the Creative Commons Attribution 4.0 License.
the Creative Commons Attribution 4.0 License.
 | 28 Nov 2025
Investigating fire-induced ozone production from local to global scales
Colette L. Heald
Donald R. Blake
Ilann Bourgeois
Matthew Coggon
Jeff Collett
Frank Flocke
Alan Fried
Georgios Gkatzelis
Samuel Hall
Jose L. Jimenez
Pedro Campuzano-Jost
I-Ting Ku
Benjamin Nault
Brett Palm
Jeff Peischl
Ilana Pollack
Amy Sullivan
Joel Thornton
Carsten Warneke
Armin Wisthaler
Tropospheric ozone (O3) production from wildfires is highly uncertain; previous studies have identified both production and loss of O3 in fire-influenced air masses. To capture the total ozone production attributable to a smoke plume, we bridge the gap between near-field fire plume chemistry and aged smoke in the remote troposphere. Using airborne measurements from several major campaigns, we find that fire-ozone production increases with age, with a regime transition from NOx-saturated to NOx-limited conditions, showing that O3 production in well-aged plumes is largely controlled by nitrogen oxides (NOx). Observations in fresh smoke demonstrate that suppressed photochemistry reduces O3 production by ∼ 70 % in units of ppb Ox (O3 + NO2) per ppm CO in the near-field (age < 20 h). We demonstrate that anthropogenic NOx injection into VOC-rich fire plumes drives additional O3 production, sometimes exceeding 50 ppb above background. Using a box model, we explore the evolving sensitivity of O3 production to fire emissions and chemical parameters. We demonstrate the importance of aerosol-induced photochemical suppression over heterogeneous HO2 uptake, validate HONO's importance as an oxidant precursor, and confirm evolving NOx sensitivity. We evaluate GEOS-Chem's performance against these observations, finding the model captures fire-induced O3 enhancements at older ages but overestimates near-field enhancements, fails to capture the magnitude and variability of fire emissions, and does not capture the chemical regime transition. These discrepancies drive biases in normalized ozone production () across plume lifetime, though the model generally captures observed absolute O3 enhancements in fire plumes. GEOS-Chem attributes 2.4 % of the global tropospheric ozone burden and 3.1 % of surface ozone concentrations to fire emissions in 2020, with stronger impacts in regions of frequent burning.
- Article
(6131 KB) - Full-text XML
-
Supplement
(3025 KB) - BibTeX
- EndNote


Wildfires have been increasing in frequency and scale in many regions of the world over the past few decades (Abatzoglou et al., 2021; Westerling, 2016). Rising temperatures, drier conditions, and longer fire seasons attributed to climate change are expected to continue to drive this trend (Abatzoglou and Williams, 2016; Williams et al., 2019). Wildfires emit a range of reactive species to the atmosphere (Andreae, 2019; Lindaas et al., 2021; Permar et al., 2021), including particulate matter and the precursors necessary to form ozone (O3) and particulate matter. Ozone is an important secondary pollutant that degrades air quality and negatively impacts human health while also being the third-most important greenhouse gas behind carbon dioxide and methane (Tarasick et al., 2019). The production of ozone from wildfire emissions has been a persistent source of uncertainty in assessing the global tropospheric ozone burden (Tarasick et al., 2019), which has implications for radiative forcing, global tropospheric oxidizing capacity (Fiore et al., 2024), and associated human health risks. In the US, the increase in wildfires has occurred in parallel with a rise in the number of homes near the wildland-urban interface (Burke et al., 2021), thus increasing human exposure to smoke and making it doubly important that we understand the impact of wildfires on air pollution.
Ozone formation is complex and nonlinear, occurring through a series of reactions between volatile organic compounds (VOCs), nitrogen oxides (NOx = NO + NO2), and oxidizing radical species in the presence of sunlight. Depending on the chemical environment and the relative concentrations of NOx, VOCs, and radicals, the production rate of ozone will have different sensitivities to its precursors. At low NOx concentrations, ozone production increases linearly with higher NOx, and we refer to this as the NOx-sensitive or NOx-limited regime. As NOxconcentrations increase, ozone production is more sensitive to changes in VOC mixing ratios, and we refer to this regime as NOx-saturated or VOC-limited (Kleinman, 1994; Sillman et al., 1990). The rate of ozone production reaches its maximum at the transition point between the NOx-limited and VOC-limited regimes. In fact, the VOC-limited regime might be better characterized as “radical-limited”, since ozone production is governed by the availability of peroxy radicals generated by the oxidation of VOCs, rather than the VOCs themselves (Schroeder et al., 2017). This is a distinction that becomes important in wildfire smoke where the availability of VOCs does not always correspond to radical availability when limited photolysis slows radical production. While both the photochemical production of ozone and the details of NOx-VOC-O3 chemistry have been widely studied in the urban context and are reasonably well understood, the different and variable chemical environment presented by wildfire smoke plumes has proven challenging to measure and characterize. These uncertainties result from an inadequate understanding of (1) the emissions of NOx, VOCs, and oxidant precursors across different fuel types and burning conditions (Gkatzelis et al., 2024; Jin et al., 2023a; Yokelson et al., 2013), (2) the dynamic chemistry that occurs as those emissions interact, age, and mix with other air masses, and (3) local (i.e. plume injection height) and downwind meteorological transport.
Previous studies have leveraged ground observations, and occasionally airborne data, to quantify ozone production in smoke plumes. Figure 1 shows a summary of some of these studies compiled by (Jaffe and Wigder, 2012). They identify both production and loss of O3 in fire-influenced air masses, with significant scatter introduced by the aging and mixing of plumes with other sources (Alvarado et al., 2010; DeBell et al., 2004; Pfister et al., 2008; Singh et al., 2010, 2012). The amount of ozone produced in smoke plumes is characterized by the normalized excess mixing ratio (NEMR) between O3 and CO, which are often well correlated in fire plumes. It is generally observed that this quantity, , is positive and increases with plume age.
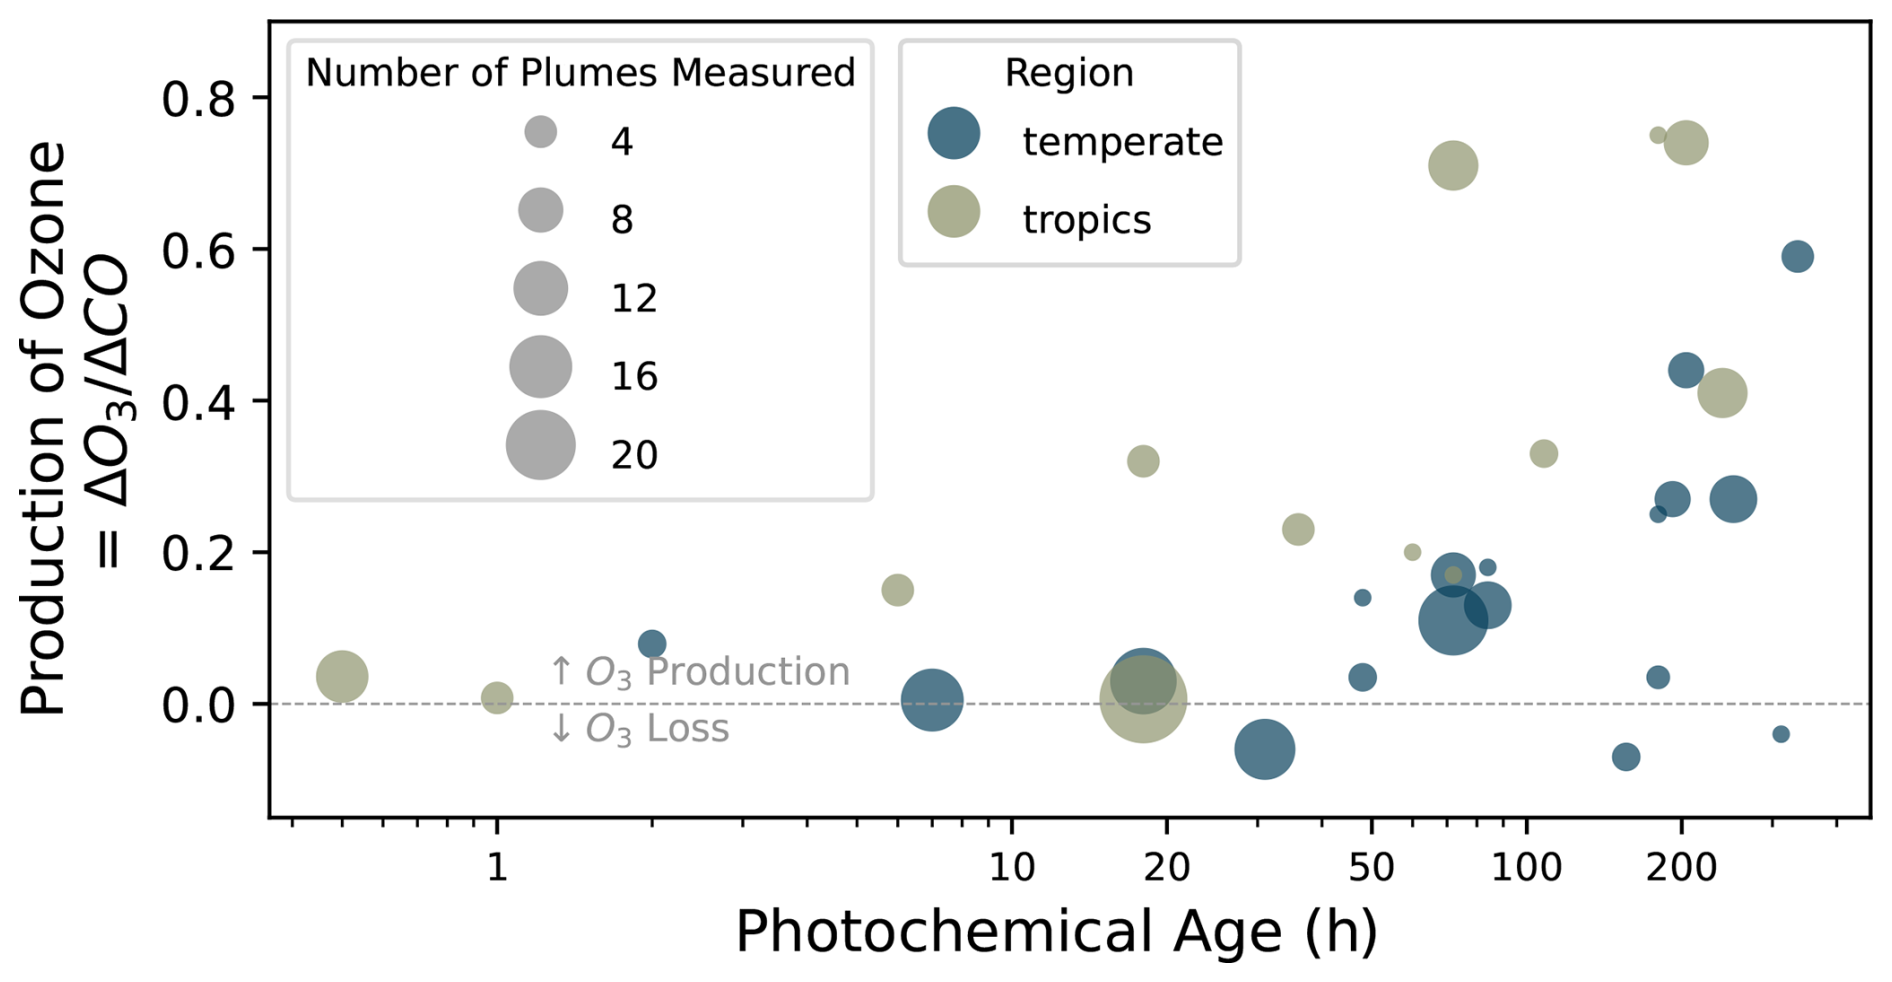
Figure 1Fire-induced ozone production (; ppb/ppb) from previous studies, compiled by Jaffe and Wigder (2012). Each data point represents a separate study; in some cases, multiple plumes are aggregated.
Xu et al. (2021) used a single transect analysis method to explore FIREX-AQ measurements of wildfire plumes close to the source, from which they derive a parameterization for ozone formation that agrees reasonably well with observations. Other recent wildfire-ozone studies use observationally constrained box model simulations to assess ozone production rates in fresh smoke plumes and analyze the sensitivity to certain chemical factors, such as the breakdown of reactive VOCs and the changes to the radical budget by species emitted and produced within wildfires (namely nitrous acid (HONO), formaldehyde (CH2O), and oxygenated VOCs (OVOCs)) (Robinson et al., 2021; Wolfe et al., 2022). The comprehensive chemical representation of these box modeling studies provides insight into the ozone chemical regime observed within smoke – they assert that typically a smoke plume begins in a NOx-saturated regime before transitioning to a NOx-limited regime within a few hours. Other studies have used observations together with more sophisticated numerical methods, such as large eddy simulations, to represent the spatial heterogeneity within smoke plumes, and the importance that this plays in determining photolysis rates and radical availability (Decker et al., 2021; Wang et al., 2021a). Near-field studies typically only focus on single plume events close to the source, limiting their utility for evaluating the lifecycle of O3 production in an airmass and the global impact of fires on the burden of O3.
Because fire plumes emit large amounts of NOx and VOCs, they may potentially produce significant downwind ozone, especially if they mix with anthropogenic emissions, which are typically high in NOx (Jaffe and Wigder, 2012). Ground-based measurements from Mount Bachelor Observatory in Washington suggest that older, more chemically processed smoke plumes have experienced greater ozone production (Baylon et al., 2015), consistent with the results shown in Fig. 1. Brey and Fischer (2016) analyze ground-based observations to show that heavily populated U.S. cities far downwind of the wildfire-prone western U.S. experience increased O3 exceedances due to aged smoke. A box modeling study driven by measurements taken during the COVID-19 lockdowns at a site in Boulder, Colorado, similarly demonstrates that transported smoke can bring significant ozone enhancements (up to 30 ppb) while also driving the local urban chemical environment towards a more NOx-sensitive regime (Rickly et al., 2023). These effects have been persistently observed; a study in Western Canada estimated an average surface ozone enhancement of at least 2 ppb across all smoke-influenced periods from 2001 to 2019 (Schneider et al., 2024). Lee and Jaffe (2024) employ a statistical approach to estimate that wildfires contribute ∼ 7.8 ppb of additional surface ozone on smoky days compared to no-smoke days at surface measurement sites across the US. These far-field studies confirm the importance of wildfires in impacting ozone across spatiotemporal scales; however, the chemical insights that can be drawn from their conclusions are limited.
Modeling ozone production in wildfire plumes is challenging and resolution dependent. Global three-dimensional chemical transport models (CTMs) cannot, with current computational constraints, represent wildfire smoke in all its chemical complexity, which raises the question: how well do global models represent smoke plume evolution and what is the impact of that representation on the modeled distribution of tropospheric ozone? Bourgeois et al. (2021) analyzed airborne measurements from the NASA Atmospheric Tomography mission (ATom) and inferred that wildfire-induced ozone is underestimated by global CTMs in most regions of the remote troposphere. In their multi-decadal analysis of tropospheric ozone in GEOS-Chem, Wang et al. (2022) observed that years with higher biomass burning emissions experienced an overall 2 %–3 % increase in the tropospheric ozone burden, highlighting the importance of modeling wildfire emissions and chemistry accurately.
Here we present an analysis of wildfire-induced ozone production that spans airborne measurements, zero-dimensional box modeling, and global chemical transport modeling. Our work aims to connect wildfire-induced ozone production across scales by developing a process-based understanding informed by comparisons between observations and chemical models. Specifically, we use airborne observations to thoroughly define the limitations of our current global models in representing wildfire smoke chemistry and the resulting ozone production.
2.1 Description of observations
To investigate biomass burning plume chemistry, we focus on airborne measurements that sample fire smoke across a range of chemical environments within the troposphere. We use observations from five different airborne campaigns for this study: ATom (2016–2018), the Fire Influence on Regional to Global Environments and Air Quality (FIREX-AQ; July–September 2019) campaign, the Western wildfire Experiment for Cloud chemistry, Aerosol absorption and Nitrogen (WE-CAN; July–September 2018), the Deep Convective Clouds and Chemistry (DC3; May–June 2012) campaign, and the Arctic Research of the Composition of the Troposphere from Aircraft and Satellites (ARCTAS; March–July 2008) campaign. Within the ATom observations, only spring and summer (N. Hemisphere: April–September; S. Hemisphere: October–March) observations are used to match the other campaigns and avoid seasonal gradients that may impact our analysis. Figure 2a shows the spatial extent of these campaigns. Our observations contain measurements taken at distinct times during the chemical development of smoke, ranging from fresh emissions in the near-field (ARCTAS, FIREX-AQ, WE-CAN), to aged, chemically processed smoke in the far-field (ATom, ARCTAS). ARCTAS and DC3 also provide an intermediate sample with minor influence from aged smoke and some nearby urban sources.
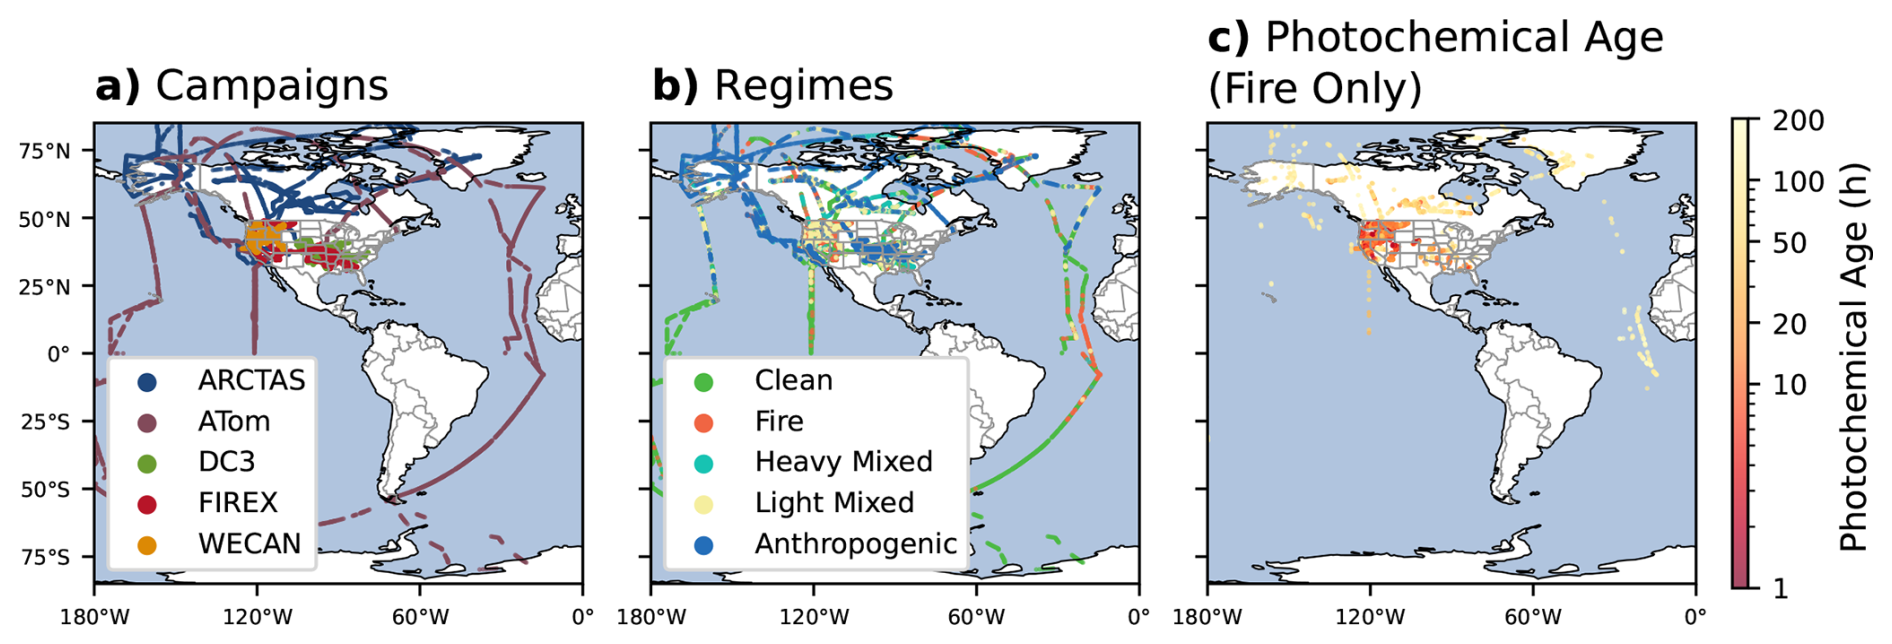
Figure 2(a) Location of flight tracks for the airborne field campaigns used in this analysis (campaign abbreviations in legend). (b) Flight tracks colored by regime type. (c) Fire-influenced observations colored by photochemical age (Sect. 2.3) in hours.
We re-sample observations to 2 min resolution to incorporate instruments with longer time resolutions. Measurements (Table S1 in the Supplement) used in this study include carbon monoxide (CO), nitrogen oxides (NOx, NOy), nitric acid (HNO3), peroxyacyl nitrates (PAN), ozone (O3), formaldehyde (CH2O), nitrous acid (HONO), photolysis rates, and a collection of VOCs including our fire and anthropogenic VOC tracers (see Sect. 2.2) and those used for photochemical aging (Sect. 2.3). In some cases, multiple instruments measured a given compound. We leverage overlapping measurements from multiple instruments if the instruments showed suitable agreement (R2 > 0.75, normalized mean bias (NMB < 0.2) across a substantial number of measurements (N > 50). Finally, any data point contaminated by marine or stratospheric influence is removed from our analysis following the criteria defined in Bourgeois et al. (2021), keeping only measurements with a ratio between 0.003 and 1 ppb ppm−1 (Fig. S1). This results in a merged dataset of 19 942 points.
2.2 Regime analysis
We use measurements of tracer species to assess the relative influence of biomass burning and anthropogenic emissions on each air mass sampled. We first subtract background levels from our observations. We separate our dataset into clean and polluted subsets by splitting at the 40th percentile of carbon monoxide mixing ratios ([CO] ≈ 100 ppb). The background level for each measurement is defined as the 25th percentile mixing ratio in each 2 km altitude bin in the free troposphere of the clean subset of points. We define different background levels for the conterminous United States (FIREX-AQ, WE-CAN, DC3), the remote measurements taken by ATom and the boreal, Arctic measurements taken by ARCTAS (Fig. S2). By subtracting this background level and putting the observed tracers in enhancement (Δ) space for the regime definition, we avoid the complications that arise from comparing data across a range of latitudes and altitudes in the free troposphere where background concentrations vary. This is especially important when using longer-lived VOC tracers that exhibit structured vertical profiles.
We sort our dataset into different regimes – clean, fire, anthropogenic, or mixed (Fig. 2b) – using the observed enhancements of measured tracer compounds commonly used to assess air mass influences in the airborne context due to their longer lifetimes (weeks–months) (Alvarado et al., 2010; Bourgeois et al., 2021; Singh et al., 2010, 2012): acetonitrile (CH3CN) and hydrogen cyanide (HCN) for fire, and tetracholoroethylene (C2Cl4) and dichloromethane (CH2Cl2) for anthropogenic pollution. Where possible, we use acetonitrile (CH3CN) as our fire tracer, and tetrachloroethylene (C2Cl4) as our anthropogenic tracer, then opt for the alternative tracer where the first choice is not available. We discard points where measurement of both a fire tracer and anthropogenic tracer are not available.
Within the polluted subset of observations, any observation that is greater than the 50th percentile of the measured tracer enhancement is classified as fire or anthropogenically influenced. If the observed air mass tracer concentrations are greater than the 50th percentile of both the fire and anthropogenic tracer it is considered mixed. Points that lie below the 50th percentile of both the fire and anthropogenic tracer may be considered lightly mixed or background pollution; these are not considered in our analysis. The majority of our analysis focuses on the fire regime, which contains 4042 points, or 39 % of the polluted subset (Fig. S4). The anthropogenic regime contains 3242 points (31 %), and the mixed regime contains 1552 points (15 %). The precise boundaries for our regime definitions (e.g. 40th percentile of CO demarcation of clean/polluted) were chosen based on an examination of the distribution of measured concentrations and to ensure a sufficient number of data points in each category; the results presented herein are insensitive to modest shifts (i.e. within 10 percentile) in these boundaries.
2.3 Photochemical aging
It is difficult to assess ozone production from smoke from instantaneous measurements. To address this, we derive the age of our fire-influenced points to analyze the time evolution of the smoke plumes in our dataset (Fig. 2c). A common method is to approximate a physical smoke age using back trajectory analysis (Stein et al., 2015) and space-based observations of fires and smoke (Jin et al., 2023b). However, this approach is subject to physical uncertainties, including an assumption of injection height/altitude of emission, that compound over time, and its utility is further limited by the mixing between fresh and aged smoke. Instead, we adopt a chemical aging strategy that employs our in-situ measurements to compute an approximate smoke age. Assuming that (1) the chosen measured VOCs are co-emitted from biomass burning (i.e., well-correlated in fire influenced points; see Fig. S5) and (2) the removal of the chosen VOCs is dominated by reactions with hydroxyl radicals, one can use the following formula to estimate the photochemical age of smoke measured in sampled air masses (De Gouw, 2005):
Where [OH] is the average concentration of hydroxyl radicals, X and Y are chosen VOCs, and kX and kY are the rate constants for the reaction of OH with X and Y, respectively. (Here, following the NASA JPL recommendations (JPL Data Evaluation, 2024), the emission ratio of X to Y is taken from the recent compilation from Andreae (2019), using the temperate forest values.) The average concentration of OH is specified as 106 molec. cm−3 (following recent work from Liao et al., 2021).
We strategically choose which X and Y VOC ratios to use based on the measurements available in each campaign and the age of the smoke that they sought to measure (see Fig. S6). For all campaigns, we use benzene as our denominator VOC (Y), as we expect it to remain elevated within the fire air masses that we sample given its longer lifetime (τ ≈ 9 d). For WE-CAN observations, we calculate photochemical age using furan (τ ≈ 7 h) as our numerator VOC (X). For FIREX-AQ, we use phenol (τ ≈ 10 h) vs. benzene, following work by Xu et al. (2021). For the other three campaigns we use toluene (τ ≈ 1.9 d) vs. benzene to capture the evolution of aged smoke plumes further downwind.
The accuracy of the photochemical age estimate is limited by (1) the assumption of constant [OH] during a plume's lifetime, (2) the uncertainty in VOC emissions ratios and variation arising from diverse fuel types, different burning conditions, and plume-to-plume variability (3) the measurement uncertainty in our VOC observations, and (4) potential mixing between more and less aged air masses. Given this, we use the derived photochemical ages to qualitatively measure the evolution of a smoke plume, and the results of our study depend on relative rather than absolute ages, as discussed below.
2.4 Idealized 0-D box modeling
To explore chemical behavior occurring within wildfire smoke at different ages, we constructed a simplified zero-dimensional box model which represents the key reactions that drive HOx-NOx-VOC-O3 photochemistry (HOx = OH + HO2; hydrogen oxide radicals). The box model is not used for direct comparison with observations, but for idealized calculations testing the relative importance of different chemical quantities in governing ozone production. Our mechanism is made up of 35 species and 69 reactions: HOx-NOx cycling and CO/CH4 oxidation reactions and their rates are taken from the GEOS-Chem model, a lumped VOC scheme is employed with GEOS-Chem reaction rates for isoprene, and we include a parameter to scale the rates of our photolysis reactions, to maintain a measure of control on HOx production and cycling. Default photolysis rates are kept constant and calculated using the simplified MCM parameterization assuming a solar zenith angle of 0°, simulating clear-sky photolysis with the sun directly overhead. Temperature is held constant at 288.15 K. Our findings are robust with respect to temperature and solar zenith angle variations, as shown in Fig. S9. The heterogeneous uptake of HO2 onto aerosol is represented in the box model in the same fashion as GEOS-Chem – using a reaction probability parameterization (Jacob, 2000), with γ=0.2. The box model is built using Catalyst.jl, a Julia package for high-performance simulation of chemical reaction networks (Loman et al., 2023). Catalyst.jl represents models symbolically to enable compatibility with other Julia libraries and the large number of numerical solvers Julia offers.
We use a Monte Carlo approach to test the sensitivity of ozone formation to a series of factors, running many steady-state box model simulations under various conditions to assess the resulting spread in ozone production. For each factor, a Monte Carlo experiment (N = 100) is performed where every other factor is held constant at the default value, while the factor of interest is randomly initialized in each simulation by bootstrapping from the defined distribution. The ozone production rate () is computed for each simulation and the spread of the distribution of reflects the importance of the factor of interest in governing the ozone production rate.
2.5 3D Model description
We use the global CTM GEOS-Chem (https://geoschem.github.io/, last access: 14 November 2025) to simulate concentrations of ozone and its chemical precursors along the flight tracks of the campaigns described in Sect. 2.1. GEOS-Chem Classic v14.3.0 (https://doi.org/10.5281/zenodo.10640536; GEOS-Chem, 2024) was used in this study, with simulations performed with a horizontal resolution of 2° × 2.5° and 72 vertical hybrid-sigma pressure levels. Additionally, we performed nested-grid simulations for the FIREX-AQ and WE-CAN campaigns at a higher spatial resolution of 0.5° × 0.625° using boundary conditions from the 2° × 2.5° global run. Six-month spin-up simulations were completed prior to the time periods of interest to ensure equilibrated initial conditions. The model is driven by the Modern Era Retrospective analysis for Research and Applications, Version 2 (MERRA-2) assimilated meteorology product from the NASA Global Modeling and Assimilation Office (GMAO). The model includes a HOx-NOx-VOC-O3-halogen photochemistry scheme (Bates and Jacob, 2019; Wang et al., 2021b) coupled to aerosol thermodynamics (Park et al., 2004).
Global anthropogenic emissions for each year follow the Community Emissions Data System (CEDSv2) (Hoesly et al., 2018) and are overwritten by regional inventories where possible. Biogenic VOC emissions are calculated online based on local meteorological conditions using the Model of Emissions of Gases and Aerosols from Nature version 2.1 (MEGANv2.1) emissions framework (Guenther et al., 2012). Year-specific fire emissions are taken from the satellite-derived global fire emissions database GFED4.1s and simulated at a 3 h resolution (van der Werf et al., 2010). Pyrogenic VOC emissions are included in GFED using updated emission factors (Carter et al., 2022).
To test GEOS-Chem's ability to reproduce wildfire-ozone production, we performed a series of simulations from 2008 to 2019, directly sampling the model at the locations and times of our airborne observations. For our analysis, we assume that the observationally defined regimes also apply to the model output, though this is not necessarily true in a coarse-grid global CTM with uncertain emissions inventories. As simulated smoke dilutes across grid boxes, its distribution will not always match the observations, meaning some “fire-influenced” points may include little to no simulated smoke in the model. To mitigate the impact of these “false-negative” points on our analysis, we filter our modeled fire distribution to include only points above the 40th percentile of modeled CO, and the model evaluation considers only this subset of points. To isolate fire-induced emissions and production within the model, as opposed to a more general bias, we calculate model background concentrations using the same method we applied to the observations, taking the modeled 25th percentile of the modeled clean ([COmodel] < [COmodel]40th) population in each 2 km altitude bin (Fig. S3). We subtract these background concentrations from our model output at each altitude level to obtain modeled enhancements (Δ) of certain compounds.
To estimate the total impact that fires have in governing the tropospheric ozone burden, we perform a perturbation sensitivity study with GEOS-Chem. Generally, source attribution model studies zero out emissions of the source of interest, and compare the results to a base case. In our work we aim to minimize the nonlinearities associated with the ozone chemical system, such as changing the oxidative potential of the global atmosphere. Hence, in our sensitivity simulations we increase and decrease wildfire emissions by 10 % (referred to as BB1.1 and BB0.9, respectively) and scale the results up to approximate the total effect, linearized against both a positive and negative perturbation.
2.6 Approximating ozone production sensitivity to precursors
In Fig. 3, the data is split using an observationally-derived threshold – the 50th percentile of θ′ (within each bin) a reactivity weighted ratio between NOx and CO (Eq. 3), used to approximate ozone production sensitivity to its precursors. Previous studies have used θ (Eq. 2) to define ozone formation regimes, especially in the urban context (Heald et al., 2020; Kirchner et al., 2001). Calculating θrequires a comprehensive and consistent estimate for total VOC reactivity, which is difficult to achieve, particularly across campaigns, despite improved instrumentation over the past several years. θ′ is a more easily observed metric for approximating ozone formation regime, and its validity is confirmed qualitatively in our box modeling experiments (Fig. 7). This metric is especially relevant for analyzing fire-influenced airmasses, as total VOC emissions are extremely well correlated with CO (R2 = 0.98; Gkatzelis et al., 2024). Additionally, CO is the largest contributor to OH reactivity (OHR) in the remote troposphere, and its concentration has previously been used as a proxy for assessing total OH reactivity in ATom measurements (Baublitz et al., 2023). Therefore, we use OHRCO as a qualitative predictor for VOC reactivity across smoke plume ages, in part because of its simplicity and the potential to extend this analysis further (e.g. towards satellite data).
where:
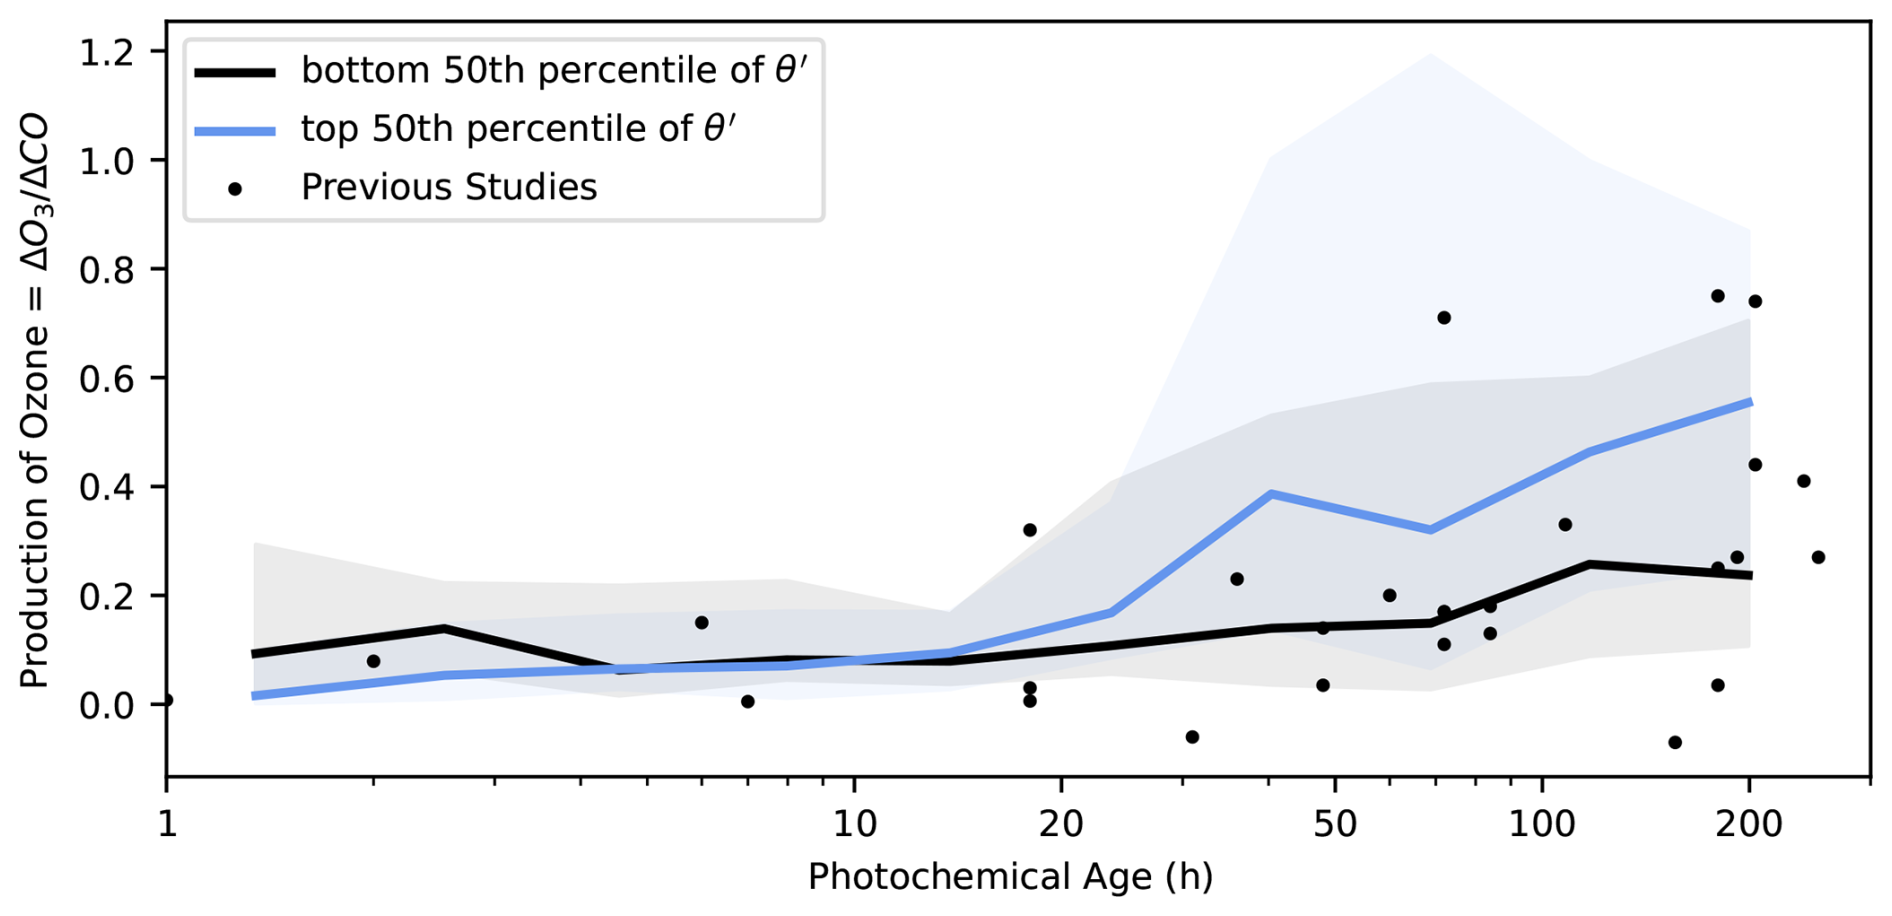
Figure 3Observed ozone production () plotted across 11 evenly log-spaced bins of photochemical age for all fire-influenced observations, split at the 50th percentile of θ′ (= OHR OHRCO). The blue trace represents the median of the top 50th percentile points within each bin, while the shaded area extends from the 16th to the 84th percentile (corresponding to one standard deviation, but in outlier resistant percentile space) within each bin. The black trace represents the same, but for points below the 50th percentile of θ′. The black points represent historical data compiled by Jaffe and Wigder 2012 and shown in Fig. 1.
3.1 Observational analysis
3.1.1 Observed ozone formation regime transition
Observed fire ozone production expressed as and binned over time is shown in Fig. 3. Because O3 and CO are often correlated in smoke plumes, the normalized excess mixing ratio (NEMR) is used to characterize wildfire-induced ozone production, as in many previous biomass burning studies (Liao et al., 2021; Müller et al., 2016; Robinson et al., 2021; Wolfe et al., 2022). CO is emitted in high concentrations in a wildfire plume and is effectively chemically inert (no production or loss) on timescales considered here; for those reasons, normalizing trace gas concentrations to CO accounts for plume dilution and entrainment of background air into the plume. When comparing multiple plumes, also normalizes measured ozone production across fires of different sizes.
Observed matches the results reported by Jaffe and Wigder from Fig. 1. Median ranges from close to zero in young plumes, where NO titration of O3 limits ozone production, to a peak of about 0.8 ppb ppb−1 in aged plumes. In the near-field, observed in the top 50th percentile (high NOx) of θ′ experience lower than those in the lower 50th percentile (low NOx). A crossover happens around t = 5–10 h, and the opposite behavior is observed in the far-field – higher ozone production in the top 50th percentile of θ′. This behavior indicates a chemical regime shift from NOx-saturated behavior in freshly emitted fire plumes to NOx-limited behavior in aged plumes. The evolving NOx sensitivity is also seen when observations are split at the 50th percentile of [NOx] (Fig. S7) or the formaldehyde to NO2 ratio (Fig. S8). This confirms the theoretical predictions in previous studies (Robinson et al., 2021; Wang et al., 2021a; Wolfe et al., 2022), which have estimated the regime shift to occur within the first few hours of a plume's lifetime – the fact that we observe the crossover point at slightly older photochemical ages likely has to do with the limited resolution of our calculated photochemical age related to the assumption of constant [OH] (See Sect. 2.3). In Fig. 3, we reproduce the variability seen across previous studies (Jaffe and Wigder, 2012) and offer an explanation of the observed spread in based on our suite of measurements – the presence of NOx in the aged, NOx-limited environment drives significant ozone production.
3.1.2 Near-field photolysis suppression
NOx-saturated air masses typically produce ozone efficiently in the presence of organic compounds. Photolysis suppression can limit the HOx source, slowing the rate of VOC oxidation and thus ozone production – an effect that is expected in some freshly emitted smoke where aerosols can limit the radiation in a smoke plume core (Palm et al., 2020). In Fig. 4, we explore how this effect manifests itself in the observations. We take the near-field observations with a photochemical age of less than 20 h and isolate points experiencing smoke-related suppression of photolysis (observed < 0.005 s−1, 25th percentile of near-field and organic aerosol > 20 µg m−3, 40th percentile of near-field). We compare total odd oxygen (Ox = O3 + NO2) production here to control for the temporary titration of ozone in heavy smoke. Observations with measured photolysis rates higher than the cutoff point experience enhanced Ox production as a function of CO compared to those below: 65.1 ppb ppm−1 vs. 18.0 ppb ppm−1. This analysis demonstrates the importance of photochemical suppression in governing observed ozone production in young smoke plumes. From our analysis, we cannot conclude how much local ozone production suppression reduces the overall O3 production in the lifecycle of a fire plume; future plume-following case study analysis may be able to further explore this question.
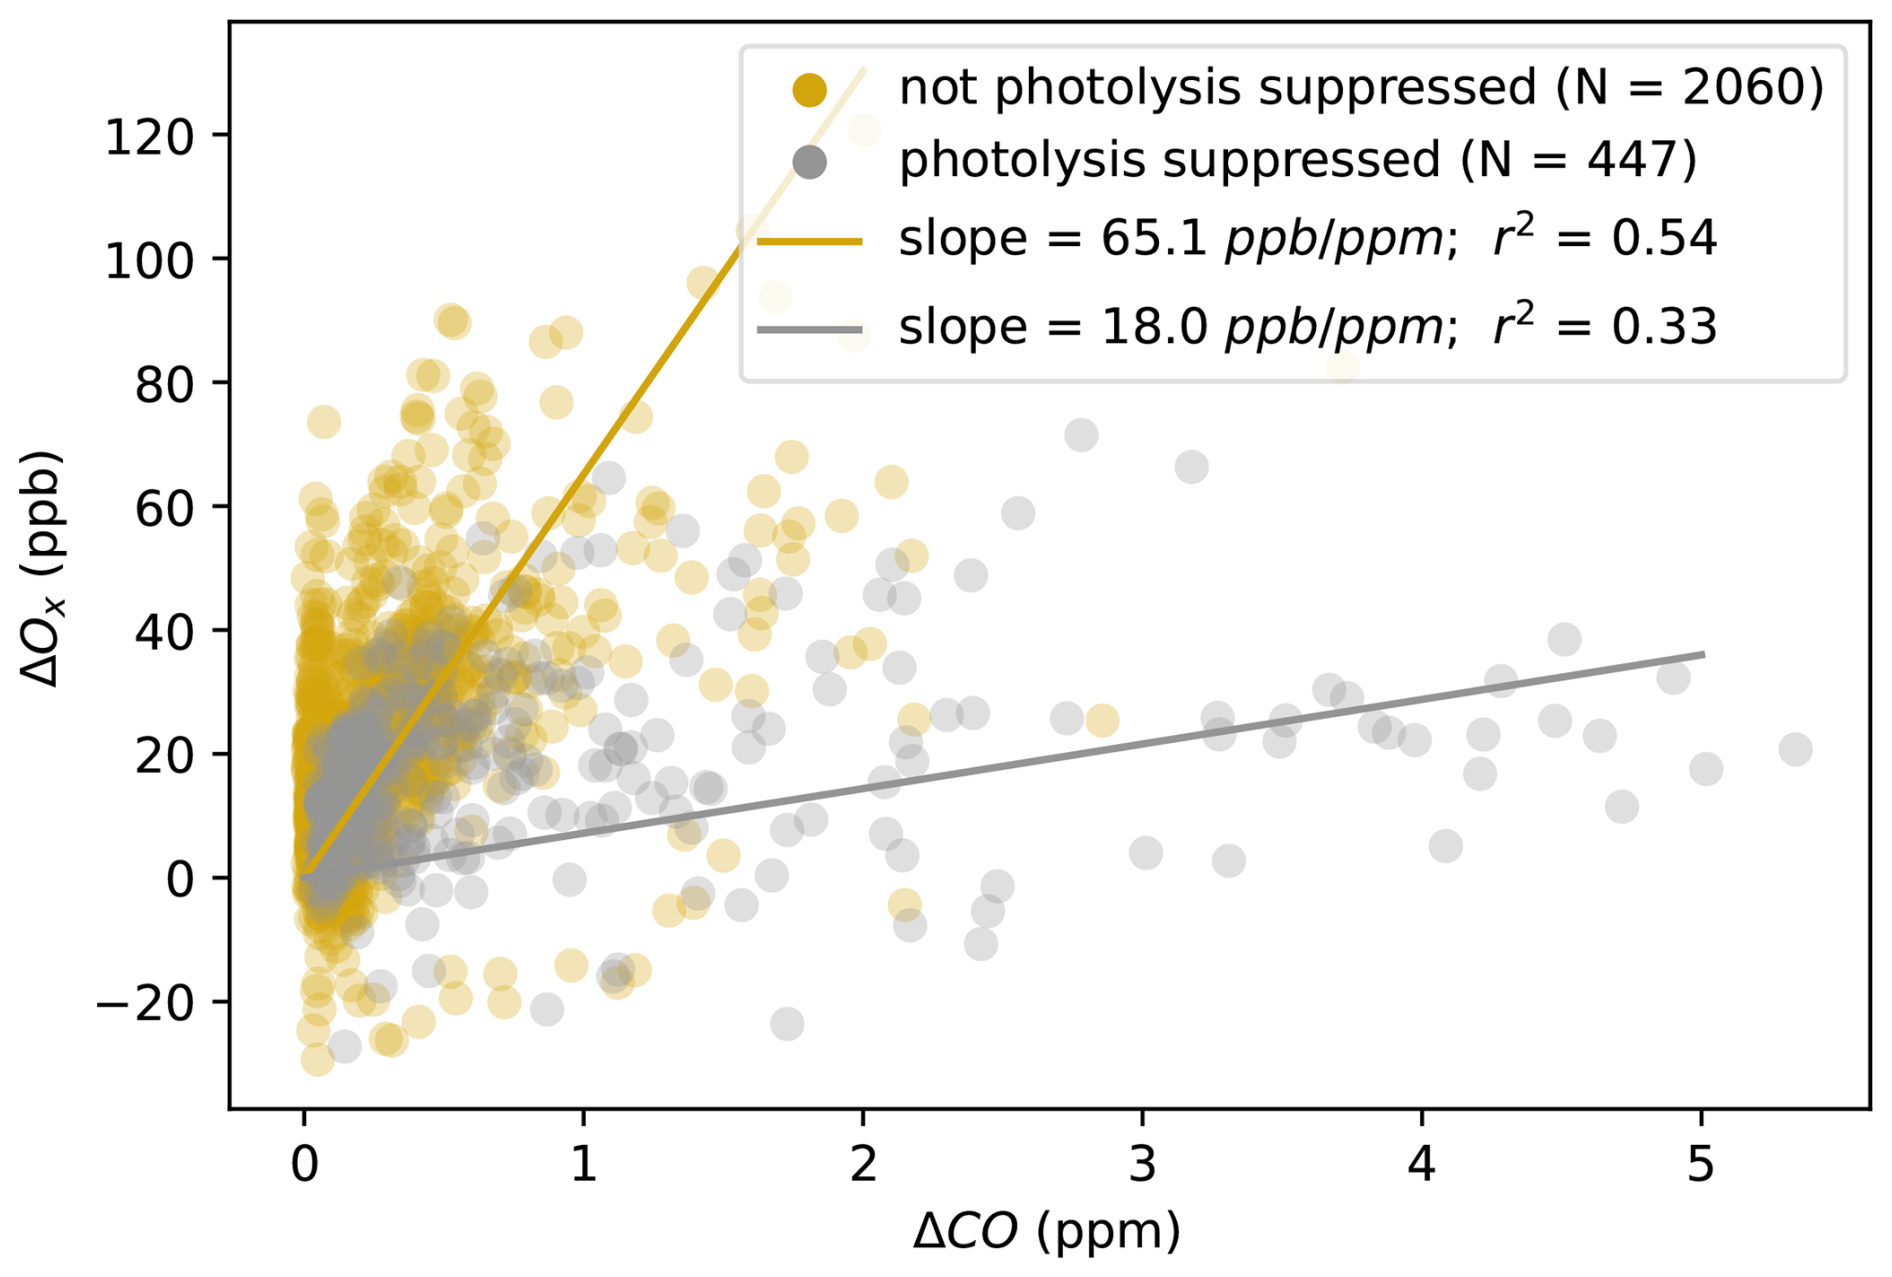
Figure 4Measured ΔOx (ΔO3+ΔNO2) vs. ΔCO for young (t<20 h) fire-influenced points. Points sampled in heavy-smoke ( < 0.005 s−1 and organic aerosol concentrations > ∼ 20 µg m−3) are shown in grey; others in yellow. Fits are made with reduced major axis regression.
3.1.3 Transport and mixing: ozone production across regimes
In the free troposphere, most air masses are generally NOx-limited, such that ozone production is primarily driven by the abundance of NOx (Chameides et al., 1992), as seen in our analysis of aged fire plumes (Fig. S7). It has been suggested that enhanced anthropogenic-fire mixed ozone production is observed when a VOC-rich biomass burning plume entrains additional NOx from an anthropogenic source, leading to downwind ozone production (Brey and Fischer, 2016; Jaffe and Wigder, 2012; McClure and Jaffe, 2018; Permar et al., 2023; Rickly et al., 2023; Singh et al., 2012). We explore the extent to which this is supported by the airborne data considered here. We find that the mixed regime exhibits larger ΔO3 values than both the fire and anthropogenic regimes on average ( = 18.5 ppb; = 21.1 ppb; = 27.0 ppb), as shown in Fig. 5a. We ascribe these disparities to the different mean chemical environments (reactive nitrogen budget, and VOC reactivity) that are observed in each regime.
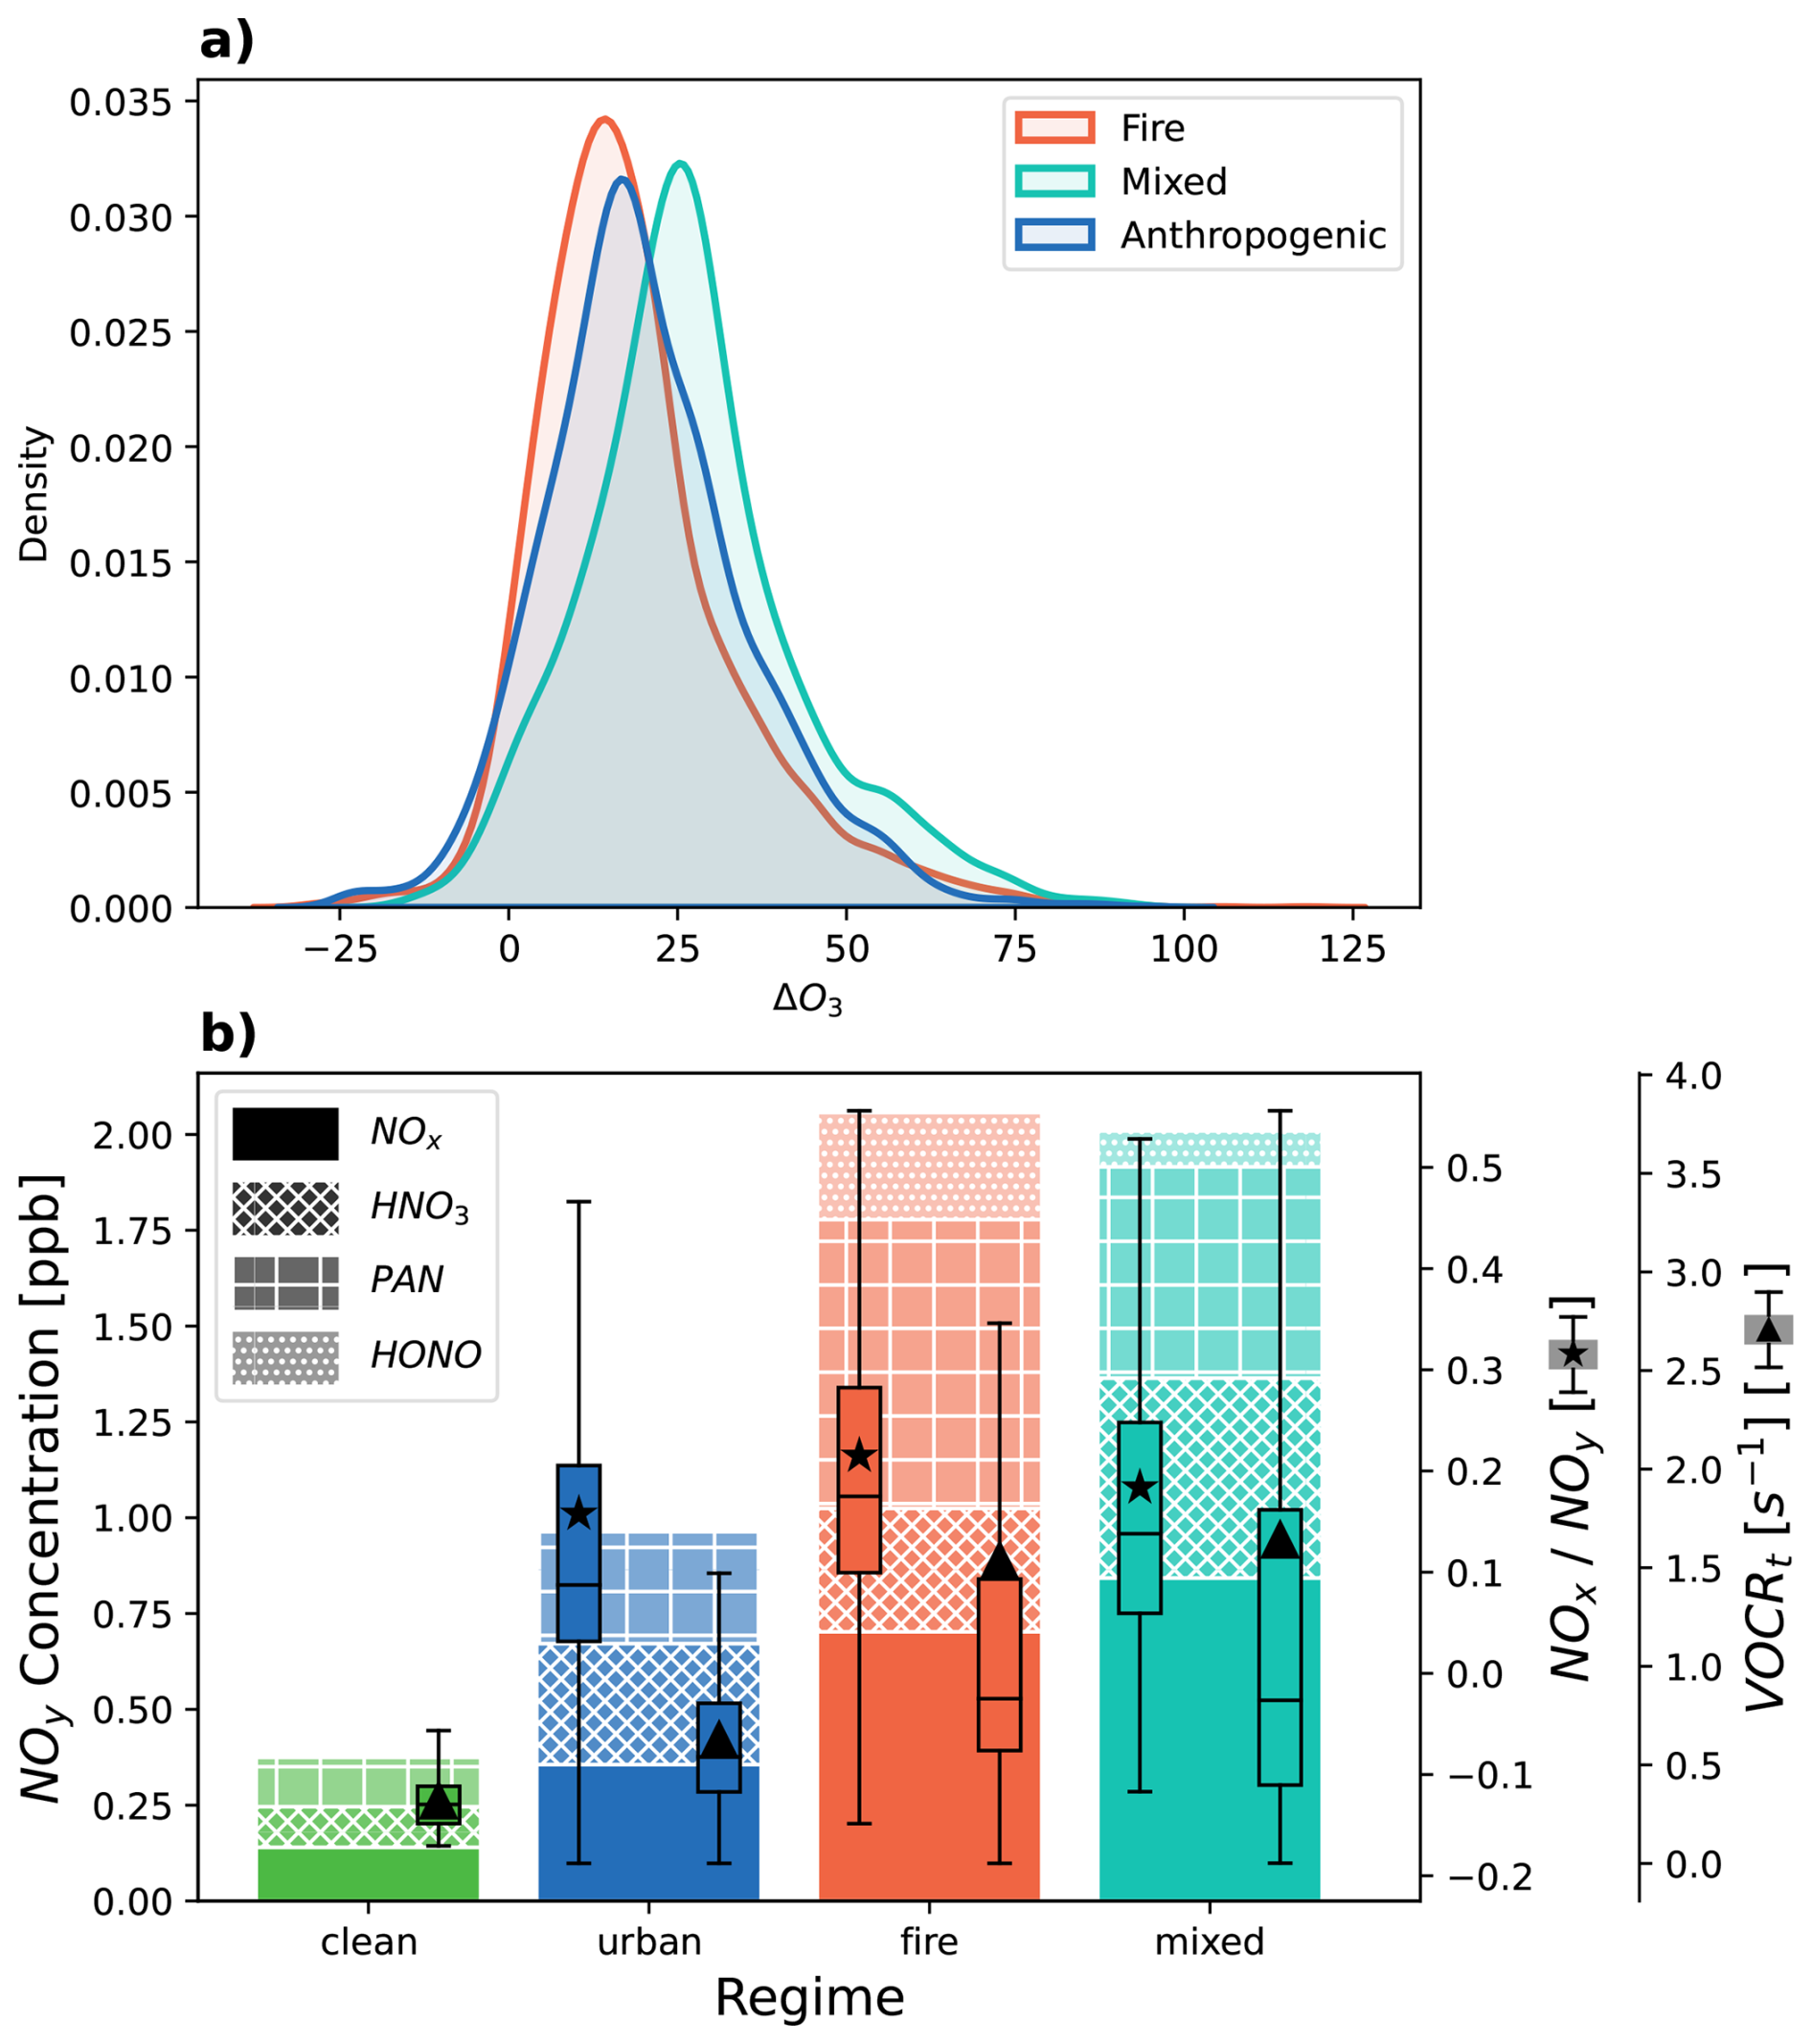
Figure 5(a) Probability density distributions of observed ΔO3 across fire, urban, and mixed regimes. (b) Mean speciated measured NOy across regimes. Patterns correspond to each of the most abundant gas phase NOy species. Box plots represent NOx NOy (box plot with star denoting mean) and VOCRt (box plot with triangle denoting mean) distributions for each regime.
First, we compare the mean reactive nitrogen (NOy) budget within each regime. NOy is derived from both anthropogenic and biomass burning sources and contains both fresh nitrogen emissions and reservoir species that are produced during aging. In Fig. 5b, we report mean mixing ratios of the five most abundant gas-phase NOy species measured across all the campaigns considered here: NOx (= NO + NO2), HNO3, PAN, and HONO (which was only measured during FIREX-AQ and WE-CAN; hence the HONO average only reflects these campaigns). In general, NOy concentrations are largest in fire air masses, followed by mixed, then anthropogenic – but these differences should be interpreted within the airborne in-situ context. Because urban NOx has a local lifetime on the order of hours (Laughner and Cohen, 2019), and the campaigns used here did not focus on sampling urban air masses, our anthropogenic airborne observations do not directly measure freshly emitted urban NOx, but instead reflect only the fraction of reactive nitrogen that has escaped the boundary layer and entered the free troposphere. In contrast, the majority of our fire influenced observations are taken in the near-field (67 %) and are rich in NOx, as reflected in Fig. S10. Both the fire and mixed regimes contain a relatively larger amount of PAN as compared to the anthropogenic points. As shown by the NOx NOy box plots with the stars denoting the means, in the mixed population a higher proportion of the observed NOy remains unprocessed in the form of NOx compared to the anthropogenic population, which could be due to either the mixing of fresher anthropogenic NOx emissions, temperature-driven PAN decomposition, or remaining NOx emitted from fires.
To distinguish between NOx that is leftover in smoke vs. the anthropogenic injection of NOx in the mixed population, we examine the relationship between ΔNOx and our anthropogenic and fire tracers. We use the ratio between ΔNOx and ΔCH3CN as an indicator for fresh anthropogenic NOx in mixed smoke plumes (Singh et al. 2012; Juncosa Calahorrano et al., 2020), shown in Fig. 6. Points outlined in yellow, with higher ΔNOCH3CN and higher ΔC2Cl4represent the subset of the mixed population that are directly influenced by an injection of anthropogenic NOx (Fig. S11). It is these measurements that experience the most extreme ozone enhancements – at times greater than 50 ppb – and represent the high tail of the mixed distribution in Fig. 5a.
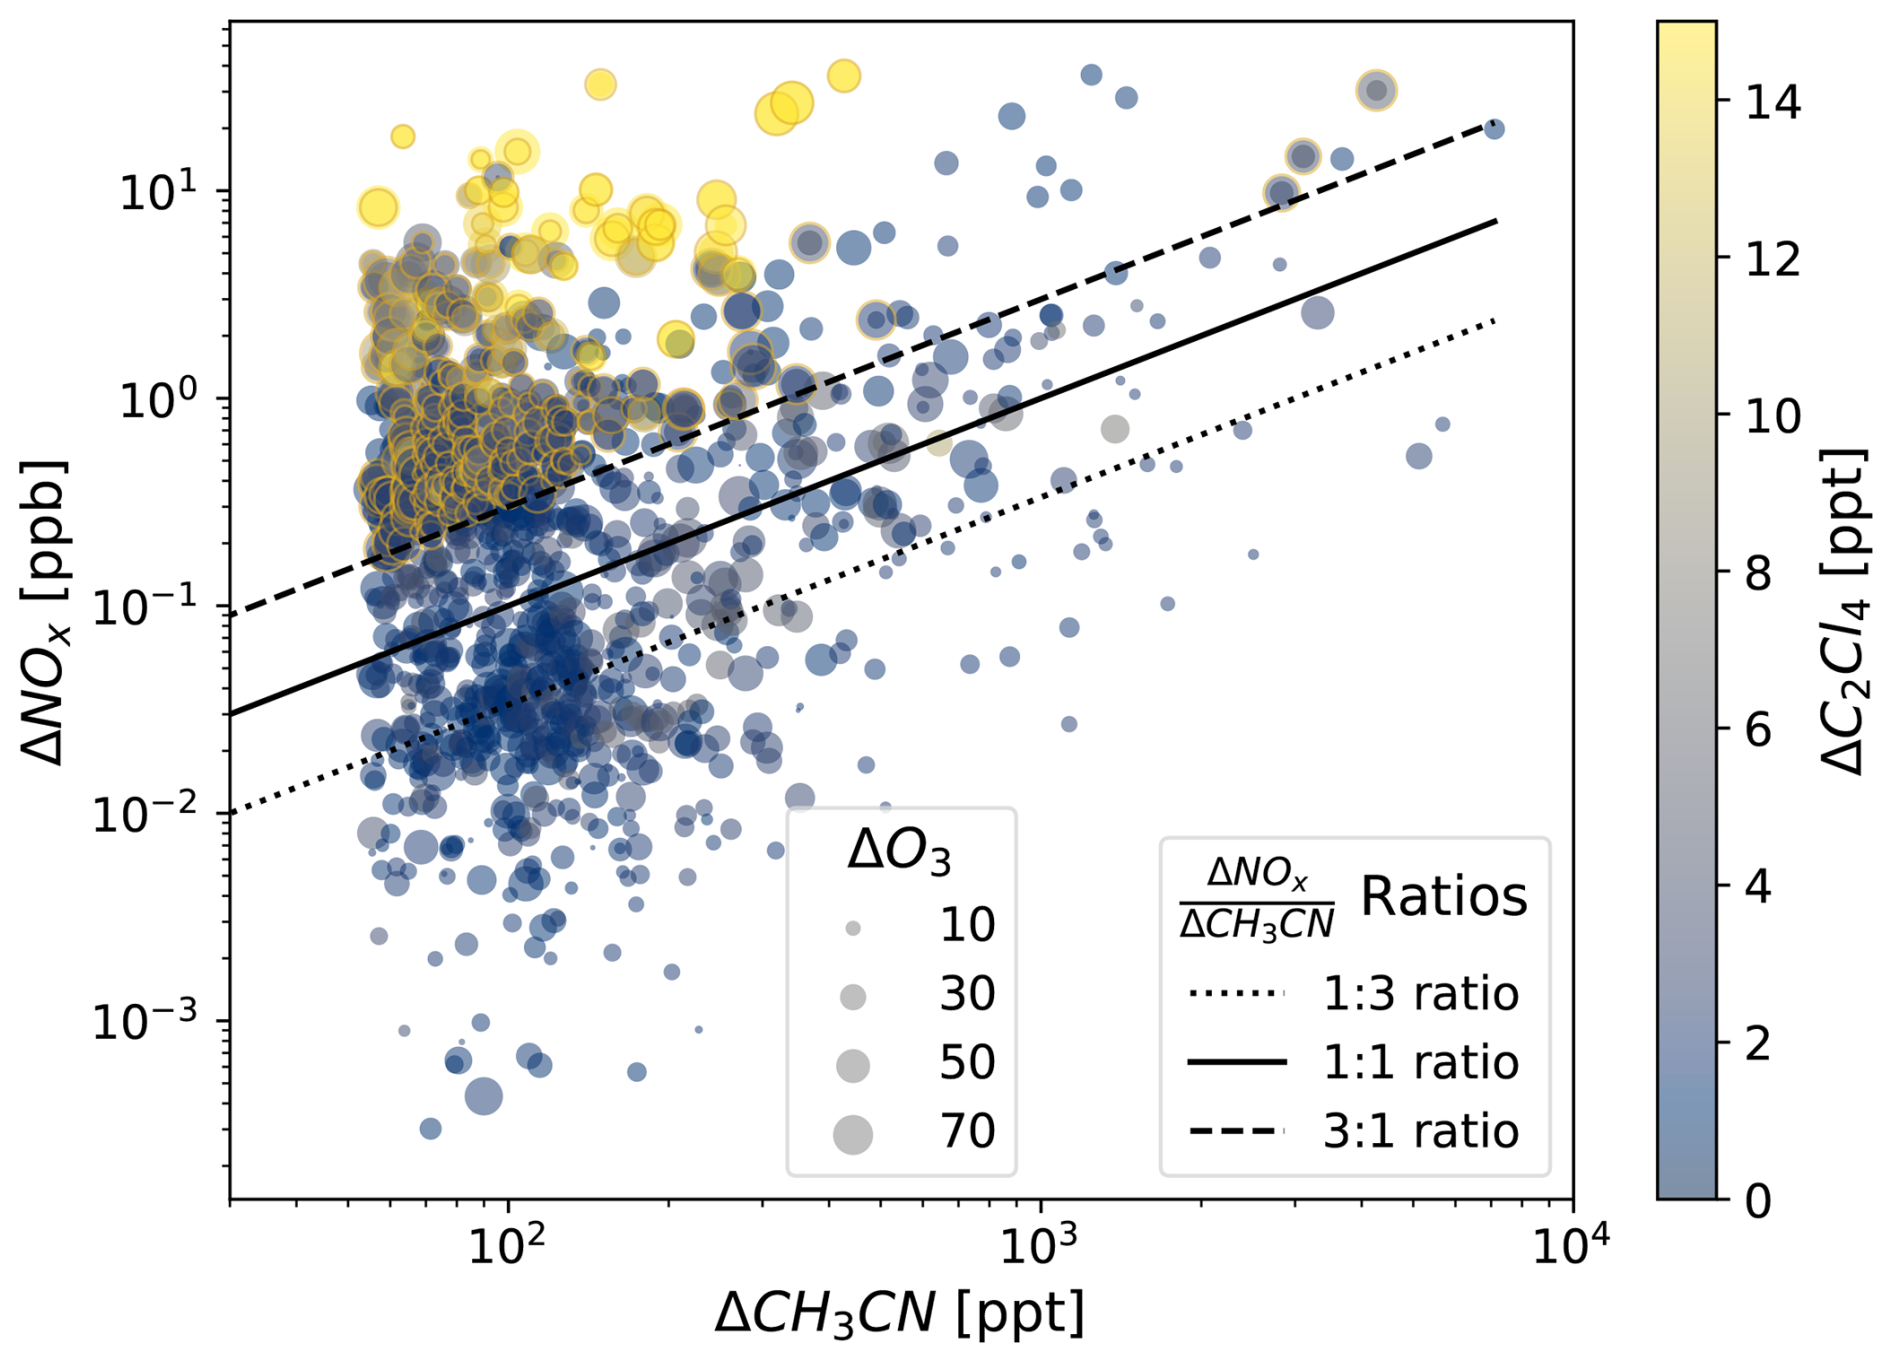
Figure 6The relationship between NOx and CH3CN enhancements for mixed pollution observations in log-log space. Points are colored by C2Cl4 enhancements and sized by ozone enhancements. ΔNOCH3CN ratios are overplotted.
The additional chemical processing that has taken place in the urban case during its transport from the surface likely means more accumulated ozone production and mixing has occurred before sampling the anthropogenic air masses – which explains the higher ozone production seen in anthropogenic points compared to fires in Fig. 5a. Hence, a fraction of the mixed population ozone enhancements will likely also be a result of mixing between fire-produced ozone and urban-produced ozone. In Fig. 6, the O3 enhancements observed within the subset of the mixed population that exhibit lower anthropogenic NOx enhancements (i.e., lower ΔNOCH3CN) are primarily due to the mixing of “historically produced” ozone – the combination of both fire-produced ozone that formed within a smoke plume before mixing, and ozone that formed in the anthropogenic context before the smoke arrived. Whereas when VOC-rich aged smoke mixes with fresh anthropogenic NOx(i.e., higher ΔNOCH3CN and higher ΔC2Cl4), ozone is directly produced downwind in addition to that historically produced ozone. This distinction is an important one, where ozone formation in the latter case could be preventable through anthropogenic NOx reductions.
In Fig. 5b we confirm that higher organic emissions from fires lead to higher VOC reactivity in the mixed population compared to the anthropogenic, which enhances ozone production by interaction with NOx. We use available VOC measurements to compute a partial VOC reactivity (VOCRt) for our observations, a quantity that relates to the production of organic radicals that contribute to ozone production (see Supplement). In the fire and mixed populations, C2H4, Furans, and oxygenated VOCs such as MVK, CH3OH, and methacrolein enhance observed VOCRt. We hypothesize that this enhanced VOC population is the reason we see the largest ozone enhancements for mixed pollution in Fig. S10, spanning the range of observed NOx NOy.
3.2 Idealized box model sensitivity analysis
Exploring the sensitivity of ozone production in fire plumes
We use our box model to test the sensitivity of ozone production against specific factors including (1) the speciation and reactivity of the emitted VOC population, (2) the range of wildfire emissions observed across fires that vary in size, fuel, and burning conditions, (3) the emission of radical precursors, (4) the evolving availability of NOx, and (5) aerosol effects. We use observed conditions to drive the model and examine the spread of the resulting simulated ozone production rate that correspond to Monte Carlo simulations runs for each factor as a metric for assessing importance.
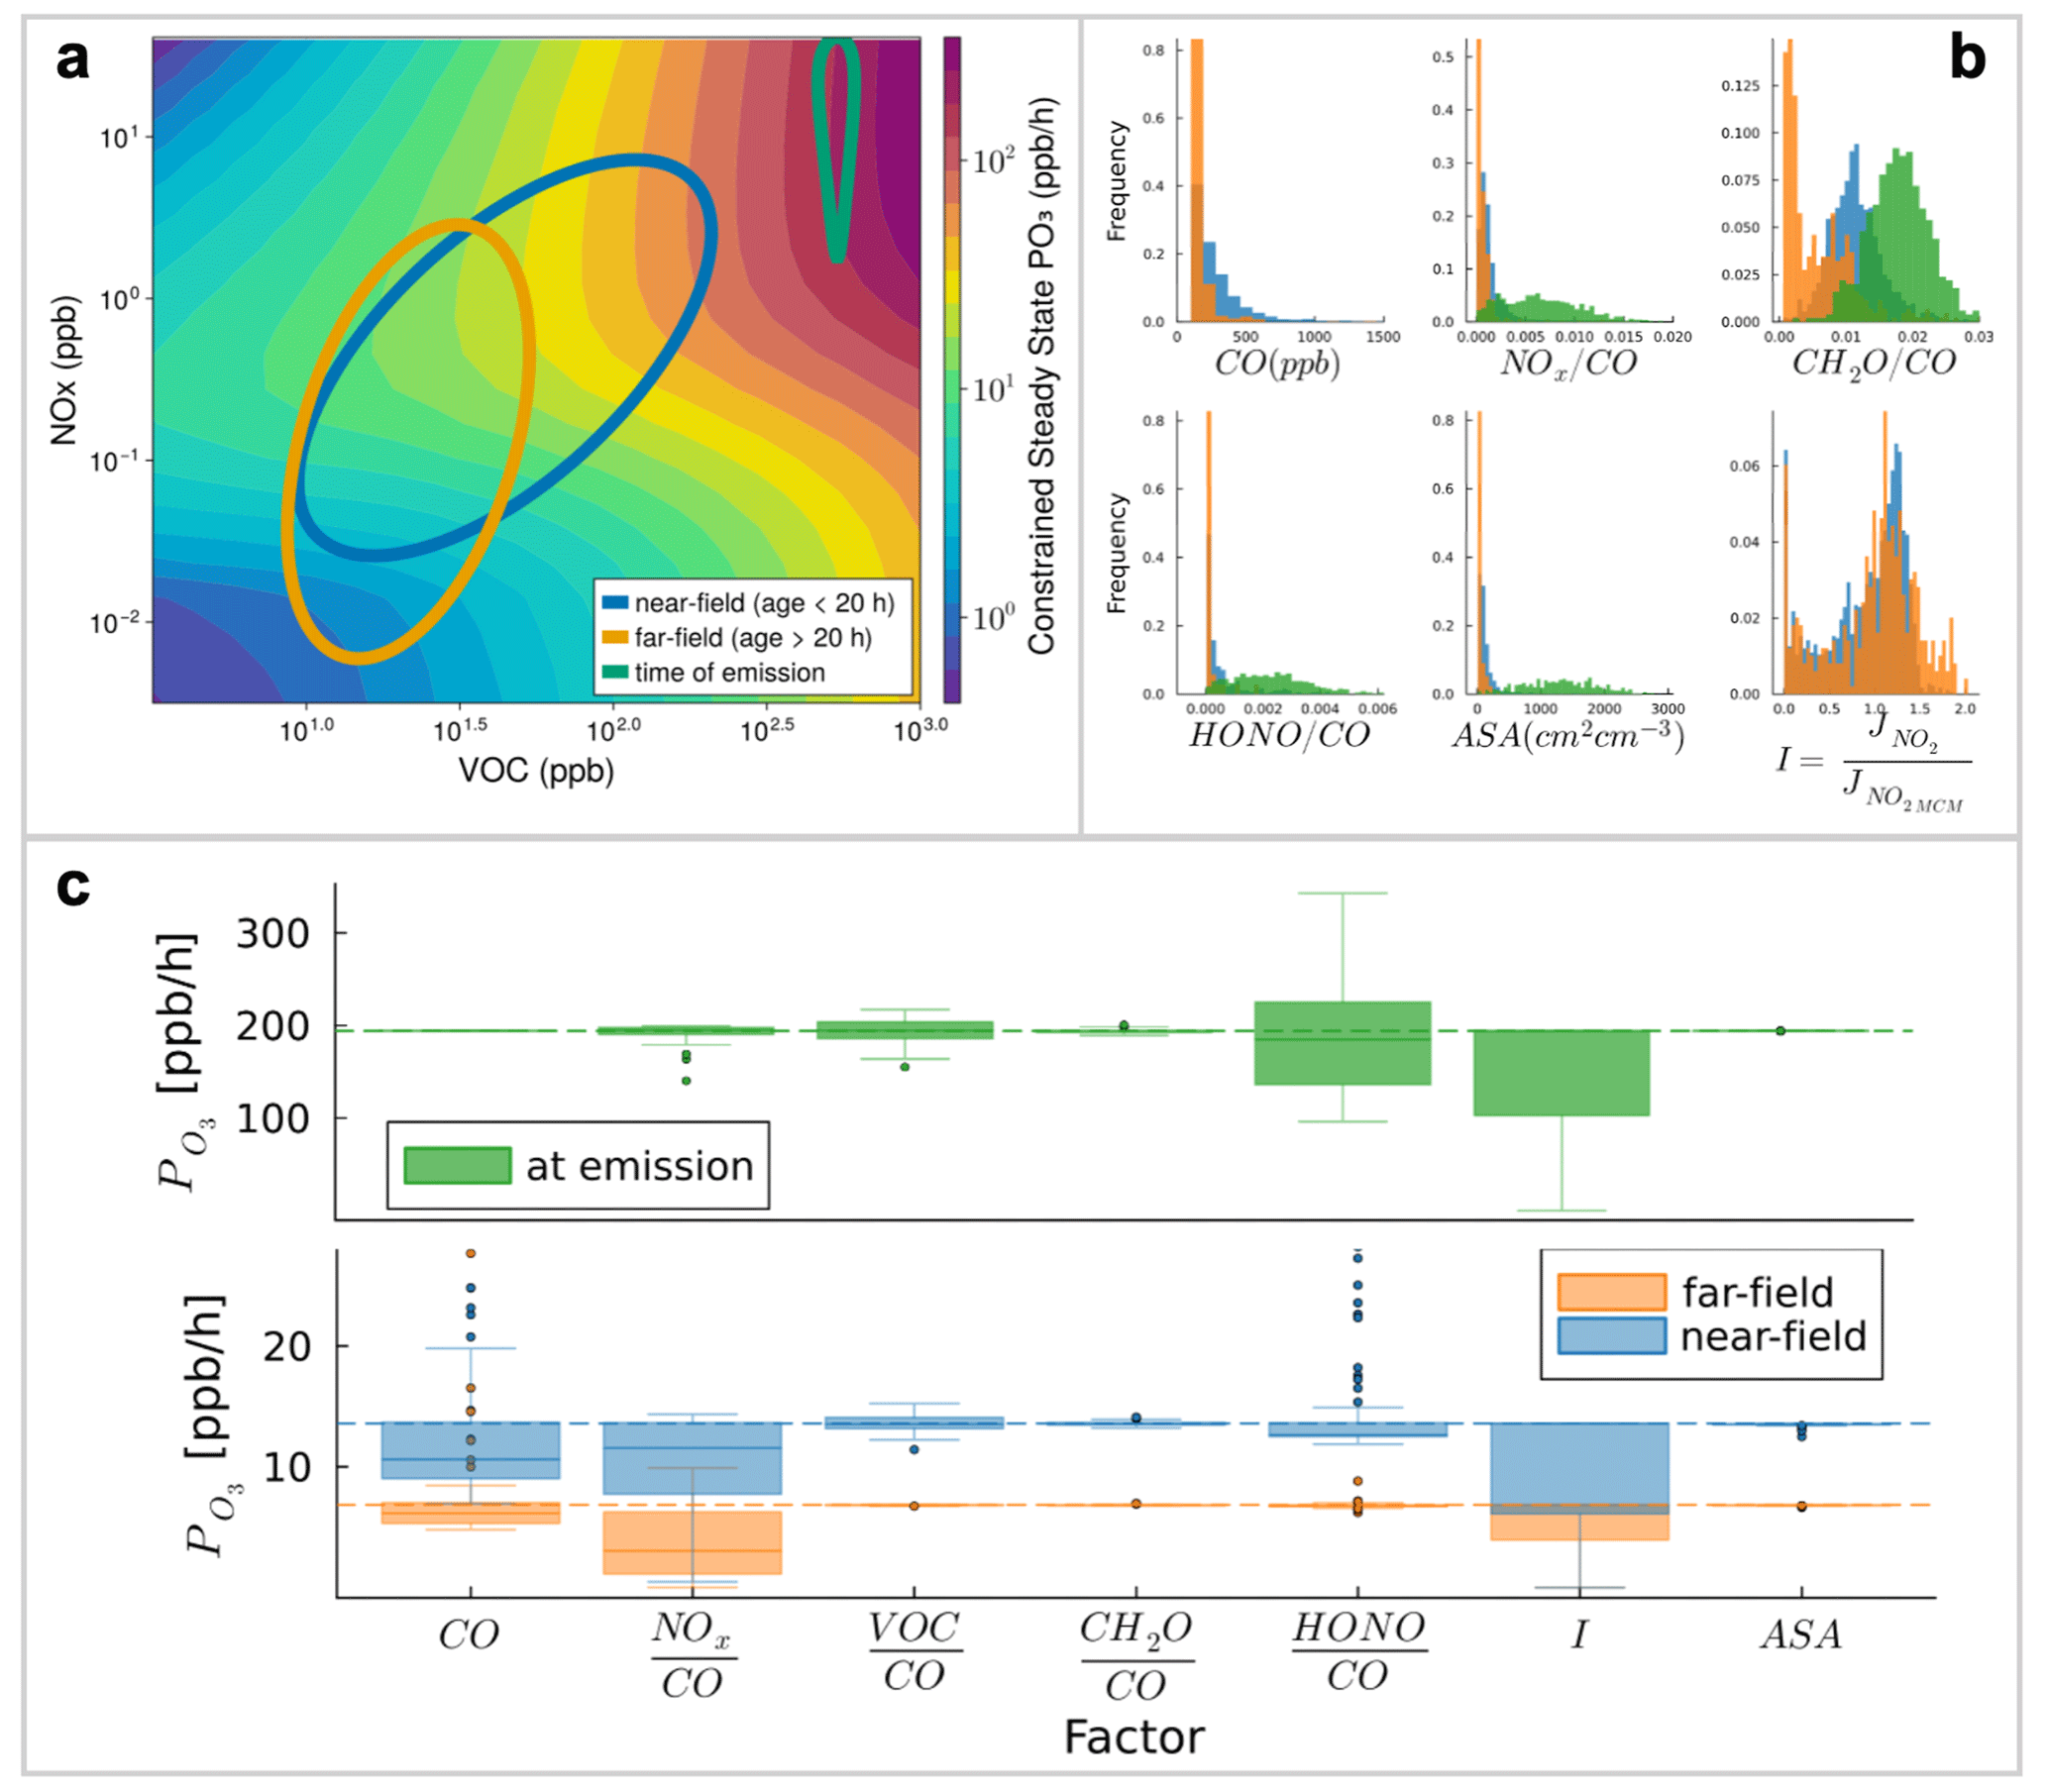
Figure 7(a) Ozone isopleth in log-log space overplotted with ovals representing distributions of NOx and VOC concentrations for three different populations: time of emission (green), near-field (blue), and far-field (orange). (b) Distributions for each factor of interest corresponding to each population. Near-field and far-field distributions are taken directly from the airborne observations, while the time of emission population relies on emission factors from Gkatzelis et al. (2024). (c) distributions corresponding to the Monte Carlo simulations run for each factor, repeated for each population.
The box model results in Fig. 7 consider three scenarios relating to the physical transport and chemical aging of smoke. The “at emission” population, shown in green, reflects emission ratio estimates from Gkatzelis et al. (2024), in which emissions of various species are scaled against CO. The airborne observations are split into near-field (near field: t < 20 h; blue) and far-field (far field: t > 20 h; orange) populations, and for gas phase measurements we also scale concentrations against CO. Using this framework allows CO concentration to act as a metric describing the approximate total magnitude of emissions of the fire/smoke plume, and further isolates the other factors that govern chemical variability within a plume of any given size.
The sensitivity of ozone production rate to certain chemical species changes over time. Notably, HONO is the most important oxidant precursor at the point of emission and, to lesser degree, in the near field (and negligibly in the far-field). As expected from Fig. 3, ozone production becomes more sensitive to NOx with age, especially in the far field, reflecting the results from the airborne observations. The sensitivity to VOC shows the opposite trend, peaking in the near-field and decreasing with age. Higher CO concentrations, corresponding to larger fires, also lead to extremely high ozone production rates, manifested by the outlying near-field points in the CO factor that are driven by the tail of the observed CO distribution.
We also explore how smoke aerosol can reduce ozone production, by (1) suppressing photolysis and thus limiting oxidant concentrations (i.e., reducing ), and (2) acting as a site for heterogeneous uptake and removal of HO2 (i.e., increasing ). In general, at the observed aerosol concentrations, our model is much more sensitive to optical effects/photolysis suppression () than to chemical effects (), and this behavior is consistent across age. Ozone production rates are negligibly sensitive to HO2uptake, given that the enhancements of NOx and VOC in smoke tend to overwhelm the chemical system, and the increased heterogeneous chemical effect is thus insignificant.
3.3 Model evaluation
3.3.1 Evaluating fire-induced ozone production in GEOS-Chem
We examine how well the GEOS-Chem model captures the airborne observations across the lifecycle of a smoke plume. In what follows, all comparisons are for fire-influenced points only.
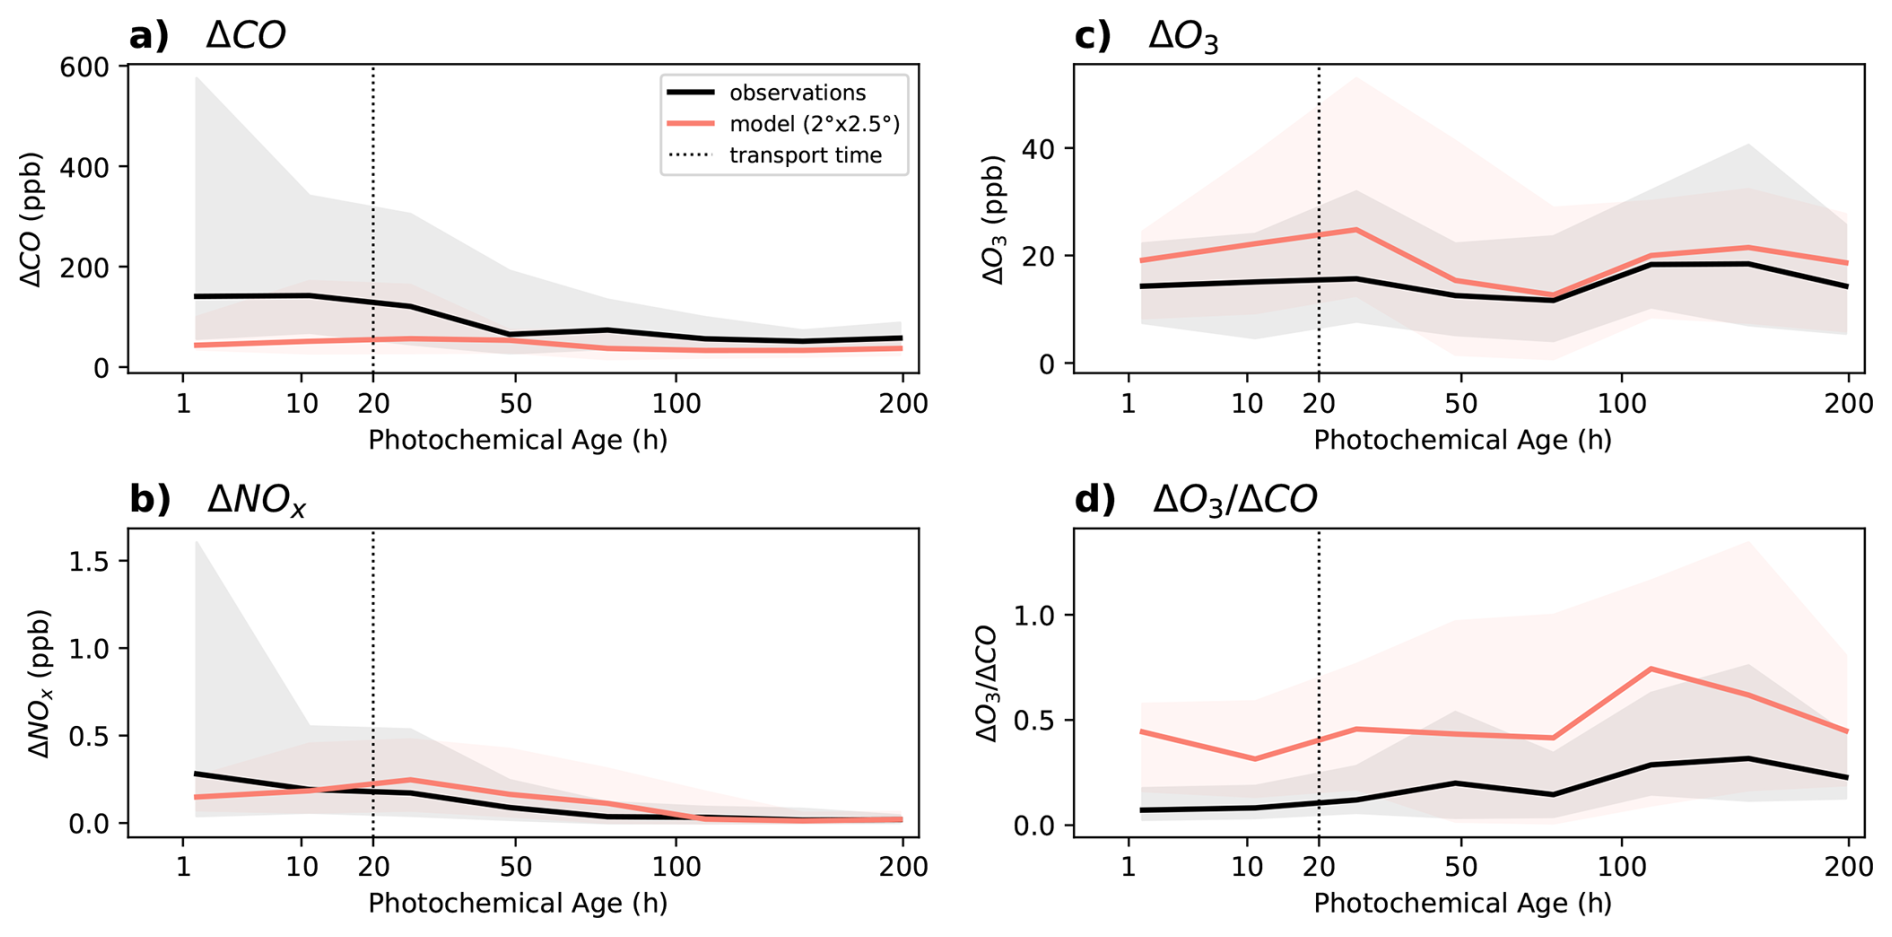
Figure 8Comparison between GEOS-Chem simulated (red) and fire-influenced observations (black), plotted over observationally derived photochemical ages, binned in log-space. The lines represent the median, and the shaded area extends from the 16th to the 84th percentile (corresponding to one standard deviation, in outlier resistant percentile space) within each bin. The dashed line represents the approximate transport time for a 2 × 2.5 grid box at mid-latitudes.
Emissions and resolution
GEOS-Chem is biased low in its representation of fresh fire CO and NOx (Fig. 8a, b), as expected given that standard Eulerian CTMs dilute emissions from localized sources across an entire model grid cell, and thus the model is unable to reproduce concentrated plumes (such as those observed in FIREX-AQ and WE-CAN) at the default resolution of 2° × 2.5° (Rastigejev et al., 2010). Air mass ages of < 20 h likely all fall within the grid box of emission. In addition, the model dramatically underestimates the variability in CO and NOx, particularly in the near-field. Current global fire emissions inventories, including GFED4 as used here, do not represent the full range of fuel types, burning conditions, and fire sizes thereby limiting the ability of GEOS-Chem to represent the variability and range of fire emissions. GEOS-Chem also underestimates total wildfire CO emissions, shown by the consistent ΔCO low bias across all ages. While observed ΔCO is highest in the near-field and decreases with age, the model remains only moderately elevated across the plume lifetime (Fig. 8a). These comparisons suggest that the NOx CO emission ratio is overestimated in the model for the fires measured in our dataset. Accurately representing NOx CO has implications for ozone production rates, especially after aging has occurred, as shown in Fig. 3, and the smoke chemical environment is NOx-sensitive.
We find that a higher resolution (0.5° × 0.625°) simulation of the FIREX-AQ and WE-CAN campaigns (which include the majority of the near-field points) does not improve the agreement between near field ΔNOx and ΔCO (see Fig. S12). This suggests that the 4-fold increase in resolution is insufficient to resolve most sampled fire plumes, and without accurate emissions inventories, it does little to improve the simulation of fire smoke.
We also note that simulated concentrations of radical precursors, HONO and CH2O (Fig. S14), are biased low in the near-field. These species produce OH when they photolyze and therefore drive ozone production. HONO emissions have been shown to provide the dominant source of OH in near-field wildfire plumes (Peng et al., 2020), and our box model confirms the importance of HONO for ozone production rates in the near-field (Fig. 7). However, wildfire emissions of HONO are currently neglected in GEOS-Chem; this omission contributes to the myriad of challenges for reproducing sub-grid near-field ozone formation.
Fire-induced ozone production
Estimating the ozone formed from fires is predicated on removing the ozone background. Previous assessments of background ozone in GEOS-Chem have observed a high model bias; these biases are spatially varying (Guo et al., 2018). Bourgeois et al. (2021) found that CTMs typically underestimate wildfire ozone enhancements in the remote troposphere, which they attribute in part to the artificially high background O3in their models. After removing the simulated background (see Fig. S3) GEOS-Chem overestimates observed ΔO3in fire-influenced air masses in the near-field, but captures observed ΔO3 in the far field (Fig. 8, near-field: R2 = 0.55, NMB = 54 %; far-field R2 = 0.43, NMB = 18 %); the latter is in contrast to the results of Bourgeois et al. (2021) in the far-field. We find that the ozone background in GEOS-Chem for the regions sampled by the aircraft campaigns varies sharply from the observed background, emphasizing the importance of carefully accounting for this background when quantifying ozone production from fires.
In Fig. 8d, we visualize the comparison between simulated and observed ozone in fire-influenced air masses in units of (as in Figs. 1 and 3). This reveals consistent high bias in simulated wildfire ozone production (normalized by a proxy for total emissions, ΔCO) across both the near-field (R2 = 0.44, NMB = 193 %) and far-field (R2 = 0.37, NMB = 80 %). Given the underestimate in CO emissions (Fig. 8a) this suggests that the model is overly efficient in ozone production across plume ages. Thus, while the model simulates the correct magnitude of ozone enhancements in aged fire plumes in particular (see Fig. 8c), this is the result of offsetting biases in emissions and chemistry.
In the near-field the model is unable to capture the NOx suppression and photochemical suppression in concentrated smoke plumes because of limitations in resolution and underestimated emissions. This drives more efficient near-field ozone production in the model than observed, similar to previous observations for ship plumes (Rastigejev et al., 2010), producing elevated .
Figure S12 shows that the GEOS-Chem model generally reproduces the range of the far-field observed ΔNOx distribution, with the exception of the high tail of values above 1 ppb. While the airborne observations show higher for points with higher ΔNOx in Fig. S12b, this behavior is not reproduced in the model. This suggests that, despite similar NOx levels, ozone production in the model in these air masses is less NOx sensitive and tends more towards the transition regime (see Fig. S13). In Fig. S14, we compare the observed and modeled age evolution of two common ozone formation regime proxies, HNO3 H2O2 and HCHO NO2. The respective high and low biases in these ratios confirm that the GEOS-Chem fire-influenced air masses are less sensitive to NOx in the far-field than the observations. Indeed, the model is biased low across all ages for many of the measured VOCs (such as benzene; Fig. S14), and oxidant precursors (HCHO, HONO; Fig. S14). The ratio between NO and NO2 in Fig. S14 shows a high bias across all ages, which is consistent with insufficient conversion of NO to NO2 due to an underestimate in the peroxy radical population, due to the missing VOC reactivity in GEOS-Chem simulated smoke (Carter et al., 2022). Thus, the far-field ozone production high bias in the model likely reflects a combination of higher ozone production in the far-field due to less NOx-sensitivity in the model, as well as excess ozone production in the near-field transported downwind.
While GEOS-Chem (with GFEDv4.1s) does not capture the magnitude and variability of wildfire emissions, leading to a misrepresentation in the smoke ozone formation regime in both the near-field and far-field, the total amount of ozone produced (ΔO3) in the far-field is well captured by the model. This suggests that while more work is needed to accurately capture the evolution of fire plume chemistry – such that the changing ozone formation sensitivity is captured – outside of source regions, the model reasonably reproduces the magnitude of ozone produced in wildfires.
3.3.2 Estimating wildfire impact on tropospheric ozone and human health
In Fig. 9, we quantify the overall impact that fires have in governing the tropospheric ozone burden in the GEOS-Chem model. For 2020, we estimate that fire emissions contribute 2.4 % of the annual mean tropospheric ozone burden, and 3.1 % to annual mean surface ozone concentrations. The total burden estimate agrees reasonably well with the estimate made by Jaffe and Wigder 2012 that 3.5 % of the global in-situ tropospheric O3 production is due to fires, based on scaled average observed regional NEMRs () against inventory estimates of fire CO emissions.
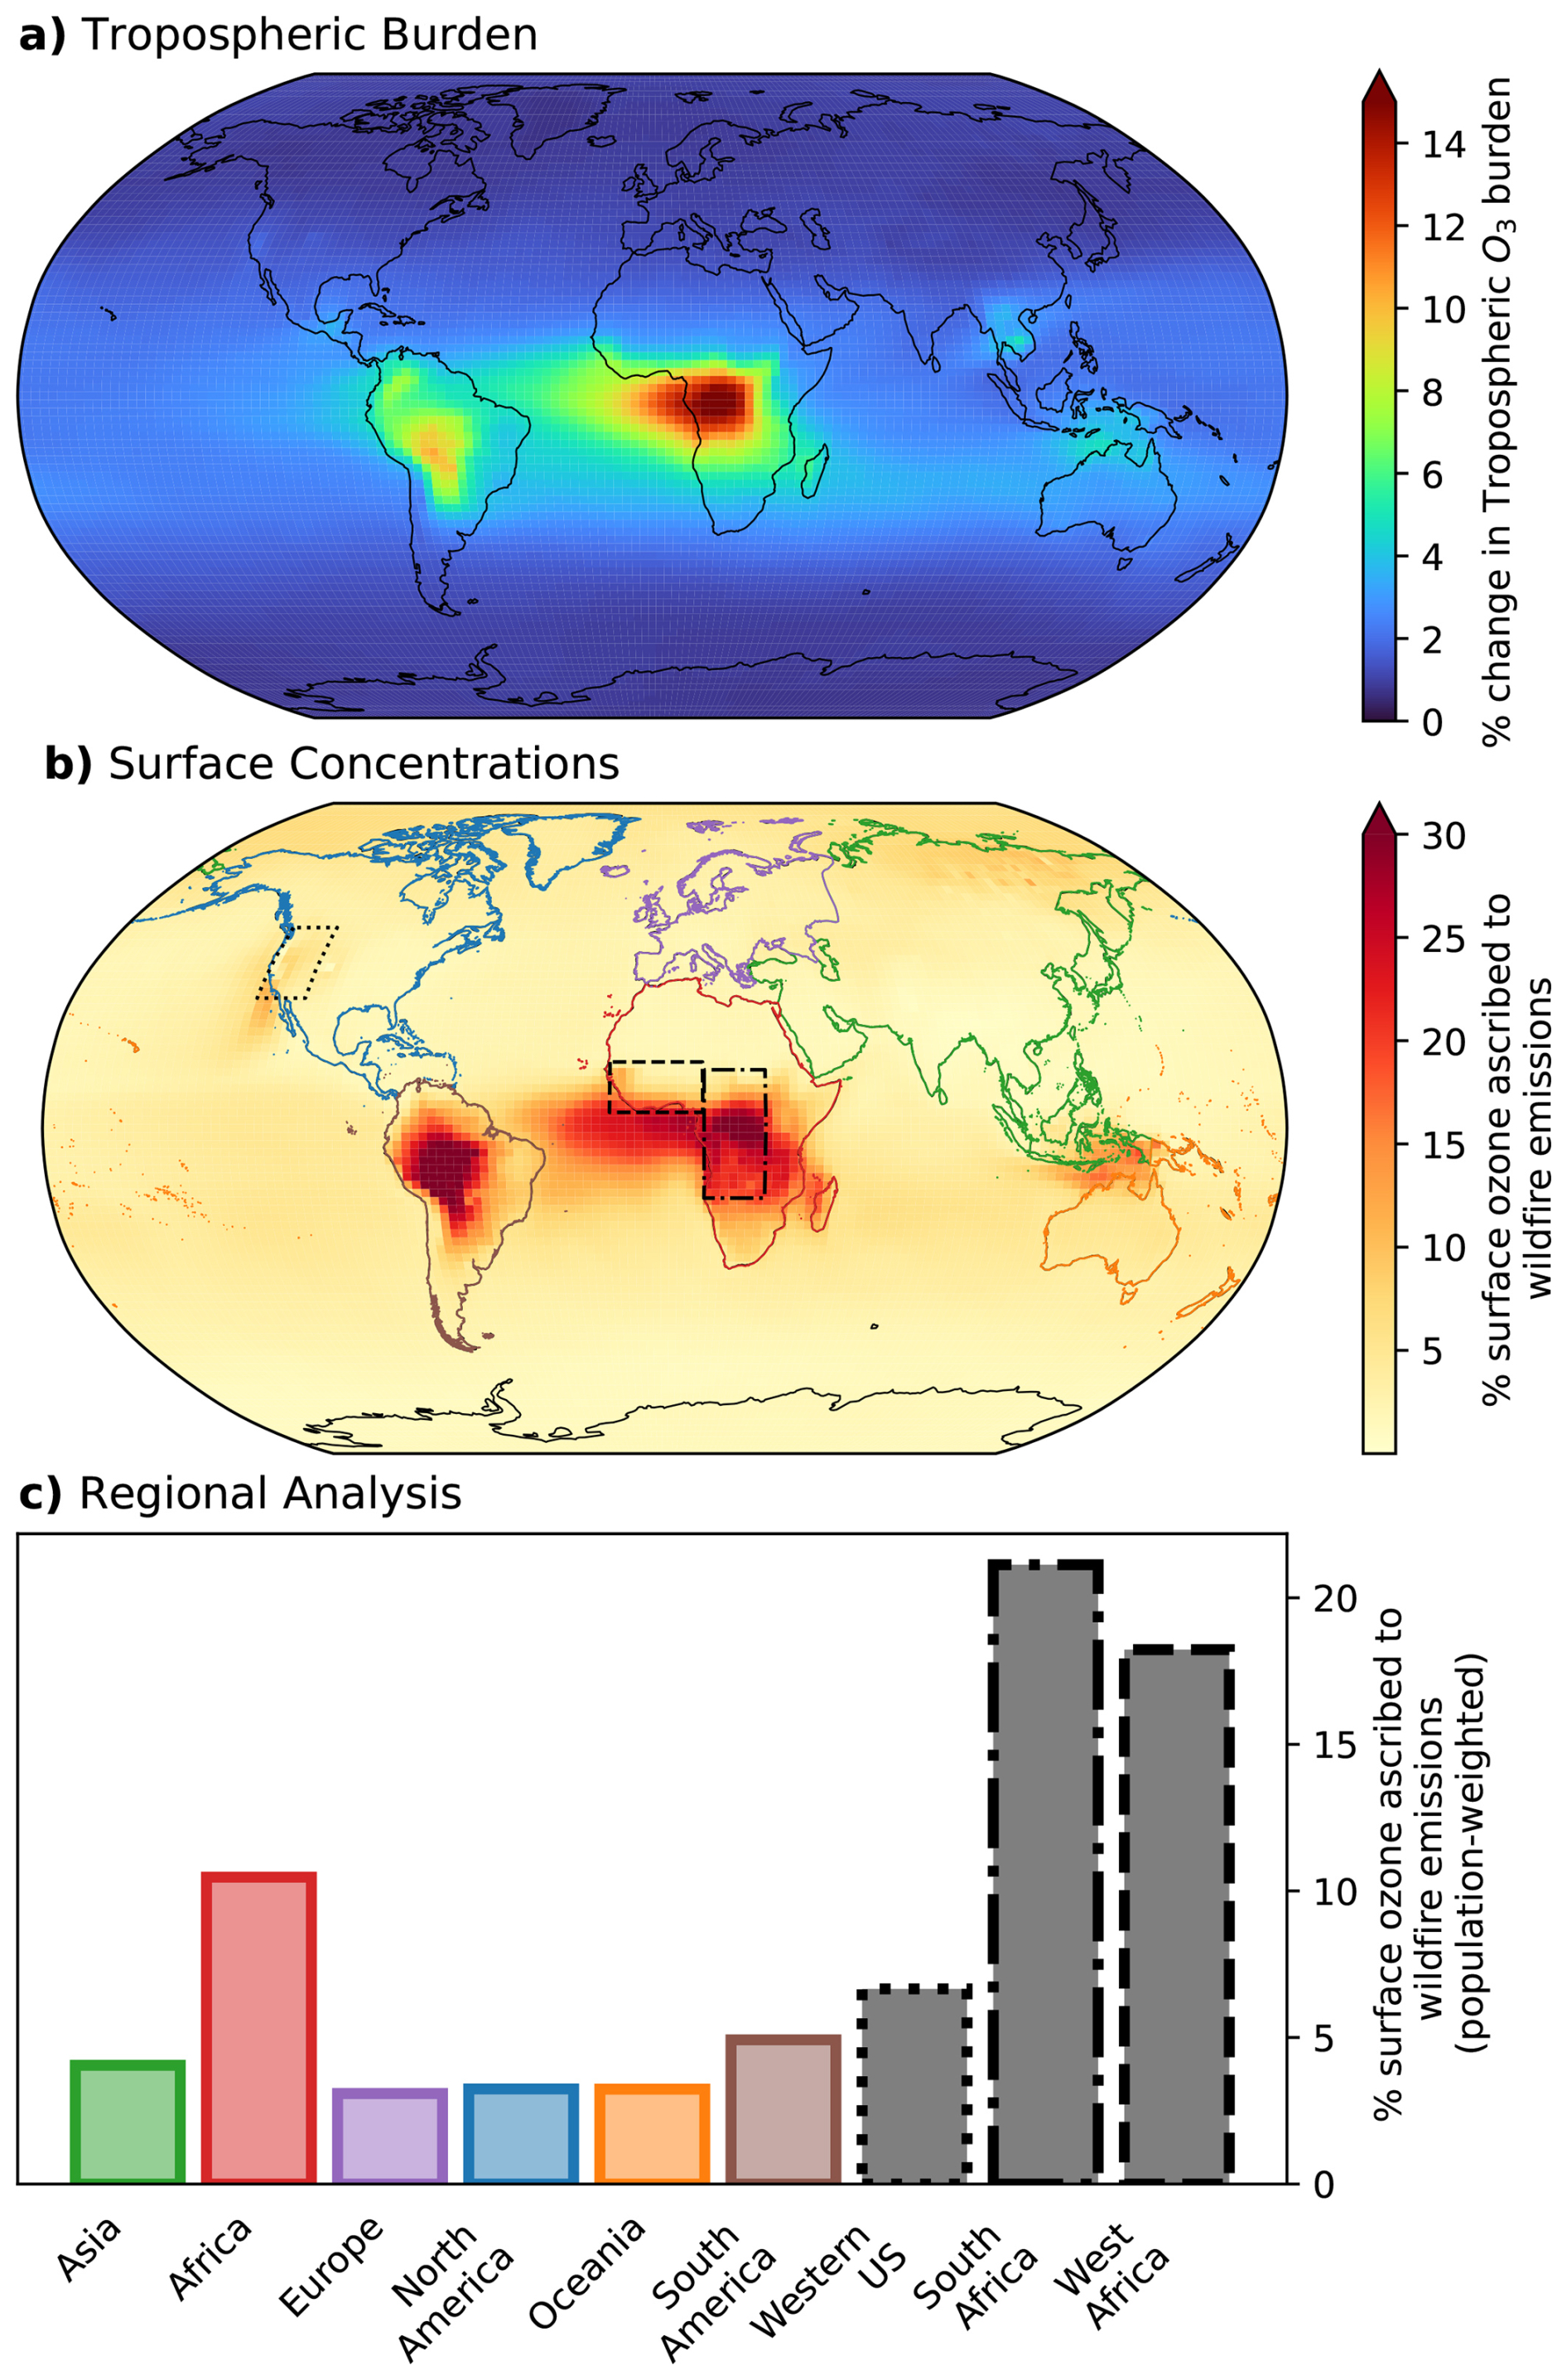
Figure 9Impact of wildfire emissions on tropospheric and surface ozone in GEOS-Chem for the year 2020. (a) Percent change in the tropospheric ozone column burden due to wildfire emissions, with the largest enhancements over tropical Africa and South America. (b) Percent of surface ozone concentrations attributable to wildfire emissions. (c) Regional, population weighted surface ozone exposure. The regions in panel (c) correspond to the colored/patterned outlines in panel (b).
The contribution of fires to simulated ozone burden is regionally variable and highest near areas of frequent burning. In the Amazon and Central Africa fires account for over 10 % of the tropospheric burden (Fig. 9a). The transient fires in the Western U.S. and Canada produce a smaller contribution to the annual mean ozone, but seasonally exceed 5 % of the tropospheric burden.
In Fig. 9b, we show that fire emissions account for up to 30 % of annual mean surface ozone in the most affected regions, with a spatial distribution that largely matches the total burden. The mean percentage of population-weighted exposure to ozone due to fires is generally consistent (3 %–4 %) for each continent, but higher contributions in South America (5 %) and Africa (10.5 %) (Fig. 9c). We also highlight three regions of interest (marked on Fig. 9b): in the Western U.S., 6.7 % of annual mean population-weighted ozone exposure is due to wildfires, and in South and West Africa, that number reaches 21 % and 18 %, respectively. It is worth noting that fire emissions exhibit interannual variability (Cooper et al., 2024) and that fire emissions inventories struggle with regionally-dependent uncertainties (Wiedinmyer et al., 2023). The reported results describe GEOS-Chem's representation of fire impacts on global ozone in a single year (2020), subject to the uncertainties in fire emission inventories.
This study uses data from several airborne campaigns to provide a comprehensive analysis of wildfire-induced tropospheric ozone production during the lifetime of a smoke plume. We observe the chemical regime transition from NOx-saturated to NOx-limited that occurs during smoke aging and identify enhanced ozone production in the far-field when NOx is available to drive ozone chemistry. We quantify the importance of suppressed photochemistry in limiting ozone production under heavy smoke in the near-field. We show that generally, mixed fire-anthropogenic air masses display higher ozone production than air masses that are solely fire-influenced, and suggest that anthropogenic NOx mixing with VOC-rich smoke is the primary driver of these enhancements. We expand upon the work of several previous studies (Bourgeois et al., 2021; Brey and Fischer, 2016; Rickly et al., 2023; Singh et al., 2012) and provide a constraint on the amount of ozone that may be attributed to the mixing between fire smoke and anthropogenic airmasses.
We find that the GEOS-Chem model overestimates near-field ozone enhancements, but captures the amount of ozone produced in far-field fire-influenced airmasses. However, spatial resolution and missing emissions contribute to the overestimate of normalized ozone production in both the near-field and far-field. In the near-field, we show that GEOS-Chem cannot capture concentrated fire emissions, and that the model cannot capture the NOx-suppressed and photochemically-suppressed sub-grid conditions. Other recent work has established that GEOS-Chem struggles to reproduce the impacts of large wildfires in the western US (Carter et al., 2020), in part because chemical transport models with coarse resolution cannot accurately resolve sub-grid processes (Eastham and Jacob, 2017) or the transport of synoptic scale plumes due to numerical diffusion issues (Rastigejev et al., 2010). Wang et al. (2021a) used a large-eddy simulation coupled to a chemical model to demonstrate that while a resolution of 1 km was sufficient for capturing downwind chemistry, a model with 4 km resolution failed at representing chemical regime shifts and thus incorrectly estimated O3 formation. With current computational constraints, GEOS-Chem and other global chemical transport models cannot operate at such fine resolutions. Resolution limitations coupled with uncertain emissions inventories drive persistent biases in the ozone formation regime behavior seen in the model. In the far-field, comparing GEOS-Chem to the observed response of different integrated (HNO3 H2O2, HCHO NO2) and instantaneous (NO NO2) metrics of ozone chemistry and radical cycling reveals that the model does not capture the observed shift towards NOx-limited regime, likely due to underestimated VOC reactivity in fire plumes. Hence, the agreement in wildfire-ozone enhancements between GEOS-Chem and the airborne observations in the far-field may be fortuitous – more work is needed to ensure that models capture smoke chemical evolution correctly, so that accurate predictions of ozone air quality can be made, especially in the context of mixing with anthropogenic pollution, which is shown to drive extreme exceedance events.
There are additional factors that may influence the formation of ozone from fires that were not explored in this study and could be further investigated in future work. Neither our observational analysis nor our model evaluation focused directly on fire plume injection height, though it contributes uncertainty to the transport process and determines where wildfire-induced ozone production will occur. To define the chemical smoke aging process with more confidence, our photochemical aging method could be validated using other approaches. Having a reliable physical age for smoke could corroborate our photochemical age metric while also providing information about oxidation in wildfire plumes. Limited to our set of observations, this study did not consider the impact that nighttime chemistry has on smoke plumes, though previous work has shown the importance of the diurnal cycle in changing oxidation patterns and plume chemistry (Decker et al., 2021; Robinson et al., 2021; Wang et al., 2021a).
Additional observations are needed to connect near-field chemistry to far-field chemistry, both for confirming the phenomena discussed above and to provide additional benchmarks for model development. More observations are needed particularly in regions outside the US – the campaign data that we synthesize does not fully represent the fuel types and meteorological conditions outside North America. Additionally, more observations of smoke mixing with urban air would be valuable. For fire-ozone chemistry studies, observations of the radical population (HO2, OHR), radical precursors (HONO), and reservoir species (HNO3, H2O2) would be valuable. Consistent tracers for fires and anthropogenic activity remain essential. The superior coverage of geostationary satellites provides exciting avenues for future analysis, and observations of formaldehyde and nitrogen dioxide may be leveraged to better understand the aging of fire plumes in relation to NOx-VOC-O3 photochemistry in near real-time, following work by Jin et al. (2023b).
Improving global simulation of wildfire-induced ozone production will require further investigation into fire dynamics and chemistry, and ongoing refinement of emissions inventories and related parameterizations. Despite resolution limitations, efforts to capture variability in wildfire emission inventories could improve model skill in reproducing the smoke chemical environment. More work is needed to comprehensively characterize leading sources of smoke VOC reactivity and incorporate near-field radical sources such as HONO in models. One potential avenue for representing sub-grid wildfire smoke chemistry within GEOS-Chem (and similar models) would be to use the type of sub-grid parameterization used for ship plumes (Vinken et al., 2011). And finally, improved representation of ozone background concentrations would enable more productive comparisons with observations.
With climate-driven increases in fire activity and frequency in many regions of the world, it is becoming increasingly important to better understand how these fires contribute to ozone formation throughout the troposphere. Additional comprehensive measurements that characterize this evolution over the lifecycle of a fire plume are essential for testing and identifying opportunities to improve models. High fidelity models are needed to facilitate more comprehensive estimates of the tropospheric ozone burden and drive more intelligent policy measures and mitigation strategies in the face of a changing climate.
The code used to run the analysis and the data used to generate the figures included in this paper are publicly available at: https://doi.org/10.5281/zenodo.17127240 (Palmo, 2025). The GEOS-Chem model is publicly available at: https://doi.org/10.5281/zenodo.10640383 (Yantosca et al., 2024). The ARCTAS campaign data are available at: https://www-air.larc.nasa.gov/cgi-bin/ArcView/arctas (last access: 14 November 2025; ARCTAS, 2025). The ATom campaign data are available at: https://espo.nasa.gov/atom (last access: 14 November 2025; ATom, 2025). The DC3 campaign data are available at: https://www.eol.ucar.edu/field_projects/dc3 (last access: 14 November 2025; DC3, 2025). The FIREX-AQ campaign data are available at: https://www-air.larc.nasa.gov/cgi-bin/ArcView/firexaq (last access: 14 November 2025; FIREX-AQ, 2025). The WE-CAN campaign data are available at: https://www.eol.ucar.edu/field_projects/we-can (last access: 14 November 2025; WE-CAN, 2025).
The supplement related to this article is available online at https://doi.org/10.5194/acp-25-17107-2025-supplement.
CLH and JOP designed the study. JOP led the analysis and performed the simulations. DRB, IB, MC, JC, FF, AF, GG, SH, LH, JLJ, PCJ, ITK, BN, BP, JP, IP, AS, JT, CW, AW, LX provided measurements used in the analysis (See Table S1). JOP and CLH wrote and edited the paper with input from the co-authors.
At least one of the (co-)authors is a member of the editorial board of Atmospheric Chemistry and Physics. The peer-review process was guided by an independent editor, and the authors also have no other competing interests to declare.
Publisher's note: Copernicus Publications remains neutral with regard to jurisdictional claims made in the text, published maps, institutional affiliations, or any other geographical representation in this paper. While Copernicus Publications makes every effort to include appropriate place names, the final responsibility lies with the authors. Views expressed in the text are those of the authors and do not necessarily reflect the views of the publisher.
We acknowledge the following investigators for providing measurements (see Table S1): Andrew Weinheimer, Bruce Daube, Chelsea Thompson, Colm Sweeney, Delphine Farmer, Dirk Richter, Eric Apel, Glenn Diskin, Glenn Wolfe, Greg Huey, Hannah Allen, James Elkins, Jason St. Clair, Jessica Gilman, John Crounse, Kathryn McKain, Kirk Ullmann, Patrick Veres, Paul Wennberg, Roisin Commane, Steve Wofsy, Teresa Campos, Thomas Hanisco, Thomas Ryerson, Wade Permar, Yong Zhou. The model simulations and analyses presented here were conducted using the “Svante” cluster, a facility located at MIT's Massachusetts Green High Performance Computing Center and jointly supported by the MIT Joint Program on the Science and Policy of Global Change; the Department of Earth, Atmospheric and Planetary Sciences; the Department of Civil and Environmental Engineering; the Institute for Data, Systems, and Society; and the Center for Global Change Science.
This work was funded by the U.S. National Science Foundation (AGS-2223070). LH acknowledges additional support from NSF (EPSCoR-2242802 and AGS-2144896). The CU-Boulder group was supported by NASA (80NSSC23K0828).
SH was supported by the NSF National Center for Atmospheric Research, which is a major facility sponsored by the US National Science Foundation under cooperative agreement no. 1852977. Their research was funded by NASA award nos. NNX08AD41G, NNX15AG71A and 80NSSC18K0638.
This paper was edited by Qiang Zhang and reviewed by Daniel A. J. Jaffe and one anonymous referee.
Abatzoglou, J. T. and Williams, A. P.: Impact of anthropogenic climate change on wildfire across western US forests, Proc. Natl. Acad. Sci. USA, 113, 11770–11775, https://doi.org/10.1073/pnas.1607171113, 2016.
Abatzoglou, J. T., Battisti, D. S., Williams, A. P., Hansen, W. D., Harvey, B. J., and Kolden, C. A.: Projected increases in western US forest fire despite growing fuel constraints, Commun. Earth Environ., 2, 1–8, https://doi.org/10.1038/s43247-021-00299-0, 2021.
Alvarado, M. J., Logan, J. A., Mao, J., Apel, E., Riemer, D., Blake, D., Cohen, R. C., Min, K.-E., Perring, A. E., Browne, E. C., Wooldridge, P. J., Diskin, G. S., Sachse, G. W., Fuelberg, H., Sessions, W. R., Harrigan, D. L., Huey, G., Liao, J., Case-Hanks, A., Jimenez, J. L., Cubison, M. J., Vay, S. A., Weinheimer, A. J., Knapp, D. J., Montzka, D. D., Flocke, F. M., Pollack, I. B., Wennberg, P. O., Kurten, A., Crounse, J., Clair, J. M. St., Wisthaler, A., Mikoviny, T., Yantosca, R. M., Carouge, C. C., and Le Sager, P.: Nitrogen oxides and PAN in plumes from boreal fires during ARCTAS-B and their impact on ozone: an integrated analysis of aircraft and satellite observations, Atmos. Chem. Phys., 10, 9739–9760, https://doi.org/10.5194/acp-10-9739-2010, 2010.
Andreae, M. O.: Emission of trace gases and aerosols from biomass burning – an updated assessment, Atmos. Chem. Phys., 19, 8523–8546, https://doi.org/10.5194/acp-19-8523-2019, 2019.
ARCTAS: DC8_AIRCRAFT Data, National Aeronautics and Space Administration [data set], https://www-air.larc.nasa.gov/cgi-bin/ArcView/arctas, last access: 14 November 2025.
ATom: ATom, ESPO, National Aeronautics and Space Administration [data set], https://espoarchive.nasa.gov/archive/browse/atom/id3/DC8, last access: 14 November 2025.
Bates, K. H. and Jacob, D. J.: A new model mechanism for atmospheric oxidation of isoprene: global effects on oxidants, nitrogen oxides, organic products, and secondary organic aerosol, Atmos. Chem. Phys., 19, 9613–9640, https://doi.org/10.5194/acp-19-9613-2019, 2019.
Baublitz, C. B., Fiore, A. M., Ludwig, S. M., Nicely, J. M., Wolfe, G. M., Murray, L. T., Commane, R., Prather, M. J., Anderson, D. C., Correa, G., Duncan, B. N., Follette-Cook, M., Westervelt, D. M., Bourgeois, I., Brune, W. H., Bui, T. P., DiGangi, J. P., Diskin, G. S., Hall, S. R., McKain, K., Miller, D. O., Peischl, J., Thames, A. B., Thompson, C. R., Ullmann, K., and Wofsy, S. C.: An observation-based, reduced-form model for oxidation in the remote marine troposphere, Proceedings of the National Academy of Sciences, 120, e2209735120, https://doi.org/10.1073/pnas.2209735120, 2023.
Baylon, P., Jaffe, D. A., Wigder, N. L., Gao, H., and Hee, J.: Ozone enhancement in western US wildfire plumes at the Mt. Bachelor Observatory: The role of NOx, Atmospheric Environment, 109, 297–304, https://doi.org/10.1016/j.atmosenv.2014.09.013, 2015.
Bourgeois, I., Peischl, J., Neuman, J. A., Brown, S. S., Thompson, C. R., Aikin, K. C., Allen, H. M., Angot, H., Apel, E. C., Baublitz, C. B., Brewer, J. F., Campuzano-Jost, P., Commane, R., Crounse, J. D., Daube, B. C., DiGangi, J. P., Diskin, G. S., Emmons, L. K., Fiore, A. M., Gkatzelis, G. I., Hills, A., Hornbrook, R. S., Huey, L. G., Jimenez, J. L., Kim, M., Lacey, F., McKain, K., Murray, L. T., Nault, B. A., Parrish, D. D., Ray, E., Sweeney, C., Tanner, D., Wofsy, S. C., and Ryerson, T. B.: Large contribution of biomass burning emissions to ozone throughout the global remote troposphere, Proc. Natl. Acad. Sci. USA, 118, e2109628118, https://doi.org/10.1073/pnas.2109628118, 2021.
Brey, S. J. and Fischer, E. V.: Smoke in the City: How Often and Where Does Smoke Impact Summertime Ozone in the United States?, Environ. Sci. Technol., 50, 1288–1294, https://doi.org/10.1021/acs.est.5b05218, 2016.
Burke, M., Driscoll, A., Heft-Neal, S., Xue, J., Burney, J., and Wara, M.: The changing risk and burden of wildfire in the United States, Proc. Natl. Acad. Sci. USA, 118, e2011048118, https://doi.org/10.1073/pnas.2011048118, 2021.
Carter, T. S., Heald, C. L., Jimenez, J. L., Campuzano-Jost, P., Kondo, Y., Moteki, N., Schwarz, J. P., Wiedinmyer, C., Darmenov, A. S., da Silva, A. M., and Kaiser, J. W.: How emissions uncertainty influences the distribution and radiative impacts of smoke from fires in North America, Atmos. Chem. Phys., 20, 2073–2097, https://doi.org/10.5194/acp-20-2073-2020, 2020.
Carter, T. S., Heald, C. L., Kroll, J. H., Apel, E. C., Blake, D., Coggon, M., Edtbauer, A., Gkatzelis, G., Hornbrook, R. S., Peischl, J., Pfannerstill, E. Y., Piel, F., Reijrink, N. G., Ringsdorf, A., Warneke, C., Williams, J., Wisthaler, A., and Xu, L.: An improved representation of fire non-methane organic gases (NMOGs) in models: emissions to reactivity, Atmos. Chem. Phys., 22, 12093–12111, https://doi.org/10.5194/acp-22-12093-2022, 2022.
Chameides, W. L., Fehsenfeld, F., Rodgers, M. O., Cardelino, C., Martinez, J., Parrish, D., Lonneman, W., Lawson, D. R., Rasmussen, R. A., Zimmerman, P., Greenberg, J., Mlddleton, P., and Wang, T.: Ozone precursor relationships in the ambient atmosphere, Journal of Geophysical Research: Atmospheres, 97, 6037–6055, https://doi.org/10.1029/91JD03014, 1992.
Cooper, O. R., Chang, K.-L., Bates, K., Brown, S. S., Chace, W. S., Coggon, M. M., Gorchov Negron, A. M., Middlebrook, A. M., Peischl, J., Piasecki, A., Schafer, N., Stockwell, C. E., Wang, S., Warneke, C., Zuraski, K., Miyazaki, K., Payne, V. H., Pennington, E. A., Worden, J. R., Bowman, K. W. and McDonald, B. C.: Early Season 2023 Wildfires Generated Record-Breaking Surface Ozone Anomalies Across the U.S. Upper Midwest, Geophysical Research Letters, 51, e2024GL111481, https://doi.org/10.1029/2024GL111481, 2024.
DC3: Deep Convective Clouds & Chemistry Project, Earth Observing Laboratory, National Center for Atmospheric Research [data set], https://www-air.larc.nasa.gov/cgi-bin/ArcView/dc3-seac4rs, last access: 14 November 2025.
DeBell, L. J., Talbot, R. W., Dibb, J. E., Munger, J. W., Fischer, E. V., and Frolking, S. E.: A major regional air pollution event in the northeastern United States caused by extensive forest fires in Quebec, Canada, Journal of Geophysical Research: Atmospheres, 109, https://doi.org/10.1029/2004JD004840, 2004.
Decker, Z. C. J., Wang, S., Bourgeois, I., Campuzano Jost, P., Coggon, M. M., DiGangi, J. P., Diskin, G. S., Flocke, F. M., Franchin, A., Fredrickson, C. D., Gkatzelis, G. I., Hall, S. R., Halliday, H., Hayden, K., Holmes, C. D., Huey, L. G., Jimenez, J. L., Lee, Y. R., Lindaas, J., Middlebrook, A. M., Montzka, D. D., Neuman, J. A., Nowak, J. B., Pagonis, D., Palm, B. B., Peischl, J., Piel, F., Rickly, P. S., Robinson, M. A., Rollins, A. W., Ryerson, T. B., Sekimoto, K., Thornton, J. A., Tyndall, G. S., Ullmann, K., Veres, P. R., Warneke, C., Washenfelder, R. A., Weinheimer, A. J., Wisthaler, A., Womack, C., and Brown, S. S.: Novel Analysis to Quantify Plume Crosswind Heterogeneity Applied to Biomass Burning Smoke, Environ. Sci. Technol., 55, 15646–15657, https://doi.org/10.1021/acs.est.1c03803, 2021.
De Gouw, J. A.: Budget of organic carbon in a polluted atmosphere: Results from the New England Air Quality Study in 2002, J. Geophys. Res., 110, D16305, https://doi.org/10.1029/2004JD005623, 2005.
Eastham, S. D. and Jacob, D. J.: Limits on the ability of global Eulerian models to resolve intercontinental transport of chemical plumes, Atmos. Chem. Phys., 17, 2543–2553, https://doi.org/10.5194/acp-17-2543-2017, 2017.
Fiore, A. M., Mickley, L. J., Zhu, Q., and Baublitz, C. B.: Climate and Tropospheric Oxidizing Capacity, Annual Review of Earth and Planetary Sciences, 52, https://doi.org/10.1146/annurev-earth-032320-090307, 2024.
FIREX-AQ: Fire Influence on Regional to Global Environments [data set], https://www-air.larc.nasa.gov/cgi-bin/ArcView/firexaq?MERGE=, last access 14 November 2025.
GEOS-Chem: GCClassic 14.3.0 release, Zenodo [code], https://doi.org/10.5281/zenodo.1343547, 2024.
Gkatzelis, G. I., Coggon, M. M., Stockwell, C. E., Hornbrook, R. S., Allen, H., Apel, E. C., Bela, M. M., Blake, D. R., Bourgeois, I., Brown, S. S., Campuzano-Jost, P., St. Clair, J. M., Crawford, J. H., Crounse, J. D., Day, D. A., DiGangi, J. P., Diskin, G. S., Fried, A., Gilman, J. B., Guo, H., Hair, J. W., Halliday, H. S., Hanisco, T. F., Hannun, R., Hills, A., Huey, L. G., Jimenez, J. L., Katich, J. M., Lamplugh, A., Lee, Y. R., Liao, J., Lindaas, J., McKeen, S. A., Mikoviny, T., Nault, B. A., Neuman, J. A., Nowak, J. B., Pagonis, D., Peischl, J., Perring, A. E., Piel, F., Rickly, P. S., Robinson, M. A., Rollins, A. W., Ryerson, T. B., Schueneman, M. K., Schwantes, R. H., Schwarz, J. P., Sekimoto, K., Selimovic, V., Shingler, T., Tanner, D. J., Tomsche, L., Vasquez, K. T., Veres, P. R., Washenfelder, R., Weibring, P., Wennberg, P. O., Wisthaler, A., Wolfe, G. M., Womack, C. C., Xu, L., Ball, K., Yokelson, R. J., and Warneke, C.: Parameterizations of US wildfire and prescribed fire emission ratios and emission factors based on FIREX-AQ aircraft measurements, Atmos. Chem. Phys., 24, 929–956, https://doi.org/10.5194/acp-24-929-2024, 2024.
Guenther, A. B., Jiang, X., Heald, C. L., Sakulyanontvittaya, T., Duhl, T., Emmons, L. K., and Wang, X.: The Model of Emissions of Gases and Aerosols from Nature version 2.1 (MEGAN2.1): an extended and updated framework for modeling biogenic emissions, Geosci. Model Dev., 5, 1471–1492, https://doi.org/10.5194/gmd-5-1471-2012, 2012.
Guo, J. J., Fiore, A. M., Murray, L. T., Jaffe, D. A., Schnell, J. L., Moore, C. T., and Milly, G. P.: Average versus high surface ozone levels over the continental USA: model bias, background influences, and interannual variability, Atmos. Chem. Phys., 18, 12123–12140, https://doi.org/10.5194/acp-18-12123-2018, 2018.
Heald, C. L., Gouw, J. de, Goldstein, A. H., Guenther, A. B., Hayes, P. L., Hu, W., Isaacman-VanWertz, G., Jimenez, J. L., Keutsch, F. N., Koss, A. R., Misztal, P. K., Rappenglück, B., Roberts, J. M., Stevens, P. S., Washenfelder, R. A., Warneke, C., and Young, C. J.: Contrasting Reactive Organic Carbon Observations in the Southeast United States (SOAS) and Southern California (CalNex), Environ. Sci. Technol., 54, 14923–14935, https://doi.org/10.1021/acs.est.0c05027, 2020.
Hoesly, R. M., Smith, S. J., Feng, L., Klimont, Z., Janssens-Maenhout, G., Pitkanen, T., Seibert, J. J., Vu, L., Andres, R. J., Bolt, R. M., Bond, T. C., Dawidowski, L., Kholod, N., Kurokawa, J.-I., Li, M., Liu, L., Lu, Z., Moura, M. C. P., O'Rourke, P. R., and Zhang, Q.: Historical (1750–2014) anthropogenic emissions of reactive gases and aerosols from the Community Emissions Data System (CEDS), Geosci. Model Dev., 11, 369–408, https://doi.org/10.5194/gmd-11-369-2018, 2018.
Jacob, D. J.: Heterogeneous chemistry and tropospheric ozone, Atmospheric Environment, 34, 2131–2159, https://doi.org/10.1016/S1352-2310(99)00462-8, 2000.
Jaffe, D. A. and Wigder, N. L.: Ozone production from wildfires: A critical review, Atmospheric Environment, 51, 1–10, https://doi.org/10.1016/j.atmosenv.2011.11.063, 2012.
Jin, L., Permar, W., Selimovic, V., Ketcherside, D., Yokelson, R. J., Hornbrook, R. S., Apel, E. C., Ku, I.-T., Collett Jr., J. L., Sullivan, A. P., Jaffe, D. A., Pierce, J. R., Fried, A., Coggon, M. M., Gkatzelis, G. I., Warneke, C., Fischer, E. V., and Hu, L.: Constraining emissions of volatile organic compounds from western US wildfires with WE-CAN and FIREX-AQ airborne observations, Atmos. Chem. Phys., 23, 5969–5991, https://doi.org/10.5194/acp-23-5969-2023, 2023a.
Jin, X., Fiore, A. M., and Cohen, R. C.: Space-Based Observations of Ozone Precursors within California Wildfire Plumes and the Impacts on Ozone-NOx-VOC Chemistry, Environ. Sci. Technol., 57, 14648–14660, https://doi.org/10.1021/acs.est.3c04411, 2023b.
JPL Data Evaluation: https://jpldataeval.jpl.nasa.gov/, last access: 25 March 2024.
Juncosa Calahorrano, J. F., Lindaas, J., O'Dell, K., Palm, B. B., Peng, Q., Flocke, F., Pollack, I. B., Garofalo, L. A., Farmer, D. K., Pierce, J. R., Collett, J. L., Weinheimer, A., Campos, T., Hornbrook, R. S., Hall, S. R., Ullmann, K., Pothier, M. A., Apel, E. C., Permar, W., Hu, L., Hills, A. J., Montzka, D., Tyndall, G., Thornton, J. A., and Fischer, E. V.: Daytime Oxidized Reactive Nitrogen Partitioning in Western U.S. Wildfire Smoke Plumes, JGR Atmospheres, 126, e2020JD033484, https://doi.org/10.1029/2020JD033484, 2021.
Kirchner, F., Jeanneret, F., Clappier, A., Krüger, B., van den Bergh, H., and Calpini, B.: Total VOC reactivity in the planetary boundary layer: 2. A new indicator for determining the sensitivity of the ozone production to VOC and NOx, Journal of Geophysical Research: Atmospheres, 106, 3095–3110, https://doi.org/10.1029/2000JD900603, 2001.
Kleinman, L. I.: Low and high NOx tropospheric photochemistry, Journal of Geophysical Research: Atmospheres, 99, 16831–16838, https://doi.org/10.1029/94JD01028, 1994.
Laughner, J. L. and Cohen, R. C.: Direct observation of changing NOx lifetime in North American cities, Science, 366, 723–727, https://doi.org/10.1126/science.aax6832, 2019.
Lee, H. and Jaffe, D. A.: Impact of wildfire smoke on ozone concentrations using a Generalized Additive model in Salt Lake City, Utah, USA, 2006–2022, Journal of the Air & Waste Management Association, 74, 116–130, https://doi.org/10.1080/10962247.2023.2291197, 2024.
Liao, J., Wolfe, G. M., Hannun, R. A., St. Clair, J. M., Hanisco, T. F., Gilman, J. B., Lamplugh, A., Selimovic, V., Diskin, G. S., Nowak, J. B., Halliday, H. S., DiGangi, J. P., Hall, S. R., Ullmann, K., Holmes, C. D., Fite, C. H., Agastra, A., Ryerson, T. B., Peischl, J., Bourgeois, I., Warneke, C., Coggon, M. M., Gkatzelis, G. I., Sekimoto, K., Fried, A., Richter, D., Weibring, P., Apel, E. C., Hornbrook, R. S., Brown, S. S., Womack, C. C., Robinson, M. A., Washenfelder, R. A., Veres, P. R., and Neuman, J. A.: Formaldehyde evolution in US wildfire plumes during the Fire Influence on Regional to Global Environments and Air Quality experiment (FIREX-AQ), Atmos. Chem. Phys., 21, 18319–18331, https://doi.org/10.5194/acp-21-18319-2021, 2021.
Lindaas, J., Pollack, I. B., Garofalo, L. A., Pothier, M. A., Farmer, D. K., Kreidenweis, S. M., Campos, T. L., Flocke, F., Weinheimer, A. J., Montzka, D. D., Tyndall, G. S., Palm, B. B., Peng, Q., Thornton, J. A., Permar, W., Wielgasz, C., Hu, L., Ottmar, R. D., Restaino, J. C., Hudak, A. T., Ku, I.-T., Zhou, Y., Sive, B. C., Sullivan, A., Collett Jr., J. L., and Fischer, E. V.: Emissions of Reactive Nitrogen From Western U.S. Wildfires During Summer 2018, Journal of Geophysical Research: Atmospheres, 126, e2020JD032657, https://doi.org/10.1029/2020JD032657, 2021.
Loman, T. E., Ma, Y., Ilin, V., Gowda, S., Korsbo, N., Yewale, N., Rackauckas, C., and Isaacson, S. A.: Catalyst: Fast and flexible modeling of reaction networks, PLOS Computational Biology, 19, e1011530, https://doi.org/10.1371/journal.pcbi.1011530, 2023.
McClure, C. D. and Jaffe, D. A.: Investigation of high ozone events due to wildfire smoke in an urban area, Atmospheric Environment, 194, 146–157, https://doi.org/10.1016/j.atmosenv.2018.09.021, 2018.
Müller, M., Anderson, B. E., Beyersdorf, A. J., Crawford, J. H., Diskin, G. S., Eichler, P., Fried, A., Keutsch, F. N., Mikoviny, T., Thornhill, K. L., Walega, J. G., Weinheimer, A. J., Yang, M., Yokelson, R. J., and Wisthaler, A.: In situ measurements and modeling of reactive trace gases in a small biomass burning plume, Atmos. Chem. Phys., 16, 3813–3824, https://doi.org/10.5194/acp-16-3813-2016, 2016.
Palm, B. B., Peng, Q., Fredrickson, C. D., Lee, B. H., Garofalo, L. A., Pothier, M. A., Kreidenweis, S. M., Farmer, D. K., Pokhrel, R. P., Shen, Y., Murphy, S. M., Permar, W., Hu, L., Campos, T. L., Hall, S. R., Ullmann, K., Zhang, X., Flocke, F., Fischer, E. V., and Thornton, J. A.: Quantification of organic aerosol and brown carbon evolution in fresh wildfire plumes, Proceedings of the National Academy of Sciences, 117, 29469–29477, https://doi.org/10.1073/pnas.2012218117, 2020.
Palmo, J.: joepalmo/O3Fire_paper: Palmo et al. 2025 (code and data) (v1.0.0), Zenodo [code], https://doi.org/10.5281/zenodo.17127240, 2025.
Park, R. J., Jacob, D. J., Field, B. D., Yantosca, R. M., and Chin, M.: Natural and transboundary pollution influences on sulfate-nitrate-ammonium aerosols in the United States: Implications for policy, Journal of Geophysical Research: Atmospheres, 109, https://doi.org/10.1029/2003JD004473, 2004.
Peng, Q., Palm, B. B., Melander, K. E., Lee, B. H., Hall, S. R., Ullmann, K., Campos, T., Weinheimer, A. J., Apel, E. C., Hornbrook, R. S., Hills, A. J., Montzka, D. D., Flocke, F., Hu, L., Permar, W., Wielgasz, C., Lindaas, J., Pollack, I. B., Fischer, E. V., Bertram, T. H., and Thornton, J. A.: HONO Emissions from Western U.S. Wildfires Provide Dominant Radical Source in Fresh Wildfire Smoke, Environ. Sci. Technol., 54, 5954–5963, https://doi.org/10.1021/acs.est.0c00126, 2020.
Permar, W., Wang, Q., Selimovic, V., Wielgasz, C., Yokelson, R. J., Hornbrook, R. S., Hills, A. J., Apel, E. C., Ku, I.-T., Zhou, Y., Sive, B. C., Sullivan, A. P., Collett Jr, J. L., Campos, T. L., Palm, B. B., Peng, Q., Thornton, J. A., Garofalo, L. A., Farmer, D. K., Kreidenweis, S. M., Levin, E. J. T., DeMott, P. J., Flocke, F., Fischer, E. V., and Hu, L.: Emissions of Trace Organic Gases From Western U.S. Wildfires Based on WE-CAN Aircraft Measurements, Journal of Geophysical Research: Atmospheres, 126, e2020JD033838, https://doi.org/10.1029/2020JD033838, 2021.
Permar, W., Jin, L., Peng, Q., O'Dell, K., Lill, E., Selimovic, V., J. Yokelson, R., S. Hornbrook, R., J. Hills, A., C. Apel, E., Ku, I.-T., Zhou, Y., C. Sive, B., P. Sullivan, A., L. Collett, J., B. Palm, B., A. Thornton, J., Flocke, F., V. Fischer, E., and Hu, L.: Atmospheric OH reactivity in the western United States determined from comprehensive gas-phase measurements during WE-CAN, Environmental Science: Atmospheres, 3, 97–114, https://doi.org/10.1039/D2EA00063F, 2023.
Pfister, G. G., Wiedinmyer, C., and Emmons, L. K.: Impacts of the fall 2007 California wildfires on surface ozone: Integrating local observations with global model simulations, Geophysical Research Letters, 35, https://doi.org/10.1029/2008GL034747, 2008.
Rastigejev, Y., Park, R., Brenner, M. P., and Jacob, D. J.: Resolving intercontinental pollution plumes in global models of atmospheric transport, Journal of Geophysical Research: Atmospheres, 115, https://doi.org/10.1029/2009JD012568, 2010.
Rickly, P. S., Coggon, M. M., Aikin, K. C., Alvarez, R. J. I., Baidar, S., Gilman, J. B., Gkatzelis, G. I., Harkins, C., He, J., Lamplugh, A., Langford, A. O., McDonald, B. C., Peischl, J., Robinson, M. A., Rollins, A. W., Schwantes, R. H., Senff, C. J., Warneke, C., and Brown, S. S.: Influence of Wildfire on Urban Ozone: An Observationally Constrained Box Modeling Study at a Site in the Colorado Front Range, Environ. Sci. Technol., 57, 1257–1267, https://doi.org/10.1021/acs.est.2c06157, 2023.
Robinson, M. A., Decker, Z. C. J., Barsanti, K. C., Coggon, M. M., Flocke, F. M., Franchin, A., Fredrickson, C. D., Gilman, J. B., Gkatzelis, G. I., Holmes, C. D., Lamplugh, A., Lavi, A., Middlebrook, A. M., Montzka, D. M., Palm, B. B., Peischl, J., Pierce, B., Schwantes, R. H., Sekimoto, K., Selimovic, V., Tyndall, G. S., Thornton, J. A., Van Rooy, P., Warneke, C., Weinheimer, A. J., and Brown, S. S.: Variability and Time of Day Dependence of Ozone Photochemistry in Western Wildfire Plumes, Environ. Sci. Technol., 55, 10280–10290, https://doi.org/10.1021/acs.est.1c01963, 2021.
Schneider, S. R., Shi, B., and Abbatt, J. P. D.: The Measured Impact of Wildfires on Ozone in Western Canada From 2001 to 2019, Journal of Geophysical Research: Atmospheres, 129, e2023JD038866, https://doi.org/10.1029/2023JD038866, 2024.
Schroeder, J. R., Crawford, J. H., Fried, A., Walega, J., Weinheimer, A., Wisthaler, A., Müller, M., Mikoviny, T., Chen, G., Shook, M., Blake, D. R., and Tonnesen, G. S.: New insights into the column CH2O NO2 ratio as an indicator of near-surface ozone sensitivity, Journal of Geophysical Research: Atmospheres, 122, 8885–8907, https://doi.org/10.1002/2017JD026781, 2017.
Sillman, S., Logan, J. A., and Wofsy, S. C.: The sensitivity of ozone to nitrogen oxides and hydrocarbons in regional ozone episodes, Journal of Geophysical Research: Atmospheres, 95, 1837–1851, https://doi.org/10.1029/JD095iD02p01837, 1990.
Singh, H. B., Anderson, B. E., Brune, W. H., Cai, C., Cohen, R. C., Crawford, J. H., Cubison, M. J., Czech, E. P., Emmons, L., Fuelberg, H. E., Huey, G., Jacob, D. J., Jimenez, J. L., Kaduwela, A., Kondo, Y., Mao, J., Olson, J. R., Sachse, G. W., Vay, S. A., Weinheimer, A., Wennberg, P. O., and Wisthaler, A.: Pollution influences on atmospheric composition and chemistry at high northern latitudes: Boreal and California forest fire emissions, Atmospheric Environment, 44, 4553–4564, https://doi.org/10.1016/j.atmosenv.2010.08.026, 2010.
Singh, H. B., Cai, C., Kaduwela, A., Weinheimer, A., and Wisthaler, A.: Interactions of fire emissions and urban pollution over California: Ozone formation and air quality simulations, Atmospheric Environment, 56, 45–51, https://doi.org/10.1016/j.atmosenv.2012.03.046, 2012.
Stein, A. F., Draxler, R. R., Rolph, G. D., Stunder, B. J. B., Cohen, M. D., and Ngan, F.: NOAA's HYSPLIT Atmospheric Transport and Dispersion Modeling System, Bulletin of the American Meteorological Society, 96, 2059–2077, https://doi.org/10.1175/BAMS-D-14-00110.1, 2015.
Tarasick, D., Galbally, I. E., Cooper, O. R., Schultz, M. G., Ancellet, G., Leblanc, T., Wallington, T. J., Ziemke, J., Liu, X., Steinbacher, M., Staehelin, J., Vigouroux, C., Hannigan, J. W., García, O., Foret, G., Zanis, P., Weatherhead, E., Petropavlovskikh, I., Worden, H., Osman, M., Liu, J., Chang, K.-L., Gaudel, A., Lin, M., Granados-Muñoz, M., Thompson, A. M., Oltmans, S. J., Cuesta, J., Dufour, G., Thouret, V., Hassler, B., Trickl, T., and Neu, J. L.: Tropospheric Ozone Assessment Report: Tropospheric ozone from 1877 to 2016, observed levels, trends and uncertainties, Elementa: Science of the Anthropocene, 7, 39, https://doi.org/10.1525/elementa.376, 2019.
van der Werf, G. R., Randerson, J. T., Giglio, L., Collatz, G. J., Mu, M., Kasibhatla, P. S., Morton, D. C., DeFries, R. S., Jin, Y., and van Leeuwen, T. T.: Global fire emissions and the contribution of deforestation, savanna, forest, agricultural, and peat fires (1997–2009), Atmos. Chem. Phys., 10, 11707–11735, https://doi.org/10.5194/acp-10-11707-2010, 2010.
Vinken, G. C. M., Boersma, K. F., Jacob, D. J., and Meijer, E. W.: Accounting for non-linear chemistry of ship plumes in the GEOS-Chem global chemistry transport model, Atmos. Chem. Phys., 11, 11707–11722, https://doi.org/10.5194/acp-11-11707-2011, 2011.
Wang, H., Lu, X., Jacob, D. J., Cooper, O. R., Chang, K.-L., Li, K., Gao, M., Liu, Y., Sheng, B., Wu, K., Wu, T., Zhang, J., Sauvage, B., Nédélec, P., Blot, R., and Fan, S.: Global tropospheric ozone trends, attributions, and radiative impacts in 1995–2017: an integrated analysis using aircraft (IAGOS) observations, ozonesonde, and multi-decadal chemical model simulations, Atmos. Chem. Phys., 22, 13753–13782, https://doi.org/10.5194/acp-22-13753-2022, 2022.
Wang, S., Coggon, M. M., Gkatzelis, G. I., Warneke, C., Bourgeois, I., Ryerson, T., Peischl, J., Veres, P. R., Neuman, J. A., Hair, J., Shingler, T., Fenn, M., Diskin, G., Huey, L. G., Lee, Y. R., Apel, E. C., Hornbrook, R. S., Hills, A. J., Hall, S. R., Ullmann, K., Bela, M. M., Trainer, M. K., Kumar, R., Orlando, J. J., Flocke, F. M., and Emmons, L. K.: Chemical Tomography in a Fresh Wildland Fire Plume: A Large Eddy Simulation (LES) Study, Journal of Geophysical Research: Atmospheres, 126, e2021JD035203, https://doi.org/10.1029/2021JD035203, 2021a.
Wang, X., Jacob, D. J., Downs, W., Zhai, S., Zhu, L., Shah, V., Holmes, C. D., Sherwen, T., Alexander, B., Evans, M. J., Eastham, S. D., Neuman, J. A., Veres, P. R., Koenig, T. K., Volkamer, R., Huey, L. G., Bannan, T. J., Percival, C. J., Lee, B. H., and Thornton, J. A.: Global tropospheric halogen (Cl, Br, I) chemistry and its impact on oxidants, Atmos. Chem. Phys., 21, 13973–13996, https://doi.org/10.5194/acp-21-13973-2021, 2021b.
WE-CAN: Western wildfire Experiment for Cloud chemistry, Aerosol absorption and Nitrogen, Earth Observing Laboratory, National Center for Atmospheric Research [data set], https://www-air.larc.nasa.gov/cgi-bin/ArcView/firexaq?MERGE=1, last access: 14 November 2025.
Westerling, A. L.: Increasing western US forest wildfire activity: sensitivity to changes in the timing of spring, Philosophical Transactions of the Royal Society B: Biological Sciences, 371, 20150178, https://doi.org/10.1098/rstb.2015.0178, 2016.
Wiedinmyer, C., Kimura, Y., McDonald-Buller, E. C., Emmons, L. K., Buchholz, R. R., Tang, W., Seto, K., Joseph, M. B., Barsanti, K. C., Carlton, A. G. and Yokelson, R.: The Fire Inventory from NCAR version 2.5: an updated global fire emissions model for climate and chemistry applications, Geoscientific Model Development, 16, 3873–3891, https://doi.org/10.5194/gmd-16-3873-2023, 2023.
Williams, A. P., Abatzoglou, J. T., Gershunov, A., Guzman-Morales, J., Bishop, D. A., Balch, J. K., and Lettenmaier, D. P.: Observed Impacts of Anthropogenic Climate Change on Wildfire in California, Earth's Future, 7, 892–910, https://doi.org/10.1029/2019EF001210, 2019.
Wolfe, G. M., Hanisco, T. F., Arkinson, H. L., Blake, D. R., Wisthaler, A., Mikoviny, T., Ryerson, T. B., Pollack, I., Peischl, J., Wennberg, P. O., Crounse, J. D., St. Clair, J. M., Teng, A., Huey, L. G., Liu, X., Fried, A., Weibring, P., Richter, D., Walega, J., Hall, S. R., Ullmann, K., Jimenez, J. L., Campuzano-Jost, P., Bui, T. P., Diskin, G., Podolske, J. R., Sachse, G., and Cohen, R. C.: Photochemical evolution of the 2013 California Rim Fire: synergistic impacts of reactive hydrocarbons and enhanced oxidants, Atmos. Chem. Phys., 22, 4253–4275, https://doi.org/10.5194/acp-22-4253-2022, 2022.
Xu, L., Crounse, J. D., Vasquez, K. T., Allen, H., Wennberg, P. O., Bourgeois, I., Brown, S. S., Campuzano-Jost, P., Coggon, M. M., Crawford, J. H., DiGangi, J. P., Diskin, G. S., Fried, A., Gargulinski, E. M., Gilman, J. B., Gkatzelis, G. I., Guo, H., Hair, J. W., Hall, S. R., Halliday, H. A., Hanisco, T. F., Hannun, R. A., Holmes, C. D., Huey, L. G., Jimenez, J. L., Lamplugh, A., Lee, Y. R., Liao, J., Lindaas, J., Neuman, J. A., Nowak, J. B., Peischl, J., Peterson, D. A., Piel, F., Richter, D., Rickly, P. S., Robinson, M. A., Rollins, A. W., Ryerson, T. B., Sekimoto, K., Selimovic, V., Shingler, T., Soja, A. J., St. Clair, J. M., Tanner, D. J., Ullmann, K., Veres, P. R., Walega, J., Warneke, C., Washenfelder, R. A., Weibring, P., Wisthaler, A., Wolfe, G. M., Womack, C. C., and Yokelson, R. J.: Ozone chemistry in western U.S. wildfire plumes, Science Advances, 7, eabl3648, https://doi.org/10.1126/sciadv.abl3648, 2021.
Yokelson, R. J., Andreae, M. O., and Akagi, S. K.: Pitfalls with the use of enhancement ratios or normalized excess mixing ratios measured in plumes to characterize pollution sources and aging, Atmos. Meas. Tech., 6, 2155–2158, https://doi.org/10.5194/amt-6-2155-2013, 2013.