the Creative Commons Attribution 4.0 License.
the Creative Commons Attribution 4.0 License.
 | 24 Nov 2025
A radar view of ice microphysics and turbulence in Arctic cloud systems
Mariko Oue
Pavlos Kollias
Edward Luke
Ice microphysical processes are inherently complex because of their sensitivity to temperature and humidity, the diversity of ice crystal habits, and their interaction with supercooled liquid water (SCL) and turbulence. Long-term surface-based radar observations have been systematically used to unravel the different processes that affect ice particle growth. In this study, we present a statistical analysis of 6.5 years of Ka-band radar observations in Arctic cloud systems, combined with thermodynamic profiles derived from radiosonde measurements. For the first time, ice particle growth and sublimation – diagnosed from vertical gradients of radar reflectivity and mean Doppler velocity – are systematically mapped across a broad range of temperature and moisture conditions. These vertical gradients correspond closely to saturation levels relative to ice and exhibit a strong temperature dependence in supersaturated regions. Notably, distinct signatures near −15 °C are indicative of dendritic growth. Turbulence, quantified via the eddy dissipation rate (EDR), is most frequently observed in regions containing SCL. The co-occurrence of SCL and elevated turbulence results in significantly enhanced ice particle growth compared to conditions in which either is present alone.
This work provides new observational constraints that are critical for improving the representation of ice microphysics in atmospheric models.
- Article
(3545 KB) - Full-text XML
- BibTeX
- EndNote


Ice clouds play a crucial role in Earth's radiation budget (e.g. Liou, 1986; Stephens et al., 1990; Lynch et al., 2002), and hydrological cycle since 70 % of global precipitation originate from the ice phase (e.g. Heymsfield et al., 2020; Khain et al., 2015; Mülmenstädt et al., 2015). Ice particles can take many forms depending on the environment and the impact of complex microphysical processes. Accurately representing these processes in numerical models remains challenging due to the limited understanding of how ice particles evolve under different thermodynamic and dynamic conditions (e.g. Khain et al., 2015; Grabowski et al., 2019).
Ice particles develop different habits under varying environmental conditions primarily through the deposition of water vapors (e.g. Korolev et al., 1999; Bailey and Hallett, 2009; Baker and Lawson, 2006; Kikuchi et al., 2013). Among these, dendritic crystals have attracted particular attention due to their maximum depositional growth rates (e.g. Takahashi, 2014; Korolev, 2007) and fragile structure, which make them prone to break-up (e.g. Schwarzenboeck et al., 2009; Hobbs and Rango, 1998; Takahashi et al., 1995; Griggs and Choularton, 1986; Vardiman, 1978). Secondary ice production (SIP), the formation of atmospheric ice requiring pre-existing ice particles, is also a key microphysical process in clouds (e.g. Kanji et al., 2017; Korolev and Leisner, 2020). More than six mechanisms have been identified through laboratory and field studies, but the Hallett-Mossop riming-splintering process remains the only one widely represented in models, typically occurring between −3 and −8 °C (Korolev and Leisner, 2020). Recent remote sensing observational evidence also suggests that secondary ice production frequently occurs at temperatures warmer than −10 °C (e.g. Kumjian et al., 2020; Luke et al., 2021; Oue et al., 2018; Korolev et al., 2020). Although significant progress has been made through laboratory experiments, aircraft observations, and radar case studies, to our knowledge, a systematic understanding of how environmental conditions shape ice microphysics in natural clouds, particularly from a long-term observational perspective, is limited.
In addition to atmospheric thermodynamic conditions, turbulence has also been recognized as a factor influencing ice nucleation and particle growth, yet observational studies investigating this interaction in natural cloud systems are extremely limited. Terrain-induced flow modifications result in turbulence and vertical updrafts, which significantly shape the ice microphysical processes (e.g. Garrett and Yuter, 2014; Houze and Medina, 2005; Ramelli et al., 2021). Recent statistical analysis from 15‐months of radar observations has revealed that the increased turbulence, quantified by the eddy dissipation rate (EDR), enhances aggregation and riming in Arctic low-level mixed-phase clouds (Chellini and Kneifel, 2024). However, this analysis does not account for the influence of humidity and temperature at each observation point, which may also play an important role.
The U.S. Department of Energy (DOE) Atmospheric Radiation Measurement (ARM) North Slope of Alaska (NSA) observatory (Verlinde et al., 2016) provides multi-year ground-based observations for ice clouds including Ka-band ARM Zenith-pointing Radar (KAZR) measurements, radiosondes, and ceilometer. KAZR provides much higher sensitivity to small cloud droplets and ice crystals, allowing clear detection of MDV deceleration when large precipitation particles coexist with smaller hydrometeors, compared to longer-wavelength radars (X, C, S bands) (Kollias et al., 2020). The objective of our study is to characterize ice microphysical processes (e.g. depositional growth and sublimation) and in-cloud turbulence, based on long-term KAZR observations under a wide range of environmental conditions derived from radiosondes and examine their relationships. The presented analysis aims to improve our understanding of ice microphysics in Arctic clouds and provide observational constraints for advancing the representation of ice microphysics in models.
2.1 Data
The observations in this study are collected from the DOE ARM NSA ( N, W) atmospheric observatory from January 2013 to May 2019, which is the same dataset as used by Luke et al. (2021). This dataset provides a continuous and sufficiently long record for deriving robust statistics. Radar reflectivity and mean Doppler velocity (MDV) from the Ka-band ARM Zenith Radar (KAZR, Bharadwaj et al., 2025) are used, while temperature and moisture data from the radiosonde measurements (Keeler et al., 2025) are utilized to characterize the environmental conditions. Ceilometer-derived cloud-base heights (Zhang et al., 2025) are employed to assess the performance of the method described in Sect. 2.2. The vertical and time resolutions of the KAZR data are 30 m and 3.7 s, respectively. Detailed descriptions of the KAZR radar and radiosonde instruments used at the NSA site are extensively covered in previous studies (Kollias et al., 2020; Luke et al., 2021).
To ensure adequate representativeness of the environmental conditions surrounding the radar profile at a given time, we only analyze KAZR radar observations occurring within ±15 min time and 4 km horizontal distance of a corresponding radiosonde measurement as the balloon ascends as shown in an example case in Fig. 1, following the approach used in Luke et al. (2021). To ensure the focus remains on cold phase microphysical processes, we exclude the profiles containing warm clouds, with temperatures above 0 °C according to the radiosonde profile. This selection remains a large dataset, with over 39 million valid radar observation points.
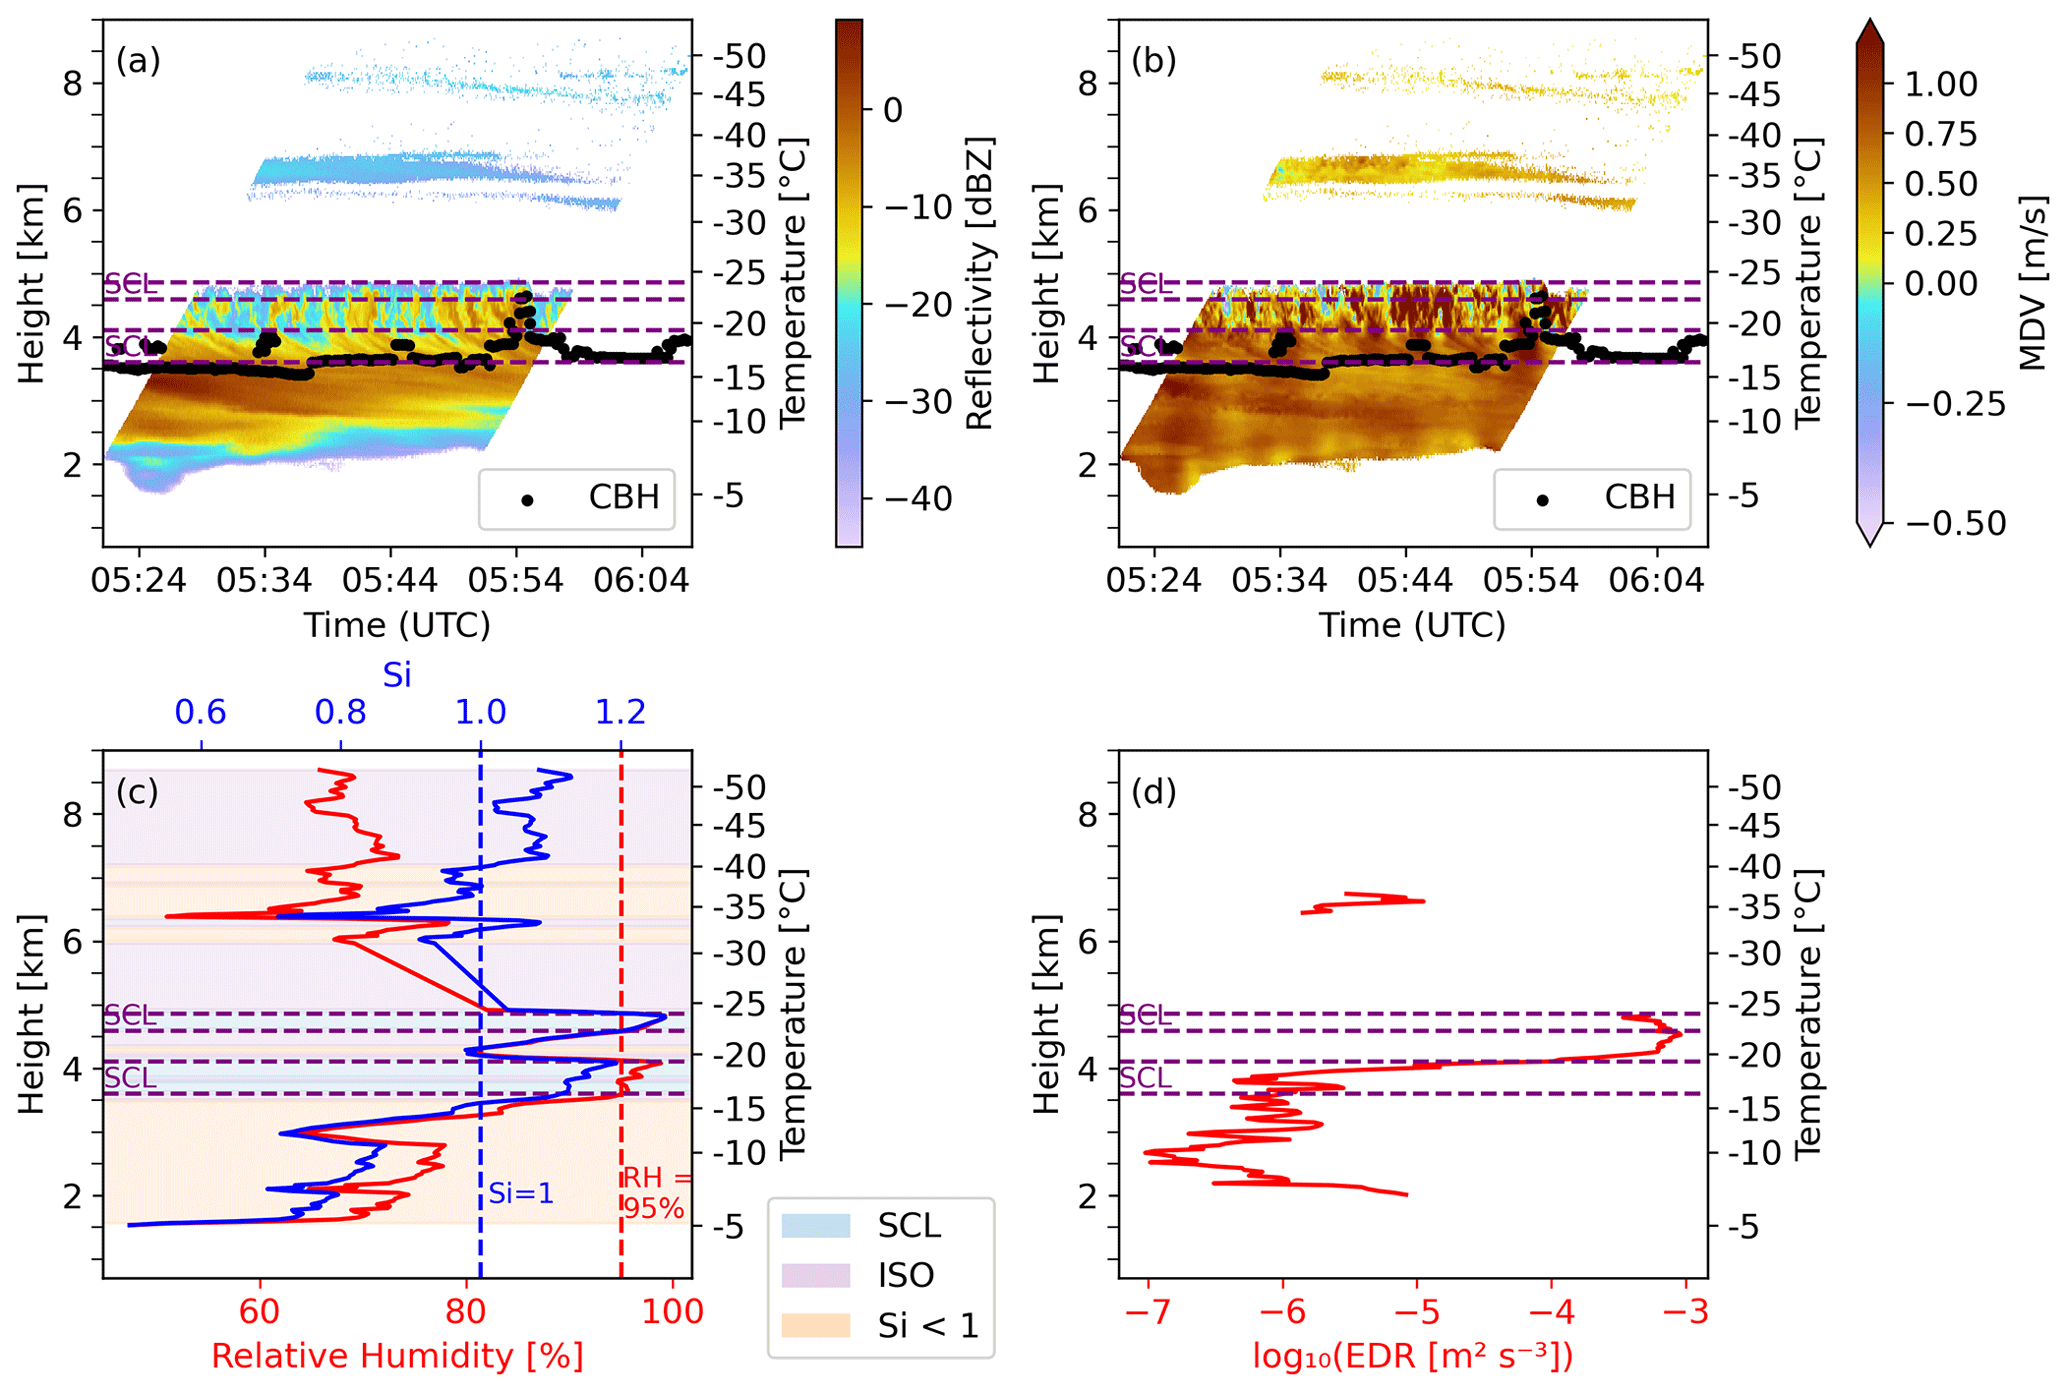
Figure 1A case on 18 February 2015 (UTC) at the NSA site. (a) Radar reflectivity (dBZ) and (b) mean Doppler velocity (MDV) from KAZR within ±15 min and 4 km of the radiosonde launch, plotted as time–height sections in UTC. (c) Radiosonde profiles of relative humidity and water vapor saturation ratio with respect to ice (Si). (d) In-cloud energy dissipation rate (EDR) from radiosonde and radar. In (a)–(b), dashed purple lines mark the top and bottom boundaries of radiosonde-identified supercooled liquid water (SCL) layers; for clarity, two closely spaced SCL layers separated by a thin non-SCL interval are shown as one continuous layer. Black points denote ceilometer cloud base height (Zhang et al., 2025). In (c), the vertical dashed red line marks RH = 95 % (SCL threshold), and the vertical dashed blue line marks Si = 1. Colored shadings in (c) indicate moisture regimes: blue for the SCL condition (RH > 95 %, Si > 1.0), purple for the ISO condition (RH < 95 %, Si > 1.0), and orange for the ice-subsaturated condition (Si < 1.0).
2.2 Moisture conditions
The saturation ratio with respect to ice (Si) is calculated from temperature, relative humidity (RH), and pressure obtained from the radiosonde measurements. This is a good indicator to identify layers where ice hydrometers grow by water vapor deposition (Si > 1.0) or sublimate (Si < 1.0). In the example case on 18 February 2015, shown in Fig. 1, the layers with Si > 1.0 show good agreement with the cloud signals shown by radar reflectivity, except for altitudes below 3 km. The high reflectivity with Si < 1.0 below 3 km suggests that sublimation is dominant there.
Previous research indicates that radiosonde-observed high relative humidity is consistent with the presence of supercooled liquid droplets (SCL) at subfreezing temperatures. For example, Silber et al. (2021) used a threshold of RH above 95 % to identify the SCL layer across a wide temperature range, while Luke et al. (2021) used a higher threshold of about 98 % around −5 °C. In this study, we use the relative humidity threshold of 95 % to indicate the potential existence of SCL, as it provides a broadly applicable criterion across the temperature range. We define three moisture regimes: SCL conditions (RH > 95 %, Si > 1.0), which favors the existence of SCL, considering sufficient cloud condensation nuclei are available; ISO (ice supersaturated only) conditions (RH < 95 %, Si > 1.0), where deposition is possible but the occurrence of liquid water is highly unlikely; and ice-subsaturated conditions (Si < 1.0), where neither liquid water nor depositional growth is expected.
As shown in Fig. 1, the cloud base heights observed by the ceilometer, which is the lowest altitude of liquid, exhibit good agreement with the base of the first SCL layer above the surface, identified by the radiosonde observations (i.e., RH exceeding 95 %). This agreement supports our identification of SCL, with the ceilometer serving as an independent validation on the vertical placement of SCL inferred from radiosonde measurements. The second SCL layer recognized by RH > 95 % is located near the top of the radar-detected cloud layer. SCL-topped clouds with ice precipitation below is a typical structure of mixed-phase clouds in Arctic (Morrison et al., 2012).
2.3 EDR calculation
The eddy dissipation rate (EDR), used to characterize turbulence intensity, is calculated from mean Doppler velocity observations from KAZR and horizontal wind data from radiosondes following the velocity time-series variance method described in Borque et al. (2016), which provides robust estimates in cases where the spread of the particle size distribution significantly affects spectrum width.
As implemented here, A 30 min window centered on the radiosonde profile is used to extract mean Doppler velocity time series at each altitude. If fewer than 300 mean Doppler velocity measurements are available to consist a time series within this window, EDR is not computed for that altitude, as shown in Fig. 1d. As detailed in Borque et al. (2016), these time series are Fourier-transformed to obtain the velocity spectrum. EDR is then estimated by integrating the spectrum over multiple subranges within the inertial subrange using scaling relations derived from Kolmogorov's theory based on the following equation:
where flow and fhigh represent the lower and upper bounds of the inertial subrange, Vh is the horizontal wind speed, α is the Kolmogorov constant, and S(f) is the turbulent energy spectrum as a function of frequency. To identify valid inertial subranges, several predefined frequency intervals are tested, and a power-law fit is performed for each. Intervals with spectral slopes within ± are retained as the intervals in inertial subrange, and the final EDR is computed as the average over these accepted estimates. The uncertainty measured by the standard deviation of the accepted EDR estimates is approximately 30 %, which in log 10(EDR) corresponds to only approximately 0.1 dex.
2.4 Radar variables and their vertical gradient
Under the assumption of Rayleigh scattering, reflectivity is proportional to number concentration and the sixth power of diameter (D6), thereby reflecting particle size and number. In addition, the highly complex shapes of ice particles and the potential existence of Mie scattering make the simulation of scattering for ice particles difficult (Tyynelä et al., 2023). The MDV (downward motion is positive) can be used to infer both particle fall speed and vertical air motion. Assuming that vertical air motion is negligible relative to particle fall speed in large statistical samples for Arctic clouds, we interpret the median MDV values as representative of hydrometeor fall speeds, similar to the assumption used in Kalesse et al. (2013). To account for the effect of air density on fall speed, a density correction was applied to the MDV prior to statistical analysis.
Vertical gradients of reflectivity (in dB scale) and MDV are calculated in the downward direction (i.e., toward the surface) using a five-point central difference method, providing more stable estimates while preserving meaningful small-scale variations. To avoid uncertainties at the cloud boundaries, the gradients are evaluated from the third range gate below the cloud top down to the third range gate above the cloud base. This approach yields positive gradients when the variable increases toward the surface and helps capture particle changes during falling. For simplicity, we refer to these variables as the dBZ gradient and MDV gradient, though more detailed descriptions (e.g. vertical gradient of reflectivity) may also be used in context. The effectivity of vertical gradient variables in representing ice growth or sublimation processes will be discussed in Sect. 3.1.
3.1 Statistical cloud properties from radar observations across various moisture and temperature conditions
The median values of the large number of radar observations of cold clouds are mapped under various temperature and relative moisture conditions as shown in Fig. 2, with a temperature resolution of 1 °C and relative humidity resolution of 0.5 %. The median for each grid obtained from less than 1000 samples is dropped, and most medians remained are calculated from more than 105 samples, which ensures the reliability of our analysis.
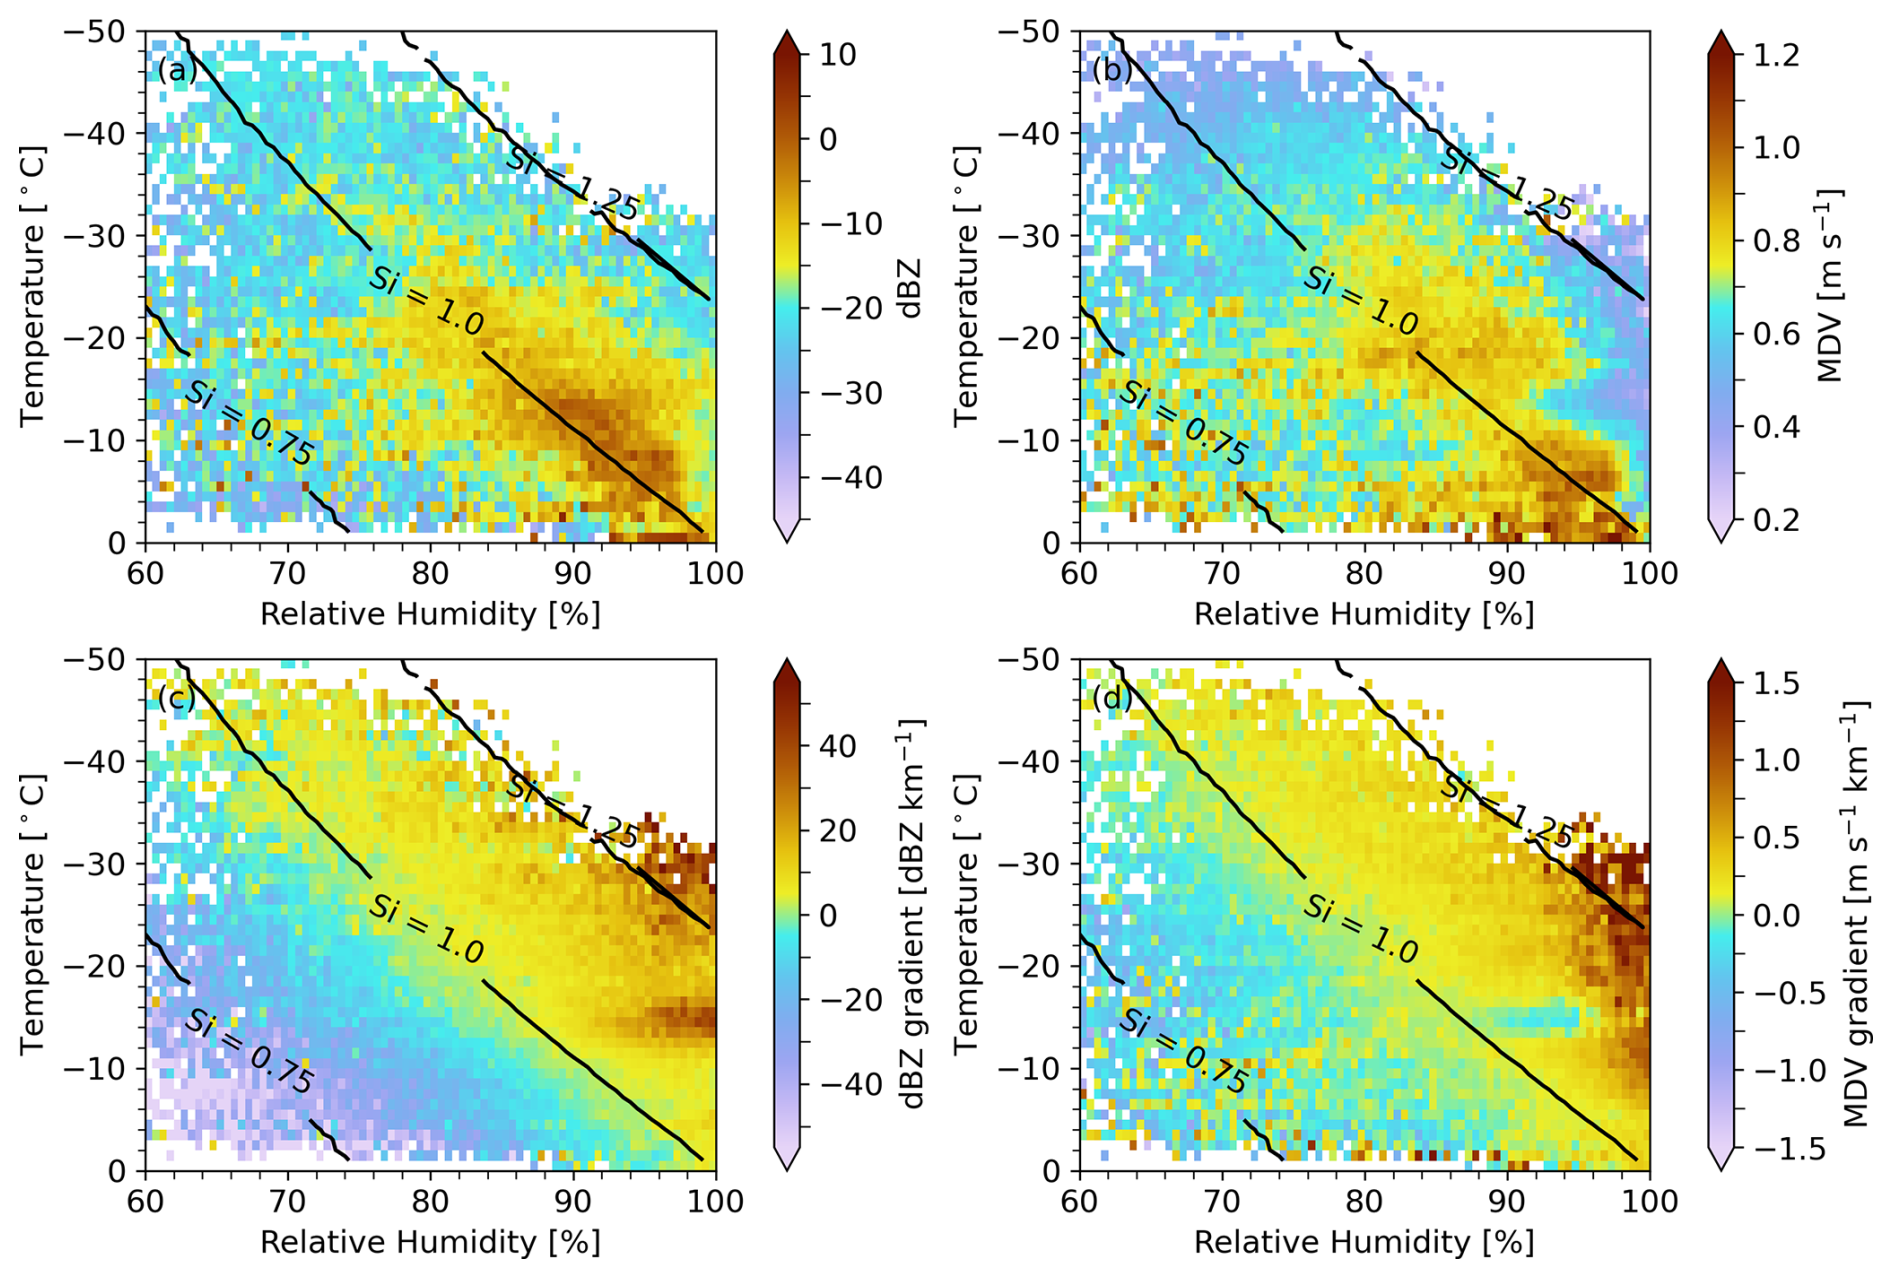
Figure 2Median values of key variables as a function of relative humidity (%) and temperature (°C), including (a) radar reflectivity, (b) mean Doppler velocity, (c) the vertical gradient of dBZ, and (d) the gradient of MDV. The black contour lines indicate different saturation levels with respect to ice (Si = 1.25, 1.0, and 0.75).
This analysis attempts to gain insights into the processes that govern ice particle growth and sublimation under different temperature and moisture conditions. Results show that the region near the ice saturation threshold (Si = 1.0) is associated with relatively larger reflectivity values (0–10 dBZ, Fig. 2a) and larger MDV values (generally > 0.7 m s−1, Fig. 2b) compared to both of ice supersaturated region (Si > 1.0) and sublimation region (Si < 1.0) at temperatures above −30 °C. Notably, the regions where the dBZ gradients (Fig. 2c) or MDV gradients (Fig. 2d) approach zero closely coincide with Si ≈ 1.0. This alignment supports the expected physical interpretation: when Si < 1.0, sublimation dominates (negative dBZ gradient and MDV gradient), and when Si > 1.0, ice particle growth is favored (positive dBZ gradient and MDV gradient). These findings suggest that the vertical gradients of dBZ and MDV can serve as process indicators for ice growth and sublimation. This framework also explains why ice particles tend to reach their maximum size and/or density near Si = 1.0, under specific temperature conditions. Ice particles in the balanced region between growth and sublimation may have experienced growth in super-saturated regions; and, in environments favorable for ice growth (Si > 1.0), particles are often still in the process of growing when observed, thus not arriving at their maximum size and density.
At lower temperatures (below −30 °C), even when particles are in equilibrium (Si ≈ 1.0), both reflectivity (typically below −5 dBZ, Fig. 2a) and MDV (generally lower than 0.5 m s−1, Fig. 2b) remain relatively lower than those at warmer temperatures. Reduced heterogeneous nucleation in this cold temperature range may lower the number concentration and potentially allow existing individual particles to grow larger. However, we observe reductions in particle size and fall speed indicated by reflectivity and MDV, which suggests that the reduction in available SCL plays a more significant role in preventing particles from reaching larger sizes and higher densities, due to the absence of growth processes involving supercooled water (such as riming). However, it should be also noted that the Si estimation in this cold temperature has a large uncertainty.
In ice supersaturated regions (Si > 1.0), the vertical gradient shows a dependence on temperature (Fig. 2c–d). The dBZ gradient is relatively larger at around −5, −15, and −25 °C compared to other temperatures, while MDV gradient is relatively lower at temperatures above −5 °C and around −15 °C compared other temperatures. Interestingly, these observed features align with the maximum mass growth rate of ice particles and their apparent density minima near −5 and −15 °C reported in vertical supercooled cloud tunnel studies (Takahashi et al., 1991; Takahashi and Fukuta, 1988). Except for the size or density growth rate, the particle shape transition may also be a significant source of change of scattering scattering properties as revealed by simulations (Tyynelä et al., 2023, and references therein). An increase in the reflectivity (dBZ) gradient and a decrease in the MDV gradient are observed around −15 °C (Fig. 2c–d), which corresponds to significant minima in MDV (Fig. 2b). These phenomena have been frequently reported in previous observations (e.g. Schrom and Kumjian, 2016; von Terzi et al., 2022).
When examining the frequency distributions for each grid point in Fig. 2, multimodal patterns are observed in reflectivity and MDV. Figure 3 shows the normalized frequency distributions of reflectivity and MDV at different temperatures in the SCL (RH > 95 %, Si > 1.0) and ISO (RH < 95 %, Si > 1.0) conditions. Results show that the medians of reflectivity and MDV in SCL conditions are smaller than the medians in ISO conditions. It is consistent with suggestions from Fig. 2 that ice particles in the ISO conditions may have experienced the growth in SCL conditions for balanced regions (Si ≈ 1.0), and thus their reflectivity and MDV are larger than those in SCL region. In addition, the smaller MDV in the SCL condition can also be partly due to the presence of SCL droplets coexisting with primary ice particles, in which situation MDV could be smaller than the situation where ice particles exist only.
The reflectivity in the SCL condition is multi-modal as shown in Fig. 3a for temperatures warmer than −15 °C, possibly because the reflectivity is also affected by differences in their growth processes determined by different particle trajectories. The population with weaker reflectivity suggests the dominance of small pristine ice crystals. The other population with larger reflectivity suggests the dominance of larger particles such as large pristine ice crystals, aggregates, and rimed particles. This is consistent with previous studies that showed active aggregation in the dendritic growth zone (Bechini et al., 2013; Andrić et al., 2013), and active riming at around −10 °C (Takahashi et al., 1991). In addition, we also suggest that at around −15 °C, the size of ice particles may have dependence on its duration time in its favorable conditions because of its slow fall speed indicated by low MDV.
Notable multimodality in MDV under the SCL condition is shown at temperatures warmer than −5 °C in Fig. 3b, where there are two populations with MDV at around 1.2 and 0.0 m s−1. The slower MDV population indicates supercooled liquid droplets, corresponding to the reflectivity peak at about −25 dBZ in Fig. 3a. The MDV reaches its local maximum value at about −6 °C, while it attains its local minimum value near −15 °C for both SCL and ISO conditions. The decrease in MDV for the SCL condition is more pronounced than that for the ISO condition.
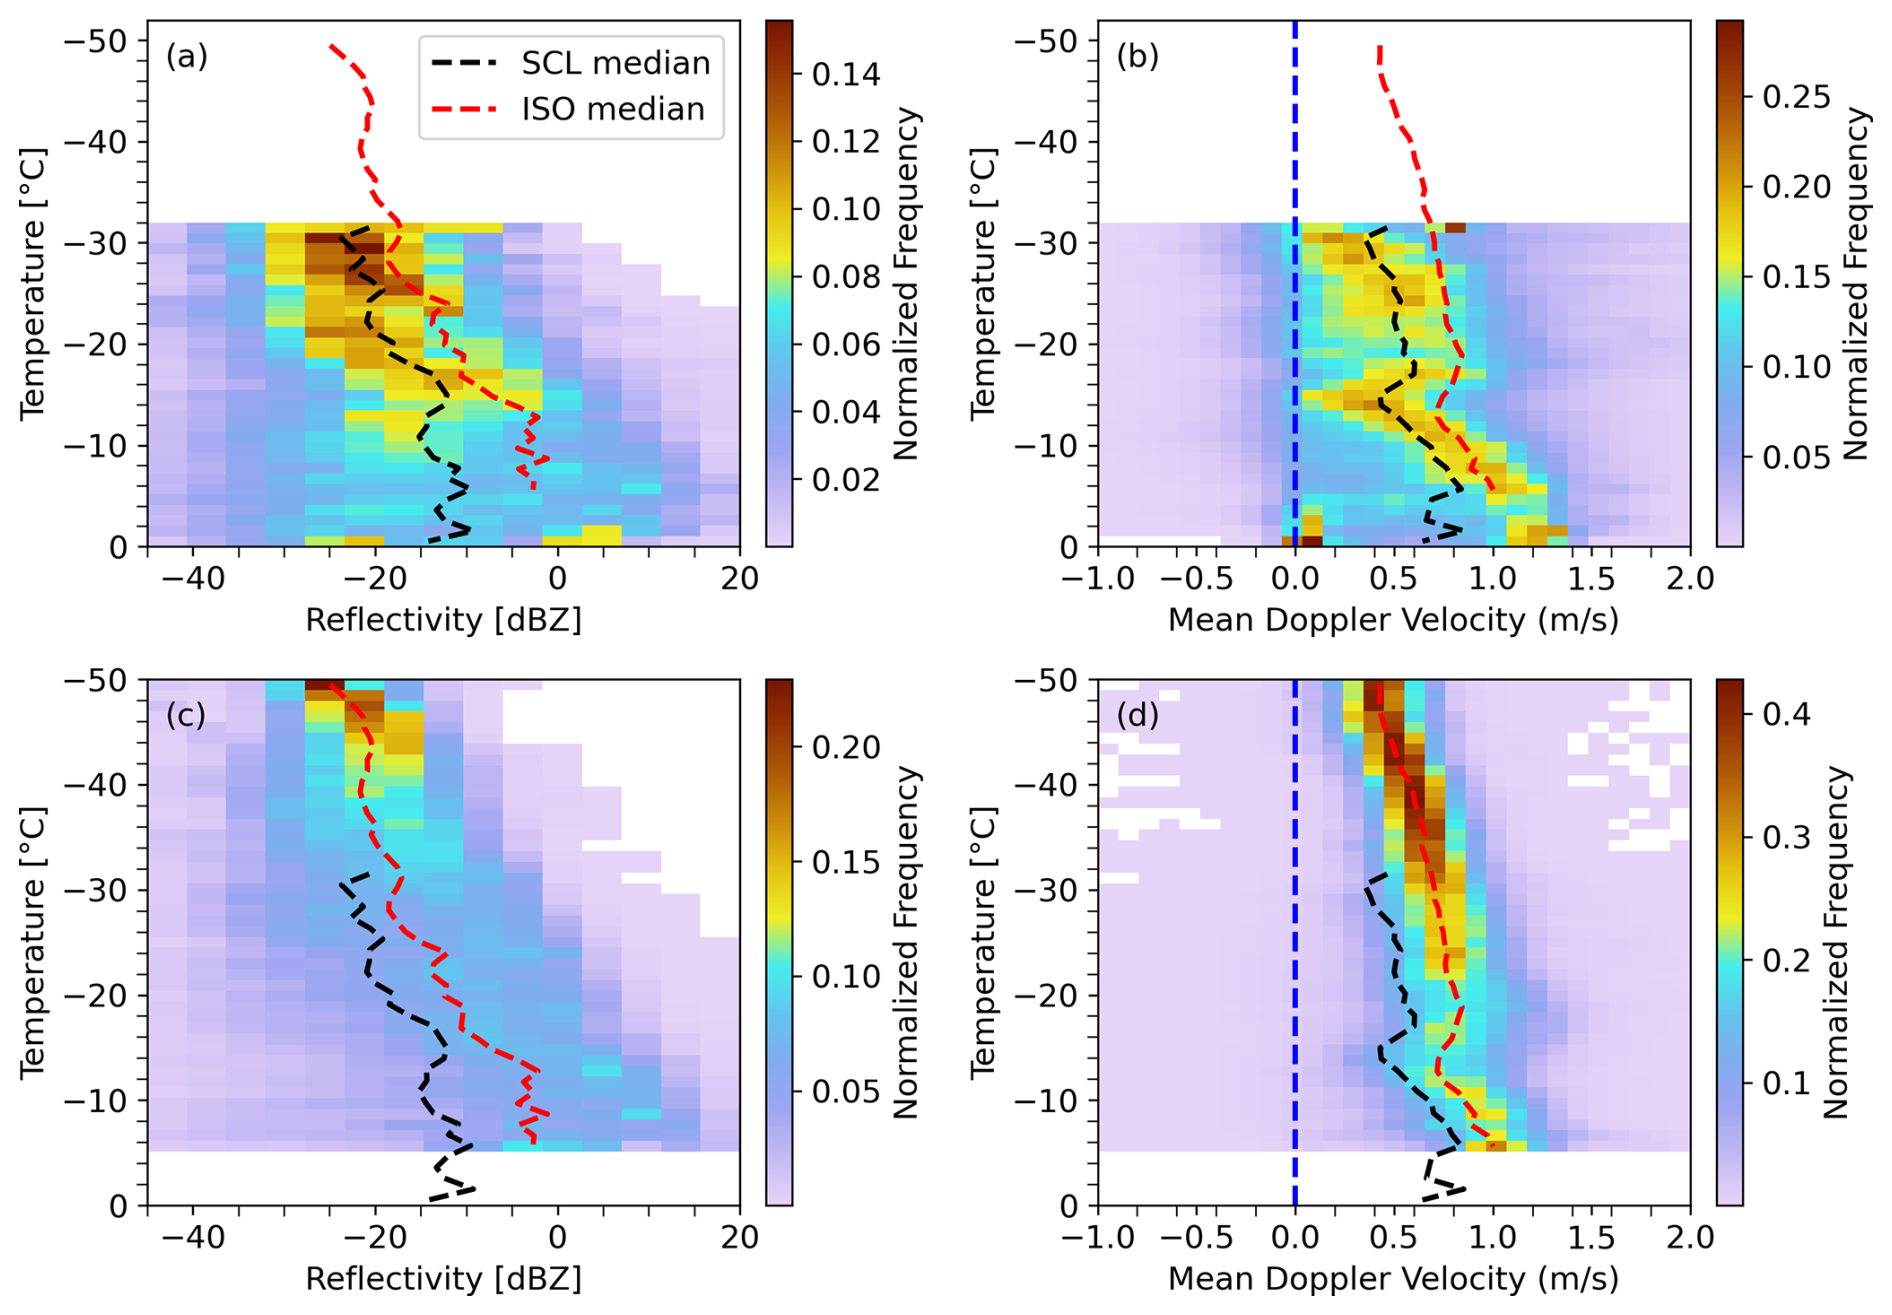
Figure 3Normalized frequency distribution of reflectivity (dBZ, panels a–b) and mean Doppler velocity (MDV, m s−1, panels c–d) as a function of temperature (°C) under different moisture conditions. Panels (a) and (b) correspond to SCL conditions, while panels (c) and (d) correspond to ISO conditions. The dashed black and red lines represent the median profiles for SCL conditions and ISO condition, respectively. The blue dashed line indicates the reference line for MDV = 0 m s−1. The color shading indicates the normalized frequency of observations within each temperature-MDV or temperature-reflectivity bin.
3.2 Microphysics in dendritic growth regions
To further explore the particle size dependence in the observed patterns in the dendritic growth regions, Fig. 4 examines the dBZ gradient and MDV gradient as a function of dBZ and temperature for SCL conditions and ISO conditions. In SCL conditions, Fig. 4a clearly shows the significant increase in dBZ gradient at around −15 °C at reflectivity from −40 to 10 dBZ. The relative small and even negative MDV gradient is significant at smaller reflectivity < −28 dBZ. For ISO conditions, the small MDV gradients coexist with large positive dBZ gradients (>30 dBZ km−1, Fig. 4c) when reflectivity < −5 dBZ. The small MDV gradient (<0.2 m s−1 km−1) at around −15 °C extends to reflectivity of 20 dBZ, while the large dBZ gradients (>20 dBZ km−1) are limited to small reflectivity dBZ. The larger gradients of reflectivity and MDV observed for SCL conditions compared to ISO conditions may result from heavy riming. For both SCL and ISO conditions, small or negative MDV gradients coexist with large dBZ gradients at relatively low reflectivity around −15 °C, suggesting that there are additional slow-falling ice particles at one height than the height above. This is because at low reflectivity (inferring small preexisting particles), an increase in the number of slow-falling particles contributes substantially to reflectivity and also reduces the MDV, leading to increased dBZ and decreased MDV gradients. In contrast, when preexisting particles are already large (high reflectivity), size effects from preexisting particles dominate over number concentration, so additional small particles produce only a limited increase in reflectivity and exert little influence on MDV (reflectivity-weighted mean), resulting in smaller gradient change than for the low-reflectivity situations.
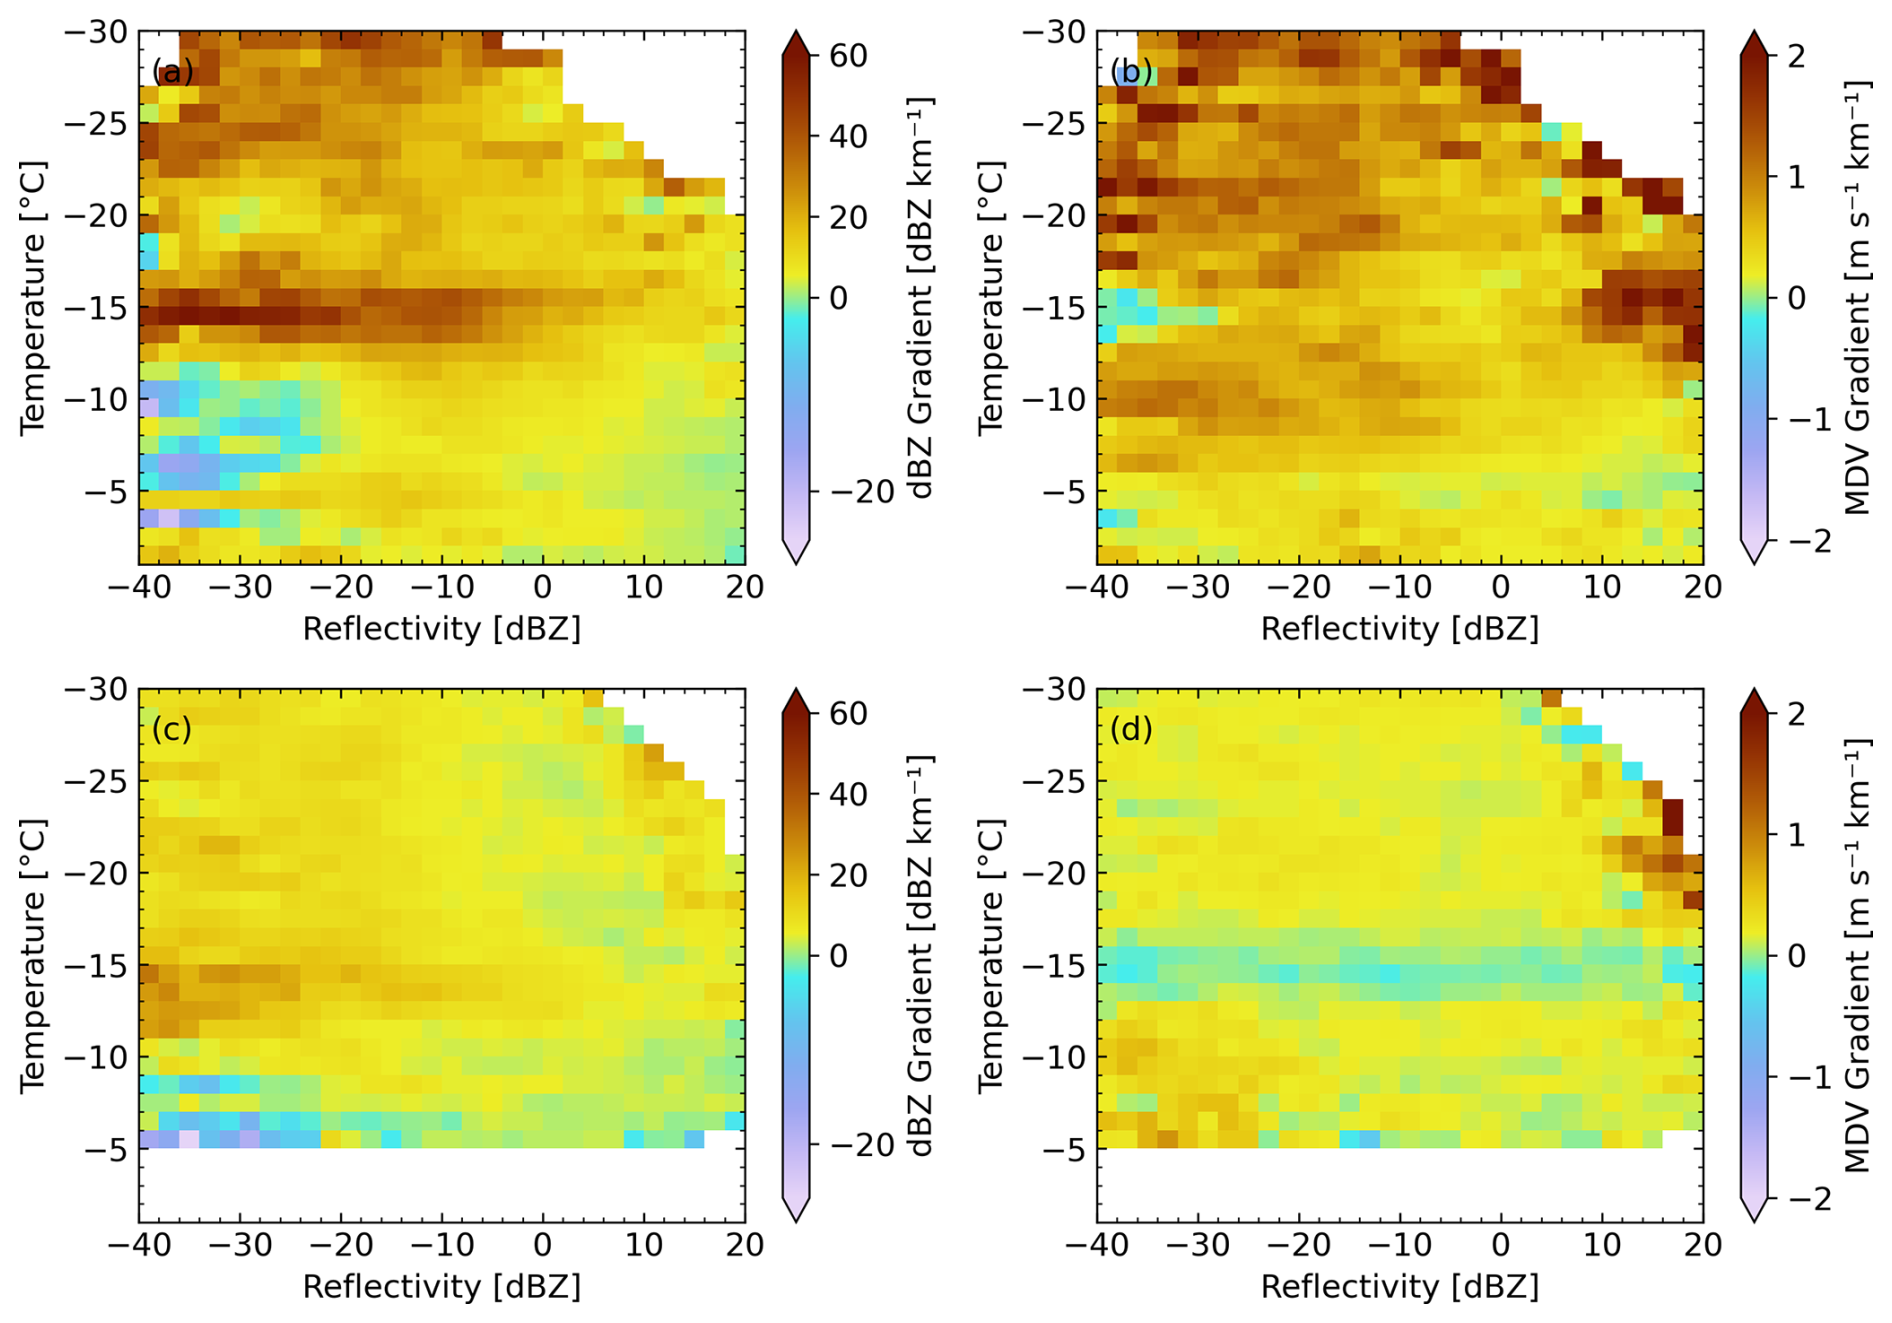
Figure 4Median values of dBZ gradient and MDV gradient as a function of temperature (°C) and reflectivity (dBZ) under different conditions: (a) SCL conditions: dBZ gradient (dBZ km−1). (b) SCL conditions: MDV gradient (m s−1 km−1). (c) ISO conditions: dBZ gradient (dBZ km−1). (d) ISO conditions: MDV gradient (m s−1 km−1).
According to Fukuta and Takahashi (1999), the increase in size growth and the reductions in fall speed growth may result from the specific shapes of lower particle density and greater air resistance. This can explain why negative MDV gradient and positive dBZ gradient patterns are observed together in the dendritic growth layer. Newly formed small ice particles with lower fall speeds in the Doppler spectrum (Schrom and Kumjian, 2016) can decrease the average of MDV, reduce the MDV gradient, and create a positive dBZ gradient as the ice number concentration increases. Secondary ice production can be a possible explanation for the creation the new slowly-falling ice particles. The particles with low fall speed, typically dendrites, appear mainly in this temperature region (Takahashi, 2014; Takahashi et al., 1991) can also be the newly occurring particle compared the above altitude. When the faster-falling particles catch up with the dendrites, the population of the ice particles at that temperature is likely to increase because of the coexistence two types of ice particles, thus increasing the net reflectivity of the radar observations. This was also observed by polarimetric radars as an increase in specific differential phase (Schrom and Kumjian, 2016; Oue et al., 2018). Additionally, the latent heat released during rapid growth in the dendrite growth zone may generate local updrafts that reduce the MDV near that temperature as suggested by Schrom and Kumjian (2016). However, the spectrum analysis by von Terzi et al. (2022) has shown that while this mechanism exists, it is not a primary contributor to the observed phenomenon.
Both SCL and ISO conditions exhibit a negative reflectivity gradient accompanied by a positive MDV gradient at −5 °C when reflectivity is below −20 dBZ. It suggests that there are fewer slow-falling particles (either cloud droplets or small ice particles) in the current radar range gate than in the gate above, which can occur near the base of tenuous supercooled liquid layers. Under SCL conditions, the MDV gradient is strongly positive for regions of high reflectivity at temperatures between −10 and −20 °C. This feature may be explained by the presence of relatively large and fast-falling snow particles indicated by large reflectivity, which enhances riming and aggregation. In addition, its coincidence with the temperature range of −10 to −20 °C further supports the aggregation, as dendrite in this regime are known to aggregate more efficiently (Lamb and Verlinde, 2011). Under ISO conditions, strongly positive MDV gradients are observed at high reflectivity within the temperature range of −16 to −25 °C. According to Fukuta and Takahashi (1999), the fall speed of ice particles arrives a local minimum at around −22 °C and a local maximum at around −20 °C when the growth time is sufficiently long, which may contribute to the observed behavior. A less pronounced pattern of MDV gradient minima and reflectivity maxima is observed around −22 °C for SCL conditions for small particles (around −40 dBZ) in Fig. 4c–d. This also suggests that ice particle type transition is happening around that temperature.
3.3 The relationship between turbulence, SCL, and ice microphysics
Figure 5a illustrates the distribution of the turbulence, represented by the EDR, under varying temperature and moisture conditions. A threshold of 10−5 m2 s−3, corresponding to the local minimum between two peaks in the EDR distribution (Fig. 5b), was used to separate turbulence regimes in the local context. Hereafter, we refer turbulent condition as EDR > 10−5 m2 s−3 (high EDR), and non-turbulent condition as EDR ≤ 10−5 m2 s−3 (low EDR). As shown in Fig. 5a, most of the medians of the EDR in SCL conditions are of values greater than 10−5 m2 s−3, and larger than those in ISO and Si < 1.0 conditions. The PDFs of EDR also show that EDR values in SCL conditions are relatively larger, suggesting stronger turbulence therein (Fig. 5b). The strong correlation between high EDR and the SCL condition may be related to multiple processes. On the one hand, liquid droplet formation and growth in the mixed-phase clouds can enhance turbulence via the latent heat release. In addition, stronger radiative cooling above the liquid cloud top can also enhance turbulence therein (e.g. Lonardi et al., 2024). On the other hand, turbulence may play an active role in maintaining humidity conditions favorable for the SCL formation (Morrison et al., 2012; Korolev and Field, 2008), potentially creating a positive feedback.
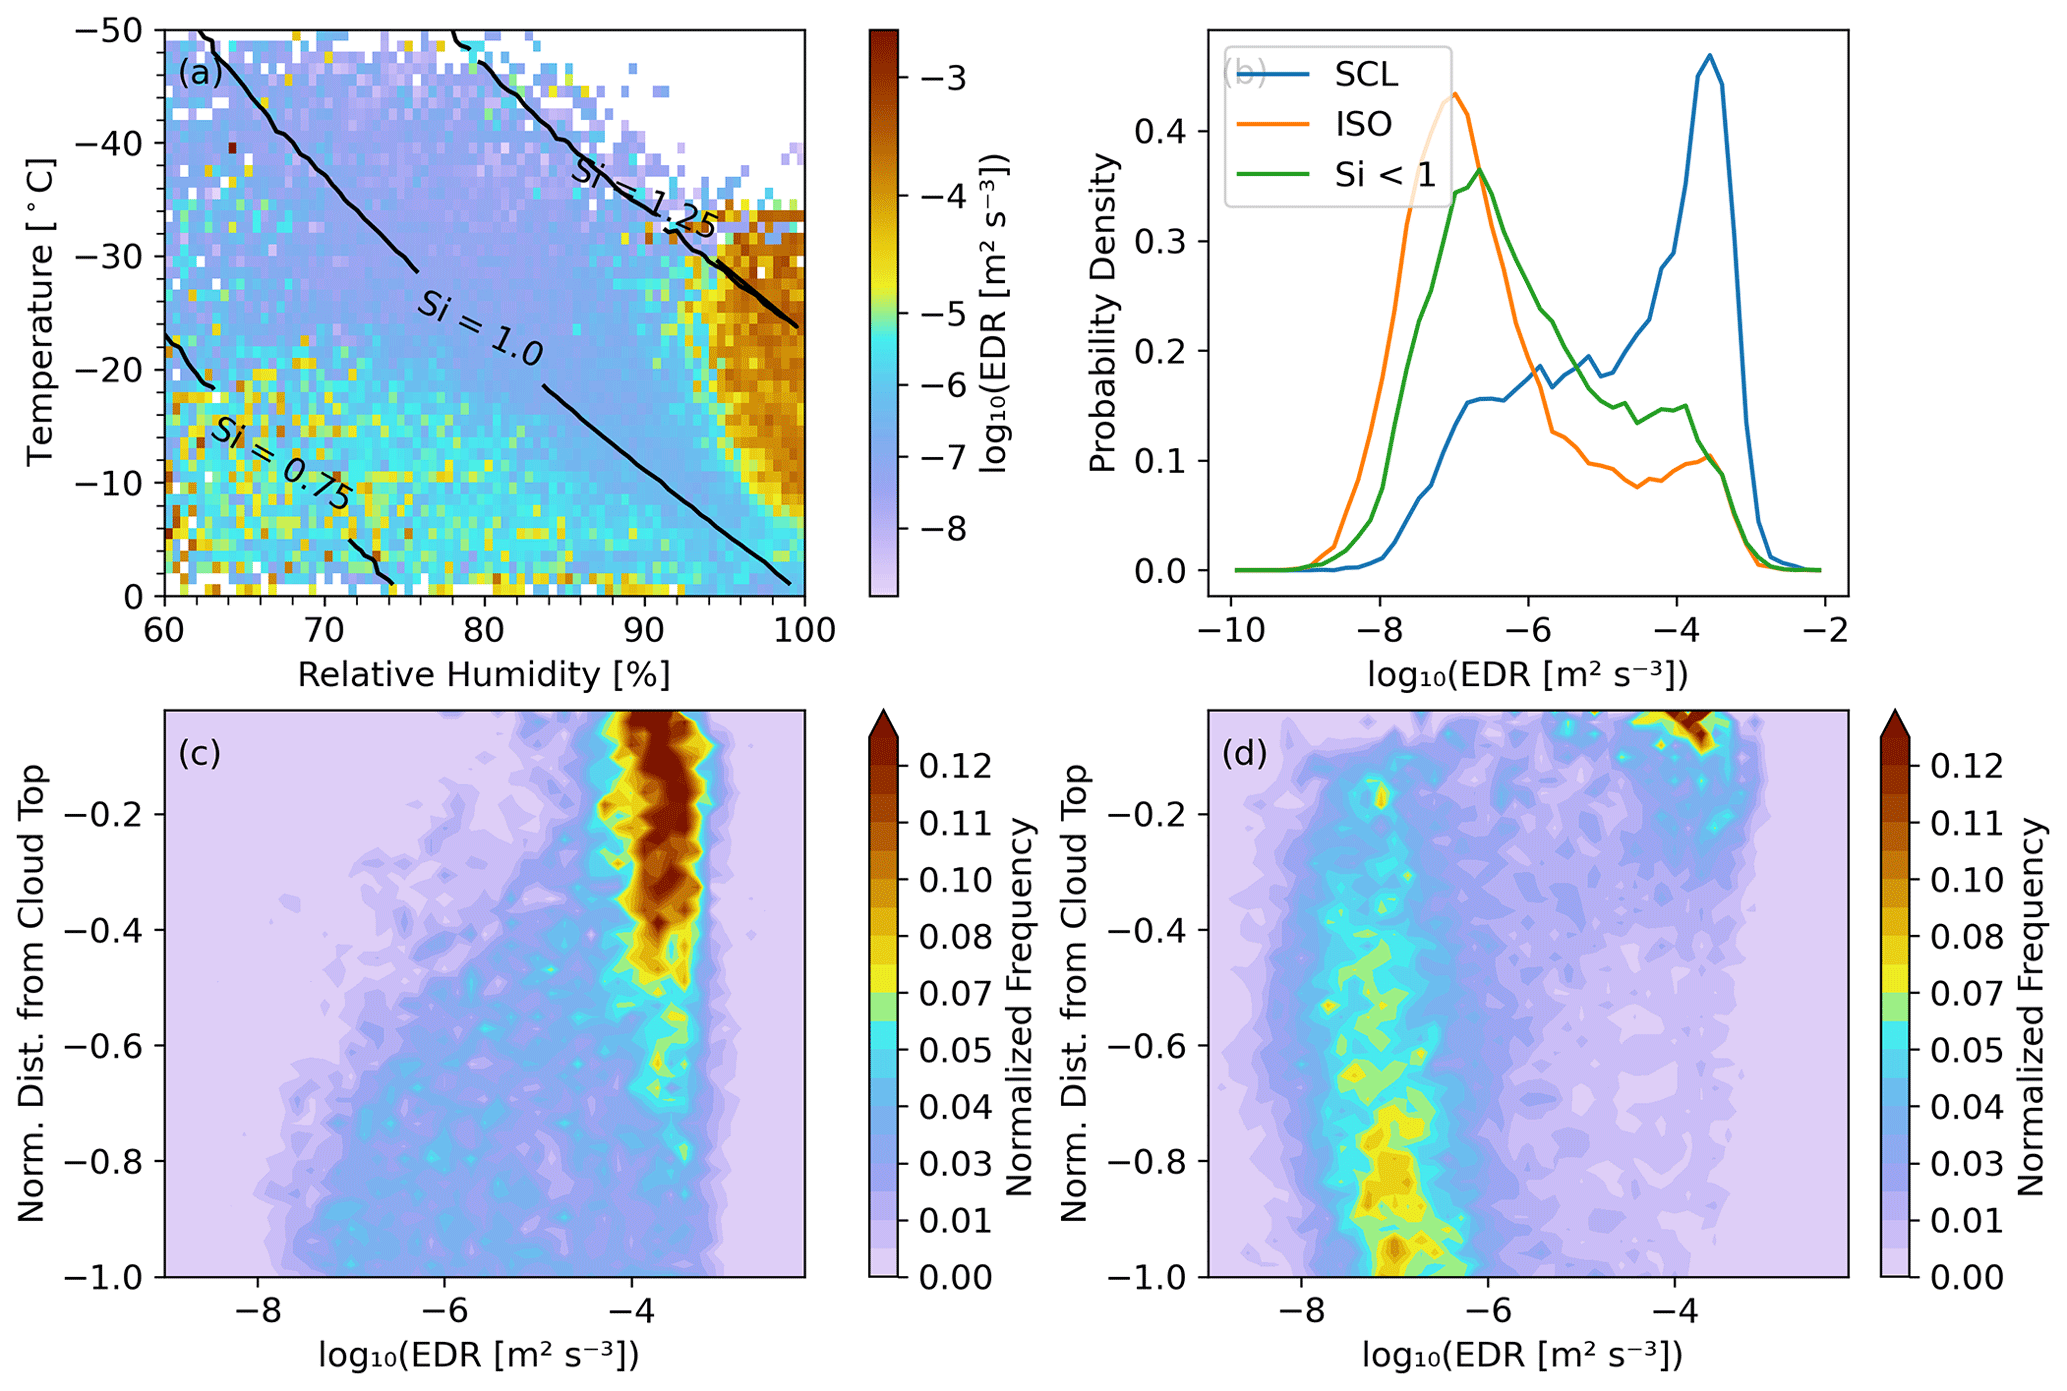
Figure 5(a) Median values of EDR as a function of relative humidity (%) and temperature (°C), the black contour lines indicate different saturation levels with respect to ice (Si = 1.25, 1.0, and 0.75); (b) PDF of EDR under SCL conditions (blue line), ISO conditions (orange line), and Si < 1.0 conditions (green line). Vertical distribution of in-cloud EDR under (c) SCL conditions and (d) ISO conditions.
We further analyze the normalized frequency of the EDR as a function of normalized distance from cloud top under SCL and ISO conditions, as shown in Fig. 5c and d, respectively. For each layer, the normalized distance to cloud top is calculated as the vertical distance from the point to the cloud top, divided by the total cloud depth, representing the relative vertical location within the layer. High EDR is more likely to appear in the upper part of the cloud under both conditions, which is consistent with the expected effect of cloud-top cooling. When the SCL appears near the base of the cloud, although the median EDR for this situation (Fig. 5c) is still significantly larger than the median EDR of snow without SCL (Fig. 5d) at the cloud base, these SCLs at cloud base are not more likely to be associated with high EDR. The distribution of EDR with SCL near the cloud base suggests that the SCL located below ice or beneath higher SCLs tends to be decoupled from strong turbulence. This suggests that radiative cooling near the cloud top is a stronger factor in generating and maintaining turbulence than latent heat release from SCL formation.
However, for every normalized distance-to-cloud-top height bin, the distribution of EDR under SCL conditions (Fig. 5c) shifts toward higher values compared to that under ISO conditions (Fig. 5d). Although high EDR is more likely to occur in the upper part of the cloud under both conditions, there is a noticeable difference in the vertical extent of the high-frequency, high-EDR region. For ISO conditions, low EDR accounts for more than half of the data from a normalized distance of −0.3 down to the cloud base. For SCL conditions, high EDR is more prevalent throughout the entire upper region of the cloud. This suggests that SCL is correlated with turbulence throughout the cloud.
Table 1Median and skewness of dBZ and MDV gradients under six thermodynamic-turbulence conditions. Units: dBZ gradient in dBZ km−1, MDV gradient in m s−1 km−1.
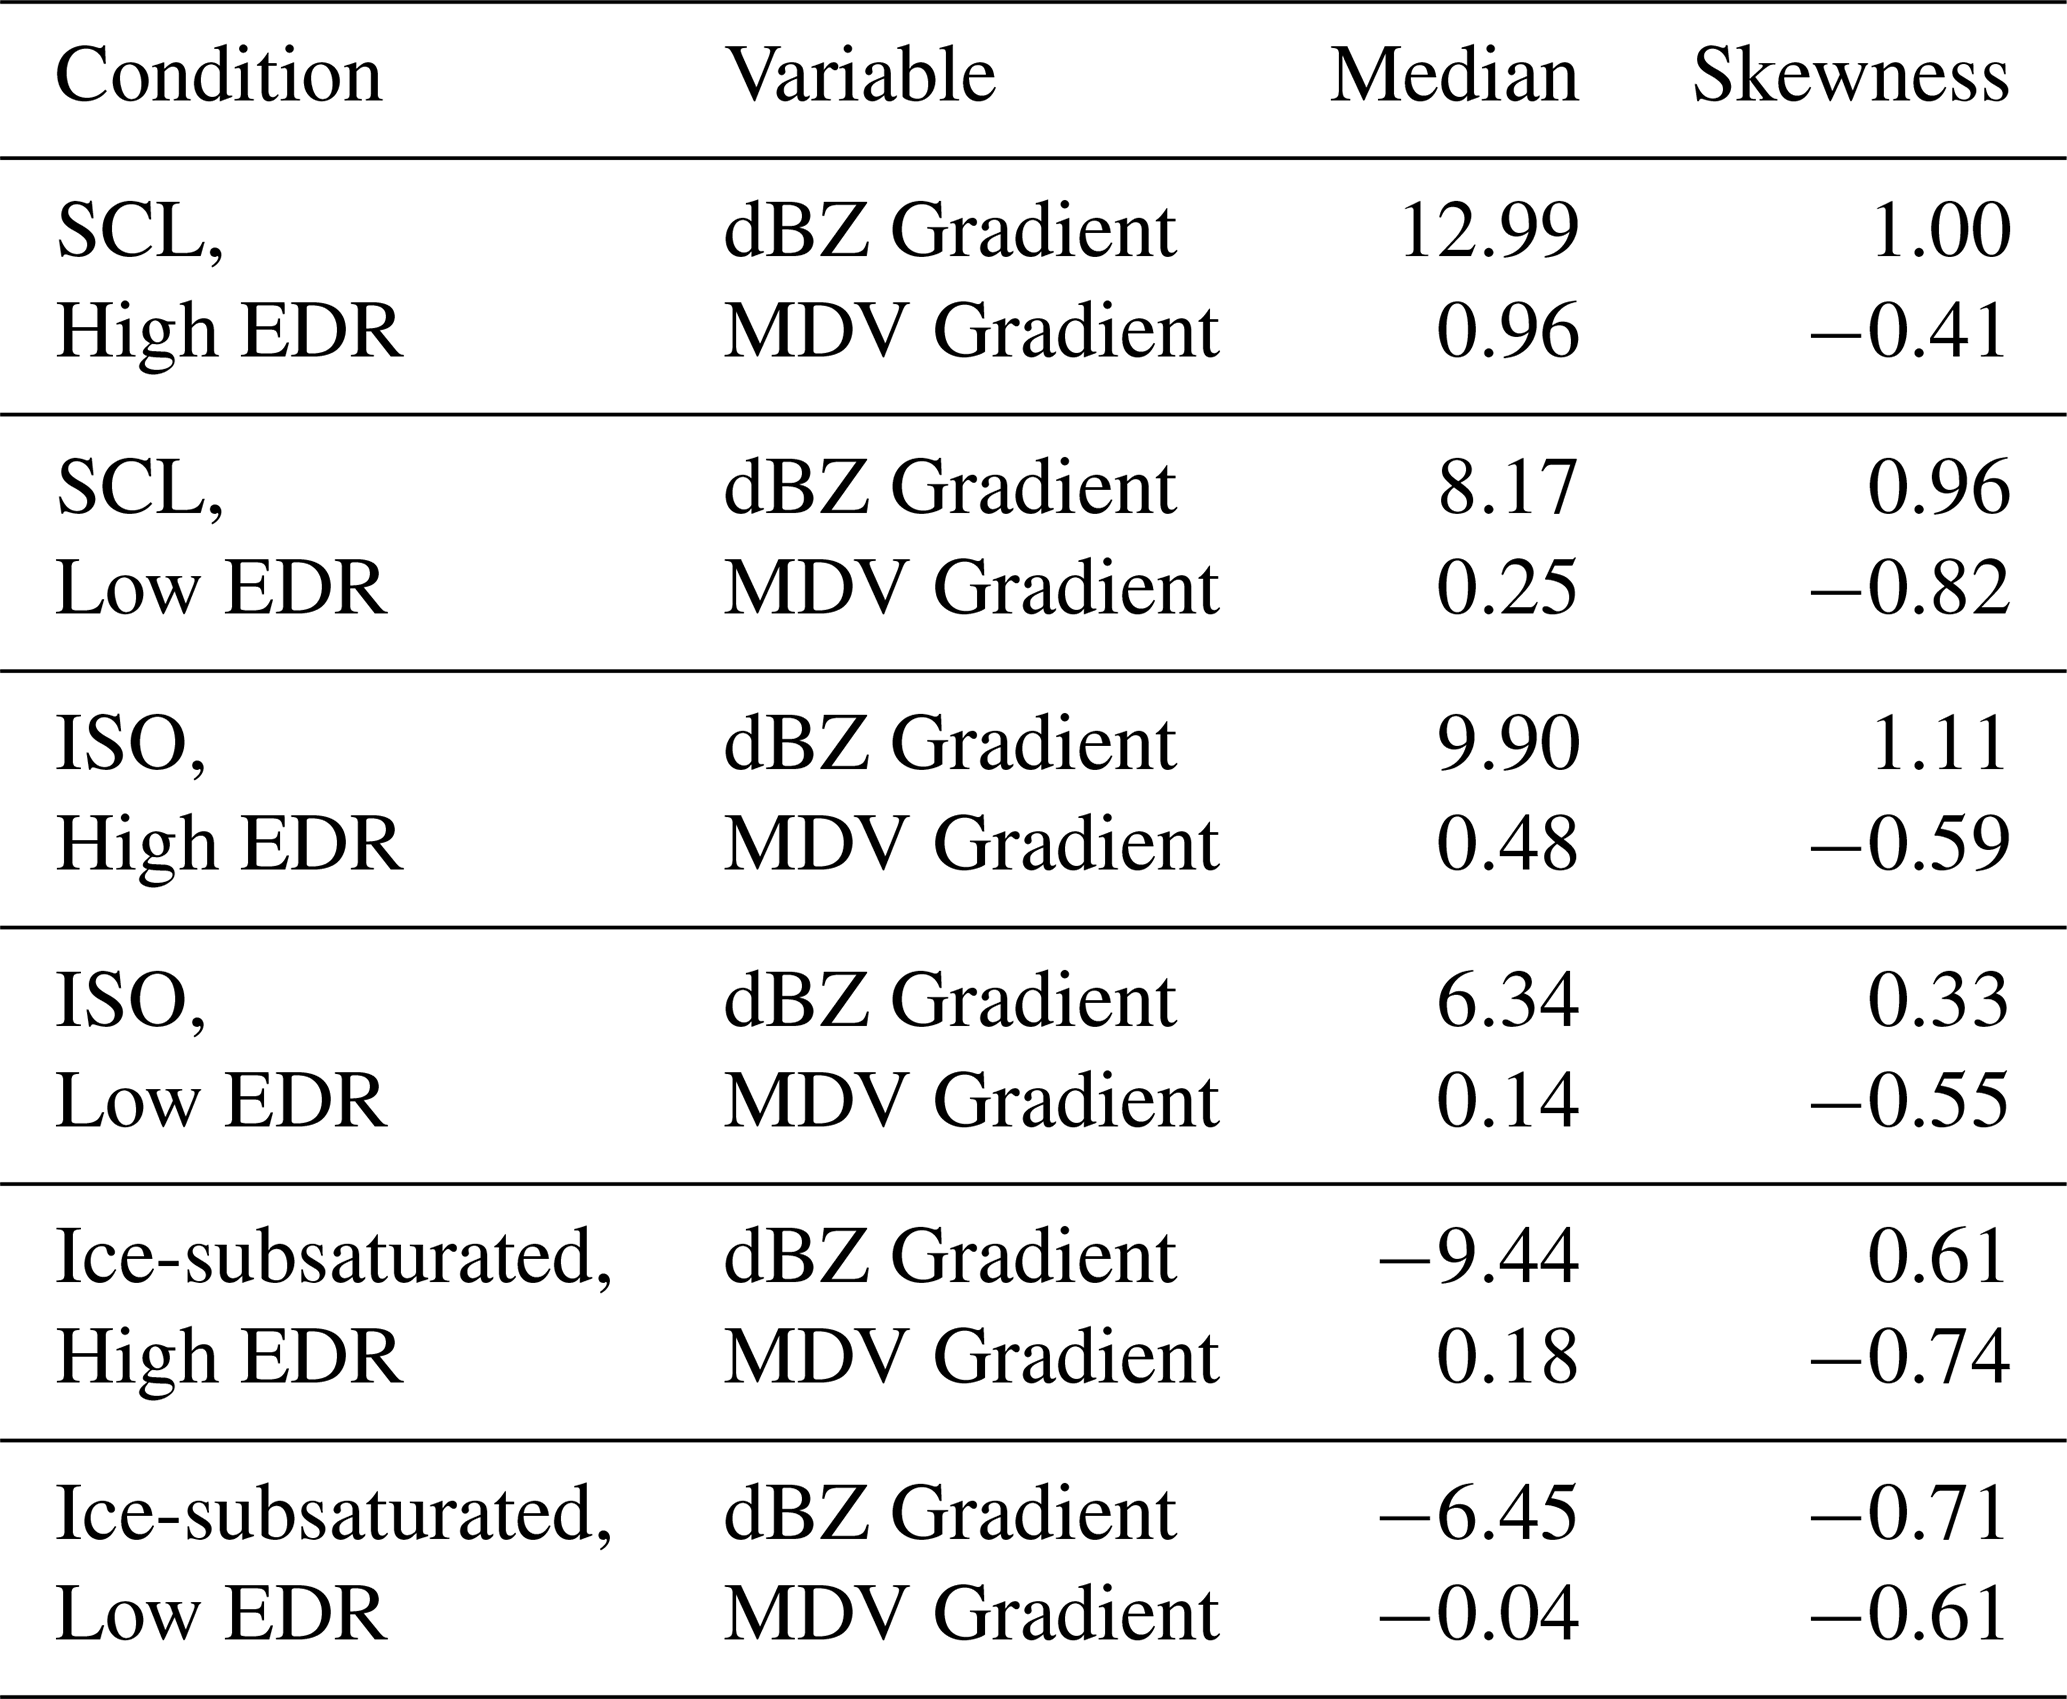
The median MDV gradient is large (> 0.7 m s−1 km−1) in the SCL conditions as shown in Fig. 2d, and high EDR also distribute in SCL conditions as shown in Fig. 5a. Their distributions almost overlap by comparing the Figs. 2d and 5a. Either of SCL or turbulence are suggested to enhance the ice growth in previous research. To explore the role of turbulence and SCL on ice particle growth respectively, we classify the environments of saturated with respect to ice into six groups: high EDR with SCL, SCL only, high EDR only, ISO with low EDR, high EDR in ice-subsaturated condition, and low EDR in ice-subsaturated condition. The order of the median of MDV gradient and dBZ gradient under ice-supersaturated conditions (Si > 1.0) from large to small are: SCL with high EDR, high EDR only, SCL only, ISO with low EDR (Table 1). That means that from the vertical gradient point of view, turbulence alone can enhance particle growth, which is consistent with previous studies (Chu et al., 2018; Chellini and Kneifel, 2024). The appearance of SCL alone can enhance ice growth, presumably via riming. When turbulence and SCL are coupled together, the MDV gradient and dBZ gradient are much larger than either alone (Table 1), which suggests that the potential positive feedback loop between SCL and turbulence might enhance the growth of ice particles.
In ice-subsaturated conditions (Si < 1.0), a more variable EDR is observed at temperatures above −22 °C, varying from 10−9 to 10−2 m2 s−3. High EDR only appears in warm regions, which likely correspond to lower altitudes, suggesting that turbulence in low Si regions is likely induced by boundary layer processes. As shown in Table 1, the dBZ gradient under high EDR is smaller than that under low EDR in this region, possibly due to turbulence-induced entrainment of dry air and enhanced sublimation in low-relative-humidity environments. In contrast, the MDV gradient is larger in high EDR region. This indicates that while turbulence or entrainment in ice-subsaturated regions (as seen in Fig. 5a) contributes to particle size reduction (i.e., negative dBZ gradient), it may simultaneously enhance particle density (i.e., positive MDV gradient) potentially through morphological changes during sublimation, as reflected in the statistics.
Low EDR is mainly observed near the Si = 1.0 line. At Si = 1.0, ice deposition and sublimation are balanced, stabilizing the local environment and minimizing turbulence. However, when turbulence does occur, it can disrupt this equilibrium by vertically displacing ice particles into regions of differing saturation, enhancing local imbalances.
The RH threshold for identifying SCL and the EDR threshold for identifying high EDR regions were adjusted within a reasonable range (RH: from 95 % to 99 %, EDR: from 10−6 to 10−4 m2 s−3 ) to verify the robustness of the results above. Although the specific values vary, the main results previously described remain unchanged despite these variations, confirming their reliability.
This study provides a comprehensive investigation into ice microphysical processes and their interaction with turbulence in Arctic stratiform clouds using 6.5 years of ground-based radar and radiosonde observations at the DOE ARM North Slope of Alaska site. By combining Ka-band radar data with thermodynamic profiles, we leverage radar reflectivity and MDV, along with their vertical gradients to trace the state and the evolution of ice particles under varying temperature and moisture conditions.
The results reveal clear links between water vapor saturation ratio with respect to ice and ice particle evolution: ice supersaturated conditions (Si > 1.0) exhibit positive vertical gradients of radar variables (i.e., reflectivity and MDV), indicating ice particle growth, while ice-subsaturated conditions (Si < 1.0) exhibit negative gradients of radar variables, indicating sublimation. The vertical gradients of reflectivity and mean Doppler velocity directly reflect ice growth processes, making them more closely tied to environmental conditions. Our observational insights provide a potential perspective for evaluating ice-growth processes, which remain a major source of uncertainty in cloud-resolving models. The shape of ice hydrometeors varies greatly due to a range of growth processes influenced by changing environmental conditions during their lifetimes. This variability makes it difficult to accurately simulate their scattering properties and fall speeds (Tyynelä et al., 2023). Instead of relying solely on empirical relationships – such as mass–diameter (M–D) or velocity–diameter (V–D) curves for different ice types (e.g. Locatelli and Hobbs, 1974) – to describe transitions in mass and number concentrations across predefined categories (Grabowski et al., 2019), an alternative approach could model size and density growth rates as functions of the microphysical processes driven by the environment.
Temperature dependence of ice growth is observed in ice supersaturated regions, which is consistent with previous laboratory studies. In the dendritic growth zone (around −15 °C), positive dBZ gradients are accompanied by negative Doppler velocity gradients, particularly pronounced for small ice particles (as indicated by low dBZ values). This pattern suggests the transitions from fast-falling to slow-falling ice particles near this temperature, or the emergence of newly-formed, slowly-falling ice particles through secondary ice production. A similar pattern is observed around −22 °C, although it is not as significant as that around −15 °C.
Turbulence, quantified by EDR, is strongest and most concentrated in SCL regions compared to ISO conditions and ice-subsaturated conditions. Although EDR is relatively larger near cloud top than that below, the correlation between SCL and turbulence can be observed throughout the cloud. The coexistence of SCL and high EDR substantially enhances ice particle growth, as indicated by pronounced vertical gradients. The median vertical gradient of reflectivity in these regions is 12.99 dBZ km−1, and the median gradient of MDV is 0.96 m s−1 km−1, both significantly higher than in SCL only regions (8.17 dBZ km−1 and 0.25 m s−1 km−1, respectively) and turbulence only regions (9.9 dBZ km−1, 0.48 m s−1 km−1). While either SCL or high EDR alone can promote ice growth, their individual contributions are 24 %–37 % lower in reflectivity gradient and 50 %–74 % lower in MDV gradient, compared to regions where both coexist. High EDR in ice-subsaturated regions at temperatures above −22 °C is possibly driven by boundary layer processes, which tends to reduce particle size but enhance particle density as indicated by vertical gradient of reflectivity and MDV.
Although our observations provide robust statistics, they are limited to primarily stratiform cloud regimes due to the infrequent occurrence of deep convection over the North Slope of Alaska. The role of convective dynamics and associated turbulence in shaping ice microphysics remains an important open question. Future studies targeting convective systems may offer valuable insights. Furthermore, utilizing multi-frequency and dual-polarization radar systems could also improve the characterization of ice particle microstructure and ice microscopical processes, thereby advancing understanding of microphysical complexity (e.g. Kumjian et al., 2022; Tyynelä and Chandrasekar, 2014; Leinonen et al., 2013; Oue et al., 2021; von Terzi et al., 2022).
Our study provides a map of ice particle growth and sublimation – diagnosed from vertical gradients of radar reflectivity and mean Doppler velocity – across a broad range of temperature and moisture conditions based on long-term radar observations. It confirms and extends previous findings on temperature-dependent ice growth from short-term observations and laboratory experiments by providing statistical quantification over a multi-year dataset. In addition, our results enhance understanding of the role of turbulence in ice microphysics and underscore the importance of incorporating both environmental conditions and turbulence to improve the representation of ice microphysical processes in models.
Data from KAZR radar, radiosonde, and ceilometer (DOIs: https://doi.org/10.5439/1976090, Bharadwaj et al., 2025, https://doi.org/10.5439/1595321, Keeler et al., 2025, https://doi.org/10.5439/1181954, Zhang et al., 2025) are available from the ARM Data Discovery website (https://www.archive.arm.gov/discovery/, last access: 19 November 2025).
Data analysis, post-processing and generation of figures was performed by JY. Conceptualization of the method, interpretation, and writing were shared between JY, MO, PK, EL and FY. Data pre-processing was performed by EL.
The contact author has declared that none of the authors has any competing interests.
Publisher’s note: Copernicus Publications remains neutral with regard to jurisdictional claims made in the text, published maps, institutional affiliations, or any other geographical representation in this paper. While Copernicus Publications makes every effort to include appropriate place names, the final responsibility lies with the authors. Views expressed in the text are those of the authors and do not necessarily reflect the views of the publisher.
Jialin Yan and Pavlos Kollias were supported National Aeronautics and Space Administration (NASA) under the Atmospheric Observing System (AOS) project (Contract number: 80NSSC23M0113). Mariko Oue and Pavlos Kollias were supported by the National Science Foundation grant number AGS1841215. Mariko Oue was also supported by DOE grant numbers DE-SC0021160 and DE-SC0025146. Edward Luke, Pavlos Kollias, and Fan Yang were funded by DOE as part of the Atmospheric System Research (ASR) program under contract DE-SC0012704.
This research has been supported by the National Aeronautics and Space Administration (grant no. 80NSSC23M0113), the National Science Foundation (grant nos. AGS1841215 and 2113070), and the U.S. Department of Energy (grant nos. DE-SC0021160, DE-SC0025146, and DE-SC0012704).
This paper was edited by Yi Huang and reviewed by Peter May and one anonymous referee.
Andrić, J., Kumjian, M. R., Zrnić, D. S., Straka, J. M., and Melnikov, V. M.: Polarimetric signatures above the melting layer in winter storms: An observational and modeling study, Journal of Applied Meteorology and Climatology, 52, 682–700, 2013. a
Bailey, M. P. and Hallett, J.: A Comprehensive Habit Diagram for Atmospheric Ice Crystals: Confirmation from the Laboratory, AIRS II, and Other Field Studies, Journal of the Atmospheric Sciences, 66, 2888–2899, https://doi.org/10.1175/2009JAS2883.1, 2009. a
Baker, B. A. and Lawson, R. P.: In Situ Observations of the Microphysical Properties of Wave, Cirrus, and Anvil Clouds. Part I: Wave Clouds, Journal of the Atmospheric Sciences, 63, 3160–3185, https://doi.org/10.1175/jas3802.1, 2006. a
Bechini, R., Baldini, L., and Chandrasekar, V.: Polarimetric radar observations in the ice region of precipitating clouds at C-band and X-band radar frequencies, Journal of applied meteorology and climatology, 52, 1147–1169, 2013. a
Bharadwaj, N., Lindenmaier, I., Johnson, K., Nelson, D., Isom, B., Hardin, J., Matthews, A., Wendler, T., Melo de Castro, V., Deng, M., Rocque, M., and Feng, Y.: Ka ARM Zenith Radar (KAZRSPECCMASKMDCOPOL), 2011-11-11 to 2019-10-21, North Slope Alaska (NSA) Central Facility, Barrow AK (C1), ARM Data Center [data set], https://doi.org/10.5439/1976090, 2025. a, b
Borque, P., Luke, E., and Kollias, P.: On the unified estimation of turbulence eddy dissipation rate using Doppler cloud radars and lidars, Journal of Geophysical Research: Atmospheres, 121, 5972–5989, https://doi.org/10.1002/2015JD024543, 2016. a, b
Chellini, G. and Kneifel, S.: Turbulence as a Key Driver of Ice Aggregation and Riming in Arctic Low-Level Mixed-Phase Clouds, Revealed by Long-Term Cloud Radar Observations, Geophysical Research Letters, 51, e2023GL106599, https://doi.org/10.1029/2023GL106599, 2024. a, b
Chu, X., Xue, L., Geerts, B., and Kosović, B.: The impact of boundary layer turbulence on snow growth and precipitation: Idealized Large Eddy Simulations, Atmospheric Research, 204, 54–66, https://doi.org/10.1016/j.atmosres.2018.01.015, 2018. a
Fukuta, N. and Takahashi, T.: The Growth of Atmospheric Ice Crystals: A Summary of Findings in Vertical Supercooled Cloud Tunnel Studies, Journal of the Atmospheric Sciences, 56, 1963–1979, https://doi.org/10.1175/1520-0469(1999)056<1963:TGOAIC>2.0.CO;2, 1999. a, b
Garrett, T. J. and Yuter, S. E.: Observed influence of riming, temperature, and turbulence on the fallspeed of solid precipitation, Geophysical Research Letters, 41, 6515–6522, https://doi.org/10.1002/2014gl061016, 2014. a
Grabowski, W. W., Morrison, H., Shima, S.-I., Abade, G. C., Dziekan, P., and Pawlowska, H.: Modeling of cloud microphysics: Can we do better?, Bulletin of the American Meteorological Society, 100, 655–672, 2019. a, b
Griggs, D. J. and Choularton, T. W.: A laboratory study of secondary ice particle production by the fragmentation of rime and vapour-grown ice crystals, Quarterly Journal of the Royal Meteorological Society, 112, 149–163, 1986. a
Heymsfield, A. J., Schmitt, C., Chen, C.-C.-J., Bansemer, A., Gettelman, A., Field, P. R., and Liu, C.: Contributions of the liquid and ice phases to global surface precipitation: Observations and global climate modeling, Journal of the Atmospheric Sciences, 77, 2629–2648, 2020. a
Hobbs, P. V. and Rangno, A. L.: Microstructures of Low and Middle‐level Clouds over the Beaufort Sea, Quarterly Journal of the Royal Meteorological Society, 124, 2035–2071, https://doi.org/10.1002/qj.49712455012, 1998. a
Houze, R. A. and Medina, S.: Turbulence as a Mechanism for Orographic Precipitation Enhancement, Journal of the Atmospheric Sciences, 62, 3599–3623, https://doi.org/10.1175/JAS3555.1, 2005. a
Kalesse, H., Kollias, P., and Szyrmer, W.: On using the relationship between Doppler velocity and radar reflectivity to identify microphysical processes in midlatitudinal ice clouds, Journal of Geophysical Research: Atmospheres, 118, 12168–12179, https://doi.org/10.1002/2013JD020386, 2013. a
Kanji, Z. A., Ladino, L. A., Wex, H., Boose, Y., Burkert-Kohn, M., Cziczo, D. J., and Krämer, M.: Overview of Ice Nucleating Particles, Meteorological Monographs, 58, 1.1–1.33, https://doi.org/10.1175/AMSMONOGRAPHS-D-16-0006.1, 2017. a
Keeler, E., Burk, K., and Kyrouac, J.: Balloon-Borne Sounding System (SONDEWNPN), 2002-04-28 to 2025-05-06, North Slope Alaska (NSA), Central Facility, Barrow AK (C1), ARM Data Center, [data set], https://doi.org/10.5439/1595321, 2025. a, b
Khain, A. P., Beheng, K. D., Heymsfield, A., Korolev, A., Krichak, S. O., Levin, Z., Pinsky, M., Phillips, V., Prabhakaran, T., Teller, A., Van Den Heever, S. C., and Yano, J. I.: Representation of microphysical processes in cloud‐resolving models: Spectral (bin) microphysics versus bulk parameterization, Reviews of Geophysics, 53, 247–322, https://doi.org/10.1002/2014rg000468, 2015. a, b
Kikuchi, K., Kameda, T., Higuchi, K., and Yamashita, A.: A global classification of snow crystals, ice crystals, and solid precipitation based on observations from middle latitudes to polar regions, Atmos. Res., 132–133, 460–472, 2013. a
Kollias, P., Bharadwaj, N., Clothiaux, E. E., Lamer, K., Oue, M., Hardin, J., Isom, B., Lindenmaier, I., Matthews, A., Luke, E. P., Giangrande, S. E., Johnson, K., Collis, S., Comstock, J., and Mather, J. H.: The ARM Radar Network: At the Leading Edge of Cloud and Precipitation Observations, Bulletin of the American Meteorological Society, 101, E588–E607, https://doi.org/10.1175/BAMS-D-18-0288.1, 2020. a, b
Korolev, A.: Limitations of the Wegener–Bergeron–Findeisen mechanism in the evolution of mixed-phase clouds, Journal of the Atmospheric Sciences, 64, 3372–3375, 2007. a
Korolev, A. and Field, P. R.: The effect of dynamics on mixed-phase clouds: Theoretical considerations, Journal of the Atmospheric Sciences, 65, 66–86, 2008. a
Korolev, A. and Leisner, T.: Review of experimental studies of secondary ice production, Atmos. Chem. Phys., 20, 11767–11797, https://doi.org/10.5194/acp-20-11767-2020, 2020. a, b
Korolev, A., Heckman, I., Wolde, M., Ackerman, A. S., Fridlind, A. M., Ladino, L. A., Lawson, R. P., Milbrandt, J., and Williams, E.: A new look at the environmental conditions favorable to secondary ice production, Atmos. Chem. Phys., 20, 1391–1429, https://doi.org/10.5194/acp-20-1391-2020, 2020. a
Korolev, A. V., Isaac, G. A., and Hallett, J.: Ice particle habits in Arctic clouds, Geophysical Research Letters, 26, 1299–1302, https://doi.org/10.1029/1999GL900232, 1999. a
Kumjian, M. R., Tobin, D. M., Oue, M., and Kollias, P.: Microphysical Insights into Ice Pellet Formation Revealed by Fully Polarimetric Ka-Band Doppler Radar, Journal of Applied Meteorology and Climatology, 59, 1557–1580, https://doi.org/10.1175/JAMC-D-20-0054.1, 2020. a
Kumjian, M. R., Prat, O. P., Reimel, K. J., Van Lier-Walqui, M., and Morrison, H. C.: Dual-Polarization Radar Fingerprints of Precipitation Physics: A Review, Remote Sensing, 14, 3706, https://doi.org/10.3390/rs14153706, 2022. a
Lamb, D. and Verlinde, J.: Physics and Chemistry of Clouds, Cambridge University Press, ISBN 978-0-511-97637-7, ISBN 978-1-139-19063-3, ISBN 978-1-62870-283-5, 2011. a
Leinonen, J., Moisseev, D., and Nousiainen, T.: Linking Snowflake Microstructure to Multi‐frequency Radar Observations, Journal of Geophysical Research: Atmospheres, 118, 3259–3270, https://doi.org/10.1002/jgrd.50163, 2013. a
Liou, K.-N.: Influence of cirrus clouds on weather and climate processes: A global perspective, Monthly Weather Review, 114, 1167–1199, 1986. a
Locatelli, J. D. and Hobbs, P. V.: Fall speeds and masses of solid precipitation particles, Journal of Geophysical Research, 79, 2185–2197, https://doi.org/10.1029/jc079i015p02185, 1974. a
Lonardi, M., Akansu, E. F., Ehrlich, A., Mazzola, M., Pilz, C., Shupe, M. D., Siebert, H., and Wendisch, M.: Tethered balloon-borne observations of thermal-infrared irradiance and cooling rate profiles in the Arctic atmospheric boundary layer, Atmos. Chem. Phys., 24, 1961–1978, https://doi.org/10.5194/acp-24-1961-2024, 2024. a
Luke, E. P., Yang, F., Kollias, P., Vogelmann, A. M., and Maahn, M.: New insights into ice multiplication using remote-sensing observations of slightly supercooled mixed-phase clouds in the Arctic, Proceedings of the National Academy of Sciences, 118, e2021387118, https://doi.org/10.1073/pnas.2021387118, 2021. a, b, c, d, e
Lynch, D. K., Sassen, K., Starr, D. O., and Stephens, G.: Cirrus, Oxford University Press, ISBN 978-0195351392, 2002. a
Morrison, H., De Boer, G., Feingold, G., Harrington, J., Shupe, M. D., and Sulia, K.: Resilience of persistent Arctic mixed-phase clouds, Nature Geoscience, 5, 11–17, https://doi.org/10.1038/ngeo1332, 2012. a, b
Mülmenstädt, J., Sourdeval, O., Delanoë, J., and Quaas, J.: Frequency of occurrence of rain from liquid-, mixed-, and ice-phase clouds derived from A-Train satellite retrievals, Geophysical Research Letters, 42, 6502–6509, 2015. a
Oue, M., Kollias, P., Ryzhkov, A., and Luke, E. P.: Toward Exploring the Synergy Between Cloud Radar Polarimetry and Doppler Spectral Analysis in Deep Cold Precipitating Systems in the Arctic, Journal of Geophysical Research: Atmospheres, 123, 2797–2815, https://doi.org/10.1002/2017jd027717, 2018. a, b
Oue, M., Kollias, P., Matrosov, S. Y., Battaglia, A., and Ryzhkov, A. V.: Analysis of the microphysical properties of snowfall using scanning polarimetric and vertically pointing multi-frequency Doppler radars, Atmos. Meas. Tech., 14, 4893–4913, https://doi.org/10.5194/amt-14-4893-2021, 2021. a
Ramelli, F., Henneberger, J., David, R. O., Lauber, A., Pasquier, J. T., Wieder, J., Bühl, J., Seifert, P., Engelmann, R., Hervo, M., and Lohmann, U.: Influence of low-level blocking and turbulence on the microphysics of a mixed-phase cloud in an inner-Alpine valley, Atmos. Chem. Phys., 21, 5151–5172, https://doi.org/10.5194/acp-21-5151-2021, 2021. a
Schrom, R. S. and Kumjian, M. R.: Connecting Microphysical Processes in Colorado Winter Storms with Vertical Profiles of Radar Observations, Journal of Applied Meteorology and Climatology, 55, 1771–1787, https://doi.org/10.1175/JAMC-D-15-0338.1, 2016. a, b, c, d
Schwarzenboeck, A., Shcherbakov, V., Lefevre, R., Gayet, J.-F., Pointin, Y., and Duroure, C.: Indications for Stellar-Crystal Fragmentation in Arctic Clouds, Atmospheric Research, 92, 220–228, https://doi.org/10.1016/j.atmosres.2008.10.002, 2009. a
Silber, I., McGlynn, P. S., Harrington, J. Y., and Verlinde, J.: Habit‐Dependent Vapor Growth Modulates Arctic Supercooled Water Occurrence, Geophysical Research Letters, 48, https://doi.org/10.1029/2021gl092767, 2021. a
Stephens, G. L., Tsay, S.-C., Stackhouse Jr, P. W., and Flatau, P. J.: The relevance of the microphysical and radiative properties of cirrus clouds to climate and climatic feedback, Journal of Atmospheric Sciences, 47, 1742–1754, 1990. a
Takahashi, T.: Influence of Liquid Water Content and Temperature on the Form and Growth of Branched Planar Snow Crystals in a Cloud, Journal of the Atmospheric Sciences, 71, 4127–4142, https://doi.org/10.1175/JAS-D-14-0043.1, 2014. a, b
Takahashi, T. and Fukuta, N.: Supercooled cloud tunnel studies on the growth of snow crystals between-4 and-20 C, Journal of the Meteorological Society of Japan. Ser. II, 66, 841–855, 1988. a
Takahashi, T., Endoh, T., Wakahama, G., and Fukuta, N.: Vapor Diffusional Growth of Free-Falling Snow Crystals between -3 and -23 degC, Journal of the Meteorological Society of Japan. Ser. II, 69, 15–30, https://doi.org/10.2151/jmsj1965.69.1_15, 1991. a, b, c
Takahashi, T., Nagao, Y., and Kushiyama, Y.: Possible High Ice Particle Production during Graupel–Graupel Collisions, Journal of the Atmospheric Sciences, 52, 4523–4527, https://doi.org/10.1175/1520-0469(1995)052<4523:PHIPPD>2.0.CO;2, 1995. a
Tyynelä, J. and Chandrasekar, V.: Characterizing Falling Snow Using Multifrequency Dual-Polarization Measurements: TYYNELÄ AND CHANDRASEKAR, Journal of Geophysical Research: Atmospheres, 119, 8268–8283, https://doi.org/10.1002/2013JD021369, 2014. a
Tyynelä, J., McCusker, K., Ori, D., Ekelund, R., and Fenni, I.: Scattering by Snow Particles, in: Advances in Weather Radar. Volume 2: Precipitation Science, Scattering and Processing Algorithms, edited by: Bringi, V., Mishra, K. V., and Thurai, M., Institution of Engineering and Technology, 99–142, ISBN 978-1-83953-624-3 978-1-83953-625-0, https://doi.org/10.1049/SBRA557G_ch3, 2023. a, b, c
Vardiman, L.: The generation of secondary ice particles in clouds by crystal–crystal collision, Journal of Atmospheric Sciences, 35, 2168–2180, 1978. a
Verlinde, J., Zak, B. D., Shupe, M. D., Ivey, M. D., and Stamnes, K.: The ARM North Slope of Alaska (NSA) Sites, Meteorological Monographs, 57, 8.1–8.13, https://doi.org/10.1175/amsmonographs-d-15-0023.1, 2016. a
von Terzi, L., Dias Neto, J., Ori, D., Myagkov, A., and Kneifel, S.: Ice microphysical processes in the dendritic growth layer: a statistical analysis combining multi-frequency and polarimetric Doppler cloud radar observations, Atmos. Chem. Phys., 22, 11795–11821, https://doi.org/10.5194/acp-22-11795-2022, 2022. a, b, c
Zhang, D., Ermold, B., and Morris, V.: Ceilometer (CEIL), 1997-12-11 to 2025-04-12, North Slope Alaska (NSA) [data set], Central Facility, Barrow AK (C1), https://doi.org/10.5439/1181954, 2025. a, b, c