the Creative Commons Attribution 4.0 License.
the Creative Commons Attribution 4.0 License.
 | 05 Feb 2025
Fluorescence properties of long-range-transported smoke: insights from five-channel lidar observations over Moscow during the 2023 wildfire season
Igor Veselovskii
Mikhail Korenskiy
Nikita Kasianik
Boris Barchunov
Qiaoyun Hu
Philippe Goloub
Thierry Podvin
The fluorescence lidar at the Prokhorov General Physics Institute (Moscow) was utilized to study smoke transported over the Atlantic during the wildfire season from May to September 2023. The lidar system, which is based on a tripled Nd : YAG laser, performs fluorescence measurements across five spectral intervals centered at wavelengths of 438, 472, 513, 560 and 614 nm. This configuration enables the assessment of the spectral dependence of fluorescence backscattering over a broad range of altitudes, from the planetary boundary layer (PBL) to the middle and upper troposphere (MUT). The fluorescence capacity of smoke, defined as the ratio of fluorescence backscattering to aerosol backscattering at the laser wavelength, exhibits significant variation in the MUT, with changes of up to a factor of 3. This variation is likely indicative of differences in the relative concentration of organic compounds within the smoke. Analysis of more than 40 smoke episodes has enabled an evaluation of the height dependence of smoke fluorescence properties. Observations reveal that the fluorescence capacity generally increases with altitude, suggesting a higher concentration of organic compounds in the MUT compared to the lower troposphere. Additionally, the measurements consistently show differences in the fluorescence spectra of smoke and urban aerosol. Urban aerosol fluorescence tends to decrease gradually with wavelength, whereas the peak of smoke fluorescence is observed in the 513 and 560 nm channels. This spectral distinction provides an effective means of separating smoke from urban aerosol. The technique was applied the analysis of events where smoke from the upper troposphere descended into the PBL, demonstrating its utility in distinguishing between these aerosol types.
- Article
(5583 KB) - Full-text XML
- BibTeX
- EndNote


Smoke particles produced by intense wildfires can ascend into the middle and upper troposphere (MUT), where they can alter the Earth's radiation budget by scattering and absorbing solar radiation, as well as by influencing cloud formation processes (Baars et al., 2019; Khaykin et al., 2020; Senf et al., 2023; Mamouri et al., 2023). Mie–Raman lidars have been used for years to study the physical properties of both fresh and aged smoke (Adam et al., 2020; Ansmann et al., 2021, and references therein). However, distinguishing smoke from other aerosol types based on Mie–Raman lidar measurements can be challenging, especially within thin aerosol layers where lidar ratios cannot be calculated. A new opportunity for identifying smoke particles has recently emerged due to advancements in fluorescence lidar observations (Reichardt et al., 2018, 2023; Veselovskii et al., 2020, 2024; Hu et al., 2022; Miri et al., 2024). Organic compounds, which account for a substantial fraction of wildfire emissions, exhibit high-fluorescence cross-sections, providing a basis for monitoring smoke in the MUT and within cirrus clouds (Veselovskii et al., 2022a; Gast et al., 2024).
Measuring the total fluorescence spectrum (Sugimoto et al., 2012; Saito et al., 2018; Reichardt et al., 2023) offers a clear advantage for aerosol identification. Nevertheless, single-channel fluorescence lidars are now being developed due to their simplicity. Furthermore, selecting the spectral interval for fluorescence observations with an interference filter allows for high detection sensitivity, as modern interference filters have a transmission exceeding 90 %. In a standard Mie–Raman lidar, which employs a tripled Nd : YAG laser and measures the so-called 3β+2α data set (comprising three backscattering and two aerosol extinction coefficients), a segment of the spectral range, roughly between 415 and 525 nm, can be utilized for fluorescence measurements. Recent studies have demonstrated that combining single-channel fluorescence and polarization measurements enables the identification of major aerosol types, such as smoke, dust, urban particles and pollen (Veselovskii et al., 2022b). Additionally, the contributions of different particle types to the total backscattering coefficient of an aerosol mixture can be evaluated (Veselovskii et al., 2024). However, particle classification using a single-channel fluorescence lidar is based on fluorescence capacity (the ratio of fluorescence backscattering to aerosol backscattering at the laser wavelength), which depends on relative humidity (RH). Particle hygroscopic growth leads to an increase in the backscattering coefficient, which in turn reduces the fluorescence capacity. This reduction in fluorescence capacity can impact the accuracy of a classification algorithm. Meanwhile, as recently shown by Veselovskii et al. (2023), fluorescence measurements in several discrete channels should mitigate the impact of relative humidity because the ratio of the fluorescence backscattering coefficients in different channels is not affected by hygroscopic growth. Moreover, the spectral dependence of fluorescence backscattering for specific aerosols can be used for their identification.
In 2022, a five-channel fluorescence lidar was put into operation at the Prokhorov General Physics Institute (PGPI) in Moscow (Veselovskii et al., 2023). The year 2023 was characterized by intense wildfires in North America and Siberia, allowing the fluorescence spectra of smoke to be studied across a wide range of altitudes, from the planetary boundary layer (PBL) to the upper troposphere. This paper summarizes the results of fluorescence measurements of smoke layers over Moscow from May to September 2023. We begin with a description of the lidar system in Sect. 2. In the first part of the results section (Sect. 3.1), we analyze two typical observations in the upper and in the middle troposphere to identify the main features of the fluorescence spectrum. Section 3.2 presents an analysis of over 40 smoke episodes to determine the mean spectral characteristics of fluorescence at different altitude intervals. Section 3 introduces a novel approach to separating smoke and urban aerosol based on their fluorescence spectra. This approach is applied to episodes where the smoke layer transported over the Atlantic descended to the PBL. In the conclusion section, we summarize our main findings.
A description of the five-channel fluorescence lidar at the PGPI is given by Veselovskii et al. (2023). The lidar is based on a tripled Nd : YAG laser with a pulse energy of 80 mJ at 355 nm and a repetition rate of 20 Hz. Backscattered light is collected by a 40 cm aperture telescope, and the lidar signals are digitized with Licel transient recorders with 7.5 m range resolution, allowing simultaneous detection in the analog and photon counting modes. Measurements were performed through the laboratory window at an angle of 48° to the horizon, which was the maximum available angle for observations. Additional atmospheric parameters were obtained from radiosonde measurements at the Dolgoprudny meteorological station, located about 50 km from the observation site.
The lidar operated at the PGPI allows the detection of elastic and nitrogen Raman backscatter as well as fluorescence backscatter within five spectral intervals. The central wavelengths (widths) of transmission bands of the fluorescence channels (Dλ) are as follows: 438 (29), 472 (32), 513 (29), 560 (40) and 614 (54) nm. The strong sunlight background during the daytime restricts the fluorescence observations to nighttime only. The duration of the measurement sessions varied from 5 to 8 h, depending on the season. The aerosol extinction coefficients at 355 nm (α355) were computed from Raman observations as described by Ansmann et al. (1992). To calculate the backscattering coefficient (β355) in the presence of clouds, this method was adapted as described by Veselovskii et al. (2022b).
To characterize aerosol fluorescence properties we use two key parameters, the fluorescence backscattering coefficient (βFλ) and the fluorescence capacity (GFλ), for each fluorescence channel centered at the wavelength λ. The βFλ is calculated from the ratio of the fluorescence backscattering and the nitrogen Raman backscattering, as described by Veselovskii et al. (2020). The GFλ is defined as the ratio of . These parameters were utilized in previous studies with a single-channel fluorescence lidar (Veselovskii et al., 2020; Hu et al., 2022) and correspond to measurements integrated over the transmission band of each channel. However, for the analysis of multichannel observations, where the width of the transmission band (Dλ) varies from one channel to another, both GFλ and βFλ should be divided by Dλ for comparisons across channels. Thus, in this study we use the “spectral fluorescence backscattering coefficients”, , and the “spectral fluorescence capacity”, , resulting in units of and nm−1 respectively. For simplicity, these normalized properties are referred to as the “fluorescence backscattering coefficient” and “fluorescence capacity” throughout the paper. All profiles of particle properties presented in this work were smoothed with the Savitzky–Golay method, employing a second-order polynomial with eight points in the window.
The aerosol volume (V) and mass (M) concentrations are crucial properties for characterizing smoke events. One of the simplest ways to derive particle volume concentration from lidar measurements is by employing the extinction-to-volume conversion factor for a specific type of aerosol, as suggested by Mamouri and Ansmann (2017), Ansmann et al. (2019, 2021), and He et al. (2023). These conversion factors for smoke, dust and urban aerosol, derived from the AERONET observations at a wavelength of 532 nm, enable the determination of aerosol volume concentration from extinction measurements. For a specific aerosol type, the particle volume can be estimated using the formula
The indices i=S, U and D correspond to smoke, urban and dust respectively. In the upper troposphere, the profiles of extinction coefficients cannot be calculated within the weak smoke layers, but the smoke volume concentration, VS, can still be estimated from the aerosol backscattering coefficient, assuming the lidar ratio () for smoke.
Based on the results presented in the publications by Mamouri and Ansmann (2017) and Ansmann et al. (2021), we use the conversion factor µm3 cm−3 Mm for smoke in our calculation. The lidar ratios of North American aged smoke at 532 nm have been reported in numerous publications (e.g., Burton et al., 2013; Haarig et al., 2018; Hu et al., 2022). In this study, we use the mean value of sr. Since our lidar system measures at 355 nm, the backscattering coefficient β355 can be converted to the equivalent at 532 nm using the color ratio . Based on observations in Lille (Hu et al., 2022), the CR for aged smoke is about 2.2. The volume concentration can be recalculated to the mass using the smoke density ρS=1.15 g cm−3 (Ansmann et al., 2021). Thus, the smoke volume concentration (in µm3 cm−3) and mass concentration (in µg m−3) can be estimated by multiplying β355 (in ) by the factors 3.8 µm3 cm−3 Mm sr and 4.4 µg m−3 Mm sr respectively. The uncertainty in such estimations should be below 25 %.
The partitioning of a three-component aerosol mixture in terms of backscattering coefficient was discussed in a recent publication by Veselovskii et al. (2024). For a smoke–urban mixture, such partitioning is feasible when the fluorescence capacities of smoke and urban particles, and , are known, and aerosol hygroscopic growth is absent. The equations for the backscattering coefficients and fluorescence capacities can be expressed as follows:
Here represents the relative contributions of smoke and urban particles to the overall backscattering coefficient. From Eqs. (3) and (4), we derive
Thus, the volume and mass concentrations of smoke in the smoke–urban mixture can be determined.
3.1 Fluorescence properties of smoke within the lower free troposphere and the middle–upper troposphere
From May to September 2023, smoke layers originating from North American and Siberian wildfires were regularly observed over Moscow at a wide range of altitudes, extending from the PBL to the upper troposphere. In total, over 40 measurement sessions were analyzed. The fluorescence properties of smoke varied with height, and in this analysis, we considered the three following altitude ranges: the PBL, the lower free troposphere (LFT, 4–8 km), and the middle and upper troposphere (MUT, 8–12 km). The aerosols over the observation site were primarily composed of smoke and urban aerosols. In our classification scheme, the “urban” type encompasses both continental aerosol and anthropogenic pollution.
Figure 1 provides an example of a strong smoke episode in the MUT during the night of 6–7 September 2023. The figure depicts spatiotemporal distributions of the aerosol and fluorescence backscattering coefficients (β355 and B513). The smoke layer within the 8–10 km range exhibits strong fluorescence, with B513 exceeding 10 at its maximum. The mean value of the ratio within this height range is about , indicating that the fluorescence backscattering coefficient is almost 4 orders of magnitude lower than the elastic one. However, the fluorescence technique in Fig. 1 allows the smoke layer in the MUT to be monitored.

Figure 1Spatiotemporal distributions of (a) the aerosol backscattering coefficient β355 and (b) the fluorescence backscattering coefficient B513 during the night of 6–7 September 2023.
Vertical profiles of key particle properties such as the aerosol and fluorescence backscattering coefficients, β355 and Bλ, along with the fluorescence capacity G513 and the ratio , are shown in Fig. 2. Within the PBL, where urban aerosol is dominant, the fluorescence capacity is relatively low, about nm−1. However, within the smoke layer G513 shows a significant increase with height, starting from nm−1 at 8 km and rising to nm−1 at 10 km. As mentioned, the main contribution to the smoke fluorescence is provided by the organic fraction. Thus, the height dependence of G513 within the smoke layer may indicate changes in the relative content of the organic fraction: it is minimal near the layer bottom and maximal in the center.
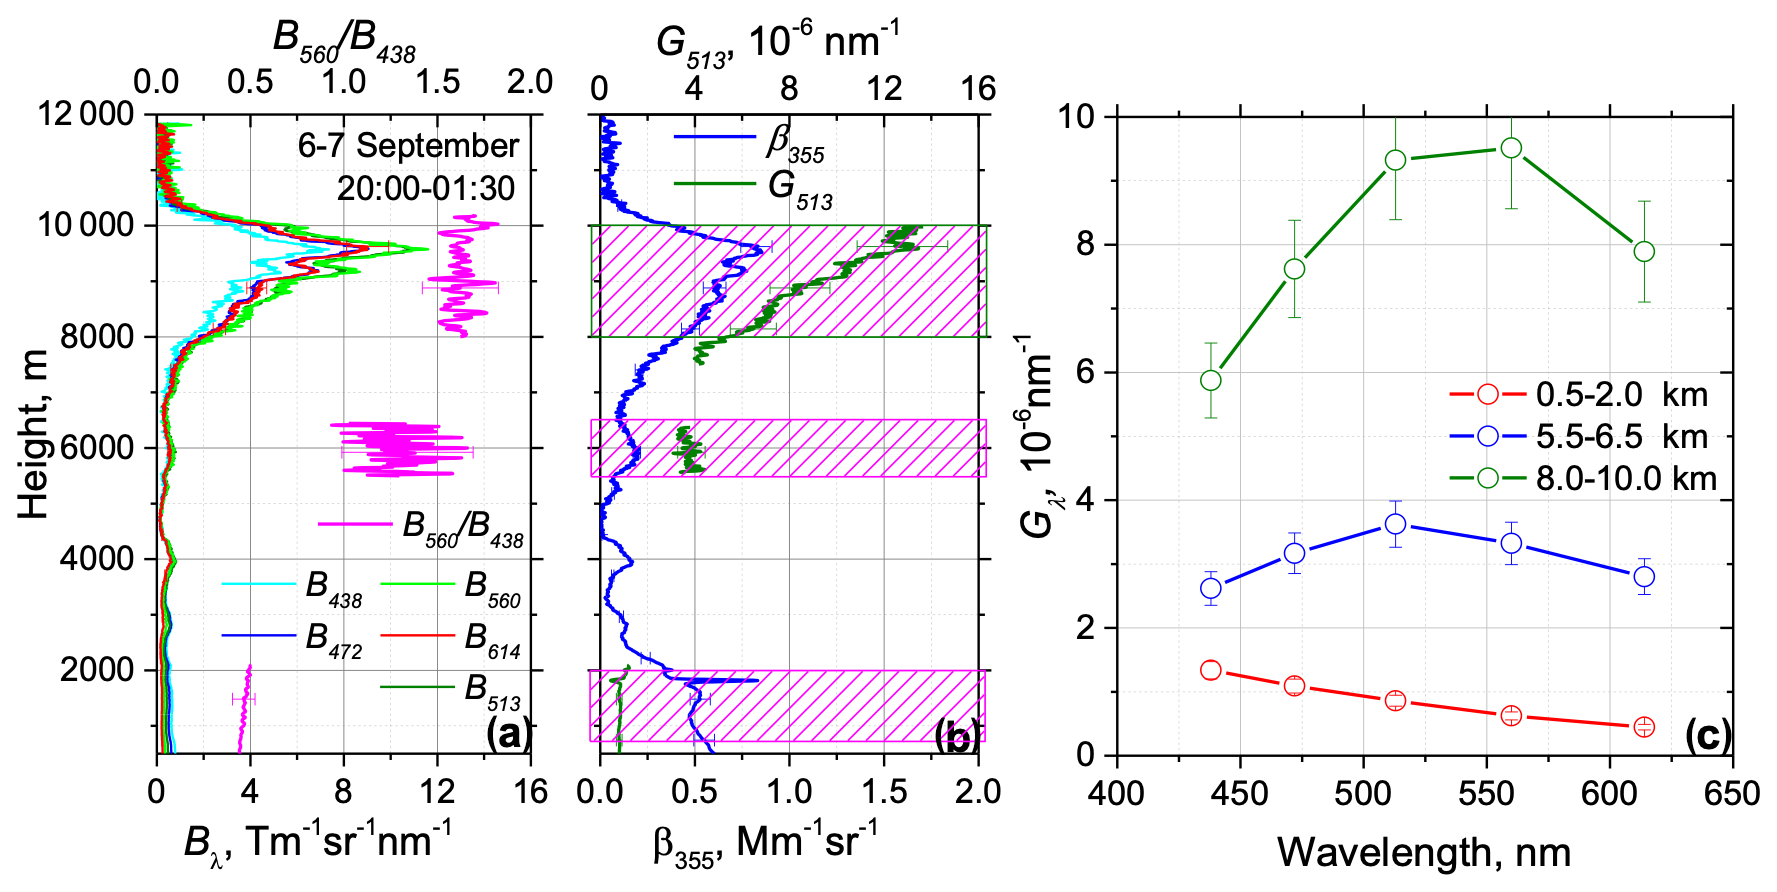
Figure 2Vertical profiles of (a) the fluorescence backscattering coefficient Bλ at 438, 472, 513, 560 and 614 nm along with the ratio and (b) the aerosol backscattering coefficient β355 alongside the fluorescence capacity G513. (c) Spectra of the fluorescence capacity Gλ within three height ranges, which are marked in plot (b) by magenta boxes. Results are presented for the temporal interval from 20:00 to 01:30 UTC on the night of 6–7 September 2023.
The spectral dependence of the fluorescence capacity for three height intervals is depicted in Fig. 2c. Within the PBL, the fluorescence capacity of urban aerosol gradually decreases with wavelength. The second interval (5.5–6.5 km) encompasses a weak smoke layer in the LFT. The fluorescence capacity within this layer increases for all wavelengths, with a noticeable maximum shifting to the 513 nm channel. The third interval (8–10 km) corresponds to the smoke layer in the MUT. Here, the maximum fluorescence shifts to the 560 nm channel, and the fluorescence capacity at 560 nm increases by approximately a factor of 3 compared to the LFT. The shift and increase in fluorescence capacity highlight the changes in the chemical composition and concentration of organic compounds as the smoke ascends to higher altitudes.
From the spectra in Fig. 2c, it is evident that urban aerosol and smoke can be efficiently separated by the fluorescence capacity. The most efficient separation occurs in the 513 and 560 nm channels. The fluorescence spectra also offer a distinctive way to differentiate between smoke and urban aerosols. The ratio of the fluorescence capacities, such as , is particularly useful for distinguishing these two aerosol types. As depicted in Fig. 2a, this ratio is approximately 0.4 within the PBL, indicating a dominance of urban aerosol. It increases to about 1.6 within the smoke layer in the MUT. It is important that this ratio is not influenced by the particle hygroscopic growth (Veselovskii et al., 2023).
As discussed in Sect. 2, the smoke volume and mass concentrations can be estimated from the aerosol backscattering coefficient using the conversion factors. The mean value of β355 within the 8–10 km interval is 0.62 . Thus, the volume and mass concentrations within the MUT layer are estimated to be 2.4 ± 0.6 µm3 cm−3 and 2.7 ± 0.7 µg m−3 respectively.
For comparison, Fig. 3 shows the results of smoke observations in the LFT on 16 June 2023. During this period, a strong smoke layer with a fluorescence backscattering coefficient B513 reaching up to 5 extends from 5.0 to 8.5 km throughout the night. The vertical profiles are depicted in Fig. 4, highlighting the same particle properties as in Fig. 2. Within the PBL the fluorescence capacity G513 is similar to the values observed on 6–7 September, about nm−1. Within the smoke layer, G513 increases up to nm−1. However, unlike the results in Fig. 2b, G513 does not show significant height variations, suggesting that the smoke composition within the layer remains consistent.
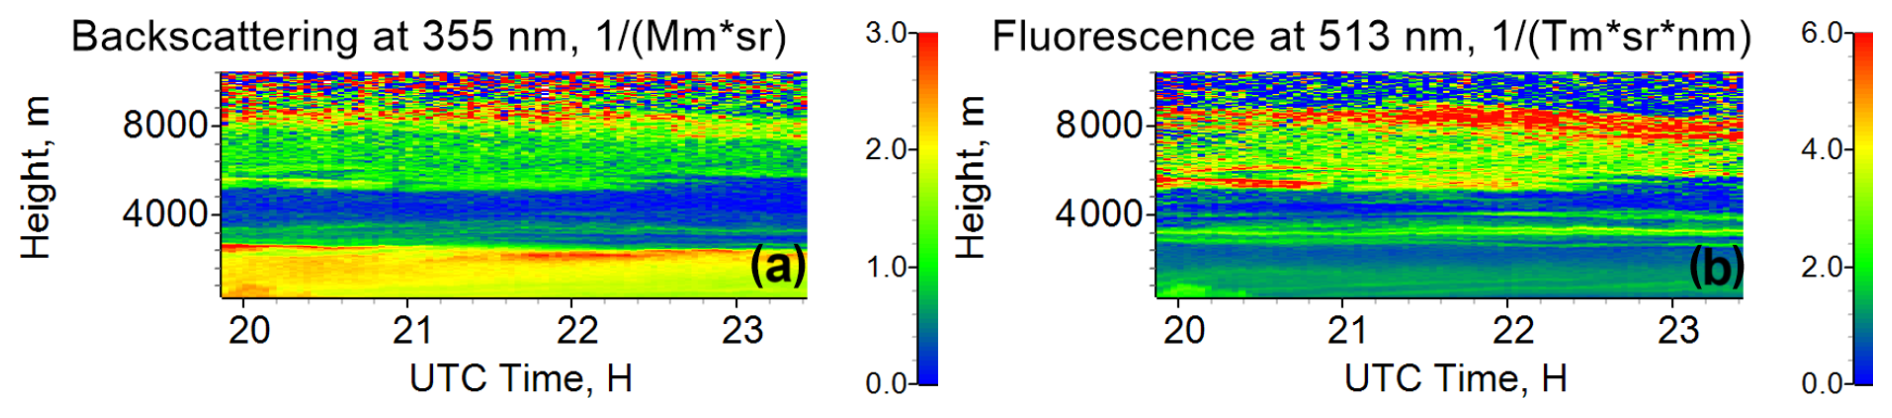
Figure 3Spatiotemporal distributions of (a) the aerosol backscattering coefficient β355 and (b) the fluorescence backscattering coefficient B513 during the night of 16 June 2023.
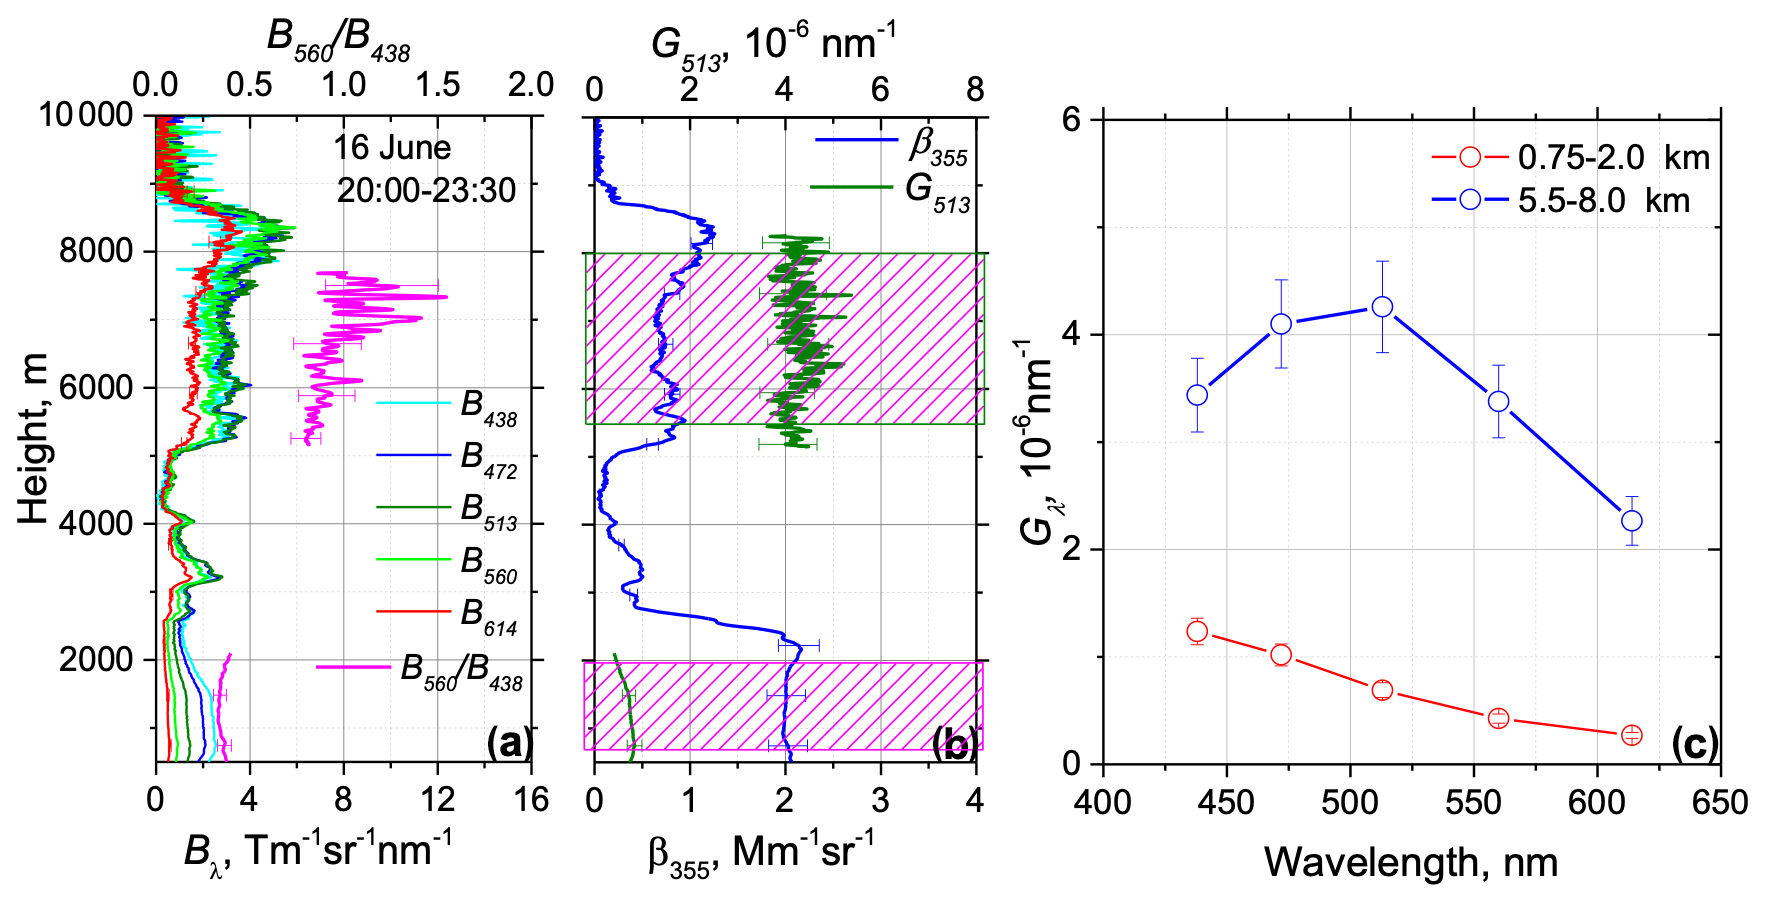
Figure 4Vertical profiles of (a) the fluorescence backscattering coefficient Bλ at 438, 472, 513, 560 and 614 nm along with the ratio and (b) the aerosol backscattering coefficient β355 alongside the fluorescence capacity G513. (c) Spectra of the fluorescence capacity Gλ within two height ranges, which are marked in plot (b) by magenta boxes. Results are presented for the temporal interval from 20:00 to 23:30 UTC on 16 June 2023.
From the results presented in this section, we conclude that the fluorescence capacity of smoke at the MUT is higher than at the LFT, and the maxima of fluorescence shifts from the 513 nm channel to the 560 nm channel. Additionally, smoke and urban aerosol exhibit distinctly different spectral dependencies of Gλ. To corroborate these conclusions, we conducted an analysis of numerous smoke episodes. The corresponding results are presented in the next section.
3.2 Smoke observations during the May–September 2023 period over Moscow
Smoke transported over the Atlantic was regularly observed over Moscow during May–September 2023 within both the LFT and MUT. The results of these smoke measurements are summarized in Fig. 5, which displays the height of the smoke layer's center, Hsm, along with the smoke backscattering coefficient, β355, and the fluorescence capacities G513 and G560 averaged over the layer. The values observed within the LFT and the MUT are represented by open and solid symbols respectively. The highest smoke backscattering coefficient in the MUT, β355=3.2 , was observed on 20 June at a height of 10.5 km, with the corresponding smoke mass concentration in the layer estimated to be 14 µg m−3.
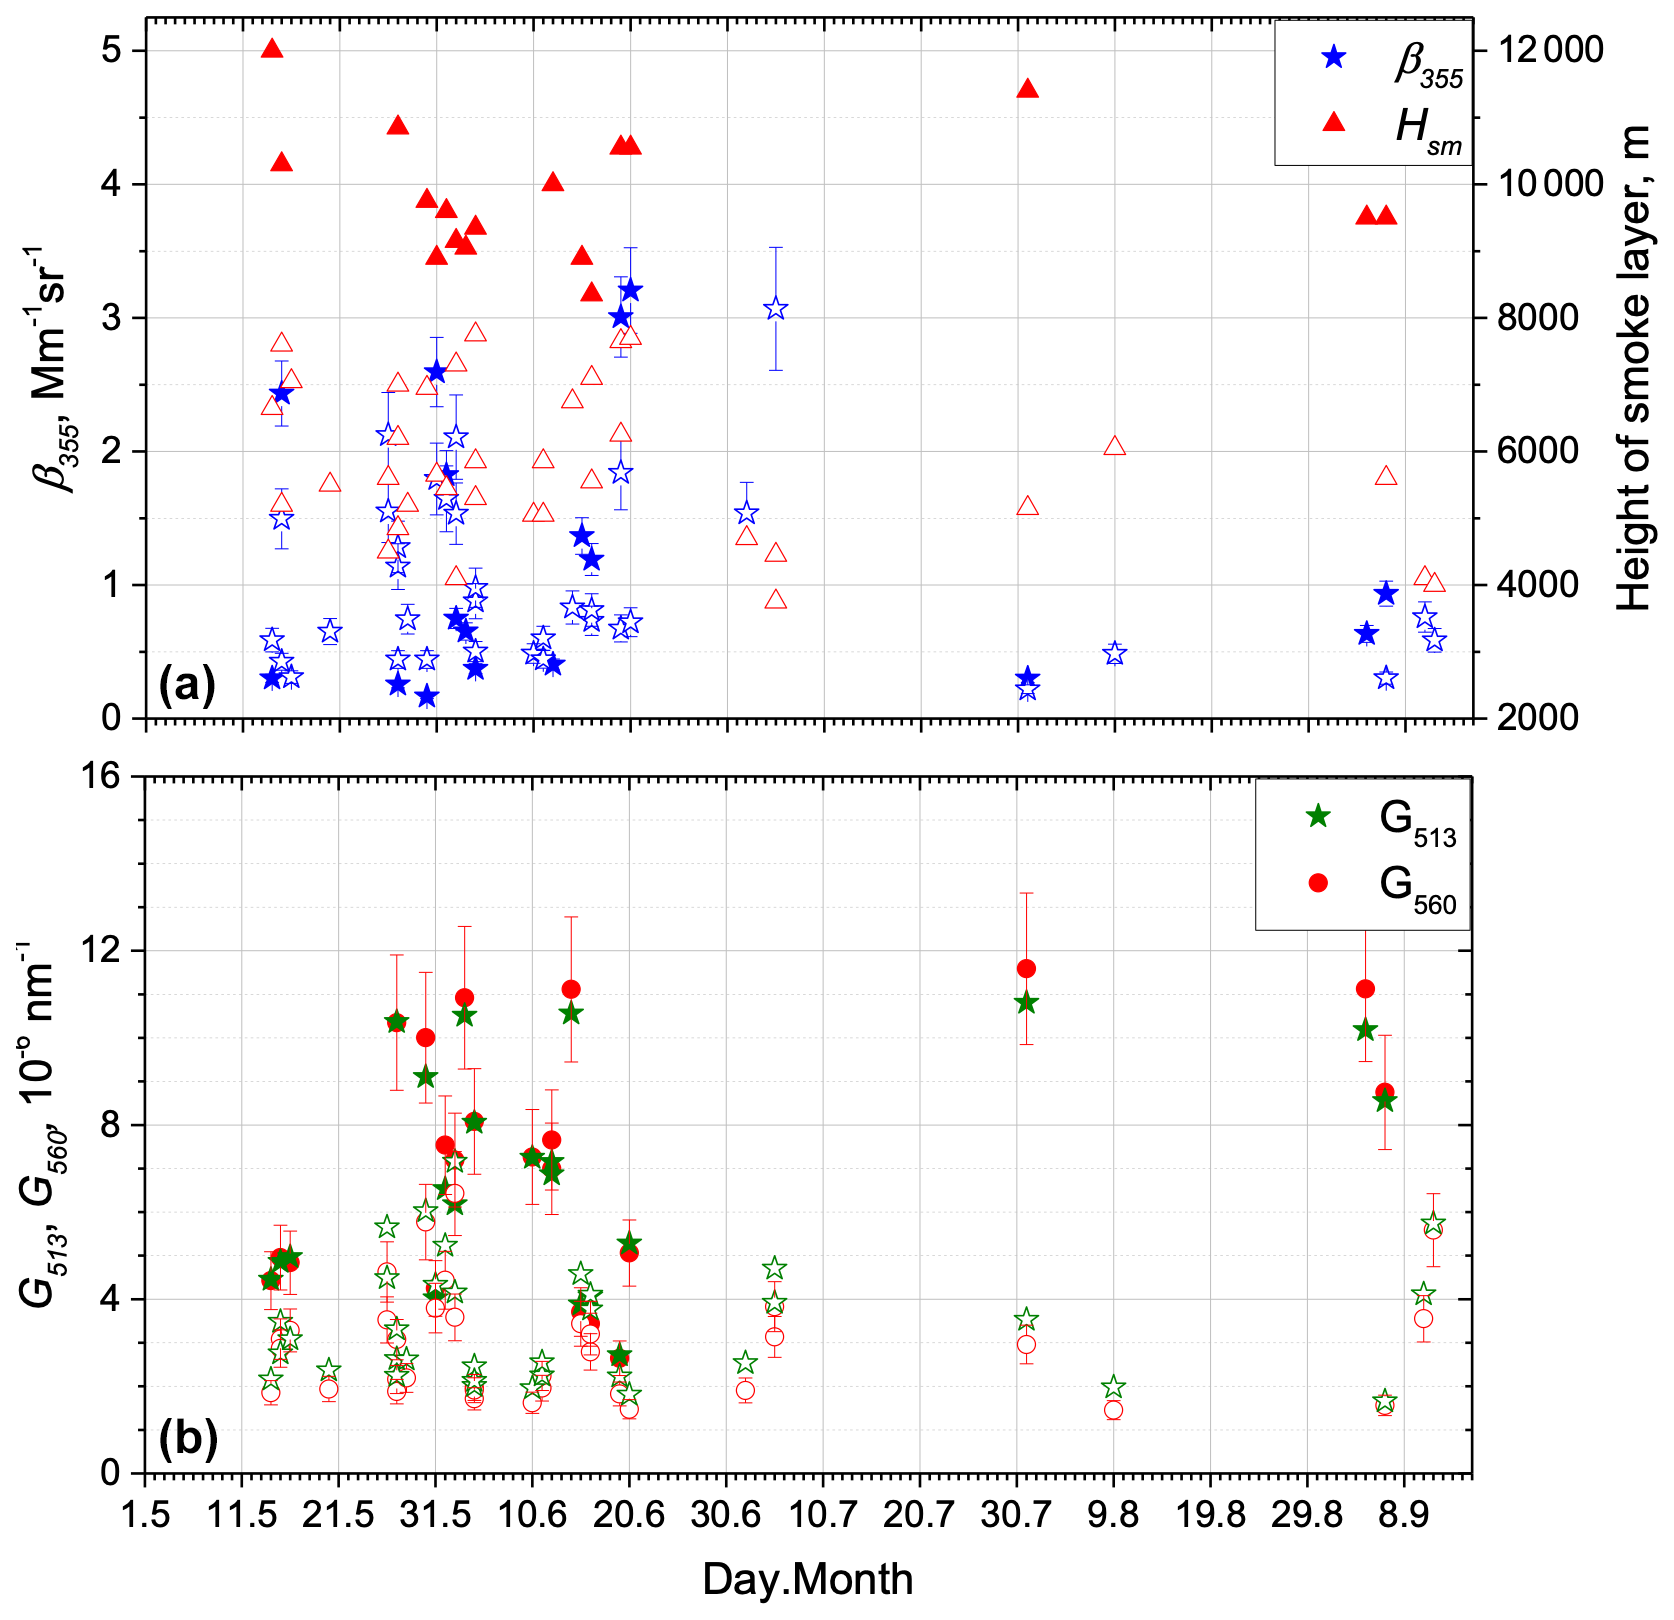
Figure 5Smoke layers in the LFT (open symbols) and MUT (solid symbols) over Moscow during May–September 2023. (a) The height of the center of the smoke layer, Hsm, and the mean aerosol backscattering coefficient, β355, within the layer. (b) The fluorescence capacities G513 and G560 of smoke.
Figure 5b shows that the fluorescence capacities G513 and G560 are generally higher in the MUT than in the LFT. Additionally, G560 typically exceeds G513 in the MUT. The height dependence of fluorescence capacity may indicate an increase in the organic carbon fraction with altitude, potentially reflecting differences in the chemical aging and transport processes of smoke in the lower versus upper troposphere. Another important observation is that the fluorescence capacity exhibits a wide range of values. Specifically, for G560 in the MUT this range is between 2.5 and 11.0 × 10⁻⁶ nm−1. The variations are likely related to changes in the relative concentration and chemical properties of organic compounds.
To analyze the height dependence of the smoke-fluorescence-related properties, Fig. 6 provides the fluorescence capacity G560 and the ratio for the smoke episodes observed in 2023 as a function of height. The data reveal that while the fluorescence capacity does not exhibit a clear trend within the LFT, it increases above 8 km. Despite considerable variability in the data points, the mean value of G560 at the MUT is 2.7 times higher than in the LFT. Additionally, the mean ratio is 0.85 in the LFT and 1.03 in the MUT, indicating a tendency for the fluorescence maximum to shift toward the 560 nm channel with height.
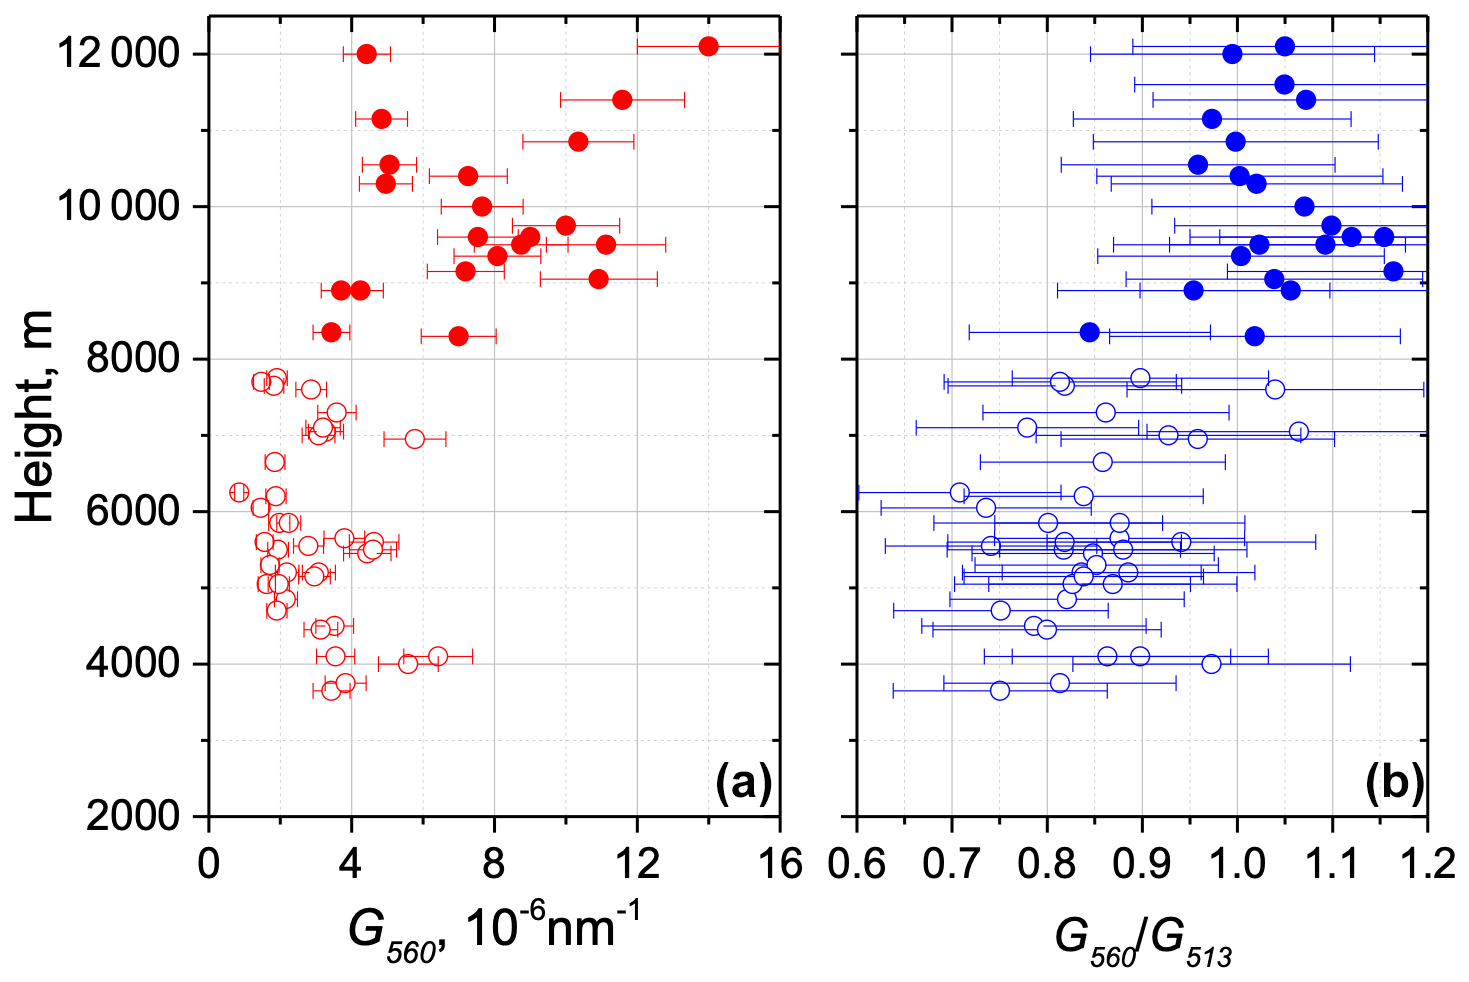
Figure 6Height dependence of (a) the fluorescence capacity G560 and (b) the ratio for the smoke episodes in 2023. Open and solid symbols correspond to the layers at the LFT and MUT respectively.
The systematic difference between the fluorescence spectra of urban particles and smoke was consistently observed during the wildfire season. Figure 7 shows the spectra of Bλ and Gλ recorded in 2023. The data are presented for three height intervals, in the PBL, the LFT and the MUT. To compare the “shape” of the fluorescence spectra for different days, Bλ values are normalized to the sum .
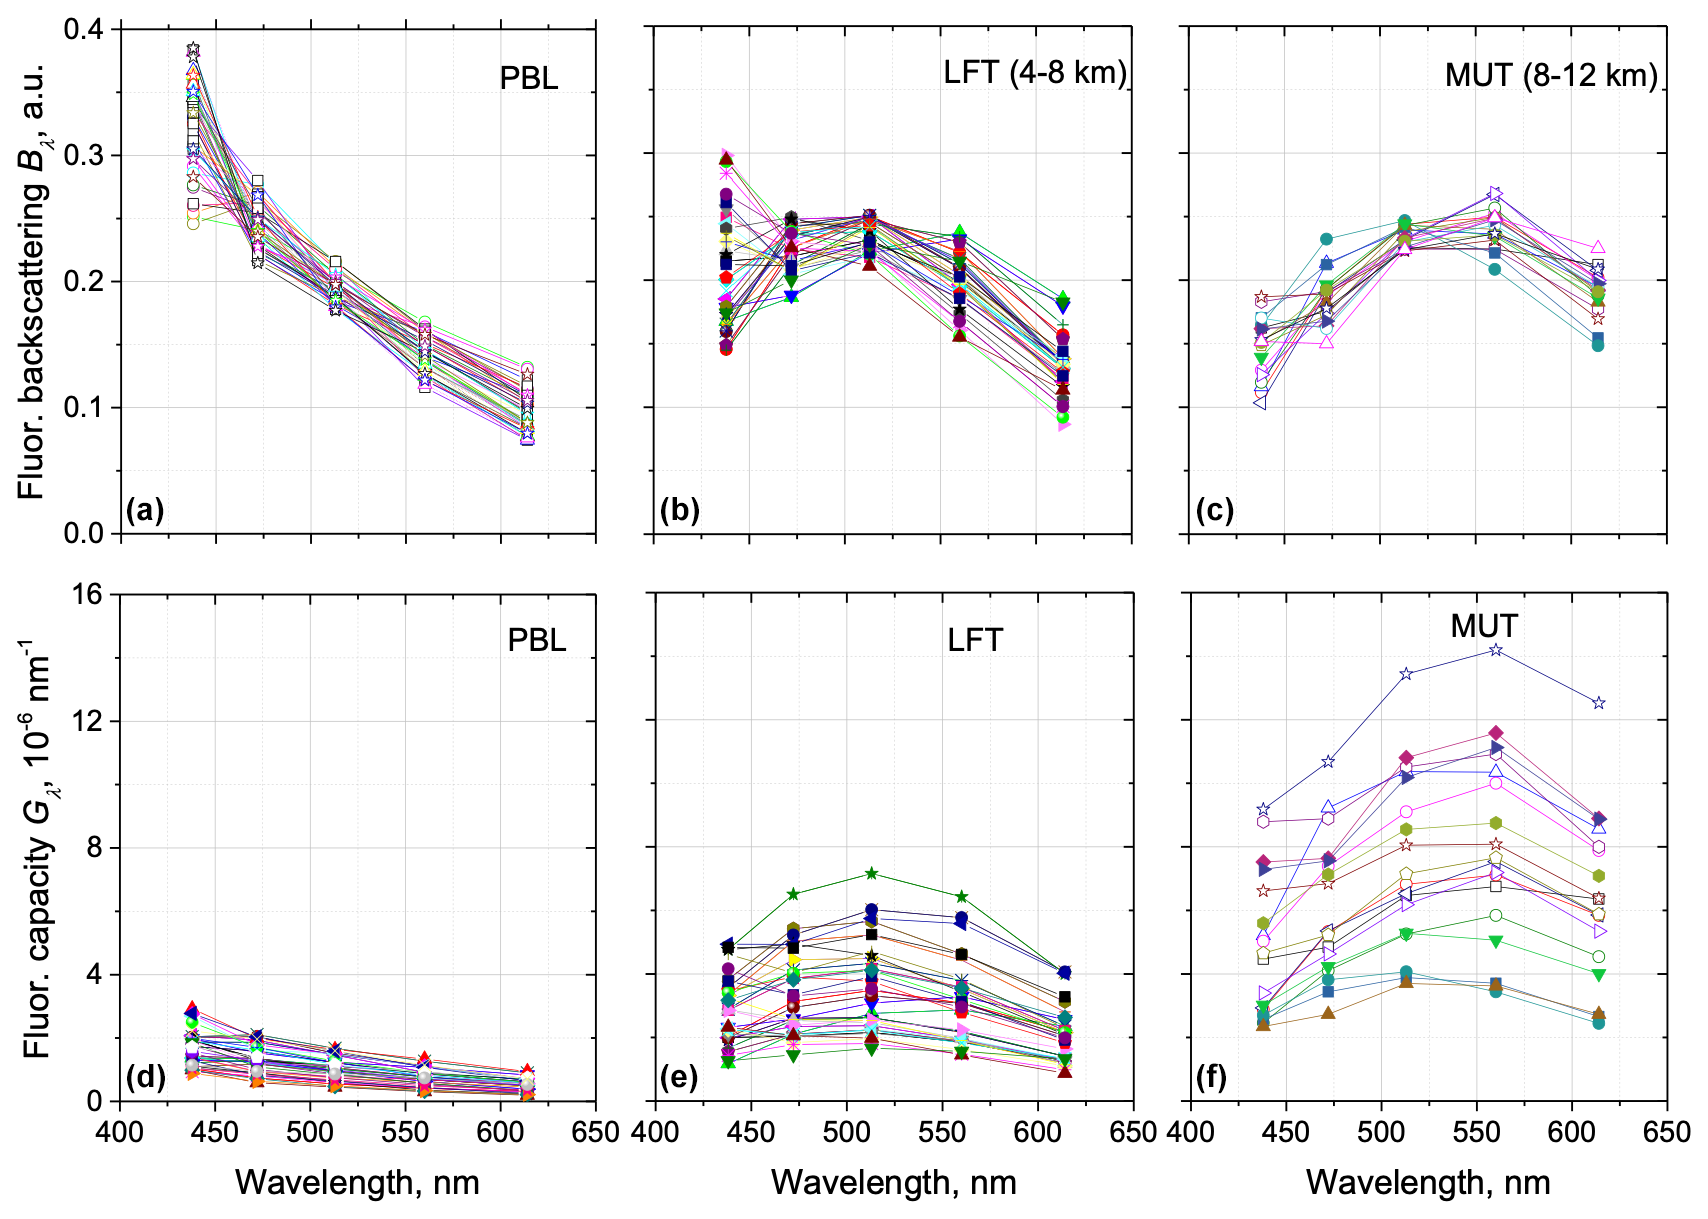
Figure 7Spectra of (a–c) the fluorescence backscattering, Bλ, and (d–f) the fluorescence capacity, Gλ, measured over Moscow during May–September 2023. Results are given for three height intervals: the PBL, LFT (4–8 km) and MUT (8–12 km). The fluorescence backscattering coefficients are normalized to the sum .
Figure 8a depicts the mean values of normalized Bλ along with their standard deviations. Within the PBL, where the urban aerosols prevail, normalized Bλ shows significant deviations from the mean value, particularly around 10 % in the 438 nm channel. Despite these deviations, all measurement sessions reveal that the fluorescence backscattering within the PBL gradually decreases with wavelength. In the smoke layers at the LFT, the fluorescence backscattering exhibits a maximum in the 513 nm channel. The highest deviations are observed in the 438 nm channel, around 20 %, likely due to the mixing of smoke with urban particles during transport. At the MUT, the fluorescence backscattering peaks in the 560 nm channel, with deviations from the mean value being lower, approximately 15 % in the 438 nm channel.
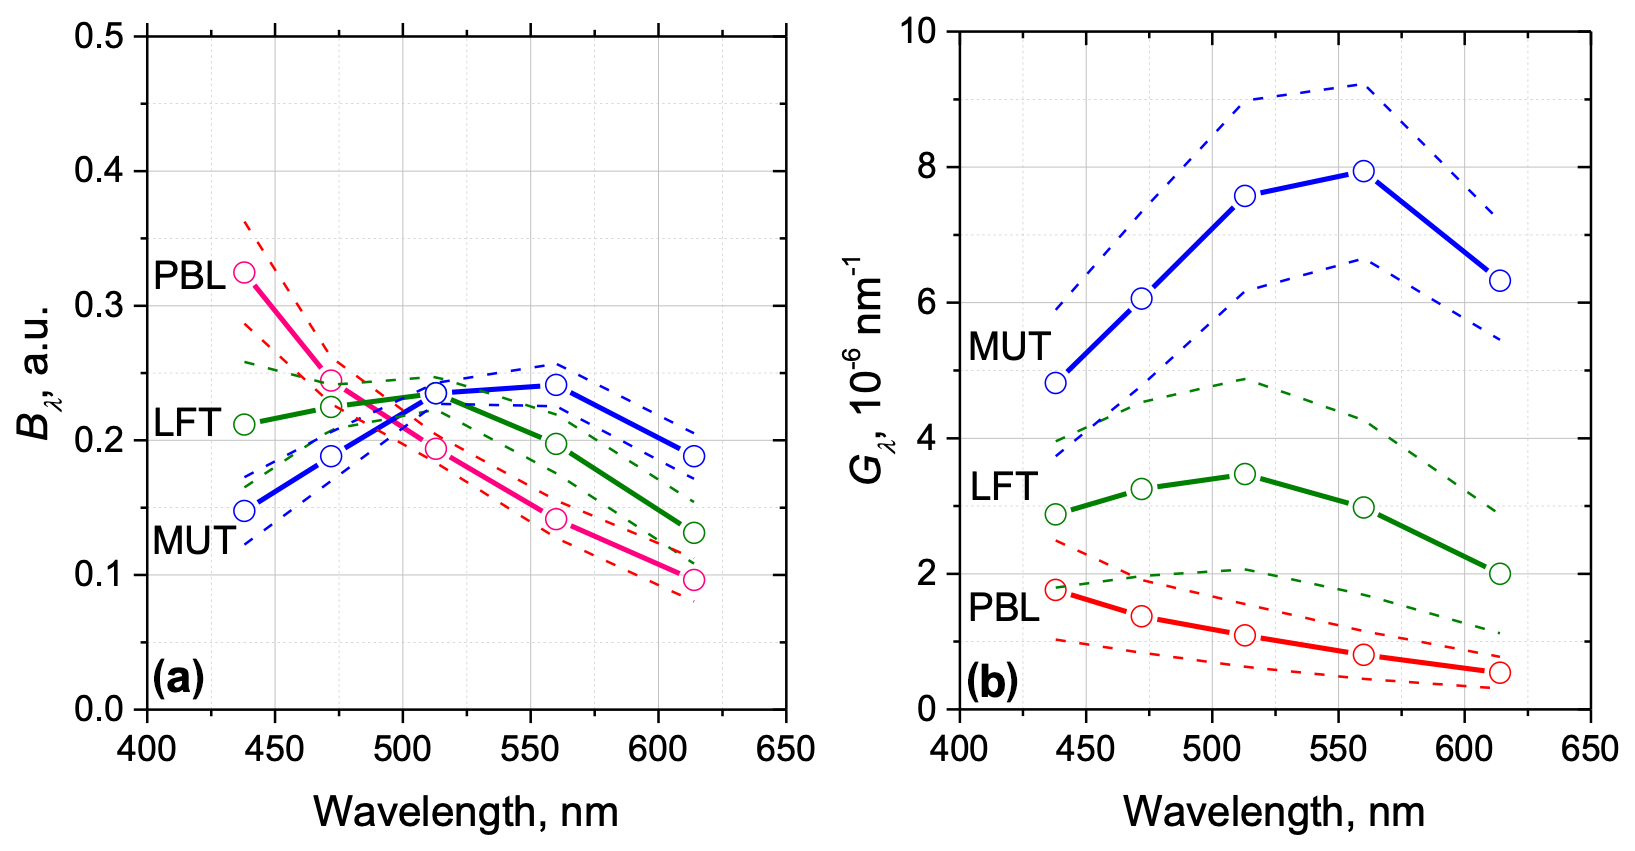
Figure 8Averaged values (solid lines) and standard deviations (dash lines) of (a) the fluorescence backscattering Bλ and (b) the fluorescence capacity Gλ measured over Moscow during May–September 2023. Results are provided for the PBL, LFT and MUT.
The variability in Gλ is notably greater compared to normalized Bλ, as shown in Fig. 7d–f. Variations in Gλ within the PBL could be influenced by the hygroscopic growth of urban aerosol. Additionally, the fluorescence capacity could increase due to the presence of smoke at the PBL. In the LFT, variation in Gλ might be due to mixing with urban aerosol during transport and the mixing with descending smoke layers from the MUT. Even at the MUT, where such mixing effects are minimal, G513 ranges within 4.0 to 13.5 × 10⁻⁶ nm−1. This variability is likely related to changes in the smoke's chemical composition, particularly the organic fraction. Despite these variations, the mean values of fluorescence capacity for all channels, as shown in Fig. 8b, exhibit a clear increase with height. Specifically, G513 is approximately nm−1 in the PBL, nm−1 in the LFT and nm−1 in the MUT.
In Fig. 9, the spectral dependence of the ratio of the mean fluorescence capacity in the LFT to that in the PBL, , is shown. This ratio increases with wavelength, reaching a maximum value of 3.7 in the 560 nm channel. Similarly, the ratio of the mean fluorescence capacity in the MUT to that in the LFT, , also increases with wavelength, with the highest value of 3.2 observed in the 614 nm channel. The observed ratio suggests that the concentration of organic compounds, which have a fluorescence spectrum shifted towards longer wavelengths, is higher in the MUT compared to the LFT.
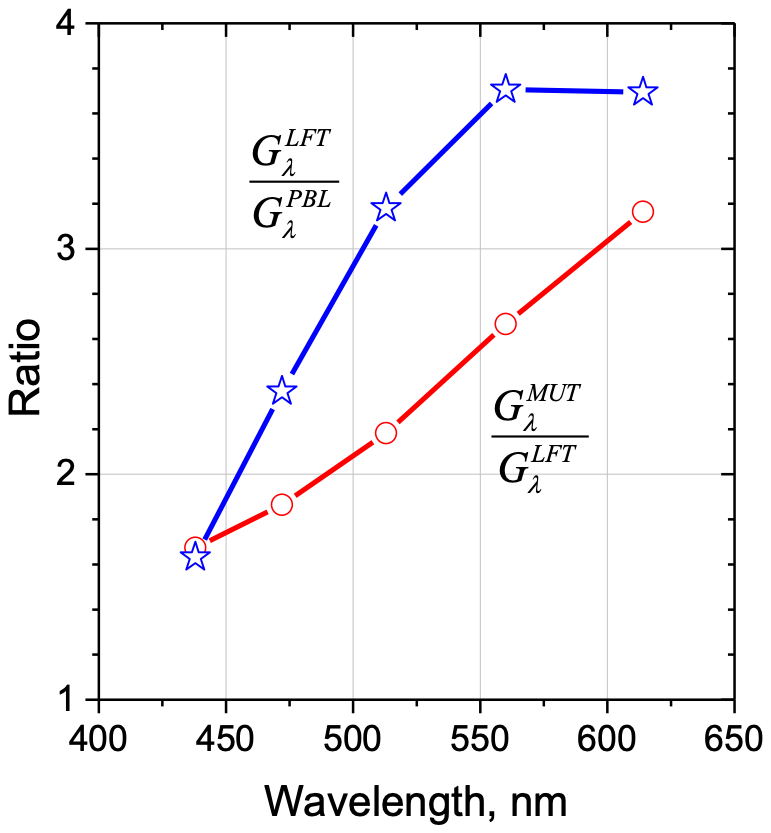
Figure 9The spectral dependence of the ratio of the averaged Gλ from Fig. 8b in the LFT to that in the PBL, , along with the corresponding ratio for the MUT and LFT, .
For the separation of urban and smoke particles, as discussed in Veselovskii et al. (2022b, 2024), a “threshold algorithm” based on fluorescence capacities at 466 nm was used to classify particles as smoke if their fluorescence capacity exceeds a certain threshold. While effective, this approach is sensitive to the range of Gλ variations, which, as follows from Fig. 8, can be considerable. Additionally, the hygroscopic growth of particles reduces fluorescence capacity, potentially impacting classification accuracy. An alternative to this method is the “spectral” approach, which utilizes the distinct fluorescence spectra of smoke and urban particles. This method may offer an advantage, particularly in varying environmental conditions such as changing relative humidity.
The fluorescence spectrum is not influenced by the RH. This is supported by Fig. 10, which displays the aerosol and the fluorescence backscattering coefficients (β355 and Bλ) measured under the conditions of particle hygroscopic growth on 28 May 2024. The RH, as recorded by the radiosonde in Dolgoprudny, increased with height from 40 % at 1000 m to 80 % at 2250 m, accompanied by a corresponding rise in β355. Despite these changes in RH and the presence of hygroscopic growth, the ratio of fluorescence backscattering, such as and (Fig. 10b), remains constant, even within the cloud, indicating that the fluorescence spectrum is not affected by changes in RH.

Figure 10Fluorescence measurements in the presence of aerosol hygroscopic growth on 28 May 2024. (a) Vertical profiles of the fluorescence backscattering coefficient Bλ at the wavelengths 438, 472, 513, 560 and 614 nm along with the aerosol backscattering coefficient β355. (b) Scaled β355 and the ratios and . (c) Profile of the RH measured by a radiosonde on 29 May at 00:00 UTC.
3.3 Distinguishing the fluorescence contributions of smoke and urban particles
Smoke and urban aerosol exhibit distinct spectral dependence for Bλ, and the averaged normalized Bλ shown in Fig. 8a can be taken as the reference spectra. Thus, if smoke and urban particles are predominant components of an aerosol mixture, the observed fluorescence spectrum can be approximated as a combination of their contributions ( and ).
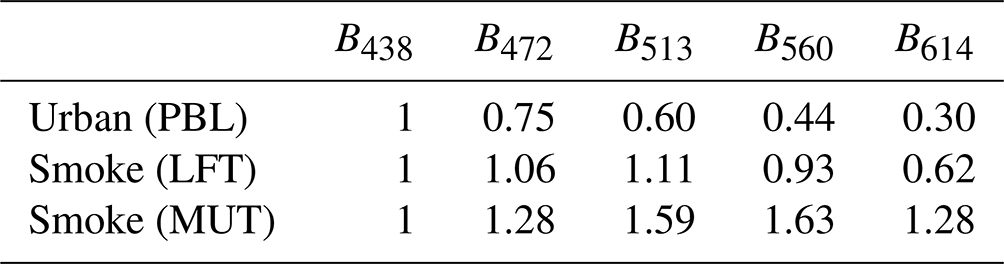
Here and are the reference fluorescence spectra of urban particles and smoke respectively. Given the five fluorescence channels, the system (Eq. 6) contains five equations with two unknowns. This system was solved by the least squares method to derive coefficients a and b. For the urban particles, the fluorescence spectrum within the PBL in Fig. 8a was used as a reference. For smoke, two reference spectra were considered, one for the LFT and the other for the MUT. The values for the reference spectra are summarized in Table 1. With these values, the derived and can be recalculated from one wavelength to another. Additionally, from Table 1 one can conclude that the ratio is a convenient parameter for distinguishing between smoke and urban particles. For the reference spectra this ratio is 0.44 for the urban aerosol in the PBL and 0.93 and 1.63 for smoke in the LFT and MUT respectively.
Table 1The reference spectra of the fluorescence backscattering coefficient for urban aerosol in the PBL and for smoke in the LFT and in MUT. The Bλ values are normalized to B438.
During the wildfire season of 2023, numerous episodes were observed where tropospheric smoke descended to the PBL and mixed with urban aerosol. Below, we apply the spectral approach to analyze such an episode on 25–26 September.
On the night of 25–26 September 2023, the air masses above 2000 m over the observation site were transported across the Atlantic from the regions affected by North American wildfires, as indicated by the HYSPLIT backward trajectory analysis (Stein et al., 2015) shown in Fig. 11. The spatiotemporal distributions of key aerosol parameters, such as the aerosol and fluorescence backscattering coefficients (β355 and B513), fluorescence capacity (G513), and the ratio , are depicted in Fig. 12. These parameters help to distinguish between two different aerosol layers. In the first layer, extending from the surface to approximately 1500 m altitude, the fluorescence capacity G513 is low (about nm−1), and the ratio is approximately 0.4. Both these characteristics indicate that the aerosol in this layer is of urban origin. Above 1500 m both the fluorescence capacity and the ratio increase, with G513 exceeding nm−1 and reaching about 1.6. These characteristics suggest the predominance of smoke particles. The radiosonde measurements reveal a temperature inversion at 1500 m, indicating that the lower layer is the PBL, while the smoke is located at its top.
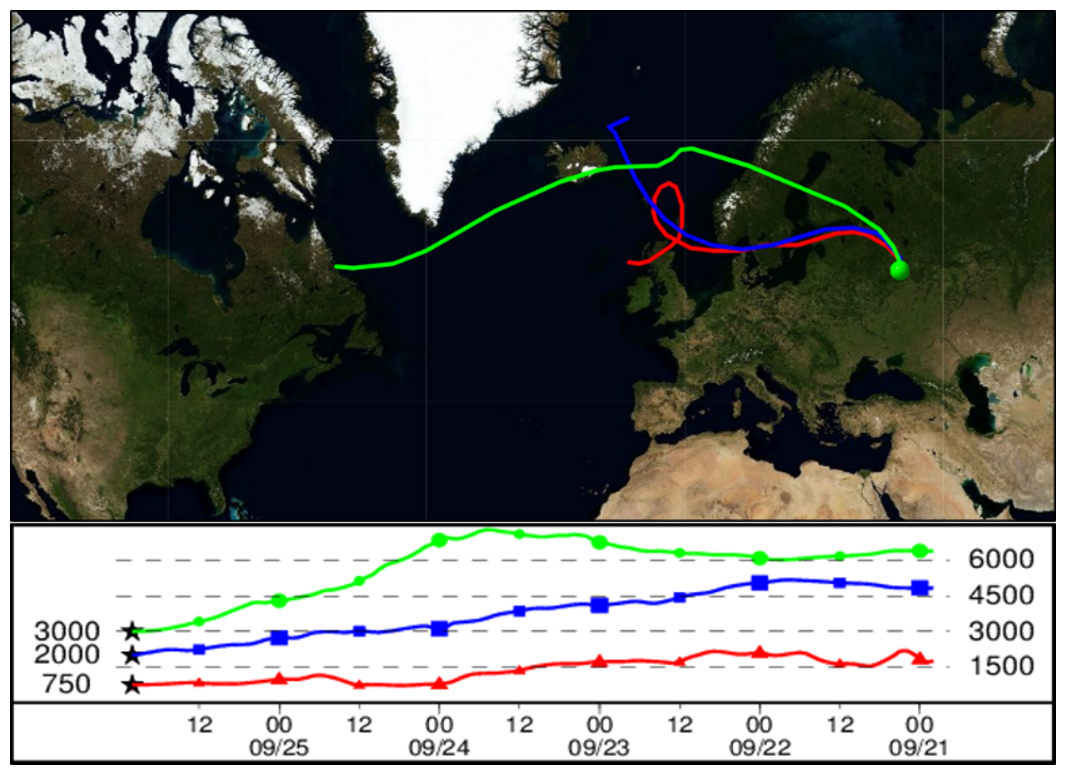
Figure 11The HYSPLIT 5 d backward trajectories for the air mass over Moscow at altitudes 750, 2000 and 3000 m on 25 September 2023 at 22:00 UTC.
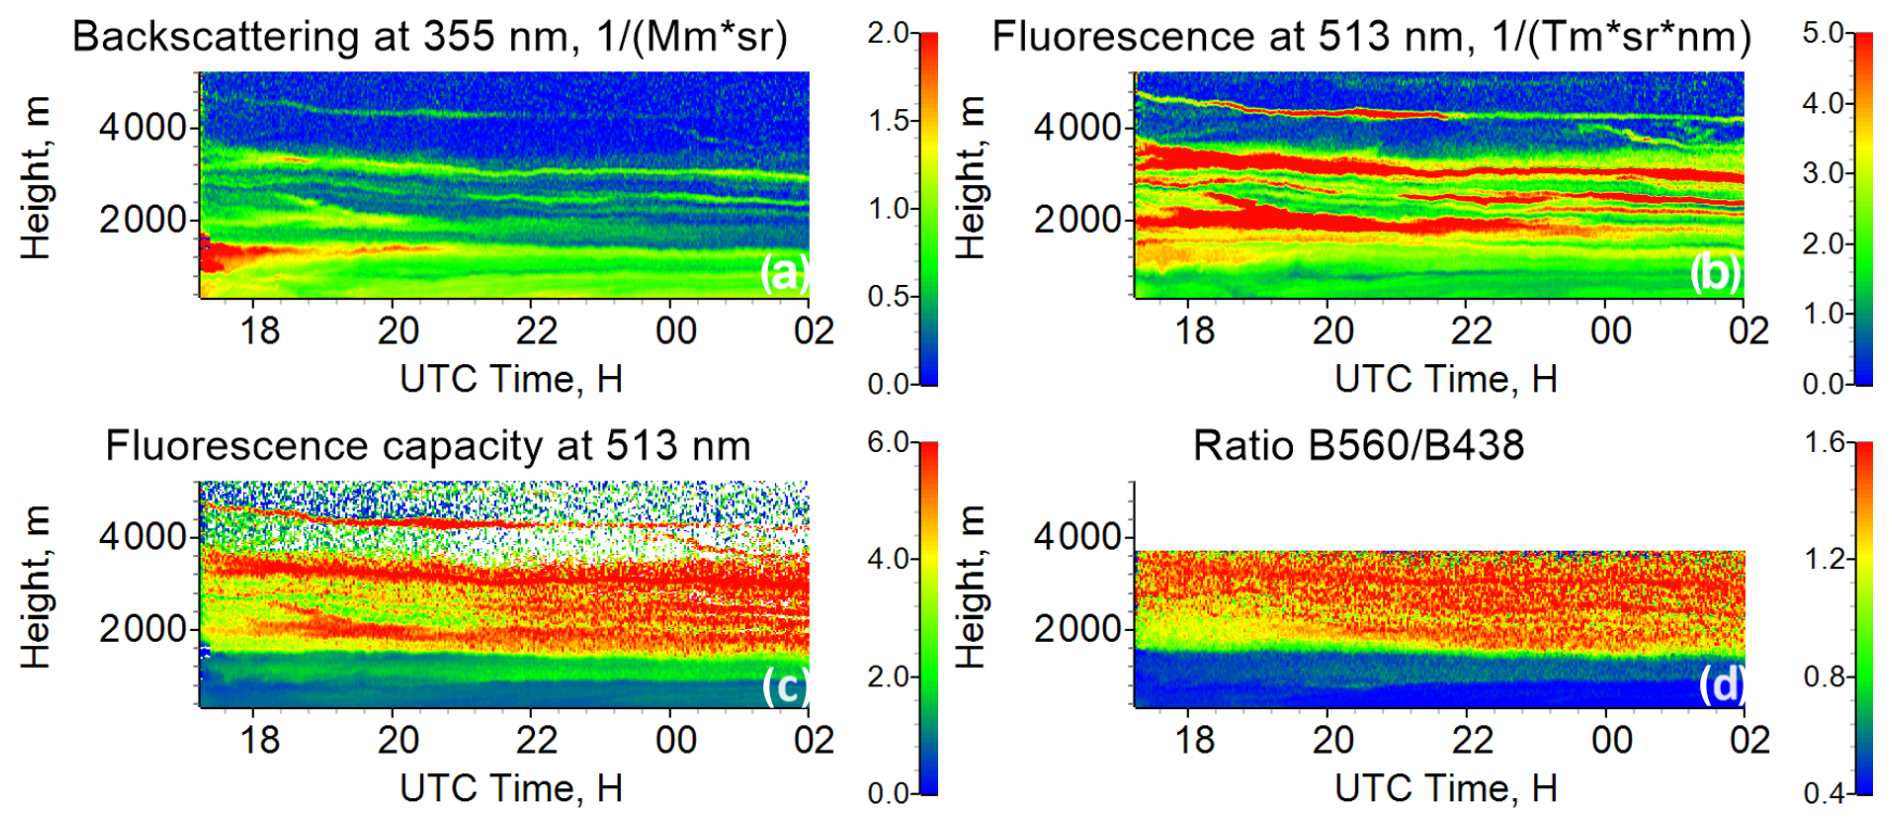
Figure 12Spatiotemporal distributions of (a) the aerosol backscattering coefficient β355, (b) the fluorescence backscattering coefficient B513, (c) the fluorescence capacity G513 (in 10−6 nm−1) and (d) the ratio during the night of 25–26 September 2023.
The spectral approach described was applied to this case to distinguish the smoke and urban contributions to the overall fluorescence backscattering coefficient. The spatiotemporal distributions of and obtained for LFT reference spectra are shown in Fig. 13. Smoke and urban particles are well separated, with their mixing occurring only within a relatively thin layer (several hundred meters). Vertical profiles of particle parameters averaged over the interval from 17:15 to 02:15 UTC are displayed in Fig. 14. The aerosol backscattering coefficient β355 is the strongest within the PBL, while β355 within the smoke layer (above 1500 m) is approximately a factor of 2 lower. The ratio rises with height from 0.4 to 1.6 due to an increase in the smoke contribution to the overall fluorescence backscattering. The profiles of and are depicted in Fig. 14b. Below 1000 m, urban particles dominate, while smoke becomes prevalent above 1600 m. Within the 1000–1600 m range, the particles are mixed, resulting in a change in the fluorescence spectrum with height. To understand the sensitivity of the results to the choice of the reference spectrum, calculations of and in Fig. 14b were performed using the smoke reference spectrum for the LFT (solid lines) and for the MUT (dashed lines). The results obtained are similar, with the maximum difference between obtained with these two reference spectra occurring at 2000 m, where it is below 25 %.
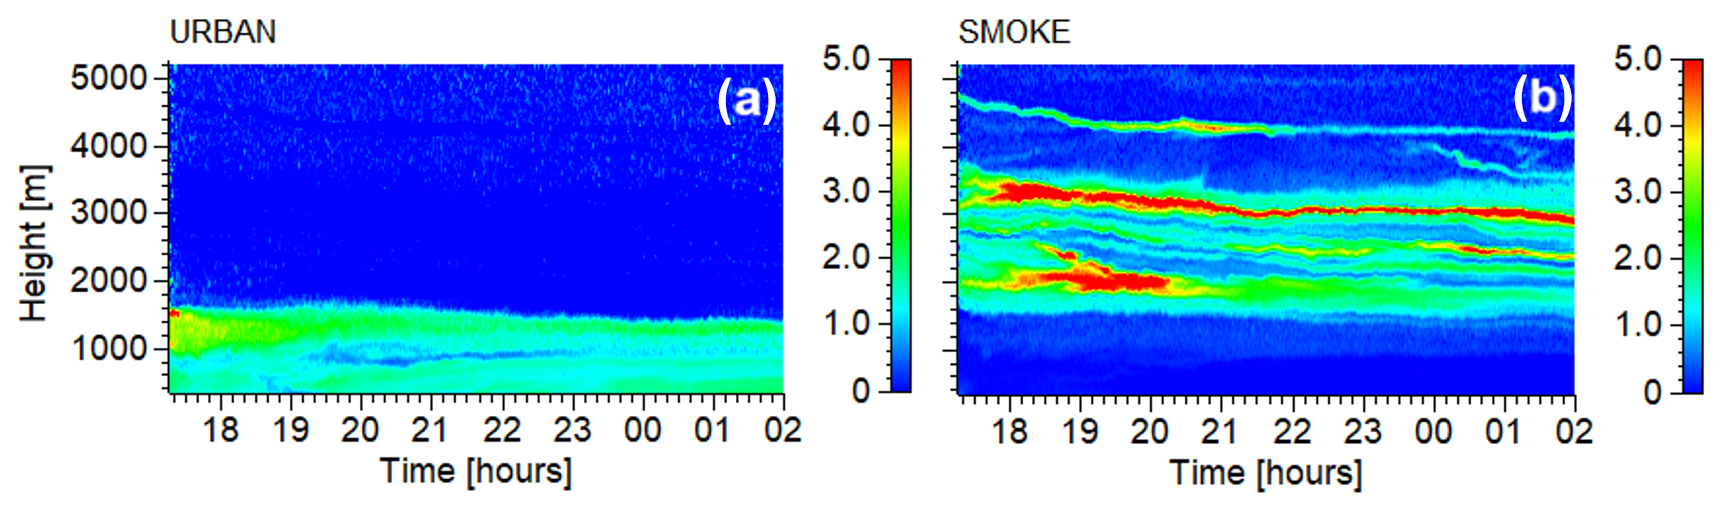
Figure 13The fluorescence backscattering coefficient (in ) at 438 nm attributed to (a) urban particles and (b) smoke on 25–26 September 2023. The computations were performed using the smoke reference fluorescence spectrum in the LFT.
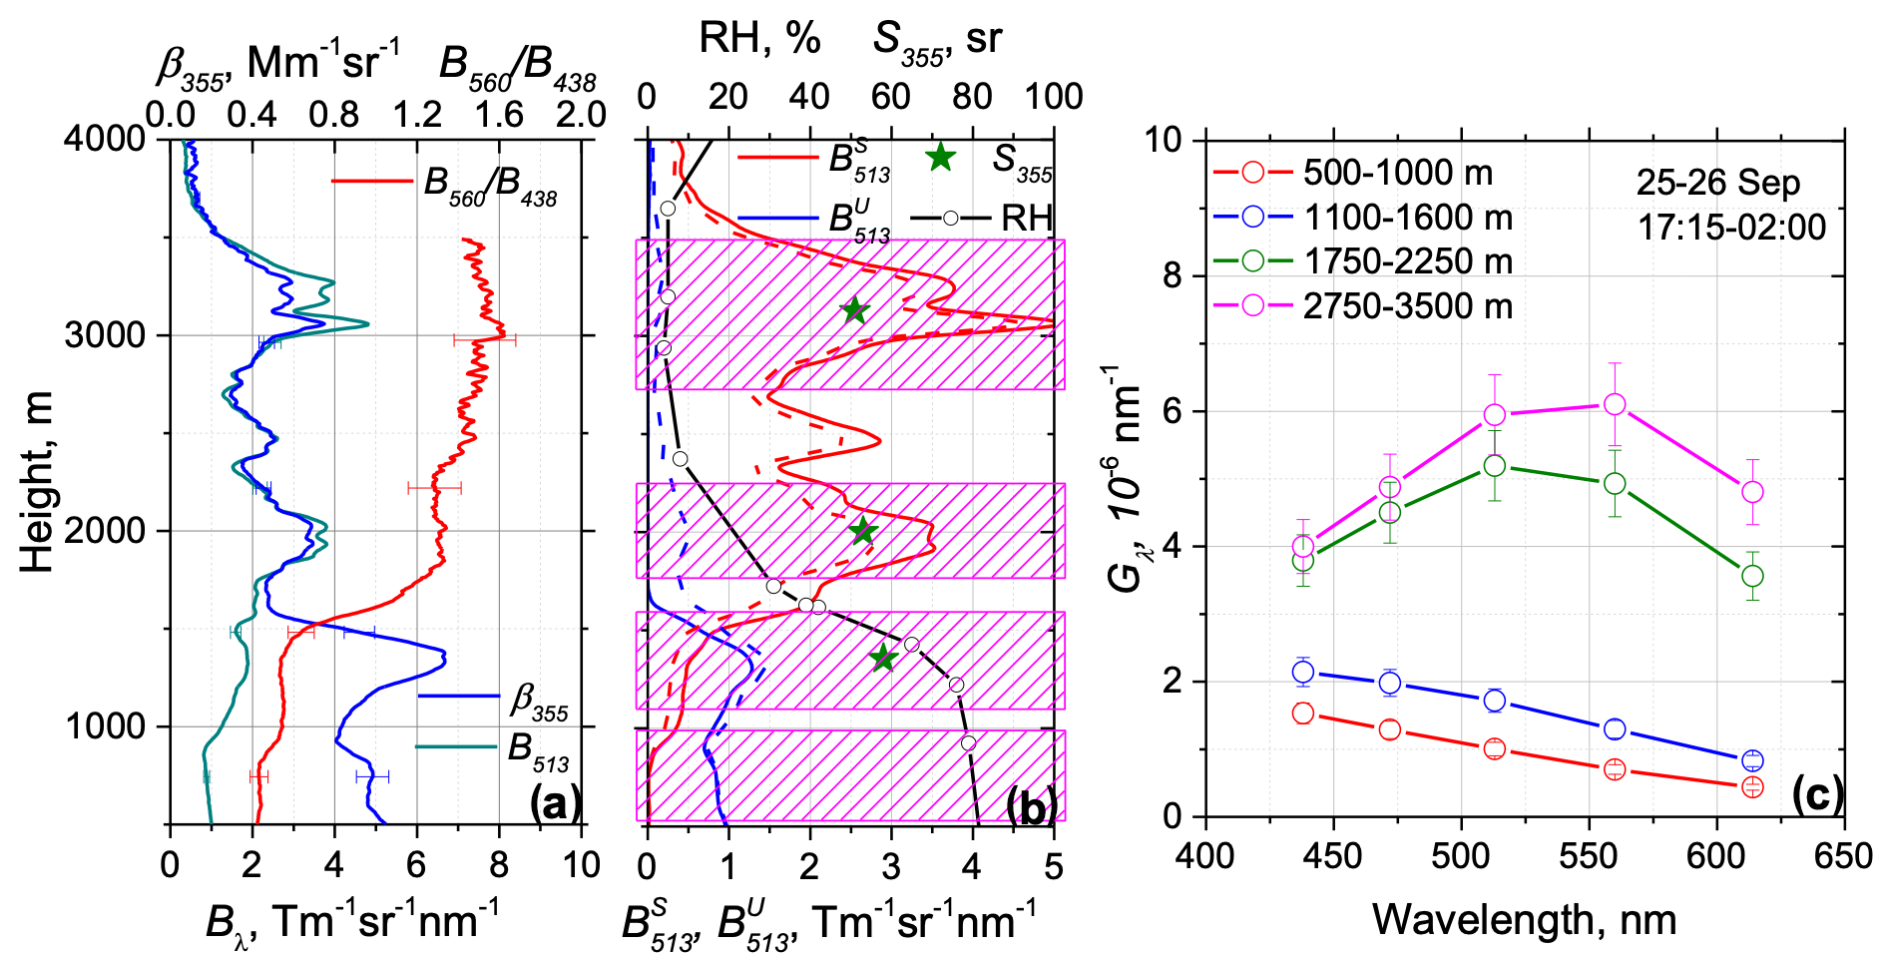
Figure 14(a) Vertical profiles of the aerosol and fluorescence backscattering coefficients (β355, B513), along with the ratio . (b) Contribution of smoke, , and urban, , particles to the overall fluorescence backscattering coefficient, B513, alongside the relative humidity measured by a radiosonde and averaged lidar ratios, S355. and were calculated using the reference spectra for smoke in the LFT (solid lines) and MUT (dashed lines). (c) Spectra of the fluorescence capacity, Gλ, within four height ranges. These ranges are highlighted in plot (b) with magenta boxes.
Figure 14b also provides the averaged lidar ratios at 355 nm, S355, within the highlighted ranges. The values of S355 for two height intervals within the smoke layer are about 50 sr, which agrees with the range of S355 variation of 35–50 sr reported by Ansmann et al. (2021) and with the range of 25–50 sr reported by Hu et al. (2022) for aged North American smoke. Within the 1100–1600 m layer, S355 is higher (about 60 sr) due to the presence of urban particles.
The spectra of the fluorescence capacity for four height ranges are depicted in Fig. 14c. Below 1000 m, the spectrum exhibits characteristics typical of urban particles: Gλ decreases with wavelength, and G513 is about nm−1, which is close to the corresponding value in Fig. 8b. Within the 1100–1600 m height range, G513 increases up to nm−1 due to the presence of smoke. The maximum of the fluorescence spectrum of smoke within the 1750–2250 m layer occurs in the 513 nm channel, and for the 2750–3500 m range, this maximum shifts to 560 nm. The value of G513 is high (up to nm−1), indicating that the layer at 3000 m may contain the smoke that descended from the upper troposphere, which agrees with the results of the backwards trajectory analysis in Fig. 11.
To test how well the calculated spectrum of the fluorescence backscattering () matches the observations (Bλ), Fig. 15 depicts the corresponding spectra for the 1400–1600 m height interval, where urban particles are mixed with smoke. Computations were performed using the smoke reference spectra for the LFT and the MUT. The spectrum for the LFT provides a better match to observations, suggesting that its use is probably more appropriate.
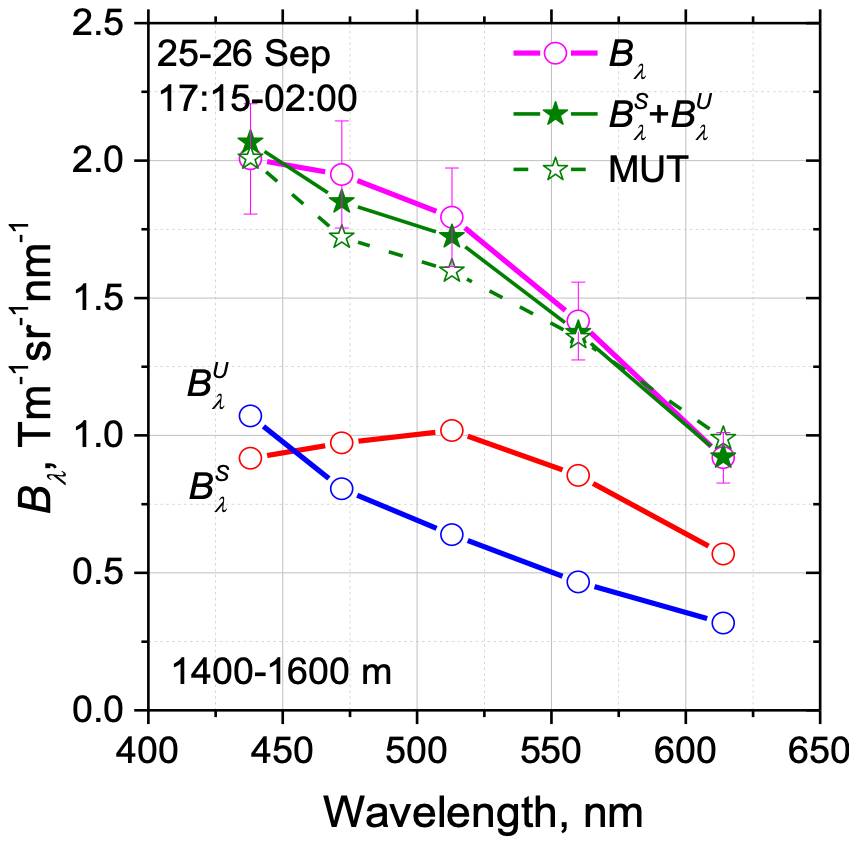
Figure 15The spectrum of the fluorescence backscattering coefficient, Bλ, within the 1400–1600 m interval along with the contributions of smoke, ; urban aerosol, ; and their sum, . The computations were performed using the smoke reference fluorescence spectra in the LFT (solid line) and in the MUT (dashed line).
As discussed in Sect. 2, the smoke mass concentration within the PBL can be estimated if the smoke contribution to the total aerosol backscattering β355 is known. This contribution can be calculated as . Assuming that the fluorescence capacity of smoke remains constant within the 500–2000 m interval, we can use the value at 2000 m nm−1. Within the 1400–1600 m height interval, , as follows from Fig. 15, and the smoke contribution to the aerosol backscattering coefficient is .
An estimation of can also be made based on the fluorescence capacity of smoke and urban aerosol. The fluorescence capacity of urban aerosol at 800 m, where smoke contribution can be neglected, is nm−1. Using Eq. (5) and the values β355=0.84 and G513=1.9 within the 1400–1600 m interval, we obtain . Thus, the results obtained with the two different approaches are fairly consistent. Finally, the mass concentration of smoke in the aerosol mixture, within 1400–1600 m height range, is estimated to be 0.8 µg m−3.
Regular observations conducted during the wildfire season using the five-channel fluorescence lidar enabled the detection of spectral variations in fluorescence capacity across a wide range of altitudes, from the planetary boundary layer (PBL) to the upper troposphere. From the results obtained we can conclude that the fluorescence capacity of smoke varies significantly from episode to episode. Notably, in the MUT, where Gλ is not influenced by urban aerosol, the G560 varies within the range of 4–14 × 10−6 nm−1. This variability suggests substantial differences in the composition of the smoke observed during different episodes. In contrast, the shape of the fluorescence spectrum, represented by the normalized fluorescence backscattering coefficient, does not exhibit such strong variations. Given that the primary contribution to fluorescence comes from the organic fraction of smoke, it is reasonable to assume that the observed variations in Gλ are due to changes in the relative concentration of organic components. The change in Gλ of more than a factor of 3 suggests that the proportion of organic materials in the smoke particles can vary significantly, reflecting differences in the sources, combustion conditions or aging processes of the smoke.
The analysis of our unique data set also reveals a notable height dependence of the fluorescence capacity. Despite strong variations, there is a consistent tendency for the fluorescence capacity at all wavelengths to increase with height. Specifically, the mean value of G513 in the MUT is approximately twice as high as that in the LFT. This trend may indicate an increase in the organic fraction of smoke particles with altitude. Moreover, the height dependence of Gλ intensifies with increasing wavelength. The most significant change in fluorescence capacity between the MUT and LFT is observed in the 614 nm channel. Consequently, the peak of the fluorescence spectrum shifts towards longer wavelengths as altitude increases. This spectral shift suggests that the chemical composition of the smoke, particularly the organic components, evolves with altitude, potentially due to differential aging processes.
The results accumulated throughout 2023 reveal a clear distinction between the fluorescence spectra of smoke and urban aerosol. The fluorescence spectrum of urban aerosol, predominantly located within the PBL, consistently decreases with wavelength. In contrast, the fluorescence of smoke exhibits a peak that shifts toward the 513 or 560 nm channel. This difference in the fluorescence spectra can be effectively utilized to differentiate between urban and smoke fractions in an aerosol mixture and to estimate corresponding mass concentrations.
To discriminate between smoke and urban particles based on their fluorescence spectra, at least two fluorescence channels are necessary. Based on our data set, the 438 and 560 nm channels would provide the most efficient separation. However, if modifications are made to a standard Mie–Raman lidar, preserving the capability for 3β+2α observations could be advantageous. In this case, incorporating the 438 and 513 nm channels could be a practical solution.
Lidar measurements are available upon request (igorv@pic.troitsk.ru).
IV processed the data and wrote the paper. MK and BB prepared the program for aerosol mixture partitioning. NK performed the measurements. QH, PG and TP performed data analysis and helped with manuscript preparation.
The contact author has declared that none of the authors has any competing interests.
Publisher's note: Copernicus Publications remains neutral with regard to jurisdictional claims made in the text, published maps, institutional affiliations, or any other geographical representation in this paper. While Copernicus Publications makes every effort to include appropriate place names, the final responsibility lies with the authors.
We acknowledge CaPPA project (ANR-11-LABX-0005-01) for funding observation-related scientific activities and OBS4CLIM project (ANR-21-ESRE-0013) for providing financial support to Qiaoyun Hu. The Russian Science Foundation is acknowledged for its supports in the framework of project 21-17-00114.
This research has been supported by the Agence Nationale de la Recherche (grant no. ANR-11-LABX-0005-01). Publisher’s note: the article processing charges for this publication were not paid by a Russian or Belarusian institution.
This paper was edited by Eduardo Landulfo and reviewed by two anonymous referees.
Adam, M., Nicolae, D., Stachlewska, I. S., Papayannis, A., and Balis, D.: Biomass burning events measured by lidars in EARLINET – Part 1: Data analysis methodology, Atmos. Chem. Phys., 20, 13905–13927, https://doi.org/10.5194/acp-20-13905-2020, 2020.
Ansmann, A., Riebesell, M., Wandinger, U., Weitkamp, C., Voss, E., Lahmann, W., and Michaelis, W.: Combined Raman elastic-backscatter lidar for vertical profiling of moisture, aerosols extinction, backscatter, and lidar ratio, Appl. Phys. B, 55, 18–28, https://doi.org/10.1007/BF00348608, 1992.
Ansmann, A., Mamouri, R.-E., Hofer, J., Baars, H., Althausen, D., and Abdullaev, S. F.: Dust mass, cloud condensation nuclei, and ice-nucleating particle profiling with polarization lidar: updated POLIPHON conversion factors from global AERONET analysis, Atmos. Meas. Tech., 12, 4849–4865, https://doi.org/10.5194/amt-12-4849-2019, 2019.
Ansmann, A., Ohneiser, K., Mamouri, R.-E., Knopf, D. A., Veselovskii, I., Baars, H., Engelmann, R., Foth, A., Jimenez, C., Seifert, P., and Barja, B.: Tropospheric and stratospheric wildfire smoke profiling with lidar: mass, surface area, CCN, and INP retrieval, Atmos. Chem. Phys., 21, 9779–9807, https://doi.org/10.5194/acp-21-9779-2021, 2021.
Baars, H., Ansmann, A., Ohneiser, K., Haarig, M., Engelmann, R., Althausen, D., Hanssen, I., Gausa, M., Pietruczuk, A., Szkop, A., Stachlewska, I. S., Wang, D., Reichardt, J., Skupin, A., Mattis, I., Trickl, T., Vogelmann, H., Navas-Guzmán, F., Haefele, A., Acheson, K., Ruth, A. A., Tatarov, B., Müller, D., Hu, Q., Podvin, T., Goloub, P., Veselovskii, I., Pietras, C., Haeffelin, M., Fréville, P., Sicard, M., Comerón, A., Fernández García, A. J., Molero Menéndez, F., Córdoba-Jabonero, C., Guerrero-Rascado, J. L., Alados-Arboledas, L., Bortoli, D., Costa, M. J., Dionisi, D., Liberti, G. L., Wang, X., Sannino, A., Papagiannopoulos, N., Boselli, A., Mona, L., D'Amico, G., Romano, S., Perrone, M. R., Belegante, L., Nicolae, D., Grigorov, I., Gialitaki, A., Amiridis, V., Soupiona, O., Papayannis, A., Mamouri, R.-E., Nisantzi, A., Heese, B., Hofer, J., Schechner, Y. Y., Wandinger, U., and Pappalardo, G.: The unprecedented 2017–2018 stratospheric smoke event: decay phase and aerosol properties observed with the EARLINET, Atmos. Chem. Phys., 19, 15183–15198, https://doi.org/10.5194/acp-19-15183-2019, 2019.
Burton, S. P., Ferrare, R. A., Vaughan, M. A., Omar, A. H., Rogers, R. R., Hostetler, C. A., and Hair, J. W.: Aerosol classification from airborne HSRL and comparisons with the CALIPSO vertical feature mask, Atmos. Meas. Tech., 6, 1397–1412, https://doi.org/10.5194/amt-6-1397-2013, 2013.
Gast, B., Jimenez, C., Ansmann, A., Haarig, M., Engelmann, R., Fritzsch, F., Floutsi, A. A., Griesche, H., Ohneiser, K., Hofer, J., Radenz, M., Baars, H., Seifert, P., and Wandinger, U.: Invisible aerosol layers: improved lidar detection capabilities by means of laser-induced aerosol fluorescence, EGUsphere [preprint], https://doi.org/10.5194/egusphere-2024-2586, 2024.
Haarig, M., Ansmann, A., Baars, H., Jimenez, C., Veselovskii, I., Engelmann, R., and Althausen, D.: Depolarization and lidar ratios at 355, 532, and 1064 nm and microphysical properties of aged tropospheric and stratospheric Canadian wildfire smoke, Atmos. Chem. Phys., 18, 11847–11861, https://doi.org/10.5194/acp-18-11847-2018, 2018.
He, Y., Yin, Z., Ansmann, A., Liu, F., Wang, L., Jing, D., and Shen, H.: POLIPHON conversion factors for retrieving dust-related cloud condensation nuclei and ice-nucleating particle concentration profiles at oceanic sites, Atmos. Meas. Tech., 16, 1951–1970, https://doi.org/10.5194/amt-16-1951-2023, 2023.
Hu, Q., Goloub, P., Veselovskii, I., and Podvin, T.: The characterization of long-range transported North American biomass burning plumes: what can a multi-wavelength Mie–Raman-polarization-fluorescence lidar provide?, Atmos. Chem. Phys., 22, 5399–5414, https://doi.org/10.5194/acp-22-5399-2022, 2022.
Khaykin, S., Legras, B., Bucci, S., Sellitto, P., Isaksen, L., Tencé, F., Bekki, S., Bourassa, A., Rieger, L., Tawada, D., Jumelet, J., and Godin-Beekmann, S.: The 2019/20 Australian wildfires generated a persistent smoke-charged vortex rising up to 35 km altitude, Commun. Earth Environ., 1, 22, https://doi.org/10.1038/s43247-020-00022-5, 2020.
Mamouri, R.-E. and Ansmann, A.: Potential of polarization/Raman lidar to separate fine dust, coarse dust, maritime, and anthropogenic aerosol profiles, Atmos. Meas. Tech., 10, 3403–3427, https://doi.org/10.5194/amt-10-3403-2017, 2017.
Mamouri, R.-E., Ansmann, A., Ohneiser, K., Knopf, D. A., Nisantzi, A., Bühl, J., Engelmann, R., Skupin, A., Seifert, P., Baars, H., Ene, D., Wandinger, U., and Hadjimitsis, D.: Wildfire smoke triggers cirrus formation: lidar observations over the eastern Mediterranean, Atmos. Chem. Phys., 23, 14097–14114, https://doi.org/10.5194/acp-23-14097-2023, 2023.
Miri, R., Pujol, O., Hu, Q., Goloub, P., Veselovskii, I., Podvin, T., and Ducos, F.: Innovative aerosol hygroscopic growth study from Mie–Raman–fluorescence lidar and microwave radiometer synergy, Atmos. Meas. Tech., 17, 3367–3375, https://doi.org/10.5194/amt-17-3367-2024, 2024.
Reichardt, J., Leinweber, R., and Schwebe, A.: Fluorescing aerosols and clouds: investigations of co-existence, EPJ Web Conf., 176, 05010, https://doi.org/10.1051/epjconf/201817605010, 2018.
Reichardt, J., Behrendt, O., and Lauermann, F.: Spectrometric fluorescence and Raman lidar: absolute calibration of aerosol fluorescence spectra and fluorescence correction of humidity measurements, Atmos. Meas. Tech., 16, 1–13, https://doi.org/10.5194/amt-16-1-2023, 2023.
Saito, Y., Ichihara, K., Morishita, K., Uchiyama, K., Kobayashi, F., and Tomida, T.: Remote detection of the fluorescence spectrum of natural pollens floating in the atmosphere using a laser-induced-fluorescence spectrum (LIFS) lidar, Remote Sens.-Basel, 10, 1533, https://doi.org/10.3390/rs10101533, 2018.
Senf, F., Heinold, B., Kubin, A., Müller, J., Schrödner, R., and Tegen, I.: How the extreme 2019–2020 Australian wildfires affected global circulation and adjustments, Atmos. Chem. Phys., 23, 8939–8958, https://doi.org/10.5194/acp-23-8939-2023, 2023.
Stein, A. F., Draxler, R. R., Rolph, G. D., Stunder, B. J. B., Cohen, M. D., and Ngan, F.: NOAA’s HYSPLIT atmospheric transport and dispersion modeling system, B. Am. Meteorol. Soc., 96, 2059–2077, https://doi.org/10.1175/BAMS-D-14-00110.1, 2015.
Sugimoto, N., Huang, Z., Nishizawa, T., Matsui, I., and Tatarov, B.: Fluorescence from atmospheric aerosols observed with a multichannel lidar spectrometer, Opt. Express, 20, 20800–20807, https://doi.org/10.1364/OE.20.020800, 2012.
Veselovskii, I., Hu, Q., Goloub, P., Podvin, T., Korenskiy, M., Pujol, O., Dubovik, O., and Lopatin, A.: Combined use of Mie–Raman and fluorescence lidar observations for improving aerosol characterization: feasibility experiment, Atmos. Meas. Tech., 13, 6691–6701, https://doi.org/10.5194/amt-13-6691-2020, 2020.
Veselovskii, I., Hu, Q., Ansmann, A., Goloub, P., Podvin, T., and Korenskiy, M.: Fluorescence lidar observations of wildfire smoke inside cirrus: a contribution to smoke–cirrus interaction research, Atmos. Chem. Phys., 22, 5209–5221, https://doi.org/10.5194/acp-22-5209-2022, 2022a.
Veselovskii, I., Hu, Q., Goloub, P., Podvin, T., Barchunov, B., and Korenskii, M.: Combining Mie–Raman and fluorescence observations: a step forward in aerosol classification with lidar technology, Atmos. Meas. Tech., 15, 4881–4900, https://doi.org/10.5194/amt-15-4881-2022, 2022b.
Veselovskii, I., Kasianik, N., Korenskii, M., Hu, Q., Goloub, P., Podvin, T., and Liu, D.: Multiwavelength fluorescence lidar observations of smoke plumes, Atmos. Meas. Tech., 16, 2055–2065, https://doi.org/10.5194/amt-16-2055-2023, 2023.
Veselovskii, I., Barchunov, B., Hu, Q., Goloub, P., Podvin, T., Korenskii, M., Dubois, G., Boissiere, W., and Kasianik, N.: Retrieval and analysis of the composition of an aerosol mixture through Mie–Raman–fluorescence lidar observations, Atmos. Meas. Tech., 17, 4137–4152, https://doi.org/10.5194/amt-17-4137-2024, 2024.