the Creative Commons Attribution 4.0 License.
the Creative Commons Attribution 4.0 License.
 | 18 Nov 2025
Seasonal isoprene emission estimates over tropical South America inferred from satellite observations of isoprene
Shihan Sun
Paul I. Palmer
Richard Siddans
Brian J. Kerridge
Lucy Ventress
Achim Edtbauer
Akima Ringsdorf
Eva Y. Pfannerstill
Jonathan Williams
Isoprene, a volatile organic compound (VOC) emitted by plants, plays a significant role in atmospheric chemistry and climate. The Amazon rainforest is a globally relevant source of atmospheric isoprene. We report isoprene emissions inferred from a full-physics retrieval of isoprene columns from the Cross-track Infrared Sounder (CrIS) and the local sensitivities between isoprene emissions and isoprene columns determined by the GEOS-Chem chemical transport model. Compared with the Model of Emissions of Gases and Aerosols from Nature (MEGAN) isoprene emissions, the isoprene emission estimates inferred from CrIS have different spatial and seasonal distributions with generally lower emission rates but higher emission rates over the northern Amazon basin and southeast Brazil. The observed mean isoprene concentration at the Amazon Tall Tower Observatory (ATTO), March–December 2019, is 3.0 ± 2.2 ppbv, which is reproduced better by the GEOS-Chem model driven by isoprene emissions inferred from CrIS (2.8 ± 1.4 ppbv) than by the MEGAN inventory (4.1 ± 1.3 ppbv). Isoprene emission estimates inferred from CrIS generally agree better than MEGAN with in situ observations of seasonal isoprene fluxes over the Amazon. GEOS-Chem model formaldehyde (HCHO) columns, corresponding to isoprene emissions inferred from CrIS, are generally more consistent with TROPOMI data (normalized mean error, NME = 43 %) than the HCHO columns corresponding to MEGAN isoprene emissions (NME = 50 %), as expected. CrIS-inferred isoprene emission rates can vary by ±20 % considering potential model biases in nitrogen oxide emissions. Our results provide confidence that we can use CrIS data to examine future impacts of anthropogenic activities on isoprene emissions from the Amazon.
- Article
(9599 KB) - Full-text XML
-
Supplement
(3244 KB) - BibTeX
- EndNote


Tropical South America, including the Amazon rainforest, hosts important ecosystems that influence the global carbon and water cycles. Amazonia is also a significant but uncertain source of biogenic volatile compounds (BVOCs), dominated by mass by isoprene (Guenther et al., 2006), that influence atmospheric chemical composition on local to global scales (Wiedinmyer et al., 2006; Yáñez-Serrano et al., 2015; Millet et al., 2016; Gomes Alves et al., 2023; Mayhew et al., 2023; Ringsdorf et al., 2023; Ferracci et al., 2024). Isoprene has an e-folding lifetime of ∼ 1 h against oxidation by the hydroxyl radical (OH) and plays a role in ozone chemistry (Atkinson, 2000; Saunier et al., 2020), the production of secondary organic aerosol (Claeys et al., 2004; Kroll et al., 2005, 2006; Carlton et al., 2009), and modifying the levels of OH (Lelieveld et al., 2008; Hofzumahaus et al., 2009; Fuchs et al., 2013; Millet et al., 2016; Nölscher et al., 2016; Hansen et al., 2017; Pfannerstill et al., 2021). Isoprene also influences the lifetimes of other pollutants, e.g. carbon monoxide (Miyoshi et al., 1994) and methane (Feng et al., 2023). Evidence suggests that plants emit isoprene to protect leaf biochemistry under environmental stress (Sharkey et al., 2007; Monson et al., 2013; Zeinali et al., 2016), which is also seen as a key plant trait that determines species responses to rising temperature and drought (Taylor et al., 2018; Werner et al., 2021; Byron et al., 2022). Changes in isoprene emissions due to deforestation, rising levels of atmospheric CO2, and climate-change-induced land use and land cover changes will also play an important role in controlling future changes in biogenic emissions and thereby atmospheric composition (Fini et al., 2017; Chen et al., 2018; Yáñez-Serrano et al., 2020; Sahu et al., 2023).
Isoprene emissions are typically described in atmospheric chemistry transport models and chemistry–climate models using bottom-up models. The Model of Emissions of Gases and Aerosols from Nature (MEGAN) (Guenther et al., 2006, 2012) is a commonly used bottom-up emission model, which we use in this study, so it is instructive to use it to explain the general approach. Basal emission rates, indicative of standard environmental conditions and specific genera, are grouped into a comparatively small set of plant functional types (PFTs) that describe a group of plants with similar characteristics. These standardized emission rates are then adjusted using empirical scaling factors that describe environmental changes, e.g. temperature or photosynthetic active radiation. Large uncertainties remain for these basal isoprene emission rates (Arneth et al., 2008) and for the empirical parameterizations of how different plants respond to their environment (Jiang et al., 2018; Seco et al., 2022; Bourtsoukidis et al., 2024). As such, these uncertainties compounded with other uncertainties with time-dependent inputs, e.g. land cover, can compromise model performance. Uncertainties from leaf-level phenological traits, such as leaf age or ecosystem-level plant biodiversity, which also influence isoprene emissions, are difficult to measure, with very few observational sites, but can be partially addressed with satellite-based observations of optical wavelengths (Li et al., 2024; Lian et al., 2024). Limitations of satellite remote sensing data result in uncertainties in the inferred maps of vegetation, including coarse resolution and PFT mapping, which subsequently introduce uncertainties into isoprene emission estimates (Chen et al., 2018; Opacka et al., 2021). Direct evaluation of these emission models is difficult, particularly over tropical ecosystems where there are very few data. An alternative indirect approach is to compare the emissions model with atmospheric data in which an atmospheric chemistry transport model acts as an intermediary between the emissions and the corresponding atmospheric concentrations of isoprene and its oxidation products, e.g. formaldehyde (HCHO). Studies have reported significant discrepancies between MEGAN isoprene emission estimates, used as an input to a chemistry transport model, and observations of atmospheric isoprene determined by in situ and satellite data, particularly over tropical ecosystems (Warneke et al., 2010; Bauwens et al., 2016; Wang et al., 2017; Gomes Alves et al., 2023).
Satellite observations of HCHO have, for the last 20 years, helped to supplement sparse ground-based observations of isoprene (Abbot et al., 2003; Palmer et al., 2003; Shim et al., 2005; Wiedinmyer et al., 2005; Palmer et al., 2006, 2007; Barkley et al., 2008; Millet et al., 2008; Müller et al., 2008; Barkley et al., 2009; Stavrakou et al., 2009; Kaiser et al., 2018; Surl et al., 2018; Opacka et al., 2021; Feng et al., 2024; Opacka et al., 2025). Formaldehyde is a high-yield product of isoprene oxidation by OH, and because HCHO has a lifetime of typically only several hours, observed changes in HCHO can be linked to emissions of the parent hydrocarbon (Palmer et al., 2003). Irrespective of the sophistication of the inverse method that is used to translate observed changes in HCHO into isoprene emission estimates (Shim et al., 2005; Kaiser et al., 2018), some form of an atmospheric chemistry model is needed, typically a global 3-D model that includes atmospheric transport, so we remain reliant on the assumed a priori emission inventories (e.g. Guenther et al., 2006), the chemical mechanism, and their respective uncertainties. For example, there remain substantial uncertainties associated with the production of HCHO from isoprene oxidation at low nitrogen oxide levels, which is found over the tropics away from biomass burning and urban centres (Lelieveld et al., 2008). Interpreting HCHO in terms of BVOC emissions also requires careful attention to discard data influenced by biomass burning (Barkley et al., 2008; Gonzi et al., 2011). HCHO can also be produced from sources other than isoprene, such as alkanes, alkenes, and monoterpenes, resulting in uncertainties in HCHO-inferred isoprene emissions (Marvin et al., 2017; Surl et al., 2018). Some studies have highlighted a positive model bias for MEGAN over the tropics compared with isoprene emission estimates inferred from satellite observations of HCHO (Marais et al., 2012; Barkley et al., 2013; Stavrakou et al., 2014; Worden et al., 2019), while others have found a negative bias when compared with ground-based or aircraft measurements (Gu et al., 2017; DiMaria et al., 2023). Development of isoprene retrievals (Fu et al., 2019; Palmer et al., 2022; Wells et al., 2020, 2022) using data collected by the Cross-track Infrared Sounder (CrIS) has resulted in a new and independent capability to determine isoprene emissions more directly. Different approaches have been adopted to retrieve isoprene from CrIS data. Fu et al. (2019) developed the first direct retrieval of isoprene using infrared radiance measurements from CrIS and the MUSES algorithm, which follows optimal estimation principles, while others have adopted other optimal estimation retrieval approaches (Palmer et al., 2022). In more recent work, some researchers have developed an innovative machine learning approach (Wells et al., 2022), building on Fu et al. (2019). Here we use data retrieved using optimal estimation.
In this study, we use a nested version of the GEOS-Chem chemical transport model to investigate the consistency of isoprene emission estimates inferred from CrIS isoprene retrievals and the bottom-up MEGAN isoprene emission inventory over tropical South America during 2019, and we compare the a posteriori isoprene concentrations with in situ measurements collected from the Amazon Tall Tower Observatory (ATTO), located in pristine rainforest. Section 2 describes the nested GEOS-Chem model configuration we use to interpret the satellite and in situ tall-tower data, including the MEGAN isoprene emissions model, the TROPOMI and CrIS satellite data, the tall-tower data, and the methods we use to translate the column data into emission estimates. In Sect. 3, we report our results. We compare our satellite-based emission estimates for isoprene with the inventory estimates from the MEGAN model and evaluate our CrIS-derived estimates against the in situ tall-tower atmospheric isoprene measurements. We also evaluate the CrIS-derived isoprene emission estimates by comparing the corresponding model HCHO columns simulated with HCHO columns retrieved from TROPOMI, using the GEOS-Chem model as an intermediary. To examine the robustness of our isoprene emission estimates from CrIS data, we report the results from a series of sensitivity tests that assume different soil NOx emission rates. We conclude our study in Sect. 4.
Here we describe the GEOS-Chem atmospheric chemistry model that relates surface emissions of BVOCs, including isoprene, to atmospheric columns of isoprene and HCHO. We describe the satellite observations of isoprene from CrIS and HCHO from TROPOMI, as well as the tall-tower measurements of atmospheric isoprene collected in central Amazonia that we use to evaluate the model. We also describe the methods that we use to translate these data into estimates of isoprene emission.
2.1 GEOS-Chem simulations
We use the GEOS-Chem v14.1.0 atmospheric chemical transport model (https://geoschem.github.io, last access: 5 December 2024). GEOS-Chem is driven by Goddard Earth Observing System Forward Processing (GEOS-FP) assimilated meteorological analyses from the NASA Global Modeling and Assimilation Office at the NASA Goddard Earth Observing System. Nested model simulations are conducted at a horizontal resolution of 0.25° × 0.3125° using 47 vertical levels, of which 30–35 are within the troposphere, over a spatial domain centred over tropical South America: 35° S–15° N, 85–30° W. A buffer zone of 3° is applied along each of the four lateral boundaries of the nested domain. We generate lateral boundary conditions for the nested model using a self-consistent global model run at a horizontal resolution of 2° × 2.5°, following a 1-year spin-up from January 2018 through December 2019.
We use the complex secondary organic aerosol (SOA) and semi-volatile primary organic aerosol (SVPOA) mechanism, which includes the full-chemistry “tropchem” mechanism to describe gas-phase reactions (Eastham et al., 2014) and the photochemical production of SOA and SVPOA with up-to-date isoprene mechanisms (Bates and Jacob, 2019). The “complex–SOA_SVPOA” mechanism uses a combination of explicit aqueous uptake mechanisms (Marais et al., 2016) with a standard volatility basis set scheme (Pye et al., 2010).
We use the standard Harvard–NASA Emissions Component (HEMCO) configuration, including biogenic emissions from the MEGAN v2.1 inventory (Guenther et al., 2012). To test the isoprene emissions inferred from the satellite data, we use offline BVOC emissions at 0.25° × 0.3125° horizontal resolution, which are pre-computed using MEGAN v2.1 with leaf area index (LAI) estimates from the Moderate Resolution Imaging Spectroradiometer (MODIS) (Yuan et al., 2011) and GEOS-FP meteorological reanalyses to modify the emission rates. MEGAN uses an empirical CO2 inhibition scheme to calculate isoprene emission factors (Possell and Hewitt, 2011; Tai et al., 2013). The MEGAN extension in HEMCO does not include the soil moisture effect for isoprene, so our current model configuration does not account for the impact of drought on isoprene emission. Pyrogenic emissions are from Global Fire Emissions Database (GFED) version 4.1, which includes small fire correction (Van Der Werf et al., 2017). The GFED inventory provides monthly dry matter emissions based on satellite observations of fire activity and vegetation coverage from MODIS. Anthropogenic emissions, including fossil and biofuel sources, are from the Community Emissions Data System inventory (CEDS v2), which provides CMIP6 historical anthropogenic emissions data from 1750 to 2019 mapped to a 0.5° global grid (Hoesly et al., 2018). Offline soil NOx emission estimates used in this study (Hudman et al., 2012) are generated using consistent GEOS-FP meteorological analyses.
To compare model simulations with satellite retrievals, GEOS-Chem-simulated profiles are sampled at the satellite overpassing time and location of each measurement for both TROPOMI and CrIS. We then interpolate model profiles to the vertical levels of satellite retrievals. For consistency between satellite and GEOS-Chem-simulated vertical profiles, we also apply scene-dependent averaging kernels that describe the instrument vertical sensitivity to changes in a trace gas, replacing any a priori information assumed by the retrieval, and then integrate from the surface up to the tropopause to calculate column values.
2.2 CrIS isoprene retrievals
We use CrIS isoprene column average retrievals from RAL's Infrared and Microwave Sounding (IMS) scheme (Palmer et al., 2022). CrIS is a Fourier transform spectrometer covering three IR spectral regions spanning 650–2550 cm−1 and launched on board the Suomi-National Polar-orbiting Partnership (S-NPP) satellite in October 2011, NOAA-20 in November 2017, and NOAA-21 in 2022 into sun-synchronous low Earth orbits with overpass times of 01:30 and 13:30 local time. CrIS has comparatively low noise in the spectral region in which isoprene features occur, which, together with a more favourable thermal structure at ∼ 13:30 than 09:30, makes detection of isoprene feasible for CrIS. Other than instrumental noise and spectral interference from other atmospheric constituents, uncertainty in CrIS-retrieved isoprene column averages principally concerns the adopted vertical profile shape, which is a constant volume mixing ratio, and CrIS vertical sensitivity, which is accounted for explicitly in the analysis by applying vertical averaging kernels to the model profiles. Although the a priori constraint on the retrieval is weak, this is also accounted for. As in Palmer et al. (2022), CrIS isoprene data are filtered to exclude scenes with extensive thick or high cloud and retrievals with a high cost function (i.e. poor spectral fit). Due to the simple profile shape adopted and decrease in sensitivity near the surface level in the absence of significant surface–air temperature contrast, IMS column averages tend to be lower than those derived from surface-based observations, where surface-level concentrations are high as expected, which does not necessarily indicate a low bias from the RAL IMS product. The sensitivity of infrared spectra to trace gases is generally lowest near the ground because of the small temperature difference between the atmosphere and the surface, particularly at night. In this study, we use daytime satellite-retrieved isoprene columns, which correspond to peak isoprene emissions.
2.3 TROPOMI column retrievals of HCHO and NO2
TROPOMI was launched on board the Copernicus Sentinel-5 Precursor (S5P) satellite on 13 October 2017 into a low Earth polar orbit with an equatorial local overpass time of 13:30 (Veefkind et al., 2012). TROPOMI is a nadir-viewing instrument that collects data at ultraviolet, visible, near-infrared, and shortwave infrared wavelengths. TROPOMI has a horizontal swath of 2600 km, which is divided into 450 across-track rows. The spatial resolution of TROPOMI at nadir is 3.5 × 7 km2 (across-track × along-track), which was later refined to 3.5 × 5.5 km2 in August 2019 due to an adjustment to the along-track integration time. TROPOMI NO2 retrievals use wavelengths from 400 to 496 nm, and HCHO retrievals use wavelengths from 320 to 405 nm. We refer the reader to dedicated reports on these retrieved data products for further details (De Smedt et al., 2018; Van Geffen et al., 2022). We use the operational offline TROPOMI level 2 quality control retrievals for HCHO and NO2 columns. To remove retrievals with substantial errors or those influenced by clouds or snow/ice cover, we use the retrieval quality assurance (QA) flag provided by the data products. We discard data with QA flags > 0.75 for NO2 and > 0.5 for HCHO, following recommendations (De Smedt et al., 2020; Eskes and Eichmann, 2022).
TROPOMI has a better signal-to-noise ratio compared to the Ozone Monitoring Instrument (OMI), but the HCHO observations still have a bias against ground-based multi-axis differential optical absorption spectroscopy instruments (De Smedt et al., 2021). TROPOMI retrievals of HCHO were found to underestimate high columns and overestimate low columns in previous studies (Vigouroux et al., 2020; Müller et al., 2024). Noting that biases for OMI and TROPOMI HCHO columns are expected to be similar (De Smedt et al., 2021), we have applied a bias-correction formula recently proposed for HCHO columns from OMI, which has previously been evaluated using observations over South America (Müller et al., 2024): ΩHCHO,BC = , where ΩHCHO,BC denotes the bias-corrected HCHO columns (molec. cm−2). We find that applying this bias correction does not change the conclusions of our paper.
2.4 Amazon Tall Tower Observatory (ATTO)
We use data collected at the Amazon Tall Tower Observatory (ATTO; 2°8′ S, 59°0′ W) site located in central Amazonia (Gomes Alves et al., 2023) to independently evaluate the GEOS-Chem model. The characteristics of this site have been described extensively in Andreae et al. (2015). The anthropogenic influence from the closest city, Manaus (150 km southwest of ATTO), is negligible, and the site has been established to represent pristine tropical forest conditions throughout the year. The tropical climate at this broader geographical region includes a dry season (July–October) and a wet season (December–May) associated with seasonal rainfall amounts of less than 100 mm and over 200 mm, respectively (Botía et al., 2022). We use air measurements that were collected at 80, 150, and 320 m, respectively, from March to December 2019. The measurements were made using a proton transfer reaction time-of-flight mass spectrometer (PTR-ToF-MS, Ionicon, Austria) as described by Ringsdorf et al. (2023). For the purposes of comparison with the model, we calculate the mean hourly observed isoprene concentrations from these three levels. Modelled isoprene mixing ratios from the corresponding first three levels from the surface are sampled on the day and at the time when observations are available and then averaged over the same time period.
2.5 Method to infer satellite-derived isoprene emission inventory
We use CrIS retrievals of isoprene column (Ωisop), described above, to derive the isoprene emission rates that we use within the GEOS-Chem model. To understand the relationships of these isoprene columns to isoprene emissions, we use a linear model to regress MEGAN isoprene emission rates Eisop,GC (kg m−2 s−1) and the corresponding GEOS-Chem model Ωisop. To determine monthly isoprene emission rates from satellite retrievals from CrIS, we rearrange the regression model and insert the observed columns: Eisop,sat = , where Eisop,sat is the isoprene emission estimate inferred by satellite data and Ωsat refers to the CrIS column data. The intercept B refers to the isoprene background, while the slope S refers to the isoprene column corresponding to the isoprene emission rates, which is mainly determined by isoprene lifetime. We use a similar approach to relate TROPOMI HCHO columns (ΩHCHO) to isoprene emission estimates. For the analysis of HCHO data, the S in the regression model is determined by the HCHO yield from isoprene oxidation and by the HCHO lifetime.
We first compute the linear regression relationships, including estimates of B and S, within each grid for each month using daily MEGAN isoprene emission estimates and the corresponding model values for ΩHCHO and Ωisop sampled at the equatorial overpass time of the satellite, 2018–2020, inclusively. We then use these grid-based regressions models to infer monthly isoprene emission estimates for 2019. For model grid boxes for which emission rates cannot be estimated, e.g. p value > 0.05 or missing data, we use data from the immediately adjacent grids (nearest neighbours) to recalculate the regression models, as described above. The magnitude of satellite-inferred isoprene emission rates for 2019 is scaled by the ratio of monthly MEGAN emission rates in 2019 relative to the 2018–2020 monthly mean. We then relate the monthly Eisop,sat values, representative of the approximate 13:30 local overpass time of CrIS and TROPOMI, to the diurnal variation in isoprene emission rates using scaling factors derived from diurnal and day-to-day variations in the offline MEGAN isoprene emission rates for 2019. Given the lifetime of isoprene against oxidation by OH and the mean wind speed, we estimate that most of the isoprene lost and the associated HCHO production is on a scale shorter than a 2° × 2.5° grid box but typically longer than an individual 0.25° × 0.3125° grid box. Consequently, to remove this potential “smearing effect” on the finer horizontal resolution, we calculate our regression model using a horizontal resolution of 2° × 2.5°, following recent studies (Wells et al., 2020, 2022).
To remove the influence of biomass burning on the HCHO regressions models, we discard data for which there are fire counts identified by the NASA Fire Information for Resource Management System (FIRMS) active daily fire data acquired by the MODIS sensors (https://firms.modaps.eosdis.nasa.gov/, last access: 15 November 2024). These fire counts are determined by thermal IR anomalies by the MODIS sensors aboard Aqua and Terra satellites at a 1 km horizontal resolution. We select daytime fire counts with a high confidence level, i.e. higher than or equal to 80 %, as recommended in the MODIS user's guide (Giglio et al., 2020).
3.1 CrIS-inferred isoprene emissions
Figure 1 compares monthly mean CrIS and GEOS-Chem (MEGAN) isoprene columns for the year 2019. GEOS-Chem model fields are screened where CrIS data are absent or do not pass the quality thresholds. Both GEOS-Chem and CrIS show a strong seasonal cycle, with a peak monthly mean Ωisop in August. GEOS-Chem (MEGAN) and CrIS report the lowest monthly Ωisop in April and November, respectively. The best agreement between GEOS-Chem (MEGAN) and CrIS for 2019 is found mainly during dry months, from June to August, with Pearson correlation coefficients R = 0.59–0.73, p < 0.05, and with normalized mean biases (NMBs) of 20 % to 38 %. The largest discrepancies between GEOS-Chem and CrIS typically occur during relatively wet months (regional mean total precipitation > 5 mm d−1). GEOS-Chem (MEGAN) has a positive bias with respect to CrIS (NMB > 100 %) over the Amazon basin throughout the year, with the highest positive biases over the western Amazon basin, as shown in Fig. 1. Despite the overall positive biases, the model underestimates Ωisop over southeast Brazil, where it is dominated by savanna, with the largest negative biases during the dry season. These seasonal and regional model biases have also been found in previous studies (e.g. Wells et al., 2020). Hotspots of Ωisop during the wet season are mainly observed to the north of the Amazon basin, on the borders between Columbia, Venezuela, and Brazil, where the land cover is dominated by tropical rainforest. In contrast, GEOS-Chem (MEGAN) shows regional hotspots along the east of the Andes and over western Brazil and eastern Peru. Elevated values of CrIS Ωisop over northern Amazonia have been independently observed by aircraft measurements (Gu et al., 2017), suggesting possible negative model bias where the tropical plant species distributions may not be well represented by the model.
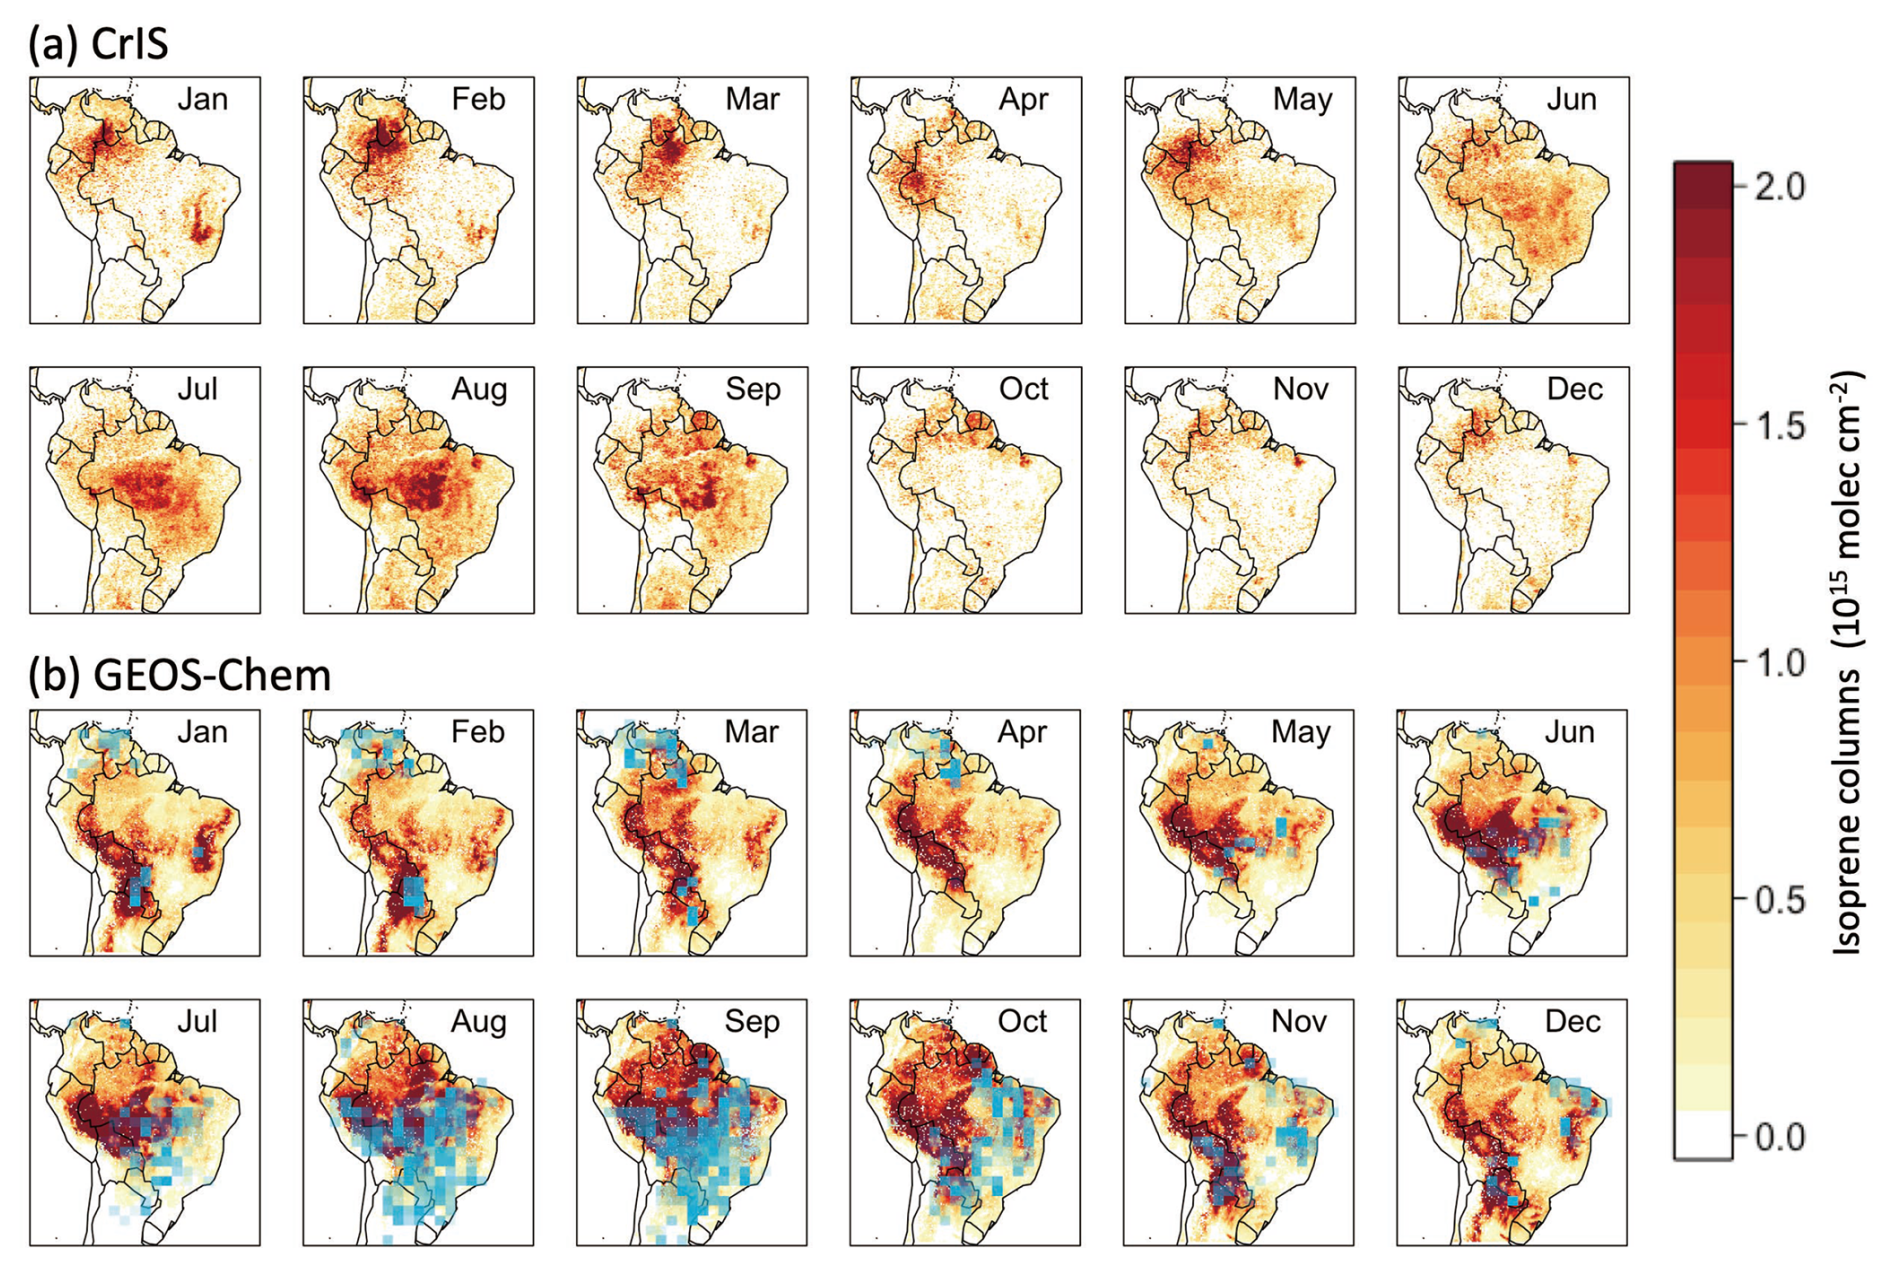
Figure 1Monthly mean (a) CrIS and (b) GEOS-Chem isoprene columns (1015 molec. cm−2) driven by MEGAN emissions sampled at the CrIS local overpass time of 13:30 for 2019. GEOS-Chem model columns include scene-dependent CrIS averaging kernels. Blue boxes in panel (b) indicate fire intensities and locations from MODIS.
Previous studies have reported significant spatial differences between bottom-up emission inventories of isoprene and satellite column observations of isoprene (Fu et al., 2019; Wells et al., 2022; Müller et al., 2024). To understand these differences, we calculate top-down values of Eisop using satellite column retrievals of isoprene and HCHO for comparison with the MEGAN bottom-up inventory for Eisop. We use the relationships between isoprene emissions and isoprene columns described in GEOS-Chem to derive Eisop from CrIS Ωisop, and we also calculate Eisop derived from TROPOMI ΩHCHO for comparison with CrIS-derived Eisop. For those model grids where the Eisop ∼ Ωsat linear relationships are not significant (p value > 0.05) or satellite-inferred isoprene emissions are negative, we assume there are no isoprene emissions within these grids so that any differences in modelled biases are caused by CrIS-derived Eisop that have been modified in this study. This approach can cause an underestimation of Eisop in some areas. Figure 1 also shows the monthly location of fires identified by MODIS data. It clearly shows that for large parts of the Amazon, isoprene emission estimates inferred from HCHO are compromised by fire (Barkley et al., 2008, 2011), and for these locations we remove days with fire incidents when computing Eisop ∼ Ωsat linear relationships.
Figure 2a shows monthly total isoprene emission estimates from MEGAN and with estimates inferred from CrIS isoprene and TROPOMI HCHO column data over the spatial domain shown in Fig. 1, where monthly isoprene emission rates can be inferred from both CrIS and TROPOMI data. TROPOMI- and CrIS-inferred isoprene emission estimates peak in September, which is the same as with MEGAN. TROPOMI-derived isoprene emission estimates are 12 %–72 % lower than those of MEGAN. CrIS estimates are about 2 %–49 % lower than those of MEGAN except for July. We remove ΩHCHO values that coincide with MODIS-detected fires, resulting in lower TROPOMI ΩHCHO-derived isoprene emissions during the months where isoprene hotspots are collocated with fire incidents, as shown in Fig. 1. Recent work also found that OMI HCHO-based isoprene emissions were significantly lower than the CrIS-derived emissions (from a different CrIS retrieval scheme) over South America, with the largest discrepancies over Brazil (Müller et al., 2024). Figure 2b shows the spatial distribution of monthly mean isoprene emission rates for the year 2019, inferred from the IMS CrIS isoprene column data. The corresponding monthly isoprene emission estimates from MEGAN and those inferred from TROPOMI HCHO columns are shown in Fig. S1.
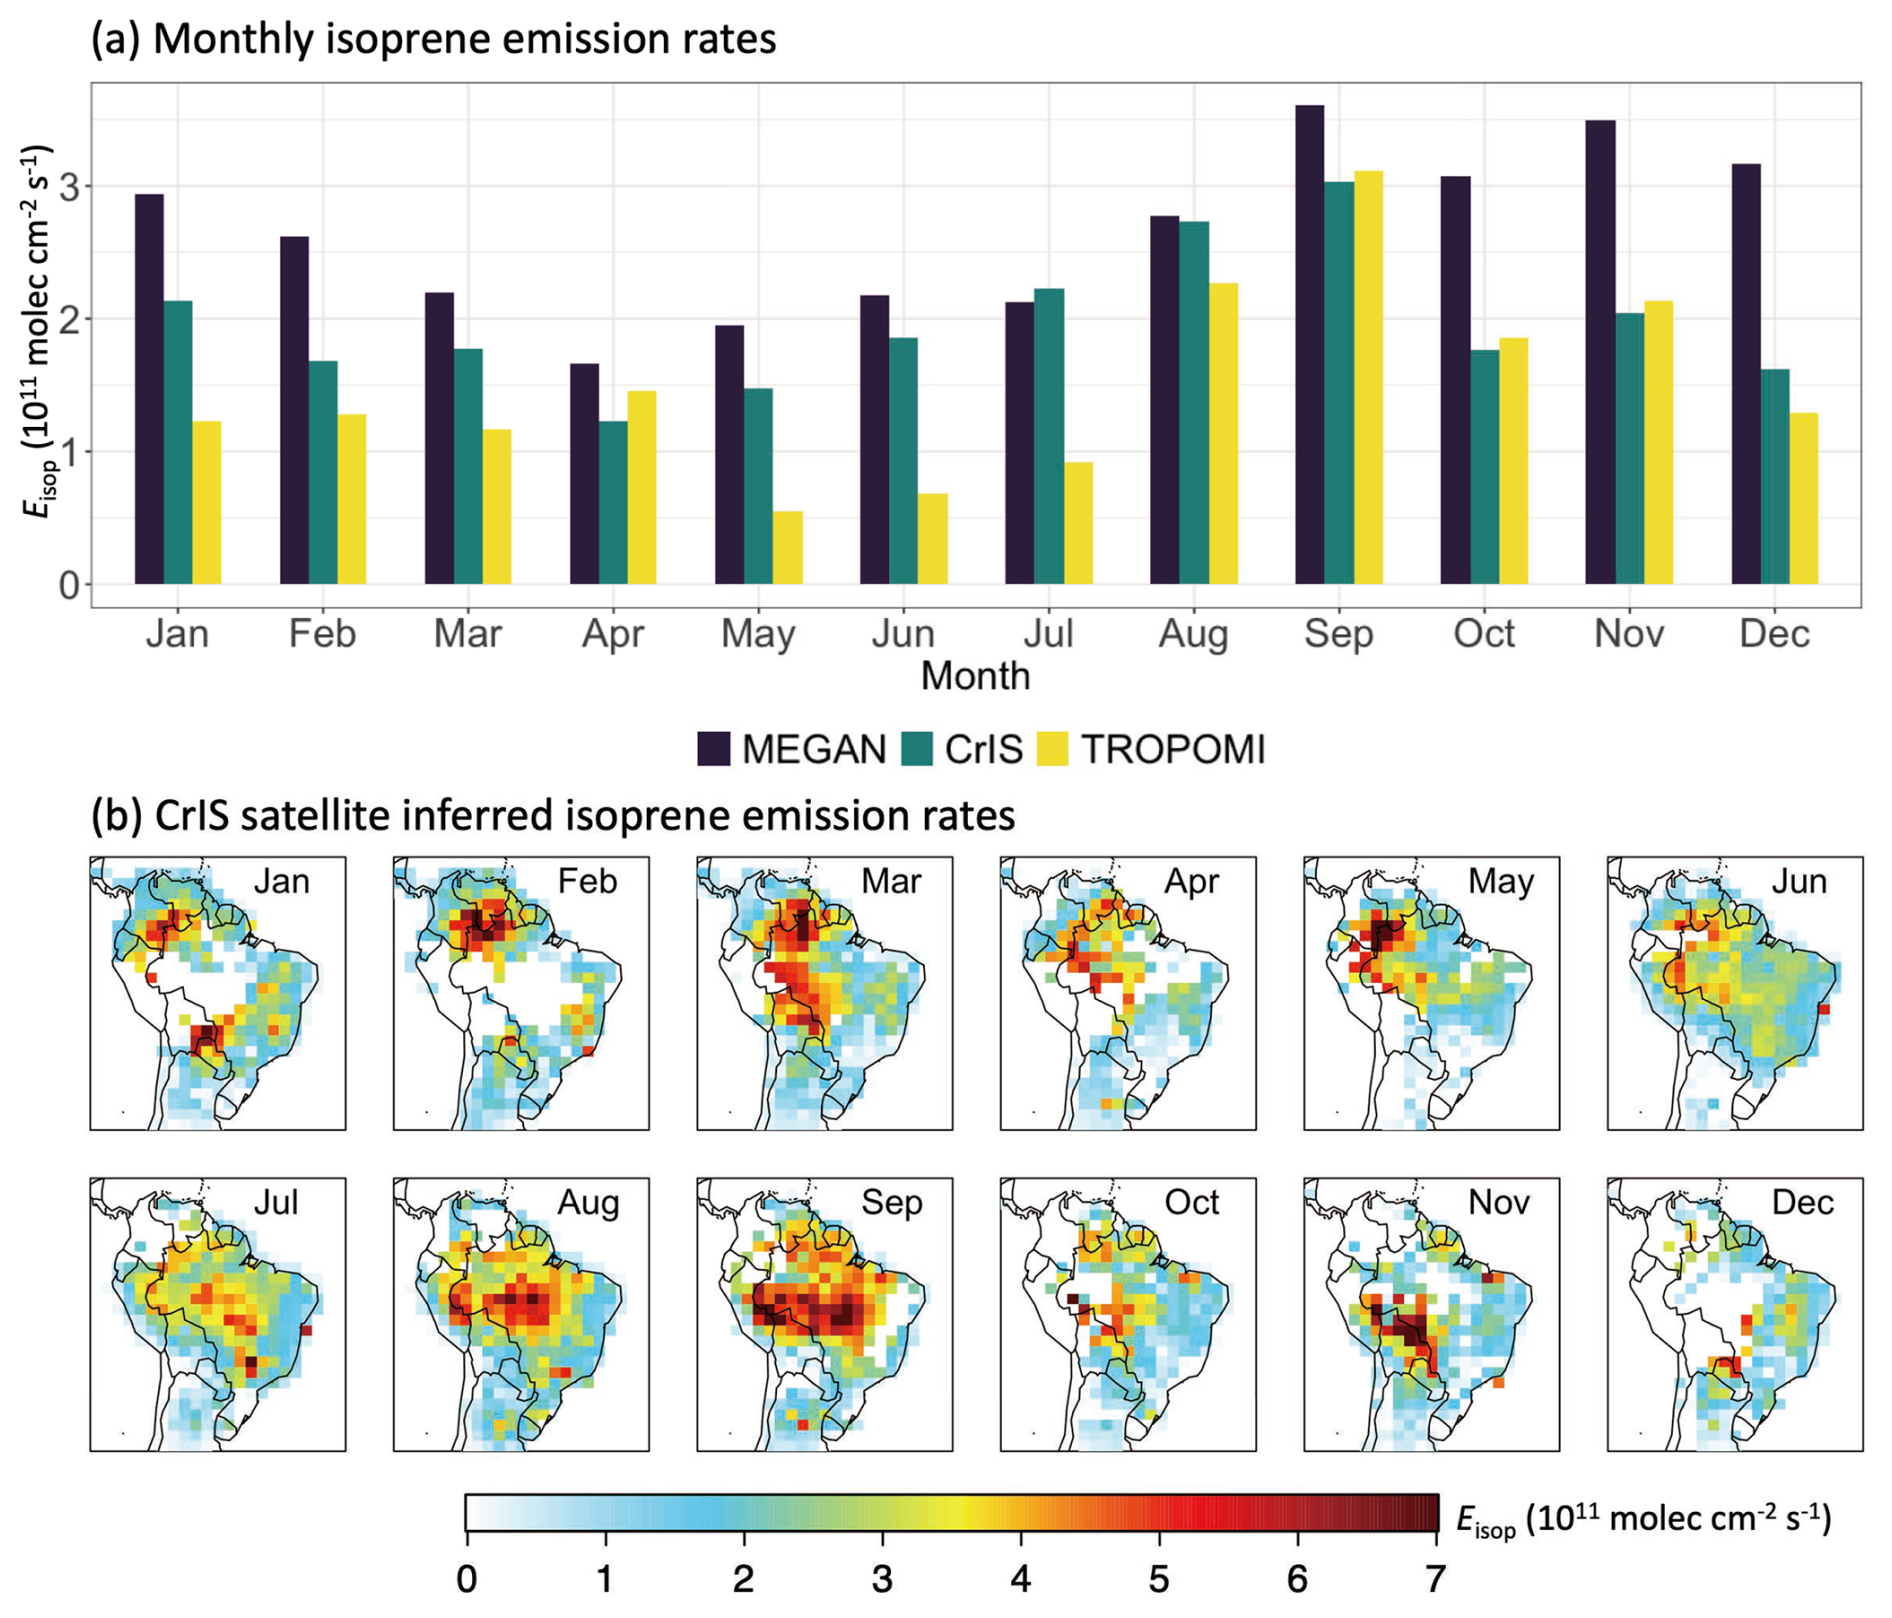
Figure 2(a) Monthly mean MEGAN- and satellite-derived isoprene emission rates (1011 molec. cm−2 s−1) from CrIS isoprene and TROPOMI HCHO observations across tropical South America for 2019. (b) Monthly spatial distribution of the CrIS-derived isoprene emission rates over tropical South America for 2019.
3.2 Evaluation of CrIS-inferred isoprene emission
3.2.1 Evaluation with ATTO data
We conducted nested model simulations at a horizontal resolution of 0.25° × 0.3125°, driven by MEGAN and our CrIS-derived isoprene emission estimates, and compared the resulting hourly isoprene mixing ratios sampled at the grid boxes (Fig. 3a) nearest to ATTO. We acknowledge that the CrIS Eisop inferred at a horizontal resolution of 2° × 2.5° (Fig. 1), as described above, can only represent the mean isoprene emissions over that area. Figure 3a shows annual mean values for the enhanced vegetation index (EVI) from the MODIS instrument, which provide information about the greenness of vegetation. The highest values of EVI over the Amazon basin are associated with tropical rainforests that have a comparatively small seasonal variation. Measurements collected at the ATTO site should by design be representative of the surrounding rainforest within the Amazon basin. As such, we assume that model isoprene mixing ratios over grid cells adjacent to ATTO, dominated by upland tropical rainforest with similar biome types, are comparable to the monthly isoprene concentrations observed at ATTO. We compare the model-predicted isoprene mixing ratios averaged over the grid where the site is located together with all the adjacent grid boxes (9 grid boxes in total from nested simulations).
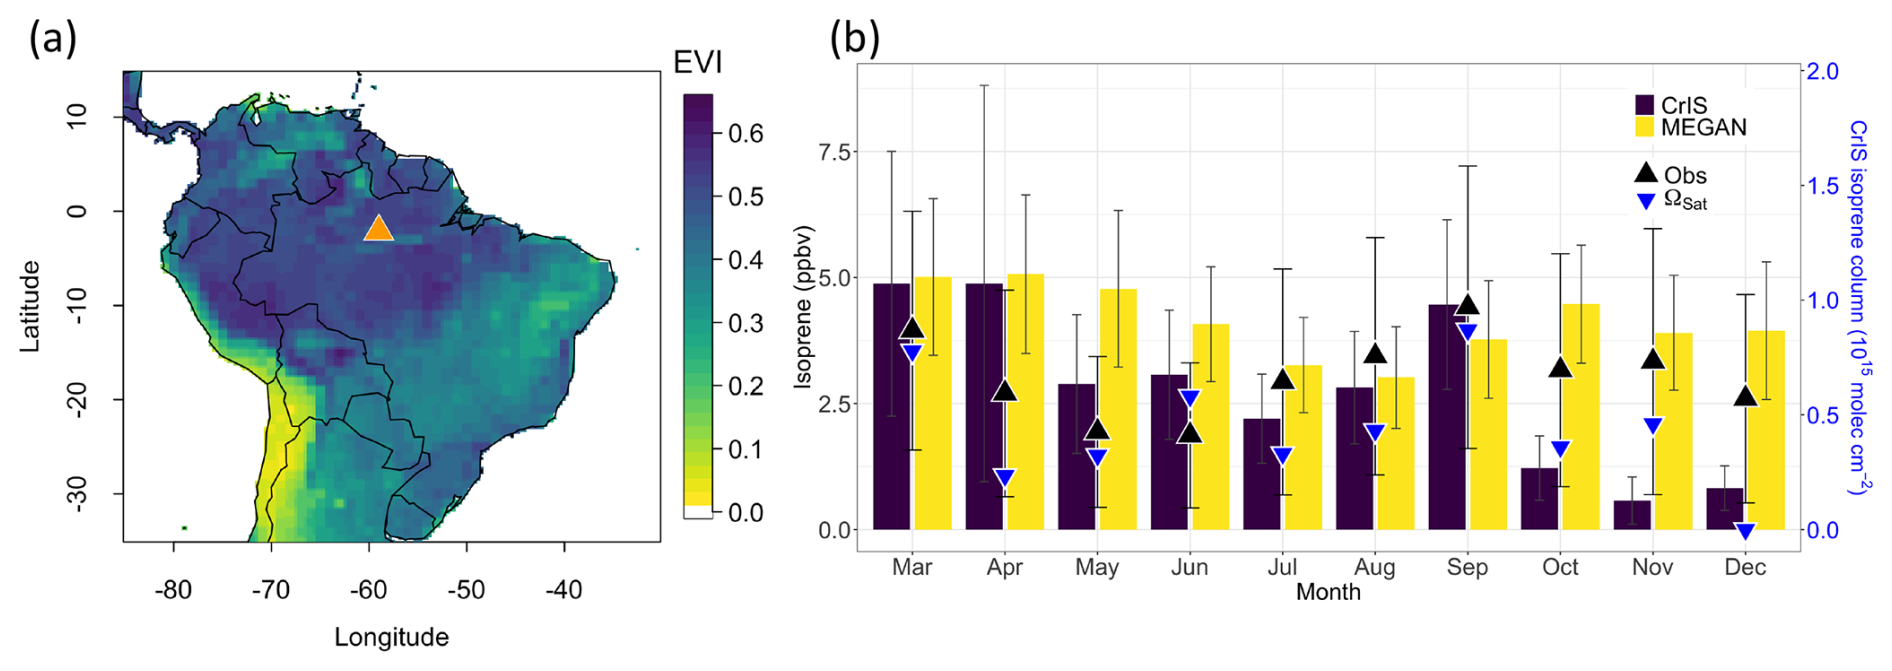
Figure 3(a) Annual mean values of the enhanced vegetation index (EVI) from MODIS. The ATTO site is marked by an orange triangle. (b) Model (bars) and observed (triangles) monthly mean isoprene mixing ratios (ppbv) at the ATTO site during March–December 2019. Model values are driven by MEGAN and by values determined by the CrIS satellite data. Vertical lines denote the standard deviations of the monthly means. Blue triangles denote CrIS isoprene columns at the ATTO site.
Figure 3b shows the comparison of observed monthly mean isoprene mixing ratios at ATTO and the GEOS-Chem model during March to December 2019. The monthly satellite-retrieved isoprene columns generally follow the observed monthly variations at ATTO. GEOS-Chem (MEGAN) reproduces the monthly mean ATTO data, with an annual mean isoprene mole fraction of 4.1 ± 1.3 ppbv compared with the observed annual mean value of 3.0 ± 2.2 ppbv. June and November are transitioning months between the wet season (December–May) and dry season (July–October). We classify June as a wet month and November as a dry month based on mean monthly root soil moisture at ATTO in 2019. The model (MEGAN) overestimates ATTO data by 77 % during the wet months (March–June, December), 4.6 ± 1.4 ppbv versus 2.6 ± 1.9 ppbv, but is much closer during the dry months (July–November), 3.7 ± 1.1 ppbv versus 3.5 ± 2.5 ppbv. Isoprene emission estimates inferred from CrIS result in an annual mean of 2.8 ± 1.4 ppbv, with 2.3 ± 1.0 and 3.3 ± 1.9 ppbv during the dry (July–November) and wet (March–June, December) months, respectively. The top-down isoprene emissions underestimate the observed values from October to December, partly because of low satellite-observed isoprene columns as shown in Fig. 2b and because some of the grid boxes near the observational tower are set to zero emission rates where the regression relationship is not significant (p value > 0.05), which may lower the mean simulated isoprene mole fractions at ATTO. Despite the discrepancies between model and site observations, isoprene emission estimates using CrIS isoprene retrievals can generally reproduce the magnitudes of isoprene mole fractions for most months and can better capture months with peak isoprene concentrations (March and September) compared with the model using MEGAN.
We use isoprene flux measurements from the Amazon basin collected in previous years to extend our model evaluation and report the mean statistics for each site, following a previous study (Barkley et al., 2008) (see Table S1 in the Supplement). Different sampling methods (e.g. technical approach, sampling height, sampling hours) can affect the magnitude of measured isoprene fluxes, and the model isoprene fluxes are for 2019 and not from the same year as the flux measurements. We compare model isoprene fluxes during the same month and daytime hours for each flux measurement collected at different observational sites. The mean observed isoprene flux during dry months is about 3 mg m−2 h−1, which is generally higher than that during wet months (∼ 1 mg m−2 h−1). MEGAN has higher isoprene fluxes for both seasons, with 4.2 and 2.9 mg m−2 h−1 for the dry and wet season, respectively. Satellite-based isoprene flux estimates generally better reproduce the magnitudes of observed seasonal isoprene fluxes, with about 3 and 1.7 mg m−2 h−1 during dry and wet months, respectively. Previous studies have found that MEGAN typically overestimates isoprene fluxes over the Amazon (Bauwens et al., 2016; Gomes Alves et al., 2023). We find that CrIS-based isoprene flux estimates can potentially reduce the positive model biases in the tropical rainforest regions.
3.2.2 Evaluation using TROPOMI HCHO data
We evaluate the CrIS-inferred isoprene emission rates by comparing model ΩHCHO with TROPOMI ΩHCHO. GEOS-Chem-simulated ΩHCHO depends largely on isoprene emissions over the studied region so that any reduced biases in model HCHO can be attributed to the CrIS isoprene emission estimates.
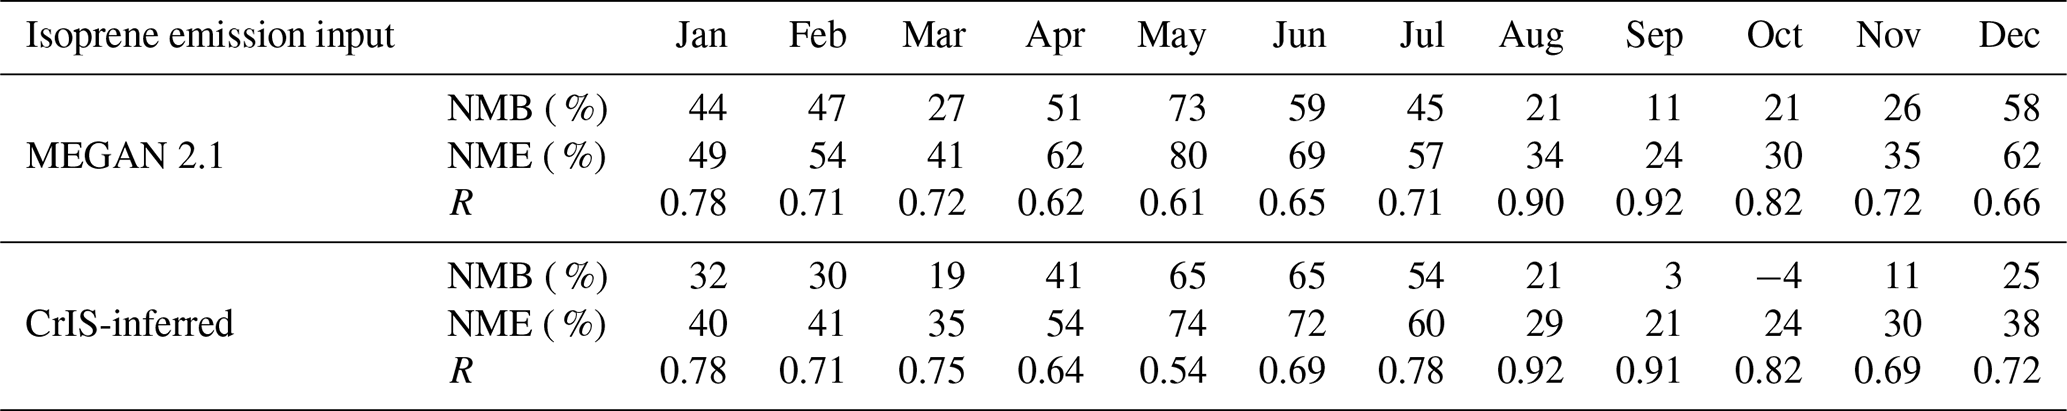
Figure 4 shows a monthly comparison between TROPOMI HCHO columns and GEOS-Chem driven by MEGAN and satellite-based CrIS-derived isoprene emissions. The model generally captures the spatial distribution of monthly HCHO columns (R = 0.61–0.92). The model has a positive bias over most forested regions throughout the year, with a negative bias found over the tropical grasslands of the Colombia–Venezuelan plains to the north of the Amazon basin during March and April, as well as over the cropland to the southeast of the basin during the dry season. The CrIS-derived isoprene emission inventory reduces the annual normalized mean error (NME) from 50 % to 43 % and reduces the NME from 58 % to 47 % during the wet season (December–May) and from 36 % to 33 % for the dry season (July–October). Over the Amazonian region (50–75° W, 15° S–5° N), NME is reduced from 54 % to 45 % annually, from 37 % to 31 % during the dry season, and from 65 % to 53 % during the wet season. Table 1 shows the monthly comparison statistics between TROPOMI and GEOS-Chem HCHO columns. We find an overall reduction in model biases, but the spatial correlation between GEOS-Chem and TROPOMI for most months is not improved significantly using CrIS-inferred isoprene emissions. The spatial distribution of HCHO is also strongly affected by non-biogenic sources such as wildfires and anthropogenic emissions. Improvement in the description of the biogenic source alone does not significantly improve the overall biases. Because we assume zero isoprene emissions where the satellite data cannot be used to derive emission rates, this approach can potentially increase the model bias.
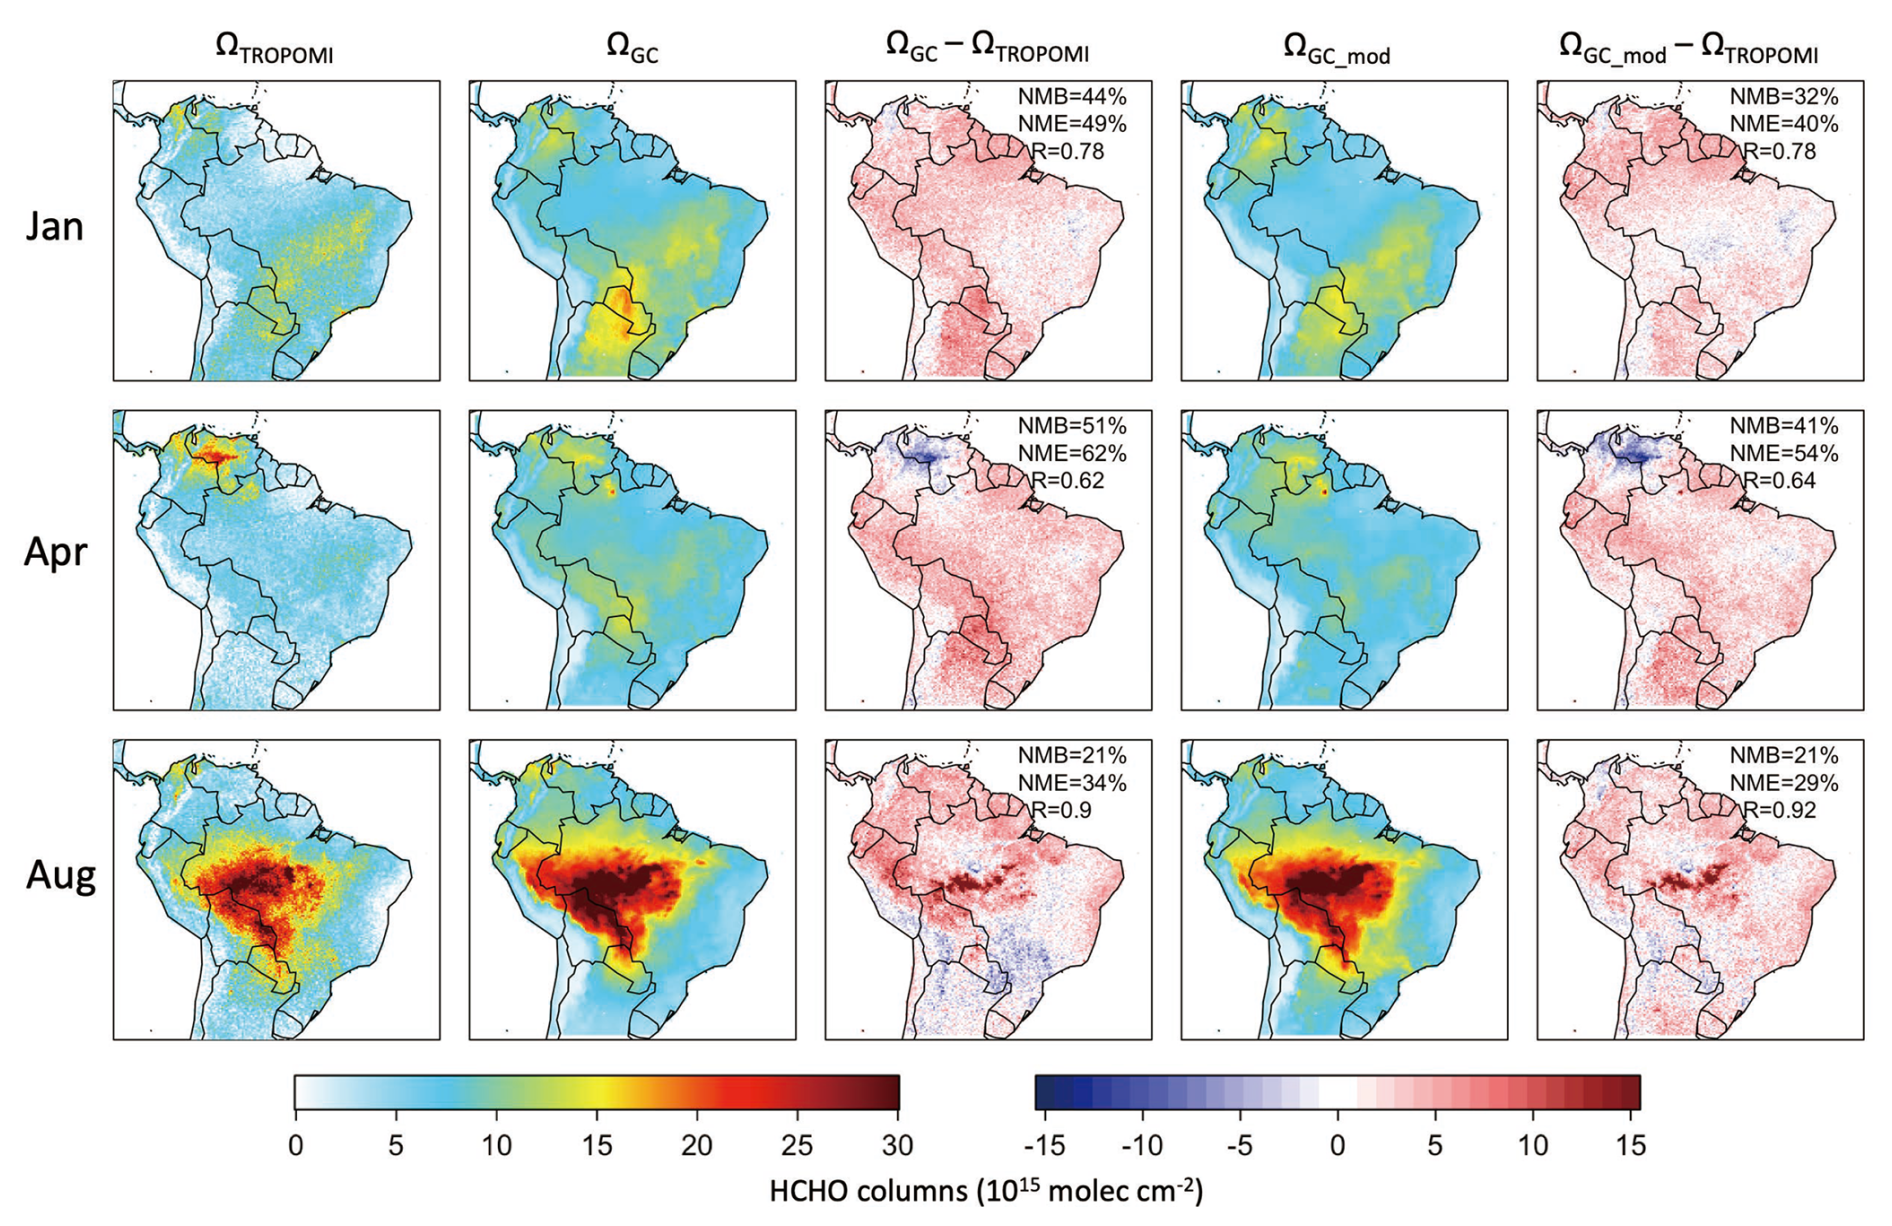
Figure 4TROPOMI (first column) and GEOS-Chem monthly mean HCHO columns (1015 molec. cm−2) for January, April, and August in 2019. The GEOS-Chem model columns driven by MEGAN (second column) and by CrIS-derived isoprene emission estimates (fourth column). Differences between TROPOMI and model values are shown in the third and fifth columns. The values in the panels in the third and fifth columns are the normalized mean biases (NMBs), normalized mean error (NME), and Pearson correlation coefficients (R).
Table 1Monthly normalized mean biases (NMBs), normalized mean error (NME), and the Pearson correlation coefficients (R) between GEOS-Chem-simulated HCHO columns and TROPOMI HCHO columns for the year 2019. For all the correlation coefficients here, p value < 0.05.
3.3 Sensitivity of isoprene emission estimates to assumed NOx emissions
Previous studies have found large-scale NOx biases, likely due to underestimated soil NOx emissions, over Amazonia (Liu et al., 2016; Wells et al., 2020). NOx plays an important role in the oxidation of isoprene and thus isoprene lifetime (Atkinson, 2000; Barket et al., 2004; Lelieveld et al., 2008). The assumed model chemistry of isoprene underpins the isoprene emission estimates determined by CrIS data. A shorter isoprene lifetime will result in lower isoprene columns and consequently a smaller slope for ΩGC = SEisop,MEGAN + B and a higher CrIS-based isoprene emission estimate (Eisop,sat = . To examine the uncertainties from model biases in NOx emissions, we present isoprene emission estimates corresponding to a series of sensitivity tests and scale the NOx emissions by 0.25, 0.5, 0.75, 1.25, 1.5, 2, and 10. All sensitivity cases use a resolution of 2° × 2.5°. Other settings are the same as described in Sect. 2.1.
Table 2Mean relative changes (%) in simulated NO2 columns under different NOx emission levels compared with the default case (EmisScale_NO = 1) during wet and dry seasons.
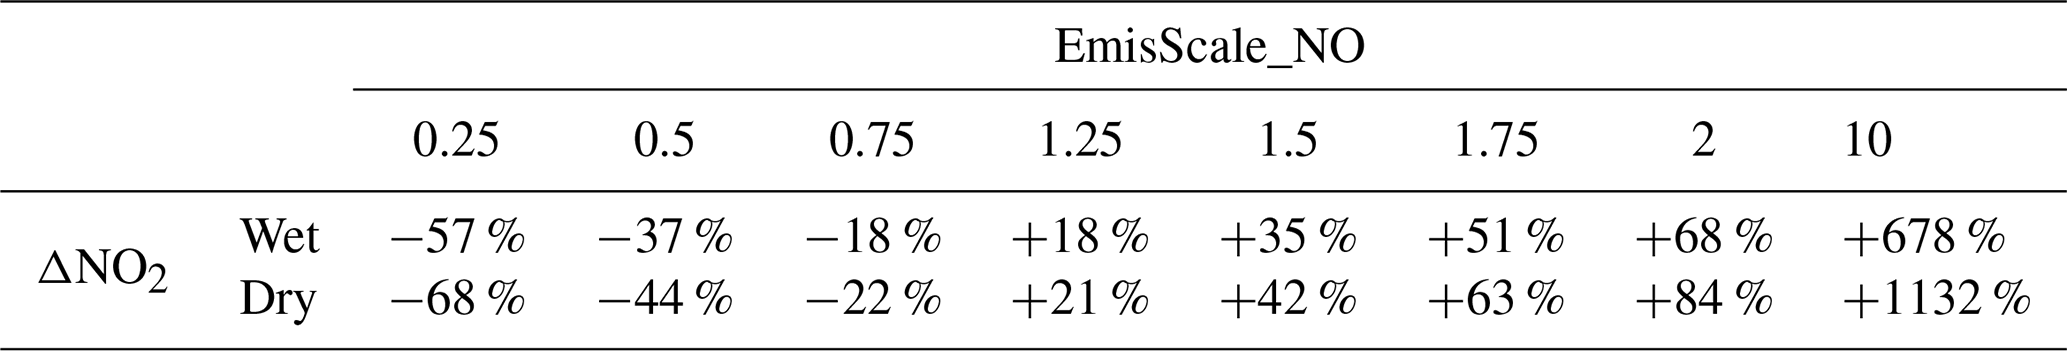
We first compare monthly GEOS-Chem-simulated NO2 columns with TROPOMI retrievals and find similar negative biases in model NO2 (see Fig. S2 in the Supplement). The comparison between GEOS-Chem and TROPOMI reflects the model bias at the satellite overpassing time. We find GEOS-Chem underestimated NO2 (NMB = −16 % to −28 %) over the Amazonian region (50–75° W, 15° S–5° N) during the wet season (December–May) compared with TROPOMI. However, we find that GEOS-Chem overestimated NO2 (NMB = 21 % to 77 %) during the dry season (July–October) in 2019 over the southern parts of Amazon, primarily due to fires. Table 2 shows the percentage changes in GEOS-Chem monthly mean NO2 columns (ΔNO2) over tropical South America from our sensitivity tests compared with our base case during wet and dry months. ΔNO2 over the Amazon is shown in Table S2. We find that near to source regions, NOx emissions mostly affect the lower troposphere, as expected. GEOS-Chem ΔNO2 is typically lower during wet months due to stronger convections and to higher loss rates during the wet season, particularly from deposition and atmospheric chemistry.
We derive CrIS-based isoprene emission estimates for all sensitivity cases, using the method described in Sect. 2.5, to examine their sensitivity to potential biases in NOx emissions. We find that monthly spatial distributions of Eisop generally do not vary significantly with different scaling factors (see Fig. S3). Table 3 summarizes the relative changes in CrIS-derived emission estimates (ΔEisop) for wet and dry seasons, under different NOx emission levels. We include the dry-to-wet and wet-to-dry months to calculate the annual mean ΔEisop. Satellite-predicted values of Eisop increase (decrease) with higher (lower) NOx emissions. Figure 5b summarizes the monthly Eisop and the corresponding isoprene lifetimes from all model grids over tropical South America, showing that lower NOx emissions (EmisScale_NO < 1) generally have longer isoprene lifetimes and lower predicted isoprene emission estimates. Underestimated NOx emissions over the Amazon can lead to higher isoprene lifetime and thus lower predicted isoprene emission rates.
Table 3Mean relative changes (%) in monthly CrIS-derived isoprene emission rates under different NOx emission levels compared with the default case (EmisScale_NO = 1) during the wet and dry season.
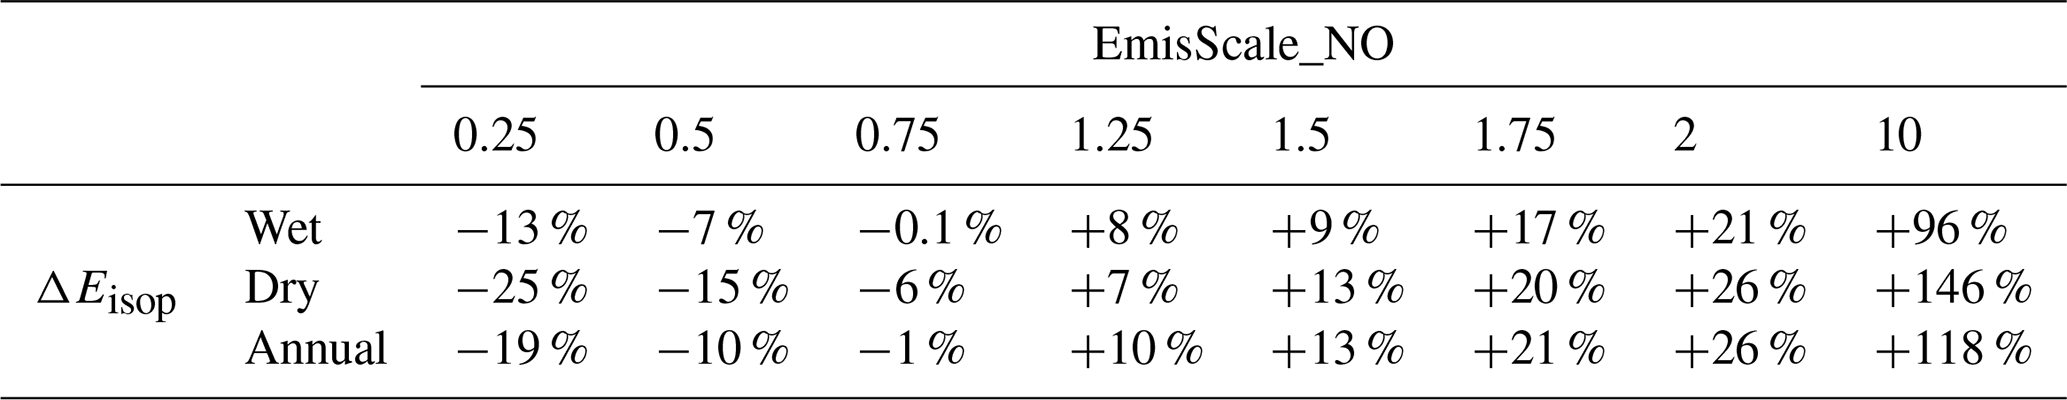
To compensate for the NO2 column model negative bias (NMB = −16 % to 28 %) over the Amazon during the wet season and the NO2 column model positive bias (NMB = 21 %–77 %) during the dry season over the southern Amazon, we use scale factors of 1.25 (ΔNO2 = +18 % for wet season) and 0.25 (ΔNO2 = −68 % for dry season) to estimate CrIS-based isoprene emission estimates. The predicted satellite-based emission rates would be increased by ∼ 8 % during the wet months and reduced by ∼ 25 % during the dry months accordingly (Table 3). Figure 5a shows the monthly mean CrIS isoprene emission estimates corresponding to our sensitivity cases over the Amazon. We find that the seasonal variation in the isoprene emission estimates that correspond to the NOx sensitivity experiments follows our base case (Fig. 3). Considering the potential model biases in NOx emissions, satellite-based isoprene emission rates can vary by about ±20 % annually.
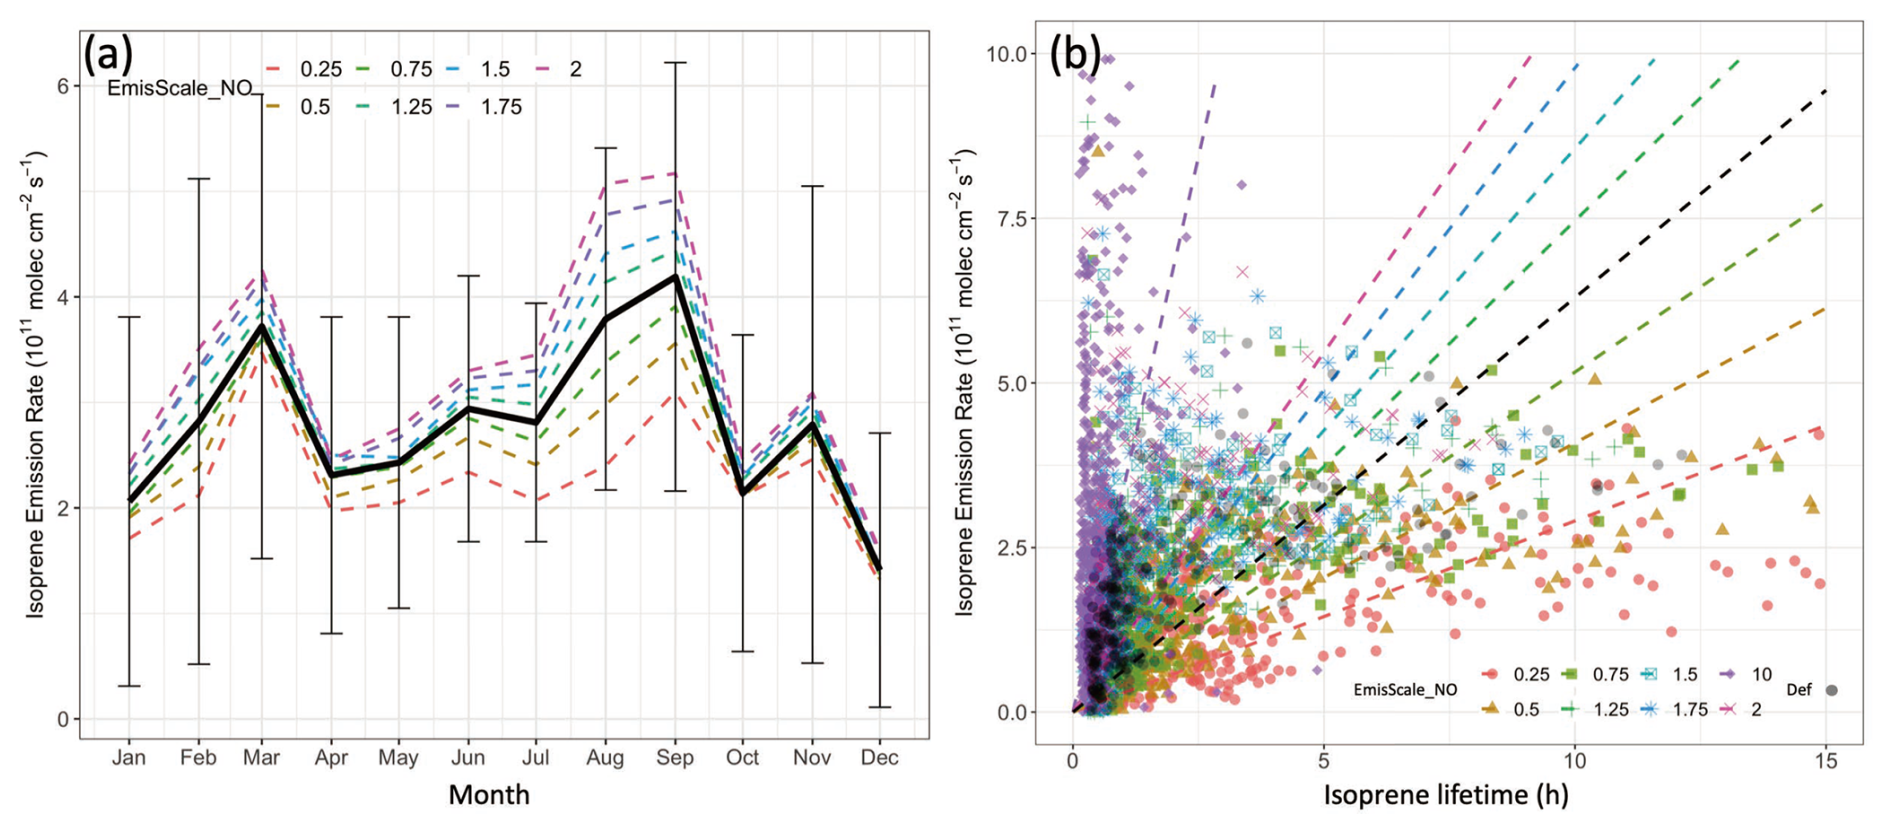
Figure 5(a) Monthly mean CrIS-based isoprene emission rates (Eisop, 1011 molec. cm−2 s−1) over the Amazonian region under different NOx emission levels. Black line indicates the monthly mean with standard deviations of the default case (EmisScale_NO = 1). (b) Annual mean CrIS-derived isoprene emission rates vs. isoprene midday lifetime under different NO2 emission levels over tropical South America. Default CrIS isoprene emission rates are shown in black.
Figure 6 shows monthly isoprene emission rates inferred from CrIS isoprene column data for which grid-dependent NOx emissions are scaled using TROPOMI tropospheric NO2 columns. These grid-dependent scaling factors are determined by monthly NO2 column differences between GEOS-Chem and TROPOMI (Fig. S2). For example, for a model grid where the monthly TROPOMI NO2 column is 75 % lower than the corresponding GEOS-Chem value, we scale the model NOx emissions by a factor of 0.25 (EmisScale_NO = 0.25). Using this approach, we account for the spatial distribution of model biases in NOx emissions. As a caveat, scaling the NOx emissions in the model in this way does not necessarily reflect the real emission biases. For example, the influences of convection and advection are not considered in the distribution of atmospheric NOx. Moreover, these scaling factors are calculated at the satellite overpass time and consequently do not represent any time dependence in model bias. We examine the monthly simulated isoprene mole fractions with scaled NOx emissions at the ATTO site. The scaling factor is 1.25 for March to May, 0.75 for July to September, and 1 for June and October to December based on the monthly differences between model and satellite NO2 columns at ATTO. The resulting model bias is reduced for wet and dry months. For wet months (March–May), the mean model isoprene mole fraction is reduced from 4.2 to 3.8 ppbv, corresponding to higher NOx emission levels, compared with the observed value of 2.9 ppbv. For dry months (July–September), the mean model isoprene mole fraction is increased from 3.2 to 3.6 ppbv, corresponding to lower NOx emission levels, closer to the observed value of 3.6 ppbv.
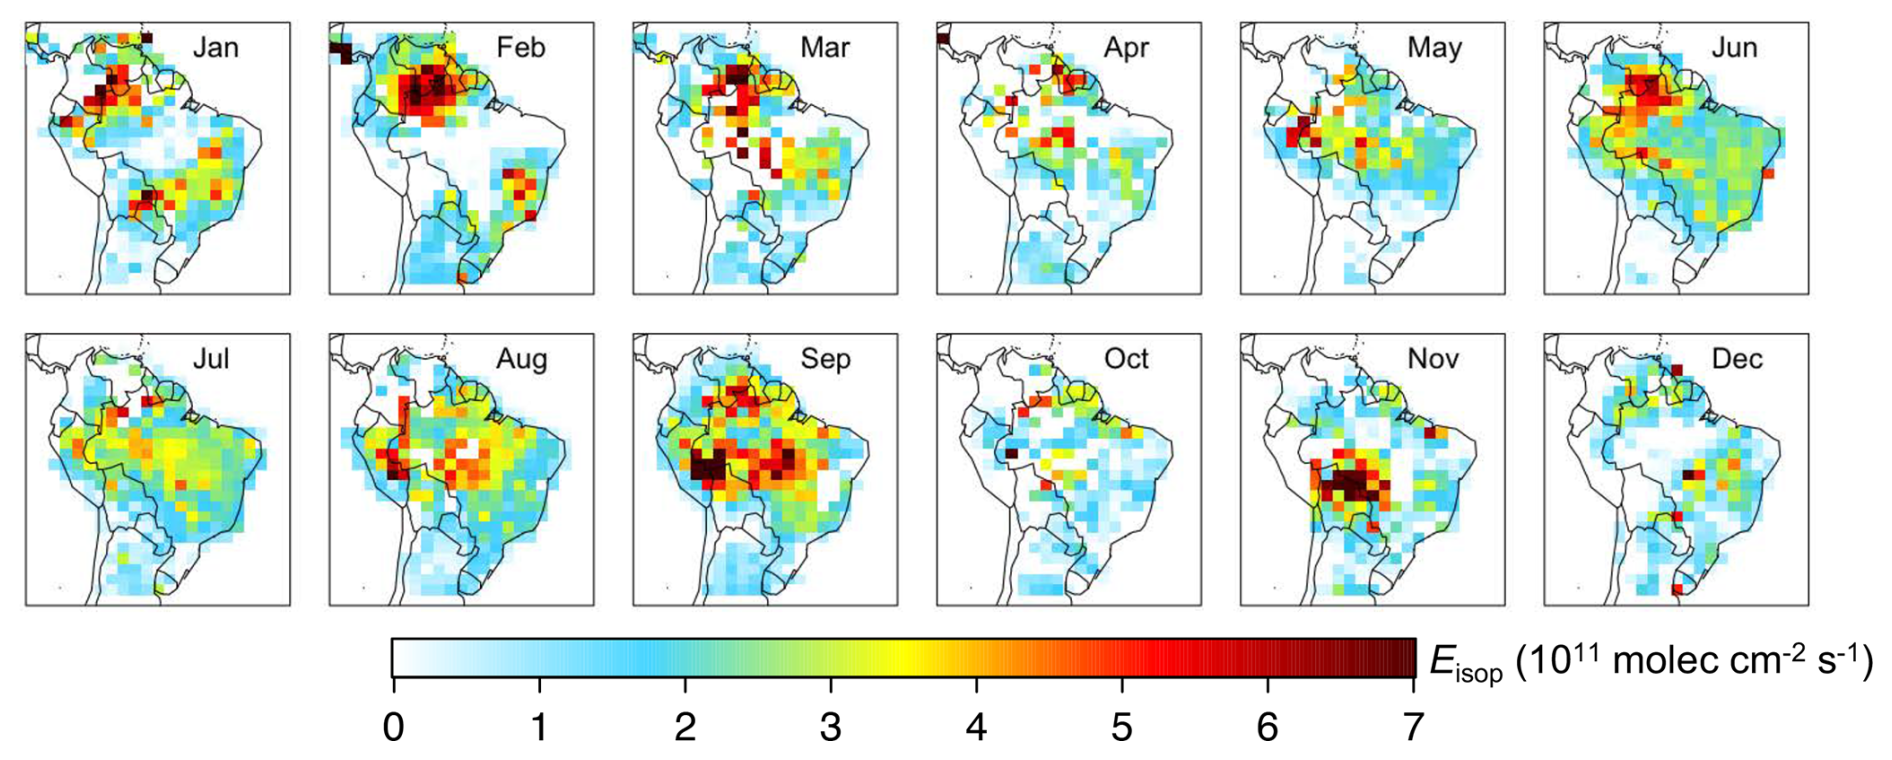
Figure 6Monthly CrIS-derived isoprene emission rates over tropical South America for 2019 using grid-dependent scaled NOx emissions.
Using the GEOS-Chem atmospheric chemistry transport model, we derived top-down isoprene emissions over tropical South America for 2019 using isoprene columns retrieved from CrIS on the NOAA-20 satellite. We found that isoprene emission estimates inferred from CrIS data result in very different spatial and seasonal distributions of isoprene columns over tropical South America than when we use the MEGAN isoprene emission inventory.
We evaluated our CrIS-derived isoprene emissions by comparing the corresponding isoprene concentrations with observations collected at the Amazon Tall Tower Observatory, March–December 2019, and found the CrIS-derived isoprene emissions reproduce the magnitude of the seasonal cycle better than MEGAN, with smaller monthly biases. The CrIS-derived isoprene emission inventory was evaluated by comparing modelled HCHO distributions based on itself against TROPOMI HCHO. We found that this isoprene emission inventory reduced the annual normalized mean error from 50 % to 43 %, relative to MEGAN, and reduced the NME from 58 % to 47 % during the wet season (December–May) and from 36 % to 33 % for the dry season (July–October). We find that the satellite-derived isoprene emission estimates improve the model's ability to describe monthly variations, with individual monthly values varying by about ±20 % with model NOx emission biases. We find that accounting for model biases in NOx emissions using satellite-retrieved NO2 columns can potentially improve the satellite-derived isoprene emissions.
More accurate estimates of isoprene are of great importance for understanding the relative contribution of anthropogenic and biogenic sources to the formation of ozone and secondary organic aerosol in the upper troposphere (Palmer et al., 2022; Curtius et al., 2024; Shen et al., 2024). Human-induced land use and land cover changes have been found to strongly influence isoprene emissions during recent decades compared with those induced by climate change (Chen et al., 2018). Satellite retrievals of isoprene columns, interpreted using state-of-the-art atmospheric chemistry transport models, can help us understand some of the impacts on atmospheric composition from, for example, continuing deforestation, widespread drought, and heatwaves. Recent work has shown that these data can also track changes in atmospheric oxidation over forested regions (Shutter et al., 2024). Tracking changes in isoprene over tropical rainforests, in the context of wider land surface quantities, provides a way to check on the health of these remote ecosystems. The Amazon basin has suffered from severe droughts in recent years, associated with deforestation and changes in climate (Bottino et al., 2024; Espinoza et al., 2024). The El Niño–Southern Oscillation has also contributed to droughts in Amazonia and is predicted to induce more extreme heatwaves and floods over this region in the future (Marengo and Espinoza, 2016). At a time when we are witnessing such extensive and widespread environmental change, particularly across the tropics, it is essential we sustain these important environment datasets (Millet et al., 2024) because they may comprise one of the first harbingers of an emerging feedback (Spracklen and Coelho, 2023).
GEOS-Chem model code and input data are available from the GEOS-Chem website (http://www.geos-chem.org, last access: 5 October 2025). TROPOMI HCHO and NO2 data can be found at https://doi.org/10.5270/S5P-vg1i7t0 (last access: 1 August 2023) and https://doi.org/10.5270/S5P-9bnp8q8 (last access: 1 August 2023), respectively (Copernicus Sentinel-5P, 2020, 2021). The CrIS isoprene data are to be archived on the Centre for Environmental Data Analysis (CEDA) archive (https://archive.ceda.ac.uk/, last access: 10 November 2025).
The supplement related to this article is available online at https://doi.org/10.5194/acp-25-15801-2025-supplement.
SS led the experimental design and the associated model runs and data analysis. PIP helped to design the study and wrote the manuscript with SS. All authors helped to revise the manuscript. RS, BJK, and LV provided the CrIS isoprene data and the support necessary to apply these data to study isoprene emissions. AE, AR, EYP, and JW contributed isoprene measurements at the ATTO site.
At least one of the (co-)authors is a member of the editorial board of Atmospheric Chemistry and Physics. The peer-review process was guided by an independent editor, and the authors also have no other competing interests to declare.
Publisher's note: Copernicus Publications remains neutral with regard to jurisdictional claims made in the text, published maps, institutional affiliations, or any other geographical representation in this paper. While Copernicus Publications makes every effort to include appropriate place names, the final responsibility lies with the authors. Also, please note that this paper has not received English language copy-editing. Views expressed in the text are those of the authors and do not necessarily reflect the views of the publisher.
This research was supported by the UK National Centre for Earth Observation (NCEO) funded by the Natural Environment Research Council (NE/R016518/1).
This research has been supported by the National Centre for Earth Observation (grant no. NE/R016518/1).
This paper was edited by Kelvin Bates and reviewed by two anonymous referees.
Abbot, D. S., Palmer, P. I., Martin, R. V., Chance, K. V., Jacob, D. J., and Guenther, A.: Seasonal and interannual variability of North American isoprene emissions as determined by formaldehyde column measurements from space, Geophys. Res. Lett., 30, 1886, https://doi.org/10.1029/2003GL017336, 2003.
Andreae, M. O., Acevedo, O. C., Araùjo, A., Artaxo, P., Barbosa, C. G. G., Barbosa, H. M. J., Brito, J., Carbone, S., Chi, X., Cintra, B. B. L., da Silva, N. F., Dias, N. L., Dias-Júnior, C. Q., Ditas, F., Ditz, R., Godoi, A. F. L., Godoi, R. H. M., Heimann, M., Hoffmann, T., Kesselmeier, J., Könemann, T., Krüger, M. L., Lavric, J. V., Manzi, A. O., Lopes, A. P., Martins, D. L., Mikhailov, E. F., Moran-Zuloaga, D., Nelson, B. W., Nölscher, A. C., Santos Nogueira, D., Piedade, M. T. F., Pöhlker, C., Pöschl, U., Quesada, C. A., Rizzo, L. V., Ro, C.-U., Ruckteschler, N., Sá, L. D. A., de Oliveira Sá, M., Sales, C. B., dos Santos, R. M. N., Saturno, J., Schöngart, J., Sörgel, M., de Souza, C. M., de Souza, R. A. F., Su, H., Targhetta, N., Tóta, J., Trebs, I., Trumbore, S., van Eijck, A., Walter, D., Wang, Z., Weber, B., Williams, J., Winderlich, J., Wittmann, F., Wolff, S., and Yáñez-Serrano, A. M.: The Amazon Tall Tower Observatory (ATTO): overview of pilot measurements on ecosystem ecology, meteorology, trace gases, and aerosols, Atmos. Chem. Phys., 15, 10723–10776, https://doi.org/10.5194/acp-15-10723-2015, 2015.
Arneth, A., Monson, R. K., Schurgers, G., Niinemets, Ü., and Palmer, P. I.: Why are estimates of global terrestrial isoprene emissions so similar (and why is this not so for monoterpenes)?, Atmos. Chem. Phys., 8, 4605–4620, https://doi.org/10.5194/acp-8-4605-2008, 2008.
Atkinson, R.: Atmospheric chemistry of VOCs and NOx, Atmos. Environ., 34, 2063–2101, https://doi.org/10.1016/S1352-2310(99)00460-4, 2000.
Barket Jr., D. J., Grossenbacher, J. W., Hurst, J. M., Shepson, P. B., Olszyna, K., Thornberry, T., Carroll, M. A., Roberts, J., Stroud, C., Bottenheim, J., and Biesenthal, T.: A study of the NOx dependence of isoprene oxidation, J. Geophys. Res., 109, D11310, https://doi.org/10.1029/2003JD003965, 2004.
Barkley, M. P., Palmer, P. I., Kuhn, U., Kesselmeier, J., Chance, K., Kurosu, T. P., Martin, R. V., Helmig, D., and Guenther, A.: Net ecosystem fluxes of isoprene over tropical South America inferred from Global Ozone Monitoring Experiment (GOME) observations of HCHO columns, J. Geophys. Res., 113, D20304, https://doi.org/10.1029/2008JD009863, 2008.
Barkley, M. P., Palmer, P. I., De Smedt, I., Karl, T., Guenther, A., and Van Roozendael, M.: Regulated large-scale annual shutdown of Amazonian isoprene emissions?, Geophys. Res. Lett., 36, L04803, https://doi.org/10.1029/2008GL036843, 2009.
Barkley, M. P., Palmer, P. I., Ganzeveld, L., Arneth, A., Hagberg, D., Karl, T., Guenther, A., Paulot, F., Wennberg, P. O., Mao, J., Kurosu, T. P., Chance, K., Müller, J.-F., De Smedt, I., Van Roozendael, M., Chen, D., Wang, Y., and Yantosca, R. M.: Can a “state of the art” chemistry transport model simulate Amazonian tropospheric chemistry?, J. Geophys. Res., 116, D16302, https://doi.org/10.1029/2011JD015893, 2011.
Barkley, M. P., Smedt, I. D., Van Roozendael, M., Kurosu, T. P., Chance, K., Arneth, A., Hagberg, D., Guenther, A., Paulot, F., Marais, E., and Mao, J.: Top-down isoprene emissions over tropical South America inferred from SCIAMACHY and OMI formaldehyde columns, J. Geophys. Res.-Atmos., 118, 6849–6868, https://doi.org/10.1002/jgrd.50552, 2013.
Bates, K. H. and Jacob, D. J.: A new model mechanism for atmospheric oxidation of isoprene: global effects on oxidants, nitrogen oxides, organic products, and secondary organic aerosol, Atmos. Chem. Phys., 19, 9613–9640, https://doi.org/10.5194/acp-19-9613-2019, 2019.
Bauwens, M., Stavrakou, T., Müller, J.-F., De Smedt, I., Van Roozendael, M., van der Werf, G. R., Wiedinmyer, C., Kaiser, J. W., Sindelarova, K., and Guenther, A.: Nine years of global hydrocarbon emissions based on source inversion of OMI formaldehyde observations, Atmos. Chem. Phys., 16, 10133–10158, https://doi.org/10.5194/acp-16-10133-20166, 2016.
Botía, S., Komiya, S., Marshall, J., Koch, T., Gałkowski, M., Lavric, J., Gomes-Alves, E., Walter, D., Fisch, G., Pinho, D. M., Nelson, B. W., Martins, G., Luijkx, I. T., Koren, G., Florentie, L., Carioca De Araújo, A., Sá, M., Andreae, M. O., Heimann, M., Peters, W., and Gerbig, C.: The CO2 record at the Amazon Tall Tower Observatory: A new opportunity to study processes on seasonal and inter-annual scales, Glob. Change Biol., 28, 588–611, https://doi.org/10.1111/gcb.15905, 2022.
Bottino, M. J., Nobre, P., Giarolla, E., Da Silva Junior, M. B., Capistrano, V. B., Malagutti, M., Tamaoki, J. N., De Oliveira, B. F. A., and Nobre, C. A.: Amazon savannization and climate change are projected to increase dry season length and temperature extremes over Brazil, Sci. Rep., 14, 5131, https://doi.org/10.1038/s41598-024-55176-5, 2024.
Bourtsoukidis, E., Pozzer, A., Williams, J., Makowski, D., Peñuelas, J., Matthaios, V. N., Lazoglou, G., Yañez-Serrano, A. M., Lelieveld, J., Ciais, P., Vrekoussis, M., Daskalakis, N., and Sciare, J.: High temperature sensitivity of monoterpene emissions from global vegetation, Communications Earth & Environment, 5, 23, https://doi.org/10.1038/s43247-023-01175-9, 2024.
Byron, J., Kreuzwieser, J., Purser, G., Van Haren, J., Ladd, S. N., Meredith, L. K., Werner, C., and Williams, J.: Chiral monoterpenes reveal forest emission mechanisms and drought responses, Nature, 609, 307–312, https://doi.org/10.1038/s41586-022-05020-5, 2022.
Carlton, A. G., Wiedinmyer, C., and Kroll, J. H.: A review of Secondary Organic Aerosol (SOA) formation from isoprene, Atmos. Chem. Phys., 9, 4987–5005, https://doi.org/10.5194/acp-9-4987-2009, 2009.
Chen, W. H., Guenther, A. B., Wang, X. M., Chen, Y. H., Gu, D. S., Chang, M., Zhou, S. Z., Wu, L. L., and Zhang, Y. Q.: Regional to Global Biogenic Isoprene Emission Responses to Changes in Vegetation From 2000 to 2015, J. Geophys. Res.-Atmos., 123, 3757–3771, https://doi.org/10.1002/2017JD027934, 2018.
Claeys, M., Graham, B., Vas, G., Wang, W., Vermeylen, R., Pashynska, V., Cafmeyer, J., Guyon, P., Andreae, M. O., Artaxo, P., and Maenhaut, W.: Formation of Secondary Organic Aerosols Through Photooxidation of Isoprene, Science, 303, 1173–1176, https://doi.org/10.1126/science.1092805, 2004.
Copernicus Sentinel-5P (processed by ESA): TROPOMI Level 2 Formaldehyde Total Column products, Version 02, European Space Agency [data set], https://doi.org/10.5270/S5P-vg1i7t0, 2020.
Copernicus Sentinel-5P (processed by ESA): TROPOMI Level 2 Nitrogen Dioxide total column products, Version 02, European Space Agency [data set], https://doi.org/10.5270/S5P-9bnp8q8, 2021.
Curtius, J., Heinritzi, M., Beck, L. J., Pöhlker, M. L., Tripathi, N., Krumm, B. E., Holzbeck, P., Nussbaumer, C. M., Hernández Pardo, L., Klimach, T., Barmpounis, K., Andersen, S. T., Bardakov, R., Bohn, B., Cecchini, M. A., Chaboureau, J.-P., Dauhut, T., Dienhart, D., Dörich, R., Edtbauer, A., Giez, A., Hartmann, A., Holanda, B. A., Joppe, P., Kaiser, K., Keber, T., Klebach, H., Krüger, O. O., Kürten, A., Mallaun, C., Marno, D., Martinez, M., Monteiro, C., Nelson, C., Ort, L., Raj, S. S., Richter, S., Ringsdorf, A., Rocha, F., Simon, M., Sreekumar, S., Tsokankunku, A., Unfer, G. R., Valenti, I. D., Wang, N., Zahn, A., Zauner-Wieczorek, M., Albrecht, R. I., Andreae, M. O., Artaxo, P., Crowley, J. N., Fischer, H., Harder, H., Herdies, D. L., Machado, L. A. T., Pöhlker, C., Pöschl, U., Possner, A., Pozzer, A., Schneider, J., Williams, J., and Lelieveld, J.: Isoprene nitrates drive new particle formation in Amazon's upper troposphere, Nature, 636, 124–130, https://doi.org/10.1038/s41586-024-08192-4, 2024.
De Smedt, I., Theys, N., Yu, H., Danckaert, T., Lerot, C., Compernolle, S., Van Roozendael, M., Richter, A., Hilboll, A., Peters, E., Pedergnana, M., Loyola, D., Beirle, S., Wagner, T., Eskes, H., van Geffen, J., Boersma, K. F., and Veefkind, P.: Algorithm theoretical baseline for formaldehyde retrievals from S5P TROPOMI and from the QA4ECV project, Atmos. Meas. Tech., 11, 2395–2426, https://doi.org/10.5194/amt-11-2395-2018, 2018.
De Smedt, I., Romahn, F., and Eichmann, K.-U.: S5P Mission Performance Centre Formaldehyde [L2__HCHO___] Readme, S5P-MPC-BIRA-PRF-HCHO, 2.1, https://sentinels.copernicus.eu/documents/247904/3541451/Sentinel-5P-Formaldehyde-Readme.pdf (last access: 3 August 2023), 2020.
De Smedt, I., Pinardi, G., Vigouroux, C., Compernolle, S., Bais, A., Benavent, N., Boersma, F., Chan, K.-L., Donner, S., Eichmann, K.-U., Hedelt, P., Hendrick, F., Irie, H., Kumar, V., Lambert, J.-C., Langerock, B., Lerot, C., Liu, C., Loyola, D., Piters, A., Richter, A., Rivera Cárdenas, C., Romahn, F., Ryan, R. G., Sinha, V., Theys, N., Vlietinck, J., Wagner, T., Wang, T., Yu, H., and Van Roozendael, M.: Comparative assessment of TROPOMI and OMI formaldehyde observations and validation against MAX-DOAS network column measurements, Atmos. Chem. Phys., 21, 12561–12593, https://doi.org/10.5194/acp-21-12561-2021, 2021.
DiMaria, C. A., Jones, D. B. A., Worden, H., Bloom, A. A., Bowman, K., Stavrakou, T., Miyazaki, K., Worden, J., Guenther, A., Sarkar, C., Seco, R., Park, J., Tota, J., Alves, E. G., and Ferracci, V.: Optimizing the Isoprene Emission Model MEGAN With Satellite and Ground-Based Observational Constraints, J. Geophys. Res.-Atmos., 128, e2022JD037822, https://doi.org/10.1029/2022JD037822, 2023.
Eastham, S. D., Weisenstein, D. K., and Barrett, S. R. H.: Development and evaluation of the unified tropospheric–stratospheric chemistry extension (UCX) for the global chemistry-transport model GEOS-Chem, Atmos. Environ., 89, 52–63, https://doi.org/10.1016/j.atmosenv.2014.02.001, 2014.
Eskes, H. J. and Eichmann, K.-U.: S5P Mission Performance Centre Nitrogen Dioxide [L2__NO2__] Readme, S5P-MPC-KNMI-PRF-NO2, 1.6, https://sentinel.esa.int/documents/247904/3541451/Sentinel-5P-Nitrogen-Dioxide-Level-2-Product-Readme-File (last access: 24 June 2023), 2022.
Espinoza, J.-C., Jimenez, J. C., Marengo, J. A., Schongart, J., Ronchail, J., Lavado-Casimiro, W., and Ribeiro, J. V. M.: The new record of drought and warmth in the Amazon in 2023 related to regional and global climatic features, Sci. Rep., 14, 8107, https://doi.org/10.1038/s41598-024-58782-5, 2024.
Feng, L., Palmer, P. I., Parker, R. J., Lunt, M. F., and Bösch, H.: Methane emissions are predominantly responsible for record-breaking atmospheric methane growth rates in 2020 and 2021, Atmos. Chem. Phys., 23, 4863–4880, https://doi.org/10.5194/acp-23-4863-2023, 2023.
Feng, S., Jiang, F., Qian, T., Wang, N., Jia, M., Zheng, S., Chen, J., Ying, F., and Ju, W.: Constraining non-methane VOC emissions with TROPOMI HCHO observations: impact on summertime ozone simulation in August 2022 in China, Atmos. Chem. Phys., 24, 7481–7498, https://doi.org/10.5194/acp-24-7481-2024, 2024.
Ferracci, V., Weber, J., Bolas, C. G., Robinson, A. D., Tummon, F., Rodríguez-Ros, P., Cortés-Greus, P., Baccarini, A., Jones, R. L., Galí, M., Simó, R., Schmale, J., and Harris, N. R. P.: Atmospheric isoprene measurements reveal larger-than-expected Southern Ocean emissions, Nat. Commun., 15, 2571, https://doi.org/10.1038/s41467-024-46744-4, 2024.
Fini, A., Brunetti, C., Loreto, F., Centritto, M., Ferrini, F., and Tattini, M.: Isoprene Responses and Functions in Plants Challenged by Environmental Pressures Associated to Climate Change, Front. Plant Sci., 8, 1281, https://doi.org/10.3389/fpls.2017.01281, 2017.
Fu, D., Millet, D. B., Wells, K. C., Payne, V. H., Yu, S., Guenther, A., and Eldering, A.: Direct retrieval of isoprene from satellite-based infrared measurements, Nat. Commun., 10, 3811, https://doi.org/10.1038/s41467-019-11835-0, 2019.
Fuchs, H., Hofzumahaus, A., Rohrer, F., Bohn, B., Brauers, T., Dorn, H.-P., Häseler, R., Holland, F., Kaminski, M., Li, X., Lu, K., Nehr, S., Tillmann, R., Wegener, R., and Wahner, A.: Experimental evidence for efficient hydroxyl radical regeneration in isoprene oxidation, Nat. Geosci., 6, 1023–1026, https://doi.org/10.1038/ngeo1964, 2013.
Giglio, L., Schroeder, W., Hall, J. V., and Justice, C. O.: MODIS Collection 6 Active Fire Product User's Guide, Revision C, NASA, https://modis-fire.umd.edu/files/MODIS_C6_Fire_User_Guide_C.pdf (last access: 1 September 2023), 2020.
Gomes Alves, E., Aquino Santana, R., Quaresma Dias-Júnior, C., Botía, S., Taylor, T., Yáñez-Serrano, A. M., Kesselmeier, J., Bourtsoukidis, E., Williams, J., Lembo Silveira de Assis, P. I., Martins, G., de Souza, R., Duvoisin Júnior, S., Guenther, A., Gu, D., Tsokankunku, A., Sörgel, M., Nelson, B., Pinto, D., Komiya, S., Martins Rosa, D., Weber, B., Barbosa, C., Robin, M., Feeley, K. J., Duque, A., Londoño Lemos, V., Contreras, M. P., Idarraga, A., López, N., Husby, C., Jestrow, B., and Cely Toro, I. M.: Intra- and interannual changes in isoprene emission from central Amazonia, Atmos. Chem. Phys., 23, 8149–8168, https://doi.org/10.5194/acp-23-8149-2023, 2023.
Gonzi, S., Palmer, P. I., Barkley, M. P., De Smedt, I., and Van Roozendael, M.: Biomass burning emission estimates inferred from satellite column measurements of HCHO: Sensitivity to co-emitted aerosol and injection height: HCHO BIOMASS BURNING EMISSIONS, Geophys. Res. Lett., 38, L14807, https://doi.org/10.1029/2011GL047890, 2011.
Gu, D., Guenther, A. B., Shilling, J. E., Yu, H., Huang, M., Zhao, C., Yang, Q., Martin, S. T., Artaxo, P., Kim, S., Seco, R., Stavrakou, T., Longo, K. M., Tóta, J., De Souza, R. A. F., Vega, O., Liu, Y., Shrivastava, M., Alves, E. G., Santos, F. C., Leng, G., and Hu, Z.: Airborne observations reveal elevational gradient in tropical forest isoprene emissions, Nat. Commun., 8, 15541, https://doi.org/10.1038/ncomms15541, 2017.
Guenther, A., Karl, T., Harley, P., Wiedinmyer, C., Palmer, P. I., and Geron, C.: Estimates of global terrestrial isoprene emissions using MEGAN (Model of Emissions of Gases and Aerosols from Nature), Atmos. Chem. Phys., 6, 3181–3210, https://doi.org/10.5194/acp-6-3181-2006, 2006.
Guenther, A. B., Jiang, X., Heald, C. L., Sakulyanontvittaya, T., Duhl, T., Emmons, L. K., and Wang, X.: The Model of Emissions of Gases and Aerosols from Nature version 2.1 (MEGAN2.1): an extended and updated framework for modeling biogenic emissions, Geosci. Model Dev., 5, 1471–1492, https://doi.org/10.5194/gmd-5-1471-2012, 2012.
Hansen, R. F., Lewis, T. R., Graham, L., Whalley, L. K., Seakins, P. W., Heard, D. E., and Blitz, M. A.: OH production from the photolysis of isoprene-derived peroxy radicals: cross-sections, quantum yields and atmospheric implications, Phys. Chem. Chem. Phys., 19, 2332–2345, https://doi.org/10.1039/C6CP06718B, 2017.
Hoesly, R. M., Smith, S. J., Feng, L., Klimont, Z., Janssens-Maenhout, G., Pitkanen, T., Seibert, J. J., Vu, L., Andres, R. J., Bolt, R. M., Bond, T. C., Dawidowski, L., Kholod, N., Kurokawa, J.-I., Li, M., Liu, L., Lu, Z., Moura, M. C. P., O'Rourke, P. R., and Zhang, Q.: Historical (1750–2014) anthropogenic emissions of reactive gases and aerosols from the Community Emissions Data System (CEDS), Geosci. Model Dev., 11, 369–408, https://doi.org/10.5194/gmd-11-369-2018, 2018.
Hofzumahaus, A., Rohrer, F., Lu, K., Bohn, B., Brauers, T., Chang, C.-C., Fuchs, H., Holland, F., Kita, K., Kondo, Y., Li, X., Lou, S., Shao, M., Zeng, L., Wahner, A., and Zhang, Y.: Amplified Trace Gas Removal in the Troposphere, Science, 324, 1702–1704, https://doi.org/10.1126/science.1164566, 2009.
Hudman, R. C., Moore, N. E., Mebust, A. K., Martin, R. V., Russell, A. R., Valin, L. C., and Cohen, R. C.: Steps towards a mechanistic model of global soil nitric oxide emissions: implementation and space based-constraints, Atmos. Chem. Phys., 12, 7779–7795, https://doi.org/10.5194/acp-12-7779-2012, 2012.
Jiang, X., Guenther, A., Potosnak, M., Geron, C., Seco, R., Karl, T., Kim, S., Gu, L., and Pallardy, S.: Isoprene emission response to drought and the impact on global atmospheric chemistry, Atmos. Environ., 183, 69–83, https://doi.org/10.1016/j.atmosenv.2018.01.026, 2018.
Kaiser, J., Jacob, D. J., Zhu, L., Travis, K. R., Fisher, J. A., González Abad, G., Zhang, L., Zhang, X., Fried, A., Crounse, J. D., St. Clair, J. M., and Wisthaler, A.: High-resolution inversion of OMI formaldehyde columns to quantify isoprene emission on ecosystem-relevant scales: application to the southeast US, Atmos. Chem. Phys., 18, 5483–5497, https://doi.org/10.5194/acp-18-5483-2018, 2018.
Kroll, J. H., Ng, N. L., Murphy, S. M., Flagan, R. C., and Seinfeld, J. H.: Secondary organic aerosol formation from isoprene photooxidation under high-NOx conditions, Geophys. Res. Lett., 32, L18808, https://doi.org/10.1029/2005GL023637, 2005.
Kroll, J. H., Ng, N. L., Murphy, S. M., Flagan, R. C., and Seinfeld, J. H.: Secondary Organic Aerosol Formation from Isoprene Photooxidation, Environ. Sci. Technol., 40, 1869–1877, https://doi.org/10.1021/es0524301, 2006.
Lelieveld, J., Butler, T. M., Crowley, J. N., Dillon, T. J., Fischer, H., Ganzeveld, L., Harder, H., Lawrence, M. G., Martinez, M., Taraborrelli, D., and Williams, J.: Atmospheric oxidation capacity sustained by a tropical forest, Nature, 452, 737–740, https://doi.org/10.1038/nature06870, 2008.
Li, X., Zhu, L., De Smedt, I., Sun, W., Chen, Y., Shu, L., Wang, D., Liu, S., Pu, D., Li, J., Zuo, X., Fu, W., Li, Y., Zhang, P., Yan, Z., Fu, T., Shen, H., Wang, C., Ye, J., and Yang, X.: Global Temperature Dependency of Biogenic HCHO Columns Observed From Space: Interpretation of TROPOMI Results Using GEOS-Chem Model, J. Geophys. Res.-Atmos., 129, e2024JD041784, https://doi.org/10.1029/2024JD041784, 2024.
Lian, X., Morfopoulos, C., and Gentine, P.: Water deficit and storm disturbances co-regulate Amazon rainforest seasonality, Sci. Adv., 10, eadk5861, https://doi.org/10.1126/sciadv.adk5861, 2024.
Liu, Y., Brito, J., Dorris, M. R., Rivera-Rios, J. C., Seco, R., Bates, K. H., Artaxo, P., Duvoisin, S., Keutsch, F. N., Kim, S., Goldstein, A. H., Guenther, A. B., Manzi, A. O., Souza, R. A. F., Springston, S. R., Watson, T. B., McKinney, K. A., and Martin, S. T.: Isoprene photochemistry over the Amazon rainforest, Proc. Natl. Acad. Sci. U.S.A., 113, 6125–6130, https://doi.org/10.1073/pnas.1524136113, 2016.
Marais, E. A., Jacob, D. J., Kurosu, T. P., Chance, K., Murphy, J. G., Reeves, C., Mills, G., Casadio, S., Millet, D. B., Barkley, M. P., Paulot, F., and Mao, J.: Isoprene emissions in Africa inferred from OMI observations of formaldehyde columns, Atmos. Chem. Phys., 12, 6219–6235, https://doi.org/10.5194/acp-12-6219-2012, 2012.
Marais, E. A., Jacob, D. J., Jimenez, J. L., Campuzano-Jost, P., Day, D. A., Hu, W., Krechmer, J., Zhu, L., Kim, P. S., Miller, C. C., Fisher, J. A., Travis, K., Yu, K., Hanisco, T. F., Wolfe, G. M., Arkinson, H. L., Pye, H. O. T., Froyd, K. D., Liao, J., and McNeill, V. F.: Aqueous-phase mechanism for secondary organic aerosol formation from isoprene: application to the southeast United States and co-benefit of SO2 emission controls, Atmos. Chem. Phys., 16, 1603–1618, https://doi.org/10.5194/acp-16-1603-2016, 2016.
Marengo, J. A. and Espinoza, J. C.: Extreme seasonal droughts and floods in Amazonia: causes, trends and impacts, Int. J. Climatol., 36, 1033–1050, https://doi.org/10.1002/joc.4420, 2016.
Marvin, M. R., Wolfe, G. M., Salawitch, R. J., Canty, T. P., Roberts, S. J., Travis, K. R., Aikin, K. C., De Gouw, J. A., Graus, M., Hanisco, T. F., Holloway, J. S., Hübler, G., Kaiser, J., Keutsch, F. N., Peischl, J., Pollack, I. B., Roberts, J. M., Ryerson, T. B., Veres, P. R., and Warneke, C.: Impact of evolving isoprene mechanisms on simulated formaldehyde: An inter-comparison supported by in situ observations from SENEX, Atmos. Environ., 164, 325–336, https://doi.org/10.1016/j.atmosenv.2017.05.049, 2017.
Mayhew, A. W., Edwards, P. M., and Hamilton, J. F.: Daytime isoprene nitrates under changing NOx and O3, Atmos. Chem. Phys., 23, 8473–8485, https://doi.org/10.5194/acp-23-8473-2023, 2023.
Millet, D. B., Jacob, D. J., Boersma, K. F., Fu, T., Kurosu, T. P., Chance, K., Heald, C. L., and Guenther, A.: Spatial distribution of isoprene emissions from North America derived from formaldehyde column measurements by the OMI satellite sensor, J. Geophys. Res., 113, D02307, https://doi.org/10.1029/2007JD008950, 2008.
Millet, D. B., Baasandorj, M., Hu, L., Mitroo, D., Turner, J., and Williams, B. J.: Nighttime Chemistry and Morning Isoprene Can Drive Urban Ozone Downwind of a Major Deciduous Forest, Environ. Sci. Technol., 50, 4335–4342, https://doi.org/10.1021/acs.est.5b06367, 2016.
Millet, D. B., Palmer, P. I., Levelt, P. F., Gallardo, L., and Shikwambana, L.: Coordinated Geostationary, Multispectral Satellite Observations Are Critical for Climate and Air Quality Progress, AGU Advances, 5, e2024AV001322, https://doi.org/10.1029/2024AV001322, 2024.
Miyoshi, A., Hatakeyama, S., and Washida, N.: OH radical-initiated photooxidation of isoprene: An estimate of global CO production, J. Geophys. Res., 99, 18779–18787, https://doi.org/10.1029/94JD01334, 1994.
Monson, R. K., Jones, R. T., Rosenstiel, T. N., and Schnitzler, J.: Why only some plants emit isoprene, Plant Cell Environ., 36, 503–516, https://doi.org/10.1111/pce.12015, 2013.
Müller, J.-F., Stavrakou, T., Wallens, S., De Smedt, I., Van Roozendael, M., Potosnak, M. J., Rinne, J., Munger, B., Goldstein, A., and Guenther, A. B.: Global isoprene emissions estimated using MEGAN, ECMWF analyses and a detailed canopy environment model, Atmos. Chem. Phys., 8, 1329–1341, https://doi.org/10.5194/acp-8-1329-2008, 2008.
Müller, J.-F., Stavrakou, T., Oomen, G.-M., Opacka, B., De Smedt, I., Guenther, A., Vigouroux, C., Langerock, B., Aquino, C. A. B., Grutter, M., Hannigan, J., Hase, F., Kivi, R., Lutsch, E., Mahieu, E., Makarova, M., Metzger, J.-M., Morino, I., Murata, I., Nagahama, T., Notholt, J., Ortega, I., Palm, M., Röhling, A., Stremme, W., Strong, K., Sussmann, R., Té, Y., and Fried, A.: Bias correction of OMI HCHO columns based on FTIR and aircraft measurements and impact on top-down emission estimates, Atmos. Chem. Phys., 24, 2207–2237, https://doi.org/10.5194/acp-24-2207-2024, 2024.
Nölscher, A. C., Yañez-Serrano, A. M., Wolff, S., De Araujo, A. C., Lavrič, J. V., Kesselmeier, J., and Williams, J.: Unexpected seasonality in quantity and composition of Amazon rainforest air reactivity, Nat. Commun., 7, 10383, https://doi.org/10.1038/ncomms10383, 2016.
Opacka, B., Müller, J.-F., Stavrakou, T., Bauwens, M., Sindelarova, K., Markova, J., and Guenther, A. B.: Global and regional impacts of land cover changes on isoprene emissions derived from spaceborne data and the MEGAN model, Atmos. Chem. Phys., 21, 8413–8436, https://doi.org/10.5194/acp-21-8413-2021, 2021.
Opacka, B., Stavrakou, T., Müller, J.-F., De Smedt, I., van Geffen, J., Marais, E. A., Horner, R. P., Millet, D. B., Wells, K. C., and Guenther, A. B.: Natural emissions of VOC and NOx over Africa constrained by TROPOMI HCHO and NO2 data using the MAGRITTEv1.1 model, Atmos. Chem. Phys., 25, 2863–2894, https://doi.org/10.5194/acp-25-2863-2025, 2025.
Palmer, P. I., Jacob, D. J., Fiore, A. M., Martin, R. V., Chance, K., and Kurosu, T. P.: Mapping isoprene emissions over North America using formaldehyde column observations from space, J. Geophys. Res., 108, 4180, https://doi.org/10.1029/2002JD002153, 2003.
Palmer, P. I., Abbot, D. S., Fu, T., Jacob, D. J., Chance, K., Kurosu, T. P., Guenther, A., Wiedinmyer, C., Stanton, J. C., Pilling, M. J., Pressley, S. N., Lamb, B., and Sumner, A. L.: Quantifying the seasonal and interannual variability of North American isoprene emissions using satellite observations of the formaldehyde column, J. Geophys. Res., 111, D12315, https://doi.org/10.1029/2005JD006689, 2006.
Palmer, P. I., Barkley, M. P., Kurosu, T. P., Lewis, A. C., Saxton, J. E., Chance, K., and Gatti, L. V.: Interpreting satellite column observations of formaldehyde over tropical South America, Philos. T. Roy. Soc. A., 365, 1741–1751, https://doi.org/10.1098/rsta.2007.2042, 2007.
Palmer, P. I., Marvin, M. R., Siddans, R., Kerridge, B. J., and Moore, D. P.: Nocturnal survival of isoprene linked to formation of upper tropospheric organic aerosol, Science, 375, 562–566, https://doi.org/10.1126/science.abg4506, 2022.
Pfannerstill, E. Y., Reijrink, N. G., Edtbauer, A., Ringsdorf, A., Zannoni, N., Araújo, A., Ditas, F., Holanda, B. A., Sá, M. O., Tsokankunku, A., Walter, D., Wolff, S., Lavrič, J. V., Pöhlker, C., Sörgel, M., and Williams, J.: Total OH reactivity over the Amazon rainforest: variability with temperature, wind, rain, altitude, time of day, season, and an overall budget closure, Atmos. Chem. Phys., 21, 6231–6256, https://doi.org/10.5194/acp-21-6231-2021, 2021.
Possell, M. and Hewitt, C. N.: Isoprene emissions from plants are mediated by atmospheric CO2 concentrations, Glob. Change Biol., 17, 1595–1610, https://doi.org/10.1111/j.1365-2486.2010.02306.x, 2011.
Pye, H. O. T., Chan, A. W. H., Barkley, M. P., and Seinfeld, J. H.: Global modeling of organic aerosol: the importance of reactive nitrogen (NOx and NO3), Atmos. Chem. Phys., 10, 11261–11276, https://doi.org/10.5194/acp-10-11261-2010, 2010.
Ringsdorf, A., Edtbauer, A., Vilà-Guerau De Arellano, J., Pfannerstill, E. Y., Gromov, S., Kumar, V., Pozzer, A., Wolff, S., Tsokankunku, A., Soergel, M., Sá, M. O., Araújo, A., Ditas, F., Poehlker, C., Lelieveld, J., and Williams, J.: Inferring the diurnal variability of OH radical concentrations over the Amazon from BVOC measurements, Sci. Rep., 13, 14900, https://doi.org/10.1038/s41598-023-41748-4, 2023.
Sahu, A., Mostofa, M. G., Weraduwage, S. M., and Sharkey, T. D.: Hydroxymethylbutenyl diphosphate accumulation reveals MEP pathway regulation for high CO2 -induced suppression of isoprene emission, P. Natl. Acad. Sci. USA, 120, e2309536120, https://doi.org/10.1073/pnas.2309536120, 2023.
Saunier, A., Ormeño, E., Piga, D., Armengaud, A., Boissard, C., Lathière, J., Szopa, S., Genard-Zielinski, A.-C., and Fernandez, C.: Isoprene contribution to ozone production under climate change conditions in the French Mediterranean area, Reg. Environ. Change, 20, 111, https://doi.org/10.1007/s10113-020-01697-4, 2020.
Seco, R., Holst, T., Davie-Martin, C. L., Simin, T., Guenther, A., Pirk, N., Rinne, J., and Rinnan, R.: Strong isoprene emission response to temperature in tundra vegetation, P. Natl. Acad. Sci. USA, 119, e2118014119, https://doi.org/10.1073/pnas.2118014119, 2022.
Sharkey, T. D., Wiberley, A. E., and Donohue, A. R.: Isoprene Emission from Plants: Why and How, Annals of Botany, 101, 5–18, https://doi.org/10.1093/aob/mcm240, 2007.
Shen, J., Russell, D. M., DeVivo, J., Kunkler, F., Baalbaki, R., Mentler, B., Scholz, W., Yu, W., Caudillo-Plath, L., Sommer, E., Ahongshangbam, E., Alfaouri, D., Almeida, J., Amorim, A., Beck, L. J., Beckmann, H., Berntheusel, M., Bhattacharyya, N., Canagaratna, M. R., Chassaing, A., Cruz-Simbron, R., Dada, L., Duplissy, J., Gordon, H., Granzin, M., Große Schute, L., Heinritzi, M., Iyer, S., Klebach, H., Krüger, T., Kürten, A., Lampimäki, M., Liu, L., Lopez, B., Martinez, M., Morawiec, A., Onnela, A., Peltola, M., Rato, P., Reza, M., Richter, S., Rörup, B., Sebastian, M. K., Simon, M., Surdu, M., Tamme, K., Thakur, R. C., Tomé, A., Tong, Y., Top, J., Umo, N. S., Unfer, G., Vettikkat, L., Weissbacher, J., Xenofontos, C., Yang, B., Zauner-Wieczorek, M., Zhang, J., Zheng, Z., Baltensperger, U., Christoudias, T., Flagan, R. C., El Haddad, I., Junninen, H., Möhler, O., Riipinen, I., Rohner, U., Schobesberger, S., Volkamer, R., Winkler, P. M., Hansel, A., Lehtipalo, K., Donahue, N. M., Lelieveld, J., Harder, H., Kulmala, M., Worsnop, D. R., Kirkby, J., Curtius, J., and He, X.-C.: New particle formation from isoprene under upper-tropospheric conditions, Nature, 636, 115–123, https://doi.org/10.1038/s41586-024-08196-0, 2024.
Shim, C., Wang, Y., Choi, Y., Palmer, P. I., Abbot, D. S., and Chance, K.: Constraining global isoprene emissions with Global Ozone Monitoring Experiment (GOME) formaldehyde column measurements, J. Geophys. Res., 110, D24301, https://doi.org/10.1029/2004JD005629, 2005.
Shutter, J. D., Millet, D. B., Wells, K. C., Payne, V. H., Nowlan, C. R., and Abad, G. G.: Interannual changes in atmospheric oxidation over forests determined from space, Sci. Adv., 10, eadn1115, https://doi.org/10.1126/sciadv.adn1115, 2024.
Spracklen, D. V. and Coelho, C. A. S.: Modeling early warning signs of possible Amazon Forest dieback, Sci. Adv., 9, eadk5670, https://doi.org/10.1126/sciadv.adk5670, 2023.
Stavrakou, T., Müller, J.-F., De Smedt, I., Van Roozendael, M., van der Werf, G. R., Giglio, L., and Guenther, A.: Evaluating the performance of pyrogenic and biogenic emission inventories against one decade of space-based formaldehyde columns, Atmos. Chem. Phys., 9, 1037–1060, https://doi.org/10.5194/acp-9-1037-2009, 2009.
Stavrakou, T., Müller, J.-F., Bauwens, M., De Smedt, I., Van Roozendael, M., Guenther, A., Wild, M., and Xia, X.: Isoprene emissions over Asia 1979–2012: impact of climate and land-use changes, Atmos. Chem. Phys., 14, 4587–4605, https://doi.org/10.5194/acp-14-4587-2014, 2014.
Surl, L., Palmer, P. I., and González Abad, G.: Which processes drive observed variations of HCHO columns over India?, Atmos. Chem. Phys., 18, 4549–4566, https://doi.org/10.5194/acp-18-4549-2018, 2018.
Tai, A. P. K., Mickley, L. J., Heald, C. L., and Wu, S.: Effect of CO2 inhibition on biogenic isoprene emission: Implications for air quality under 2000 to 2050 changes in climate, vegetation, and land use, Geophys. Res. Lett., 40, 3479–3483, https://doi.org/10.1002/grl.50650, 2013.
Taylor, T. C., McMahon, S. M., Smith, M. N., Boyle, B., Violle, C., Van Haren, J., Simova, I., Meir, P., Ferreira, L. V., De Camargo, P. B., Da Costa, A. C. L., Enquist, B. J., and Saleska, S. R.: Isoprene emission structures tropical tree biogeography and community assembly responses to climate, New Phytol., 220, 435–446, https://doi.org/10.1111/nph.15304, 2018.
van der Werf, G. R., Randerson, J. T., Giglio, L., van Leeuwen, T. T., Chen, Y., Rogers, B. M., Mu, M., van Marle, M. J. E., Morton, D. C., Collatz, G. J., Yokelson, R. J., and Kasibhatla, P. S.: Global fire emissions estimates during 1997–2016, Earth Syst. Sci. Data, 9, 697–720, https://doi.org/10.5194/essd-9-697-2017, 2017.
van Geffen, J., Eskes, H., Compernolle, S., Pinardi, G., Verhoelst, T., Lambert, J.-C., Sneep, M., ter Linden, M., Ludewig, A., Boersma, K. F., and Veefkind, J. P.: Sentinel-5P TROPOMI NO2 retrieval: impact of version v2.2 improvements and comparisons with OMI and ground-based data, Atmos. Meas. Tech., 15, 2037–2060, https://doi.org/10.5194/amt-15-2037-2022, 2022.
Veefkind, J. P., Aben, I., McMullan, K., Förster, H., De Vries, J., Otter, G., Claas, J., Eskes, H. J., De Haan, J. F., Kleipool, Q., Van Weele, M., Hasekamp, O., Hoogeveen, R., Landgraf, J., Snel, R., Tol, P., Ingmann, P., Voors, R., Kruizinga, B., Vink, R., Visser, H., and Levelt, P. F.: TROPOMI on the ESA Sentinel-5 Precursor: A GMES mission for global observations of the atmospheric composition for climate, air quality and ozone layer applications, Remote Sens. Environ., 120, 70–83, https://doi.org/10.1016/j.rse.2011.09.027, 2012.
Vigouroux, C., Langerock, B., Bauer Aquino, C. A., Blumenstock, T., Cheng, Z., De Mazière, M., De Smedt, I., Grutter, M., Hannigan, J. W., Jones, N., Kivi, R., Loyola, D., Lutsch, E., Mahieu, E., Makarova, M., Metzger, J.-M., Morino, I., Murata, I., Nagahama, T., Notholt, J., Ortega, I., Palm, M., Pinardi, G., Röhling, A., Smale, D., Stremme, W., Strong, K., Sussmann, R., Té, Y., van Roozendael, M., Wang, P., and Winkler, H.: TROPOMI–Sentinel-5 Precursor formaldehyde validation using an extensive network of ground-based Fourier-transform infrared stations, Atmos. Meas. Tech., 13, 3751–3767, https://doi.org/10.5194/amt-13-3751-2020, 2020.
Wang, P., Schade, G., Estes, M., and Ying, Q.: Improved MEGAN predictions of biogenic isoprene in the contiguous United States, Atmos. Environ., 148, 337–351, https://doi.org/10.1016/j.atmosenv.2016.11.006, 2017.
Warneke, C., De Gouw, J. A., Del Negro, L., Brioude, J., McKeen, S., Stark, H., Kuster, W. C., Goldan, P. D., Trainer, M., Fehsenfeld, F. C., Wiedinmyer, C., Guenther, A. B., Hansel, A., Wisthaler, A., Atlas, E., Holloway, J. S., Ryerson, T. B., Peischl, J., Huey, L. G., and Hanks, A. T. C.: Biogenic emission measurement and inventories determination of biogenic emissions in the eastern United States and Texas and comparison with biogenic emission inventories, J. Geophys. Res., 115, D00F18, https://doi.org/10.1029/2009JD012445, 2010.
Wells, K. C., Millet, D. B., Payne, V. H., Deventer, M. J., Bates, K. H., De Gouw, J. A., Graus, M., Warneke, C., Wisthaler, A., and Fuentes, J. D.: Satellite isoprene retrievals constrain emissions and atmospheric oxidation, Nature, 585, 225–233, https://doi.org/10.1038/s41586-020-2664-3, 2020.
Wells, K. C., Millet, D. B., Payne, V. H., Vigouroux, C., Aquino, C. A. B., De Mazière, M., De Gouw, J. A., Graus, M., Kurosu, T., Warneke, C., and Wisthaler, A.: Next-Generation Isoprene Measurements From Space: Detecting Daily Variability at High Resolution, J. Geophys. Res.-Atmos., 127, e2021JD036181, https://doi.org/10.1029/2021JD036181, 2022.
Werner, C., Meredith, L. K., Ladd, S. N., Ingrisch, J., Kübert, A., Van Haren, J., Bahn, M., Bailey, K., Bamberger, I., Beyer, M., Blomdahl, D., Byron, J., Daber, E., Deleeuw, J., Dippold, M. A., Fudyma, J., Gil-Loaiza, J., Honeker, L. K., Hu, J., Huang, J., Klüpfel, T., Krechmer, J., Kreuzwieser, J., Kühnhammer, K., Lehmann, M. M., Meeran, K., Misztal, P. K., Ng, W.-R., Pfannerstill, E., Pugliese, G., Purser, G., Roscioli, J., Shi, L., Tfaily, M., and Williams, J.: Ecosystem fluxes during drought and recovery in an experimental forest, Science, 374, 1514–1518, https://doi.org/10.1126/science.abj6789, 2021.
Wiedinmyer, C., Greenberg, J., Guenther, A., Hopkins, B., Baker, K., Geron, C., Palmer, P. I., Long, B. P., Turner, J. R., Pétron, G., Harley, P., Pierce, T. E., Lamb, B., Westberg, H., Baugh, W., Koerber, M., and Janssen, M.: Ozarks Isoprene Experiment (OZIE): Measurements and modeling of the “isoprene volcano”, J. Geophys. Res., 110, D18307, https://doi.org/10.1029/2005JD005800, 2005.
Wiedinmyer, C., Tie, X., Guenther, A., Neilson, R., and Granier, C.: Future Changes in Biogenic Isoprene Emissions: How Might They Affect Regional and Global Atmospheric Chemistry?, Earth Interactions, 10, 1–19, https://doi.org/10.1175/EI174.1, 2006.
Worden, H. M., Bloom, A. A., Worden, J. R., Jiang, Z., Marais, E. A., Stavrakou, T., Gaubert, B., and Lacey, F.: New constraints on biogenic emissions using satellite-based estimates of carbon monoxide fluxes, Atmos. Chem. Phys., 19, 13569–13579, https://doi.org/10.5194/acp-19-13569-2019, 2019.
Yáñez-Serrano, A. M., Nölscher, A. C., Williams, J., Wolff, S., Alves, E., Martins, G. A., Bourtsoukidis, E., Brito, J., Jardine, K., Artaxo, P., and Kesselmeier, J.: Diel and seasonal changes of biogenic volatile organic compounds within and above an Amazonian rainforest, Atmos. Chem. Phys., 15, 3359–3378, https://doi.org/10.5194/acp-15-3359-2015, 2015.
Yáñez-Serrano, A. M., Bourtsoukidis, E., Alves, E. G., Bauwens, M., Stavrakou, T., Llusià, J., Filella, I., Guenther, A., Williams, J., Artaxo, P., Sindelarova, K., Doubalova, J., Kesselmeier, J., and Peñuelas, J.: Amazonian biogenic volatile organic compounds under global change, Glob. Change Biol., 26, 4722–4751, https://doi.org/10.1111/gcb.15185, 2020.
Yuan, H., Dai, Y., Xiao, Z., Ji, D., and Shangguan, W.: Reprocessing the MODIS Leaf Area Index products for land surface and climate modelling, Remote Sens. Environ., 115, 1171–1187, https://doi.org/10.1016/j.rse.2011.01.001, 2011.
Zeinali, N., Altarawneh, M., Li, D., Al-Nu'airat, J., and Dlugogorski, B. Z.: New Mechanistic Insights: Why Do Plants Produce Isoprene?, ACS Omega, 1, 220–225, https://doi.org/10.1021/acsomega.6b00025, 2016.