the Creative Commons Attribution 4.0 License.
the Creative Commons Attribution 4.0 License.
Saharan dust transport event characterization in the Mediterranean atmosphere using 21 years of in-situ observations
Davide Putero
Paolo Bonasoni
Paolo Cristofanelli
Marco Zanatta
Angela Marinoni
The Mediterranean Basin is regularly affected by atmospheric dust transport from the Saharan desert. These recurring events have strong implications for the Earth’s energy budget, cloud formation processes, human health, and solar energy production. Monte Cimone, with 2165 m a.s.l., is an ideal platform to investigate dust outbreaks in Mediterranean Europe. In this study, we present 21 years (2003–2023) of dust transport event identification, derived from continuous measurements of the aerosol optical size distribution coupled with backward trajectories. Throughout all the years investigated, the fraction of dust transport days remained constant at values between 15 % and 20 % without any detectable trend. This absent trend was also observed in the particulate matter concentration. The annual cycle of dust transport days was characterized by two peaks from May to August and in October and November with values up to 20 %. A similar annual cycle was reflected in the particulate matter concentration with the highest concentrations in summer and the lowest in winter. Grouping consecutive dust transport days into dust transport events revealed that in the winter months a typical event had a duration of one or two days, whereas in the summer months dust transport events lasted longer (three or more days). The 21 years of measurements presented in this study will set a baseline to assess future dust transport scenarios. Furthermore, they can be used to validate dust forecast models to increase the accuracy of predicting atmospheric dust transport towards the Mediterranean Basin.
- Article
(2007 KB) - Full-text XML
-
Supplement
(478 KB) - BibTeX
- EndNote
Mineral dust has the highest contribution to the global aerosol mass (Kinne et al., 2006), with an annual atmospheric aerosol burden of a few thousand megatons (Kok et al., 2021). It is emitted by wind erosion and resuspension from arid and semi-arid regions across the continents (Knippertz and Todd, 2012). While being suspended in the atmosphere, mineral dust can affect the Earth's energy budget by directly scattering and absorbing incoming radiation (Choobari et al., 2014; Schepanski, 2018). On the other hand, dust particles have the strong ability to form cloud droplets (Karydis et al., 2017) and ice crystals throughout the entire atmospheric temperature range, leading to a potential full glaciation of a cloud (Froyd et al., 2022; Vogel, 2022). This strongly alters the radiative properties of the clouds and their precipitation capability and therefore influences the Earth's water cycle (Mülmenstädt et al., 2015). Moreover, mineral dust can affect tropospheric chemistry by multiple pathways (van Herpen et al., 2023; Huo et al., 2024; Melssen et al., 2024). Mineral dust deposition enriches the soil and water with nutrients, altering the oceanic and terrestrial biochemical cycle (Mahowald et al., 2014; Adebiyi et al., 2023); when it is deposited on glaciers (e.g. in the Alps), it changes their albedo, favoring their melting (Gabbi et al., 2015). Mineral dust also has an impact on human health, causing respiratory and cardiovascular disorders (Goudie, 2014; Oduber et al., 2019), flight traffic, due to a reduced visibility (Weinzierl et al., 2012), and solar energy production due to a damping of incoming radiation and dust deposition on solar power panels (Varga et al., 2024). The Saharan desert is the largest source region of mineral dust world wide (Miller et al., 2004) and it is still debated whether its contribution to the atmospheric dust load is increasing (Zuidema et al., 2019) or decreasing (Yuan et al., 2020). Due to their vicinity, the Mediterranean and Continental Europe are regions frequently impacted by dust outbreaks (Querol et al., 2009; Pey et al., 2013; Cabello et al., 2016; Gobbi et al., 2019). Hereby, synoptic patterns such as cyclones over the Mediterranean, the presence of an upper-level trough over the Mediterranean basin or anticyclonic conditions associated with convective injection of dust in north Africa play a crucial role suspending and transporting Saharan dust towards Europe (Brattich et al., 2015; Varga, 2020; Flaounas et al., 2022). Another important transport pathway over the Saharan desert is the Inter-Tropical Convergence Zone (ITCZ), a low pressure belt reaching its northern most position over the Sahara in summer, and thus enhancing the dust load in the atmosphere (Ginoux et al., 2001; Sunnu et al., 2008). As summarized by Dulac et al. (2023), there is a long-standing history of Saharan dust characterization and event identification across the entire Mediterranean basin with both in-situ and remote sensing observations. In-situ observations of particulate matter (PM) and aerosol number concentration have been used for more than 30 years to identify the impact of African dust outbreaks on PM levels in the Mediterranean. An increase in the PM concentration has been observed in the upper levels of the atmosphere, but also at ground level. This is also true in urban areas as shown by measurements carried out in the Po Valley (e.g. Parma, Modena and Cesena) during dust transport events identified at Monte Cimone, confirming that the contribution of dust particles on the urban PM10 surface values can be very critical, favoring threshold exceedance (Bonasoni et al., 2004). Since an enhanced level of the PM concentration can lead to health issues, guidelines published by the World Health Organization (WHO) give an upper limit of 45 µg m−3 per day for the concentration of particles with a diameter smaller than 10 µm. Previous studies, such as Pey et al. (2013); Conte et al. (2020); Nava et al. (2020); Tositti et al. (2022) investigated the increase in the PM concentration during dust transport events throughout the Mediterranean region and reported a consistent increase, which is more pronounced in the southern part, closer to the Saharan desert. Within all the analyzed measurements, there was no consistent seasonal pattern, as some places in Central Italy had higher PM concentrations in summer, and other places in the winter months (Pey et al., 2013; Petroselli et al., 2024). While in-situ measurements provide direct information on PM concentrations and health-relevant metrics at ground level, remote sensing techniques, both satellite and ground-based, offer broader spatial and temporal coverage on the vertical atmospheric column. The majority of remote sensing-based studies for aerosol-type classification over the Mediterranean were based on sun photometer retrievals like aerosol optical depth (AOD) and its spectral dependence. While satellite remote sensing allows the detection of dust events on regional scale (Barnaba and Gobbi, 2004; Cuevas-Agulló et al., 2024), ground based remote sensing offers continuous observations at local scales, in the eastern (Kaskaoutis et al., 2012; Kosmopoulos et al., 2008), central (Gobbi et al., 2019; Tafuro et al., 2006) and western (Benkhalifa et al., 2017; Valenzuela et al., 2014) Mediterranean. One region of interest are the northern Apennines, the first mountain range that air masses from northern Africa cross to reach central Europe. High-altitude measurement sites are of particular interest, since they are typically not strongly affected by anthropogenic emissions and can experience both planetary boundary layer and free tropospheric conditions. In particular, the Monte Cimone (CMN) station, with its location and altitude, has been object of multiple studies to investigate the influence of Saharan dust transport. Bonasoni et al. (2004) presented the first work on dust, finding a clear correlation between Saharan dust transport and atmospheric aerosol concentration. Duchi et al. (2016) consolidated this research activity by presenting 10 years (2002–2012) of Saharan dust transport events occurring at CMN to introduce a methodology to identify the dust transport days by using measurements of the optical particle size distribution and backward trajectory analysis. A commonly applied approach for dust transport identification is not yet established and methods range from in-situ observations to remote sensing approaches. Also long-term measurements to validate dust forecast models are still rare. This work aims at extending the work from Duchi et al. (2016) until 2023, which allows to investigate not only the annual and interannual variability in dust transport days and particulate matter concentration, but also trends over two decades (see Sect. 3.2 and 3.4). In Sect. 3.4 we further discuss the enhancement in the particulate matter concentration due to transported dust. At the end of the paper we elaborate the duration of dust transport events throughout the months and their intensity based on the enhancement in the particulate matter concentration (see Sect. 3.5 and 3.6).
2.1 Measurement site and instrumental setup
Monte Cimone (CMN, 2165 m a.s.l.) is the highest peak in the Italian northern Apennines, and is located at 44.19° N, 10.70° E. The observatory is operational since the early 1990s and is a WMO/GAW (World Meteorological Organization/Global Atmosphere Watch) global station and a national facility of ACTRIS-RI (Aerosol, Clouds and Trace Gases Research Infrastructure; https://www.actris.eu/, last access: 4 November 2025) and ICOS-RI (Integrated Carbon Observing System Research Infrastructure; https://www.icos-cp.eu/, last access: 4 November 2025). CMN is a remote site, since there are no pollution sources nearby. However, its vicinity to the Po Valley, one of the most polluted urban areas in Europe leads to regular intrusions of pollution (Marenco et al., 2006). In winter CMN is mainly influenced by air masses from the free troposphere, while in summer it frequently undergoes influence from the planetary boundary layer (PBL). Due to its altitude, the station can be either inside or outside a cloud. Further details on the measurement site and its meteorological characteristics can be found in Cristofanelli et al. (2021). Among other variables, the aerosol optical size distribution is measured with an optical particle counter/sizer (OPC/OPS; Grimm® model 1.108) since August 2002. Particles in the sampling air enter the instrument and cross a laser light beam, with an operating wavelength of 780 nm. The 90° scattered light of single particles is detected, and depending on the signal intensity, the particles are assigned to one of the 15 available diameter channels. Hereby, the minimum detectable particle diameter is 0.3 µm and the maximum particle diameter is 20 µm. The measurements are saved as a particle number concentration per bin with a time resolution of 1 min. For the analysis in this work, data were averaged over 60 min and later 1 d, with a minimum hourly data coverage of 50 %. To identify dust transport days (DTDs) we used the coarse particle concentration, i.e., particles with a diameter greater than 1 µm. This corresponds to the OPC bin numbers 6 and higher. The instrument is connected to a whole air inlet, which underwent important modifications during the 21 years of measurements presented in the manuscript. Among the changes was the implementation of a heating system at the top of the sampling line in 2008, to better control the humidity in an increased sampling flow (150 L min−1). Due to the smaller sampling flow in 2002–2007 (below 20 L min−1), the passive heating of the room maintained a warmer temperature in the sampling line ensuring RH values below 40 %, as suggested by ACTRIS-RI sampling guidelines. More details are provided in Sect. S2 in the Supplement.
2.2 FLEXTRA backward trajectories
3D-backward trajectories were retrieved from the FLEXTRA model (Stohl et al., 1995), which performs the calculations based on the vertical wind. Meteorological data were provided by ECMWF with a 1.25° × 1.25° grid resolution on 60 vertical levels, derived from a combination of observations with numerical models. In this study, a 7 d long backward trajectory was calculated every 6 h (00:00, 06:00, 12:00, 18:00 UTC). The trajectories were limited to 7 d due to the atmospheric residence time of super-micron particles between 10 h and 100 h (Esmen and Corn, 1971). The initializing height was set to 2200 m a.s.l. and every 3 h the calculation provided several parameters, among which were the location and the altitude of the air parcel. Stohl and Seibert (1998) indicate an accuracy in terms of travel distance around 20 %. From the location of the air parcels, it can be assessed whether the trajectories traveled over the Saharan desert before reaching Monte Cimone. Therefore, we divided northern Africa into 4 boxes (Fig. 1c) with the following boundaries:
-
Box 1 (Western Sahara): 15 to 35° N and −17 to −7° E
-
Box 2 (Central Sahara): 15 to 37.5° N and −7 to 15° E
-
Box 3 (Eastern Sahara): 15 to 33° N and 15 to 34° E
-
Box 4 (Sahel zone): 10 to 15° N and −17 to 34° E
This grid presents a modified version compared to the one applied in Duchi et al. (2016), where they used one large box ranging from 10 to 35° N and −15 to 30° E. With the new division we fully incorporate the northern part of central Africa and enlarge the included part of the eastern Sahara.
2.3 Identification of dust transport events
The method for the identification of dust transport events (DTEs) is based on a pre-selection of potential days using in-situ measurements of the coarse particle concentration and confirmation by 7 d back-trajectories. While a detailed description of the method can be found in Duchi et al. (2016), we give a short summary here. The Duchi et al. (2016) approach consists of the following steps: (i) 24 h average of the coarse particle number concentration measured with the OPC, (ii) 21 d moving average applied 3 times to dampen the noise, (iii) subtraction of the third iteration of the moving average from the 24 h average time series to obtain the “high frequency” (HF) component, (iv) flag days on which the HF component is above the 95 % confidence interval of all HF components as potential DTDs, (v) if any of the trajectory points on the potential DTD passed over the grid specified in Sect. 2.2, this day is flagged as a DTD. To retrieve an unbiased statistics, we only considered months in which the data coverage was at least 50 %, leading to 221 months out of 252. Furthermore, we retained data only from 2003 on, because OPC measurements from 2002 did not depict a full year as they started in August. Throughout the 21 years of measurements presented in this work, 81 % of the data were considered valid. The remaining 19 % were invalid due to missing measurements or not available back-trajectories. Missing measurements occur due to a malfunction of the instrument or the instrument being out of service due to routinary maintenance or calibration in the factory. Back-trajectories might not be available due to missing meteorological data. The longest period of missing data spans over three months. DTDs are regarded as individual days on which Saharan dust was transported in the atmosphere to CMN. To investigate the duration of continuous Saharan dust advection, consecutive days were grouped into DTEs. Hereby, consecutive DTDs that were interrupted by one non-DTD were considered as a unique DTE. For the analysis in Sect. 3.5 and 3.6 the DTEs were split into durations of 1, 2, 3 and 4 or more days.
2.4 PM mass concentration
2.4.1 Calculation of PM mass concentration from measurements
One of the variables to characterize aerosol load in the atmosphere is the particulate matter (PM) concentration in different size ranges. Common measures are the PM concentration of particles smaller than 1 µm (PM1), smaller than 10 µm (PM10) and the total PM concentration. For this work we calculated the daily PM concentration of the coarse particles (PMcoarse; Eq. 1), in the same size range as used for the identification of DTDs (particle diameter larger than 1 µm).
Hereby, Cn,i is the particle number concentration of the individual bins of the OPC. The volume Vi of the particles with a diameter di is derived from the volume of a sphere, assuming the particle sphericity. The particle density depends on the particle size and composition. Therefore we applied on our data a particle size dependent density ρi as presented in Wittmaack (2002). Given that, the particle density ranges from 2.1 to 2.6 g cm−3 for 1 and 20 µm particles, respectively, with an average density of 2.4 g cm−3. In our analysis we differentiate the PMcoarse concentration on DTDs and outside of DTDs, the so called “background”. Note that the contribution of other events such as pollution or wild fires were not removed from the background conditions. Considering that these type of particles are predominantly found in the accumulation mode (Lohmann et al., 2016), their contribution to the coarse particle concentration was assumed to be negligible.
2.4.2 PMcoarse enhancement
To assess the enhancement in the PMcoarse concentration compared to the background, we applied the method proposed by Escudero et al. (2007) with the modification reported by the European Commission Staff Working Paper which establishes guidelines for demonstration and subtraction of exceedances attributable to natural sources under the Directive 2008/50/EC on ambient air quality and cleaner air for Europe (https://data.consilium.europa.eu/doc/document/ST-6771-2011-INIT/en/pdf, last access: 9 October 2024) and the median instead of the average. We used the PMcoarse concentration instead of the PM10 concentration. The methods consisted of two steps. In the first step, a 30 d moving average of the background PMcoarse was calculated. In the second step, the enhancement in the PMcoarse concentrations during DTDs was then retrieved from the PMcoarse concentration during individual DTDs and the background PMcoarse. A more quantitative measure on how much dust influences the background PMcoarse concentration is the enhancement factor (EF), calculated as the ratio of the PMcoarse enhancement over the running median of the background.
2.4.3 PM mass concentration from CAMS reanalysis
CAMS (Copernicus Atmosphere Monitoring Service, https://ads.atmosphere.copernicus.eu/datasets, last access: 8 October 2025) provides global reanalysis of various atmospheric constituents. The EAC4 (ECMWF Atmospheric Composition Reanalysis 4) reanalysis data are provided for a 0.7° × 0.7° grid with a vertical resolution of 60 hybrid sigma–pressure (model) levels. The time resolution is 3 h. To compare the here presented PMcoarse concentration to reanalysis data, we used the dust aerosol mixing ratio (0.9–20 µm), which was converted to a mass concentration using the provided air density for the selected chosen model level. Data were downloaded for all the years (2003 to 2023) for the model level 46, which corresponds to a geometric altitude of 2327.89 m and a pressure of 780.3455 hPa. As CMN is situated between the provided grid points, the mass concentration was averaged over the four closest points. Further, the data were averaged over 24 h to obtain the same time resolution as the measurements.
2.5 Trend analysis
To assess the trend in our dataset, we applied the trend detection methodology presented and discussed in detail by Collaud Coen et al. (2020). In short, it combines three different pre-whitening methods to remove autocorrelation and minimize the number of detected false positive trends. In case the dataset has a positive trend, the output is the user-defined alpha value, which in this study is 0.95. If no trend was obtained, the output value is 0, −1 or −2, where 0 stands for no trend given from all tests, and −1 and −2 stand for a false positive test from different tests. This trend analysis was applied on the annual fraction of DTDs and the annual average of the PMcoarse concentration during DTDs.
2.6 Uncertainties
The uncertainty in the quantification of DTDs was calculated assuming the ±5 % uncertainty of the OPC counting for both the high frequency component and the threshold, which are the variables directly used to identify DTDs. Hence, the maximum overestimation of DTDs was calculated assuming a +5 % on the high frequency component and a −5 % on the threshold. The opposite was done to estimate the maximum underestimation of DTDs.
The calculation of the PMcoarse concentration is subject to uncertainties. Given Eq. (1), individual uncertainties of the particle diameter (di), the particle number concentration (Cn,i) and the particle density (ρi), are propagated into a final uncertainty of the PMcoarse concentration. For Cn,i, the manufacturer provides for the same OPC model an uncertainty between 3 % and 5 %. In the literature, the characterization of the uncertainty is limited to one study by Burkart et al. (2010) who observed a 9 % higher total number concentration measured by the same OPC compared to a differential mobility analyzer. However, they did not convert the electrical mobility diameter to an optical equivalent diameter, which can lead to an increased uncertainty. We therefore apply in our calculation of the error propagation the uncertainty of 5 %.
An uncertainty for di is not provided by the manufacturer of the OPC; however, it should be accounted due to biases in the correct sizing introduced by non-spheric particles. Putaud et al. (2004) suggest in their study at Monte Cimone a particle sizing uncertainty of 10 % outside of DTDs and of 20 % during DTDs. The higher uncertainty during DTDs arises from the high degree of non-sphericity of dust particles.
The uncertainty for (ρi) is not given in the study by Wittmaack (2002), which we used to obtain the size dependent particle density. For our calculations we estimated an upper and lower uncertainty both for background conditions and during DTDs. For the upper limit we used the ratio between the mean PMcoarse concentration calculated as described in Sect. 2.4 and the mean PMcoarse concentration calculated with the highest density we used of 2.6 g cm−3. This was equal for DTDs and background conditions. On the other hand, for the lower limit, we used the lowest density of 2.1 g cm−3 for measurements during DTDs and 1.77 g cm−3 for background conditions. During background conditions the aerosol present at Monte Cimone is mainly organics, ammonium sulphate and unknown particles (Putaud et al., 2004). Based on this calculation, we obtained the following uncertainty ranges for the density: DTDs + 9.5 %/−9.8 % and background conditions +11.4 %/−28 %. Applying the error propagation, we obtain the upper and lower uncertainty for the PMcoarse concentration during DTDs ±61 % and during background conditions +32 %/−41 %.
3.1 Overview of dust transport to CMN
Duchi et al. (2016) presented 10.5 years (from August 2002 to December 2012) of dust transport analysis at Monte Cimone (CMN), and our analysis extends the time series by a further 11 years until the end of 2023. Figure 1 provides a general overview of (a) the number of dust transport days (DTDs), and (b) the duration of dust transport events (DTEs) of these 21 years and Table 1 summarizes the major results of the presented work. In this period, 15.8 %, or 1004 d, of the analyzed days were detected as DTDs following the approach described in Sect. 2.3. For the uncertainty, we obtained +5 and −8 DTDs, which are negligible numbers given the total number of 1004 days, thus an effect of the measurement uncertainty on the analysis presented in the paper can be excluded. The individual DTDs were grouped into DTEs as presented in Sect. 2.3. The majority (42.2 %) of the events lasted one day, whereas the other duration had similar fractions with values of 22.3 %, 15.1 % and 20.4 % for increasing duration. After the occurrence and duration of DTEs, we investigated the potential source origin of mineral dust within the Saharan desert area (Fig. 1c). The dominant source area was identified to be “Central Sahara” (box 2), which was crossed by 72 % of all trajectory points across the selected area. While “Eastern Sahara” (box 3) was associated with 7.7 % of trajectory points, 'Western Sahara' (box 1) was the second most important source region with 19.2 %. Only 0.4 % of the back-trajectory points passed over the southern part of the Sahara, which also includes the Sahel zone (box 4). A similar source contribution from the different areas of the Sahara is presented in Collaud Coen et al. (2004) and Duchi et al. (2016), where they observed the highest density of trajectories in the northern part of the Sahara, during dust transport to Jungfraujoch and CMN.
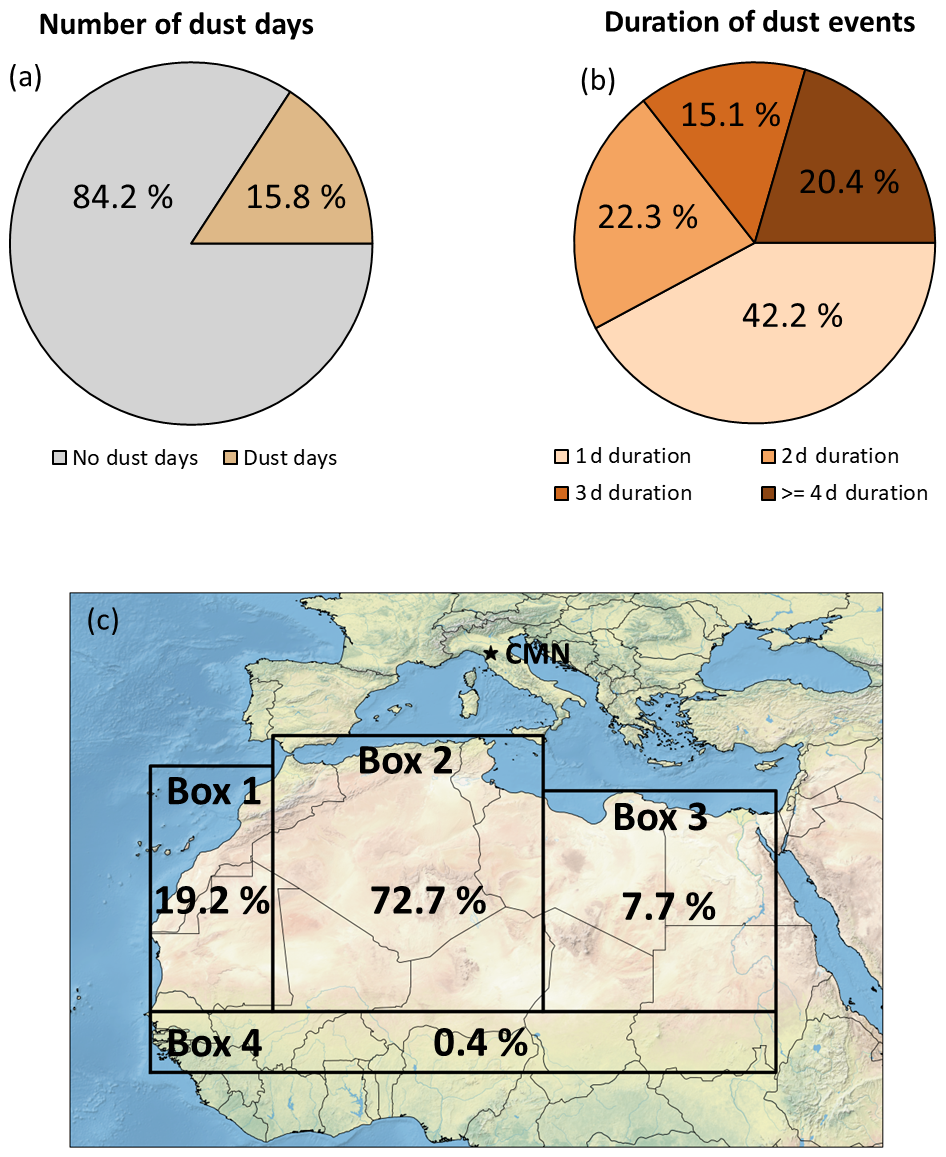
Figure 1(a) Fraction of dust transport days (brown) and the number of non-dust transport days (grey). (b) Duration of dust transport events divided into 1 d (beige), 2 d (orange), 3 d (light brown) and 4 and more days (dark brown). (c) Grid box extension for the four boxes used to confirm dust transport days. The percentage values give the fraction of back-trajectories that passed over each box. Map made with Natural Earth (https://naturalearthdata.com, last access: 4 November 2025).
Table 1Summary of major results discussed in Sect. 3.2 and 3.4. Column 1 refers to the different variables, column 2 to the minimum and maximum values of the interannual variability of the respective variables and column 3 to the minimum and maximum values in the annual cycle. For the annual cycle the months in which the minimum and maximum are reached are indicated. Column 4 indicates in which figure the results can be seen.
3.2 Frequency of dust transport at Monte Cimone
The annual fraction of DTDs was calculated as the ratio of the annual number of DTDs over the total number of valid days per year (Fig. 2a). On average, the annual fraction of DTDs was 15.8 %, meaning that CMN was affected by Saharan dust transport on about 58 d per year. The fraction was fluctuating between 12 % and 19.5 % with multi-annual periods of lower or higher fractions. Within the 21 years of dust identification, there was no significant temporal trend (slope of 0.063) in the fraction of DTDs obtained from the trend analysis described in Sect. 2.5. The quantification of the trend might be affected by the high fractions at the beginning and the low fractions at the end of the time series as well as the lower and higher fraction from 2005 to 2010 and 2012 to 2017, respectively. Saharan dust is transported by large-scale synoptic patterns, such as cyclones in the Mediterranean, which change in position and intensity throughout the year, and thus influence the seasonal variation of DTDs, but not the interannual variability (Varga, 2020; Flaounas et al., 2022). The annual cycle was investigated grouping all the DTD yearly values for each month (Fig. 2 b), and revealed a clear cycle. A broad maximum in the median fraction of DTDs up to 20 % was observed for May, June, July and August, which was followed by a secondary maximum in October and November, with similar high median fractions. The winter months (December, January and February) showed a minimum fraction with median values from 6 % to 10 %. This means that in the summer months CMN experienced Saharan dust transport on about 6 d per month, while in winter this number was reduced to 2.5 d. The interannual variability, depicted by the whiskers, does not follow an annual cycle and is rather driven by one or two years that showed a comparably very high number of DTDs in a specific month. This variability reached values from 0 % in December, meaning that no DTDs were detected in at least one year, up to 32 % in May, August and October. The annual cycle in DTDs is consistent with Pey et al. (2013), who gave a monthly probability of DTDs for central Italy similar to our measurements with a high peak in May, June and August and a secondary peak in October and November. A modeling study of the aerosol index by Israelevich et al. (2002), and an analysis of the aerosol optical depth presented by Di Antonio et al. (2023), both suggest an annual cycle with higher values over the Mediterranean region, linked to dust transport. However, Petroselli et al. (2024) observed in a low mountain site in central Italy a rather inverse trend compared to our measurements with a minimum in July and August and a maximum in the winter months. This could be due to the fact the site in their study is at a lower altitude (1100 m a.s.l.). By that it experiences a different impact from the boundary layer dynamics and might not be in the free troposphere as often as CMN. Moreover, they applied the Duchi et al. (2016) approach on hourly data, which can lead to different results. Monthly changes in the fraction of DTDs can potentially reflect the location of the cyclones in the Mediterranean, which in the summer months occurs preferably over the north-western part of Africa, the Atlas mountain, and thus enhances dust transport towards Italy (Varga, 2020; Flaounas et al., 2022). This could also explain, that the major source region of Saharan dust is the Central Sahara. Another large scale synoptic pattern, that could contribute to the enhanced fraction of DTDs from May to August is the Inter-Tropical Convergence Zone (ITCZ). Its position in the summer months is at around 20° N and by that can enhance the northward transport of dust loaded air (Ginoux et al., 2001; Sunnu et al., 2008). In winter, however, it is positioned around 5° N, which prohibits dust transport. The reason for the second peak in October and November is yet unclear, however, a possible explanation could be found in Medicanes, mainly occurring in these months, which potentially enhance the transport of dust towards southern Europe.
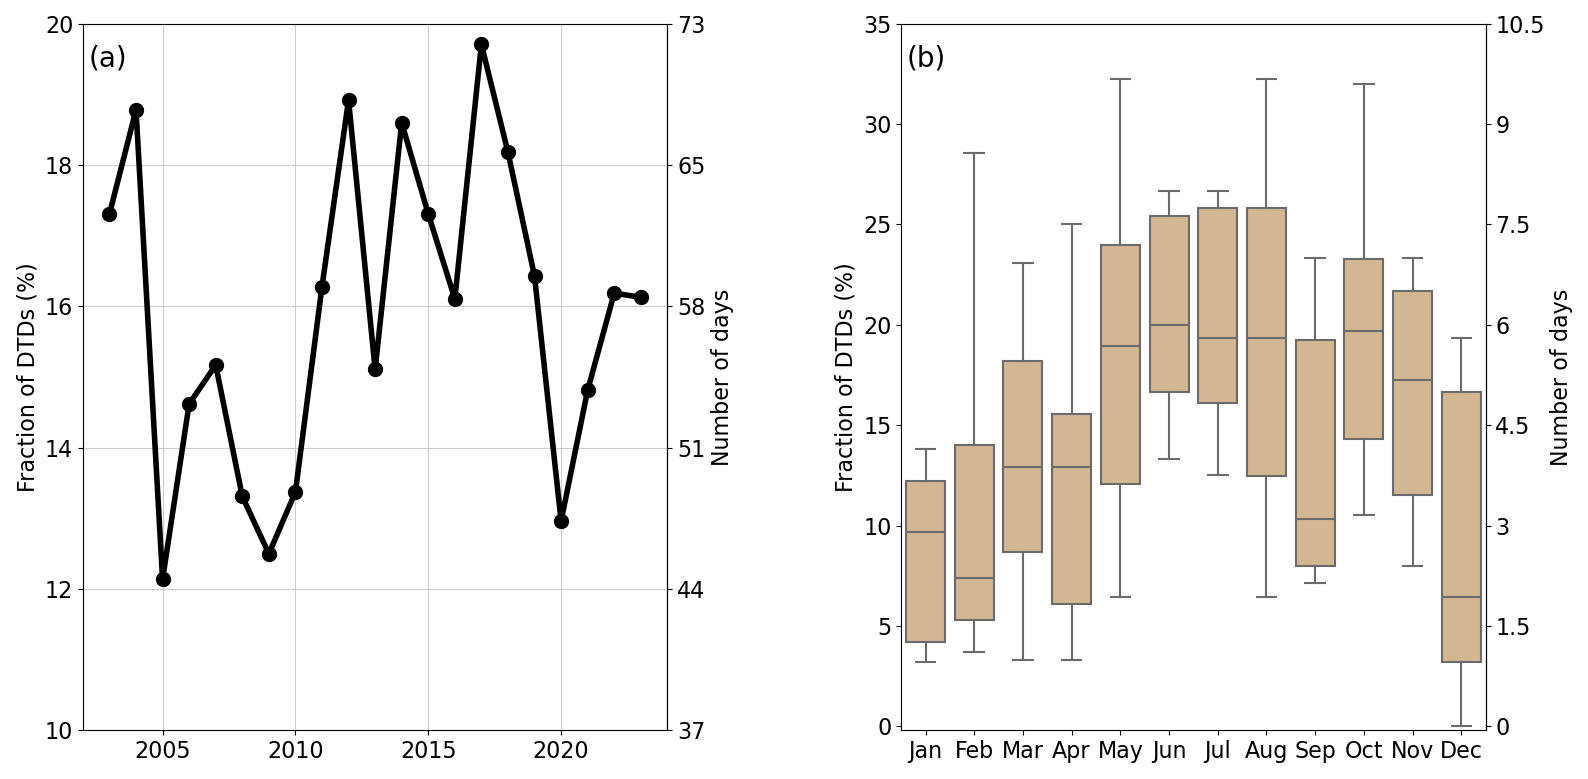
Figure 2Annual fraction of DTDs including the years from 2003 to 2023 (a). The solid line corresponds to the individual data points, and the dashed line shows the trend over all 21 years. The left y axis gives the fraction of DTDs in relation to the number of valid days per year and the right y axis is the conversion of the fraction into a number of days per year. (b) monthly fraction of DTDs. The boxes mark the 25th and 75th percentile, while the whiskers are the 10th and 90th percentile. The left y axis gives the fraction of DTDs in relation to the number of valid days per month and the right y axis is the conversion of the fraction into a number of days per month.
3.3 Comparison to the study of Duchi et al. (2016)
Duchi et al. (2016) analyzed the dust transport at Mt. Cimone between 2002 and 2012. The dataset in this paper extends this analysis until 2023. Both studies observed an overall fraction of DTDs of 15.7 % or 15.8 %, indicating that the annual fraction of DTDs did not change significantly. Also, the seasonal cycle of DTDs was consistent in both studies, with a broad maximum in spring/summer, a second maximum in October/November, and a minimum in winter. When looking at the duration of DTEs, the highest fraction was always the 1 d duration events with 44 % for Duchi et al. (2016) and 42.2 % in this study. For Duchi et al. (2016) the second highest fraction with 28 % were the 2 d events and further they only report that 8 % of the DTEs lasted more than 5 d. In this study, the fraction of the 2 d events was reduced to 22.3 %. The further duration classification differed slightly, as we categorized differently the DTEs based on their duration. After the discussion of the occurrence of DTDs and the seasonal cycle, Duchi et al. (2016) focused their work on the changes in the coarse particle concentration during DTDs and the source origin from the various parts of the Saharan desert. In our work we discuss the interannual variability and the seasonal cycle of the PMcoarse concentration instead of the coarse particle concentration, so that our results can be more comparable to other studies. Furthermore, we give an estimate of the uncertainty related to this analysis.
3.4 PMcoarse concentration during and outside dust transport days
3.4.1 Recurring interannual cycle
The PM concentration is a regulated air quality variable that describes the atmospheric aerosol burden in terms of mass, which helps to quantify the level of pollution of ambient air. Previous studies such as Querol et al. (2009), Pey et al. (2013), and Petroselli et al. (2024) made use of the PM10 concentration to assess the contribution of Saharan dust to the background PM10 concentration. As presented in Section 2.4.1, we calculated the PM concentration of the coarse particles only (PMcoarse) during and outside DTDs. The background PMcoarse concentration showed median values between 0.3 and 3 µg m−3 (Fig. 3a, gray line). Within the whole observation period, the median PMcoarse concentration on DTDs (Fig. 3a, brown line) was about one order of magnitude higher than the background conditions. Also the 25th percentile of the PMcoarse concentration on DTDs was in almost all years higher than the 75th percentile of the background concentration, meaning that the increase of PMcoarse during DTDs was relevant. In the study by Millán-Martínez et al. (2021) they also observed enhanced PM10 concentrations during dust transport episodes, but the difference to the background was reduced to a factor of 1.5. The average of the PMcoarse concentration during DTDs (Fig. 3a, dark brown line) is consistently higher than the median. In most of the years the error bars of the average, given as ±61 % include the median value. In exceptional years, such as 2014, the difference between the median and the average can be as high as a factor of 5, while the standard deviation is always higher than the average. These statistics point out that the PMcoarse concentration during DTDs is driven by one or two events per year transporting very high amounts of dust mass towards Monte Cimone and thus leading to a skewed distribution of the PMcoarse concentration. To reduce the weight of extreme events on the multi-decadal time series, it is recommended to rely on the median values for further analysis. All three variables, i.e., the median of the PMcoarse background, the median and the average PMcoarse during DTDs, showed a wave-like profile with a wavelength of about 12 years. Minima were observed in 2006 and 2019–2020, while a broad maximum from 2011 to 2013 was reached. This wave-like pattern was reported the first time and a potential connection to atmospheric circulations like ENSO (El-Nino Southern Oscillation) or NAO (North Atlantic Oscillation) could not be confirmed. A trend analysis performed on the PMcoarse concentration during DTDs revealed no trend for this data set, which can be connected to the wave-like pattern. Institutions like Copernicus provide dust forecasts based on the aerosol optical depth, which is a variable integrated over the full atmospheric column (Blake et al., 2025). To verify the representativity of CAMS reanalysis with in-situ observations we provide for the first time a comparison of the PM mass concentration on a single level on a long term and local scale. The median mass concentration retrieved from CAMS reanalysis reflects, overall, the interannual variability of the measurements and falls within the range between the 25th and 75th percentile. Exceptions are years with a very high (2014) or very low (2019) measured PMcoarse concentrations. Potential studies should address especially the underestimation of CAMS during episodes of extreme dust transport events during which high PM concentrations were measured. Further differences between the CAMS reanalysis data and the measurements can originate from the choice of the vertical model level and the horizontal grid and require a dedicated sensitivity study. The annual enhancement, calculated as described in Sect. 2.4.2, was very variable and showed median values between 2 and 33 µg m−3 (Fig. 3b). Some years showed a higher variability, where the 75th percentile reached values up to 50 µg m−3, or in the extreme case of 2014 up to 200 µg m−3. This can be caused by one or two extreme DTEs with very high PMcoarse concentrations, as it can also be seen in Fig. 3a, where especially in 2014 it reached the highest median concentrations. The annual enhancement factor (EF) varied between median values of 3 and 12, with an overall median value of 7 (Fig. 3c). Higher EFs, such as in 2020, can originate from DTEs during which the PMcoarse background was very low and the PMcoarse concentration on DTDs was high.
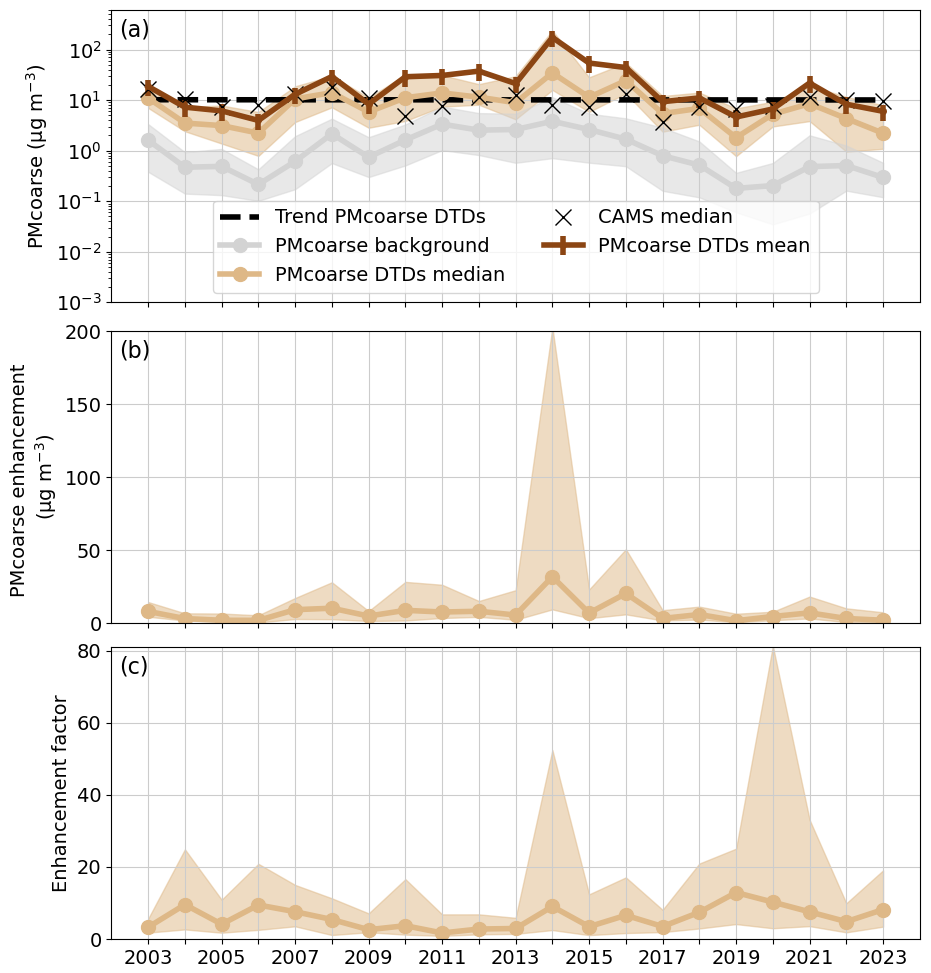
Figure 3(a) Annual median PMcoarse concentration during (brown) and outside (grey) DTDs. The dark brown line shows the average values during DTDs including error bars, defined as ±61 %. The crosses show the median value of the CAMS reanalysis data. The dashed line shows the trend in the PMcoarse concentration during DTDs. (b) Enhancement in the PMcoarse concentration during DTDs. (c) Enhancement factor (EF) of the PMcoarse concentration during DTDs. In all panels, the solid line shows the median values; the shaded area around is the 25th and 75th percentile.
3.4.2 Seasonal cycle
The PMcoarse background concentration (Fig. 4a, gray line) showed a clear annual cycle with minimum median values of 0.2 µg m−3 in winter and a maximum median value of 3 µg m−3 in summer. The PMcoarse concentration during DTDs (Fig. 4a, brown line) followed this annual cycle of the background and was almost all of the time one order of magnitude higher, with minimum median concentrations in winter of about 1 µg m−3 and maximum median concentrations in summer of about 10 µg m−3. One exception is November, where the concentration during DTDs was strongly driven by one extreme event in 2014. The average of the PMcoarse concentration during DTDs does not follow the seasonal cycle. While the average PMcoarse concentration aligns with the 75th percentile until October, from October to December it grows up to a factor of 5 higher than the 75th percentile. This increase suggests an increasing influence of intense dust transport events on the PMcoarse concentration and rises an issue on how the PMcoarse concentration during DTDs should be assessed statistically. While the median values help identifying recurring conditions or cycles and drawing a climatology over a long time period, averages may underline months containing strong dust transport events and may be used to isolate specific and intense anomalies. As the focus of this paper is the analysis of the climatology, the following results will be discussed based only on the median values. Escudero et al. (2007) and Querol et al. (2009) observed in their studies a similar annual variability in Spain and the Mediterranean basin with higher concentrations in summer compared to winter. This result supports the idea that in winter, when CMN is more often in the free troposphere, background concentrations are lower while in summer, when CMN is most often affected by PBL air masses, background concentrations are higher. The influence of eventual diel changes in the background concentration due to an increase in the PBL height are negligible, as the coarse particle concentration measured at CMN does not underlay a diel cycle (Marinoni et al., 2008). Other than the effect of the PBL, also wet removal by precipitation can promote the observed annual cycle. The lack of rainfall in summer hinders wet removal (Mifka et al., 2022) and by that aerosol particles in the atmosphere and specifically the PBL are enriched, increasing the background values as well as the dust concentration (Wang et al., 2021). The CAMS reanalysis reflects the seasonal cycle of the measurements and shows a minimum in the winter months and a maximum in April/May. In the summer and autumn months the CAMS data points fall well within the 25th/75th percentile and are very close to the measured points. This difference is increased especially in winter, where CAMS consistently underestimates the PM mass concentration. The enhancement in the PMcoarse concentration followed the same annual cycle as the PMcoarse concentration (Fig. 4b), which is a reasonable behavior as the dust inputs act as a flux that is superimposing to the background. It was the lowest in January and December, with median values of 1 µg m−3. These two months also showed the lowest variability, since the spread between the 25th and 75th percentile is 3.5 µg m−3 at maximum. In spring and early summer, the PMcoarse enhancement was much higher with maximum median values of up to 8 µg m−3. Also the variability within one month was increased compared to winter and the spread between the 25th and 75th percentile reached up to 25 µg m−3. The EF (Fig. 4c) showed an opposite profile compared to the PMcoarse concentration and enhancement, with a minimum median value of about 2 and a low variability in spring and summer, and maximum median values between 15 and 25 with a high variability from September to February. Even though dust transport in winter is rarer (Sect. 3.2) than in summer, its impact on the PMcoarse concentration is much stronger. Due to the cleaner atmosphere in the winter free troposphere, the EF during DTEs is higher compared to the enhancement dust induces in summer, in addition to the aerosol population in the PBL.
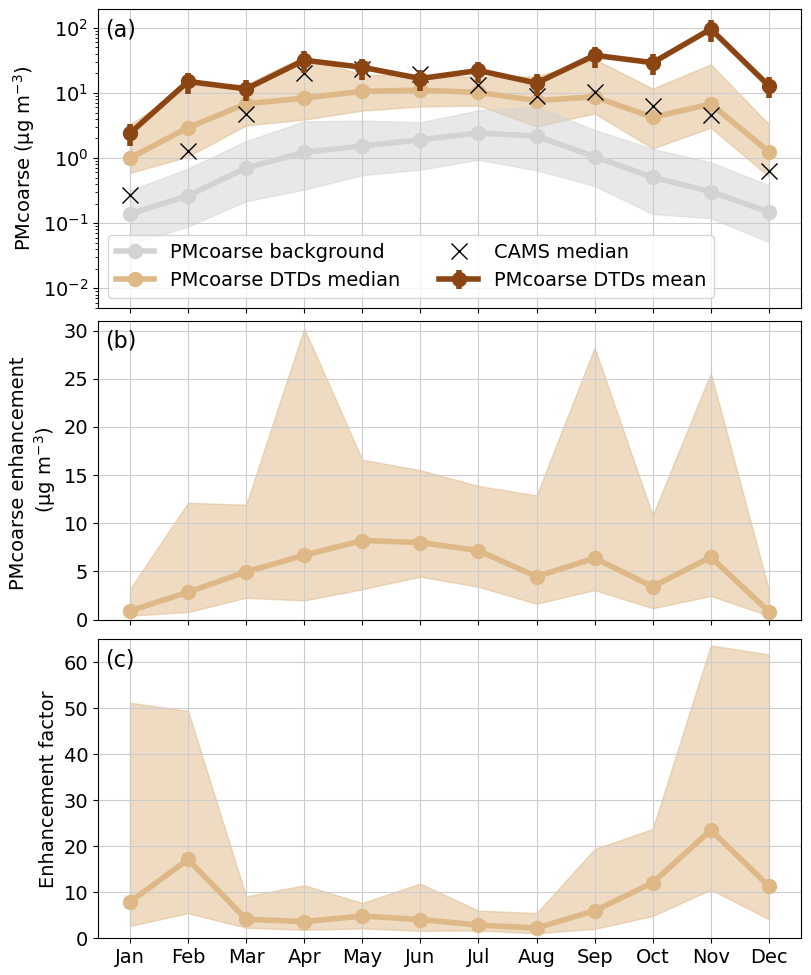
Figure 4(a) Monthly median PMcoarse concentration during (brown) and outside (grey) of DTDs. The dark brown line shows the average values during DTDs including error bars, defined as ±61 %. The crosses show the median value of the CAMS reanalysis data. (b) Enhancement in the PMcoarse concentration during DTDs. (c) Enhancement factor (EF) of the PMcoarse concentration during DTDs. In all panels, the solid line shows the median values; the shaded area around is the 25th and 75th percentile.
3.5 Interannual variability and annual cycle in the duration of dust transport events
The interannual variability of the duration of the DTEs, presented as the fraction of the number of DTEs for each duration group over the total number of DTEs in the respective year or month, showed fluctuations throughout the 21 years, but no distinct pattern (Fig. 5a). In most of the years, the highest fraction was observed for 1 d events, with values between 30 % and 55 %. The second highest fraction in most of the years was 2 d events with values between 15 % and almost 20 %. Exceptions are the years from 2012 to 2018, in which the 2 d events represented the smallest fraction. The last two groups of 3 and ≥ 4 d made up a fraction between 5 % and 35 % each. However, there was no tendency towards longer or shorter DTEs over the years. When looking at the annual cycle, clear changes in the duration of DTEs were visible (Fig. 5b). The fraction of 1 d DTEs decreased from 75 % in January to 30 % in June, slightly increased afterwards and showed a second, equally low, minimum in November. The fraction of 2 d events was constant throughout the months with values around 15 %, except June where the fraction decreased to 5 %. As for the 2 d events, also the 3 d events showed a constant fraction around 10 %. Exceptions here were January and February, with lower fractions of 2 % and 5 % respectively and June with a higher fraction of 25 %. The class of the longest DTEs of ≥ 4 d was the highest between May and November with 20 % to 30 % and the lowest in the winter months and March, when it decreased to 5 %. The study of Duchi et al. (2016) already suggested a similar seasonal cycle for DTEs, with the majority of the winter events being of 1 d duration and the summer events being more often of a duration of multiple days. Also Petroselli et al. (2024) reported slightly more DTEs of 1 d duration in winter compared to summer, but did not observe in increase in the duration of DTEs in summer. Differences in the fractions of the different duration groups, between January and June, could originate from the increased dust injection into the atmosphere during the summer (Vandenbussche et al., 2020; Mousavi et al., 2023) and PBL height over the desert. In summer, the PBL can reach up to 6 km (Knippertz and Todd, 2012), so dust resides in the atmosphere above the Sahara at already high altitudes. As soon as atmospheric circulation is favorable, dust transport towards the Mediterranean will occur and depending on the stability of the circulation it can last multiple days. In winter, when the PBL height over the Sahara is lower, dust intrusions to altitudes of long-range transport are more prohibited. Moreover, during winter CMN is more often in the free troposphere where air masses can be diluted much faster.
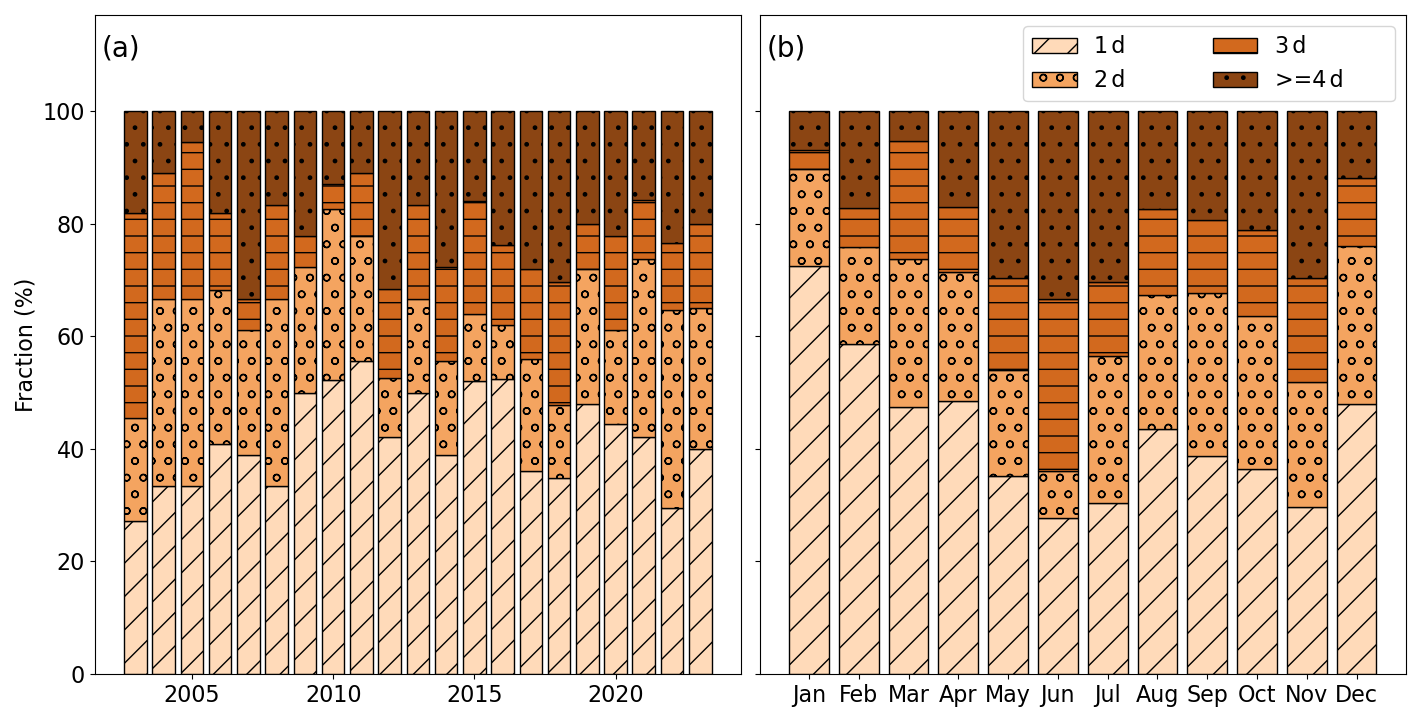
Figure 5Fractional duration of DTEs on an annual scale (a) and a monthly scale (b). The duration is divided into 1 d (beige with diagonal stripes), 2 d (orange with circles), 3 d (light brown with horizontal stripes) and ≥ 4 d (dark brown with dots) events. For each year and month the fraction is calculated as the ratio of the number of DTEs in the various duration groups over the total annual or monthly number of DTEs.
3.6 Higher PMcoarse enhancement during longer events
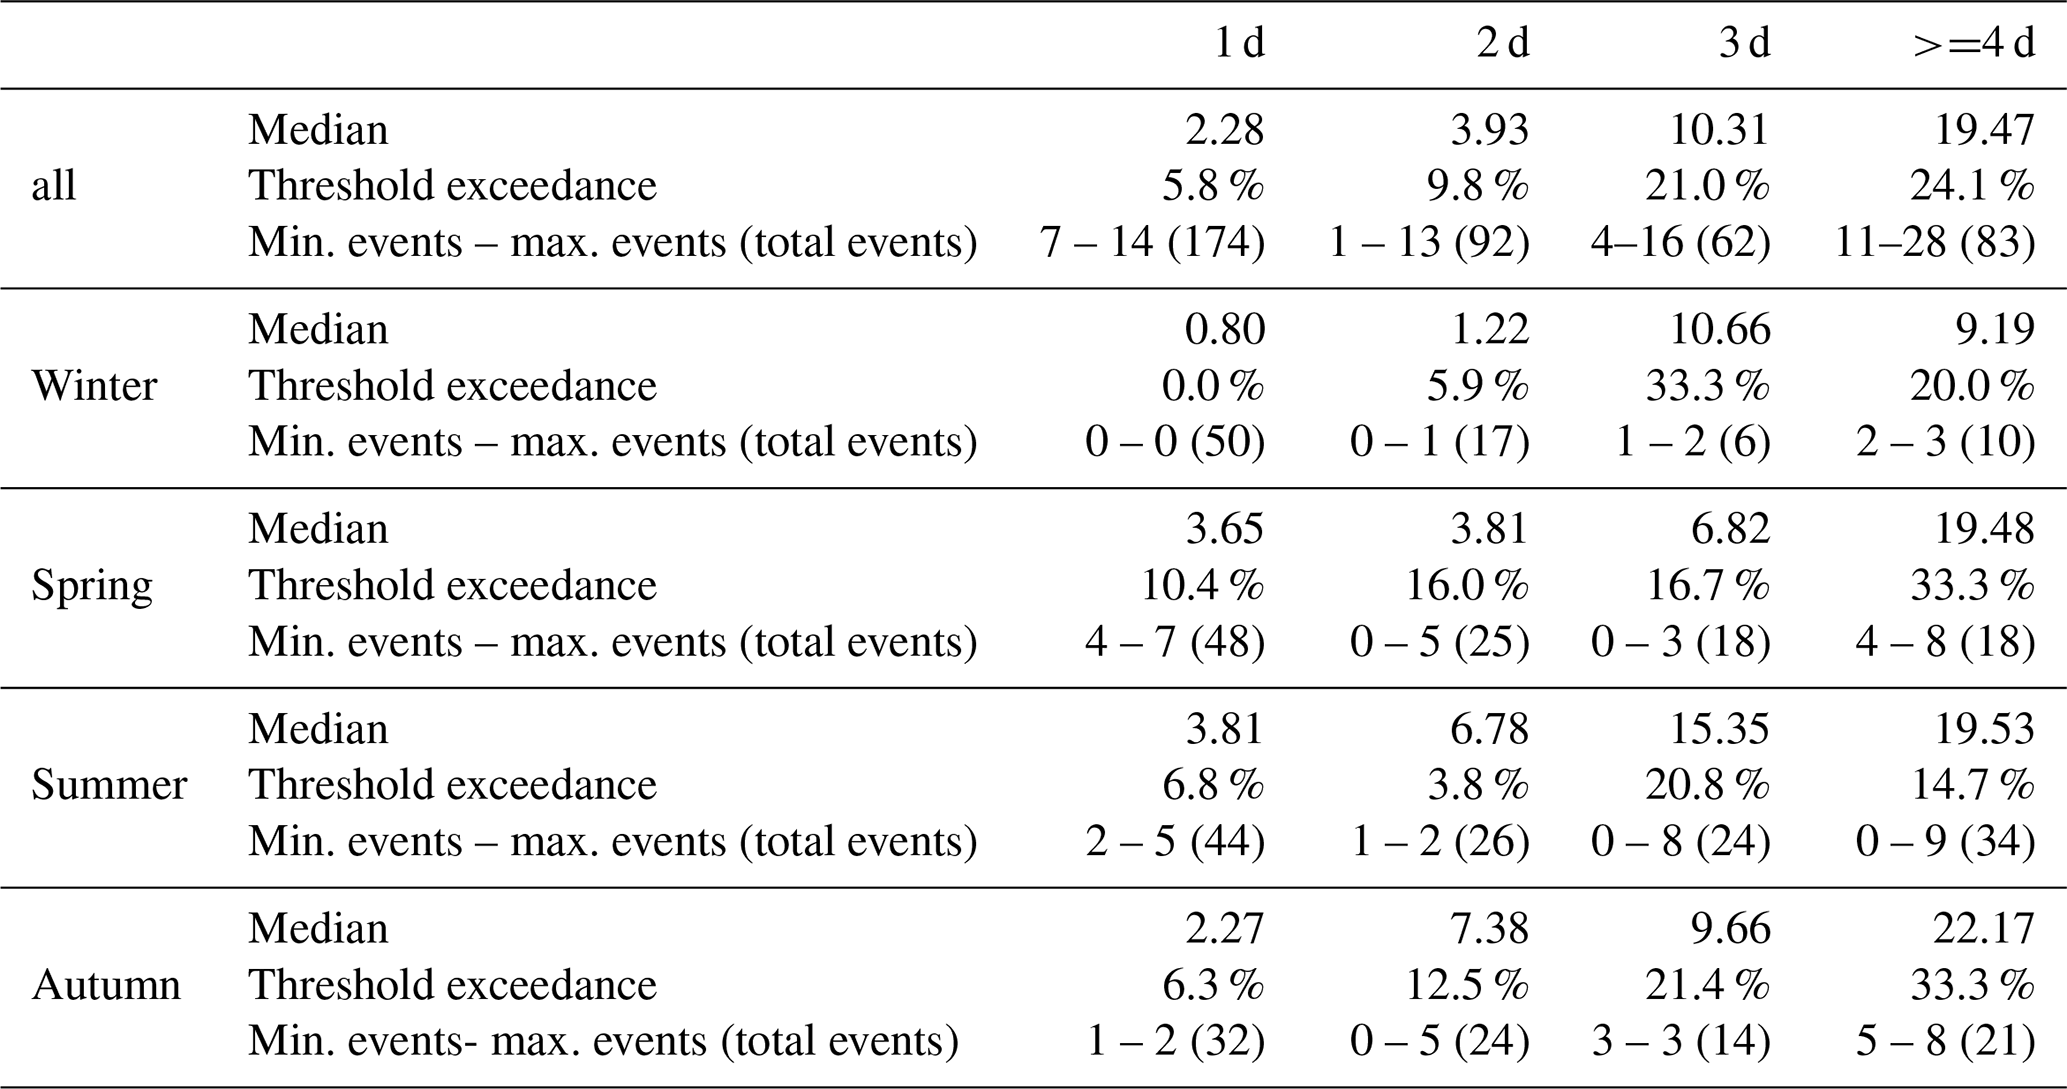
To assess the intensity of DTEs as function of their duration and peak PMcoarse enhancement, we compared the maximum daily PMcoarse enhancement of the different DTE durations (Fig. 6). The median of the maximum daily PMcoarse enhancement increased steadily with the duration of DTEs from 2.28 µg m−3 for 1 d events to 19.47 µg m−3 for DTEs that lasted at least 4 d (see Table 2), but stayed consistently below the WHO threshold value of 45 µg m−3. This means that the longer the DTE, the more likely it is to reach higher enhancements in the PMcoarse concentrations. The same pattern was observed when dividing the data into the different seasons (Fig. 7 and Table 2). One reason for the observed behavior could be that for longer DTEs a more extensive dust plume reached CMN, which might be connected to a dust storm over the Saharan desert induced by strong winds. Short DTEs might originate from dust transport of the generally dust loaded air over the Sahara without a prior dust storm. Another important point to mark here is that longer lasting DTEs seem to be more likely to occasionally exceed the threshold value given by the WHO, as the fraction of DTEs above the threshold increases from 5.8 % for 1 d events to 24.1 % for events that last at least four days. To account for the uncertainty of the PMcoarse enhancement and its effect on the threshold exceedance, the ±61 % uncertainty, as given in Sect. 2.6, is applied on the data and the respective days exceeding the threshold are counted (see Table 2). While the analysis of the full data set (Fig. 6) is based on enough data for each duration class, some of the seasonal data (Fig. 7) must be taken carefully as only very few events are available. Independent of the uncertainty, the numbers presented here give only a lower limit as we consider the PMcoarse and not the PM10 concentration and by that exclude some part of the aerosol mass concentration.
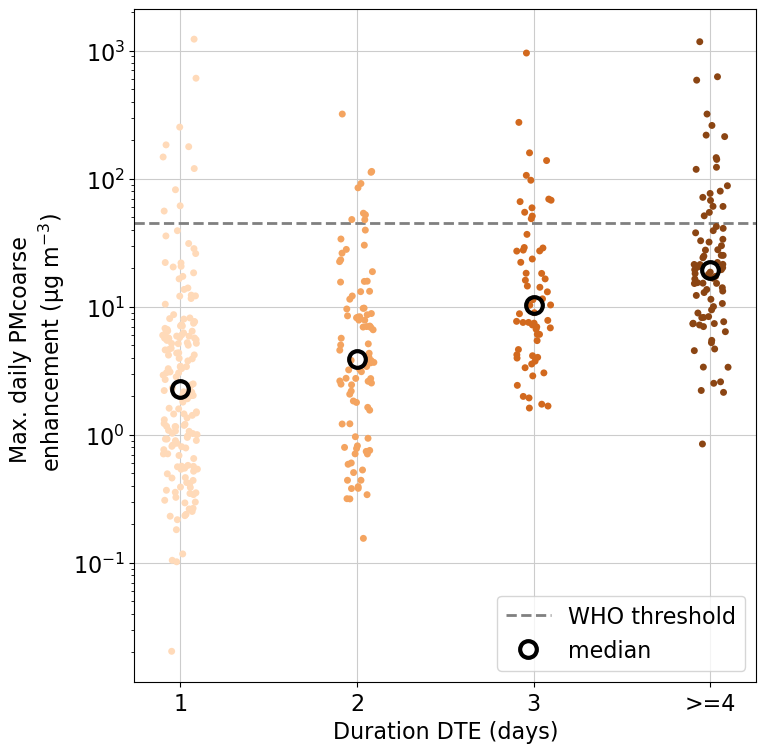
Figure 6Maximum daily PMcoarse enhancement for the four different lengths of DTE. Each point represents one DTE, the black circle the median value and the dashed line the WHO threshold.
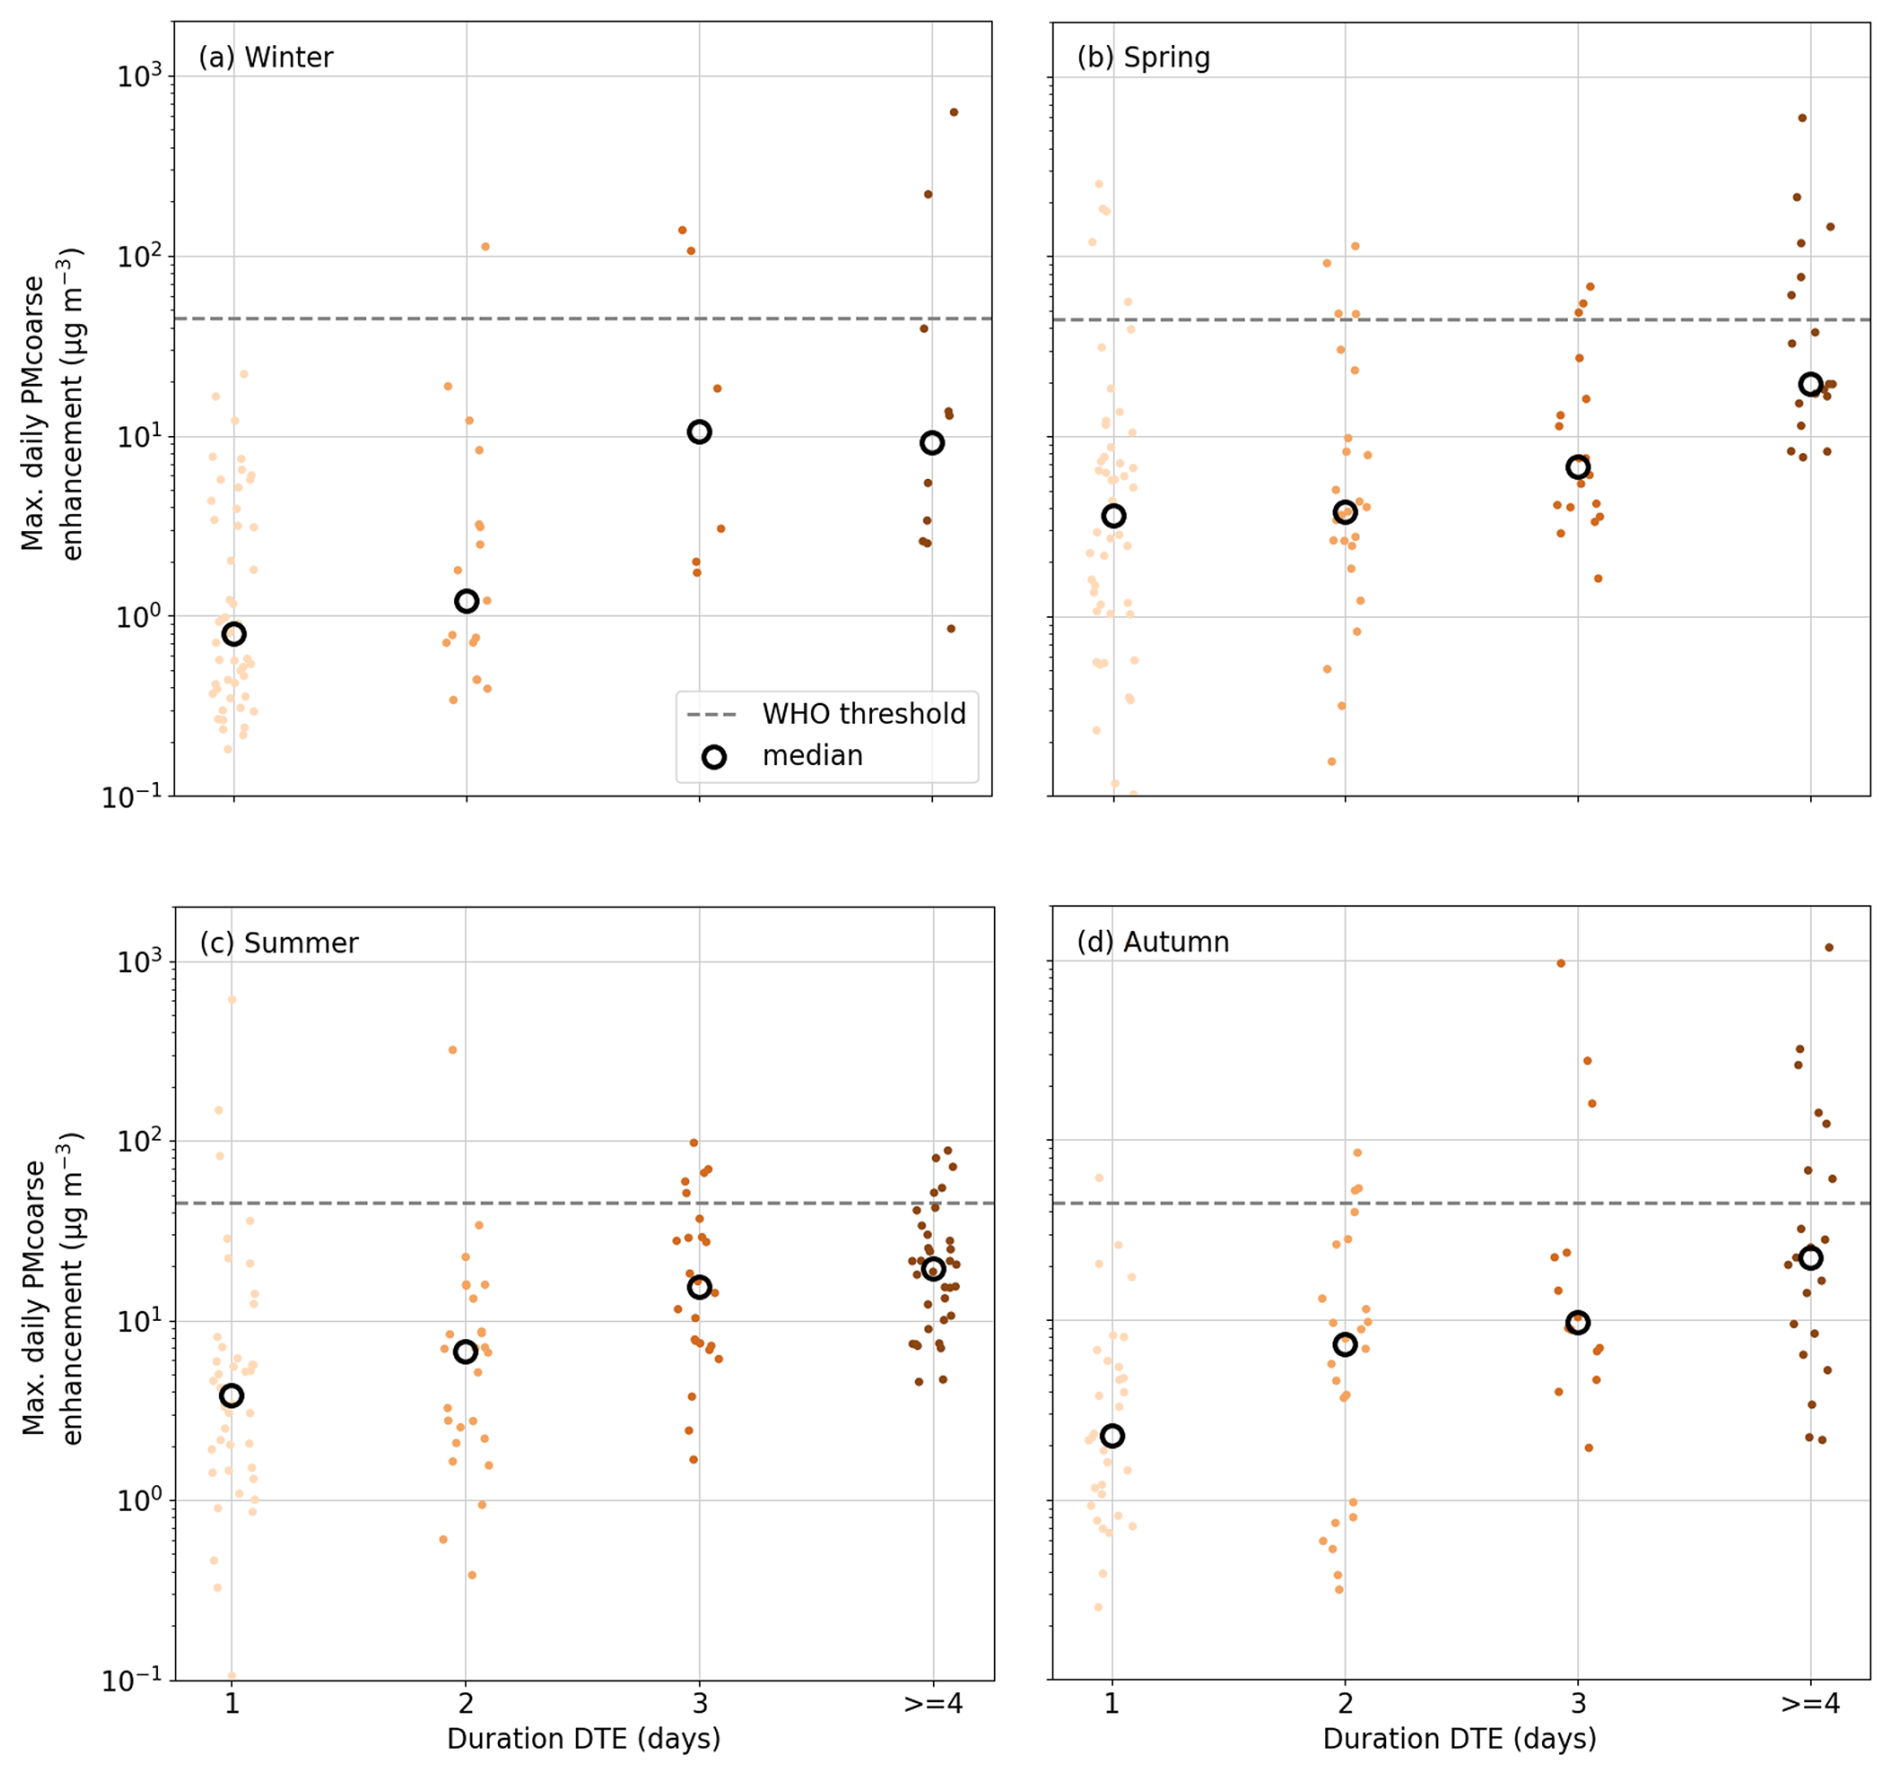
Figure 7Maximum daily PMcoarse enhancement for the different durations of dust transport events. The data are divided into the four seasons: (a) winter, (b) spring, (c) summer and (d) autumn. Each point represents one DTE, the black circle the median value and the dashed line the WHO threshold.
Table 2Summary of the results from Figs. 6 and 7 indicating the median of the maximum daily PMcoarse enhancement for the four dust transport event duration categories (1, 2, 3 and >= 4 d) the median of the maximum daily PMcoarse enhancement. The percentage of how many DTEs exceeded the WHO threshold value is also provided. To account for the uncertainty, the lower and upper uncertainty was applied on the dataset and the respective number of days above the threshold were counted. The number in brackets give the total number of events.
In this paper we present 21 years, from 2003 to 2023, of continuous measurements of the optical particle size distribution at the mountain station of Monte Cimone (CMN), the highest peak of the Italian northern Apennines, from which we identified Saharan dust transport events (DTEs). Additionally to what was presented in Duchi et al. (2016), we give a detailed evaluation of the uncertainty and present the PMcoarse concentration instead of the number concentration of coarse particles, to be more comparable to other studies. The data showed a similar high fraction of dust transport days (DTDs) of 15.8 % throughout all the years, with no detectable increasing or decreasing trend. The annual cycle of DTDs was characterized by one broad maximum in summer and a secondary maximum in October and November, with equal high fractions of DTDs of about 20 %. For the annual variation in DTDs, the position and strength of cyclones in the Mediterranean play a crucial role (Varga, 2020; Flaounas et al., 2022) together with the position of the ITCZ, where a cyclone placed over northwest Africa and the more northward position of the ITCZ in summer time promote dust transport (Ginoux et al., 2012; Sunnu et al., 2008). We show that dust transport consistently increases the PMcoarse concentration by one order of magnitude compared to the background. Our findings on the annual variation in the PMcoarse concentration report a higher enhancement factor in winter compared to summer, as in winter the background concentration is very low and a DTE represents a major disturbance in that season. Longer lasting events in summer than in winter result from a combination of favorable conditions. In summer, the dust mobilization over the Saharan desert is increased (Vandenbussche et al., 2020; Mousavi et al., 2023) and with the increased PBL height an enhanced dust load is injected to higher altitudes, where it can be more easily transported over long distances (Merdji et al., 2023). In combination with very persistent high-pressure systems, which can form over the Mediterranean in summer, dust transport for a longer time period is favored in the summer months. While in winter, CMN is more frequently in the free troposphere, and exposed to faster air mass transport, in summer CMN is more often affected by PBL air masses (Cristofanelli et al., 2018), where the mineral dust transported from Northern Africa can reside longer. Moreover, wet removal of aerosol particles is reduced during the dry summer months compared to winter (Mifka et al., 2022), leading to a longer residence time in the atmosphere. With our measurements, we provide valuable information on Saharan dust transport over Italy, which might directly impact the energy sector and its solar energy production. As, on average, 58 d per year are affected by Saharan dust transport, we can emphasize that strong effects are expected even far from the source region, with an enhancement in the PMcoarse concentration between 1 and 8 µg m−3, with an occasional exceedance of the WHO threshold of 45 µg m−3. This study set a milestone in DTE identification, providing a robust and long dataset based on the mass concentration, which will help in validating the rising number of dust forecast products provided by intergovernmental entities such as Copernicus. Future studies can be directed towards (i) investigating in how far wet removal of dust on its transport pathway influences the presence and amount of dust reaching CMN or other locations (Mifka et al., 2022), (ii) combining the here applied method with other methods using e.g. the optical properties of dust (Collaud Coen et al., 2004) and (iii) investigating the various lengths of DTEs by using the dust optical depth or reanalysis data of the geopotential height. This will help to improve our understanding of dust transported in the atmosphere under changing Mediterranean conditions.
The FLEXTRA trajectories used for the detection of dust transport events can be accessed under https://nadir-trajectories.nilu.no/trajectories/ (last access: 7 November 2024) by selecting “modelldata”, the respective year and then the station “mtcimone”. The OPC data products are available under https://doi.org/10.71763/XDZA-FA77 (Vogel et al., 2025). The CAMS reanalysis data used in this study are publicly available through the Atmosphere Data Store: CAMS global reanalysis (EAC4); https://doi.org/10.24381/d58bbf47 (Copernicus Atmosphere Monitoring Service, 2020).
The supplement related to this article is available online at https://doi.org/10.5194/acp-25-15453-2025-supplement.
FV analyzed and interpreted the data and wrote the manuscript. DP supported the data analysis. DP, PB, PC, MZ and AM contributed to the interpretation of the data set and the discussion of the results. All authors reviewed the manuscript.
The contact author has declared that none of the authors has any competing interests.
Publisher’s note: Copernicus Publications remains neutral with regard to jurisdictional claims made in the text, published maps, institutional affiliations, or any other geographical representation in this paper. While Copernicus Publications makes every effort to include appropriate place names, the final responsibility lies with the authors. Views expressed in the text are those of the authors and do not necessarily reflect the views of the publisher.
We would like to thank Maurizio Busetto, Francescopiero Calzolari and Fabrizio Roccato for their valuable work for the instrumental maintenance, data acquisition and data flow. The authors gratefully acknowledge the Italian Air Force (CAMM) for access and logistic support at Monte Cimone. NILU is acknowledged for providing the FLEXTRA trajectories (https://www.nilu.no/trajectories, last access: 4 November 2025) used in this study.
This work was supported by the EU-funded EUSAAR PF6 (European Supersites for Atmospheric Aerosol Research), ACTRIS and ACTRIS-2 H2020 (Aerosols, Clouds and Trace gases Research InfraStructure Network), and by the Italian Ministry for University and Research (MUR) through PON PER_ACTRIS_IT and the ITINERIS projects. The Italian component of ACTRIS RI was also funded on national level by Fondo Ordinario per gli Enti di ricerca (FOE) for ESFRI activities. FV was funded by “Progetto nazionale Rafforzamento del Capitale Umano CIR01_00015 – PER_ACTRIS_IT Potenziamento della componente italiana della Infrastruttura di Ricerca Aerosol, Clouds and Trace Gases – Rafforzamento del Capitale Umano”.
This paper was edited by Marco Gaetani and reviewed by two anonymous referees.
Adebiyi, A., Kok, J. F., Murray, B. J., Ryder, C. L., Stuut, J.-B. W., Kahn, R. A., Knippertz, P., Formenti, P., Mahowald, N. M., Pérez García-Pando, C., Klose, M., Ansmann, A., Samset, B. H., Ito, A., Balkanski, Y., Di Biagio, C., Romanias, M. N., Huang, Y., and Meng, J.: A review of coarse mineral dust in the Earth system, Aeolian Research, 60, 100849, https://doi.org/10.1016/j.aeolia.2022.100849, 2023. a
Barnaba, F. and Gobbi, G. P.: Aerosol seasonal variability over the Mediterranean region and relative impact of maritime, continental and Saharan dust particles over the basin from MODIS data in the year 2001, Atmos. Chem. Phys., 4, 2367–2391, https://doi.org/10.5194/acp-4-2367-2004, 2004. a
Benkhalifa, J., Léon, J. F., and Chaabane, M.: Aerosol optical properties of Western Mediterranean basin from multi-year AERONET data, Journal of Atmospheric and Solar-Terrestrial Physics, 164, 222–228, https://doi.org/10.1016/j.jastp.2017.08.029, 2017. a
Blake, L., Arola, A., Benedictow, A., Bennouna, Y., Bouarar, I., Cuevas, E., Errera, Q., Eskes, H., Griesfeller, J., Ilic, L., Kapsomenakis, J., Langerock, B., Li, C. W. Y., E, Mortier, A., Pison, I., Pitkänen, M., Richter, A., Schoenhardt, A., Schulz, M., Tarniewicz, J., Tsikerdekis, A., Warneke, T., and Zerefos, C.: Validation report for the CAMS global reanalyses of aerosol and reactive trace gases: 2003–2024, Copernicus Atmosphere Monitoring Service (CAMS) report, https://doi.org/10.24380/vv0t-8tcg, 2025. a
Bonasoni, P., Cristofanelli, P., Calzolari, F., Bonafè, U., Evangelisti, F., Stohl, A., Zauli Sajani, S., van Dingenen, R., Colombo, T., and Balkanski, Y.: Aerosol-ozone correlations during dust transport episodes, Atmos. Chem. Phys., 4, 1201–1215, https://doi.org/10.5194/acp-4-1201-2004, 2004. a, b
Brattich, E., Riccio, A., Tositti, L., Cristofanelli, P., and Bonasoni, P.: An outstanding Saharan dust event at Mt. Cimone (2165 m a.s.l., Italy) in March 2004, Atmospheric Environment, 113, 223–235, https://doi.org/10.1016/j.atmosenv.2015.05.017, 2015. a
Burkart, J., Steiner, G., Reischl, G., Moshammer, H., Neuberger, M., and Hitzenberger, R.: Characterizing the performance of two optical particle counters (Grimm OPC1.108 and OPC1.109) under urban aerosol conditions, Journal of Aerosol Science, 41, 953–962, https://doi.org/10.1016/j.jaerosci.2010.07.007, 2010. a
Cabello, M., Orza, J., Dueñas, C., Liger, E., Gordo, E., and Cañete, S.: Back-trajectory analysis of African dust outbreaks at a coastal city in southern Spain: Selection of starting heights and assessment of African and concurrent Mediterranean contributions, Atmospheric Environment, 140, 10–21, https://doi.org/10.1016/j.atmosenv.2016.05.047, 2016. a
Choobari, O. A., Zawar-Reza, P., and Sturman, A.: The global distribution of mineral dust and its impacts on the climate system: A review, Atmospheric Research, 138, 152–165, https://doi.org/10.1016/j.atmosres.2013.11.007, 2014. a
Collaud Coen, M., Weingartner, E., Schaub, D., Hueglin, C., Corrigan, C., Henning, S., Schwikowski, M., and Baltensperger, U.: Saharan dust events at the Jungfraujoch: detection by wavelength dependence of the single scattering albedo and first climatology analysis, Atmos. Chem. Phys., 4, 2465–2480, https://doi.org/10.5194/acp-4-2465-2004, 2004. a, b
Collaud Coen, M., Andrews, E., Bigi, A., Martucci, G., Romanens, G., Vogt, F. P. A., and Vuilleumier, L.: Effects of the prewhitening method, the time granularity, and the time segmentation on the Mann–Kendall trend detection and the associated Sen's slope, Atmos. Meas. Tech., 13, 6945–6964, https://doi.org/10.5194/amt-13-6945-2020, 2020. a
Conte, M., Merico, E., Cesari, D., Dinoi, A., Grasso, F., Donateo, A., Guascito, M., and Contini, D.: Long-term characterisation of African dust advection in south-eastern Italy: Influence on fine and coarse particle concentrations, size distributions, and carbon content, Atmospheric Research, 233, 104690, https://doi.org/10.1016/j.atmosres.2019.104690, 2020. a
Copernicus Atmosphere Monitoring Service: CAMS global reanalysis (EAC4), Copernicus Atmosphere Monitoring Service (CAMS) Atmosphere Data Store, https://doi.org/10.24381/d58bbf47, 2020. a
Cristofanelli, P., Brattich, E., Decesari, S., Landi, T. C., Maione, M., Putero, D., Tositti, L., and Bonasoni, P.: High-Mountain Atmospheric Research: The Italian Mt. Cimone WMO/GAW Global Station (2165 m a.s.l.), Springer, https://doi.org/10.1007/978-3-319-61127-3, 2018. a
Cristofanelli, P., Gutiérrez, I., Adame, J., Bonasoni, P., Busetto, M., Calzolari, F., Putero, D., and Roccato, F.: Interannual and seasonal variability of NOx observed at the Mt. Cimone GAW/WMO global station (2165 m a.s.l., Italy), Atmospheric Environment, 249, 118245, https://doi.org/10.1016/j.atmosenv.2021.118245, 2021. a
Cuevas-Agulló, E., Barriopedro, D., García, R. D., Alonso-Pérez, S., González-Alemán, J. J., Werner, E., Suárez, D., Bustos, J. J., García-Castrillo, G., García, O., Barreto, Á., and Basart, S.: Sharp increase in Saharan dust intrusions over the western Euro-Mediterranean in February–March 2020–2022 and associated atmospheric circulation, Atmos. Chem. Phys., 24, 4083–4104, https://doi.org/10.5194/acp-24-4083-2024, 2024. a
Di Antonio, L., Di Biagio, C., Foret, G., Formenti, P., Siour, G., Doussin, J.-F., and Beekmann, M.: Aerosol optical depth climatology from the high-resolution MAIAC product over Europe: differences between major European cities and their surrounding environments, Atmos. Chem. Phys., 23, 12455–12475, https://doi.org/10.5194/acp-23-12455-2023, 2023. a
Duchi, R., Cristofanelli, P., Landi, T. C., Arduini, J., Bonafe’, U., Bourcier, L., Busetto, M., Calzolari, F., Marinoni, A., Putero, D., and Bonasoni, P.: Long-term (2002–2012) investigation of Saharan dust transport events at Mt. Cimone GAW global station, Italy (2165 m a.s.l.), Elementa: Science of the Anthropocene, 4, 000085, https://doi.org/10.12952/journal.elementa.000085, 2016. a, b, c, d, e, f, g, h, i, j, k, l, m, n
Dulac, F., Mihalopoulos, N., Kaskaoutis, D. G., Querol, X., di Sarra, A., Masson, O., Pey, J., Sciare, J., and Sicard, M.: History of Mediterranean Aerosol Observations, Springer International Publishing, Cham, 145–252, ISBN 978-3-031-12741-0, https://doi.org/10.1007/978-3-031-12741-0_8, 2023. a
Escudero, M., Querol, X., Pey, J., Alastuey, A., Pérez, N., Ferreira, F., Alonso, S., Rodríguez, S., and Cuevas, E.: A methodology for the quantification of the net African dust load in air quality monitoring networks, Atmospheric Environment, 41, 5516–5524, https://doi.org/10.1016/j.atmosenv.2007.04.047, 2007. a, b
Esmen, N. A. and Corn, M.: Residence time of particles in urban air, Atmospheric Environment (1967), 5, 571–578, https://doi.org/10.1016/0004-6981(71)90113-2, 1971. a
Flaounas, E., Davolio, S., Raveh-Rubin, S., Pantillon, F., Miglietta, M. M., Gaertner, M. A., Hatzaki, M., Homar, V., Khodayar, S., Korres, G., Kotroni, V., Kushta, J., Reale, M., and Ricard, D.: Mediterranean cyclones: current knowledge and open questions on dynamics, prediction, climatology and impacts, Weather Clim. Dynam., 3, 173–208, https://doi.org/10.5194/wcd-3-173-2022, 2022. a, b, c, d
Froyd, K., Yu, P., Schill, G., Brock, C., Kupc, A., Williamson, C., Jensen, E., Ray, E., Rosenlof, K., Bian, H., Darmenov, A., Colarco, P., Diskin, G., Bui, T. P., and Murphy, D.: Dominant role of mineral dust in cirrus cloud formation revealed by global-scale measurements, Nat. Geosci., 15, 177–183, https://doi.org/10.1038/s41561-022-00901-w, 2022. a
Gabbi, J., Huss, M., Bauder, A., Cao, F., and Schwikowski, M.: The impact of Saharan dust and black carbon on albedo and long-term mass balance of an Alpine glacier, The Cryosphere, 9, 1385–1400, https://doi.org/10.5194/tc-9-1385-2015, 2015. a
Ginoux, P., Chin, M., Tegen, I., Prospero, J. M., Holben, B., Dubovik, O., and Lin, S.-J.: Sources and distributions of dust aerosols simulated with the GOCART model, Journal of Geophysical Research: Atmospheres, 106, 20255–20273, https://doi.org/10.1029/2000JD000053, 2001. a, b
Ginoux, P., Prospero, J. M., Gill, T. E., Hsu, N. C., and Zhao, M.: Global‐scale attribution of anthropogenic and natural dust sources and their emission rates based on MODIS Deep Blue aerosol products, Reviews of Geophysics, 50, 2012RG000388, https://doi.org/10.1029/2012RG000388, 2012. a
Gobbi, G., Barnaba, F., Di Liberto, L., Bolignano, A., Lucarelli, F., Nava, S., Perrino, C., Pietrodangelo, A., Basart, S., Costabile, F., Dionisi, D., Rizza, U., Canepari, S., Sozzi, R., Morelli, M., Manigrasso, M., Drewnick, F., Struckmeier, C., Poenitz, K., and Wille, H.: An inclusive view of Saharan dust advections to Italy and the Central Mediterranean, Atmospheric Environment, 201, 242–256, https://doi.org/10.1016/j.atmosenv.2019.01.002, 2019. a, b
Goudie, A. S.: Desert dust and human health disorders, Environment International, 63, 101–113, https://doi.org/10.1016/j.envint.2013.10.011, 2014. a
Huo, Y., Li, M., Wang, X., Sun, J., Zhou, Y., Ma, Y., and He, M.: Rapid oxidation of phenolic compounds by O3 and HO•: effects of the air–water interface and mineral dust in tropospheric chemical processes, Atmos. Chem. Phys., 24, 12409–12423, https://doi.org/10.5194/acp-24-12409-2024, 2024. a
Israelevich, P. L., Levin, Z., Joseph, J. H., and Ganor, E.: Desert aerosol transport in the Mediterranean region as inferred from the TOMS aerosol index, Journal of Geophysical Research: Atmospheres, 107, AAC 13–1–AAC 13–13, https://doi.org/10.1029/2001JD002011, 2002. a
Karydis, V. A., Tsimpidi, A. P., Bacer, S., Pozzer, A., Nenes, A., and Lelieveld, J.: Global impact of mineral dust on cloud droplet number concentration, Atmos. Chem. Phys., 17, 5601–5621, https://doi.org/10.5194/acp-17-5601-2017, 2017. a
Kaskaoutis, D. G., Prasad, A. K., Kosmopoulos, P. G., Sinha, P. R., Kharol, S. K., Gupta, P., El-Askary, H. M., and Kafatos, M.: Synergistic Use of Remote Sensing and Modeling for Tracing Dust Storms in the Mediterranean, Advances in Meteorology, 2012, 861026, https://doi.org/10.1155/2012/861026, 2012. a
Kinne, S., Schulz, M., Textor, C., Guibert, S., Balkanski, Y., Bauer, S. E., Berntsen, T., Berglen, T. F., Boucher, O., Chin, M., Collins, W., Dentener, F., Diehl, T., Easter, R., Feichter, J., Fillmore, D., Ghan, S., Ginoux, P., Gong, S., Grini, A., Hendricks, J., Herzog, M., Horowitz, L., Isaksen, I., Iversen, T., Kirkevåg, A., Kloster, S., Koch, D., Kristjansson, J. E., Krol, M., Lauer, A., Lamarque, J. F., Lesins, G., Liu, X., Lohmann, U., Montanaro, V., Myhre, G., Penner, J., Pitari, G., Reddy, S., Seland, O., Stier, P., Takemura, T., and Tie, X.: An AeroCom initial assessment – optical properties in aerosol component modules of global models, Atmos. Chem. Phys., 6, 1815–1834, https://doi.org/10.5194/acp-6-1815-2006, 2006. a
Knippertz, P. and Todd, M. C.: Mineral dust aerosols over the Sahara: Meteorological controls on emission and transport and implications for modeling, Reviews of Geophysics, 50, https://doi.org/10.1029/2011RG000362, 2012. a, b
Kok, J. F., Adebiyi, A. A., Albani, S., Balkanski, Y., Checa-Garcia, R., Chin, M., Colarco, P. R., Hamilton, D. S., Huang, Y., Ito, A., Klose, M., Li, L., Mahowald, N. M., Miller, R. L., Obiso, V., Pérez García-Pando, C., Rocha-Lima, A., and Wan, J. S.: Contribution of the world's main dust source regions to the global cycle of desert dust, Atmos. Chem. Phys., 21, 8169–8193, https://doi.org/10.5194/acp-21-8169-2021, 2021. a
Kosmopoulos, P., Kaskaoutis, D., Nastos, P., and Kambezidis, H.: Seasonal variation of columnar aerosol optical properties over Athens, Greece, based on MODIS data, Remote Sensing of Environment, 112, 2354–2366, https://doi.org/10.1016/j.rse.2007.11.006, 2008. a
Lohmann, U., Lüönd, F., and Mahrt, F.: An introduction to clouds: From the microscale to climate, Cambridge University Press, https://doi.org/10.1017/CBO9781139087513, 2016. a
Mahowald, N., Albani, S., Kok, J. F., Engelstaeder, S., Scanza, R., Ward, D. S., and Flanner, M. G.: The size distribution of desert dust aerosols and its impact on the Earth system, Aeolian Research, 15, 53–71, https://doi.org/10.1016/j.aeolia.2013.09.002, 2014. a
Marenco, F., Bonasoni, P., Calzolari, F., Ceriani, M., Chiari, M., Cristofanelli, P., D'Alessandro, A., Fermo, P., Lucarelli, F., Mazzei, F., Nava, S., Piazzalunga, A., Prati, P., Valli, G., and Vecchi, R.: Characterization of atmospheric aerosols at Monte Cimone, Italy, during summer 2004: Source apportionment and transport mechanisms, Journal of Geophysical Research: Atmospheres, 111, https://doi.org/10.1029/2006JD007145, 2006. a
Marinoni, A., Cristofanelli, P., Calzolari, F., Roccato, F., Bonafè, U., and Bonasoni, P.: Continuous measurements of aerosol physical parameters at the Mt. Cimone GAW Station (2165 m a.s.l., Italy), Science of The Total Environment, 391, 241–251, https://doi.org/10.1016/j.scitotenv.2007.10.004, 2008. a
Melssen, E., Bish, D. L., Losovyj, Y., and Raff, J. D.: Photoreduction of Nitrate to HONO and NOx by Organic Matter in the Presence of Iron and Aluminum, ACS Earth and Space Chemistry, 8, https://doi.org/10.1021/acsearthspacechem.4c00252, 2024. a
Merdji, A. B., Lu, C., Xu, X., and Mhawish, A.: Long-term three-dimensional distribution and transport of Saharan dust: Observation from CALIPSO, MODIS, and reanalysis data, Atmospheric Research, 286, 106658, https://doi.org/10.1016/j.atmosres.2023.106658, 2023. a
Mifka, B., Telišman Prtenjak, M., Kuzmić, J., Čanković, M., Mateša, S., and Ciglenečki, I.: Climatology of Dust Deposition in the Adriatic Sea; a Possible Impact on Marine Production, Journal of Geophysical Research: Atmospheres, 127, e2021JD035783, https://doi.org/10.1029/2021JD035783, 2022. a, b, c
Miller, R. L., Tegen, I., and Perlwitz, J.: Surface radiative forcing by soil dust aerosols and the hydrologic cycle, Journal of Geophysical Research: Atmospheres, 109, https://doi.org/10.1029/2003JD004085, 2004. a
Millán-Martínez, M., Sánchez-Rodas, D., Sánchez De La Campa, A. M., and De La Rosa, J.: Contribution of anthropogenic and natural sources in PM10 during North African dust events in Southern Europe, Environmental Pollution, 290, 118065, https://doi.org/10.1016/j.envpol.2021.118065, 2021. a
Mousavi, S. V., Karami, K., Tilmes, S., Muri, H., Xia, L., and Rezaei, A.: Future dust concentration over the Middle East and North Africa region under global warming and stratospheric aerosol intervention scenarios, Atmos. Chem. Phys., 23, 10677–10695, https://doi.org/10.5194/acp-23-10677-2023, 2023. a, b
Mülmenstädt, J., Sourdeval, O., Delanoë, J., and Quaas, J.: Frequency of occurrence of rain from liquid-, mixed-, and ice-phase clouds derived from A-Train satellite retrievals, Geophysical Research Letters, 42, 6502–6509, https://doi.org/10.1002/2015GL064604, 2015. a
Nava, S., Calzolai, G., Chiari, M., Giannoni, M., Giardi, F., Becagli, S., Severi, M., Traversi, R., and Lucarelli, F.: Source Apportionment of PM2.5 in Florence (Italy) by PMF Analysis of Aerosol Composition Records, Atmosphere, 11, https://doi.org/10.3390/atmos11050484, 2020. a
Oduber, F., Calvo, A., Blanco-Alegre, C., Castro, A., Nunes, T., Alves, C., Sorribas, M., Fernández-González, D., Vega-Maray, A., Valencia-Barrera, R., Lucarelli, F., Nava, S., Calzolai, G., Alonso-Blanco, E., Fraile, B., Fialho, P., Coz, E., Prevot, A., Pont, V., and Fraile, R.: Unusual winter Saharan dust intrusions at Northwest Spain: Air quality, radiative and health impacts, Science of The Total Environment, 669, 213–228, https://doi.org/10.1016/j.scitotenv.2019.02.305, 2019. a
Petroselli, C., Crocchianti, S., Vecchiocattivi, M., Moroni, B., Selvaggi, R., Castellini, S., Corbucci, I., Bruschi, F., Marchetti, E., Galletti, M., Angelucci, M., and Cappelletti, D.: Decadal trends (2009–2018) in Saharan dust transport at Mt. Martano EMEP station, Italy, Atmospheric Environment, 304, 107364, https://doi.org/10.1016/j.atmosres.2024.107364, 2024. a, b, c, d
Pey, J., Querol, X., Alastuey, A., Forastiere, F., and Stafoggia, M.: African dust outbreaks over the Mediterranean Basin during 2001–2011: PM10 concentrations, phenomenology and trends, and its relation with synoptic and mesoscale meteorology, Atmos. Chem. Phys., 13, 1395–1410, https://doi.org/10.5194/acp-13-1395-2013, 2013. a, b, c, d, e
Putaud, J.-P., Van Dingenen, R., Dell'Acqua, A., Raes, F., Matta, E., Decesari, S., Facchini, M. C., and Fuzzi, S.: Size-segregated aerosol mass closure and chemical composition in Monte Cimone (I) during MINATROC, Atmos. Chem. Phys., 4, 889–902, https://doi.org/10.5194/acp-4-889-2004, 2004. a, b
Querol, X., Pey, J., Pandolfi, M., Alastuey, A., Cusack, M., Pérez, N., Moreno, T., Viana, M., Mihalopoulos, N., Kallos, G., and Kleanthous, S.: African dust contributions to mean ambient PM10 mass-levels across the Mediterranean Basin, Atmospheric Environment, 43, 4266–4277, https://doi.org/10.1016/j.atmosenv.2009.06.013, 2009. a, b, c
Schepanski, K.: Transport of Mineral Dust and Its Impact on Climate, Geosciences, 8, https://doi.org/10.3390/geosciences8050151, 2018. a
Stohl, A. and Seibert, P.: Accuracy of trajectories as determined from the conservation of meteorological tracers, Quarterly Journal of the Royal Meteorological Society, 124, 1465–1484, https://doi.org/10.1002/qj.49712454907, 1998. a
Stohl, A., Wotawa, G., Seibert, P., and Kromp-Kolb, H.: Interpolation errors in wind fields as a function of spatial and temporal resolution and their impact on different types of kinematic trajectories, J. Appl. Meteorol., 34, 2149–2165, 1995. a
Sunnu, A., Afeti, G., and Resch, F.: A long-term experimental study of the Saharan dust presence in West Africa, Atmospheric Research, 87, 13–26, https://doi.org/10.1016/j.atmosres.2007.07.004, 2008. a, b, c
Tafuro, A., Barnaba, F., De Tomasi, F., Perrone, M., and Gobbi, G.: Saharan dust particle properties over the central Mediterranean, Atmospheric Research, 81, 67–93, https://doi.org/10.1016/j.atmosres.2005.11.008, 2006. a
Tositti, L., Brattich, E., Cassardo, C., Morozzi, P., Bracci, A., Marinoni, A., Di Sabatino, S., Porcù, F., and Zappi, A.: Development and evolution of an anomalous Asian dust event across Europe in March 2020, Atmos. Chem. Phys., 22, 4047–4073, https://doi.org/10.5194/acp-22-4047-2022, 2022. a
Valenzuela, A., Olmo, F. J., Lyamani, H., Granados-Muñoz, M. J., Antón, M., Guerrero-Rascado, J. L., Quirantes, A., Toledano, C., Perez-Ramírez, D., and Alados-Arboledas, L.: Aerosol transport over the western Mediterranean basin: Evidence of the contribution of fine particles to desert dust plumes over Alborán Island, Journal of Geophysical Research: Atmospheres, 119, 14028–14044, https://doi.org/10.1002/2014JD022044, 2014. a
van Herpen, M. M. J. W., Li, Q., Saiz-Lopez, A., Liisberg, J. B., Röckmann, T., Cuevas, C. A., Fernandez, R. P., Mak, J. E., Mahowald, N. M., Hess, P., Meidan, D., Stuut, J.-B. W., and Johnson, M. S.: Photocatalytic chlorine atom production on mineral dust–sea spray aerosols over the North Atlantic, Proceedings of the National Academy of Sciences, 120, e2303974120, https://doi.org/10.1073/pnas.2303974120, 2023. a
Vandenbussche, S., Callewaert, S., Schepanski, K., and De Mazière, M.: North African mineral dust sources: new insights from a combined analysis based on 3D dust aerosol distributions, surface winds and ancillary soil parameters, Atmos. Chem. Phys., 20, 15127–15146, https://doi.org/10.5194/acp-20-15127-2020, 2020. a, b
Varga, G.: Changing nature of Saharan dust deposition in the Carpathian Basin (Central Europe): 40 years of identified North African dust events (1979–2018), Environment International, 139, 105712, https://doi.org/10.1016/j.envint.2020.105712, 2020. a, b, c, d
Varga, G., Gresina, F., Szeberényi, J., Gelencsér, A., and Rostási, Á.: Effect of Saharan dust episodes on the accuracy of photovoltaic energy production forecast in Hungary (Central Europe), Renewable and Sustainable Energy Reviews, 193, 114289, https://doi.org/10.1016/j.rser.2024.114289, 2024. a
Vogel, F.: Short-term Variation in Measurements of Atmospheric Ice-Nucleating Particle Concentrations, PhD thesis, Dissertation, Karlsruhe, Karlsruher Institut für Technologie (KIT), https://doi.org/10.5445/IR/1000151147, 2022. a
Vogel, F., Marinoni, A., Putero, D., Mona, L., Ripepi, E., and Volini, M.: Dust event identification product dataset collection over Monte Cimone, Italy 2003-2023, Version 1, ITINERIS HUB [data set], https://doi.org/10.71763/XDZA-FA77, 2025. a
Wang, Y., Xia, W., and Zhang, G. J.: What rainfall rates are most important to wet removal of different aerosol types?, Atmos. Chem. Phys., 21, 16797–16816, https://doi.org/10.5194/acp-21-16797-2021, 2021. a
Weinzierl, B., Sauer, D., Minikin, A., Reitebuch, O., Dahlkötter, F., Mayer, B., Emde, C., Tegen, I., Gasteiger, J., Petzold, A., Veira, A., Kueppers, U., and Schumann, U.: On the visibility of airborne volcanic ash and mineral dust from the pilot's perspective in flight, Physics and Chemistry of the Earth, Parts A/B/C, 45–46, 87–102, https://doi.org/10.1016/j.pce.2012.04.003, 2012. a
Wittmaack, K.: Advanced evaluation of size-differential distributions of aerosol particles, Journal of Aerosol Science, 33, 1009–1025, 2002. a, b
Yuan, T., Yu, H., Chin, M., Remer, L. A., McGee, D., and Evan, A.: Anthropogenic Decline of African Dust: Insights From the Holocene Records and Beyond, Geophysical Research Letters, 47, e2020GL089711, https://doi.org/10.1029/2020GL089711, 2020. a
Zuidema, P., Alvarez, C., Kramer, S. J., Custals, L., Izaguirre, M., Sealy, P., Prospero, J. M., and Blades, E.: Is Summer African Dust Arriving Earlier to Barbados? The Updated Long-Term In Situ Dust Mass Concentration Time Series from Ragged Point, Barbados, and Miami, Florida, Bulletin of the American Meteorological Society, 100, 1981–1986, https://doi.org/10.1175/BAMS-D-18-0083.1, 2019. a