the Creative Commons Attribution 4.0 License.
the Creative Commons Attribution 4.0 License.
 | 10 Nov 2025
Sensitivity of simulated ammonia fluxes in Rocky Mountain National Park to measurement time resolution and meteorological inputs
Lillian E. Naimie
Da Pan
Amy P. Sullivan
John T. Walker
Aleksandra Djurkovic
Bret A. Schichtel
Jeffrey L. Collett Jr.
Gaseous ammonia (NH3) is an important precursor for secondary aerosol formation and contributes to reactive nitrogen deposition. NH3 dry deposition is poorly quantified due to the complex bidirectional nature of NH3 atmosphere-surface exchange and lack of high time-resolution in situ NH3 concentration and meteorological measurements. To better quantify NH3 dry deposition, measurements of NH3 were made above a subalpine forest canopy in Rocky Mountain National Park (RMNP) and used with in situ micrometeorology to simulate bidirectional fluxes. NH3 dry deposition was largest during the summer, with 47 % of annual net NH3 dry deposition occurring in June, July, and August. Because in situ, high time-resolution concentration and meteorological data are often unavailable, the impacts on estimated deposition from utilizing more commonly available biweekly NH3 measurements and ERA5 meteorology were evaluated. Fluxes simulated with biweekly NH3 concentrations, commonly available from NH3 monitoring networks, underestimated NH3 dry deposition by 45 %. These fluxes were strongly correlated with 30 min fluxes integrated to a biweekly basis (R2 = 0.88), indicating that a correction factor could be applied to mitigate the observed bias. Application of an average NH3 diel concentration pattern to the biweekly NH3 concentration data removed the observed low bias. Annual NH3 dry deposition from fluxes simulated with reanalysis meteorological inputs exceeded simulations using in situ meteorology measurements by a factor of 2.
- Article
(4317 KB) - Full-text XML
-
Supplement
(1922 KB) - BibTeX
- EndNote


Gaseous ammonia (NH3) is an important atmospheric constituent, with effects on atmospheric chemistry and the nitrogen cycle. Atmospheric deposition of reactive nitrogen (Nr) is linked to nitrogen oxides (NOx) and NH3 emissions. Emissions of NOx and NH3 have many potential fates, including chemical transformation, dry deposition, particle formation, and wet deposition. Anthropogenic emissions of NOx and NH3 are produced predominantly by combustion and agriculture, respectively (Walker et al., 2019a), although there are also NH3 emissions from traffic, wastewater treatment, and wildfires (Walker et al., 2019b; Tomsche et al., 2023). Due to increased food demand and industrialization, anthropogenic Nr has been increasing annually (Galloway et al., 2008; Kanakidou et al., 2016). Excess reactive nitrogen deposition has well-documented adverse effects on ecosystem health, including eutrophication, soil acidification, decreased biodiversity, and increased N in freshwater bodies (Bobbink, 1991; Baron, 2006; Holtgrieve et al., 2011; Boot et al., 2016; Zhan et al., 2017; Pan et al., 2021).
As a result of effective NOx emission controls, the balance of Nr wet deposition across the US has shifted from oxidized N-dominated to reduced N-dominated, and dry deposition of NH3 at times dominates total Nr deposition (Li et al., 2016; Walker et al., 2019a; Driscoll et al., 2024). The National Emission Inventory (NEI) indicates that US NOx emissions were reduced by 46 % between 2013 and 2023, while NH3 emissions increased by 13 % (U.S. EPA, 2023).
Critical loads, deposition levels below which harmful effects are not expected to occur, have been estimated for many ecosystems (e.g., Bowman et al., 2012; Schwede and Lear, 2014). In Rocky Mountain National Park (RMNP), a critical load of 1.5 kg N ha−1 yr−1, based on wet deposition of NO and NH, has been established to avoid adverse effects on the ecosystem (Baron, 2006). The pre-industrial nitrogen load has been estimated at 0.2 kg N ha−1 yr−1, while the current wet deposition rate is as high as 3.65 kg N ha−1 yr−1, approximately 15× the natural background and significantly higher than the critical load (Burns, 2003; CDPHE, 2007; Benedict et al., 2013a). Although the RMNP Nr critical load only considers wet deposition of NO and NH, dry deposition can also contribute significantly to total Nr deposition. NH3 dry deposition in RMNP was estimated to be the third largest contributor to total Nr deposition, accounting for 18 % of Nr deposition from November 2008 to November 2009 (Benedict et al., 2013a).
NH3 dry deposition, however, remains a highly uncertain component of Nr deposition, and fluxes are rarely measured (Walker et al., 2019b). Previous studies in RMNP have estimated NH3 dry deposition using unidirectional inferential models, where the NH3 deposition velocity (Vd) was approximated as 70 % of the HNO3 deposition velocity (Beem et al., 2010; Benedict et al., 2013a, b) and NH3 emission from the surface was ignored. In reality, NH3 exchange between the atmosphere and surface is bidirectional, including deposition to and emission from the surface (Sutton et al., 1995). Several models have been developed to simulate the bidirectional exchange of NH3 with the surface (Massad et al., 2010; Zhang et al., 2010; Pleim et al., 2013). Key model inputs include micrometeorology, soil and vegetation parameters, and atmospheric concentrations. In practice, fluxes can change quickly and even reverse direction with changing environmental conditions. Gaseous NH3 is challenging and expensive to measure at high time resolution; lower-cost weekly or biweekly passive diffusion-based sampler measurements are more commonly utilized for long-term monitoring (Li et al., 2016; Schiferl et al., 2016; Butler et al., 2016; Hu et al., 2021). Previous efforts have used these low-cost measurements to quantify NH3 dry deposition (Walker et al., 2008; Shen et al., 2016; Tanner et al., 2022). Detailed, high time-resolution meteorological observations at the location of interest are also desired when estimating dry deposition. Due to the frequent unavailability of such data, reanalysis meteorological data is often used as a substitute (Wichink Kruit et al., 2012; Schrader et al., 2018).
Schrader et al. (2018) investigated the impact of low time-resolution NH3 concentrations on modeled fluxes. They found that using monthly NH3 concentrations underestimates total NH3 dry deposition. However, due to a linear relationship between simulations using monthly NH3 concentrations and those using hourly NH3 concentrations, they were able to generate a site-specific correction to compensate for the use of low time-resolution concentration data. Simulations were done using a simplified parameterization of the bidirectional exchange model described in Massad et al. (2010), and the NH3 concentrations were simulated using the LOTOS-EUROS model (Hendriks et al., 2016).
Understanding and managing these biases could unveil opportunities to estimate NH3 deposition when high time-resolution, in situ concentration, and meteorological observations are unavailable. Using high time-resolution NH3 concentration measurements, we provide the first estimate of NH3 annual dry deposition to an RMNP forest canopy using a bidirectional exchange model driven by high time-resolution NH3 concentration data and in situ micro-meteorological measurements. We use in situ data collected in RMNP to determine if site-specific correction factors suggested by Schrader et al. (2018) apply to real-world observations and whether correction factors can be employed to reduce biases associated with NH3 simulations using lower-cost, low time-resolution NH3 measurements such as those available from the U.S. Ammonia Monitoring network (AMoN) (Puchalski et al., 2011). We also tested if an average NH3 diel pattern could be applied to reduce these biases and, if so, the length of measurements necessary to adequately describe the diel pattern. Finally, we examine biases introduced by substituting reanalysis meteorological data for high time-resolution in situ measurements.
2.1 Site location
Study observations were collected in RMNP in northern Colorado. The park, established to preserve the natural landscape, including montane, subalpine, and alpine ecosystems, is predominantly above 3000 m, where ecosystems developed under nutrient-deprived conditions and are therefore sensitive to excess inputs of nitrogen. Nitrogen deposition has been a historical problem in RMNP, with diatom changes documented starting in the 1950s and more recent effects, including eutrophication and changes to plant species (Baron et al., 2000; Korb and Ranker, 2001; Baron, 2006).
The area east of RMNP (Fig. 1) includes a large urban corridor and extensive agricultural activity in the plains. The Front Range urban corridor, spanning from Denver to Fort Collins, is a major source of nitrogen oxide emissions (Benedict et al., 2013b). The northeast plains of Colorado are predominantly agricultural and include major sources of NH3 emissions from both animal feeding operations and crop production. The spatial pattern seen for feedlots is broadly consistent with the spatial distribution of other agricultural activities. Pan et al. (2021) found that 40 % of summertime dry deposition of NH3 in RMNP was associated with transport from agricultural regions to the east.
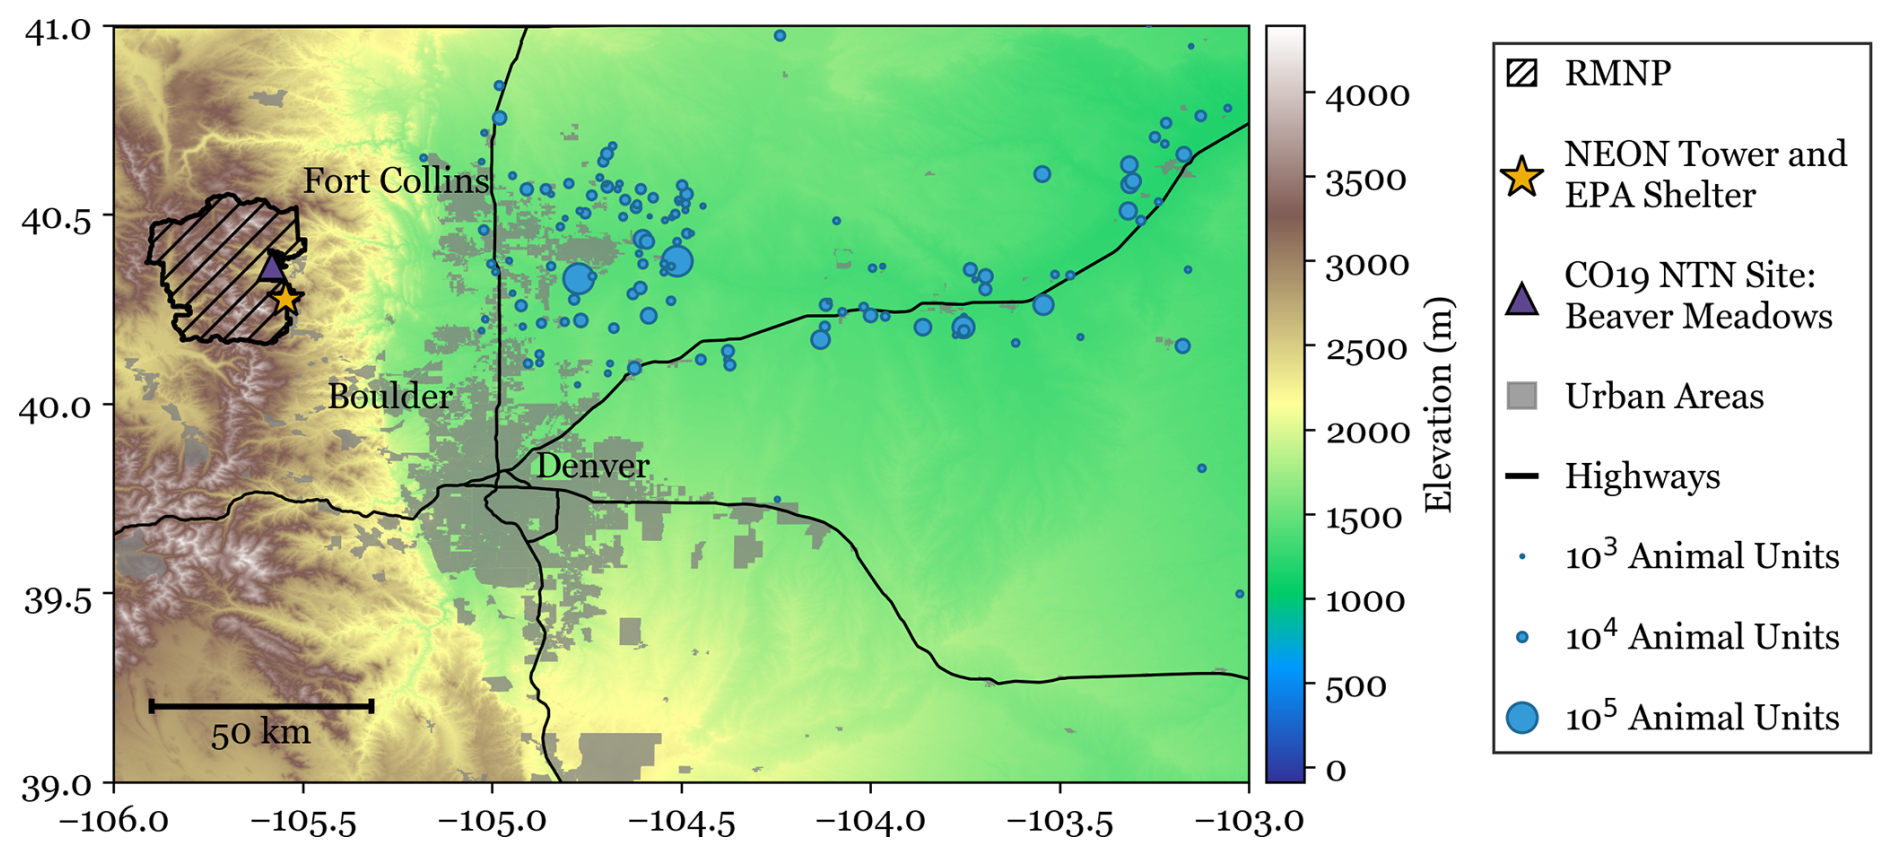
Figure 1A map of the study region. Animal units are shown as the number of permitted animals as of 2017, scaled by an animal unit factor relative to the species. Elevation data is from the US Geological Survey Global Multi-resolution Terrain Elevation Data 2010 (GMTED2010) at 7.5 arcsec spatial resolution, or 225 m (available at: https://earthexplorer.usgs.gov/, last access: 27 February 2024).
Data was collected at two adjacent locations for this study, both near the base of Longs Peak in Rocky Mountain National Park: a National Ecological Observatory Network (NEON) tower site (40.275903, −105.54596) and a nearby National Park Service shelter (∼ 500 m north of the NEON tower), from September 2021 through August 2022. The study location, denoted with a star in Fig. 1, is 2750 m above sea level. The tower is surrounded by lower montane forest, comprised of predominantly evergreen needleleaf species, including ponderosa pine, juniper, and Douglas fir. There are also groves of quaking aspen located in the region. Meteorological transport to the site is generally bimodal. Prevailing downslope transport from the northwest occurs generally overnight and during the cooler months, when ammonia concentrations are typically low. The mountain-plains circulation generates daytime upslope transport, bringing air masses from the plains east of the park up into RMNP. This pattern strengthens during warmer seasons. Periods of synoptically forced sustained upslope transport are also common, especially during spring and autumn (Gebhart et al., 2011). Downslope and upslope transport patterns are not due west and east at the study site because of channelling by local topography.
At RMNP, a diel pattern in ambient NH3 concentrations has commonly been observed in past measurements. This pattern is primarily driven by changes in transport patterns that carry NH3 emissions to the park (Benedict et al., 2013b; Juncosa Calahorrano et al., 2024) and, sometimes, modified by changes in the atmosphere-surface exchange of NH3, especially during NH3 uptake and emission from dew formation and evaporation (Wentworth et al., 2016).
2.2 Micrometeorological measurements
2.2.1 In situ micrometeorology
Meteorological and soil data were accessed from the RMNP NEON flux tower. The mean canopy height in the area surrounding the tower is 19 m. Temperature (mean = 6 °C), relative humidity (mean = 40 %), and annual days of precipitation are highly variable at the site due to its high elevation. Mean values were calculated from September 2021 to September 2022. Snowfall typically occurs between October and May. The seasonal mean temperatures (relative humidities) are as follows: winter (December, January, and February) mean is −3 °C (30 %), spring (March, April, and May) mean is 2 °C (44 %), the summer (June, July, and August) mean is 15 °C (49 %), and the fall (September, October, and November) mean is 8 °C (37 %). Precipitation is measured at 1 min resolution by a Belfort AEPG II 600M weighing gauge. Precipitation events were defined as periods of rainfall separated by at least one hour without precipitation. During our study period, there were 27 precipitation events in the winter, 62 in the spring, 63 in the summer, and 26 in the fall.
Meteorological data accessed from the NEON site includes wind vectors, friction velocity, Obukhov length, soil temperature, short wave radiation, relative humidity, air density, air pressure, and air temperature above the tree canopy. The meteorological observations used from the NEON tower are 30 min mean values. Direct measurements of wind vectors, air temperature, short wave radiation, relative humidity, air density, and air pressure were used from the tower-top measurements (25 m a.g.l., meter above ground level). 3D wind vectors were measured at 20 Hz using the CSAT-3 sonic anemometer (Campbell Scientific Inc., Logan, Utah, USA). Soil temperature was taken as the average across 5 collection sites within 200 m of the flux tower. Leaf area index (LAI) is estimated at the site using remotely sensed data. The square kilometer of leaf area index values surrounding the tower site is shown in Fig. S5 in the Supplement. A mean value of 0.8 was estimated using the landscape surrounding the site. The sensitivity of simulated NH3 fluxes to LAI can also be found in Sect. S5 of the Supplement. Additional information about each of the reported NEON datasets can be found in the Site Management and Event Reporting documentation (available at: https://doi.org/10.48443/9p2t-hj77, NEON, 2023).
NEON meteorological data contained gaps due to power outages and scheduled instrument maintenance. Across the year of data, the gaps comprised 5.8 % of the data (1021 data points). To quantify the annual deposition of NH3 in RMNP, these gaps were filled using the average diel pattern of fluxes during the current biweekly NH3 sampling period.
2.2.2 Reanalysis meteorology data
Detailed meteorological and soil data are not available at many locations where NH3 dry deposition is of interest. Reanalysis data, which combine short-range weather forecasts with assimilated observations, are a common source of meteorological data that can be used in the absence of local observations. To probe the impact of using reanalysis data in place of in situ observations, a set of bidirectional flux simulations was conducted using ERA5 hourly reanalysis data (Hersbach et al., 2020). ERA5 hourly reanalysis data has a spatial resolution of 0.25°, or approximately 31 km. The parameters used from the ERA5 data are as follows: air temperature, air pressure, dewpoint temperature, turbulent surface stress, moisture flux, sensible heat flux, friction velocity, standard deviation of filtered subgrid orography, solar radiation, and soil temperature. Obukhov length (L) is not given in the ERA5 dataset and was calculated using Eq. (1) following Stull (1988), shown below. Obukhov Length is the characteristic length scale of turbulence in the atmospheric boundary layer and is calculated from ERA5 data using instantaneous surface sensible heat and moisture fluxes based on the suggested calculation from the European Centre for Medium-Range Weather Forecasts (Guisti, 2024).
where k is the von Karman constant, g is gravitational acceleration, is the mean virtual temperature near the surface, is the surface flux of virtual potential temperature, and u∗ is the friction velocity.
2.3 NH3 data
2.3.1 Biweekly NH3 measurements
Biweekly NH3 ambient air concentration was measured using Radiello passive diffusion samplers purchased from Sigma Aldrich. The Radiello sampling system includes a diffusive body (part number: RAD1201) and an adsorbing cartridge (part number: RAD168) coated with phosphoric acid. NH3(g) diffuses across the exterior diffusive body and is collected on the adsorbing cartridge as ammonium (NH) over two weeks. Collected ammonia (as NH) is extracted from the cartridge into deionized water and analyzed on a cation IC using a 20 mM methanesulfonic acid eluent (0.5 mL min−1) on a Dionex CS12A ion exchange column with a CSRS ULTRA II suppressor and Dionex conductivity detector (Li et al., 2016). NH3 passive samples were collected in duplicate ( µg m−3) on top of the NEON tower (25.35 m a.g.l.). Across the study period, there were 27 sampling periods. Due to site access issues, some samples had durations longer than 2 weeks. To create a consistent dataset, all data were aggregated to a 2-week average. In the case where two samples overlapped during a 2-week period, they were combined using a weighted average. One sample was below the detection limit and was removed from this analysis. Passive NH3 sampling methods have been shown to have a low bias when compared with other sampling methods, including annular denuders and Picarro Cavity Ringdown spectroscopy methods (Puchalski et al., 2011; Pan et al., 2020).
2.3.2 High temporal resolution NH3 measurements
NH3(g) air concentration was also measured using an ion mobility spectrometer (IMS). Ion mobility spectroscopy separates ionized molecules based on their mobility through a carrier gas, under the influence of an electric field. The instrument used was the AirSentry II Point-of-Use IMS (Particle Measuring Systems, Niwot, CO). The instrument was in the National Park Service (NPS) shelter (located at 40.278129, −105.545635), 500 m north of the NEON site, with an inlet located approximately 2 m above natural grassland. The sampling inlet was 0.635 cm Teflon tubing, heated to 40 °C to reduce NH3 loss to the sampling tube. Inlet length was kept as short as possible to further prevent NH3 loss. Particles were removed by a fiber filter at the tip of the inlet. Due to the high altitude of the site location, the instrument was zeroed to account for pressure differences upon installation. Multi-point calibrations were conducted at the beginning and end of sampling. Calibration was confirmed using a known concentration ammonia gas sample split between the instrument and a phosphoric acid-coated annular denuder, where the NH3 collected by the denuder is extracted into deionized water and analyzed using ion chromatography. Zero measurements were made periodically by overflowing the inlet with ultra-high purity clean air. The AirSentry samples at a 30 s frequency. During the study, the AirSentry collected 919 000 data points. The limit of detection for 30 s measurements 70 pptv. For this data analysis, NH3 concentration data was averaged to 30 min mean values. Averaging data points increases the signal-to-noise ratio. We approximate that the signal-to-noise ratio increases proportionally to the square root of the number of samples (n=60) (Dempster, 2001). In this case, the signal-to-noise ratio increases by a factor of 7.7, reducing the limit of detection to 9 pptv for 30 min mean NH3 concentrations. Across the year of data collection, 101 points fell below the detection limit.
2.3.3 NH3 data preparation
To investigate the effect of NH3(g) sampling time-resolution on simulated fluxes, bidirectional fluxes were simulated with concentration data at: (i) 30 min resolution (30 min NH3), (ii) with the 2-week integrated passive NH3 (Biweekly Passive NH3), and (iii) lastly with an average diel profile applied to each day within the 2-week passive period (Average Diel Pattern NH3). The three NH3 data products are shown in Fig. 2.
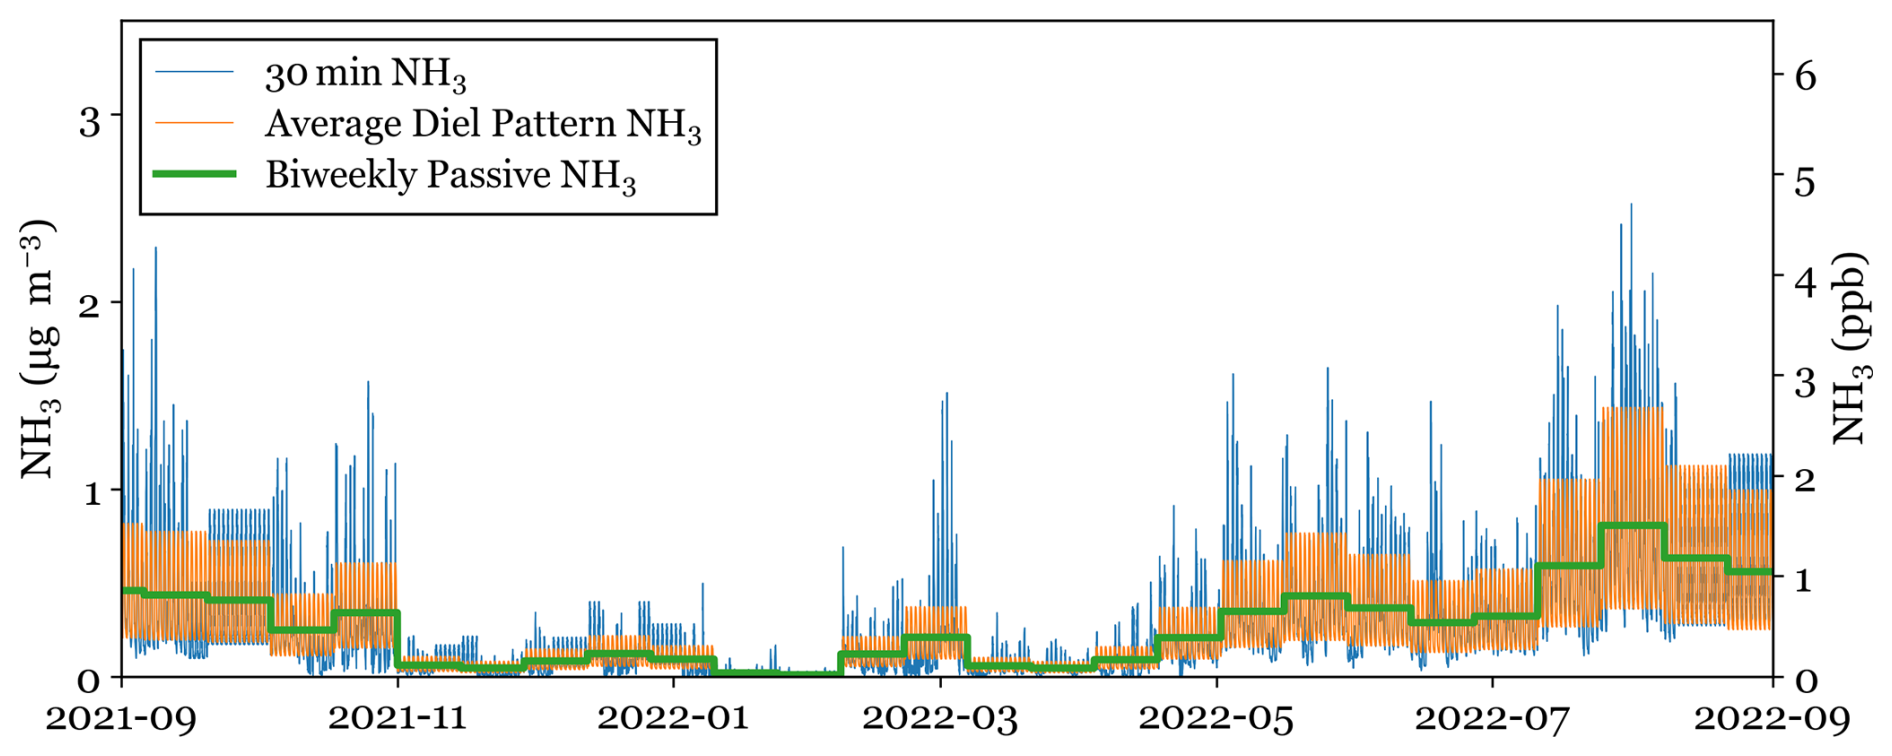
Figure 2Three NH3 concentration data sets are shown for the entire study period. The two-week average across each concentration data product is the same.
The 30 min NH3 concentration data is generated using a combination of data from the AirSentry NH3 located at the NPS shelter and passive NH3 samples collected on the NEON tower. Data gaps, due to power outages and regular maintenance, were filled using the average diel pattern across the year of data collection. Data gaps accounted for about 3000 out of more than 900 000 points across the study period. To generate a 30 min NH3 data set above the tree canopy, the data was divided into biweekly periods that match the passive NH3 collection periods. The average concentration from the AirSentry across each period was then scaled to match the biweekly passive NH3 concentration. The 101 30 min average NH3 concentration values below the AirSentry detection limit, representing 0.5 % of the total measurement period, were assumed to represent a random distribution below the detection limit and retained for post-process scaling from the passive observations. This preserves the temporal variability of NH3 concentrations while ensuring that the average air concentration across the sampling period is consistent with the passive NH3 measurements atop the NEON tower, which can differ from those above the adjacent grassland where the Air Sentry measurements are made.
The biweekly passive NH3 with diel profile applied is generated using the annual average diel pattern of NH3 from the AirSentry data. To determine if there are systematic differences between the NH3 diel pattern at the two sites, raw and scaled AirSentry concentrations were compared to 4 and 6 h University Research Glassware denuder measurements taken on the NEON tower. The NH3 concentrations were well correlated between sites. This comparison is shown in Fig. S1. Each day of the biweekly passive period is assigned the average diel pattern, then the biweekly mean is scaled to match the biweekly passive concentration. This dataset was generated to investigate if the inclusion of a simple diel profile was sufficient to correct for the bias in bidirectional fluxes created by using low time-resolution NH3 concentrations, as shown by Schrader et al. (2018).
These three concentration data sets will be used for bidirectional flux simulations of NH3. For the rest of this work, the three NH3 data sets will be referred to using the following nomenclature.
-
30 min NH3: NH3 concentration data at 30 min resolution
-
Biweekly NH3: Biweekly Passive NH3 concentration data
-
Average Diel Pattern NH3: Passive NH3 concentration scaled using an average diel profile from the 30 min NH3 dataset
2.4 Additional measurements
2.4.1 Wet deposition data
Weekly precipitation wet deposition data was obtained from the National Trends Network (NTN) (National Atmospheric Deposition Program, 2022) site at Beaver Meadows in RMNP (“CO19”: located at 40.3639, −105.5810). The Beaver Meadows site location, at 2477 m elevation and located approximately 10 km north of the CASTNET site, is shown in Fig. 1.
2.4.2 Additional gas and particle measurements
Additional air concentration data was obtained from the U.S. EPA Clean Air Status and Trends Network (CASTNET) site at the NPS shelter (“ROM206”: located at 40.278129, −105.545635). Weekly filter pack concentrations of nitric acid (HNO3) and sulfur dioxide (SO2) were used to calculate the acid ratio (Eq. 10) in the bidirectional exchange simulations of NH3 (U.S. EPA, 2024a).
Weekly dry deposition of HNO3, NO, and NH was estimated by CASTNET (U.S. EPA, 2024b) using the weekly filter pack concentrations and historical values of deposition velocity (Vd) from the U.S. EPA Multi-Layer Model (MLM) (Meyers et al., 1998). The generation of deposition velocities was discontinued in 2019. Bowker et al. (2011) found that using historical values of Vd from the U.S. EPA Multi-Layer Model did not significantly bias the annual mean of deposition.
One approach to estimating NH3 deposition is to estimate the Vd as a fixed fraction (70 %) of the Vd of HNO3. This approach has been historically used to estimate the Vd of NH3 in RMNP (Beem et al., 2010; Benedict et al., 2013a, b).
2.5 Bidirectional flux modelling of NH3
Bidirectional NH3 fluxes are simulated across the study period using the dry deposition inferential model described in Massad et al. (2010). This model was selected because it estimates both emissions and deposition of NH3, uses a compensation point framework to capture these complex dynamics, and takes into account rapidly changing micrometeorology. The simulation framework (Fig. 3) accounts for the bidirectional nature of NH3 fluxes and allows for deposition and emission. The model determines if the flux will be negative (deposition) or positive (emission) based on the relationship between the atmospheric concentration (χa) at a given reference height (z) and the compensation point () at a defined distance (d) above the roughness length (z0).
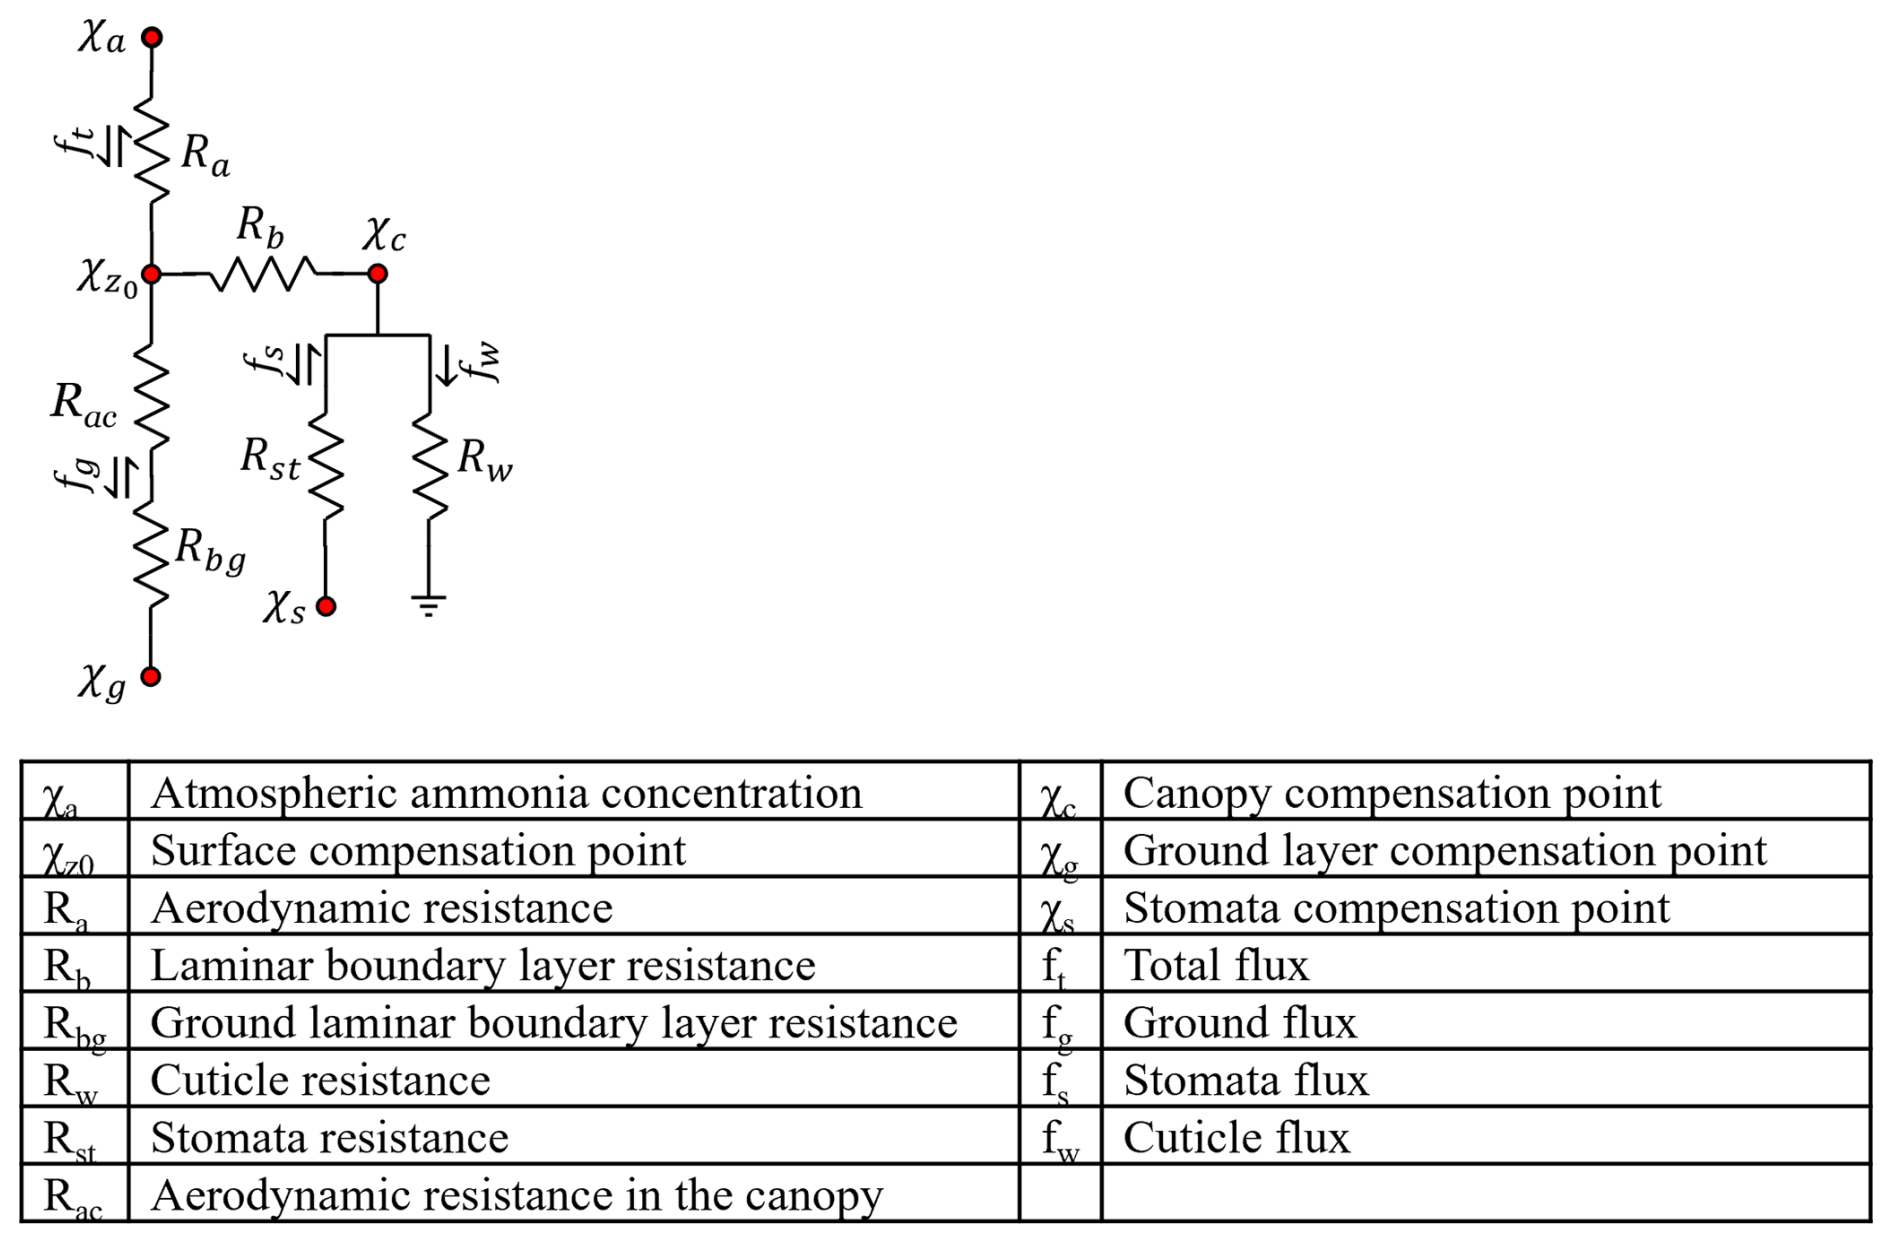
Figure 3Dry deposition inferential model proposed in Massad et al. (2010). The table describes each model element. Arrows next to each flux show the allowed flux directions of the given pathway.
A conceptual diagram of resistances and compensation points is shown in Fig. 3. Aerodynamic (Ra) and laminar boundary layer resistance (Rb) capture the effects of turbulent and diffusive transfer from the atmosphere to the surface, respectively. Ra was calculated according to Thom (1975), where z is 25.35 m, d is 7.15 m, and the roughness length is 1.65 m. The stability functions ΨH and ΨM for scalars and momentum, respectively, are empirical relationships dependent on L (Thom 1975). Displacement and roughness length were provided from the RMNP NEON Tower (NEON, 2023).
Rb is modeled as described in Xiu and Pleim (2001), where γair is the kinematic diffusivity of air, and is the diffusivity of NH3.
In-canopy resistance (Rg) is the sum of aerodynamic resistance within the canopy (Rac) and ground boundary layer resistance (Rbg). Rac was calculated based on Nemitz et al. (2001) using Eq. (5), where α is a height dependent constant calculated using Eqs. (16) and (17) from Massad et al. (2010).
Ground boundary layer resistance (Rbg) is based on Nemitz et al. (2001), where ug is the wind speed at the ground, which we approximate as 5 % of the wind speed at tower top (25 m), and zl is the upper bound height of the logarithmic wind profile above the ground, which we approximate as 10 % of the canopy height (Nemitz et al., 2001).
Stomata resistance (Rst) captures the diffusion of NH3 through plant stomata and is calculated as a minimum value related to the plant type proposed by Hicks et al. (1987). Further parameterization proposed by Nemitz et al. (2001) was used here to calculate Rst, where SR (W m−2) is the solar radiation. The minimum value for Rst (225 s m−1) was determined using Table 1 of Zhang et al. (2003), assuming 75 % of the land surface was evergreen needleaf trees and 25 % was deciduous broadleaf trees and shrubs.
Cuticular resistance (Rw) was calculated according to the proposed corrected parameterization as described in Massad et al. (2010), for a forest ecosystem. When relative humidity (RH) is below 100 %, Eq. (8) is used, and when RH exceeds or is equal to 100 %, Eq. (9) is used.
In both equations, AR is the acid ratio, which is calculated using the molar ratio of acids and bases in the atmosphere. The calculated acid ratio had a mean value of 1.3, a minimum of 0.22, and a maximum of 11.6. Acid ratios were the largest in the winter months.
For this study period, the acid ratio was calculated using weekly CASTNET measurements of SO2 and HNO3 paired with our measurements of NH3.
χst was calculated according to Massad et al. (2010). In the stomata compensation point (Eq. 11), Γst is the emission potential of the stomata and is approximated as 29 based on vegetation samples from the area surrounding the NEON Tower. The sampling methods and determination of this value can be found in the Supplement. Emission potentials describe the potential for surface emission.
χg was calculated according to Eq. (3) through Eq. (5) of Stratton et al. (2018). In Eq. (12), TAN is the concentration of total ammoniacal N (the sum of NH3 and NH) in the soil aqueous phase (mg kg−1), KH is the Henry constant, and Ka is the equilibrium constant. TAN was estimated at 10.6 mg kg−1 based on soil measurements in RMNP from Stratton et al. (2018). NH3 flux simulations are very sensitive to the TAN value. The Supplement includes a test of the sensitivity of the flux results to TAN values within one standard deviation for the measurements taken by Stratton et al. (2018).
KH and Ka were predicted using Eqs. (13) and (14) based on the models of Montes et al. (2009), where T is temperature.
χc, Eq. (15) below, was calculated using Eq. (12) from Massad et al. (2010).
Compensation point at the displacement height (d) above the roughness length (z0) is calculated using Eq. (17) below as proposed in Massad et al. (2010). takes all other compensation points and resistances into account.
Finally, the total flux was calculated following Eq. (17) (Massad et al., 2010). NH3 flux is calculated in this framework as a difference between the and χa, scaled by Ra.
Total exchange flux () from the dry deposition inferential model gives the direction and magnitude of NH3 fluxes.
3.1 Simulated bidirectional exchange fluxes of NH3
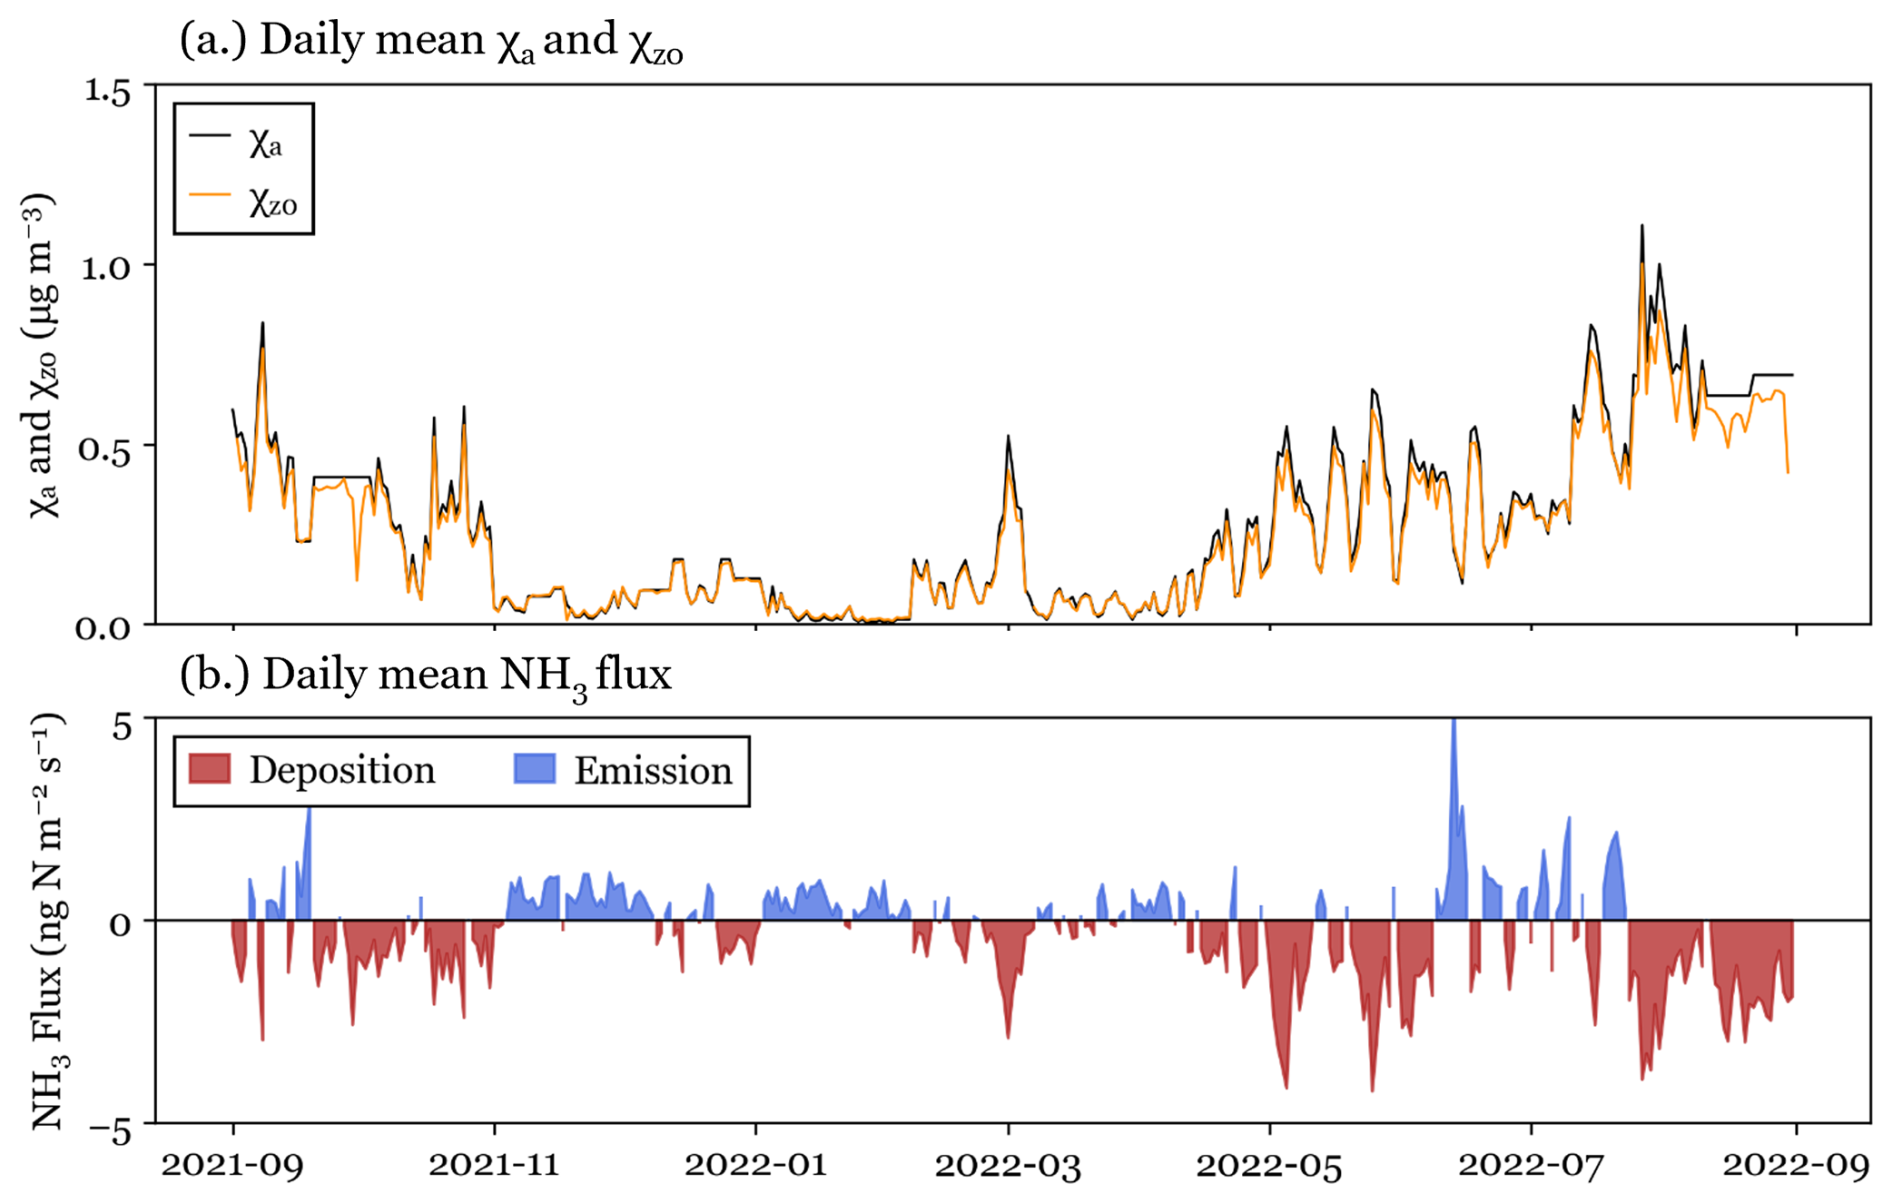
Bidirectional fluxes were simulated using the 30 min NH3 concentration data set and in situ meteorological data as inputs to the Massad et al. (2010) model, described above. NH3 concentration, , and fluxes have a strong seasonal cycle in RMNP (see Fig. 4). NH3 flux direction is determined by the difference between and χa (Fig. 4a). When NH3 concentration exceeds the compensation point, NH3 is deposited to the surface (a negative flux value). Both NH3 concentrations and deposition fluxes tend to be greatest during the summer (June, July, and August), with 47 % of NH3 modeled annual dry deposition occurring during June, July, and August. NH3 fluxes also had the largest variability in the summer. Deposition in the spring (March, April, and May) closely follows, with 43 % of NH3 modeled annual dry deposition occurring during March, April, and May. During all seasons, there are periods of net emission from the surface (Fig. 4b). The largest periods of net emission occur in the summer. Daily NH3 emission fluxes are most common in the winter (December, January, and February), although they are typically smaller than deposition fluxes in the spring and summer.
Total modeled NH3 flux can be broken down into stomatal, ground, and cuticular fluxes. Figure 5 shows the distribution of simulated NH3 fluxes for each of these components.
Deposition is driven primarily by stomatal and cuticular fluxes, while ground emission fluxes are sometimes observed. Winter periods of net emission (see Fig. 4b) are driven by the ground flux. One potential limitation of the model used for simulations is that it does not consider snow cover on the ground, which could alter winter fluxes in RMNP.
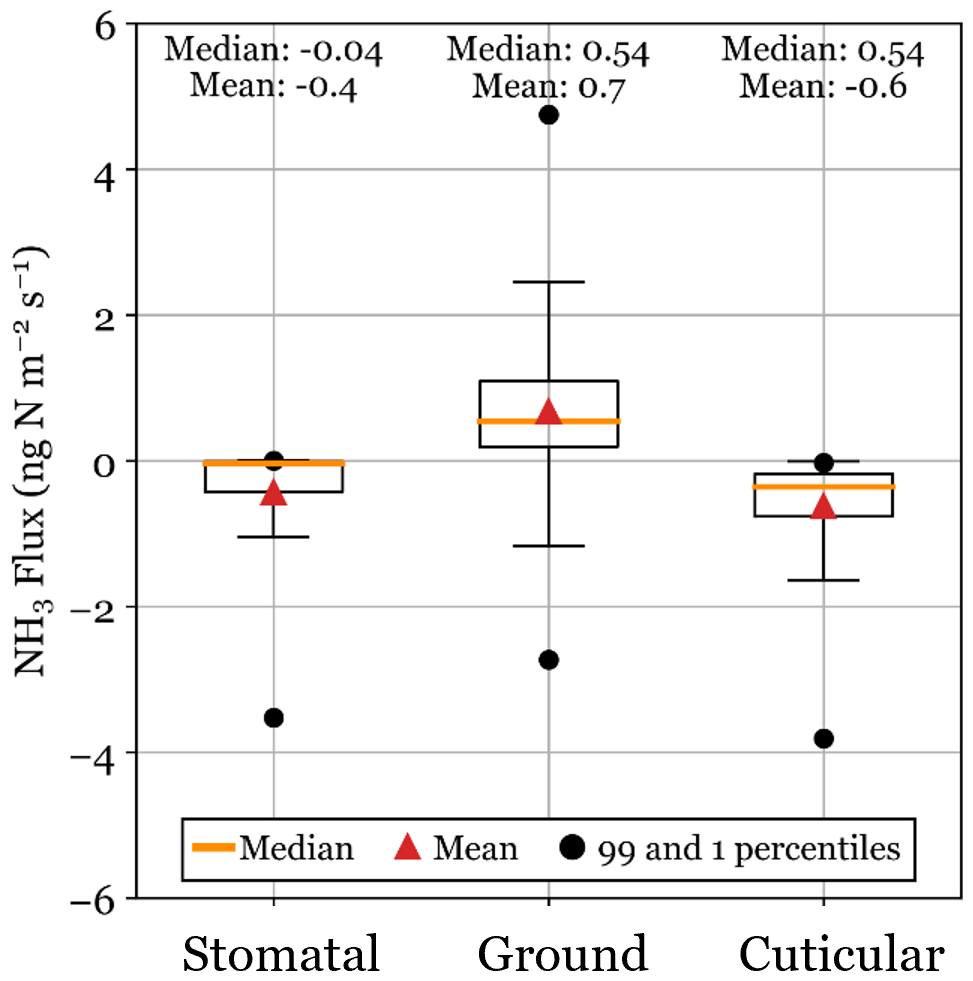
Figure 5Total NH3 simulated fluxes are separated into their component fluxes (stomatal, ground, and cuticular). Simulated fluxes are shown for the entire study period. Boxes show the 25th and 75th percentiles, and whiskers are determined at 1.5 times the interquartile range.
NH3 concentrations at RMNP are impacted by emission and transport patterns, which can both increase daytime NH3 concentrations. NH3 emissions from agricultural sources have a strong diel pattern driven by volatilization during warmer daytime temperatures. At RMNP, transport from these regions is driven on many days by the mountain-plains circulation, which begins in the late morning and transports polluted air masses westward and upslope to the park (Gebhart et al., 2011). Previous studies have demonstrated that the upslope transport from sources in the Front Range has impacts on deposition and air concentrations in RMNP (Benedict et al., 2018; Pan et al., 2021). During this study, the largest χa values are also observed during upslope transport from source regions in the CO Front Range. These source regions likely disproportionately contribute to NH3 dry deposition because the difference between χa and drives the sign and magnitude of the NH3 flux. On mornings following overnight dew formation, local volatilization from evaporating dew has also been shown to increase morning NH3 concentrations (Wentworth et al., 2016). This phenomenon was observed in RMNP and corresponds to the increase in the NH3 diel pattern around 10:00 MT observed in Fig. 6a. One limitation of the bidirectional flux model used is that NH3 uptake and emission from dew are not simulated. NH3 concentration, compensation point, and simulated fluxes each have a strong diel pattern, which peaks during the middle of the day (see Fig. 6). The peak value typically occurs close to 13:00. The soil temperature diel pattern contributes to a higher during the middle of the day. The annual cycle of soil temperature also contributes to the higher observed in summer. Although both NH3 concentration and compensation point peak during mid-day, we also observe peak deposition fluxes during the middle of the day, indicating that the influence of the diel pattern of NH3 concentration is stronger than that of the compensation point diel pattern.
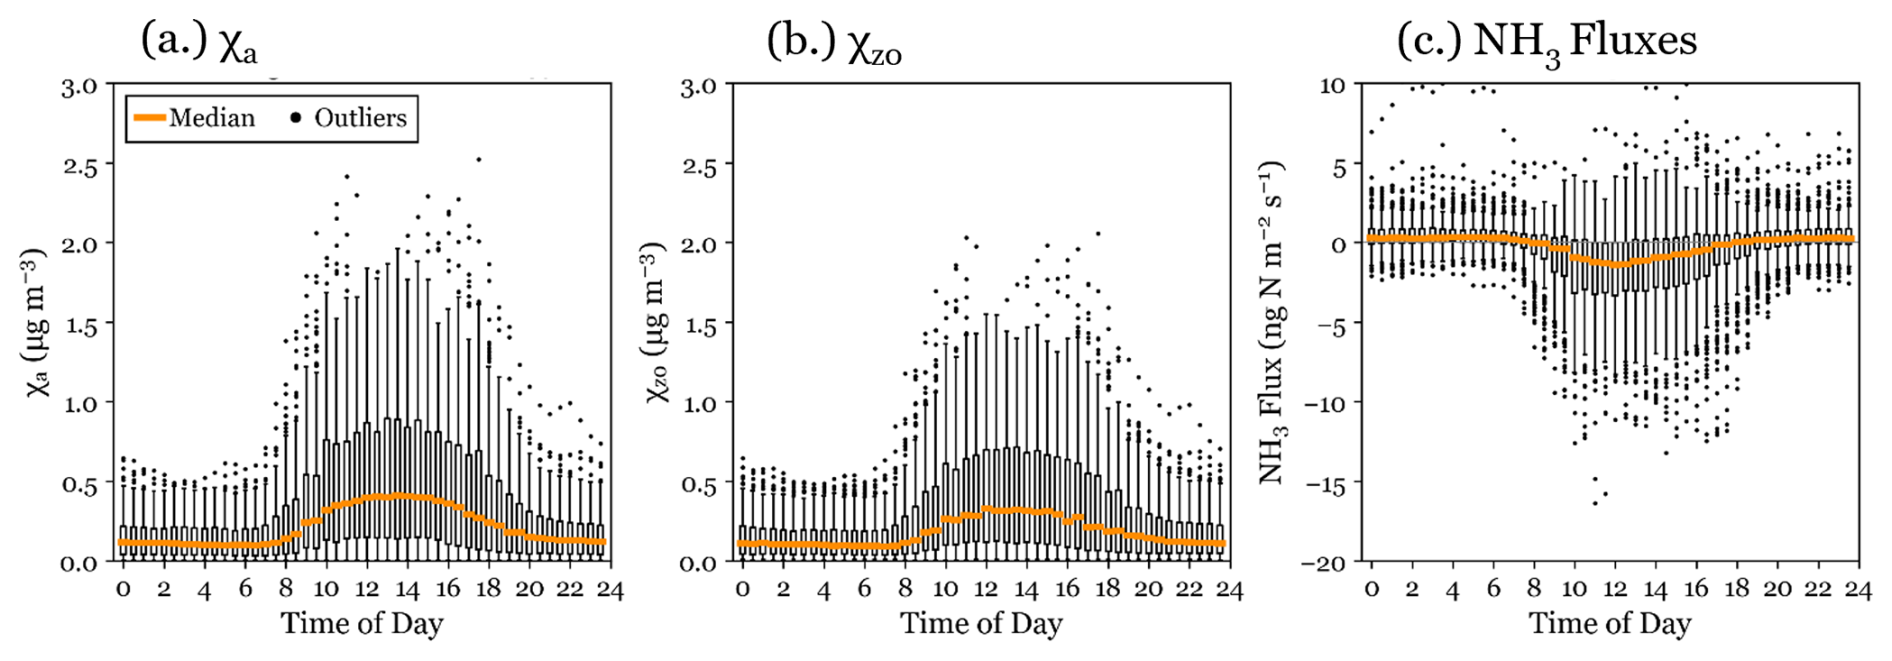
Figure 6Diel pattern of: (a) NH3 concentration, (b) simulated , and (c) NH3 fluxes are shown for the full study period in RMNP. Boxes show the 25th and 75th percentiles, and whiskers are determined at 1.5 times the interquartile range.
To understand the relative importance of NH3 deposition in RMNP, NH3 flux simulation results are combined with NADP/NTN wet deposition fluxes and dry deposition fluxes for particulate ammonium (NH) and nitrate (NO) and gaseous HNO3 derived from CASTNET concentration observations and MLM deposition velocities, to construct an updated seasonal and annual budget of inorganic N deposition at RMNP. This Nr deposition budget for all measured inorganic species is shown in Fig. 7a. Due to the lack of current measurements, wet and dry deposition of organic nitrogen are not included. Benedict et al. (2013b) reported annual organic nitrogen wet deposition of 0.6 kg N ha−1 yr−1 during their 2008–2009 study. NH3 dry deposition is the net surface flux from the simulations using 30 min NH3 concentration. The inorganic annual Nr deposition budget totals 3.4 kg N ha−1 yr−1, with the largest contributions coming from NH wet deposition (1.34 kg N ha−1 yr−1), NH3 net dry deposition (0.12 kg N ha−1 yr−1), NO wet deposition (0.71 kg N ha−1 yr−1), and HNO3 dry deposition (0.33 kg N ha−1 yr−1). Overall, reduced Nr deposition comprises 59 % of the total inorganic N deposition to RMNP. NH3 dry deposition comprises 4 % of total inorganic Nr deposition. Simulated NH3 dry deposition (0.11 kg N ha−1 yr−1) is smaller than the value estimated by Benedict et al. (2013b) during their 2008–2009 study (0.66 kg N ha−1 yr−1). The previous value estimated NH3 dry deposition velocity by scaling the HNO3 dry deposition velocity by 0.7, instead of simulating the bidirectional exchange of NH3.
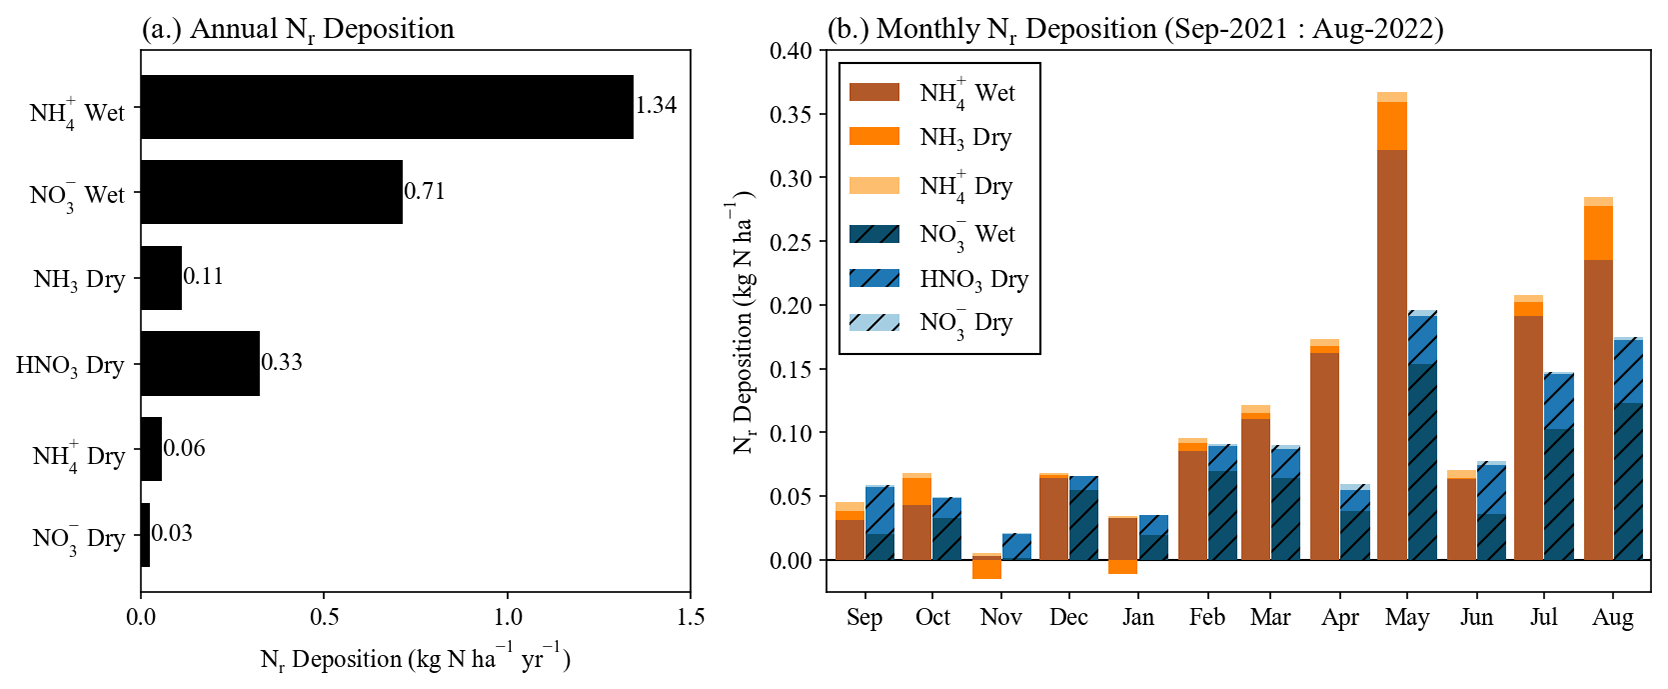
Figure 7Reactive nitrogen deposition is shown for all species with measured concentrations or deposition for the full year of study. Wet deposition data are from the NADP NTN site at Beaver Meadows. NH3 dry deposition is modeled using the bidirectional framework from Massad et al. (2010) and 30 min NH3 concentration data. Dry deposition of HNO3(g), NH(p), and NO(p) are calculated from the nearby CASTNET site concentration data and deposition velocities from the U.S. EPA MLM. Panel (a) has the annual deposition of all measured species. Panel (b) has deposition of all measured Nr species grouped by month. Only one period of wet deposition was collected by the NADP NTN site during November 2021.
Speciated monthly dry deposition is plotted in Fig. 7b to probe the seasonality of Nr deposition in RMNP. Net dry deposition of NH3 was largest during May and August. Total inorganic Nr deposition peaked during May, due to increased wet deposition. Reduced Nr deposition exceeded oxidized Nr deposition in October, December, February, March, April, May, July, and August. Excluding November, where only one period of wet deposition was recorded by the NADP NTN site, reduced Nr deposition had a fractional contribution ranging from 43 % to 74 %. In November and January, net NH3 emission was estimated from the surface.
3.2 Impacts of biweekly NH3 concentration data on simulated fluxes
The use of low time-resolution NH3 concentrations for flux simulations can produce a low bias compared with fluxes simulated using higher time-resolution NH3 concentrations. Simulated NH3 fluxes have a strong diel pattern when simulated at 30 min resolution (see Fig. 6c), due to changes in NH3 concentration and meteorology. These complex dynamics are averaged out when an average NH3 concentration is used, which leads to an underestimation in deposition. Here, we demonstrate that a site-specific correction can be generated to account for the bias introduced by lower time-resolution NH3 concentration data. Our methods differ from Schrader et al. (2018) in 3 major ways: (i) in situ data is used for both the higher frequency, 30 min NH3 concentration, and meteorology, (ii) biweekly passive NH3 data is used instead of monthly NH3 data, and (iii) Massad et al. (2010) is used as described instead of using a simplified parameterization. The results of the 30 min NH3 and Biweekly NH3 bidirectional NH3 flux simulations are compared to generate a site-specific factor to correct for any low bias in the lower time-resolution flux calculations. Simulated fluxes at biweekly time-resolution (Fig. 8) using the two NH3 concentration data sets are well correlated (R2=0.88), and the NH3 flux simulation using biweekly integrated NH3 data can be corrected to match the control flux simulation using a linear fit (slope = 1.03, y-intercept = −1.689). As noted above, RMNP has few two-week periods of net NH3 emission, and the efficacy of this method should be confirmed at a location with more extensive periods of net NH3 emission. In particular, NH3 fluxes above managed agricultural land could differ significantly from the pattern observed in RMNP. This study also focused on fluxes above a forest canopy, and results could differ for grassland ecosystems, which also occur in RMNP. To determine the efficacy in other locations, future investigations should select several sites with different land surface types and NH3 concentrations to make biweekly and high time-resolution measurements for a year.
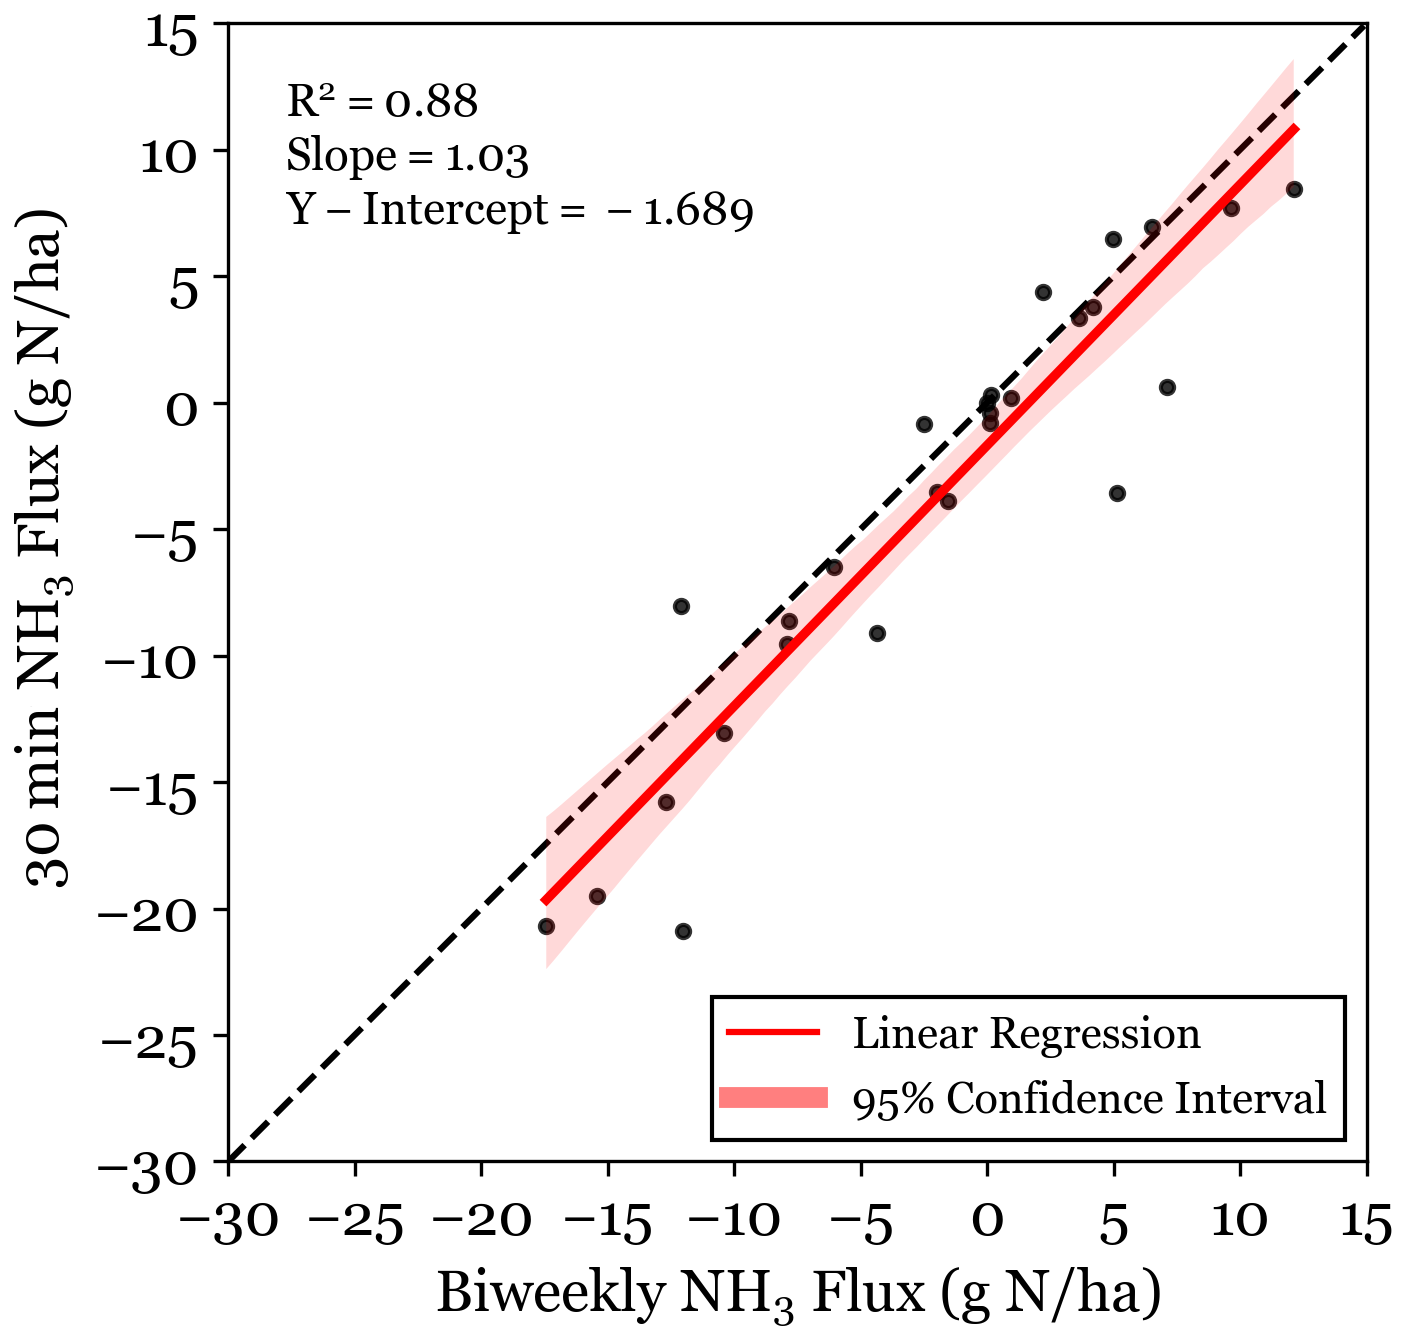
Figure 8Bidirectional NH3 flux simulated at 30 min resolution is plotted for 30 min NH3 concentration data and biweekly integrated NH3 concentration data. Fluxes are given as net flux over a two-week period. The least squares linear regression is plotted for the data.
Considering the net flux of NH3 across the full study period, using the best available time-resolution of 30 min, we find a total annual net NH3 dry deposition flux of 0.11 kg N ha−1 yr−1 (Fig. 9). The estimated NH3 dry deposition drops by 45 % to 0.06 kg N ha−1 yr−1 using biweekly vs. 30 min NH3 concentration measurements. The annual NH3 dry deposition flux increases to 0.78 kg N ha−1 yr−1 when simulating fluxes in a deposition-only unidirectional framework where the NH3 deposition velocity is scaled as 0.7 times the nitric acid deposition velocity (estimated by the US EPA MLM), an approach previously used for RMNP N deposition budgets (Beem et al., 2010; Benedict et al., 2013a, b).
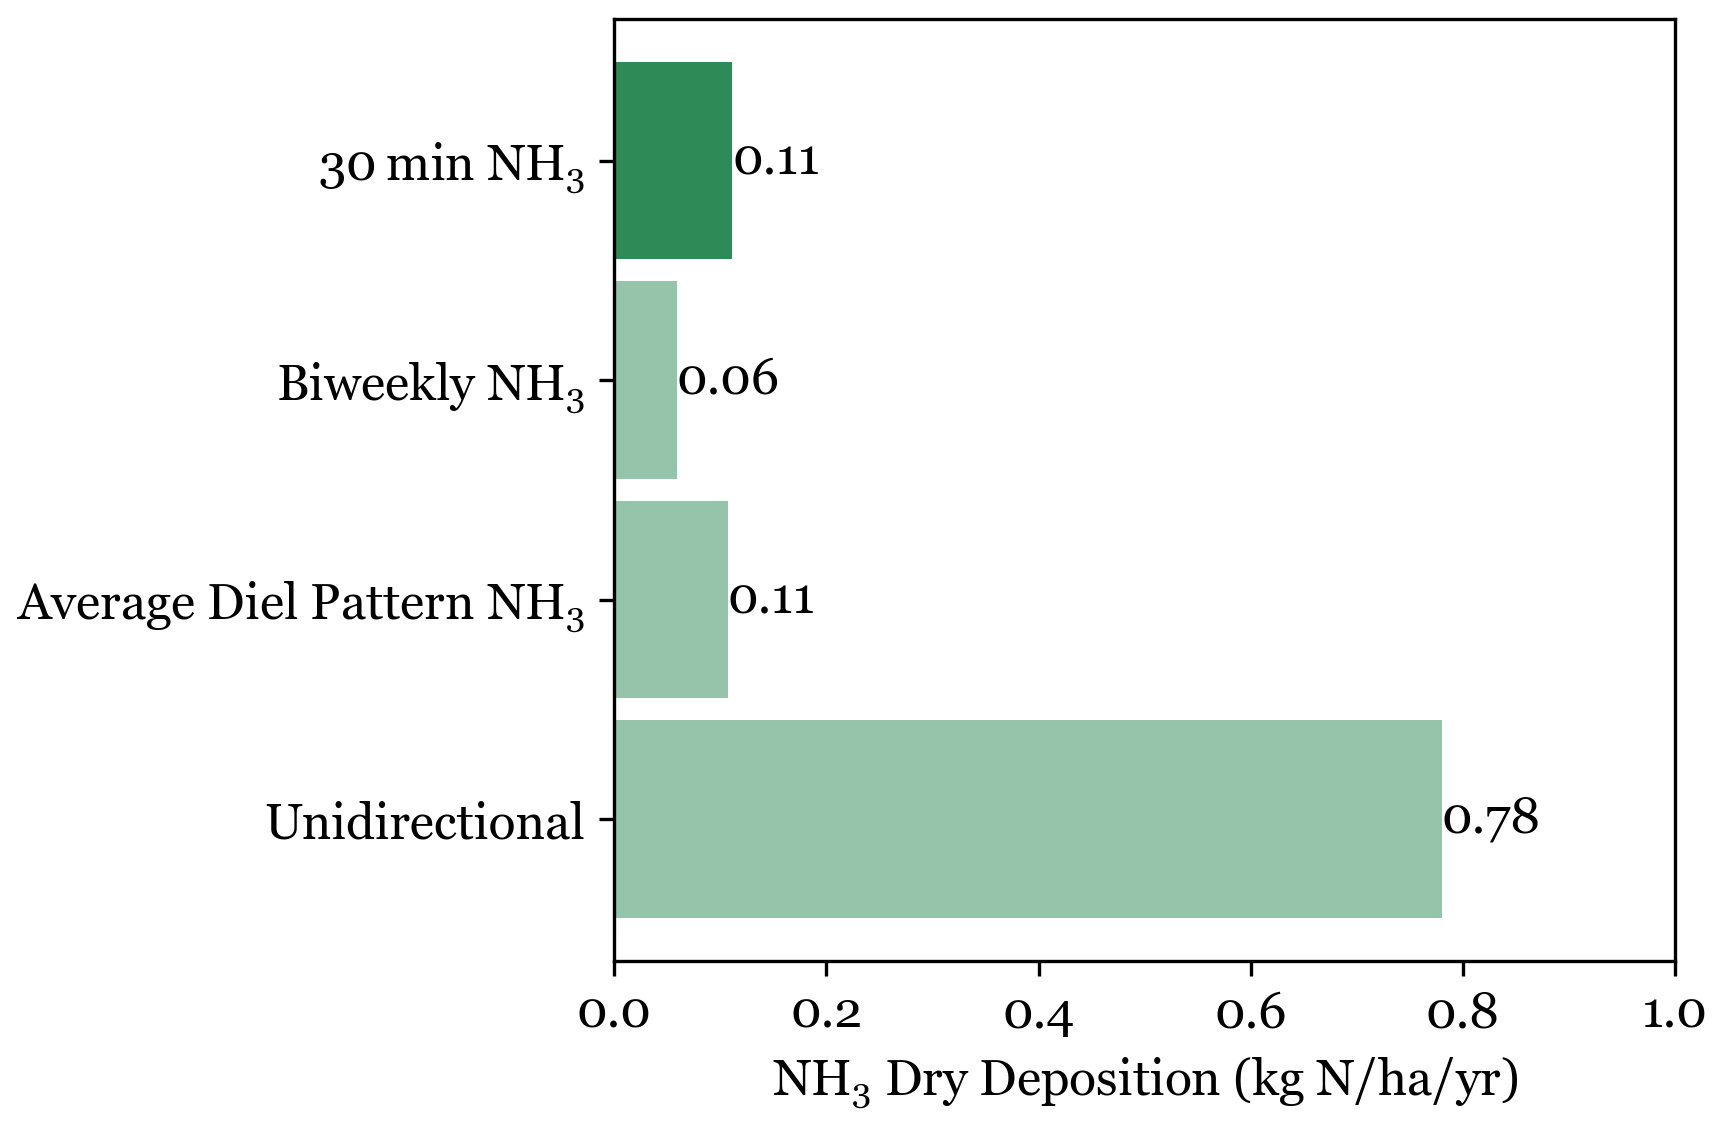
Figure 9Annual NH3 dry deposition at the NEON Flux Tower in RMNP is shown for three bidirectional simulations using three sets of NH3 concentration data (30 min NH3, Biweekly NH3, and Average Diel Pattern NH3) and one unidirectional simulation. Each simulation was run at 30 min time steps with meteorological parameters from the NEON Flux Tower. The unidirectional NH3 flux is calculated using biweekly NH3 concentrations. NH3 deposition velocities are calculated as 0.7 times the HNO3 deposition velocity from the U.S. EPA MLM.
Bidirectional flux simulations using biweekly NH3 data with an average diel pattern of NH3 yield the same annual NH3 dry deposition flux as the simulations run using 30 min NH3 concentration. This indicates that capturing daily variability in NH3 concentration profiles is not critical to accurately simulating the annual NH3 flux. Application of an annual averaged diel pattern misses the highest NH3 concentrations (Fig. 10); however, across a full year of data, the diel pattern effectively captures the net surface flux. Despite the scatter in Fig. 10a, fluxes simulated with an average diel pattern NH3 data set are well correlated with simulations using 30 min NH3 concentrations (R2=0.59) and have a fit close to unity. The daily mean fluxes (Fig. 10b and c) of each simulation have similar seasonal patterns, with periods of net emission and deposition aligned between simulations.
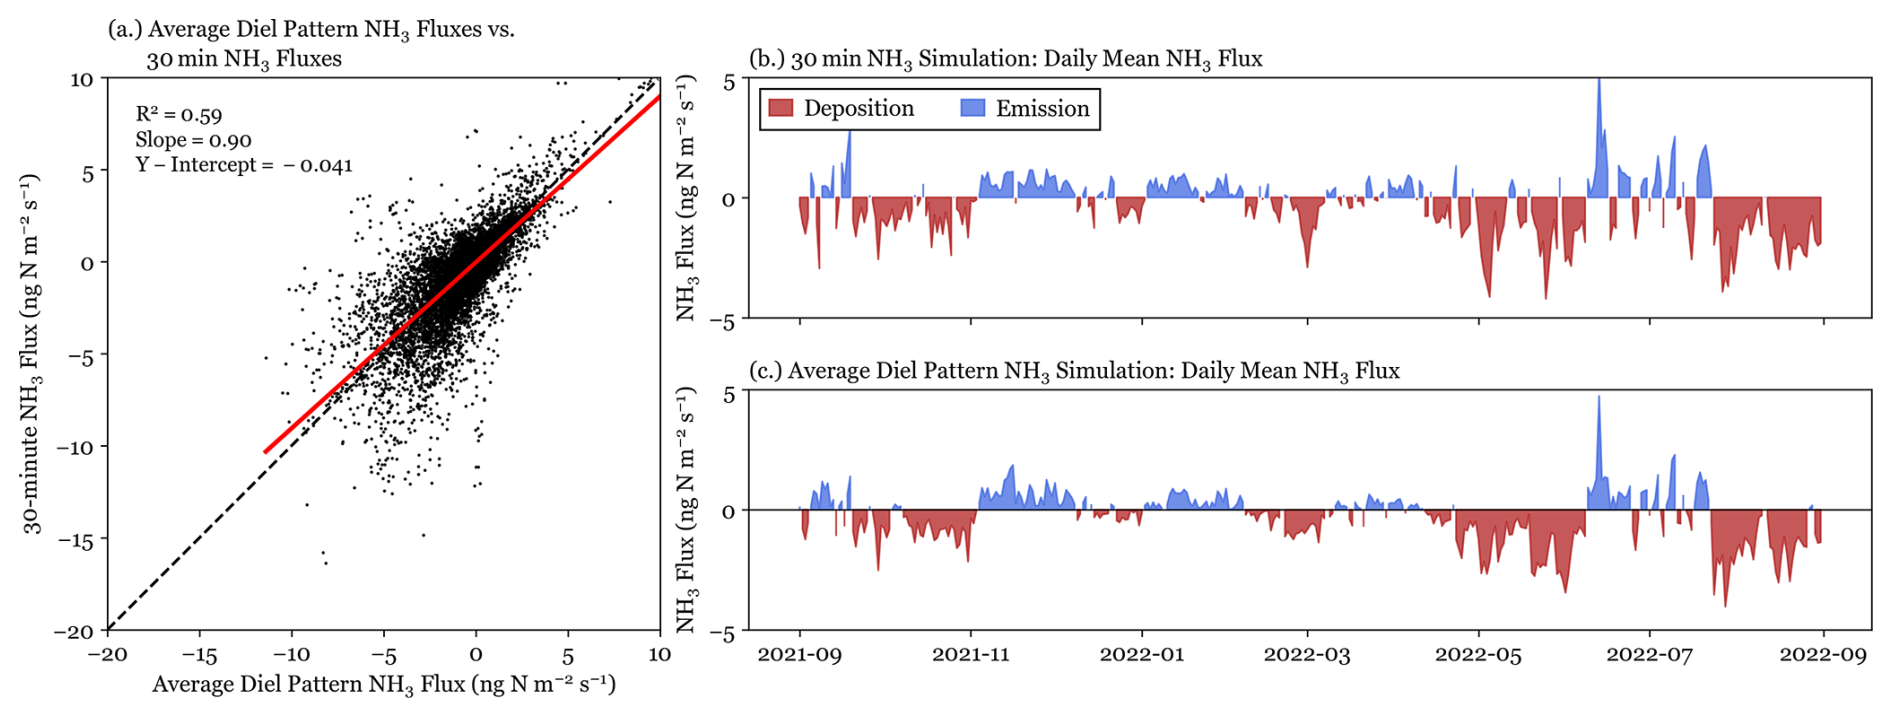
Figure 10NH3 fluxes simulated with 30 min NH3 concentrations and annual average diel pattern NH3 concentrations are shown for the full year of data. Panel (a) directly compares 30 min simulated fluxes for each data set. Panels (b) and (c) show the daily mean fluxes for simulations with 30 min NH3 concentration and average diel pattern NH3 concentration, respectively.
At RMNP, there is a large daily variability in concentration due especially to changes in upslope transport. When an air mass arrives from the Colorado Front Range and NE Colorado, NH3 concentrations rise significantly due to the large emission sources upwind. For the comparison shown in Fig. 10, the diel pattern was determined using a full year of NH3 concentration data. Fluxes were also simulated using diel patterns determined with only a month of data, to probe the necessary length of measurements to generate an effective diel pattern. Annual deposition from all flux simulations using each different monthly diel pattern fell within 2 % of the annual deposition using the annual average diel pattern. Therefore, in RMNP, one month of 30 min measurements appears sufficient to generate a diel pattern that will effectively correct the net NH3 surface flux. Other locations may have larger and/or more complex variability in NH3 diel patterns and may require longer periods of data collection to establish an NH3 diel pattern.
3.3 Impacts of reanalysis meteorological data on simulated NH3 fluxes
Bidirectional exchange models require several meteorological and soil parameters, which may not be readily available for many locations of interest. Reanalysis data can provide meteorological inputs for locations where required in situ meteorological and soil measurements are unavailable. To examine the impact on flux simulation accuracy resulting from this substitution at RMNP, the same simulations of NH3 bidirectional fluxes were run using ERA5 meteorology and soil data. 30 min NH3 simulations run with reanalysis data inputs are well correlated (R2=0.76) with 30 min NH3 simulations run with in situ data inputs (see Fig. 11), but overestimate the annual NH3 deposition flux by a factor of 2. From Fig. 11, we find that the use of ERA5 reanalysis data in the simulation of NH3 bidirectional fluxes introduces a low bias to the flux magnitude in RMNP compared to in situ meteorological data, for both positive (emission) and negative (deposition) fluxes. However, because the decrease in deposition fluxes is smaller than the decrease in emission fluxes, we observe an annual overestimation from simulations using ERA5.
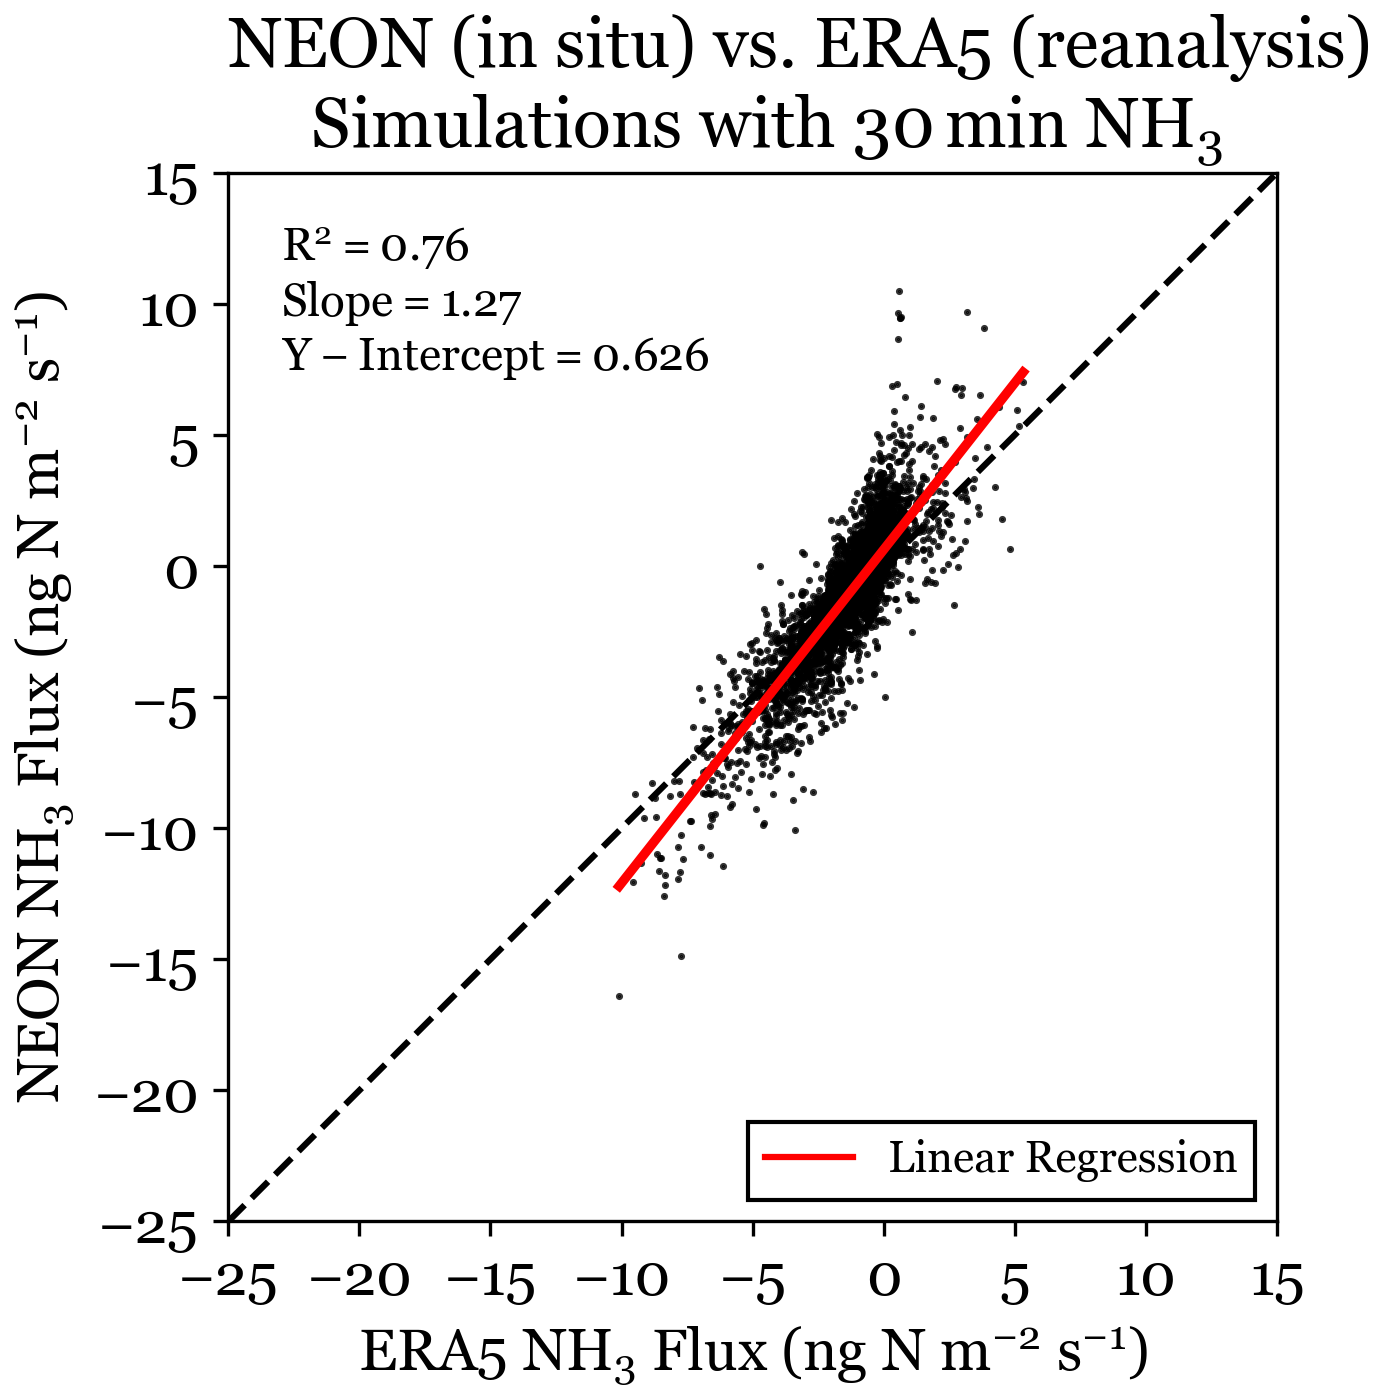
Figure 11Bidirectional NH3 flux simulated with ERA5 meteorology and NEON meteorology at 30 min resolution using the 30 min NH3 concentration. The least squares linear regression is plotted for the data in red.
The low bias for fluxes simulated using ERA5 reanalysis data is investigated further to explore what parameters influence this bias. Net NH3 fluxes are simulated using Eq. (17), which relies on , NH3 concentration, and Ra. We find that the simulations using reanalysis data generate , which agree well with the simulations using in situ measurements (slope = 1.03, R2=0.98).
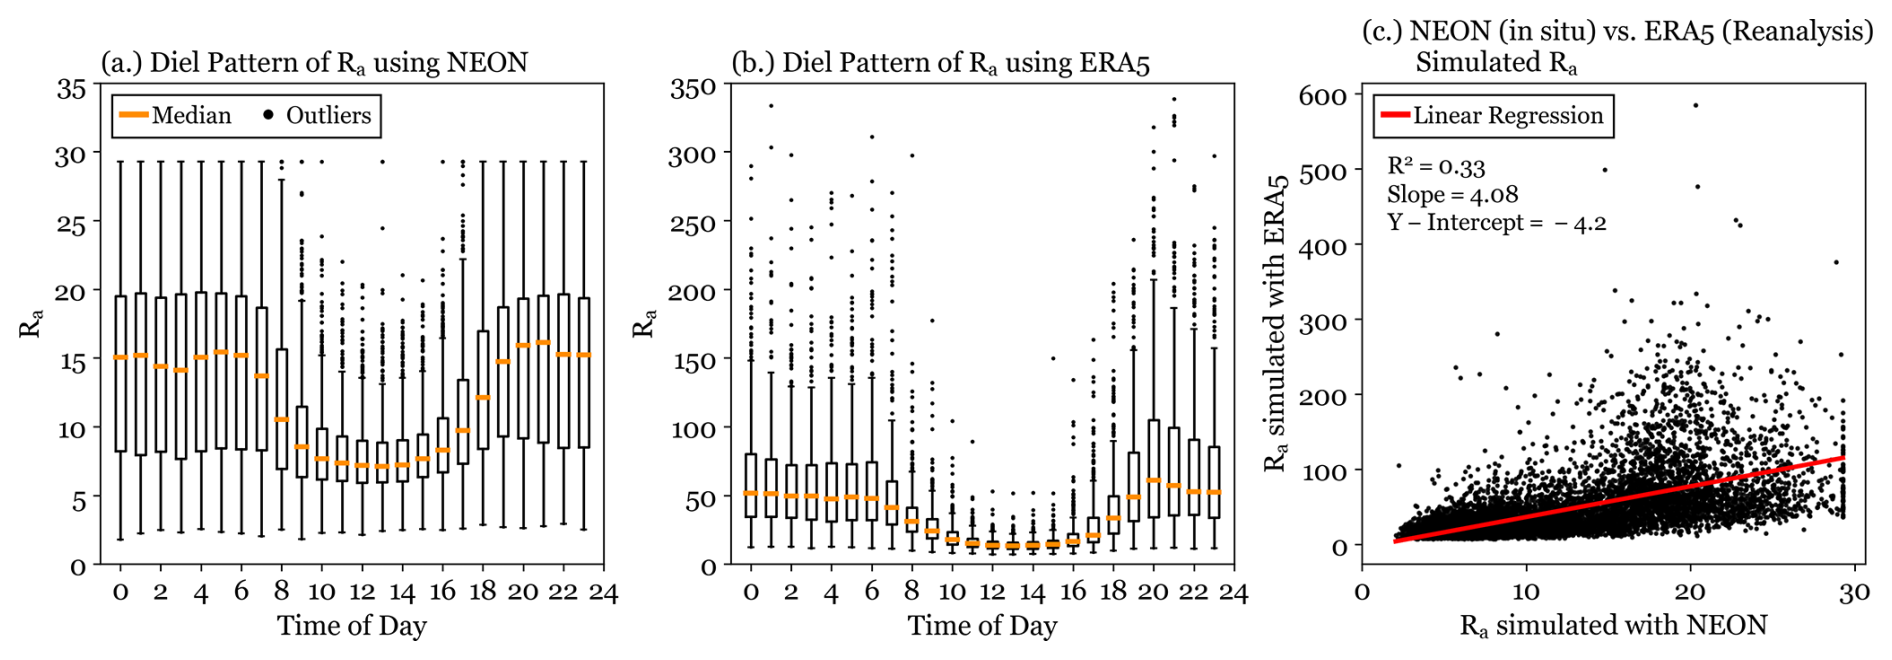
Figure 12Aerodynamic resistances are shown for simulations using in situ meteorological data from the NEON flux tower and reanalysis meteorological data from ERA5. The diel patterns are shown in (a) and (b), respectively. Panel (c) directly compares simulated Ra values using NEON in situ and ERA5 reanalysis data.
Although the general diel pattern of Ra is well captured using reanalysis data, Ra magnitudes differ substantially between the two simulations (Fig. 12a and b), with the largest difference occurring overnight. Maximum Ra values from the reanalysis simulations are an order of magnitude larger than those derived using in situ meteorology. A comparison of the two data sets shows (Fig. 12c) a typical enhancement of approximately a factor of four. Increased Ra values result in lower simulated NH3 fluxes. The Ra bias is likely driven by differences in the u∗ and L, which are used to calculate Ra. ERA5 data underestimates u∗ by a factor of 5 when compared with the in situ NEON data (slope = 0.2). The in situ NEON data also sets a minimum u∗ value (0.2 m s−1), while the ERA5 data allows u∗ values below 0.2 m s−1. Comparisons of all meteorological parameters used can be found in the Supplement. This discrepancy in modeled Ra may be due to the gridded nature of reanalysis data, which represents a large area of variable land types and complex topography using only a single value (Hogrefe et al., 2023). Previous work has identified heat and moisture fluxes as large areas of uncertainty in ERA5 Reanalysis (Kong et al., 2022; Mayer et al., 2022). Two case studies were conducted to probe the relative importance of u∗ and L. The case studies are described in the Supplement. Differences in Ra were impacted by both u∗ and L, accounting for 23 % and 10 %, respectively, of the discrepancy between in situ and ERA5 flux simulations.
Fluxes of NH3(g) can be simulated using a bidirectional model, which uses rapidly changing meteorology paired with air concentrations and soil parameters to infer flux direction and magnitude. We use a bidirectional NH3 flux model, proposed by Massad et al. (2010), to simulate a year of NH3 fluxes above a subalpine forest ecosystem in Rocky Mountain National Park. The net NH3 dry deposition to the ecosystem is estimated at 0.11 kg N ha−1 yr−1, comprising 4 % of total inorganic reactive nitrogen deposition. This is significantly lower than previous estimates for RMNP, which did not consider the bidirectional nature of the exchange. Due to the observed low bias in passive NH3 observations and the sensitivity of simulations to NH3 concentrations, this is likely a low bound. The sensitivity of NH3 flux modelling to χa was tested by scaling the input concentration by 9 % to account for the error discussed in Puchalski et al. (2011). This resulted in an annual deposition increase of 47 %, indicating the importance of accurate NH3 measurements for flux modelling. Additionally, since the highest NH3 concentrations occur during upslope events, the sources contributing to these events likely have a disproportionate effect on deposition. One limitation of this model is the exclusion of snow cover, which could significantly change NH3 fluxes in the winter, when RMNP has frequent snow events. To probe the impact of snow cover, a sensitivity test was conducted setting χg equal to zero during the winter (December, January, and February), which increased annual deposition by 0.06 kg N ha−1 yr−1. However, this analysis does not take into account how the surface differences may change NH3 fluxes above snow. Future work should investigate NH3 fluxes above snow cover to better simulate the exchange of NH3 in regions with snow.
Due to the cost and technical challenges of making continual, high time-resolution NH3 concentration measurements, there is growing interest in using integrated biweekly passive NH3 measurements, such as those from the NADP AMoN network, for flux simulations. Here, we establish that a site-specific correction can be used to correct a bias introduced by using lower time-resolution passive NH3 measurements over the studied forest canopy in RMNP. We also establish that an average NH3 diel pattern can be used to interpolate 30 min NH3 concentration and correct for the bias introduced by passive NH3 measurements. In RMNP, a month of measurements proved sufficient to determine the diel pattern used for flux simulations. The correction factor and diel pattern, however, likely vary by location due to differences in ecosystem characteristics and factors influencing NH3 concentrations. Due to the potential regional differences and changes associated with land surface type, additional sites should be studied to assess the impact of measurement time-resolution on NH3 flux simulations. To understand the seasonal variability in diel pattern and efficacy of diel pattern application for flux simulations, measurements should be conducted for a full year.
Local micrometeorological and soil measurements are also frequently unavailable, making the use of reanalysis data a desirable alternative for NH3 flux simulations. In our location, the use of reanalysis data adds a bias that leads to overestimates of net NH3 deposition. We found it was possible to apply a correction to address this bias, but this factor likely varies by location, in particular over different land surface types within a reanalysis grid cell. Future studies should explore the relationship between in situ measurements and reanalysis products above different land surface types, varied topography, and in different regions. Understanding how to correct for the biases introduced through the use of reanalysis data would allow improved modelling of NH3 bidirectional fluxes in regions lacking high time-resolution measurements.
In this analysis, we simulated the bidirectional exchange of NH3 above a forest ecosystem using the model proposed in Massad et al. (2010). However, there are other bidirectional exchange models (e.g., Zhang et al., 2010; Pleim et al., 2013) and their simulated fluxes may differ significantly from the model used here (Jongenelen et al., 2025). In the bidirectional exchange model used here, we observe that the selected inputs for NH3 concentration and meteorological data may introduce biases into the simulated NH3 fluxes. This may also be true for the other models when simulating NH3 bidirectional exchange, a good topic for future research.
The ammonia concentration data used in the study is available at DOI: https://doi.org/10.5061/dryad.0cfxpnwcw (Naimie et al., 2025). The NEON flux tower eddy covariance data bundle is available at: https://data.neonscience.org/data-products/DP4.00200.001 (last access: 4 June 2025). ERA5 reanalysis data is available at: https://www.ecmwf.int/en/forecasts/dataset/ecmwf-reanalysis-v5 (last access: 27 February 2024). CASTNET data are available at: https://www.epa.gov/castnet/download-data (last access: 24 November 2024). NTN data are available at: https://nadp.slh.wisc.edu/networks/national-trends-network/ (last access: 31 May 2024).
The supplement related to this article is available online at https://doi.org/10.5194/acp-25-15245-2025-supplement.
JC, BS, DP, and JW designed the measurement campaign. LN, AS, and DP made and processed Rocky Mountain National Park measurements. DP developed the model code. LN designed and ran the bidirectional exchange simulations. LN prepared the manuscript with contributions from all co-authors.
The contact author has declared that none of the authors has any competing interests.
The results contain modified Copernicus Climate Change Service information 2020. Neither the European Commission nor ECMWF is responsible for any use that may be made of the Copernicus information or data it contains. The results make use of data collected by the CASTNET program from the U.S. Environmental Protection Agency. The views expressed are of the authors and do not necessarily reflect those of the U.S. EPA or any other organizations that the data used was obtained from.
Publisher's note: Copernicus Publications remains neutral with regard to jurisdictional claims made in the text, published maps, institutional affiliations, or any other geographical representation in this paper. While Copernicus Publications makes every effort to include appropriate place names, the final responsibility lies with the authors. Views expressed in the text are those of the authors and do not necessarily reflect the views of the publisher.
The authors would also like to thank the NEON team for their support in collecting biweekly passive NH3 data. The authors thank Nikolas Tafoya for his assistance in collecting measurements on the NEON Tower.
This work was supported by the U.S. Environmental Protection Agency Regional Applied Research Efforts Program, Project #2237, and the National Park Service (NPS) under Agreement Number P20AC00679 with Colorado State University. This material is based in part upon work supported by the National Science Foundation through the National Ecological Observatory Network Program. The NEON Program is operated under a cooperative agreement by Battelle.
This paper was edited by Leiming Zhang and reviewed by three anonymous referees.
Baron, J. S.: Hindcasting Nitrogen Deposition To Determine An Ecological Critical Load, Ecological Applications, 16), 433–439, https://doi.org/10.1890/1051-0761(2006)016[0433:HNDTDA]2.0.CO;2, 2006.
Baron, J. S., Rueth, H. M., Wolfe, A. M., Nydick, K. R., Allstott, E. J., Minear, J. T., and Moraska, B.: Ecosystem Responses to Nitrogen Deposition in the Colorado Front Range, Ecosystems, 3, 352–368, https://doi.org/10.1007/s100210000032, 2000.
Beem, K. B., Raja, S., Schwandner, F. M., Taylor, C., Lee, T., Sullivan, A. P., Carrico, C. M., McMeeking, G. R., Day, D., Levin, E., Hand, J., Kreidenweis, S. M., Schichtel, B., Malm, W. C., and Collett, J. L.: Deposition of reactive nitrogen during the Rocky Mountain Airborne Nitrogen and Sulfur (RoMANS) study, Environmental Pollution, 158, 862–872, https://doi.org/10.1016/j.envpol.2009.09.023, 2010.
Benedict, K. B., Carrico, C. M., Kreidenweis, S. M., Schichtel, B., Malm, W. C., and Collett Jr., J. L.: A seasonal nitrogen deposition budget for Rocky Mountain National Park, Ecological Applications, 23, 1156–1169, https://doi.org/10.1890/12-1624.1, 2013a.
Benedict, K. B., Day, D., Schwandner, F. M., Kreidenweis, S. M., Schichtel, B., Malm, W. C., and Collett, J. L.: Observations of atmospheric reactive nitrogen species in Rocky Mountain National Park and across northern Colorado, Atmospheric Environment, 64, 66–76, https://doi.org/10.1016/j.atmosenv.2012.08.066, 2013b.
Benedict, K. B., Prenni, A. J., Sullivan, A. P., Evanoski-Cole, A. R., Fischer, E. V., Callahan, S., Sive, B. C., Zhou, Y., Schichtel, B. A., and Collett Jr., J. L.: Impact of Front Range sources on reactive nitrogen concentrations and deposition in Rocky Mountain National Park, PeerJ, https://doi.org/10.7717/peerj.4759, 2018.
Bobbink, R.: Effects of Nutrient Enrichment in Dutch Chalk Grassland, Journal of Applied Ecology, 28, 28–41, https://doi.org/10.2307/2404111, 1991.
Boot, C. M., Hall, E. K., Denef, K., and Baron, J. S.: Long-term reactive nitrogen loading alters soil carbon and microbial community properties in a subalpine forest ecosystem, Soil Biology and Biochemistry, 92, 211–220, https://doi.org/10.1016/j.soilbio.2015.10.002, 2016.
Bowker, G. E., Schwede, D. B., Lear, G. G., Warren-Hicks, W. J., and Finkelstein, P. L.: Quality Assurance Decisions with Air Models: A Case Study of Imputation of Missing Input Data Using EPA's Multi-layer Model, Water Air Soil Pollut., 222, 391–402, https://doi.org/10.1007/s11270-011-0832-7, 2011.
Bowman, W. D., Murgel, J., Blett, T., and Porter, E.: Nitrogen critical loads for alpine vegetation and soils in Rocky Mountain National Park, Journal of Environmental Management, 103, 165–171, https://doi.org/10.1016/j.jenvman.2012.03.002, 2012.
Butler, T., Vermeylen, F., Lehmann, C. M., Likens, G. E., and Puchalski, M.: Increasing ammonia concentration trends in large regions of the USA derived from the NADP/AMoN network, Atmospheric Environment, 146, 132–140, https://doi.org/10.1016/j.atmosenv.2016.06.033, 2016.
Burns, D. A.: Atmospheric nitrogen deposition in the Rocky Mountains of Colorado and southern Wyoming – a review and new analysis of past study results, Atmospheric Environment, 37, 921–932, https://doi.org/10.1016/S1352-2310(02)00993-7, 2003.
CDPHE (Colorado Department of Public Health and Environment, Air Pollution Control Division): Nitrogen Deposition Reduction Plan, Colorado Department of Public Health and Environment, https://cdphe.colorado.gov/public-information/planning-and-outreach/rocky-mountain-national-park-initiative (last access: 5 October 2024), 2007.
Dempster, J. (Ed.): Signal Analysis and Measurement, in The Laboratory Computer, 136–171, Academic Press, London, https://doi.org/10.1016/B978-012209551-1/50039-8, 2001.
Driscoll, C., Milford, J. B., Henze, D. K., and Bell, M. D.: Atmospheric reduced nitrogen: Sources, transformations, effects, and management, Journal of the Air & Waste Management Association, 74, 362–415, https://doi.org/10.1080/10962247.2024.2342765, 2024.
Galloway, J. N., Townsend, A. R., Erisman, J. W., Bekunda, M., Cai, Z., Freney, J. R., Martinelli, L. A., Seitzinger, S. P., and Sutton, M. A.: Transformation of the Nitrogen Cycle: Recent Trends, Questions, and Potential Solutions, Science, 320, 889–892, https://doi.org/10.1126/science.1136674, 2008.
Gebhart, K. A., Schichtel, B. A., Malm, W. C., Barna, M. G., Rodriguez, M. A., and Collett, J. L.: Back-trajectory-based source apportionment of airborne sulfur and nitrogen concentrations at Rocky Mountain National Park, Colorado, USA, Atmospheric Environment, 45, 621–633, https://doi.org/10.1016/j.atmosenv.2010.10.035, 2011.
Giusti, M.: ERA5: How to calculate Obukhov Length, Copernicus Knowledge Base, European Centre for Medium-Range Weather Forecasts (ECMWF) [code], https://confluence.ecmwf.int/display/CKB/ERA5:+How+to+calculate+Obukhov+Length (last access: 4 June 2025), 2024.
Hendriks, C., Kranenburg, R., Kuenen, J. J. P., Van den Bril, B., Verguts, V., and Schaap, M.: Ammonia emission time profiles based on manure transport data improve ammonia modelling across north western Europe, Atmospheric Environment, 131, 83–96, https://doi.org/10.1016/j.atmosenv.2016.01.043, 2016.
Hersbach, H., Bell, B., Berrisford, P., Hirahara, S., Horányi, A., Muñoz-Sabater, J., Nicolas, J., Peubey, C., Radu, R., Schepers, D., Simmons, A., Soci, C., Abdalla, S., Abellan, X., Balsamo, G., Bechtold, P., Biavati, G., Bidlot, J., Bonavita, M., De Chiara, G., Dahlgren, P., Dee, D., Diamantakis, M., Dragani, R., Flemming, J., Forbes, R., Fuentes, M., Geer, A., Haimberger, L., Healy, S., Hogan, R. J., Hólm, E., Janisková, M., Keeley, S., Laloyaux, P., Lopez, P., Lupu, C., Radnoti, G., de Rosnay, P., Rozum, I., Vamborg, F., Villaume, S., and Thépaut, J.-N.: The ERA5 Global Reanalysis, Quarterly Journal of the Royal Meteorological Society, 146, 1999–2049, https://doi.org/10.1002/qj.3803, 2020.
Hicks, B. B., Baldocchi, D. D., Meyers, T. P., Hosker, R. P., and Matt, D. R.: A preliminary multiple resistance routine for deriving dry deposition velocities from measured quantities, Water, Air, and Soil Pollution, 36, 311–330, https://doi.org/10.1007/BF00229675, 1987.
Hogrefe, C., Bash, J. O., Pleim, J. E., Schwede, D. B., Gilliam, R. C., Foley, K. M., Appel, K. W., and Mathur, R.: An analysis of CMAQ gas-phase dry deposition over North America through grid-scale and land-use-specific diagnostics in the context of AQMEII4, Atmos. Chem. Phys., 23, 8119–8147, https://doi.org/10.5194/acp-23-8119-2023, 2023.
Holtgrieve, G. W., Schindler, D. E., Hobbs, W. O., Leavitt, P. R., Ward, E. J., Bunting, L., Chen, G., Finney, B. P., Gregory-Eaves, I., Holmgren, S., Lisac, M. J., Lisi, P. J., Nydick, K., Rogers, L. A., Saros, J. E., Selbie, D. T., Shapley, M. D., Walsh, P. B., and Wolfe, A. P.: A Coherent Signature of Anthropogenic Nitrogen Deposition to Remote Watersheds of the Northern Hemisphere, Science, 334, 1545–1548, https://doi.org/10.1126/science.1212267, 2011.
Hu, C., Griffis, T. J., Frie, A., Baker, J. M., Wood, J. D., Millet, D. B., Yu, Z., Yu, X., and Czarnetzki, A. C.: A multiyear constraint on ammonia emissions and deposition within the US Corn Belt, Geophysical Research Letters, 48, e2020GL090865, https://doi.org/10.1029/2020GL090865, 2021.
Jongenelen, T., van Zanten, M., Dammers, E., Wichink Kruit, R., Hensen, A., Geers, L., and Erisman, J. W.: Validation and uncertainty quantification of three state-of-the-art ammonia surface exchange schemes using NH3 flux measurements in a dune ecosystem, Atmos. Chem. Phys., 25, 4943–4963, https://doi.org/10.5194/acp-25-4943-2025, 2025.
Juncosa Calahorrano, J. F., Sullivan, A. P., Pollack, I. B., Roscioli, J. R., McCabe, M. E., Steinmann, K. M., Caulton, D. R., Li, E., Pierce, J. R., Naimie, L. E., Pan, D., Collett Jr., J. L., and Fischer, E. V.: Anatomy of Summertime Upslope Events in Northeastern Colorado: Ammonia (NH3) Transport to the Rocky Mountains, Environmental Science & Technology, 58, 16922–16930, https://doi.org/10.1021/acs.est.3c10902, 2024.
Kanakidou, M., Myriokefalitakis, S., Daskalakis, N., Fanourgakis, G., Nenes, A., Baker, A. R., Tsigaridis, K., and Mihalopoulos, N.: Past, Present, and Future Atmospheric Nitrogen Deposition, Journal of the Atmospheric Sciences, 73, 2039–2047, https://doi.org/10.1175/JAS-D-15-0278.1, 2016.
Kong, B., Liu, N., Fan, L., Lin, L., Yang, L., Chen, H., Wang, Y., Zhang, Y., and Xu, Y.: Evaluation of surface meteorology parameters and heat fluxes from CFSR and ERA5 over the Pacific Arctic Region, Quarterly Journal of the Royal Meteorological Society, 148, 2973–2990, https://doi.org/10.1002/qj.4346, 2022.
Korb, J. E. and Ranker, T. A.: Changes in stand composition and structure between 1981 and 1996 in four Front Range plant communities in Colorado, Plant Ecology, 157, 1–11, https://doi.org/10.1023/A:1013772220131, 2001.
Li, Y., Schichtel, B. A., Walker, J. T., Schwede, D. B., Chen, X., Lehmann, C. M. B., Puchalski, M. A., Gay, D. A., and Collett, J. L.: Increasing importance of deposition of reduced nitrogen in the United States, Proceedings of the National Academy of Sciences, 113, 5874–5879, https://doi.org/10.1073/pnas.1525736113, 2016.
Massad, R.-S., Nemitz, E., and Sutton, M. A.: Review and parameterisation of bi-directional ammonia exchange between vegetation and the atmosphere, Atmos. Chem. Phys., 10, 10359–10386, https://doi.org/10.5194/acp-10-10359-2010, 2010.
Mayer, J., Mayer, M., Haimberger, L., and Liu, C.: Comparison of Surface Energy Fluxes from Global to Local Scale, J. Climate, 35, 4551–4569, https://doi.org/10.1175/JCLI-D-21-0598.1, 2022.
Meyers, T. P., Finkelstein, P., Clarke, J., Ellestad, T. G., and Sims, P. F.: A multilayer model for inferring dry deposition using standard meteorological measurements, Journal of Geophysical Research, 103, 22645–22661, 1998.
Montes, F., Rotz, C. A., and Chaoui, H.: Process Modeling of Ammonia Volatilization from Ammonium Solution and Manure Surfaces: A Review with Recommended Models, Transactions of the ASABE, 52, 1707–1720, https://doi.org/10.13031/2013.29133, 2009.
Naimie, L. E., Pan, D., Sullivan, A. P., Walker, J. T., Djurkovic, A., Schichtel, B. A., and Collett, J.: Data from: Sensitivity of simulated ammonia fluxes in Rocky Mountain National Park to measurement time resolution and meteorological inputs, Dryad [data set], https://doi.org/10.5061/dryad.0cfxpnwcw, 2025.
National Atmospheric Deposition Program (NRSP-3): NADP Program Office, Wisconsin State Laboratory of Hygiene, 465 Henry Mall, Madison, WI 53706 [data set], https://nadp.slh.wisc.edu/ (last access: 31 May 2024), 2022.
NEON (National Ecological Observatory Network): Site management and event reporting (DP1.10111.001), RELEASE-2023, NEON [data set], https://doi.org/10.48443/9p2t-hj77, 2023.
Nemitz, E., Milford, C., and Sutton, M. A.: A two-layer canopy compensation point model for describing bi-directional biosphere-atmosphere exchange of ammonia, Quarterly Journal of the Royal Meteorological Society, 127, 815–833, https://doi.org/10.1002/qj.49712757306, 2001.
Pan, D., Benedict, K. B., Golston, L. M., Wang, R., Collett, J. L. Jr., Tao, L., Sun, K., Guo, X., Ham, J., Prenni, A. J., Schichtel, B. A., Mikoviny, T., Müller, M., Wisthaler, A., and Zondlo, M. A.: Ammonia Dry Deposition in an Alpine Ecosystem Traced to Agricultural Emission Hotpots, Environmental Science & Technology, 55, 7776–7785, https://doi.org/10.1021/acs.est.0c05749, 2021.
Pan, Y., Gu, M., Song, L., Tian, S., Wu, D., Walters, W. W., Yu, X., Lü, X., Ni, X., Wang, Y., Cao, J., Liu, X., Fang, Y., and Wang, Y.: Systematic low bias of passive samplers in characterizing nitrogen isotopic composition of atmospheric ammonia, Atmospheric Research, 243, 105018, https://doi.org/10.1016/j.atmosres.2020.105018, 2020.
Pleim, J. E., Bash, J. O., Walker, J. T., and Cooter, E. J.: Development and evaluation of an ammonia bidirectional flux parameterization for air quality models, Journal of Geophysical Research: Atmospheres, 118, 3794–3806, https://doi.org/10.1002/jgrd.50262, 2013.
Puchalski, M. A., Sather, M. E., Walker, J. T., Lehmann, C. M. B., Gay, D. A., Mathew, J., and Robarge, W. P.: Passive ammonia monitoring in the United States: Comparing three different sampling devices, Journal of Environmental Monitoring, 13, 3156–3167, https://doi.org/10.1039/C1EM10553A, 2011.
Schiferl, L. D., Heald, C. L., Van Damme, M., Clarisse, L., Clerbaux, C., Coheur, P.-F., Nowak, J. B., Neuman, J. A., Herndon, S. C., Roscioli, J. R., and Eilerman, S. J.: Interannual variability of ammonia concentrations over the United States: sources and implications, Atmos. Chem. Phys., 16, 12305–12328, https://doi.org/10.5194/acp-16-12305-2016, 2016.
Schrader, F., Schaap, M., Zöll, U., Kranenburg, R., and Brümmer, C.: The hidden cost of using low-resolution concentration data in the estimation of NH3 dry deposition fluxes, Scientific Reports, 8, 969, https://doi.org/10.1038/s41598-017-18021-6, 2018.
Schwede, D. B. and Lear, G. G.: A novel hybrid approach for estimating total deposition in the United States, Atmospheric Environment, 92, 207–220, https://doi.org/10.1016/j.atmosenv.2014.04.008, 2014.
Shen, J., Chen, D., Bai, M., Sun, J., Coates, T., Lam, S. K., and Li, Y.: Ammonia deposition in the neighbourhood of an intensive cattle feedlot in Victoria, Australia, Scientific Reports, 6, 32793, https://doi.org/10.1038/srep32793, 2016.
Stratton, J. J., Ham, J., and Borch, T.: Ammonia Emissions from Subalpine Forest and Mountain Grassland Soils in Rocky Mountain National Park, Journal of Environmental Quality, 47, 778–785, https://doi.org/10.2134/jeq2018.01.0023, 2018.
Stull, R. B.: An Introduction to Boundary Layer Meteorology, Kluwer Academic, Dordrecht, https://doi.org/10.1007/978-94-009-3027-8, 1988.
Sutton, M. A., Schjørring, J. K., Wyers, G. P., Duyzer, J. H., Ineson, P., Powlson, D. S., Fowler, D., Jenkinson, D. S., Monteith, J. L., and Unsworth, M. H.: Plant–atmosphere exchange of ammonia, Philosophical Transactions of the Royal Society of London. Series A: Physical and Engineering Sciences, 351, 261–278, https://doi.org/10.1098/rsta.1995.0033, 1995.
Tanner, E., Buchmann, N., and Eugster, W.: Agricultural ammonia dry deposition and total nitrogen deposition to a Swiss mire, Agriculture, Ecosystems & Environment, 336, 108009, https://doi.org/10.1016/j.agee.2022.108009, 2022.
Thom, A. S.: Momentum, mass and heat exchange of plant communities, edited by: Monteith, J. L., Vegetation and the Atmosphere, Vol. 1, Academic Press, London, 57–110, 1975.
Tomsche, L., Piel, F., Mikoviny, T., Nielsen, C. J., Guo, H., Campuzano-Jost, P., Nault, B. A., Schueneman, M. K., Jimenez, J. L., Halliday, H., Diskin, G., DiGangi, J. P., Nowak, J. B., Wiggins, E. B., Gargulinski, E., Soja, A. J., and Wisthaler, A.: Measurement report: Emission factors of NH3 and NHx for wildfires and agricultural fires in the United States, Atmos. Chem. Phys., 23, 2331–2343, https://doi.org/10.5194/acp-23-2331-2023, 2023.
U.S. EPA: National Emissions Inventory [Tier I CAPS] [data set], https://www.epa.gov/air-emissions-inventories/national-emissions-inventory-nei (last access: 5 June 2024), 2023.
U.S. EPA: U.S. Environmental Protection Agency Clean Air Markets Division: Clean Air Status and Trends Network (CASTNET) [Weekly Dry Deposition] [data set], https://www.epa.gov/castnet (last access: 20 February 2024), 2024b.
U.S. EPA: U.S. Environmental Protection Agency Clean Air Markets Division: Clean Air Status and Trends Network (CASTNET) [Weekly Filter Pack] [data set], https://www.epa.gov/castnet (last access: 20 February 2024), 2024b.
Walker, J. T., Spence, P., Kimbrough, S., and Robarge, W.: Inferential model estimates of ammonia dry deposition in the vicinity of a swine production facility, Atmospheric Environment, 42, 3407–3418, https://doi.org/10.1016/j.atmosenv.2007.06.004, 2008.
Walker, J. T., Beachley, G., Amos, H. M., Baron, J. S., Bash, J., Baumgardner, R., Bell, M. D., Benedict, K. B., Chen, X., Clow, D. W., Cole, A., Coughlin, J. G., Cruz, K., Daly, R. W., Decina, S. M., Elliott, E. M., Fenn, M. E., Ganzeveld, L., Gebhart, K., Isil, S. S., Kerschner, B. M., Larson, R. S., Lavery, T., Lear, G. G., Macy, T., Mast, M. A., Mishoe, K., Morris, K. H., Padgett, P. E., Pouyat, R. V., Puchalski, M., Pye, H. O. T., Rea, A. W., Rhodes, M. F., Rogers, C. M., Saylor, R., Scheffe, R., Schichtel, B. A., Schwede, D. B., Sexstone, G. A., Sive, B.C., Sosa Echeverría, R., Templer, P. H., Thompson, T., Tong, D., Wetherbee, G. A., Whitlow, T. H., Wu, Z., Yu, Z., and Zhang, L.: Toward the improvement of total nitrogen deposition budgets in the United States, Science of The Total Environment, 691, 1328–1352, https://doi.org/10.1016/j.scitotenv.2019.07.058, 2019a.
Walker, J. T., Bell, M. D., Schwede, D., Cole, A., Beachley, G., Lear, G., and Wu, Z.: Aspects of uncertainty in total reactive nitrogen deposition estimates for North American critical load applications, Science of The Total Environment, 690, 1005–1018, https://doi.org/10.1016/j.scitotenv.2019.06.337, 2019b.
Wentworth, G. R., Murphy, J. G., Benedict, K. B., Bangs, E. J., and Collett Jr., J. L.: The role of dew as a night-time reservoir and morning source for atmospheric ammonia, Atmos. Chem. Phys., 16, 7435–7449, https://doi.org/10.5194/acp-16-7435-2016, 2016.
Wichink Kruit, R. J., Schaap, M., Sauter, F. J., van Zanten, M. C., and van Pul, W. A. J.: Modeling the distribution of ammonia across Europe including bi-directional surface–atmosphere exchange, Biogeosciences, 9, 5261–5277, https://doi.org/10.5194/bg-9-5261-2012, 2012.
Xiu, A. and Pleim, J. E.: Development of a Land Surface Model. Part I: Application in a Mesoscale Meteorological Model, Journal of Applied Meteorology, 40, 192–209, https://doi.org/10.1175/1520-0450(2001)040<0192:DOALSM>2.0.CO;2, 2001.
Zhan, X., Bo, Y., Zhou, F., Liu, X., Paerl, H. W., Shen, J., Wang, R., Li, F., Tao, S., Dong, Y., and Tang, X.: Evidence for the Importance of Atmospheric Nitrogen Deposition to Eutrophic Lake Dianchi, China, Environmental Science & Technology, 51, 6699–6708, https://doi.org/10.1021/acs.est.6b06135, 2017.
Zhang, L., Brook, J. R., and Vet, R.: A revised parameterization for gaseous dry deposition in air-quality models, Atmos. Chem. Phys., 3, 2067–2082, https://doi.org/10.5194/acp-3-2067-2003, 2003.
Zhang, L., Wright, L. P., and Asman, W. A. H.: Bi-directional air-surface exchange of atmospheric ammonia: A review of measurements and a development of a big-leaf model for applications in regional-scale air-quality models, Journal of Geophysical Research: Atmospheres, 115, https://doi.org/10.1029/2009JD013589, 2010.