the Creative Commons Attribution 4.0 License.
the Creative Commons Attribution 4.0 License.
 | 04 Nov 2025
Secondary ice formation in cumulus congestus clouds: insights from observations and aerosol-aware large-eddy simulations
Silvia M. Calderón
Noora Hyttinen
Harri Kokkola
Tomi Raatikainen
R. Paul Lawson
Sami Romakkaniemi
Secondary ice production (SIP) was investigated in a cumulus congestus system observed during the Secondary Production of Ice in Cumulus Experiment (SPICULE) campaign. Large-eddy simulations were performed using UCLALES–SALSA, a model that explicitly resolves aerosol–hydrometeor interactions through a sectional representation of aerosols, cloud droplets, rain droplets, and ice crystals. Two scenarios were compared: one including only immersion freezing as an ice formation process, and another incorporating additional SIP mechanisms – namely droplet shattering, rime splintering, and ice–ice collisional breakup.
The SIP-inclusive simulation reproduced the evolution of the observed cloud microphysical structure in both warm and mixed-phase regions. Ice–ice collisional breakup generated substantially more secondary ice particles than droplet shattering; however, it was only initiated after droplet shattering provided a sufficient initial ice particle population to meet the SIP triggering conditions. Droplet shattering was triggered by the presence of large supercooled droplets, defined by an integral raindrop diameter exceeding 3.5 mm L−1 at temperatures below 265 K. Once formed, secondary ice particles enhanced riming and accretion, leading to auto-catalytic amplification of SIP through ice–ice breakup. This feedback rapidly depleted cloud liquid water within approximately 10 min.
Enhanced updrafts were identified in SIP-active regions, suggesting invigoration in the upper mixed-phase levels. SIP also intensified precipitation via the ice phase, resulting in a 26 % increase in domain-mean cumulative precipitation. The simulations reproduced key aspects of the observed ice multiplication, supporting the adequacy of the SIP representation in the model framework.
- Article
(10491 KB) - Full-text XML
-
Supplement
(10257 KB) - BibTeX
- EndNote


Secondary ice production (SIP) refers to a series of physical mechanisms that generate ice particles from pre-existing ones without intervention of ice-nucleating particles (INPs). SIP can enhance ice number concentrations (INC) above levels expected from primary ice formation via INP causing ice multiplication factors of up to 104 (Wieder et al., 2022). This can significantly affect the vertical stratification of the cloud thermodynamic phase affecting their radiative properties (e.g. Young et al., 2019; Zhao et al., 2021; Waman et al., 2022). SIP effects on ice microphysics may also alter the dynamics of precipitation formation via cold phase (e.g. Sullivan et al., 2018; Patade et al., 2025; Grzegorczyk et al., 2025c).
There are at least seven mechanisms proposed to explain SIP observed in laboratory studies. The most studied ones are rime splintering (RS), droplet shattering (DS) and ice–ice collisional breakup (IIBR). Cloud particle imager (CPI) and holographic imaging systems for sampling the number, size, shape and thermodynamic phase of hydrometeors have provided a solid base of evidence of the SIP occurrence at different altitudes in different cloud types. CPI and holographic images suggest that secondary ice formation can be identified by the simultaneous presence of small individual faceted ice particles (i.e. maximum length below 100 µm) coexisting with fragments of frozen drops or frozen drops with bulges, spikes or cracks (Korolev et al., 2020, 2022; Korolev and Milbrandt, 2022; Pasquier et al., 2022; Lawson et al., 2023b; Patnaude et al., 2025). Similarly, it can also be indicated by the concurrent presence of heavily rimed ice particles, dendrites and broken branches of dendrites (e.g Schwarzenboeck et al., 2009; Ramelli et al., 2021). The combination of these crystal structures have been observed in laboratory experiments focused on secondary ice formation by the mechanisms of droplet shattering and ice–ice collisional breakup, respectively.
All secondary ice production mechanisms share a common modelling framework that considers that ice multiplication occurs during hydrometeor collisions when specific conditions of temperature and hydrometeor relative size are satisfied. SIP parametrizations are based on observed ice multiplication factors (IMF) that come from a common set of laboratory experiments. In case of rime splintering those by Hallet and Mossop (1974) and Mossop (1976); in case of the droplet shattering parameterization by Phillips et al. (2018) the studies of Brownscombe and Thorndike (1968), Takahashi and Yamashita (1970), Takahashi (1975), Takahashi and Yamashita (1977), Kolomeychuk et al. (1975) and Pruppacher and Schlamp (1975); and finally, in the case of SIP parameterizations for ice–ice collisional breakup the study by Takahashi et al. (1995). Despite this common background, IMF values can be different in different parameterizations even when they are meant to describe the same physical mechanism at the same atmospheric conditions (e.g. Sotiropoulou et al., 2021 versus Sullivan et al., 2018). Also, SIP rates can be different in different cloud modelling studies depending on how hydrometeor sizes and process related size limits are treated. Other less known SIP mechanisms include ice particle fragmentation of sublimating ice particles, and ice particle fragmentation due to thermal shock caused by freezing droplets on their surface and INP activation around freezing drops in transient supersaturation (Korolev and Leisner, 2020; Qu et al., 2022). These are not considered here because parametrizations are not available yet or in the case of sublimational breakup requires more validation (Deshmukh et al., 2022).
SIP parametrizations carry an intrinsic uncertainty inherited from old experimental techniques lacking of the high-speed microscopic imaging tools needed to follow the generation of secondary ice particles or the advanced control systems to keep stable conditions during experiments (Lauber et al., 2018; Seidel et al., 2024). This has awakened the interest in reproducing SIP experiments with state-of-the-art laboratory techniques to validate variable dependencies and assess the range of applicability of their associated parameterizations (Leisner et al., 2014; Lauber et al., 2018; Keinert et al., 2020). For example, Grzegorczyk et al. (2025a) confirmed variable dependencies (i.e. temperature and rime fraction) and trends (e.g. increasing SIP rates with increasing kinetic collisional energy) in SIP–IIBR rates observed by Takahashi et al. (1995) but proposed adjustments to model parameters to increase rates given by the SIP–IIBR parameterization of Phillips et al. (2017b). Another experiment with contrasting results was performed by Seidel et al. (2024) who found significantly lower SIP–RS rates in experiments mimicking those of Hallet and Mossop (1974). The rime splintering parameterization based on the experiments of Hallet and Mossop (1974) is the most commonly implemented SIP pathway in weather and climate models (e.g. Zhao et al., 2021; Sotiropoulou et al., 2021; Georgakaki et al., 2022; Atlas et al., 2022; Schäfer et al., 2024). In the recent modelling studies SIP–RS rates had to be multiplied by factors ranging from 2 to 10 in order to reduce the gap between modeled and observed INCs (Han et al., 2024; Grzegorczyk et al., 2025a). Unlike parametrizations for droplet shattering and ice–ice collisional breakup, the parametrization for rime splintering is typically implemented to give the number of secondary ice particles per unit mass of rime ice, ignoring any type of hydrometeor size limitation affecting it. This implicitly can lead to higher SIP rates than those occurring in natural clouds.
Despite an increasing number of case studies, the cloud modelling community has not reached a consensus on a simplified conceptual model for secondary ice production that better and more consistently conveys observed ice multiplication rates in all types of clouds regardless of their genesis. Without a common SIP modelling framework, it is possible to have contrasting results even for the same cloud case if studies employ different parameterizations of the same mechanism (Qu et al., 2022; Huang et al., 2022). There are three main action points to address in order to build a common SIP modelling framework. First, there must be a consensus around a common IMF parameterization to describe the same SIP mechanism. Currently there are at least four different IMF parameterizations to represent secondary ice production by droplet shattering. Even under the same conditions, different parameterizations of identical processes can produce vastly different ice multiplication factors per SIP event (e.g. Lawson et al., 2015; Phillips et al., 2018). Secondly, it is necessary to have experimentally based constraints for the size distribution of secondary ice particles. This is an important source of uncertainty in inter-model comparison studies, especially due to the intrinsically different cloud schemes (e.g. bulk vs. sectional-based). Lastly, this SIP modelling framework must agree on rules about the relative size of interacting hydrometeors since they determine when a collision can effectively generate secondary ice particles. These constraints must selectively identify which microphysical conditions trigger which mechanism, since there can be overlapping variable ranges (e.g. rime splintering and droplet shattering). A SIP modelling framework built according to these rules would enable process-based attribution analysis to identify specific feedbacks operating within a given cloud type.
Keeping these three factors in mind, the final goal is a SIP modelling framework that is able to capture cloud responses under realistic atmospheric conditions where cloud microphysics are constrained by aerosols. Without describing aerosol size and composition effects on hydrometeor growth, cloud schemes are limited to prescribed size distributions and process rates for droplet and ice activation. They may fail in giving proper description of ice formation via primary and secondary pathways missing important links to others such as secondary activation and aerosol invigoration (Fan et al., 2022; Varble et al., 2023). All these processes combined can potentially affect the precipitation formation driven by ice crystals, which is the most important pathway accounting for 57 % of global surface precipitation (Heymsfield et al., 2020). When included in cloud modelling studies, SIP-modulated changes in precipitation-related parameters (i.e. magnitude and spatial variability of instantaneous or cumulative rates, and duration) vary widely across cloud responses, perhaps as much as the process formulations vary among them (Phillips et al., 2017a; Sullivan et al., 2018; Hoarau et al., 2018; Han et al., 2024; Grzegorczyk et al., 2025b, c).
In this study we offer insights on cloud dynamic responses to SIP by coupling results from aerosol-aware large-eddy-simulations (LES) and in-cloud observations of a system of towering cumulus observed in 5 June 2021 during the Secondary Production of Ice in Cumulus Experiment (SPICULE) carried out in the Southern Great Plains (USA). LES simulations were performed with UCLALES–SALSA because it does not use prescribed hydrometeor size distributions but instead resolves them using a sectional representation for aerosol, cloud droplets, rain droplets, and ice crystals. This, not only allowed us to track closely size related effects, such as condensational growth and hydrometeor aggregation, but also allowed us to employ parameterizations that have a less empirical and more theory-based framework to give a more realistic description of SIP events and their dependence on hydrometeor sizes. Our goal was to explore which parameterizations, microphysical assumptions, and variable dependencies are needed to reproduce the ice multiplication effects observed in the system of cumulus congestus towers. Once our modelling framework was validated with observed cloud microphysics, we studied how SIP affected the convective intensity, cloud phase partitioning, and surface precipitation.
2.1 Cloud case study: measurements and instrumentation
Our case study comprises a system of towering cumulus clouds observed in 5 June 2021 over the Great Plains in southern Oklahoma (USA) during the Secondary Production of Ice in Cumulus Experiment (SPICULE). Our selection was driven by the existence of a very detailed set of airborne in situ and remote observations of cloud microphysical properties showing evidence of secondary ice production. Airborne measurements were carried out using two coordinated aircrafts, the NSF Gulfstream V, and the Spec Incorporated Learjet model 35 A, referred to from now on as the GV and Learjet. Both airborne platforms were equipped with air motion sensors and in situ microphysical probes covering different size ranges (Lawson et al., 2023a, 2022a). The GV was monitoring the subcloud and warm cloud section and had additional equipment compared to the Learjet to measure aerosol size distributions (UCAR/NCAR – Earth Observing Laboratory, 2023), number concentrations of giant cloud condensation nuclei (CCN) (UCAR/NCAR – Earth Observing Laboratory, 2021), and ice nucleating particles (INP) (DeMott et al., 2024). The GV was also equipped with a polarimetric millimeter-wavelength radar (HIAPER cloud radar). The Learjet flight was monitoring the uppermost section of the mixed-phase zone and was equipped with a Ka-band up/down radar (Korolev and Heckman, 2023). Although this case was well documented in Lawson et al. (2023b), for the sake of completeness, we included a summary of the instruments in Table S1 of the Supplement.
2.2 UCLALES–SALSA modelling framework
UCLALES–SALSA (University of California Los Angeles Large Eddy Simulation model – Sectional Aerosol module for Large Scale Applications) is a one-of-a-kind LES-model that simulates cloud formation with aerosol-driven microphysical processes (Tonttila et al., 2017, 2021). The model employs sectional representation of aerosol and hydrometeor microphysics to get size–resolved growth by condensation and deposition and hydrometeor aggregation rates without employing parametrizations (such as cloud droplet activation, autoconversion, accretion, and riming). Aerosol size-composition effects are accounted for using a microphysical scheme based on aerosol dry particle size and mixing state. Wet sizes are used to evaluate transitions from aerosol particles to cloud droplets, or from cloud droplets to rain droplets in the collision between droplets. Primary ice production pathway includes homogeneous ice nucleation, and heterogeneous ice nucleation includes the immersion, deposition, and contact freezing mechanisms. Ice particles are treated with a microphysical scheme based on maximum particle length using the parameterization of ice–phase microphysics of Morrison and Milbrandt (2015). The LES modelling framework applicable to liquid clouds can be found in Tonttila et al. (2017, 2021), and to mixed-phase clouds involving only primary ice production in Ahola et al. (2020) and Tonttila et al. (2022).
The ice microphysical scheme is similar to the Predicted Particle Properties (P3) scheme of Morrison and Milbrandt (2015) that uses a single ice “free” category to represent time–evolving ice particle properties based on the concept of filling in with rime. Ice particles in each size bin have mass–dimension (i.e. m(D)=αDβ with D equivalent to the maximum particle dimension) and projected area–dimension (i.e. A(D)=γDσ) relationships that vary in time and space determining their effective density and falling speed in accordance with the prognostic value of the bulk rime mass fraction. The maximum particle length D is determined by comparison against critical sizes separating pristine small spherical from dense nonspherical ice, dense nonspherical from graupel and graupel from partially rimed crystals. Parameters of the m−D and A−D relationships of nonspherical pristine ice particles are given as model inputs of simulations (Bühl et al., 2019). In this study, we implemented the change in the projected area for partially rimed particles using rime fraction–weighted values of the γ and σ parameters varying between those of nonspherical pristine ice crystals and those of spherical graupel. Pristine ice particles are treated as crystals with sectors like branches (P1b).
The immersion freezing mechanism in our simulation is the primary pathway for ice formation. Their rates are calculated using the parametrization of Savre et al. (2014) that uses a time–evolving probability density function of the contact angle parameter (i.e. angle formed between liquid water, the INP surface and the ice embryo during nucleation that gives a measure of the composition-dependent INP affinity to the ice embryo; Barahona, 2018). The use of a distribution allows to account for heterogeneities in surface properties among a given aerosol population. In our modelling framework, cloud droplets and raindrops can experience heterogeneous freezing via immersion as long as they contain a volume of insoluble species larger than a threshold value (e.g. volume equivalent to a sphere of 10 nm in diameter). The model keeps track of the fraction of nucleated INPs and uses it to increase the lower limit of the contact angle distribution once the most efficient INPs nucleate ice. The contact angle distribution is updated every time mixing and entrainment processes replenish the cloud with fresh INPs (Tonttila et al., 2022).
Production rates of secondary ice particles are modelled as the product between the ice multiplication factor (IMF) and the occurrence of SIP events per unit of time. A collision between two hydrometeors of size Dl and Dm is categorized as a SIP event if the relative size and phase of interacting hydrometeors satisfies triggering conditions that depend on the SIP mechanism. More information about the model treatment given to SIP rates can be found in Sect. S2 of the Supplement. In this study we employed the parameterization of Hallet and Mossop (1974) and Phillips et al. (2018, 2017b) modified by Grzegorczyk et al. (2025a) (see Eqs. S5–S6) to calculate IMF values due to rime splintering (SIP–RS), droplet shattering (SIP–DS) and ice–ice collisional breakup (SIP–IIBR). IMF values related to SIP-DS rates include secondary ice formation during spherical drop freezing or mode 1 and also during collisions of supercooled raindrops with more massive ice or mode 2, whose representations are supported by the laboratory studies of Keinert et al. (2020) and James et al. (2021), respectively. IMF values related to SIP–IIBR also consider the recent experimental findings of Grzegorczyk et al. (2023). There are other IMF parameterizations available for the SIP–DS and SIP–IIBR mechanisms (e.g. Lawson et al., 2015; Sotiropoulou et al., 2021) that were not considered in this study but have been implemented in UCLALES-SALSA as reported in Table S4.
Parametrizations for IMF and triggering conditions reported in literature vary widely for a single mechanism. Because these differences affect SIP rates, we have set up a common set of modeling constraints reported in Tables S1 and S2 in the Supplement. After a secondary ice production event, secondary ice particles follow a number size distribution of the power-law type D−3 with D equal to the hydrometeor size (i.e. diameter or maximum length). Secondary ice particles are located in ice bins smaller than the hydrometeor that generates them. In all cases, collision kernels are calculated using settling velocities that depend on air properties and diameter in the case of droplets (Beard, 1976), and also on the crystal habit whose mass-diameter and area-diameter relationships vary according to the rime fraction in the case of ice particles (Khvorostyanov and Curry, 2002; Morrison and Milbrandt, 2015).
A key point for the successful modelling of SIP processes is to accurately simulate the mass distribution of secondary ice particles. There is a single laboratory study providing size distributions for secondary ice particles generated after graupel-graupel and graupel-snowflake collisions. Although these distributions described the general trends in fragment sizes, they are applicable for a very specific subset of hydrometeor collisions, and are limited by the low number of experiments and in the detection of ice fragments with sizes below 25 to 30 µm (Grzegorczyk et al., 2025a).
In this study, we assumed that the rime splintering mechanism generates single-size ice crystals in the shape of hexagonal columns with a maximum length of 10 µm and mass of 3.1227 × 10⁻¹³ kg. We used the mass-diameter relationship in Bühl et al. (2019) to calculate the mass of a splinter. We assumed that the mechanisms of droplet shattering and ice–ice collisional breakup generate ice crystals that can range in size from 2 µm to nearly as large as the fragmenting hydrometeor (i.e. supercooled droplet or ice crystal). We distribute the total number of secondary ice particles produced by a collision between two hydrometeors of size Dl and Dm between size bins smaller than the fragmenting hydrometeor in such a way that each bin gains the same amount of mass. This means that secondary ice particle size distribution follows a D−3-power law distribution with a minimum fragment size D of 2 µm. This relationship aligns with the model of fractal crushing used to describe the scale-invariant low energy fragmentation of brittle materials (Palmer and Sanderson, 1991; Weiss, 2001; Åström et al., 2021).
This initial size distribution guarantees that secondary ice particles cover the wide size range observed by airborne in situ optical and imaging system going from small faceted ice crystals and single dendrite branches up to fragments of frozen drops or broken stellar crystals (e.g. Schwarzenboeck et al., 2009; Korolev and Leisner, 2020). It is also particularly useful to mimic the variety of fragmentation pathways observed in laboratory experiments during the freezing of drizzle-size droplets. Droplets of the same size, freezing in moving air under controlled conditions, can undergo bubble bursting or jetting, cracking, and breakup, sometimes occurring in combination in the same droplet (Leisner et al., 2014; Lauber et al., 2018; Keinert et al., 2020). It is expected then that a hypothetical monodisperse population of freezing droplets generates spicules or small ice crystals due to bubble bursting or jetting, but also large spherical fragments after breakup.
2.3 Model setup
Simulations were performed in a model domain of 28.8 km by 28.8 km by 12 km with horizontal and vertical resolution of 300 and 60 m respectively, and a maximum time step of 1 s. The model domain size was selected based on the surface area covered simultaneously by the GV and Learjet flights on 5 June 2021 (see Fig. S1). This time interval coincides with the early stage of the cloud system in which ice multiplication was observed in the rising cloud tower. Model outputs were taken every 30 s to follow closely changes in cloud microphysics. Aerosol and cloud droplet size distributions were modeled with a sectional representation based on dry diameter ranging from 0.003 to 10 µm across 10 size bins. Cloud droplets correspond to activated aerosols in the last 7 aerosol size bins. Rain droplets were represented using 22 size bins based on wet diameter distributed with a constant volume ratio of 2 with the minimum droplet diameter equal to 20 µm. Ice particles were represented using 23 size bins based on maximum length distributed with a constant volume ratio of 3 with the minimum size equal to 2 µm.
Aerosol properties were derived from size distributions measured below cloud base altitude with the Passive Cavity Aerosol Spectrometer Probe (PCASP-100X) (Heymsfield et al., 2024). Since these observations corresponded to wet aerosols, we had to use the relative humidity, temperature and aerosol hygroscopicity to obtain the size distribution based on dry size. To do so, we used the kappa factor to account for aerosol hygroscopicity and resolved the kappa-Köhler equation (Petters and Kreidenweis, 2007) for each particle size using the temperature and relative humidity of observations. We assumed that dry aerosol particles were spherical and composed of sulphate species and mineral dust in volumetric fractions of 0.901 and 0.099, respectively. This chemical composition corresponds to a species-based kappa value of 0.5496 that is numerically equivalent to the average hygroscopicity parameter kappa derived from Cloud Condensation Nuclei Counter and Scanning-Mobility Particle Sizer measurements at the ARM station in the Southern Great Plains, USA performed on 5 June 2021 (Kulkarni et al., 2024).
PCASP-derived dry aerosol distributions measured below cloud altitude were fitted to a multimodal lognormal distribution and then fed into UCLALES–SALSA. Since the limit for the smallest particle detected with the PCASP-100X is 125 nm ± 5 % (Liu et al., 1992), we added an aerosol mode to account for sub-micron particles missed during observations. This particle mode had a geometric mean diameter of 0.0055 µm in agreement with summer average values reported for the ARM station Southern Great Plains (SGP) and consistent with frequent events of new particle formation (Marinescu et al., 2019). The aerosol size distribution used for model initialization has four particle modes centered at [0.0055, 0.090, 0.440, 1.05]µm, geometric standard deviation of [2.8, 1.44, 1.44, 1.42] and total number concentration of [1085.0, 810.0, 2.48, 4.96] mg−1 at altitudes below 1.2 km. Based on PCASP observations, we accounted for the vertical variability in total aerosol loading assuming an exponential decay function (Eq. 1) between 1.2 and 3.5 km to scale down the total aerosol number concentration (see Fig. S2).
We used a contact angle distribution centered at 132° with variance of 20° to account for ice nucleating abilities for mineral dust as in Savre et al. (2014). This set of parameters allowed us to match observed ice nucleating particle concentrations with ice number concentrations simulated in a scenario that did not consider secondary ice production. Details about this are presented in Sect. S4 of the Supplement.
Atmospheric properties used for model initialization were derived from hourly ECMWF–ERA5 reanalyzed data for 05 June 2021 for a horizontal domain of 1° by 1° that encloses flight trajectories for our selected case (Hersbach et al., 2024). Temperature and humidity profiles were adjusted to reproduce the observed cloud base conditions (e.g., altitude, pressure, and temperature). Atmospheric conditions at higher altitudes were modified to test different values of convective available potential energy (CAPE) and equilibrium level (EL) or level of neutral buoyancy in order to reach the observed cloud top altitude. The optimal sounding is shown in Fig. 1. Information about the model sensitivity analysis can be found in Sect. S5, simulation scenarios tested are described in Table S3 and atmospheric soundings are presented in Fig. S4.
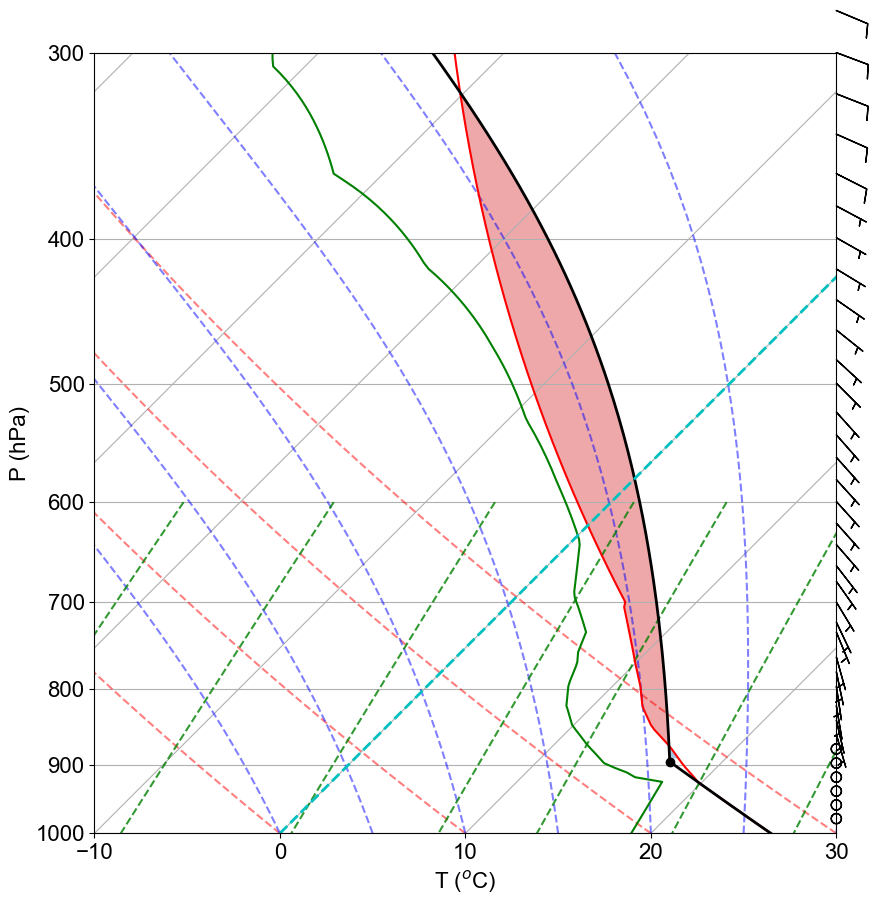
Figure 1Vertical profile of atmospheric variables in a skew T-log P diagram including temperature (red) and dew point temperature (green) profiles as well as the CAPE (red shaded area) and lifting condensation level (LCL, black dot). Conditions correspond to a CAPE of 763.7 J kg−1 and an equilibrium level (EL) of 318.9 hPa and −30.2 °C.
Convective buoyancy was emulated adding additional sensible and latent heat to the surface fluxes by means of a Gaussian distribution with a maximum of 600 W m−2 and a linear variance of 2000 m around the domain center. Surface fluxes were increased 1 h after the beginning of the simulation to initiate convection.
2.4 Model-observation comparison methodology
The comparison focuses on observations taken between 19:55 and 20:15 UTC during cloud penetrations into updraft cores with the presence of liquid water. During this time interval, both flights examined the same system of ascending cumulus congestus towers as shown in Fig. S1 of the Supplement. Cloud penetration in the GV flight covered conditions from below cloud base altitude up to 3.5 km. Cloud penetrations in the Learjet flight went as deep as 300 m below the cloud top altitude where the temperature reached a minimum of 255.6 K. While ice number concentrations (INC) were as high as 2351 L−1, number concentrations of ice nucleating particles (INP) only reached a maximum of 1 L−1 at 255.1 K indicating that secondary ice production was active and responsible for the ice concentration in updraft cores. Images taken with the Cloud Particle Imager (CPI) and the Optical Array Probe (OAP) during the Learjet cloud penetrations showed pieces of fragmented frozen drops coexisting with 100–300 µm stellar dendrites and hexagonal plates ice crystals likely formed from monocrystalline ice particles (Lawson et al., 2023b). The profuse amount of small columnar particles and the presence of fragmented frozen drops in measurements from the CPI and OAP imaging systems, combined with the occurrence of high reflectivity regions in Ka-band Doppler radar profiles characteristic of large water drops, support the hypothesis that the droplet shattering was mainly responsible for the observed ice multiplication (Lawson et al., 2023b). The coexistence of fragmented frozen droplets and small ice crystals of around 100 µm in maximum length was also observed at 256.25 K in young convective updrafts of cumulus congestus during the RF06 flight of the SPICULE campaign (Patnaude et al., 2025).
It is extremely challenging to determine the exact size and shape of freshly generated secondary ice particles by laboratory experiments or airborne in situ observations. It is expected that secondary ice particles vary across a wide range of sizes and shapes reflecting not only the nature of the ice fracturing mechanism but also the changes induced by their growth after water vapor deposition. Using airborne in situ observations, Korolev et al. (2020) found that small faceted ice crystals with sizes smaller than 100 µm can be used as tracers of SIP events. A small secondary ice particle is likely to be monocrystalline (e.g. as fragments of frozen drops or dendrite branches) (Korolev and Leisner, 2020) that can regrow by water vapor deposition to acquire the crystal habits of pristine ice particles. Small secondary ice particles can have shapes that go from plates to long columns depending on the residence time, temperature and ice supersaturation conditions in the environment where they were originated.
Observations were grouped by altitude and temperature to simplify their graphical representation in comparison plots. Model outputs were conditionally sampled selecting only grid points with a liquid water content (LWC) greater than the threshold value of 0.01 g m−3 and vertical wind (w-wind) stronger than 0.02 m s−1 to be consistent with the analysis of observational data during cloud penetrations. When observations indicated mixed phase conditions, we considered an additional constraint on the ice water content (IWC) above a threshold value of 0.001 g m−3. To compare hydrometeor size distributions, we selected cloudy grid points of the model layer with the closest agreement between the modeled and observed temperature.
We compared results from simulation scenarios that were initialized in the same way but accounted for different ice production mechanisms. In the SIP-OFF scenario, ice production was solely driven by the immersion freezing mechanism via ice nucleating particles (i.e. only primary ice production). The SIP-ON scenario additionally included ice production from the secondary mechanisms of rime splintering, droplet shattering (mode 1 and mode 2 of Phillips et al., 2018) and ice–ice collisional breakup. In this way, the differences between scenarios reflect changes in cloud dynamics triggered by the occurrence of secondary ice production processes.
Based on the observational evidence from CPI and OAP images discussed earlier, we ran two simulations: one considering only the SIP mechanism of droplet shattering, and another that also included the rime-splintering mechanism. These simulations showed good agreement between modeled and observed droplet size distributions guaranteeing a realistic onset for the production of secondary ice from supercooled droplets. However, SIP-DS rates alone or with or SIP-RS contributions could not reproduce the observed ice enhancement in the SPICULE-RF04b case. Ice enhancement in these conditions required the synergistic action of multiple SIP mechanisms. Once we added the mechanism of ice–ice collisional breakup to the previous scenarios, SIP rates increased allowing closure between modeled and observed ice number concentrations (observations from the Learjet flight reported in Table 4 and Fig. 10 of Lawson et al. (2023b) also shown here in Fig. 5). For the sake of completeness, we include here only the results from the simulation involving the three SIP mechanisms referred to as the SIP-ON scenario. A summary of the results from other scenarios is included in Section S5 of the Supplement, vertical profiles of SIP rates per mechanism are compared in Fig. S5.
3.1 SIP effects on cloud development and geometry
During the simulation time, SIP processes caused small changes in the cloud base conditions. The average cloud base altitude in our simulations was 1498 and 1326 m with temperatures of 288.1 and 289.1 K, in the SIP-ON and SIP-OFF scenarios respectively. Both agree reasonably well with the observed altitude and temperature of 1180 m and 290.65 K (Lawson et al., 2023b). The variability in modeled cloud base conditions should not be interpreted as model uncertainty. Differences in the cloud base altitude and temperature reflected the cloud dynamical response along the simulation, in particular the changes related to surface precipitation with stronger rates in the SIP-ON scenario.
The extent of the deep convective core was calculated adding up those grid cells with total water path (TWP) above a threshold value of of 1500 g m−2. In both simulation scenarios, time series of the convective system area evolved similarly with minimal differences. At the beginning, just 10 min after we increased surface turbulent fluxes to induce convection, our simulations showed the development of individual convective cells of approximately 1000 m of diameter covering an area of 1.7 km2. 30 min later, when the total water path has reached a global maximum of 20 000 g m−2, the convective area has grown to be 9.45 and 10.17 km2 in the SIP-OFF and SIP-ON scenarios, respectively. This continued to reach maximum values of 16.7 and 17.3 km2 at 60 min.
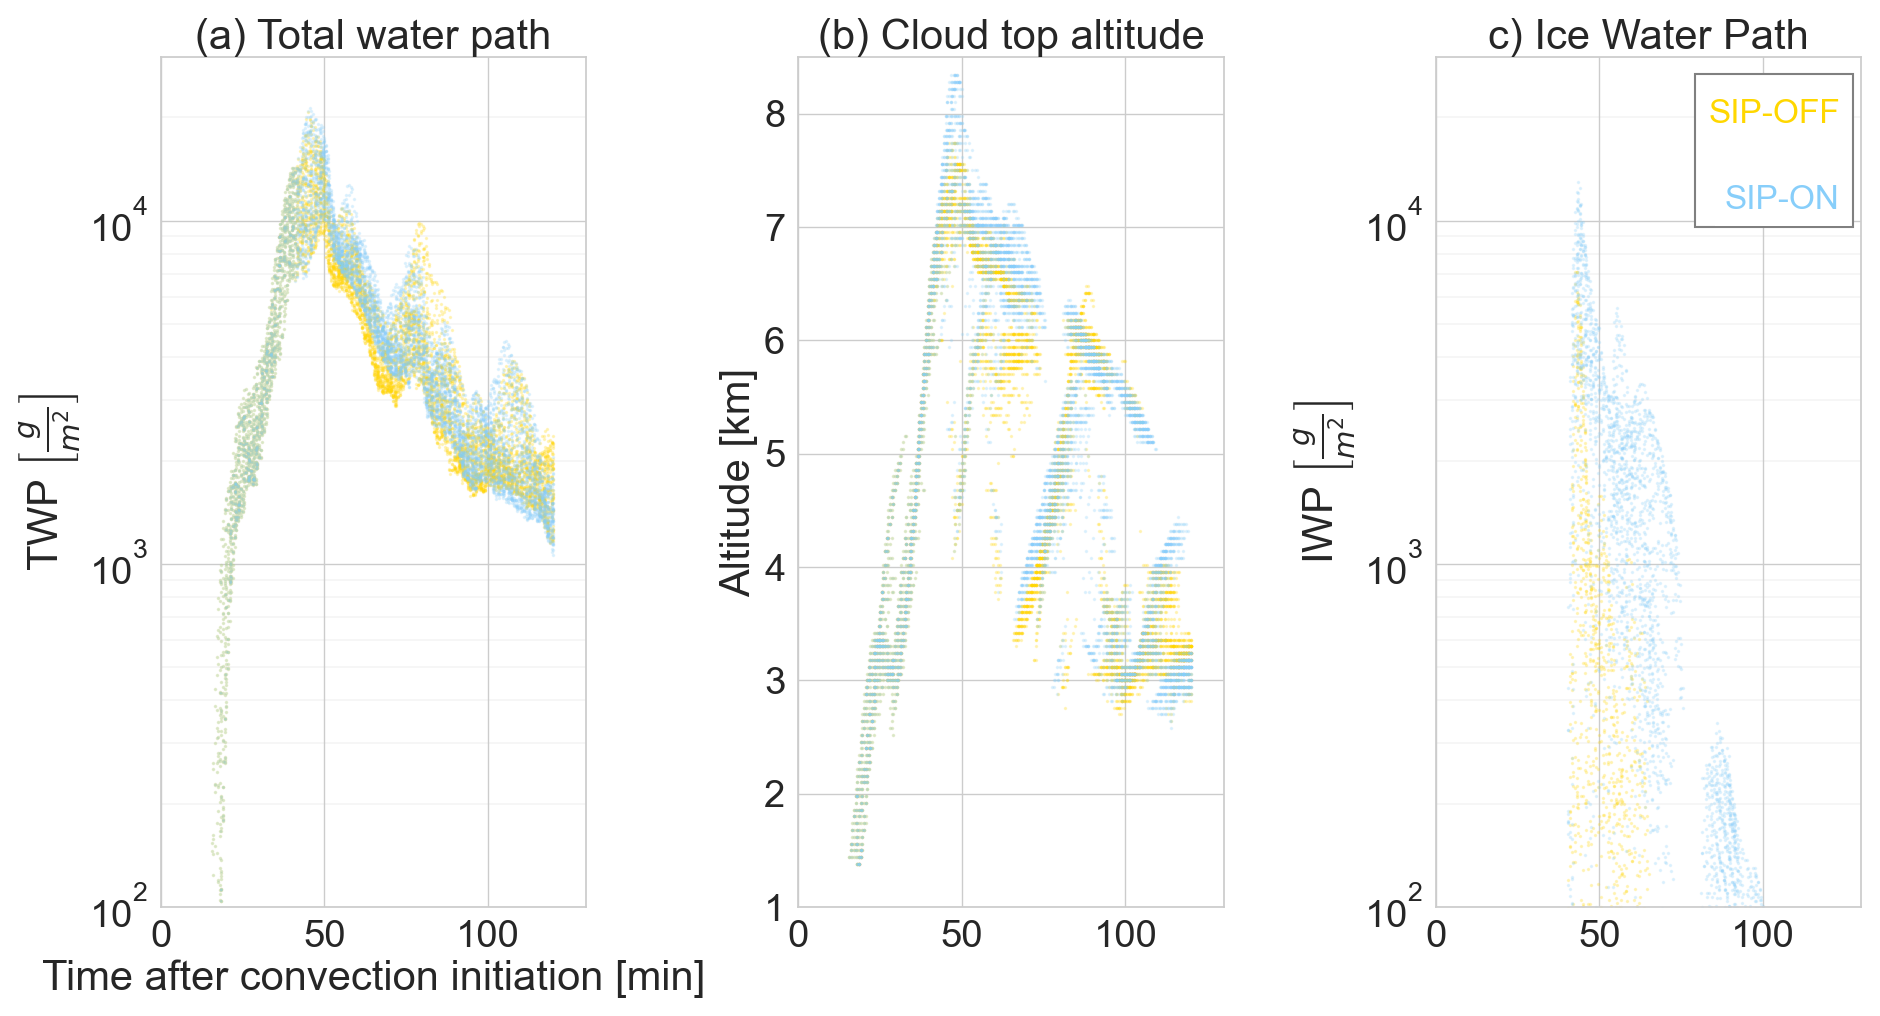
Figure 2Variability in cloud properties in simulation scenarios without and with secondary ice processes. (a) Total water path. (b) Cloud top altitude. (c) Ice water path. Scatter points correspond to the twenty tallest cloud columns in the model domain per simulation output.
Despite these commonalities between simulation scenarios, once the deep convective core had risen above freezing level, SIP processes caused noticeable changes in cloud geometry, phase structure and microphysics, particularly at the mixed-phase cloud section. Figure 2 depicts the total water path (TWP), cloud top altitude and ice water path (IWP) in the deep convective core (i.e. model columns with the highest TWP values) and reflect the pulsating growth habit that is characteristic of cumulus clouds. During the convective initiation stage, cloud tower conditions in the SIP-ON scenario corresponded to higher total water contents (Fig. 2a) and higher altitudes (Fig. 2b) with the cloud phase shifted towards ice due to higher ice water content values (Fig.2c). Peaks in TWP are indicative of convection intensity and can be characterized by its occurrence time and duration. The SIP-ON scenario showed taller and wider peaks suggesting a slower weakening of the convection intensity along the simulation compared to the SIP-OFF scenario. 50 min after convection initiation, there was a reduction in TWP values due to surface precipitation. It was noticeable that the SIP-OFF scenario did not produce as much ice as the SIP-ON scenario after 60 min.
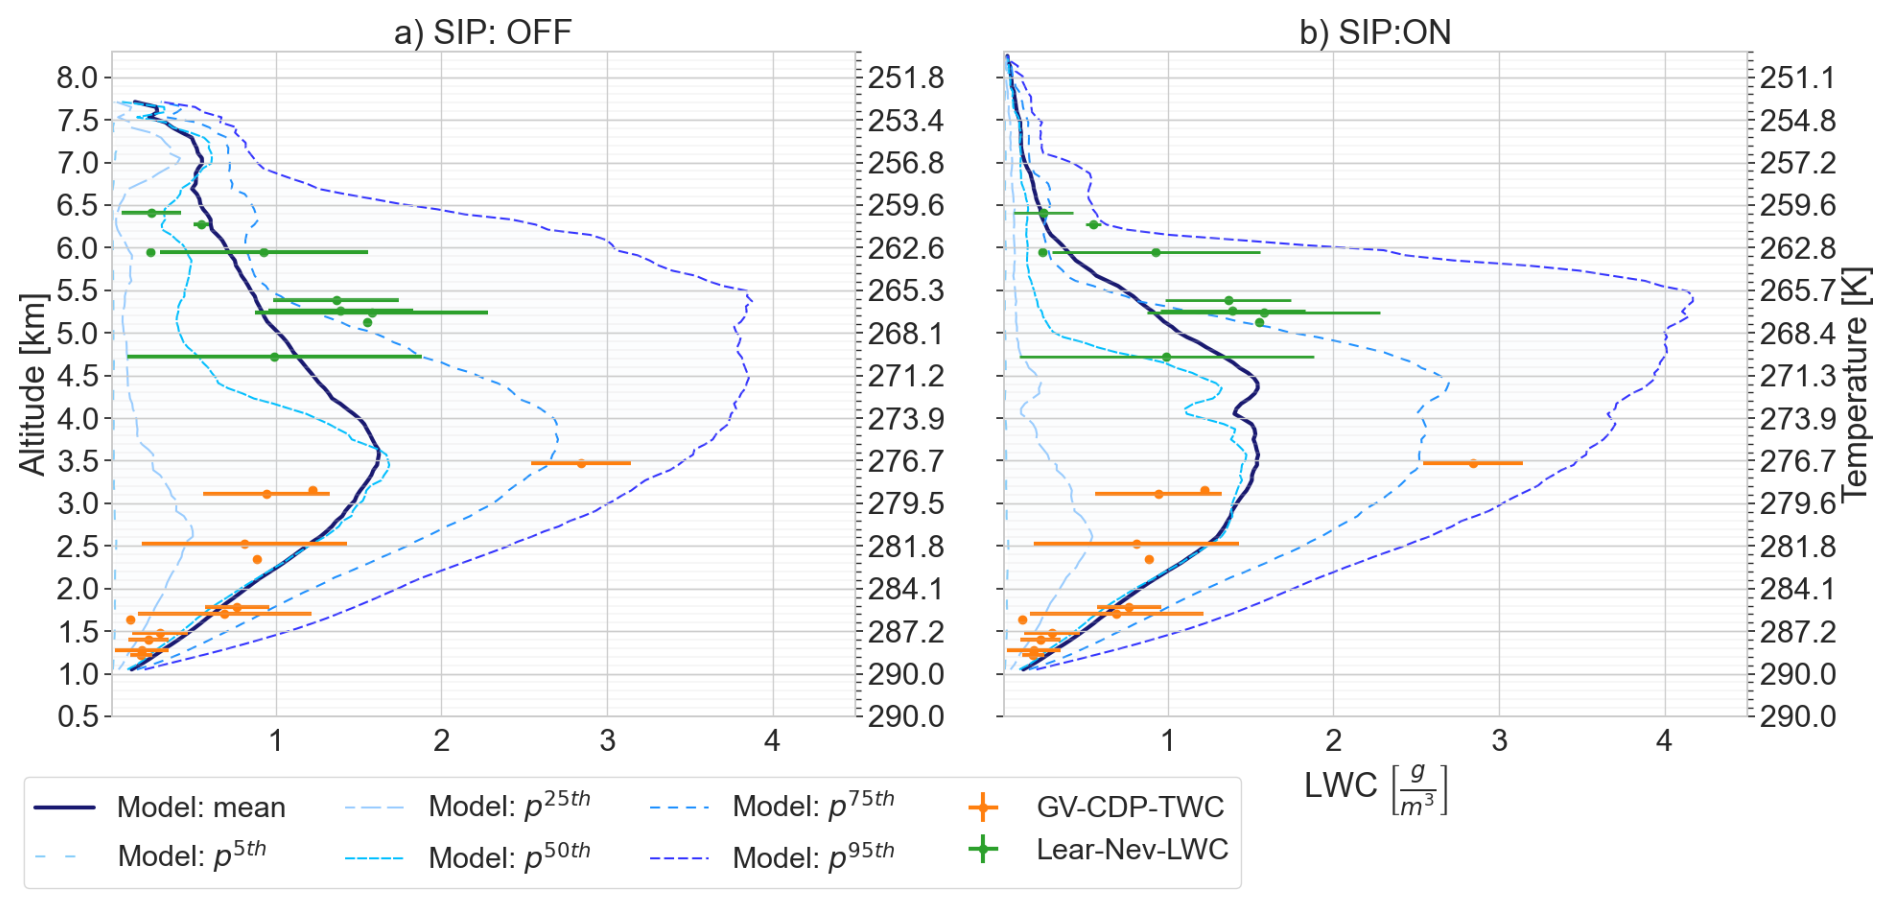
Figure 3Vertical profile of liquid water content in updrafts with cloudy conditions. The variability in model outputs is depicted using the mean and main percentiles values while observations are shown as the mean ± standard deviation for measurements with the Fast Cloud Droplet Probe in the GV-flight (GV-CDP) and with the SkyPhysTech Nevzorov Probe in the Lear35 flight (Lear-Nev). (a) Simulation scenario without secondary ice processes. (b) Simulation scenario with secondary ice processes including rime splintering (RS), droplet shattering (DS) and ice–ice collisional breakup (IIBR).
Secondary ice processes in the SIP-ON scenario not only affected the cloud geometrical thickness and cloud top conditions, they also affected the liquid and ice water content profiles. For example, Fig. 3 compares the variability in modeled and observed vertical profiles of liquid water content in updraft cores. Modeled mean values are represented together with the main percentiles of the variable distribution, while observations are represented with mean and standard deviations. The spatial heterogeneity of mixed-phase conditions along the model domain agreed with the variability observed during different cloud penetrations. The distribution of liquid water in updraft cores in the mixed-phase region (i.e. between freezing level and cloud top) was better represented in the SIP-ON scenario. Although, the differences in the LWC vertical profiles of the SIP-OFF and the SIP-ON scenarios were minimal in the warm section between cloud base and 2.5 km of altitude, they increased at higher altitudes and became particularly important above 3.5 km in the proximity of the freezing level located approximately at an altitude of 4 km. Differences in the mean LWC values of the SIP-ON scenario compared to the SIP-OFF scenario can be grouped in three trends, slightly lower liquid water contents in the warm cloud section (i.e. between 3 and 4 km), higher liquid water content at the beginning of the mixed phase part of cloud tower (i.e. between 4 and 6 km) and lower liquid water content at the tower top (i.e from 6 up to 8.5 km).
3.2 SIP effects on cloud microphysics
Modeled droplet size distributions in cloudy updrafts agreed with in-cloud observations from several instruments as shown in Fig. 4. Modeled and observed droplet size distributions were conditionally sampled to represent cloudy conditions in convective updrafts (i.e. LWC > 0.01 g m−3 and updraft velocity > 0.02 m s−1). Each modelled size distribution in Fig. 4 is from the layer where the temperature was closest to observed values. Figure 4 displays the variability in droplet size distributions in the warm cloud section. Observed and modeled binned droplet number concentrations for droplet sizes above 20 µm in diameter are in agreement. This suggested that the model captured well the liquid droplet growth processes. In both scenarios, the model showed a systematic negative deviation in droplet number concentrations for droplets with diameter below 10 µm that was more relevant at 3.5 km as shown in Fig. 4c. It is difficult to point out if the cause of this deviation is related to our modelling treatment for droplet activation or limited resolution to capture possible activation in the entrainment process at cloud edges, or if the FCDP was falsely registering droplets in the smallest channels as indicated by Lawson et al. (2023b).
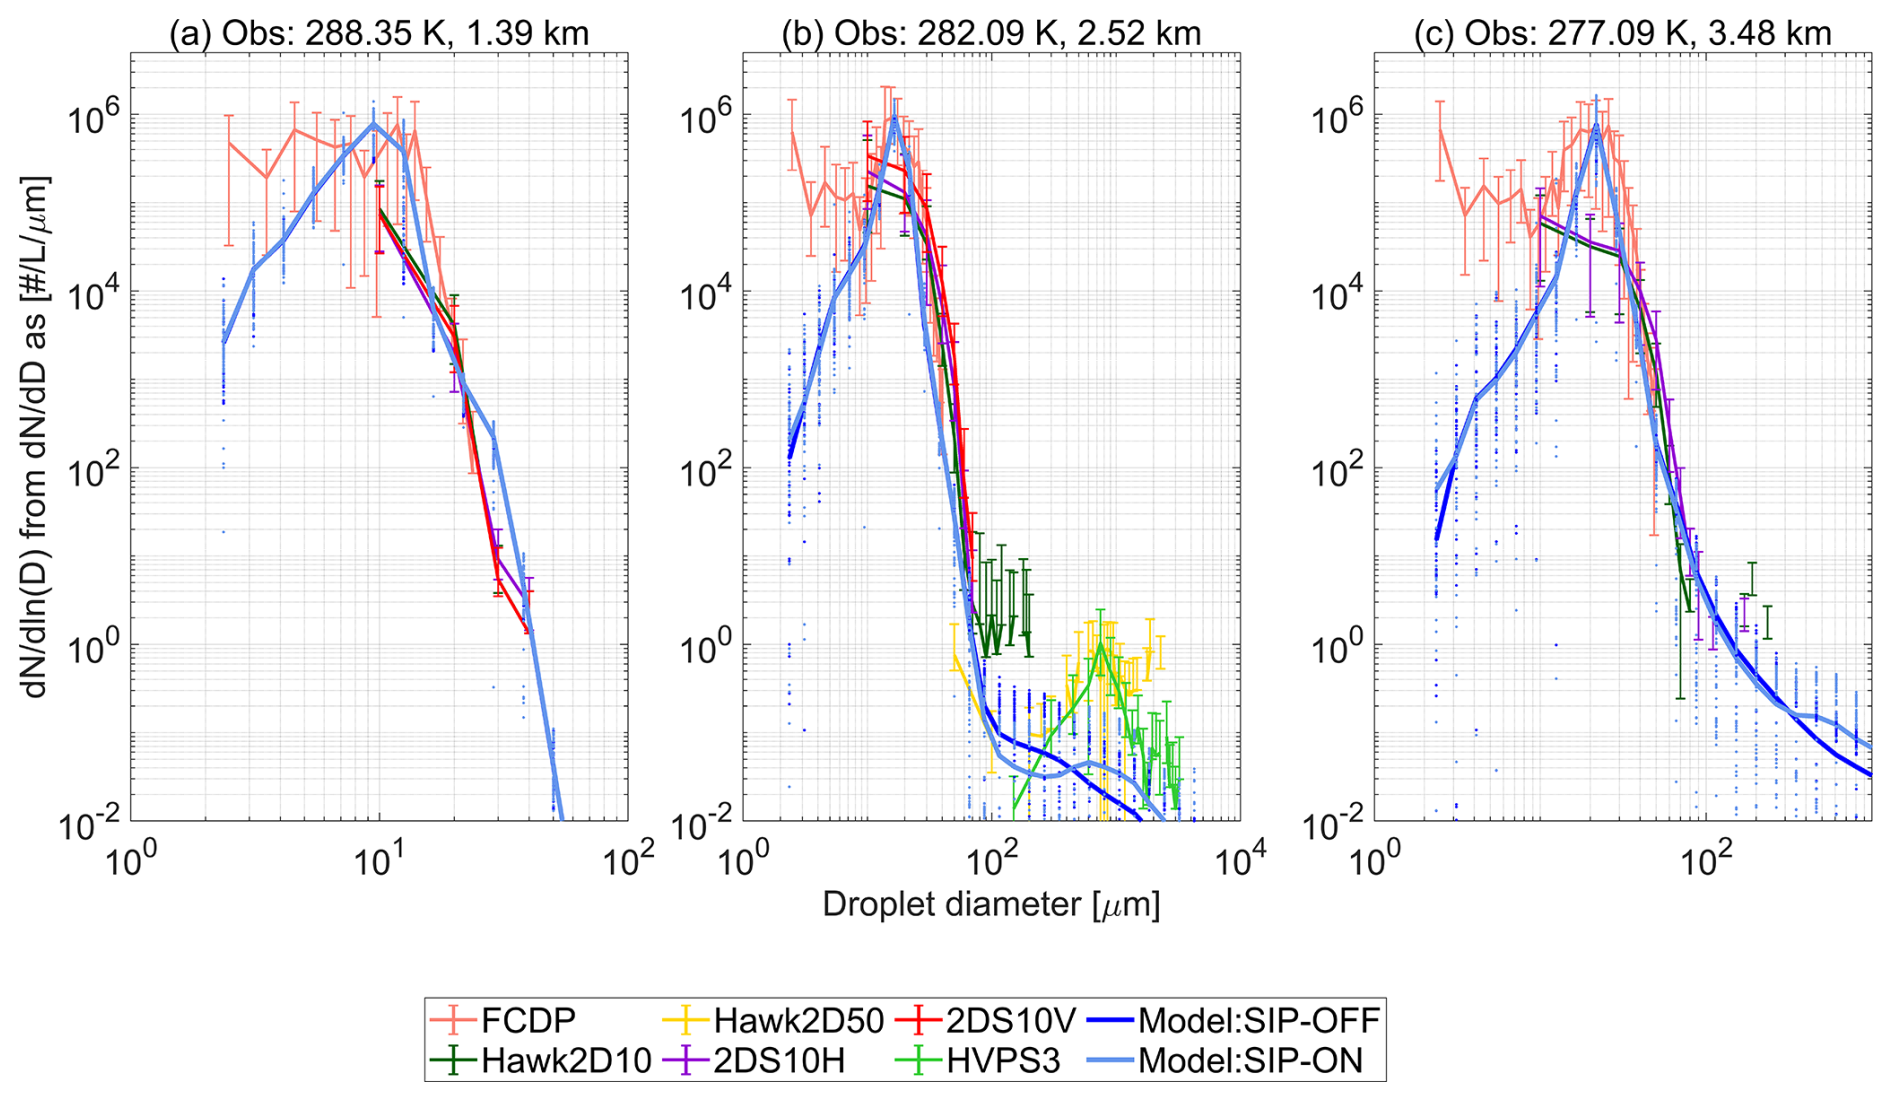
Figure 4Droplet size distributions in updrafts at the following altitudes (a) cloud base, (b) 1 km above cloud base, (c) 500 m below freezing level. Observations are shown as mean values with error bars going from the 50th to the 99th percentile and labeled according to the nomenclature described in Table S1. Modeled values are shown as mean horizontal values with dotted lines along size bins indicating variability across cloudy points with LWC > 0.01 g m−3 and updraft velocity > 0.02 m s−1.
In terms of the secondary ice production effects at cloud base altitude, the average droplet size distribution in updrafts for droplets with diameter below 100 µm did not change between the SIP-OFF and the SIP-ON scenarios as seen in Fig. 4a. At higher altitudes, average droplet size distributions changed progressively with increasing altitude indicating a reduction in binned number concentrations of droplets with diameter above 50 µm or below 10–15 µm as seen in Fig. 4b and c. These claims were also valid for other altitudes as shown in Figs. S6–S8. UCLALES-SALSA has also showed good performance reproducing observed droplet size distributions in stratocumulus clouds (Calderón et al., 2022).
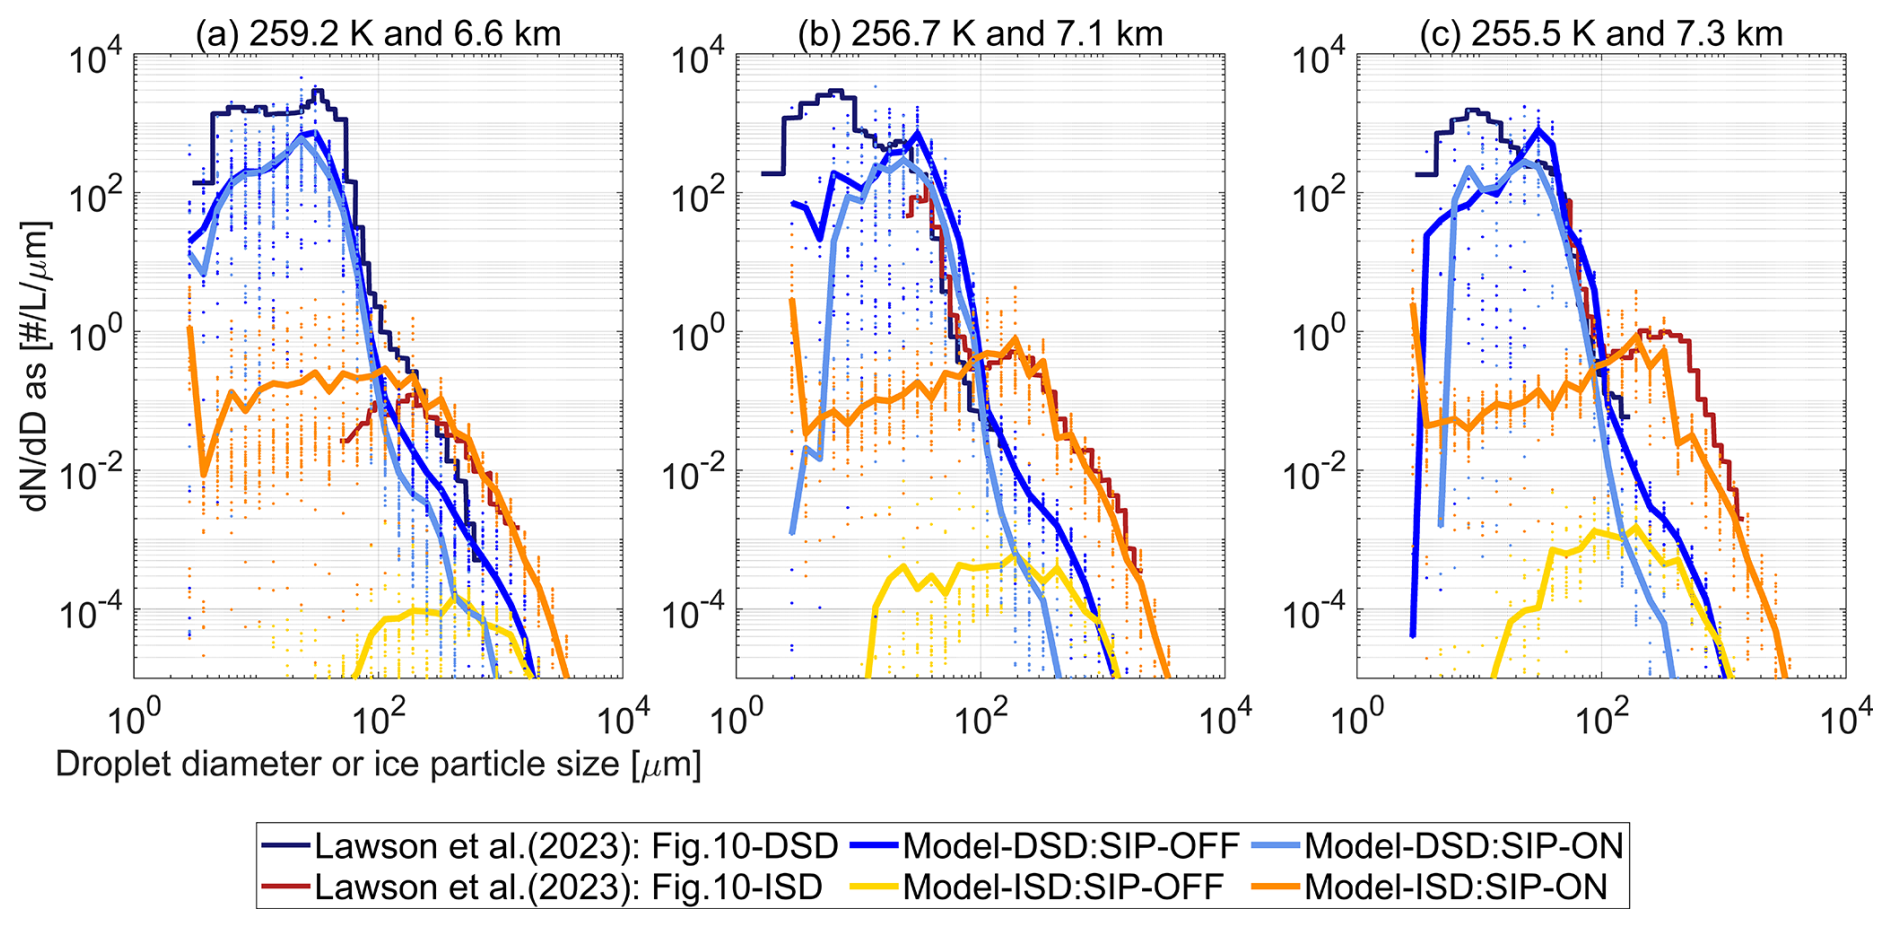
Figure 5Ice particle size distributions in updrafts at altitudes of (a) 2.6 km above freezing level (b) 3.2 km above freezing level (c) 400 m below cloud top. Observations were taken from Fig. 10 in Lawson et al. (2023b). Modeled values are shown as mean horizontal values with dotted lines along size bins indicating variability across cloudy points with mixed-phase conditions defined as LWC > 0.01 g m−3, IWC > 0.001 g m−3 and updraft velocity > 0.02 m s−1.
Figure 5 compares modeled and observed hydrometeor size distributions at high altitudes inside cloud turrets. Since the only source of ice particles in the SIP-OFF scenario was the immersion freezing mechanism, we considered that modeled ice number concentrations were directly proportional to primary ice production rates and reflected background ice concentrations given by INPs. The differences in binned ice number concentrations between the SIP-ON and the SIP-OFF scenarios indicated ice multiplication effects of up to three orders of magnitude. Beyond, the modelled ice size distributions in the SIP-ON scenario overlapped very well with the ones observed at different altitudes. This indicated that the model was able to capture both the changes in number and also size of ice particles giving support to the modelling treatment used to describe the size distribution of freshly generated secondary ice particles. Ice particle number concentrations per size bin varied by more than an order of magnitude suggesting that the variability in convective intensity was an important factor driving the occurrence of SIP events via hydrometeor collisions.
Besides the reproduction of the ice multiplication effects, the model gave also a close description of the droplet size distribution in the drizzle–rain droplet size range. SIP processes reduced number concentrations of droplets larger than 50 µm in diameter due to their participation in SIP events via collisions with ice particles during droplet shattering (i.e. a limit of 50 µm was selected for effective droplet fragmentation following experiments; Wildeman et al., 2017). This reduction increased at higher altitudes where the temperature was favorable for ice multiplication via droplet shattering (Phillips et al., 2018). Droplets above 50 µm in diameter can also participate in SIP events by rime splintering but IMF values are minimal outside the optimal temperature range of 265–270 K of SIP–RS.
3.3 SIP effects on cloud phase structure
SIP processes affected cloud dynamics in such an impactful way that it is impossible to convey temporal and spatial differences between the SIP-OFF and SIP-ON scenarios in two-dimensional graphical representations. First, we focus on the time interval before the cloud reached the strongest peak in convection intensity developing a distinctive cloud tower or turret, until the time instance at which simulations scenarios started to deviate substantially from each other in terms of thermodynamic cloud phase and cloud extent (i.e. between 40 and 50 min after convection initiation). Second, although these changes affected the entire three-dimensional cloud structure, for the sake of simplicity, we focus on the two-dimensional space enclosing the model column with the highest TWP value, which in turn shows the conditions that are representative of the deep convective core.
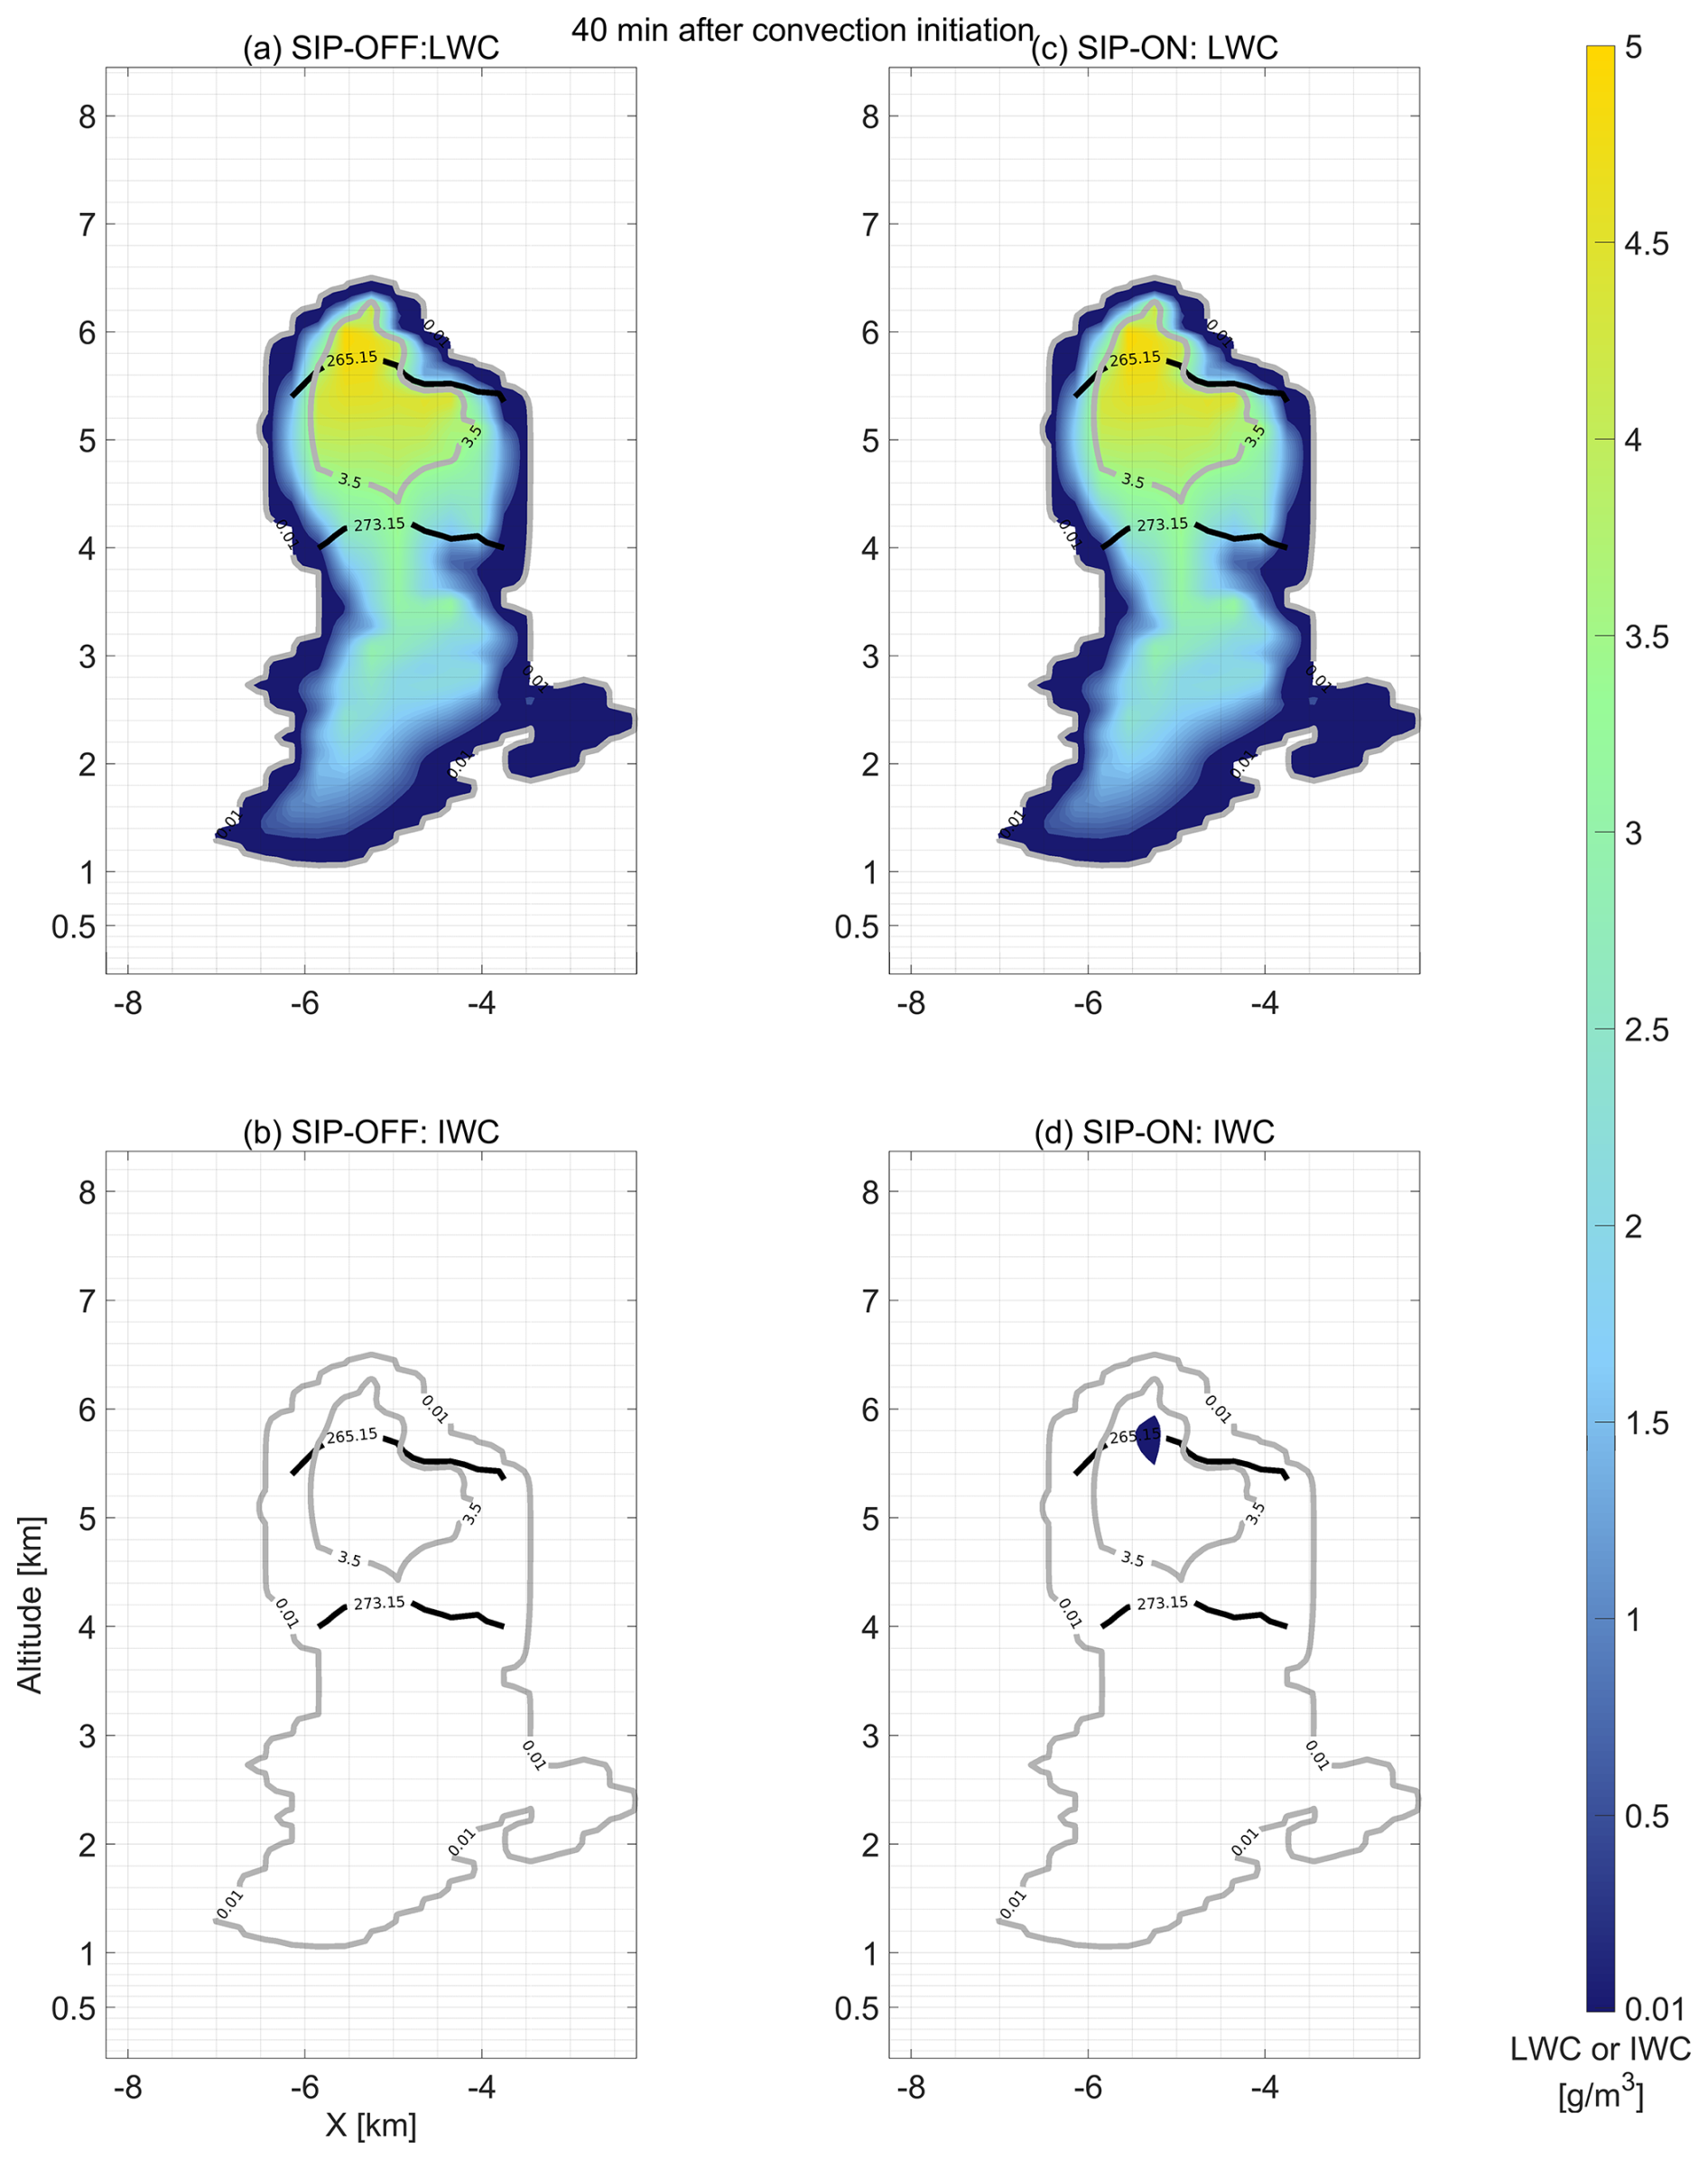
Figure 6Vertical profile of liquid water content (LWC) and ice water content (IWC) at 40 min after convection initiation. Contour lines in gray indicate Total Water Content (TWC) values of 0.01 and 3.5 g m−3 to enclose cloudy and core conditions. Continuous black lines indicate altitudes at which temperatures are 273.15 and 265.15 K corresponding to freezing and maximum ice multiplication by rime splintering, respectively. (a–b) Simulation scenario without secondary ice processes. (c–d) Simulation scenario with secondary ice processes.
We have chosen the time instances of 40, 43 and 46 min to follow the changes in the vertical profiles of LWC and IWC in correlation with changes in the vertical wind and SIP rates. Figure 6a, c compares liquid water contents at 40 min after convection initiation indicating larger values above freezing level for the SIP-ON scenario (i.e. wider area with TWC > 3.5 g m−3). It was at this time instance when IWC values overpass the threshold (i.e. IWC > 0.001 g m−3) even the cloud top had reached freezing conditions 5 min earlier. Areas containing ice are depicted in Fig. 6b, d. Rates of secondary ice production were observed at the top of the cloud turret with effects over larger areas and higher rates for the mechanism of droplet shattering compared to the rime splintering as shown in Fig. 7.
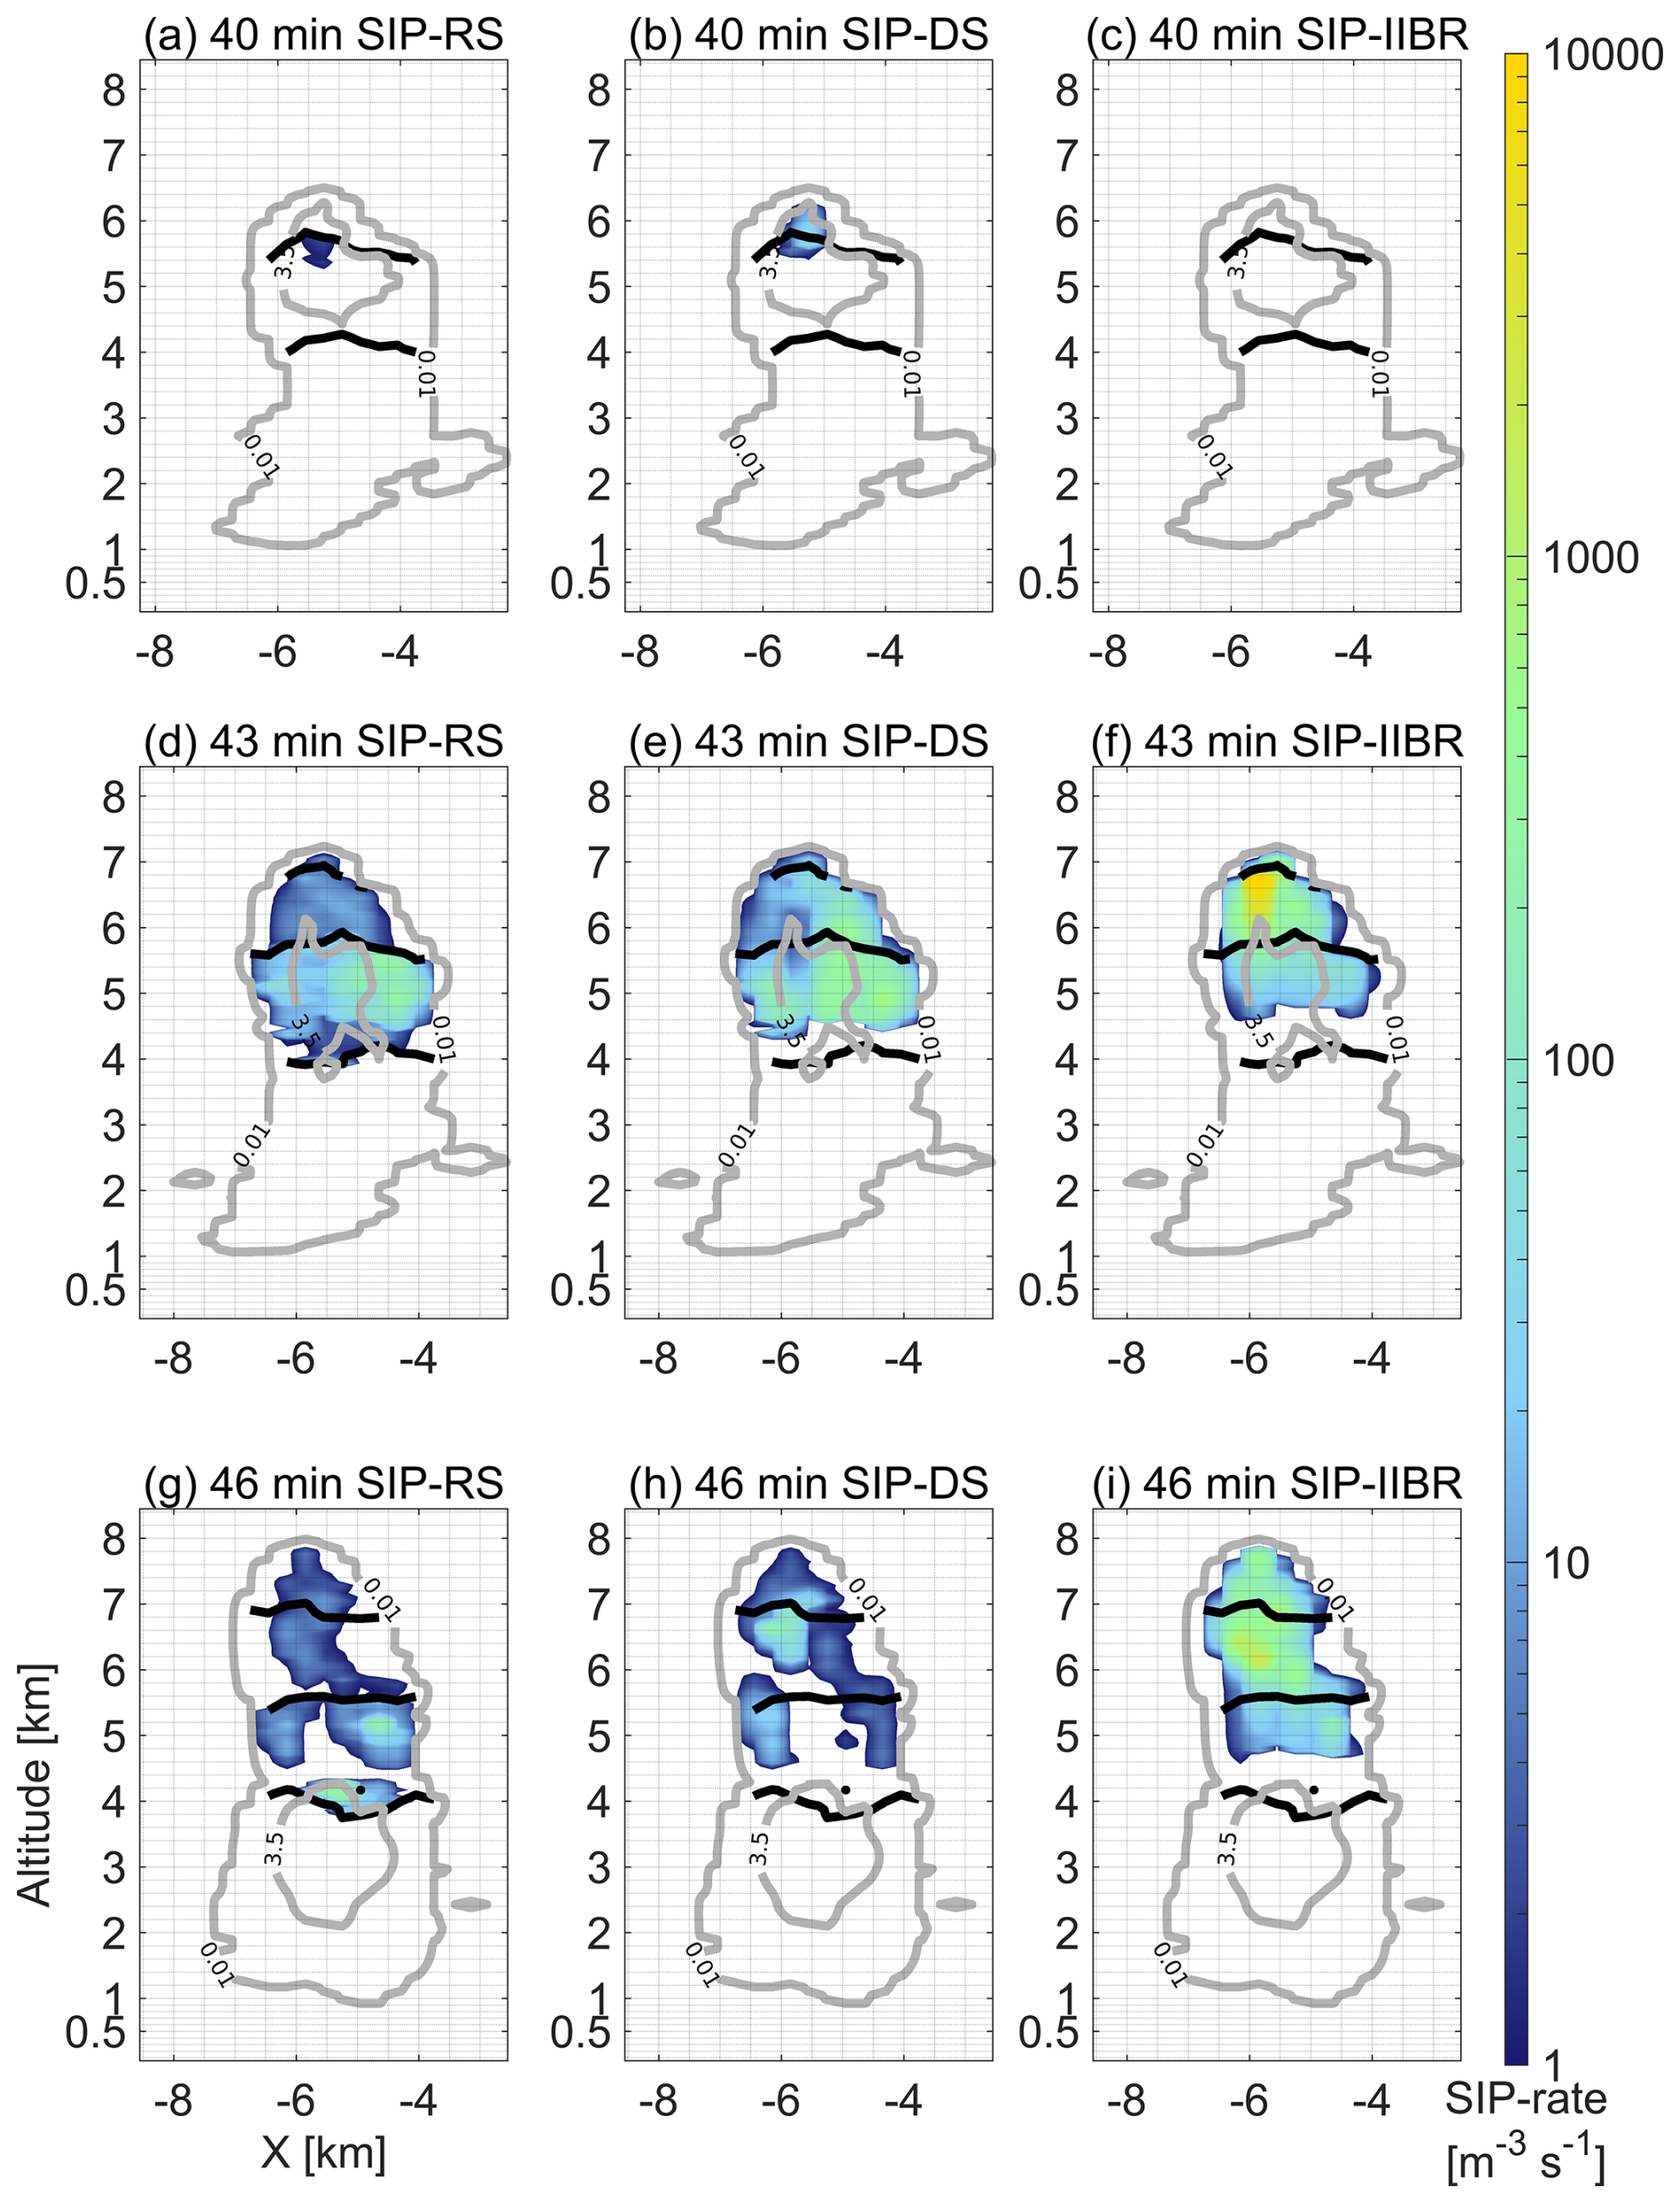
Figure 7Vertical profile of secondary ice production rates at 40, 43, and 46 min after convection initiation in the SIP-ON scenario. Contour lines in gray indicate Total Water Content (TWC) values of 0.01 and 3.5 g m−3 to enclose cloudy and core conditions. Continuous black lines indicate altitudes at which temperatures are 273.15, 265.15 and 258.15 K corresponding to freezing, maximum ice multiplication by rime splintering and by droplet shattering, respectively. (a, d, g) SIP mechanism of rime splintering (RS) (Hallet and Mossop, 1974), (b, e, h) SIP mechanism of droplet shattering (DS) (Phillips et al., 2018), (c, f, i) SIP mechanism of ice–ice collisional breakup (IIBR) (Phillips et al., 2017b; Grzegorczyk et al., 2025a).
These findings are consistent with those from in-cloud observations in two different ways. First, the temperature at which ice formation started in the SIP-OFF scenario is consistent with the ice nucleating abilities observed for aerosol particles collected during our case study (i.e. INP concentrations were measurable below 259.15 K, see Fig. S3) (Lawson et al., 2023b). Second, the mechanism of droplet shattering was active at the tallest and coldest point of the cloud turret indicating that there were collisions between ice particles and supercooled droplets with diameter above 50 µm at 258.15 K (i.e. these are limiting conditions of SIP events by this mechanism in our modelling framework). This agrees with the first detected presence of large frozen droplets at 259.15 K during cloud penetrations (Lawson et al., 2023b).
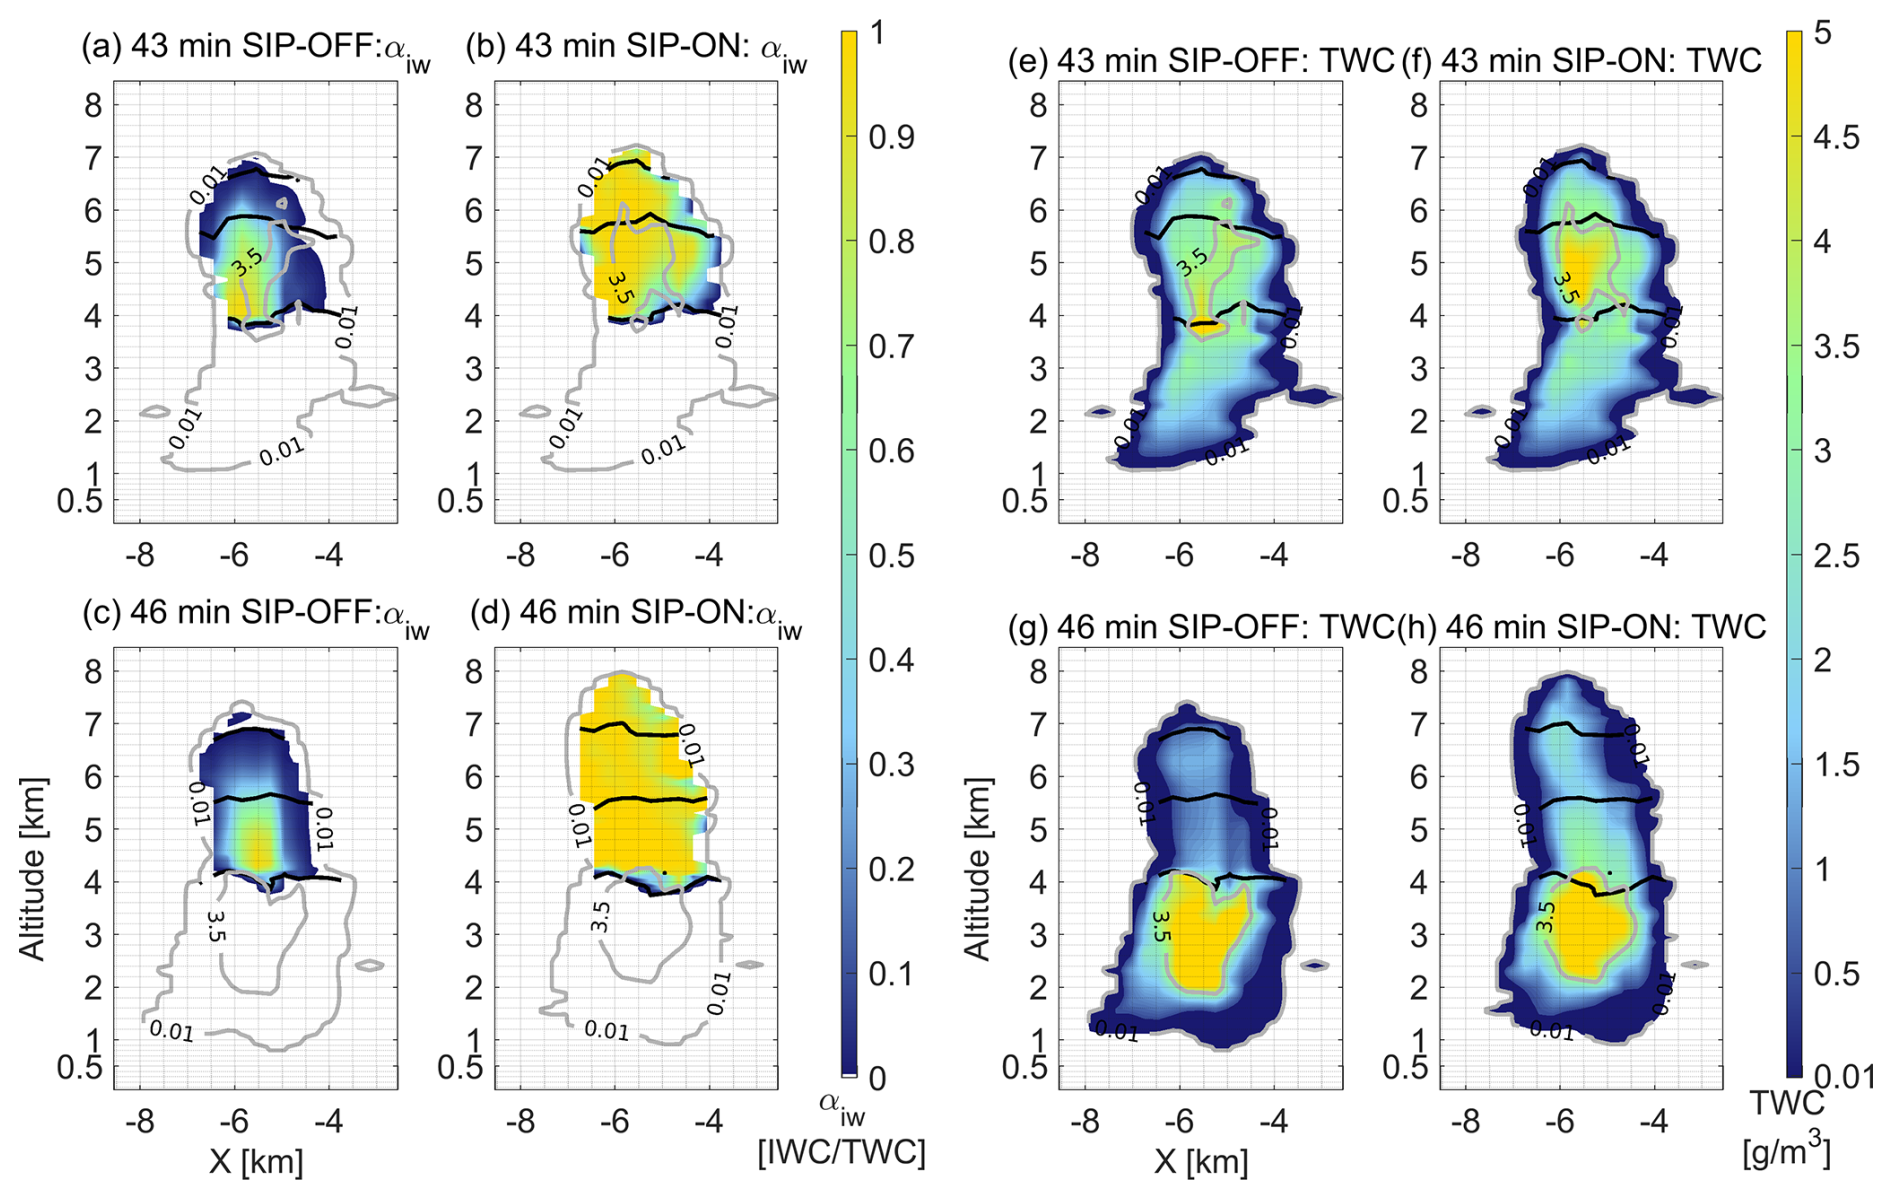
Figure 8Vertical profile of mixed-phase conditions represented by the cloud phase partitioning factor and total water content (TWC) at 43 and 46 min after convection initiation. Contour lines in gray indicate Total Water Content (TWC) values of 0.01 and 3.5 g m−3 to enclose cloudy and core conditions. Continuous black lines indicate altitudes at which temperatures are 273.15, 265.15 and 258.15 K corresponding to freezing, maximum ice multiplication by rime splintering and by droplet shattering, respectively. (a–d) Simulation scenario without secondary ice processes. (e–f) Simulation scenario with secondary ice processes.
With the formation of secondary ice particles, the number of droplet–ice collisions rapidly increased leading to substantially higher SIP rates along the entire mixed-phase zone and not only at the cloud top as shown in Fig. 7d–f. There is an enhancement in turbulent mixing driven by latent heat released during ice-related processes (i.e. droplet freezing, riming, vapor deposition through the Weneger–Bergeron–Findeisen process). As ice number concentrations increased, the rates of riming and ice–ice aggregation processes increased leading to larger ice particles, which in turn triggered the ice–ice collisional breakup (i.e. as early as 41 min). At the time instance of 43 min, SIP–IIBR rates were higher than SIP–RS and SIP–DS rates, suggesting the presence of large rimed ice particles that have the highest ice multiplication factors in the parametrization of Phillips et al. (2017b)–Grzegorczyk et al. (2025a). The combined effects of all SIP mechanisms shifted the phase structure from a liquid–dominated mixed-phase zone in the SIP-OFF scenario to a ice–dominated one in the SIP-ON scenario as shown in Fig. 8. The corresponding changes in LWC and IWC profiles are included in Fig. S9.
At the peak of convection intensity in the SIP-ON scenario (46 min after convection initiation), the SIP-IIBR mechanism was active across the mixed-phase zone, while other SIP mechanisms are constrained to smaller areas as shown in Fig. 7g–i. The mixed-phase zone in the SIP-ON scenario was almost completely glaciated with only a few areas indicating the existence of liquid water as seen in Fig. 8c–d. At this time instance, the SIP-OFF and SIP-ON scenario showed contrasting clouds not only in terms of total water content and thermodynamic cloud phase but also in cloud geometrical thickness and cloud top conditions. In the SIP-ON scenario, the warm section of the deep convective core (i.e. area with TWC > 3.5 g m−3 at lower altitudes) was smaller but more densely loaded with liquid water in the proximity of the freezing level, suggesting an important role of the ice melting process. The mixed-phase zone in the SIP-ON scenario not only had higher total water content but also was stretched vertically, reaching higher altitudes and lower cloud top temperatures. With more water displaced towards upper levels, we expect to see changes in the development of precipitation via ice particles (see Figs. S10 and S11).
3.4 SIP effects related to convective invigoration
The SIP-ON scenario showed a distinctive signal of stronger convective uplift that increased the supercooled water content of the mixed-phase cloud section expanding the mixed-phase zone and triggering glaciation of the mixed-phase zone. This set of cloud dynamic responses aligns with the concept of invigoration, which is defined as an increase in the vertical wind speed of convective updrafts (Varble et al., 2023) due to a net buoyancy gain due to changes in temperature, water vapor and water condensate mass or changes in vertical pressure gradients (Marinescu et al., 2021). The concept of invigoration was formulated to explain aerosols effects in deep convective clouds exposed to higher CCN concentrations that end up with higher droplet number concentrations and smaller droplet sizes. The mechanisms leading to stronger updrafts are not firmly established but have been linked to enhancements in thermal buoyancy due to latent heat release. Depending on which process is responsible for more latent heating, deep convection can be intensified by warm–phase invigoration when higher cloud droplet number concentrations lead to faster condensation at the lower part of the DCC, or by mixed-phase invigoration when smaller droplet sizes suppress drizzle formation allowing more cloud liquid water to be lifted higher in the mixed-phase region where droplets freeze(Marinescu et al., 2021; Fan et al., 2022). In both cases, the invigoration of convective updrafts requires an increase in positive buoyancy from latent heat that can surpass the negative buoyancy caused by a greater condensate loading (Cotton, 2024). More recently, it has been hypothesized that these CCN–induced changes on droplet size distributions can also trigger additional changes in rates of riming, primary and secondary ice production (Korolev et al., 2017; Fan et al., 2022; Varble et al., 2023).
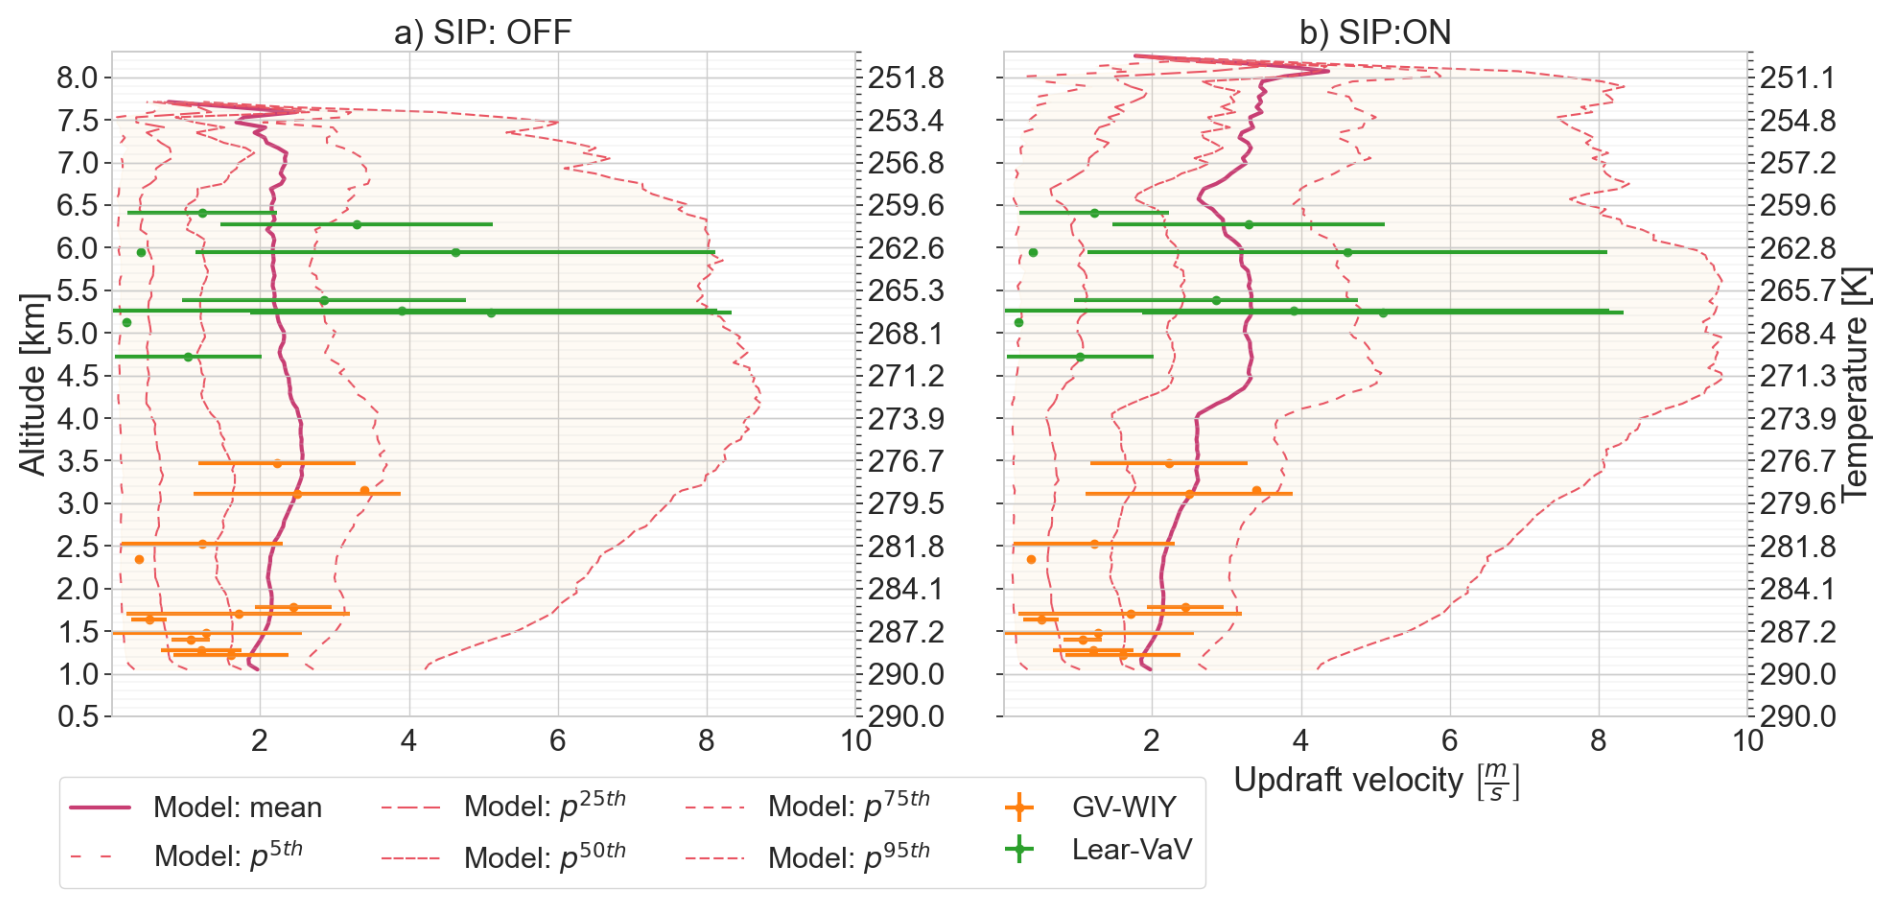
Figure 9Vertical profile of updrafts in cloudy conditions. The variability in model outputs is depicted using the mean and main percentiles values while observations are shown as the mean ± standard deviation for measurements with the Aircraft-Integrated Meteorological Measurement System (AIMM-20) GV-WIY in the GV flight and Lear-VaV in the Lear35 flight. (a) Simulation scenario without secondary ice processes. (b) Simulation scenario with secondary ice processes.
Our findings support this hypothesis because SIP also worked as a driving force for convective invigoration increasing the updraft strength in the mixed-phase region as shown in Fig. 9. While the modeled and observed distributions of updrafts varied similarly in the warm cloud section with minimal differences between the SIP-OFF and the SIP-ON scenario, SIP increased modeled mean values and percentiles above the freezing level, in particular at altitudes between 4 and 6 km where temperatures were optimal for the occurrence of SIP by droplet shattering and rime splintering. With this increase in vertical wind velocity in the mixed-phase region, the SIP-ON scenario provided better agreement with the observed updrafts than the SIP-OFF simulation.
To explore thoroughly the nature of the SIP-induced invigoration, it is necessary to quantify possible shifts in the distributions of vertical wind velocity given by the two simulation scenarios. However, all conclusions derived from a time instance comparison must be carefully interpreted since invigoration effects may not impact instantaneously the cloud properties. Instead, the time delay of the dynamic cloud responses depends on which process dominates the buoyancy balance. Also, SIP effects related to invigoration may not be sustained because as the cloud experiences glaciation, the negative buoyancy related to condensate loading may become high enough to cancel or overpass the positive buoyancy due to enhanced phase transitions. It is also relevant that once the cloud dynamics of the two simulation scenarios (SIP-ON and SIP-OFF) has departed from each other, it is meaningless to make a one-to-one comparison in time and space since the cloud extent changes drastically due to precipitation, for example. A definite bifurcation in cloud dynamics from simulation scenarios occurred at the time instance of 50 min when the SIP-OFF scenario indicated surface precipitation and a noticeable reduction in cloud extent. Before that, the divergence between cloud fields was localized and clouds had very similar boundaries as seen in Figs. S9–S11 of the Supplement.
As an example of the spatial variability in vertical wind velocities, we compare in Fig. 10 the wind fields corresponding to the thicker cloud column at the selected time instances. We used a divergent colormap to visualize better areas of positive and negative buoyancy in connection with water uplift or condensate loading dominant–effects. At 40 min we can see in Fig. 10a–b how there were minimal differences in the updraft/downdraft distribution, but once SIP rates increased at 43 min, the mixed-phase region showed stronger updrafts in areas affected by SIP that correlate well with the profiles of SIP rates shown in Fig. 7d–f particularly in the cloud top section where the ice–ice collisional breakup was the dominant SIP mechanism. At 46 min, the SIP-OFF and SIP-ON scenarios had very different structures of vertical velocity as it can be seen in Fig. 7e–f. Unlike before, areas with with active SIP mechanisms showed weaker updrafts at temperatures below 265.15 where the cloud phase was more glaciated with higher total water contents as seen in Fig. 8d. This suggested that the updraft strengthening requires that the thermal buoyancy can oppose and surpass the condensate loading buoyancy, something that is feasible just at the beginning of the glaciation when the condensate mass is low and there is latent heating from both, liquid water freezing and depositional growth of fresh secondary ice particles. When such conditions are fulfilled, secondary ice formation leads to mixed-phase invigoration which in turn enhances the cloud vertical development causing differences of up to 600 m in the cloud top height as seen in Fig. 10e–f.
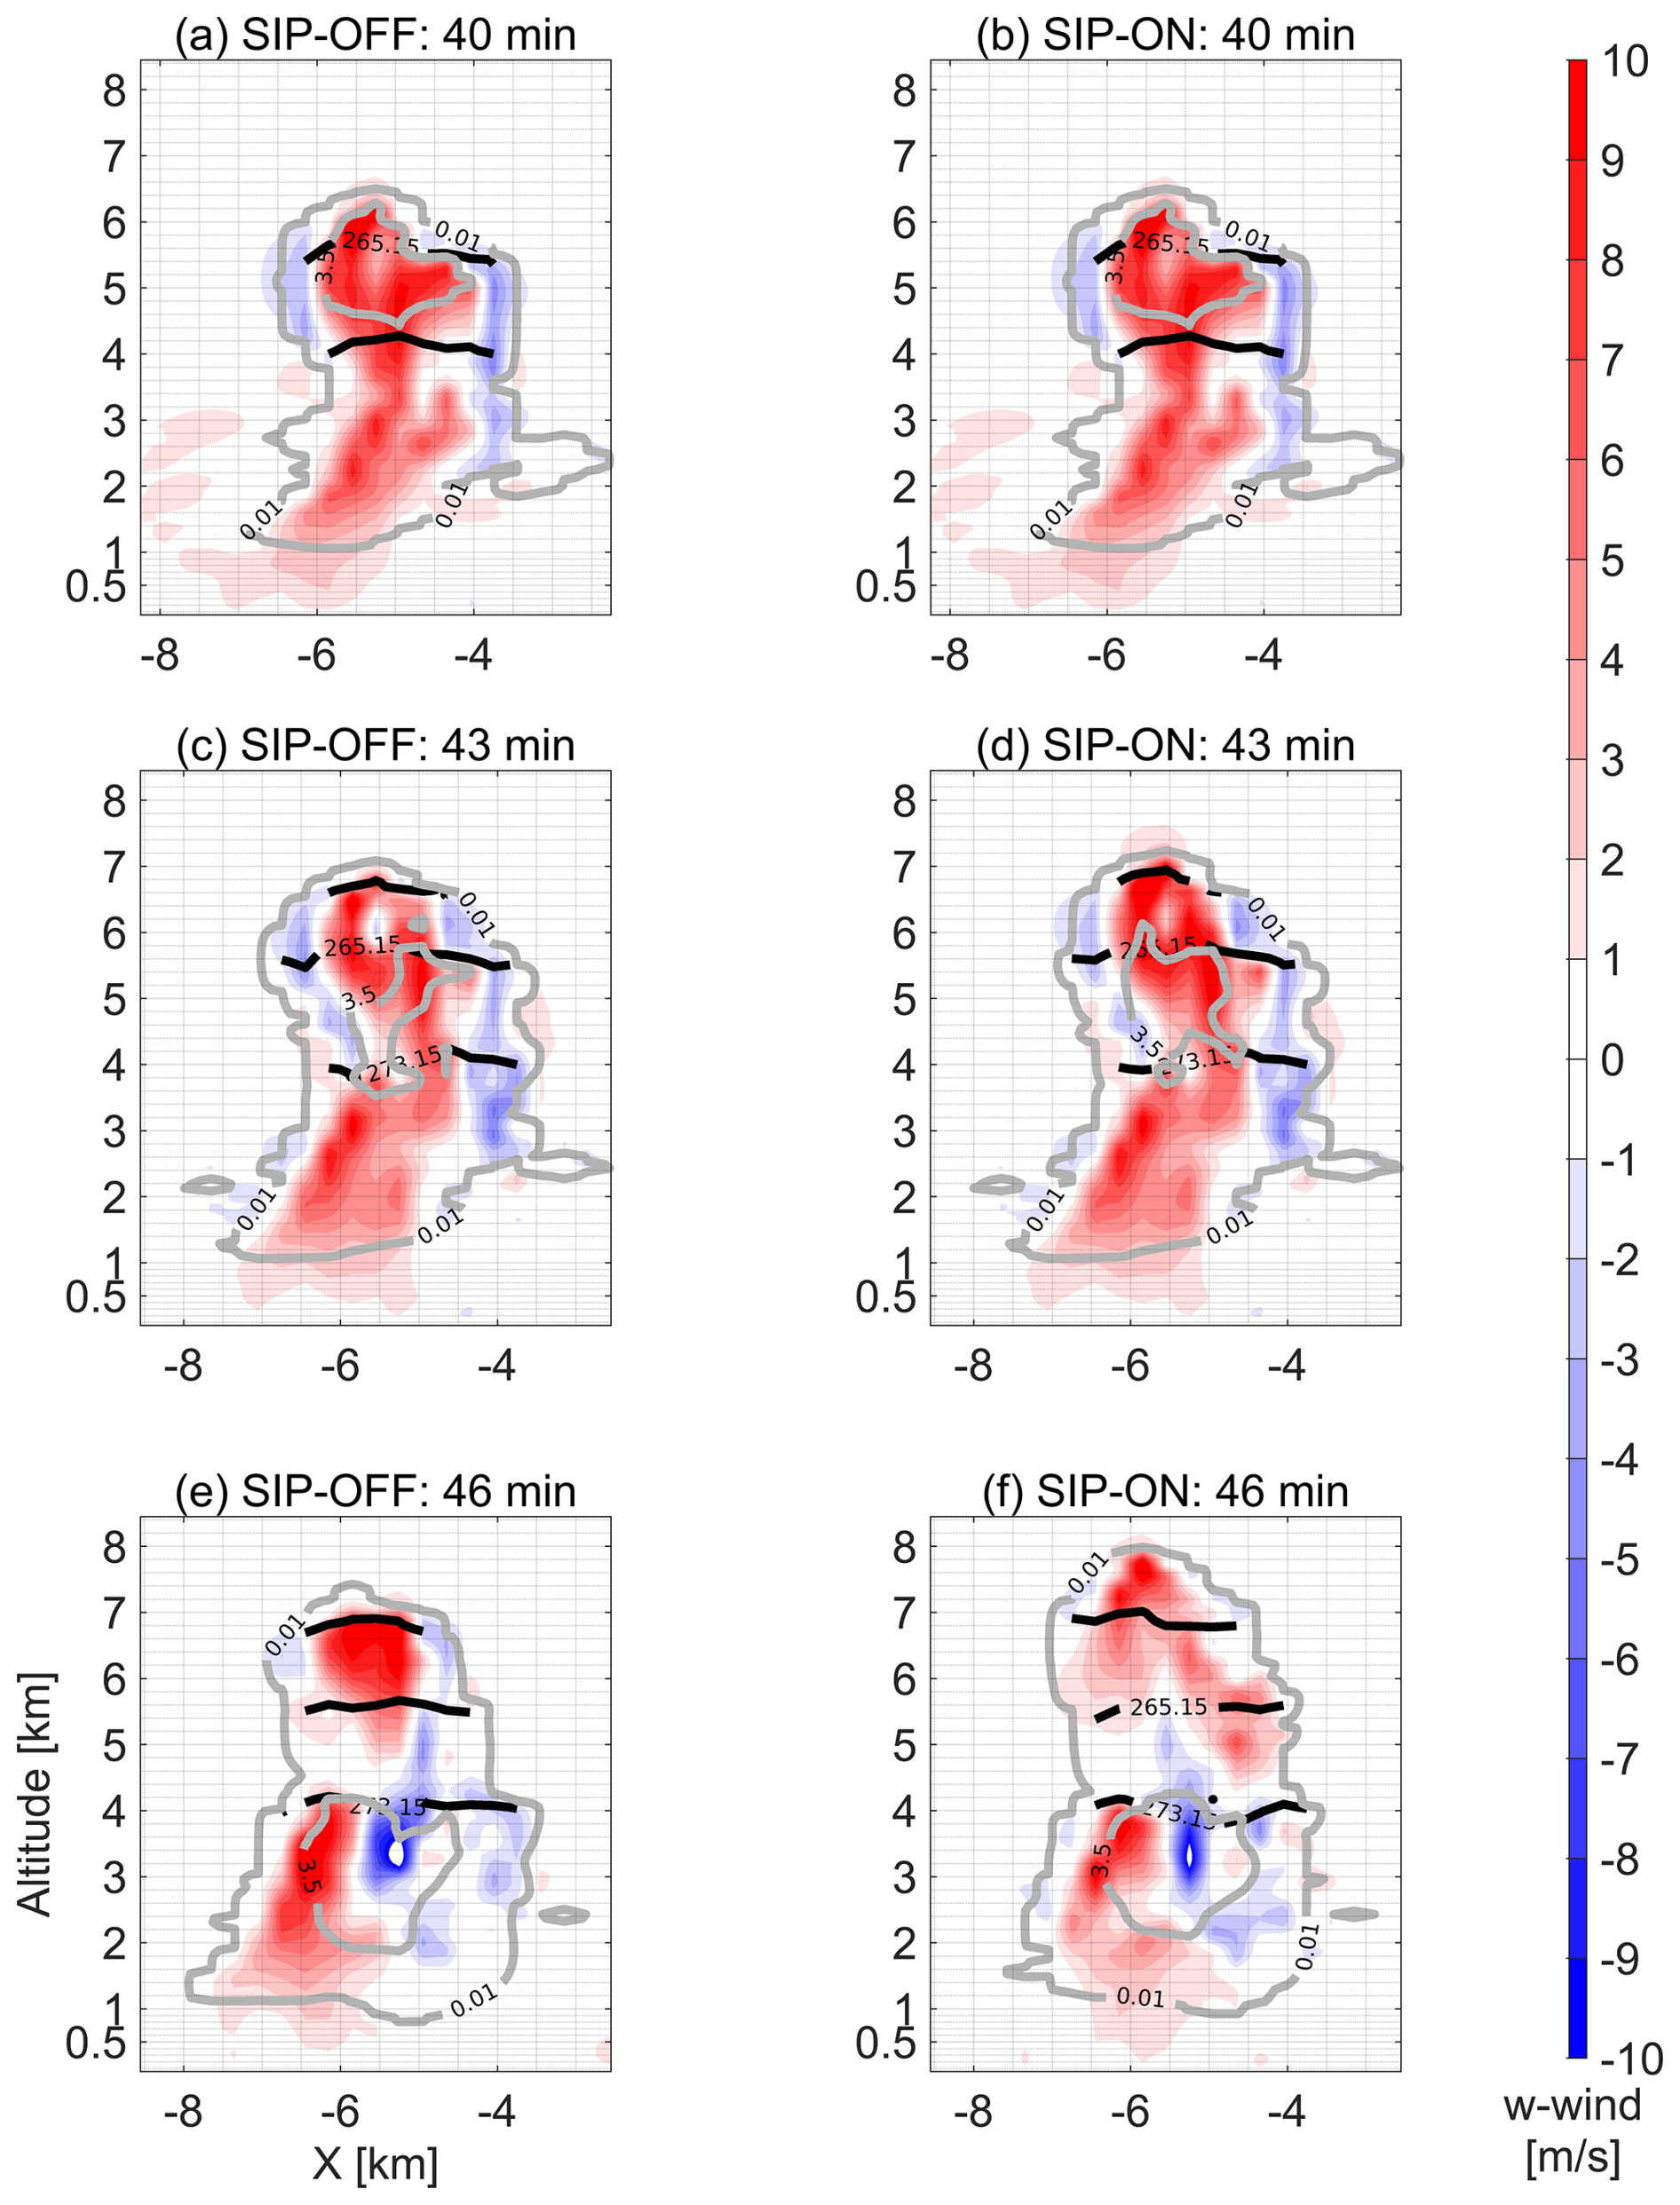
Figure 10Profile of the vertical component of the wind velocity at 40, 43 and 46 min after convection initiation. Contour lines in gray indicate Total Water Content (TWC) values of 0.01 and 3.5 g m−3 to enclose cloudy and core conditions. Continuous black lines indicate altitudes at which temperatures are 273.15, 265.15 and 258.15 K corresponding to freezing, maximum ice multiplication by rime splintering and by droplet shattering, respectively. (a) Simulation scenario without secondary ice processes. (b) Simulation scenario with secondary ice processes.
3.5 Glaciating mechanism via secondary ice production
The SIP-ON scenario depicted the rapid glaciation of the mixed-phase cloud section in a short time period of about 5 min. The phase transition followed the chain-reaction type mechanism driven by ice multiplication that has been known since the 1960s, when Koenig (1963) proposed it to explain the rapid metamorphosis of the phase structure in young cumulus congestus clouds. Based on an insightful analysis of observed cloud microphysics, the mechanism explains how clouds having a scarce presence of ice nucleating particles and supercooled liquid tops with rain-sized droplets (i.e. 1 mm in diameter at concentrations of 50 m−3) are able to develop high ice number concentrations because of the autocatalytic role played by small ice particles generated during the freezing of drops. Since then, there have been numerous field campaigns collecting evidence of this glaciation mechanism (e.g. Lawson et al., 2015, 2017, 2022b, 2023b).
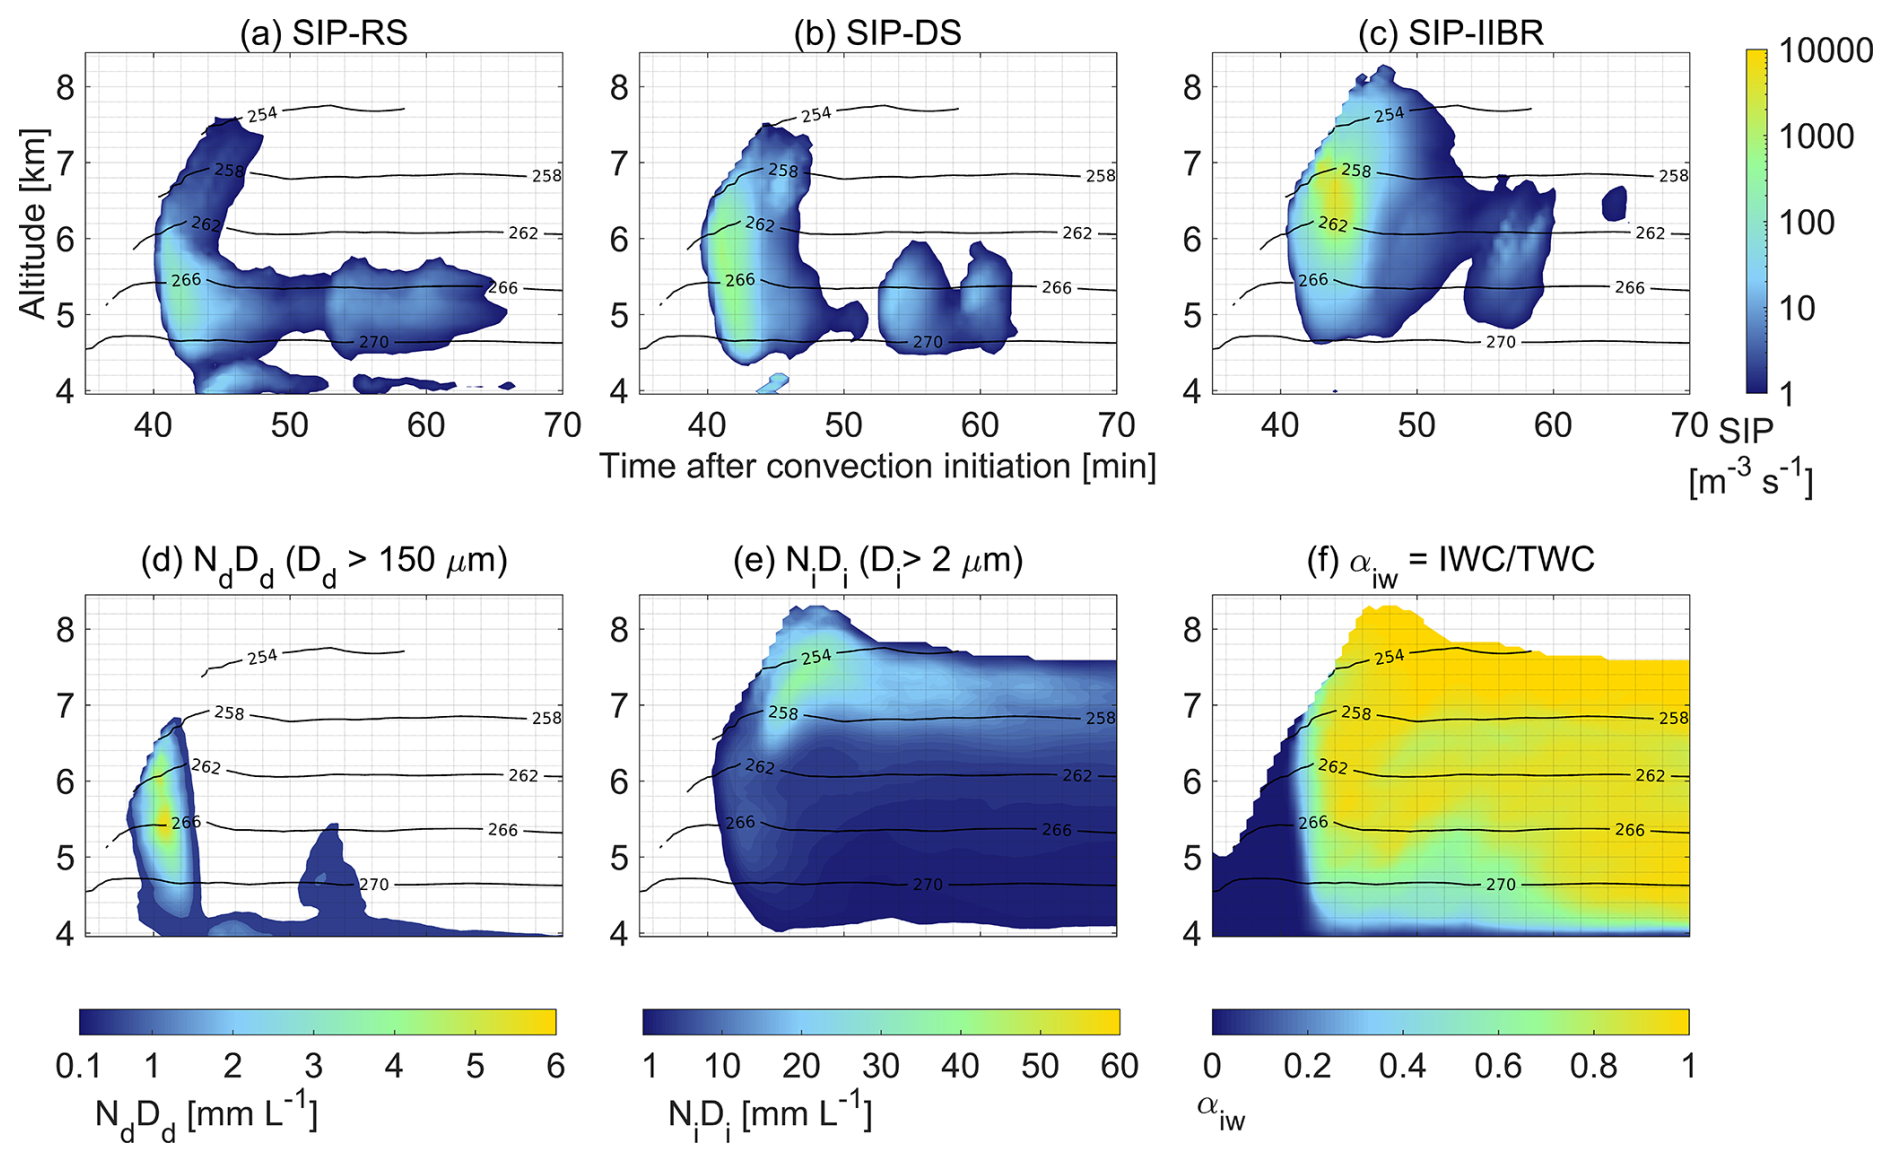
Figure 11Timeline of cloud properties related to secondary ice production in the SIP-ON scenario. (a) Rate of secondary ice production by rime splintering (SIP–RS). (b) Rate of secondary ice production by droplet shattering (SIP–DS). (c) Rate of secondary ice production by ice–ice collisional breakup. (d) Integral diameter for droplets with Dd > 150 µm. (e) Integral diameter for ice particles with maximum length larger than 2 µm. (f) Ratio of IWC to TWC. All properties represent horizontal averages in cloudy points which may lead to overestimation in cloud edges.
This research provides a detailed process-level description of the glaciating mechanism validated by a good model closure of observed cloud microphysics in both, the warm and mixed-phase cloud sections. The stages of SIP-induced glaciating mechanism is shown in Fig. 11 using horizontal average cloud properties along the time interval where secondary ice production occurred. As show already in Fig. 8, there was appreciable horizontal variability in the phase mixing.
Keeping the analogy between a chemical reaction and a secondary ice production event as collision-driven processes, we included the rates of secondary ice production per mechanism to quantify the process velocity and duration in Fig. 11a–c. In Fig. 11d–e, we included the integral diameter or first moment of the size distributions for rain droplets (i.e. for droplets with sizes between 150 µm and 2 cm) and ice particles to quantify the effective presence of reagents and products. The progress of glaciation was followed using the cloud phase partitioning factor αiw (i.e. ratio between IWC and TWC) in Fig. 11f. We included a contour plot to account for temperature effects included in the parameterization of ice multiplication factors (IMF).
The glaciation started at 40 min after convection initiation with minimal presence of ice particles in the average cloud field due to INP-limited primary ice formation. At this time instance, secondary ice production by droplet shattering (SIP–DS) was the only one active with rates above 5 at altitudes between 5.6 and 6.1 km with temperatures varying between 262 and 265 K as shown in Fig. 11b. Higher rates of SIP–DS were reached when the integral diameter of rain droplets was above 3.5 mmL−1.
For the next 2 min (i.e. 40–42 min), the secondary ice particles increased the number of droplet–ice collisions working catalytically to boost the rates of the droplet shattering mechanism up to a maximum of 774 . They also triggered SIP events by the rime-splintering and ice–ice collisional breakup but at much lower rates. The integral diameter of ice particles increased along the vertical cloud domain expanding the mixed-phase zone and increasing the IWC to TWC to a maximum ratio of 0.18.
With an increasing number of secondary ice particles, supercooled droplets were rapidly depleted. This is when the size distribution of freshly generated secondary ice particles played an important role on the cloud glaciation. After a series of droplet shattering events, the droplet population would have generated a number of of small ice crystals but also a fraction of large ice fragments. Since these secondary ice particles spread over a wide range of sizes, they have an impact over a larger number of microphysical processes. Small ice particles will trigger more droplet–ice collisions that will lead to droplet shattering and rime splintering events. Large ice particles will increase not only the riming rates due to collisions with smaller droplets, but also the occurrence of droplet shattering via mode 2 (i.e. accretion of rain drop by a more massive ice particle) (Phillips et al., 2018).
After 43 min, these processes had modified both the droplet and ice size distributions. While the integral diameter of rain droplets decreased, the integral diameter of ice particles increased rapidly in correlation with SIP rates of the ice–ice collisional mechanism (SIP–IIBR) that reached a maximum of 5300 . The thermodynamic phase in the mixed-phase cloud section became dominated by ice.
At 50 min, SIP rates of all three mechanisms decreased below 5 . Once the ice size distribution had shifted towards larger sizes, rapidly falling large ice particles collected slowly settling supercooled drizzle droplets limiting droplet growth in ascending updrafts (Cotton et al., 2010). This is an essential step in the precipitation formation via ice-phase.
Due to the pulsating growth habit of cumulus clouds, another short time rounds of SIP events started at 53 and 60 min but with lower rates for all mechanisms due to smaller values of the integral diameter of rain droplets. The weakening of SIP rates suggested that once precipitation was initiated via ice-phase, cloud dynamics were dominated by it and the initial conditions that trigger the positive-feedback of ice multiplication became impossible to reach.
3.6 SIP effects on precipitation formation
The timeline of events related to secondary ice production indicated the rapid transformation of supercooled large droplets into large ice particles of graupel–type, an essential process for the enhancement of rainfall rates and accumulated precipitation as found in cloud hygroscopic seeding experiments (Cotton, 2024). We can identify SIP-induced changes in the size of precipitating droplets below cloud base comparing the SIP-OFF and SIP-ON scenarios as shown in Fig. 12. Below cloud base, secondary ice production caused differences in droplet number concentrations for droplets with diameter above 100 µm. These differences indicated that SIP had an important influence on the collision–coalescence processes that progressively lead to a narrower droplet size distribution with higher number concentrations. These changes cannot be studied using the average size distribution, they must be analyzed in correlation with the simulation time. We have divided the simulation time in two hourly periods to account for different SIP effects in number concentrations of drizzle-sized droplets at an altitude of 1.17 km in the proximity of the cloud base. The first one comprises the SIP-active period that ended at 60 min after convection initiation (i.e. rates above 5 ) are shown in Fig. 12a–b, while the second period corresponded to the next simulation hour as shown in Fig. 12c–d. To understand how changes in the droplet spectrum affected the formation of precipitation, we have included contour plots of cumulative precipitation in Fig. S14 corresponding to the same time periods.
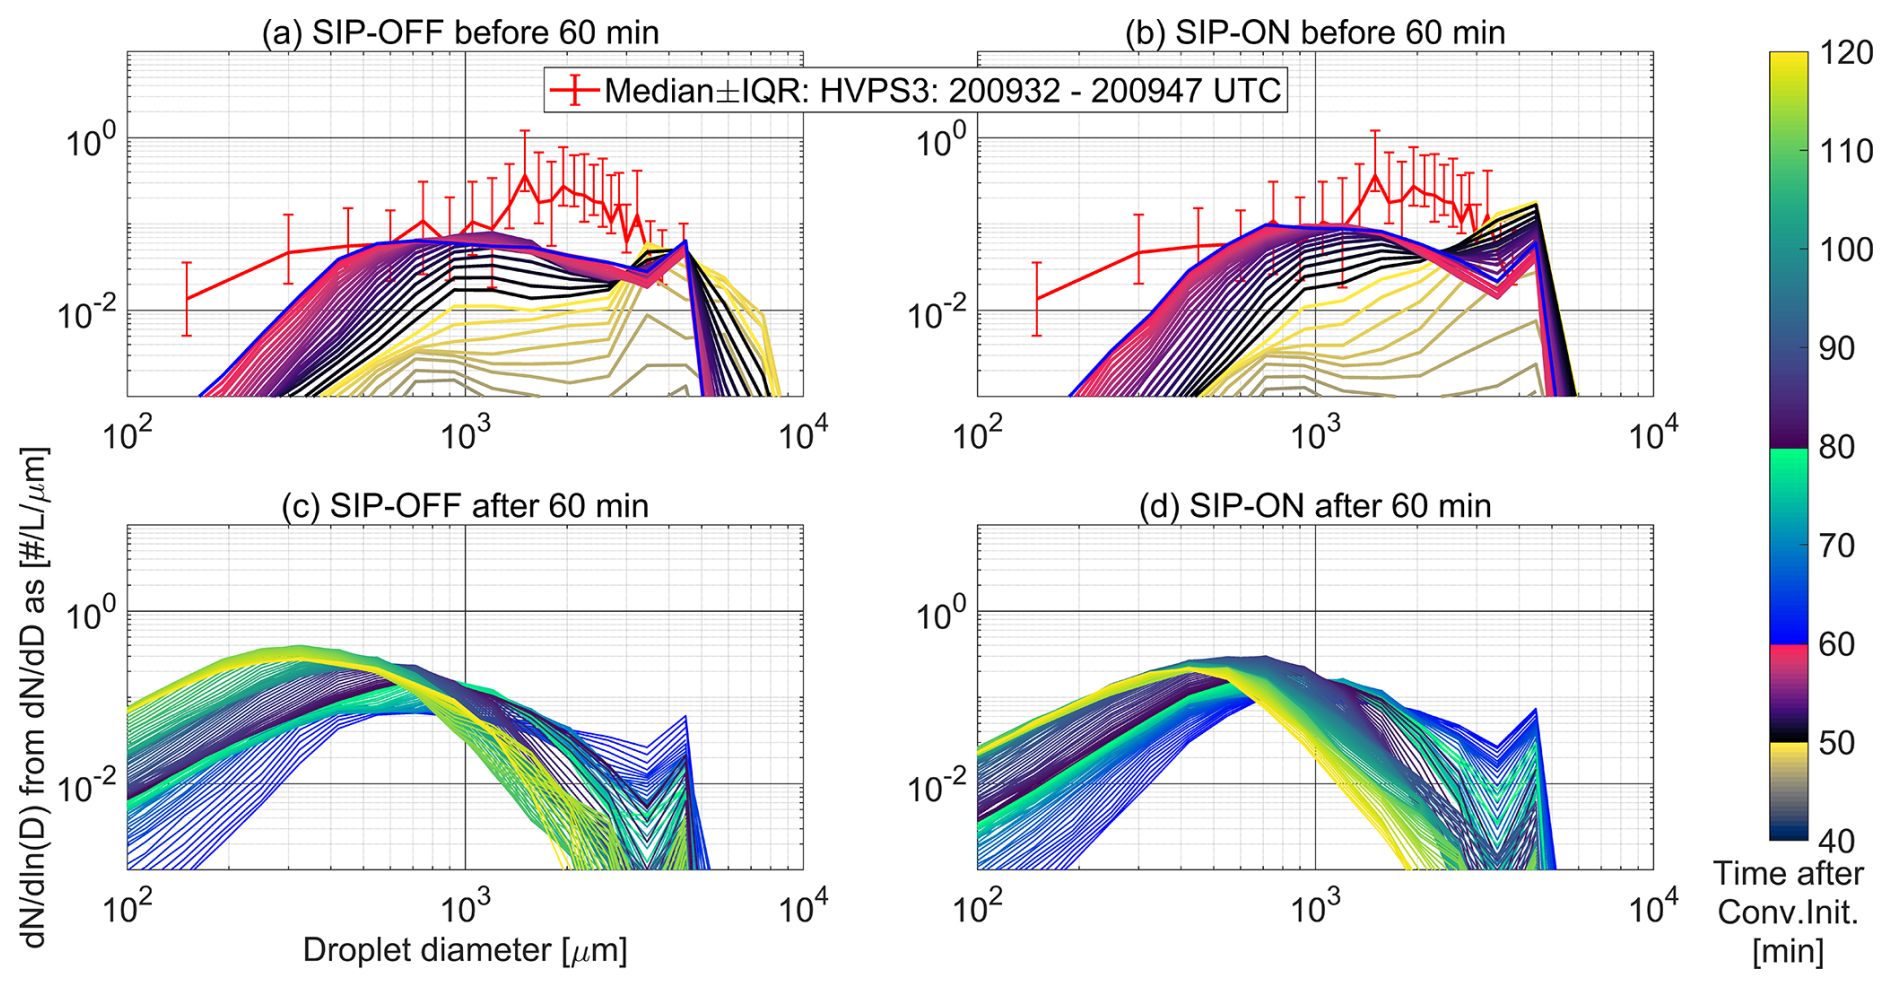
Figure 12Temporal variation of droplet size distributions below cloud base at an altitude of 1.05 km compared to droplet size distributions derived from the High Volume Precipitation Spectrometer (HVPS3) measured at 1.03 km. Modeled outputs were represented using average size distributions in cloudy points. Distributions are color coded to follow the simulation time after convection initiation. (a) SIP-OFF scenario in the first simulation hour. (b) SIP-ON scenario in the first simulation hour. (c) SIP-OFF scenario in the second simulation hour. (d) SIP-ON scenario in the second simulation hour.
Changes in the early phase of precipitation development depicted in Fig. 12a–b indicated that both simulation scenarios began with a very similar droplet size distribution (DSD) that was narrow with a peak at a droplet diameter of 1 mm. Around the 50 min time instance, just 10 min after SIP started in the SIP-ON scenario, there was an increase in number concentrations for all droplet sizes below 4 mm in diameter, but a noticeable reduction in number concentrations for droplets above this value. By 48 min, the SIP-IIBR mechanism had already established itself as the dominant secondary ice production pathway. Consequently, the positive feedback associated with the SIP-DS and SIP-IIBR mechanisms is expected to have substantially reduced the number concentration of raindrops, compared with the higher concentrations maintained in the SIP-OFF scenario. The droplet size distribution in the SIP-ON scenario became narrower with higher concentrations of millimeter-sized droplets compared to that of the SIP-OFF scenario. Since these differences balanced out, there were indistinguishable changes in the domain-average cumulative precipitation shown in Fig. S12a–b. The droplet size distribution in the SIP-ON scenario was closer to observations, but the degree of agreement is strongly affected by differences in the time resolution and spatial coverage of observations and model outputs. While DSD observations in the rain droplet size range correspond to a time period of 15 s, model outputs were taken every 30 s and averaged around the horizontal model domain. The total area in the model domain enclosing cumulative precipitation values larger than 1 mm increased slightly due to the time delay in the sedimentation and melting of large ice particles generated in the mixed-phase zone (e.g. a 1 mm droplet falling 4.5 m s−1 undisturbed in a line trajectory will take 11 min to descend from the 4 km melting altitude to cloud base at 1 km).
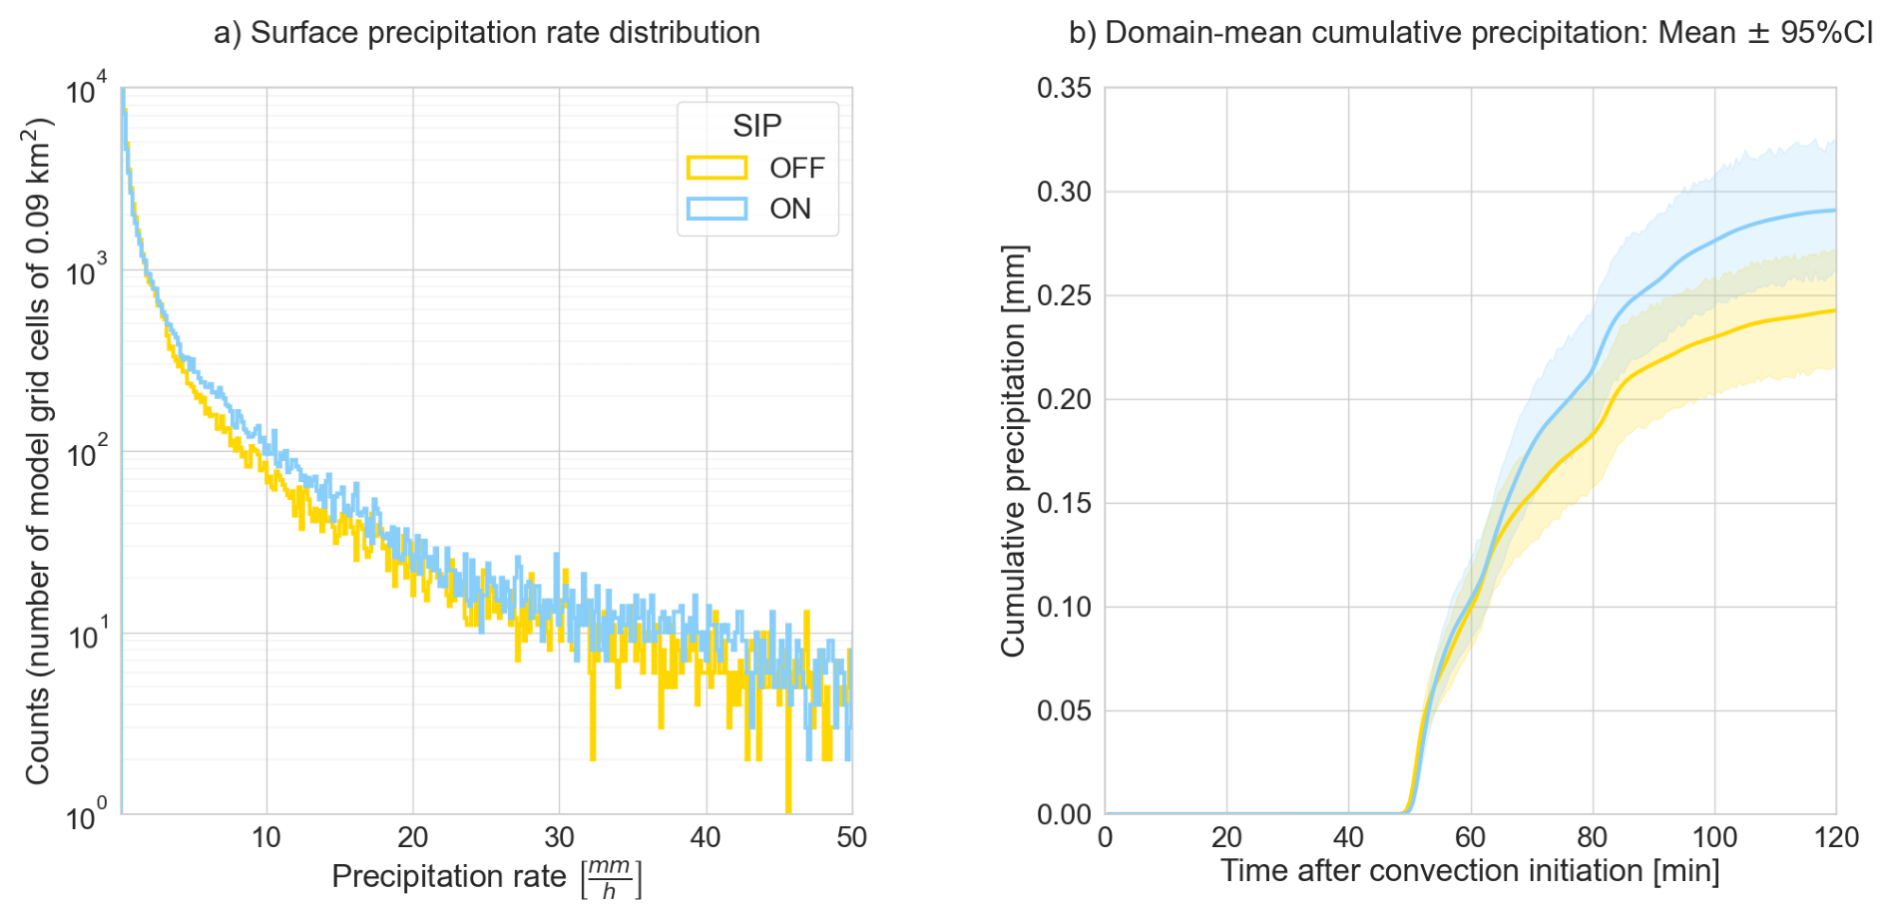
Figure 13SIP effects on precipitation formation. (a) Histograms for precipitation rates at surface level during the simulation time of 120 min. (b) Domain-mean cumulative precipitation with 95 % confidence interval.
Changes in DSD occurring in the later stage depicted in Fig. 12c–d were more drastic compared to those detected earlier. In the SIP-ON scenario there was a noticeable reduction in number concentration of droplets smaller than 500 µm that correlated positively with increasing number of millimeter-size droplets. With copious amounts of larger droplets, the distribution of surface precipitation rates moved up to higher probabilities for modest precipitation rates below 20 mmh−1 as shown in Fig. 13a. This caused a relative increase of 26 % in the domain-mean cumulative precipitation as shown in Fig. 13b as well as a relative increase of 15.6 % in the area with cumulative precipitation values larger than 1 mm (see Fig. S12c–d). Once ice multiplication ended leaving the mixed-phase section almost depleted from liquid, it takes more time for small secondary ice particles to grow, fall and melt and therefore, their influence on precipitation rates comes with a time delay. This explained the stretching of the higher cumulative precipitation area along the trajectory followed by the moving deep convective core. Liquid and solid precipitation rates in the deep convective core are described in Figs. S13 ans S14.
With the exception of our study and the one by (Sullivan et al., 2018), the majority of cloud modelling studies about SIP-induced effects on precipitation have found significant reduction of instantaneous and cumulative rates at surface level (e.g. Phillips et al., 2017a; Hoarau et al., 2018; Han et al., 2024; Grzegorczyk et al., 2025b, c).
There were distinguishable differences between cloud dynamics from simulations with and without considering secondary ice production (SIP) despite being initialized in exactly the same way. The occurrence of SIP increased the cloud top height and total water content at the peak of convection intensity during the glaciation of cumulus towers. Also, SIP events produced an enhancement of ice–related processes involving water phase transitions and positive buoyancy generation shifted the updraft distribution towards higher values suggesting that SIP also produces convective invigoration.
The model was able to reproduce the observed droplet size distributions for the warm cloud section, both with and without secondary ice processes. However, ice size distributions were reproduced only by the SIP-ON scenario and when the mechanism of ice–ice collisional breakup was combined with droplet shattering. The rime splintering mechanism was active but showed a weaker influence on the cloud dynamical response. The SIP-ON scenario provided a detailed process-level description of the glaciating mechanism in young cumulus towers with scant concentrations of ice nucleating particles that followed the chain-reaction-type metamorphosis of supercooled liquid cumulus towers proposed by Koenig (1963). We confirmed the auto-catalytic role played by secondary ice particles, and found that the droplet shattering mechanism plays a decisive role in the initiation of the glaciating mechanism. There must be a considerable presence of large supercooled droplets (i.e. integral diameter of rain droplets above 3.5 mm L−1) at temperatures below 265 K to activate the positive feedback among the SIP mechanisms. Despite its higher production rates of ice crystals, the mechanism of ice–ice collisional breakup can occur only if there are large ice particles present (i.e. IMF values are low for smaller ice particles) and this is why it required that SIP-droplet shattering occurs first to produce large fragments of frozen drops that later grow through accretion. In the absence of high enough INP concentrations to generate adequate background ice conditions, the occurrence of SIP-IIBR is subordinated to the occurrence of SIP-DS.
Surface precipitation rates in the SIP-ON scenario showed increases in the probability of occurrence at values below 20 mm h−1 due to increases in the number concentration of millimeter-sized droplets. Changes in the surface precipitation rates in the early phase occurring shortly after SIP events were minimal but increased with the enhancement in accretion rates (i.e. more numerous large ice particles produced more raindrops below the melting layer) causing an increase in the domain-mean cumulative precipitation in the SIP-ON scenario.
Although our findings are derived from a single cloud case, they still move us forward towards the goal of finding a simplified conceptual model to account for secondary ice production effects in clouds of different genesis. We had pointed out the importance of finding a set of ice multiplication factor parametrizations, triggering conditions for SIP events and size distribution of freshly generated secondary ice particles that was able to reproduce observed secondary ice formation was essential to reach this goal. In this study, we offer a validated alternative to be tested in other cloud case studies. We found that the IMF parameterizations for droplet shattering (Phillips et al., 2018) and ice–ice collisional breakup (Phillips et al., 2017b; Grzegorczyk et al., 2025a) were essential to explore more complex variable dependencies between micro- and macro-physical cloud properties giving a more realistic scenario for process–understanding studies such as this one. Likewise, the consideration of the kinetic collisional energy effect on the probability of secondary ice particle generation was essential to capture turbulent effects on collision–driven processes which in turn responded to changes in the convection intensity inside clouds. It is clear that both laboratory experiments and airborne in-cloud studies are needed to reveal the critical limits of the relative size of colliding hydrometeors that trigger each mechanism, and also if there are additional dependencies to crystal habits (e.g. stellar crystal fragmentation) or different temperature effects. The size distribution of freshly generated secondary ice particles was also important because of its role defining which ice-related microphysical processes are enhanced and up to what extent due to the modification of hydrometeor collision kernels (i.e. settling velocities depend on thermodynamic phase, size and particle shape in the case of ice particles), and how changes in these processes affect the accretional growth of ice and cloud/rain droplets. This is particularly relevant for modelling precipitation formation via ice particles.
It is essential to perform more of this type of process–understanding studies in different cloud types to explore how to improve the representation of the spatial and temporal variability in the cloud thermodynamic phase in large-scale atmospheric models and with that, their capabilities to predict the development of precipitation via ice phase. Also, the cloud research community would benefit from more laboratory studies that settle variable dependencies of SIP rates as well as in-cloud observational studies to tune-up laboratory-derived parametrizations. A deeper evaluation of the rime splintering mechanism added to the effort of Seidel et al. (2024) should be prioritized given the dominant role that this mechanism has in current cloud schemes of large-scale models.
Large-eddy-simulations were performed with UCLALES–SALSA (DEV branch version April, 2025) available from https://doi.org/10.5281/zenodo.15179737 (Calderón et al., 2025b).
We provided information needed to run the simulations, raw outputs from simulations, as well as time series of tri- and two-dimensional cloud properties conditionally sampled to depict specific conditions relevant to the study. Datasets are available at https://doi.org/10.57707/fmi-b2share.50ab4fa1e7b94909b29e31c9ef0e8618 (Calderón et al., 2025a). Data from the SPICULE campaign can be obtained from https://www.eol.ucar.edu/field_projects/spicule, last access: 24 September 2024 (Heymsfield et al., 2024).
There is supplementary information available for this study including:
-
S1 Instrumentation used in the SPICULE-RF04b flights.
-
S2 Parameterizations of SIP rates in UCLALES–SALSA.
-
S3 Flight tracks and size of the model domain.
-
S4 Ice nucleating abilities of aerosol particles.
-
S5 Model sensitivity analysis.
-
S6 Additional supporting figures.
The supplement related to this article is available online at https://doi.org/10.5194/acp-25-14479-2025-supplement.
Conceptualization: SR, SC, PL, formal analysis: SC, SR, funding acquisition: HK, SR, PL, investigation: SC, SR, PL, methodology: SC, SR, PL, software: SC, TR, SR supervision: SR, HK, validation: SC, SR, visualization: SC, SR, writing – original draft preparation: SC, SR, writing – review and editing: SC, SR, NH, TR, HK, PL.
The contact author has declared that none of the authors has any competing interests.
Publisher's note: Copernicus Publications remains neutral with regard to jurisdictional claims made in the text, published maps, institutional affiliations, or any other geographical representation in this paper. While Copernicus Publications makes every effort to include appropriate place names, the final responsibility lies with the authors. Views expressed in the text are those of the authors and do not necessarily reflect the views of the publisher.
Authors thank the Copernicus Climate Change Service (C3S) Climate Data Store for the ECMWF-ERA5 data.
The authors used ChatGPT (OpenAI) to assist with refining the grammar and clarity of the title, abstract, and selected paragraphs of this manuscript. All final content was reviewed and approved by the authors.
This research has been supported by the HORIZON EUROPE European Research Council (grant nos. 101137680 and 101137639), the Research Council of Finland (grant no. 322532), and the National Science Foundation, United Arab Emirates (National Center of Meteorology, Abu Dhabi, UAE under the UAE Research Program for Rain Enhancement Science).
This paper was edited by Markus Petters and reviewed by two anonymous referees.
Ahola, J., Korhonen, H., Tonttila, J., Romakkaniemi, S., Kokkola, H., and Raatikainen, T.: Modelling mixed-phase clouds with the large-eddy model UCLALES–SALSA, Atmos. Chem. Phys., 20, 11639–11654, https://doi.org/10.5194/acp-20-11639-2020, 2020. a
Åström, J., Cook, S., Enderlin, E. M., Sutherland, D. A., Mazur, A., and Glasser, N.: Fragmentation theory reveals processes controlling iceberg size distributions, Journal of Glaciology, 67, 603–612, https://doi.org/10.1017/jog.2021.14, 2021. a
Atlas, R. L., Bretherton, C. S., Khairoutdinov, M. F., and Blossey, P. N.: Hallett-Mossop Rime Splintering Dims Cumulus Clouds Over the Southern Ocean: New Insight From Nudged Global Storm-Resolving Simulations, AGU Advances, 3, e2021AV000454, https://doi.org/10.1029/2021AV000454, 2022. a
Barahona, D.: On the thermodynamic and kinetic aspects of immersion ice nucleation, Atmos. Chem. Phys., 18, 17119–17141, https://doi.org/10.5194/acp-18-17119-2018, 2018. a
Beard, K. V.: Terminal Velocity and Shape of Cloud and Precipitation Drops Aloft, Journal of Atmospheric Sciences, 33, 851–864, https://doi.org/10.1175/1520-0469(1976)033<0851:TVASOC>2.0.CO;2, 1976. a
Brownscombe, J. L. and Thorndike, N. S.: Freezing and Shattering of Water Droplets in Free Fall, Nature, 220, 687–689, https://doi.org/10.1038/220687a0, 1968. a
Bühl, J., Seifert, P., Radenz, M., Baars, H., and Ansmann, A.: Ice crystal number concentration from lidar, cloud radar and radar wind profiler measurements, Atmos. Meas. Tech., 12, 6601–6617, https://doi.org/10.5194/amt-12-6601-2019, 2019. a, b
Calderón, S. M., Tonttila, J., Buchholz, A., Joutsensaari, J., Komppula, M., Leskinen, A., Hao, L., Moisseev, D., Pullinen, I., Tiitta, P., Xu, J., Virtanen, A., Kokkola, H., and Romakkaniemi, S.: Aerosol–stratocumulus interactions: towards a better process understanding using closures between observations and large eddy simulations, Atmos. Chem. Phys., 22, 12417–12441, https://doi.org/10.5194/acp-22-12417-2022, 2022. a
Calderón, S. M., Hyttinen, N., Kokkola, H., Raatikainen, T., Lawson, P. R., and Romakkaniemi, S.: UCLALES-SALSA Simulation Data for the SPICULE-RF04b Cloud Case from “Secondary Ice Formation in Cumulus Congestus Clouds: Insights from Observations and Aerosol-Aware Large-Eddy Simulations”, Finnish Meteorological Institute [data set], https://doi.org/10.57707/fmi-b2share.50ab4fa1e7b94909b29e31c9ef0e8618, 2025a. a
Calderón, S. M., Tonttila, J., Raatikainen, T., Ahola, J., Kokkola, H., and Romakkaniemi, S.: UCLALES-SALSA: large-eddy-simulations with aerosol-cloud-ice-precipitation interactions, Zenodo [code], https://doi.org/10.5281/zenodo.15179737, 2025b. a
Cotton, W. R.: Aerosol-Induced Invigoration of Cumulus Clouds – A Review, Atmosphere, 15, https://doi.org/10.3390/atmos15080924, 2024. a, b
Cotton, W. R., Bryan, G. H., and van den Heever, S. C.: Storm and Cloud Dynamics, vol. 99 of International Geophysics Series, Academic Press, Boston, 2nd edn., ISBN 978-0-12-088542-8, 2010. a
DeMott, P., Hill, T., and Patnaude, R.: SPICULE: CSU Ice Spectrometer (IS) Measurements, Version 1.0, Earth Observing Laboratory Field Data Archive [data set], https://doi.org/10.26023/HAYW-8STD-KT00, 2024. a
Deshmukh, A., Phillips, V. T. J., Bansemer, A., Patade, S., and Waman, D.: New Empirical Formulation for the Sublimational Breakup of Graupel and Dendritic Snow, Journal of the Atmospheric Sciences, 79, 317–336, https://doi.org/10.1175/JAS-D-20-0275.1, 2022. a
Fan, J. and Li, Z.: Chapter 14 – Aerosol interactions with deep convective clouds, in: Aerosols and Climate, edited by: Carslaw, Ken S., Elsevier, 571–617, ISBN 978-0-12-819766-0, https://doi.org/10.1016/B978-0-12-819766-0.00001-8, 2022. a, b, c
Georgakaki, P., Sotiropoulou, G., Vignon, É., Billault-Roux, A.-C., Berne, A., and Nenes, A.: Secondary ice production processes in wintertime alpine mixed-phase clouds, Atmos. Chem. Phys., 22, 1965–1988, https://doi.org/10.5194/acp-22-1965-2022, 2022. a
Grzegorczyk, P., Yadav, S., Zanger, F., Theis, A., Mitra, S. K., Borrmann, S., and Szakáll, M.: Fragmentation of ice particles: laboratory experiments on graupel–graupel and graupel–snowflake collisions, Atmos. Chem. Phys., 23, 13505–13521, https://doi.org/10.5194/acp-23-13505-2023, 2023. a
Grzegorczyk, P., Wobrock, W., Canzi, A., Niquet, L., Tridon, F., and Planche, C.: Investigating secondary ice production in a deep convective cloud with a 3D bin microphysics model: Part I – Sensitivity study of microphysical processes representations, Atmospheric Research, 313, 107774, https://doi.org/10.1016/j.atmosres.2024.107774, 2025a. a, b, c, d, e, f, g
Grzegorczyk, P., Wobrock, W., Canzi, A., Niquet, L., Tridon, F., and Planche, C.: Investigating secondary ice production in a deep convective cloud with a 3D bin microphysics model: Part II – Effects on the cloud formation and development, Atmospheric Research, 314, 107797, https://doi.org/10.1016/j.atmosres.2024.107797, 2025b. a, b
Grzegorczyk, P., Wobrock, W., Dziduch, A., and Planche, C.: Influence of secondary ice production on cloud and rain properties: analysis of the HYMEX IOP7a heavy-precipitation event, Atmos. Chem. Phys., 25, 10403–10420, https://doi.org/10.5194/acp-25-10403-2025, 2025c. a, b, c
Hallet, J. and Mossop, S. C.: Production of secondary ice particles during the riming process, Nature, 249, 26–28, https://doi.org/10.1038/249026a0, 1974. a, b, c, d, e
Han, C., Hoose, C., and Dürlich, V.: Secondary Ice Production in Simulated Deep Convective Clouds: A Sensitivity Study, Journal of the Atmospheric Sciences, 81, 903–921, https://doi.org/10.1175/JAS-D-23-0156.1, 2024. a, b, c
Hersbach, H., Bell, B., Berrisford, P., Biavatti, G., Horáyi, A., Muñoz Sabater, J., Nicolas, J., Peubey, C., Radu, R., Rozum, I., Schepers, D., Simmons, A., Dee, C., Soci, D., and Thépaut, J.-N.: ERA5 hourly data on pressure levels from 1940 to present, Copernicus Climate Change Service (C3S) Climate Data Store (CDS), https://doi.org/10.24381/cds.bd0915c6, 2024. a
Heymsfield, A., Lawson, P., and DeMott, P.: SPICULE | Earth Observing Laboratory, Secondary Ice Production of Ice in Cumulus Experiment (SPICULE): project description and datasets, https://www.eol.ucar.edu/field_projects/spicule (last access: 24 September 2024), 2024. a, b
Heymsfield, A. J., Schmitt, C., Chen, C.-C.-J., Bansemer, A., Gettelman, A., Field, P. R., and Liu, C.: Contributions of the Liquid and Ice Phases to Global Surface Precipitation: Observations and Global Climate Modeling, Journal of the Atmospheric Sciences, 77, 2629–2648, https://doi.org/10.1175/JAS-D-19-0352.1, 2020. a
Hoarau, T., Pinty, J.-P., and Barthe, C.: A representation of the collisional ice break-up process in the two-moment microphysics LIMA v1.0 scheme of Meso-NH, Geosci. Model Dev., 11, 4269–4289, https://doi.org/10.5194/gmd-11-4269-2018, 2018. a, b
Huang, Y., Wu, W., McFarquhar, G. M., Xue, M., Morrison, H., Milbrandt, J., Korolev, A. V., Hu, Y., Qu, Z., Wolde, M., Nguyen, C., Schwarzenboeck, A., and Heckman, I.: Microphysical processes producing high ice water contents (HIWCs) in tropical convective clouds during the HAIC-HIWC field campaign: dominant role of secondary ice production, Atmos. Chem. Phys., 22, 2365–2384, https://doi.org/10.5194/acp-22-2365-2022, 2022. a
James, R. L., Phillips, V. T. J., and Connolly, P. J.: Secondary ice production during the break-up of freezing water drops on impact with ice particles, Atmos. Chem. Phys., 21, 18519–18530, https://doi.org/10.5194/acp-21-18519-2021, 2021. a
Keinert, A., Spannagel, D., Leisner, T., and Kiselev, A.: Secondary Ice Production upon Freezing of Freely Falling Drizzle Droplets, Journal of the Atmospheric Sciences, 77, 2959–2967, https://doi.org/10.1175/JAS-D-20-0081.1, 2020. a, b, c
Khvorostyanov, V. I. and Curry, J. A.: Terminal Velocities of Droplets and Crystals: Power Laws with Continuous Parameters over the Size Spectrum, Journal of the Atmospheric Sciences, 59, 1872–1884, https://doi.org/10.1175/1520-0469(2002)059<1872:TVODAC>2.0.CO;2, 2002. a
Koenig, L. R.: The Glaciating Behavior of Small Cumulonimbus Clouds, Journal of Atmospheric Sciences, 20, 29–47, https://doi.org/10.1175/1520-0469(1963)020<0029:TGBOSC>2.0.CO;2, 1963. a, b
Kolomeychuk, R. J., McKay, D. C., and Iribarne, J. V.: The Fragmentation and Electrification of Freezing Drops, Journal of Atmospheric Sciences, 32, 974–979, https://doi.org/10.1175/1520-0469(1975)032<0974:TFAEOF>2.0.CO;2, 1975. a
Korolev, A. and Heckman, I.: SPICULE: Ka-Band Probe Radar (KPR) profile data. Version 1.0, Earth Observing Laboratory Field Data Archive [data set], https://doi.org/10.26023/Z36H-G1VR-F300, 2023. a
Korolev, A. and Leisner, T.: Review of experimental studies of secondary ice production, Atmos. Chem. Phys., 20, 11767–11797, https://doi.org/10.5194/acp-20-11767-2020, 2020. a, b, c
Korolev, A. and Milbrandt, J.: How Are Mixed‐Phase Clouds Mixed?, Geophysical Research Letters, 49, e2022GL099578, https://doi.org/10.1029/2022GL099578, 2022. a
Korolev, A., McFarquhar, G., Field, P. R., Franklin, C., Lawson, P., Wang, Z., Williams, E., Abel, S. J., Axisa, D., Borrmann, S., Crosier, J., Fugal, J., Krämer, M., Lohmann, U., Schlenczek, O., Schnaiter, M., and Wendisch, M.: Mixed-Phase Clouds: Progress and Challenges, Meteorological Monographs, 58, 5.1–5.50, https://doi.org/10.1175/AMSMONOGRAPHS-D-17-0001.1, 2017. a
Korolev, A., Heckman, I., Wolde, M., Ackerman, A. S., Fridlind, A. M., Ladino, L. A., Lawson, R. P., Milbrandt, J., and Williams, E.: A new look at the environmental conditions favorable to secondary ice production, Atmos. Chem. Phys., 20, 1391–1429, https://doi.org/10.5194/acp-20-1391-2020, 2020. a, b
Korolev, A., DeMott, P. J., Heckman, I., Wolde, M., Williams, E., Smalley, D. J., and Donovan, M. F.: Observation of secondary ice production in clouds at low temperatures, Atmos. Chem. Phys., 22, 13103–13113, https://doi.org/10.5194/acp-22-13103-2022, 2022. a
Kulkarni, G., Levin, M., and Shilling, J.: CCN Counter derived hygroscopicity parameter kappa (AOSCCNSMPSKAPPA), 2017-04-12 to 2025-01-14, Southern Great Plains (SGP) Lamont, OK (Extended and Co-located with C1) (E13), Atmospheric Radiation Measurement (ARM) user facility, https://doi.org/10.5439/1729907, 2024. a
Lauber, A., Kiselev, A., Pander, T., Handmann, P., and Leisner, T.: Secondary Ice Formation during Freezing of Levitated Droplets, Journal of the Atmospheric Sciences, 75, 2815–2826, https://doi.org/10.1175/JAS-D-18-0052.1, 2018. a, b, c
Lawson, P., Gurganus, C., Woods, S., and Bruintjes, R.: Aircraft Observations of Cumulus Microphysics Ranging from the Tropics to Midlatitudes: Implications for a “New” Secondary Ice Process, Journal of the Atmospheric Sciences, 74, 2899–2920, https://doi.org/10.1175/JAS-D-17-0033.1, 2017. a
Lawson, P., Woods, S., and Bruintjes, R.: SPEC Learjet 35 Instrument Data, Version 2.0, Earth Observing Laboratory Field Data Archive [data set], https://doi.org/10.26023/NHSC-AC8Y-9W09, 2022a. a
Lawson, P., Woods, S., and Bruintjes, R.: SPEC NSF/NCAR GV Instrument Data, Version 1.1, Earth Observing Laboratory Field Data Archive [data set], https://doi.org/10.26023/GENG-Q8WN-TB13, 2023a. a
Lawson, R. P., Woods, S., and Morrison, H.: The Microphysics of Ice and Precipitation Development in Tropical Cumulus Clouds, Journal of the Atmospheric Sciences, 72, 2429–2445, https://doi.org/10.1175/JAS-D-14-0274.1, 2015. a, b, c
Lawson, R. P., Bruintjes, R., Woods, S., and Gurganus, C.: Coalescence and Secondary Ice Development in Cumulus Congestus Clouds, Journal of the Atmospheric Sciences, 79, 953–972, https://doi.org/10.1175/JAS-D-21-0188.1, 2022b. a
Lawson, R. P., Korolev, A. V., DeMott, P. J., Heymsfield, A. J., Bruintjes, R. T., Wolff, C. A., Woods, S., Patnaude, R. J., Jensen, J. B., Moore, K. A., Heckman, I., Rosky, E., Haggerty, J., Perkins, R. J., Fisher, T., and Hill, T. C. J.: The Secondary Production of Ice in Cumulus Experiment (SPICULE), Bulletin of the American Meteorological Society, 104, E51–E76, https://doi.org/10.1175/BAMS-D-21-0209.1, 2023b. a, b, c, d, e, f, g, h, i, j, k
Leisner, T., Pander, T., Handmann, T., and Kiselev, A.: Secondary ice processes upon heterogeneous freezing of cloud droplets, in: Proceedings of the 14th Conference on Cloud Physics and Atmospheric Radiation, American Meteorological Society, https://ams.confex.com/ams/14CLOUD14ATRAD/webprogram/Paper250221.html (last access: 30 October 2024), 2014. a, b
Liu, P. S. K., Leaitch, W. R., Strapp, J. W., and Wasey, M. A.: Response of Particle Measuring Systems Airborne ASASP and PCASP to NaCl and Latex Particles, Aerosol Science and Technology, 16, 83–95, https://doi.org/10.1080/02786829208959539, 1992. a
Marinescu, P. J., Levin, E. J. T., Collins, D., Kreidenweis, S. M., and van den Heever, S. C.: Quantifying aerosol size distributions and their temporal variability in the Southern Great Plains, USA, Atmos. Chem. Phys., 19, 11985–12006, https://doi.org/10.5194/acp-19-11985-2019, 2019. a
Marinescu, P. J., van den Heever, S. C., Heikenfeld, M., Barrett, A. I., Barthlott, C., Hoose, C., Fan, J., Fridlind, A. M., Matsui, T., Miltenberger, A. K., Stier, P., Vie, B., White, B. A., and Zhang, Y.: Impacts of Varying Concentrations of Cloud Condensation Nuclei on Deep Convective Cloud Updrafts – A Multimodel Assessment, Journal of the Atmospheric Sciences, 78, 1147–1172, https://doi.org/10.1175/JAS-D-20-0200.1, 2021. a, b
Morrison, H. and Milbrandt, J. A.: Parameterization of ice microphysics based on the prediction of bulk particle properties. Part I: Scheme description and idealized tests, J. Atmos. Sci., 72, 287–311, 2015. a, b, c
Mossop, S. C.: Production of secondary ice particles during the growth of graupel by riming, Quarterly Journal of the Royal Meteorological Society, 102, 45–57, https://doi.org/10.1002/qj.49710243104, 1976. a
Palmer, A. C. and Sanderson, T. J. O.: Fractal crushing of ice and brittle solids, Proceedings of the Royal Society of London. Series A: Mathematical and Physical Sciences, 433, 469–477, https://doi.org/10.1098/rspa.1991.0060, 1991. a
Pasquier, J. T., Henneberger, J., Ramelli, F., Lauber, A., David, R. O., Wieder, J., Carlsen, T., Gierens, R., Maturilli, M., and Lohmann, U.: Conditions favorable for secondary ice production in Arctic mixed-phase clouds, Atmos. Chem. Phys., 22, 15579–15601, https://doi.org/10.5194/acp-22-15579-2022, 2022. a
Patade, S., Kulkarni, G., Patade, S., Waman, D., Sotiropoulou, G., Samanta, S., Malap, N., and Prabhakaran, T.: Importance of secondary ice production in mixed-phase monsoon clouds over the Indian subcontinent, Atmospheric Research, 315, 107890, https://doi.org/10.1016/j.atmosres.2024.107890, 2025. a
Patnaude, R. J., Moore, K. A., Perkins, R. J., Hill, T. C. J., Lawson, P., Mo, Q., Bailey, A., van den Heever, S. C., Saleeby, S. M., Bian, Q., Chiu, J. C., DeMott, P. J., and Kreidenweis, S. M.: On the Role of Airborne Ice Nucleating Particles in Primary and Secondary Ice Formation Processes in Convective Midlatitude Clouds, Journal of the Atmospheric Sciences, 82, 869–892, https://doi.org/10.1175/JAS-D-24-0135.1, 2025. a, b
Petters, M. D. and Kreidenweis, S. M.: A single parameter representation of hygroscopic growth and cloud condensation nucleus activity, Atmos. Chem. Phys., 7, 1961–1971, https://doi.org/10.5194/acp-7-1961-2007, 2007. a
Phillips, V. T. J., Yano, J.-I., Formenton, M., Ilotoviz, E., Kanawade, V., Kudzotsa, I., Sun, J., Bansemer, A., Detwiler, A. G., Khain, A., and Tessendorf, S. A.: Ice Multiplication by Breakup in Ice–Ice Collisions. Part II: Numerical Simulations, Journal of the Atmospheric Sciences, 74, 2789–2811, https://doi.org/10.1175/JAS-D-16-0223.1, 2017a. a, b
Phillips, V. T. J., Yano, J.-I., and Khain, A.: Ice Multiplication by Breakup in Ice–Ice Collisions. Part I: Theoretical Formulation, Journal of the Atmospheric Sciences, 74, 1705–1719, https://doi.org/10.1175/JAS-D-16-0224.1, 2017b. a, b, c, d, e
Phillips, V. T. J., Patade, S., Gutierrez, J., and Bansemer, A.: Secondary Ice Production by Fragmentation of Freezing Drops: Formulation and Theory, Journal of the Atmospheric Sciences, 75, 3031–3070, https://doi.org/10.1175/JAS-D-17-0190.1, 2018. a, b, c, d, e, f, g, h
Pruppacher, H. R. and Schlamp, R. J.: A wind tunnel investigation on ice multiplication by freezing of waterdrops falling at terminal velocity in air, Journal of Geophysical Research, 80, 380–386, https://doi.org/10.1029/JC080i003p00380, 1975. a
Qu, Z., Korolev, A., Milbrandt, J. A., Heckman, I., Huang, Y., McFarquhar, G. M., Morrison, H., Wolde, M., and Nguyen, C.: The impacts of secondary ice production on microphysics and dynamics in tropical convection, Atmos. Chem. Phys., 22, 12287–12310, https://doi.org/10.5194/acp-22-12287-2022, 2022. a, b
Ramelli, F., Henneberger, J., David, R. O., Bühl, J., Radenz, M., Seifert, P., Wieder, J., Lauber, A., Pasquier, J. T., Engelmann, R., Mignani, C., Hervo, M., and Lohmann, U.: Microphysical investigation of the seeder and feeder region of an Alpine mixed-phase cloud, Atmos. Chem. Phys., 21, 6681–6706, https://doi.org/10.5194/acp-21-6681-2021, 2021. a
Savre, J., Ekman, A. M. L., and Svensson, G.: Technical note: Introduction to MIMICA, a large-eddy simulation solver for cloudy planetary boundary layers, Journal of Advances in Modeling Earth Systems, 6, 630–649, https://doi.org/10.1002/2013MS000292, 2014. a, b
Schäfer, B., David, R. O., Georgakaki, P., Pasquier, J. T., Sotiropoulou, G., and Storelvmo, T.: Simulations of primary and secondary ice production during an Arctic mixed-phase cloud case from the Ny-Ålesund Aerosol Cloud Experiment (NASCENT) campaign, Atmos. Chem. Phys., 24, 7179–7202, https://doi.org/10.5194/acp-24-7179-2024, 2024. a
Schwarzenboeck, A., Shcherbakov, V., Lefevre, R., Gayet, J.-F., Pointin, Y., and Duroure, C.: Indications for stellar-crystal fragmentation in Arctic clouds, Atmospheric Research, 92, 220–228, https://doi.org/10.1016/j.atmosres.2008.10.002, 2009. a, b
Seidel, J. S., Kiselev, A. A., Keinert, A., Stratmann, F., Leisner, T., and Hartmann, S.: Secondary ice production – no evidence of efficient rime-splintering mechanism, Atmos. Chem. Phys., 24, 5247–5263, https://doi.org/10.5194/acp-24-5247-2024, 2024. a, b, c
Sotiropoulou, G., Vignon, É., Young, G., Morrison, H., O'Shea, S. J., Lachlan-Cope, T., Berne, A., and Nenes, A.: Secondary ice production in summer clouds over the Antarctic coast: an underappreciated process in atmospheric models, Atmos. Chem. Phys., 21, 755–771, https://doi.org/10.5194/acp-21-755-2021, 2021. a, b, c
Sullivan, S. C., Barthlott, C., Crosier, J., Zhukov, I., Nenes, A., and Hoose, C.: The effect of secondary ice production parameterization on the simulation of a cold frontal rainband, Atmos. Chem. Phys., 18, 16461–16480, https://doi.org/10.5194/acp-18-16461-2018, 2018. a, b, c, d
Takahashi, C.: Deformations of Frozen Water Drops and Their Frequencies, Journal of the Meteorological Society of Japan. Ser. II, 53, 402–411, https://doi.org/10.2151/jmsj1965.53.6_402, 1975. a
Takahashi, C. and Yamashita, A.: Shattering of Frozen Water Drops in a Supercooled Cloud, Journal of the Meteorological Society of Japan. Ser. II, 48, 373–376, https://doi.org/10.2151/jmsj1965.48.4_373, 1970. a
Takahashi, C. and Yamashita, A.: Production of Ice Splinters by the Freezing of Water Drops in Free Fall, Journal of the Meteorological Society of Japan. Ser. II, 55, 139–141, https://doi.org/10.2151/jmsj1965.55.1_139, 1977. a
Takahashi, T., Nagao, Y., and Kushiyama, Y.: Possible High Ice Particle Production during Graupel–Graupel Collisions, Journal of Atmospheric Sciences, 52, 4523–4527, https://doi.org/10.1175/1520-0469(1995)052<4523:PHIPPD>2.0.CO;2, 1995. a, b
Tonttila, J., Maalick, Z., Raatikainen, T., Kokkola, H., Kühn, T., and Romakkaniemi, S.: UCLALES–SALSA v1.0: a large-eddy model with interactive sectional microphysics for aerosol, clouds and precipitation, Geosci. Model Dev., 10, 169–188, https://doi.org/10.5194/gmd-10-169-2017, 2017. a, b
Tonttila, J., Afzalifar, A., Kokkola, H., Raatikainen, T., Korhonen, H., and Romakkaniemi, S.: Precipitation enhancement in stratocumulus clouds through airborne seeding: sensitivity analysis by UCLALES-SALSA, Atmos. Chem. Phys., 21, 1035–1048, https://doi.org/10.5194/acp-21-1035-2021, 2021. a, b
Tonttila, J., Korpinen, A., Kokkola, H., Romakkaniemi, S., Fortelius, C., and Korhonen, H.: Interaction between Hygroscopic Seeding and Mixed-Phase Microphysics in Convective Clouds, Journal of Applied Meteorology and Climatology, 61, 1533–1547, https://doi.org/10.1175/JAMC-D-21-0183.1, 2022. a, b
UCAR/NCAR – Earth Observing Laboratory: SPICULE: Giant Cloud Condensation Nuclei (CCN) Impactor Data, Version 1.0, Earth Observing Laboratory Field Data Archive [data set], https://doi.org/10.26023/C70R-BFS8-4M0J, 2021. a
UCAR/NCAR – Earth Observing Laboratory: SPICULE: Low Rate (LRT – 1 sps) Navigation, State Parameter, and Microphysics Flight-Level Data, Version 2.2, Earth Observing Laboratory Field Data Archive [data set], https://doi.org/10.26023/SXJ1-0JC5-0Y0V, 2023. a
Varble, A. C., Igel, A. L., Morrison, H., Grabowski, W. W., and Lebo, Z. J.: Opinion: A critical evaluation of the evidence for aerosol invigoration of deep convection, Atmos. Chem. Phys., 23, 13791–13808, https://doi.org/10.5194/acp-23-13791-2023, 2023. a, b, c
Waman, D., Patade, S., Jadav, A., Deshmukh, A., Gupta, A. K., Phillips, V. T. J., Bansemer, A., and DeMott, P. J.: Dependencies of Four Mechanisms of Secondary Ice Production on Cloud-Top Temperature in a Continental Convective Storm, Journal of the Atmospheric Sciences, 79, 3375–3404, https://doi.org/10.1175/JAS-D-21-0278.1, 2022. a
Weiss, J.: Fracture and fragmentation of ice: a fractal analysis of scale invariance, Engineering Fracture Mechanics, 68, 1975–2012, https://doi.org/10.1016/S0013-7944(01)00034-0, 2001. a
Wieder, J., Ihn, N., Mignani, C., Haarig, M., Bühl, J., Seifert, P., Engelmann, R., Ramelli, F., Kanji, Z. A., Lohmann, U., and Henneberger, J.: Retrieving ice-nucleating particle concentration and ice multiplication factors using active remote sensing validated by in situ observations, Atmos. Chem. Phys., 22, 9767–9797, https://doi.org/10.5194/acp-22-9767-2022, 2022. a
Wildeman, S., Sterl, S., Sun, C., and Lohse, D.: Fast Dynamics of Water Droplets Freezing from the Outside, Physical Review Letters, 118, 0841011–0841015, https://doi.org/10.1103/PhysRevLett.118.084101, 2017. a
Young, G., Lachlan-Cope, T., O'Shea, S. J., Dearden, C., Listowski, C., Bower, K. N., Choularton, T. W., and Gallagher, M. W.: Radiative Effects of Secondary Ice Enhancement in Coastal Antarctic Clouds, Geophysical Research Letters, 46, 2312–2321, https://doi.org/10.1029/2018GL080551, 2019. a
Zhao, X., Liu, X., Phillips, V. T. J., and Patade, S.: Impacts of secondary ice production on Arctic mixed-phase clouds based on ARM observations and CAM6 single-column model simulations, Atmos. Chem. Phys., 21, 5685–5703, https://doi.org/10.5194/acp-21-5685-2021, 2021. a, b