the Creative Commons Attribution 4.0 License.
the Creative Commons Attribution 4.0 License.
 | 29 Oct 2025
A novel framework for assessing regional wildfires contributions to biomass burning aerosol optical depth
Michalina Broda
Olga Zawadzka-Mańko
Krzysztof Markowicz
Peng Xian
Edward Hyer
Biomass burning (BB) aerosol significantly affects climate by altering the radiation budget and atmospheric chemistry. Accurate source estimation is vital for climate modeling, yet global observations remain scarce. This study introduces a novel framework for assessing the contribution of transported BB aerosol to smoke-associated aerosol optical depth (BB AOD) at selected locations. The approach integrates satellite fire data (Moderate Resolution Imaging Spectroradiometer Active Fire Product) with air parcel trajectory models (HYSPLIT), aerosol transport models (NAAPS), BB emissions (FLAMBE), and plume rise (CAMS GFAS).
Tested in Warsaw (Poland, Central Europe) over 2006–2022, the methodology reveals a prominent influence of long-range BB aerosol transport from North America. Analysis indicates that USA (without Alaska) (37.3 %±3.4 %), Canada (25.4 %±6.7 %) and the Alaska (2.6 %±2.1 %) together contribute approximately 65 % of BB AOD during the BB season in the Northern Hemisphere, surpassing nearer European sources. Among European regions, Eastern Europe accounts for 16.6 %±5.3 % of BB AOD, followed by the Iberian Peninsula (10.6 %±1.5 %) and Southern Europe (7.5 %±2.1 %). Incorporating vertical plume dynamics is crucial: a planetary boundary layer plume-top threshold underestimates Canadian contribution while overestimating European sources, whereas removing altitude constraints overestimates Canadian influence. These findings underscore the importance of transatlantic transport, plume-rise processes, and vertical aerosol distribution in regional climatology.
The presented framework for assessing BB AOD contributions is universal and can be applied at any location. Future work should incorporate the specific aerosol types emitted during BB events and their aging processes.
- Article
(5655 KB) - Full-text XML
- BibTeX
- EndNote


Biomass burning (BB) aerosol affects the Earth's climate by altering the radiation budget, disrupting the hydrological cycle and often changing the chemistry of the atmosphere (Crutzen and Andreae, 1990; Jacobson, 2014; Reid et al., 2005). It absorbs or scatters solar radiation and also serves as condensation nuclei for cloud droplets (Liu et al., 2020; Moroni et al., 2020). However, characterizing the quantitative impact of BB aerosol on the global radiation balance is very difficult because they have strong temporal and spatial variability (van Leeuwen and van der Werf, 2011; Chuvieco et al., 2021; van der Werf et al., 2006). Moreover, according to the Sixth Assessment Report of the Intergovernmental Panel on Climate Change (IPCC), there is a global shortage of observations of carbonaceous aerosol (Szopa et al., 2021; Brown et al., 2021), which further complicates the characterization of their quantitative impact on the Earth's climate. Vertical distribution is also an important factor while considering the effect of BB aerosol suspended in the atmosphere (Walter et al., 2016; Jacobson, 2014; Gupta et al., 2021). Due to advection, aerosol can move over a large area during their lifetime (d) and can travel a considerable distance from the source region (Szkop and Pietruczuk, 2017; Markowicz et al., 2016; Stachlewska et al., 2018; Ancellet et al., 2016). The BB aerosol itself can exhibit opposite behavior depending on what it is composed of – if organic carbon predominates in the BB aerosol, the scattering effect dominates (Bond et al., 2013; Thornhill et al., 2021). If the noticeable part is black carbon, absorption becomes significant (Jacobson, 2001, 2014; Bond et al., 2013). Such differences in BB aerosol depend on the different vegetation types that burned down and its aging process, which consists of condensation, oxidation, coagulation and water uptake (Engelhart et al., 2012; Shi et al., 2019).
Global BB aerosol direct radiative forcing (RF) is low, equal to −0.07 Wm−2 (Brown et al., 2021). This near-zero RF of BB aerosol results from the offsetting effect of a positive RF from black carbon being balanced by a negative RF from organic aerosol (Myhre et al., 2013). On regional scales, however, direct RF due to the inflow of BB aerosol may be large. In the Amazon Basin, there was registered RF due to BB events of around −30 to −40 Wm−2 (Sena et al., 2013), −20 Wm−2 in Southeast Asia (Li et al., 2022), and −15 to −25 Wm−2 in Sub-Saharan Africa (Zhang et al., 2014). In Central Europe, during the transport of BB aerosol from Canadian wildfires in July 2013, the direct radiative forcing was estimated to reach up to at the ground level (Markowicz et al., 2016). It can change the altitude of the planetary boundary layer (PBL) and make the atmosphere in the PBL more stable (Singh et al., 2020; Luo et al., 2022; Walter et al., 2016; Zawadzka et al., 2017).
When detecting BB aerosol in the atmosphere, it should be considered that aerosol suspended in the atmosphere is usually a mixture of local and long-range transported fine particles. Hence, it is usually very difficult to identify the source of the observed aerosol load (Zhang et al., 2018; Poulain et al., 2021; Martins et al., 2018). While several studies have reported incidents of BB aerosol influx over Europe, comprehensive analyses of these phenomena, particularly over Central Europe, are still scarce. Nevertheless, smoke layers over Central Europe have been documented in earlier work. A pronounced aerosol layer at 3–6 km over Germany in August 1998 was attributed to Canadian wildfires (Forster et al., 2001). Potential smoke layers over Warsaw spanning a range of source regions were examined by Janicka et al. (2023), who found that layers that could originate from North America occurred between about 2–8.5 km, whereas layers attributed to Eastern Europe were most frequently detected between 2–4 km, with some reaching as high as 7 km. In addition, (Ortiz-Amezcua et al., 2017) reported smoke layers of 1–2 km thickness located at roughly 5 km above sea level () over Granada and Leipzig, and around 2.5 over Warsaw, linked to long-range transport from North America. On 2 June 2013, there was a transport of BB aerosol from Canada to Europe (Markowicz et al., 2021a; Ortiz-Amezcua et al., 2017). The BB aerosol influx led to an anomalous increase of total Aerosol Optical Depth (AOD) – up to 1.5, several times bigger than the mean value of AOD in Poland, which is 0.22 (Markowicz et al., 2024). Another event of BB aerosol transport over Poland was registered in August 2015 and its origin was attributed to fires in Ukraine (Szkop and Pietruczuk, 2017; Markowicz et al., 2021a). During this event, BB aerosol caused aerosol RF equal to on the Earth's surface and led to increased AOD up to 0.6. BB aerosol had also an impact on sensible and latent heat fluxes – averaging over the day, during the BB aerosol inflow event, the sensitivities of sensible heat, latent heat fluxes and radiation fluxes to AOD were reduced by about 50 %, 20 %, and 70 %, respectively (Markowicz et al., 2021a). The next occurrence of inflow of BB air masses was described by Stachlewska et al. (2018), in which fresh, 1 d-old BB aerosol mixed with 3–5 d-old aerosol from Ukraine was detected in Warsaw. An increase in AOD, Ångström exponent, and surface PM10 and PM2.5 were registered.
Given the diverse vegetation types across source regions and the aging processes that BB aerosol undergoes during transport, identifying its origins is essential. This knowledge is crucial for accurately assessing its impact on atmospheric properties and RF. Therefore, this study aims to estimate the percentage contribution of BB aerosol to the AOD associated with smoke (BB AOD) arriving in Warsaw from specific regions: Canada, USA excluding Alaska (hereafter USA) and Alaska, Eastern Europe, Southern Europe, and the Iberian Peninsula during the years 2006–2022, focusing on the months from May to September when the Northern Hemisphere experiences the highest incidence of significant fires. This work represents a first step toward understanding how BB aerosol affects the atmosphere over Central Europe, contributing to the missing knowledge necessary for climate impact modeling.
The paper is divided into several sections. Section 2 outlines the methodology, including a description of the data sources and data processing. Section 3 presents the results, and Sect. 4 provides conclusions drawn from the results.
To assess the contribution of BB regions to BB AOD at a selected location during the BB season, a new framework was developed. This methodology integrates satellite data of fire outbreaks (Moderate Resolution Imaging Spectroradiometer (MODIS) Active Fire) with models of air parcel trajectories HYbrid Single-Particle Lagrangian Integrated Trajectory (HYSPLIT), aerosol transport Navy Aerosol Analysis Prediction System (NAAPS), BB emissions Fire Locating and Monitoring of Burning Emissions (FLAMBE), and plume rise Copernicus Atmosphere Monitoring Service Global Fire Assimilation System (CAMS GFAS). The framework was tested on Warsaw (Poland) for the years 2006–2022, allowing the identification of potential BB aerosol sources and estimation of their percentage contributions to BB AOD in Warsaw.
2.1 Data
2.1.1 MODIS Active Fire Product
MODIS is a scanning radiometer onboard NASA's polar-orbiting Terra and Aqua satellites, which orbit at 705 km in a near-polar, sun-synchronous path to capture data at consistent sun angles. MODIS provides near real-time fire location and thermal anomaly data, disseminated by the Fire Information for Resource Management System (FIRMS) (NASA FIRMS, 2024a).
The MODIS Fire and Thermal Anomalies algorithm (MCD14DL V0061, NASA FIRMS, 2024b) flags the center of a 1 km pixel as a thermal anomaly or active fire if at least one fire is detected within the pixel. Active fire detection utilizes mid-infrared bands 21 (3.96 µm) and 22 (3.96 µm) for high-temperature sensitivity and thermal infrared band 31 (11 µm) to distinguish fires from background temperature variations (Giglio et al., 2003). Data from 2001 to 2022 were obtained from NASA FIRMS (2024a) for this research.
2.1.2 HYSPLIT
The HYSPLIT model is a key tool in atmospheric sciences for simulating air parcel trajectories and modeling complex processes like transport, dispersion, chemical transformations, and deposition. It employs a hybrid calculation approach: the Lagrangian method tracks air parcels using a moving reference frame for advection and diffusion, while the Eulerian approach uses a fixed 3D grid to calculate pollutant concentration. The model calculates the movement of each parcel based on meteorological data like wind speed and direction, pressure, and temperature (Stein et al., 2015). For this research, the model used meteorological inputs from the Global Data Assimilation System (GDAS). Data on archive trajectories were obtained from NOAA (2024) for the months April–September, covering the years 2006–2022.
2.1.3 NAAPS
NAAPS, based on the Danish Eulerian Hemispheric Model (Christensen, 1997), is a global offline aerosol transport model that generates 6 d deterministic forecasts for combined anthropogenic and biogenic fine particles, smoke, sea salt, and dust (Lynch et al., 2016). Aerosol output is resolved on 25 vertical levels at every 6 h (Rubin et al., 2016). The model solves the advection-diffusion equation at each grid point for each species, which is controlled by the NAVy Global Environmental Model (NAVGEM) (Hogan et al., 2014).
For each aerosol species, source areas and emission values from the Earth's surface are parameterized (Lynch et al., 2016). The flux of smoke particles is derived from the Fire Locating and Modeling of Burning Emissions (FLAMBE) inventory, which uses a source function based on near-real-time satellite thermal anomaly data from MODIS fire hotspot observations (Reid et al., 2009). NAAPS Reanalysis (NAAPS-RA) output is available at 6 hourly intervals, with 1°×1° resolution (Lynch et al., 2016). NAAPS-RA was shown to have comparable skills in simulating AOD in an intercomparison study with other aerosol reanalysis products (Xian et al., 2024). For this research, data on AOD and BB AOD at 550 nm were downloaded from Naval Research Laboratory, Marine Meteorology Division (2024) for the months March–October, covering the years 2006–2022.
2.1.4 FLAMBE
FLAMBE program (Reid et al., 2009), initiated in 1999, is a collaboration between the U.S. Navy, NASA, NOAA, and the academic community. It integrates fire detection algorithms like NOAA/NESDIS's Wild-Fire Automated Biomass Burning Algorithm (WF_ABBA) and NASA's MODIS fire products to monitor BB emissions, incorporating these data into the NAAPS model to study smoke particle emissions and their atmospheric transport on regional to continental scales (Reid et al., 2009).
FLAMBE employs a source function based on active fire detections and a simple scaling approach using a 1 km land cover database (Reid et al., 2009; Lynch et al., 2016). Due to changes in the geostationary satellite constellation during the reanalysis period, a polar-only version of FLAMBE was developed for consistency (Lynch et al., 2016).
For this research, data on fire size and emissions from April to September for the years 2006–2022 were utilized.
2.1.5 CAMS GFAS
CAMS GFAS assimilates fire radiative power (FRP) observations from satellite-based sensors to produce daily estimates of BB emissions (Kaiser et al., 2012; Rémy et al., 2017). This system includes information on the altitude at which fire emissions are released, derived from FRP observations and combined with meteorological data from the European Centre for Medium-Range Weather Forecasts (ECMWF) (Di Giuseppe et al., 2018).
CAMS GFAS data cover the period from 2003 (Rémy et al., 2017). The data are provided globally on a regular latitude-longitude grid with a horizontal resolution of 0.1°. For this research, data on plume top altitude were downloaded from GFAS (2024) for the months May–September, covering the years 2006–2022.
2.2 Methodology
The methodology described below consists of two parts: “Preparatory Work” and the main part, i.e. “Deriving Regional Contribution to BB AOD at a Selected Location”. The first part outlines the identification of months corresponding to the BB season and potential sources of BB aerosol emissions for the selected location, as well as the analysis of BB AOD and AOD at the chosen location. The second part describes the methodology used to estimate the contribution of these regions to BB AOD at the selected location.
2.2.1 Preparatory work
An initial analysis of fire frequency in the Northern Hemisphere using the Fire Active Product identified seven main potential source regions for BB aerosol reaching Poland. Regions such as Africa and Asia were excluded (with the exception of the Ural region) as they were deemed impossible to reach due to terrain and atmospheric circulation. The analysis also revealed that the wildfire season in the Northern Hemisphere occurs during the months of May–September.
Subsequently, the probability of air parcels arriving over Poland from these fire locations was calculated as the percentage of simulated forward trajectories from each source point that reached Poland, defined within coordinates (see Fig. 8a).
Trajectories were simulated using the HYSPLIT model daily at 12:00 UTC for May–September 2006–2022. Starting points represented regions with the highest fire frequency around Europe (including areas near the Ural Mountains) and North America. Simulations were conducted at altitudes from 500 m to 5000 m in 500 m intervals. Regions with low probabilities (<0.5 %) of trajectories reaching Poland were excluded from further research.
To estimate the contribution of BB from Northern Hemisphere fires to BB AOD in Warsaw, the monthly variability of BB AOD in Europe () in years 2006–2022 was examined. Then the focus was shifted to the monthly variability of BB AOD and AOD in Poland and Warsaw (52.2° N, 21° E) (Warsaw is marked in Fig. 8a) in years 2006–2022. Warsaw was chosen because of its central location and because its AOD and BB AOD values are almost the same as the mean values observed in Poland. Since Warsaw is not explicitly available in the reanalysis, interpolation was used to obtain AOD and BB AOD values.
2.2.2 Deriving regional contribution to BB AOD at a selected location
To estimate the contribution of identified regions to the BB AOD in selected location, such procedure was followed. The workflow summarizing the steps of the methodology is depicted in Fig. 1.
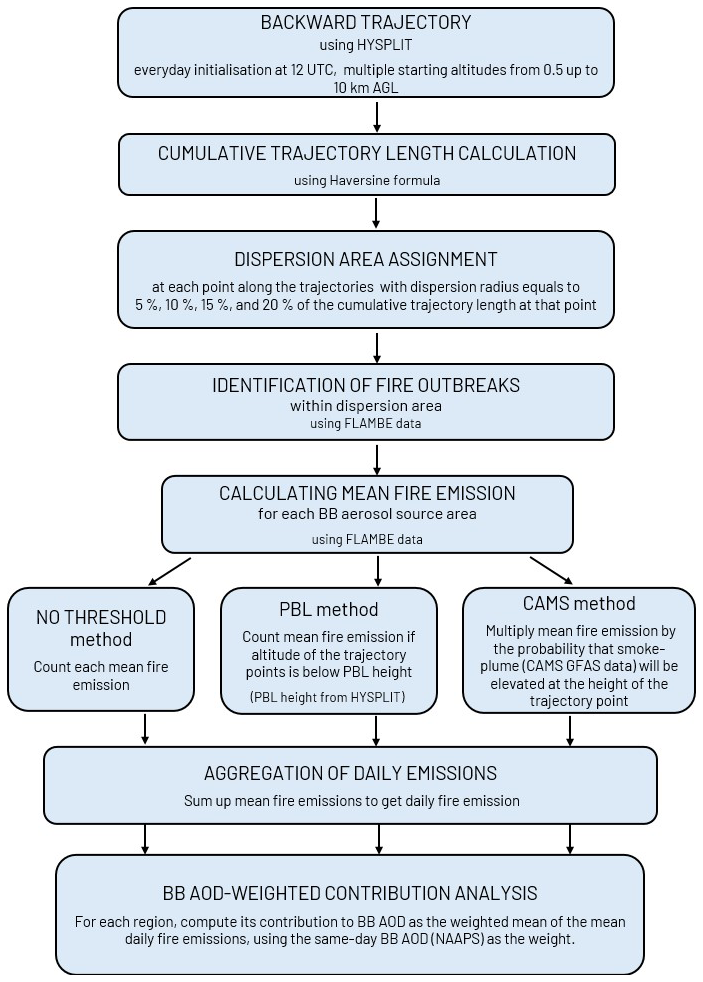
Figure 1Workflow diagram summarizing the methodological steps for estimating regional contributions to BB AOD at a selected location, including the data sources and models used.
-
Backward trajectory simulation:
For each day, generate backward trajectories originating at selected location at 12:00 UTC. Extend each trajectory 240 h (10 d) backward in time. Initialize each trajectory at multiple altitudes, starting from 500 up to 4000 m in increments of 500 , and additionally at 5000, 6000, 7000, 8000, 9000, and 10000 . For every starting height, run HYSPLIT twice: once with the height specified in metres () and once in metres above ground level (), with the latter run computed together with PBL height output (expressed in ). After computation, merge each – pair so that the resulting trajectory record contains both and height fields.
-
Cumulative trajectory length calculation:
For every backward trajectory, determine the cumulative distance traveled by each trajectory point. Since the HYSPLIT output does not directly provide trajectory length, apply the Haversine formula to compute the distance between successive coordinates. Summing these distances yields the cumulative length up to each point.
The Haversine formula used to compute the distance d between two points on Earth's surface is:
where REarth is the mean Earth radius (6370 km), θ1 and θ2 are the latitudes of the two consecutive trajectory points (separated by a time increment of 1 h), Δθ is the difference in latitude between the these two points, and Δϕ is the difference in longitude.
-
Dispersion area assignment:
At each point along the backward trajectories, assign a dispersion area to account for uncertainties in HYSPLIT output. Such uncertainties arise from model simplifications, the resolution of meteorological data, and accumulating simulation errors over time (Su et al., 2015; Koracin et al., 2011; Freitag et al., 2014). The dispersion area is defined as a square with sides equal to twice the dispersion radius r. This radius is assumed to be 5 %, 10 %, 15 %, and 20 % of the cumulative trajectory length at that point.
Once the dispersion area is defined, calculate the longitude deviation δϕ and the latitude deviation δθ to specify the rectangular boundaries of the dispersion area:
The deviations δϕ and δθ are computed using:
-
Identification of fire outbreaks:
Within the defined dispersion areas at each trajectory point, check for fire outbreaks that occurred on the same day with the outbreak hour not later than the hour of the trajectory point. If any fire outbreaks are found, assign them to one of the regions which during preparatory work were found to be a possible BB aerosol source. For each such source of BB aerosol and each dispersion area, apply three different methods to account for the fire emissions:
-
No Threshold method:
For each fire pixel within the dispersion area, calculate the fire emission as the product of the fire flux and the fire area. Then, compute the mean fire emission by dividing the sum of all fire emissions by the number of fire pixels.
-
PBL method:
Check whether the trajectory altitude is below the PBL height. If so, calculate the mean fire emission as described in the No Threshold method.
-
CAMS method:
Calculate the mean fire emission as described in the No Threshold method. Then, multiply it by the probability that the fire plume is elevated to the altitude of the trajectory point or higher. This probability is obtained by fitting a cumulative distribution function (CDF) to the CAMS GFAS top of the plume altitude data for the considered BB source region. A separate CDF is fitted for each BB source region. The plume-top altitude h is modeled using a log-normal distribution, for which the probability density function (PDF) is given by:
where h represents the plume-top altitude expressed in , while μ and σ are the mean and standard deviation of the natural logarithm of h, ln h, respectively. The CDF, representing the probability that the plume altitude does not exceed h, is defined as:
Accordingly, the probability that the fire plume extends beyond altitude h is:
This log-normal fit yields a Pearson correlation coefficient r of 1 with the observational data, indicating an excellent fit.
-
-
Aggregation of daily emissions:
For each source region, each emissions method and each dispersion radius, sum the mean fire emissions for each starting altitude, yielding the total fire emissions encountered for given day for each backward trajectory. Then, sum these totals across all starting altitudes to obtain a single daily emission value for each emissions method, each source region and each dispersion radius.
-
BB AOD-weighted contribution analysis:
For each study day, and for every emission method, source region, and dispersion radius, multiply the mean fire emission by the NAAPS-model BB AOD given at 12:00 UTC for that day at the analysis location. Then sum these BB AOD-weighted emissions over the entire study period and express each regional total as a percentage of the all-region sum for the given method and dispersion radius. The resulting percentages quantify how much each source region contributes to the overall BB AOD.
In this paper, the methodology was tested for Warsaw during the months of May–September for the years 2006–2022. The analysis was concluded with an examination of the temporal variability of contributions to BB AOD in Warsaw from identified regions, along with the trends of BB AOD, AOD, and their ratio in Poland and Warsaw in months May–September for the years 2006–2022.
3.1 Spatial patterns and drivers of fire activity
The average number of fires in BB season (in months May–September) for the years 2001–2022 retrieved from MODIS Fire Active Product data is presented in Figs. 2a, 3a, and 4a and b for Europe and Russia, and in Figs. 5a–7a for North America, including the US, Alaska, and Canada.
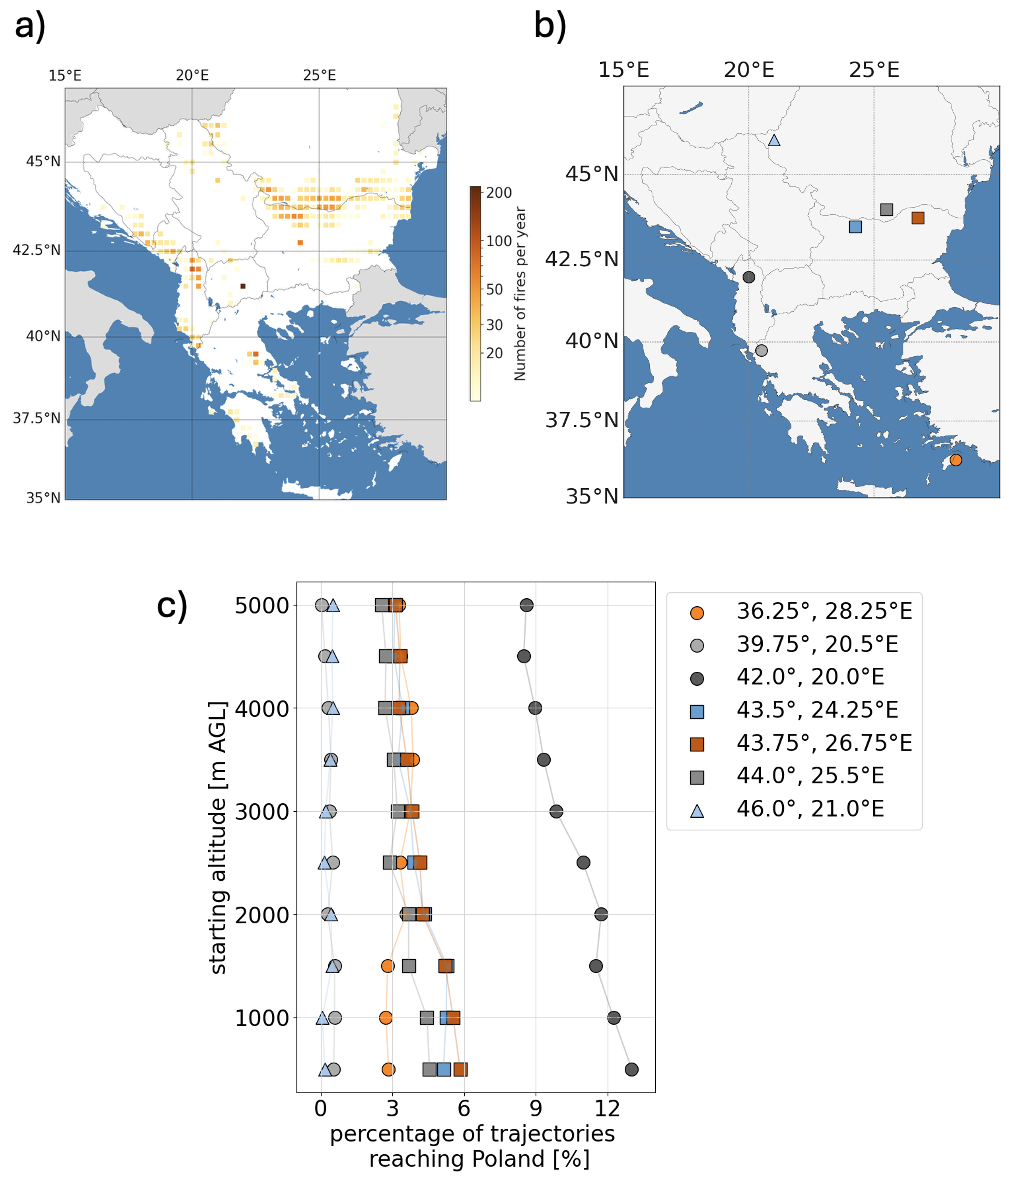
Figure 2Spatial analysis of fire events and trajectory analysis in Southern Europe. (a) displays the average number of fires during BB season (in months May–September) in the Southern European region over the period 2001–2022, with fire frequency represented on a logarithmic color scale. (b) shows the specific locations selected for trajectory analysis within this region. (c) presents the percentage of trajectories reaching Poland during BB season from each location defined in (b) as a function of starting altitude. Each symbol corresponds to a specific source point, as indicated in the legend.
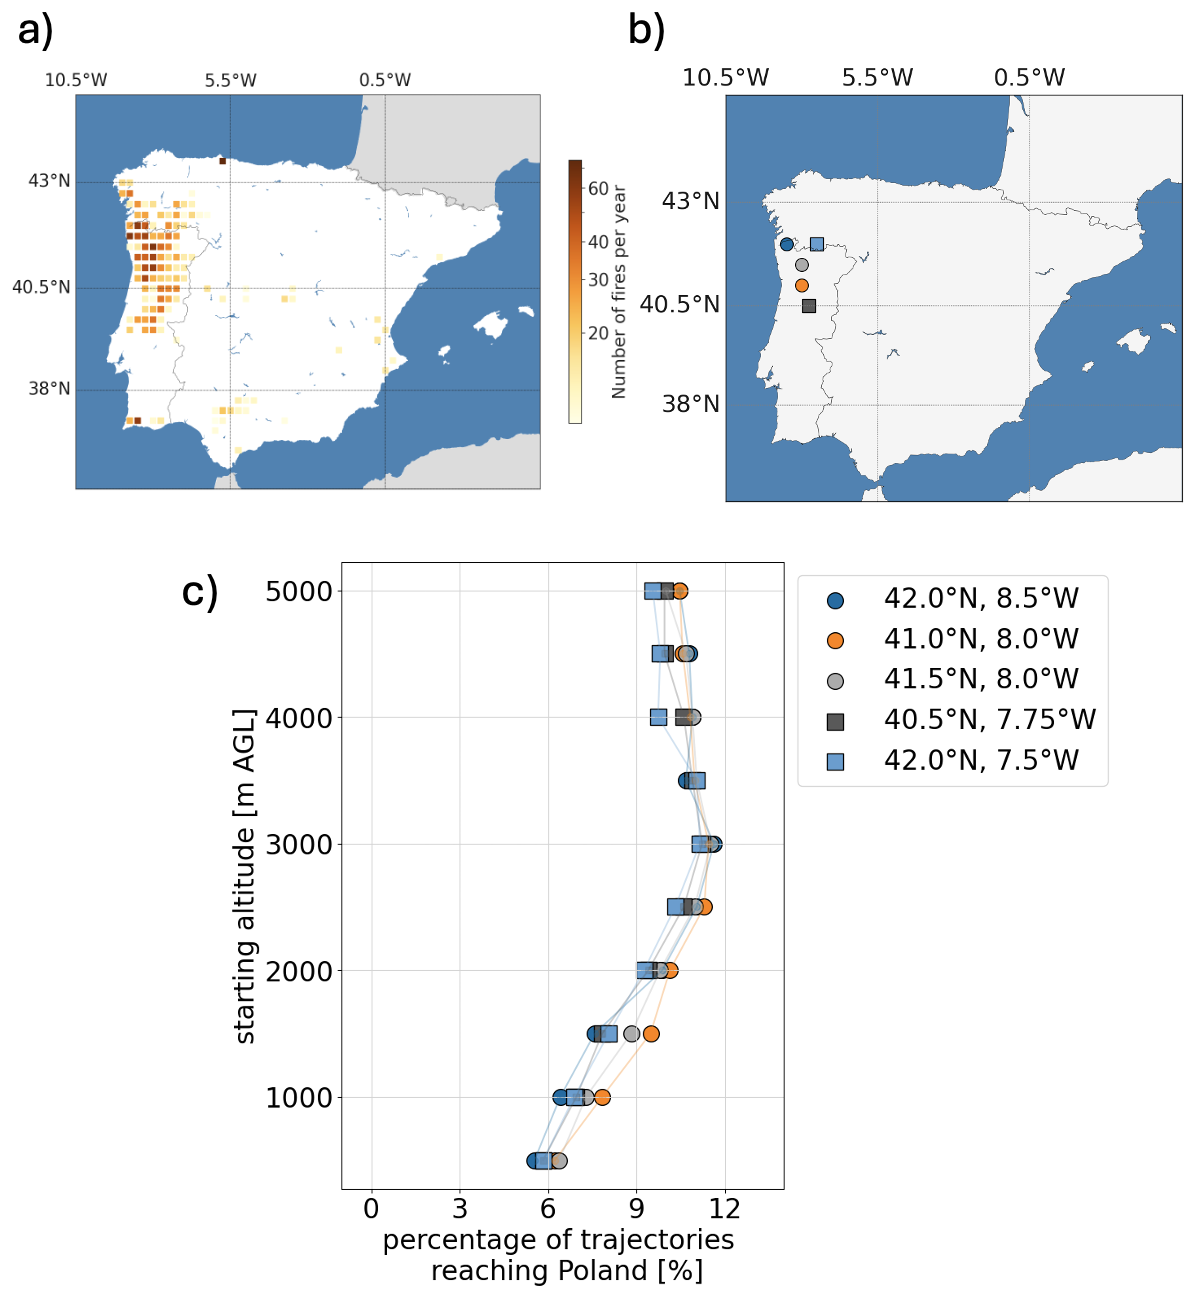
Figure 3Spatial analysis of fire events and trajectory analysis in the Iberian Peninsula. (a) displays the average number of fires during BB season (in months May–September) in the Iberian Peninsula over the period 2001–2022, with fire frequency represented on a logarithmic color scale. (b) shows the specific locations selected for trajectory analysis within this region. (c) presents the percentage of trajectories reaching Poland during BB season from each location defined in (b) as a function of starting altitude. Each symbol corresponds to a specific source point, as indicated in the legend.
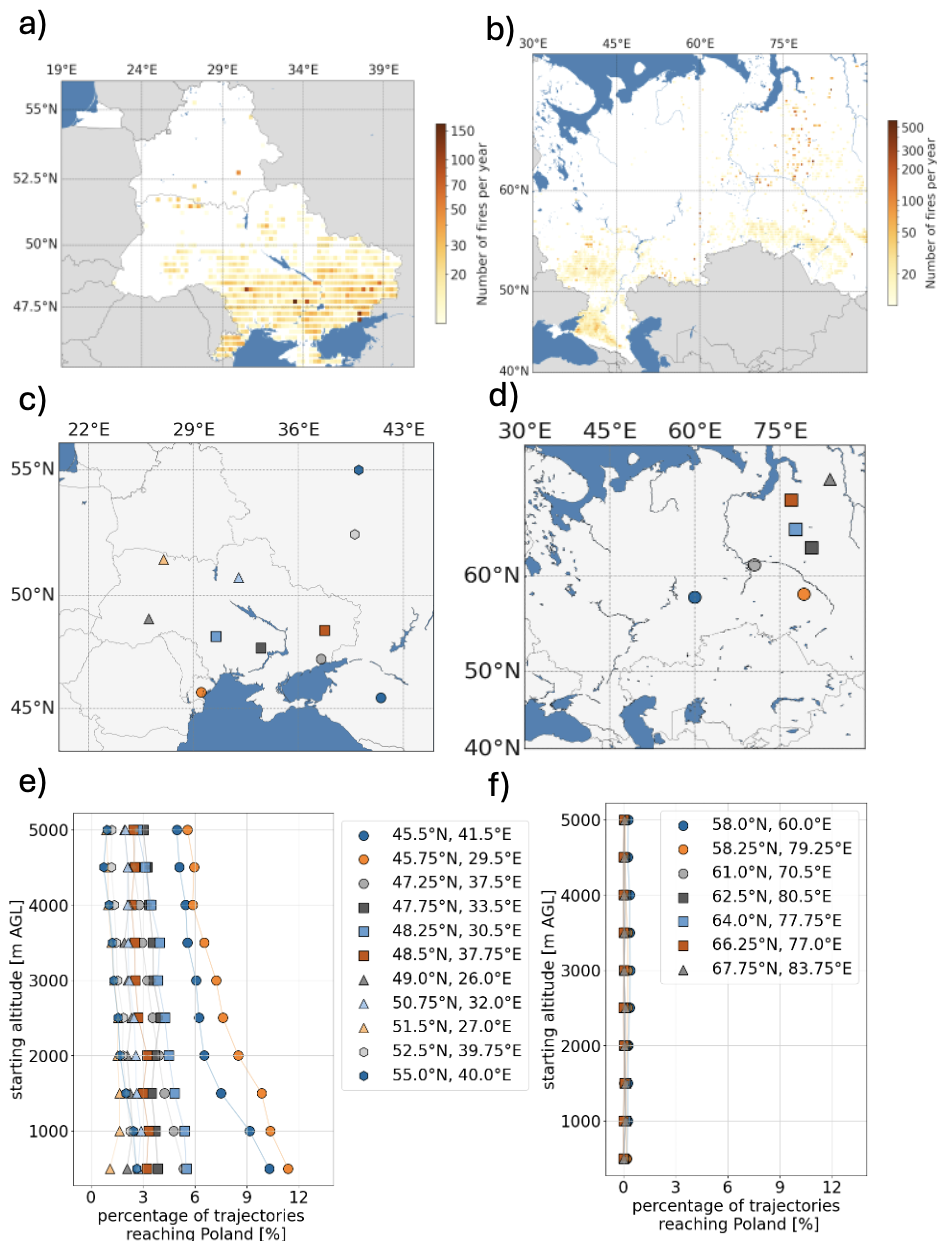
Figure 4Spatial analysis of fire events and trajectory analysis for two regions: Ukraine, Belarus, and the European part of Russia, as well as the area around the Ural Mountains. (a) displays the average number of fires during BB season (in months May–September) in the Ukraine–Belarus–European Russia region over the period 2001–2022, with fire frequency represented on a logarithmic color scale. (b) shows the average number of fires during BB season (in months May–September) in the Ural Mountains region over the same period, also using a logarithmic color scale. (c) highlights the specific locations selected for trajectory analysis within the Ukraine–Belarus–European Russia region, while (d) shows selected trajectory analysis points for the Ural Mountains region. (e) and (f) present the percentage of trajectories reaching Poland during BB season from each location defined in (c) and (d), respectively, as a function of starting altitude. Each symbol corresponds to a specific source point, as indicated in the legend.
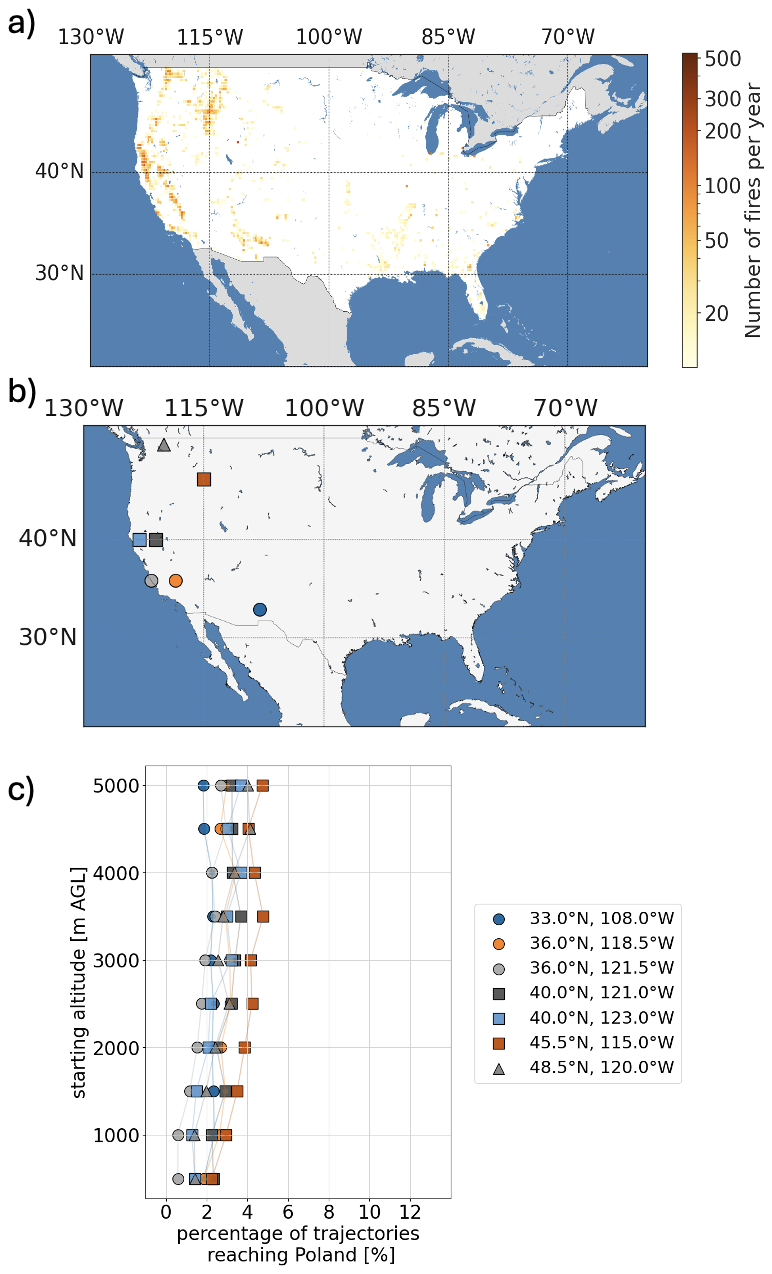
Figure 5Spatial analysis of fire events and trajectory analysis in the USA. (a) displays the average number of fires during BB season (in months May–September) in the USA over the period 2001–2022, with fire frequency represented on a logarithmic color scale. (b) shows the specific locations selected for trajectory analysis within this region. (c) presents the percentage of trajectories reaching Poland during BB season from each location defined in (b) as a function of starting altitude. Each symbol corresponds to a specific source point, as indicated in the legend.
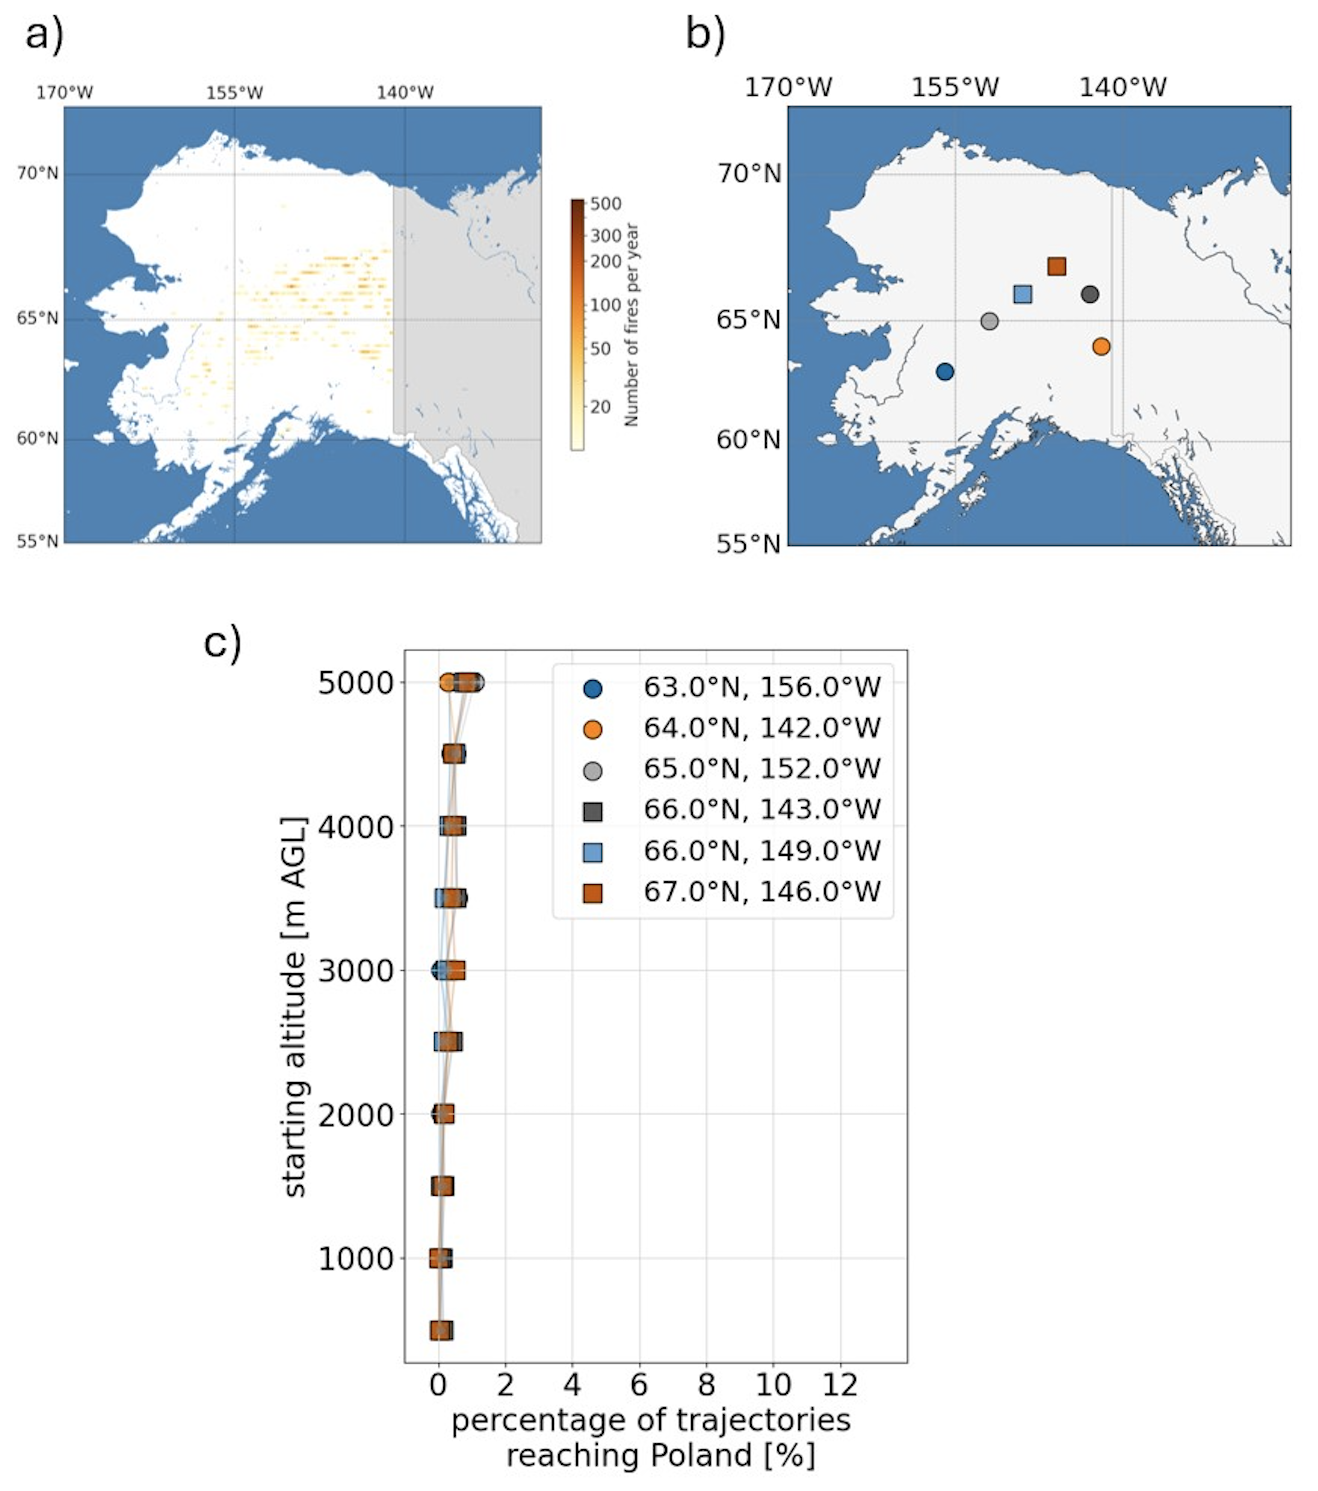
Figure 6Spatial analysis of fire events and trajectory analysis in Alaska. (a) displays the average number of fires during BB season (in months May–September) in Alaska over the period 2001–2022, with fire frequency represented on a logarithmic color scale. (b) shows the specific locations selected for trajectory analysis within this region. (c) presents the percentage of trajectories reaching Poland during BB season from each location defined in (b) as a function of starting altitude. Each symbol corresponds to a specific source point, as indicated in the legend.
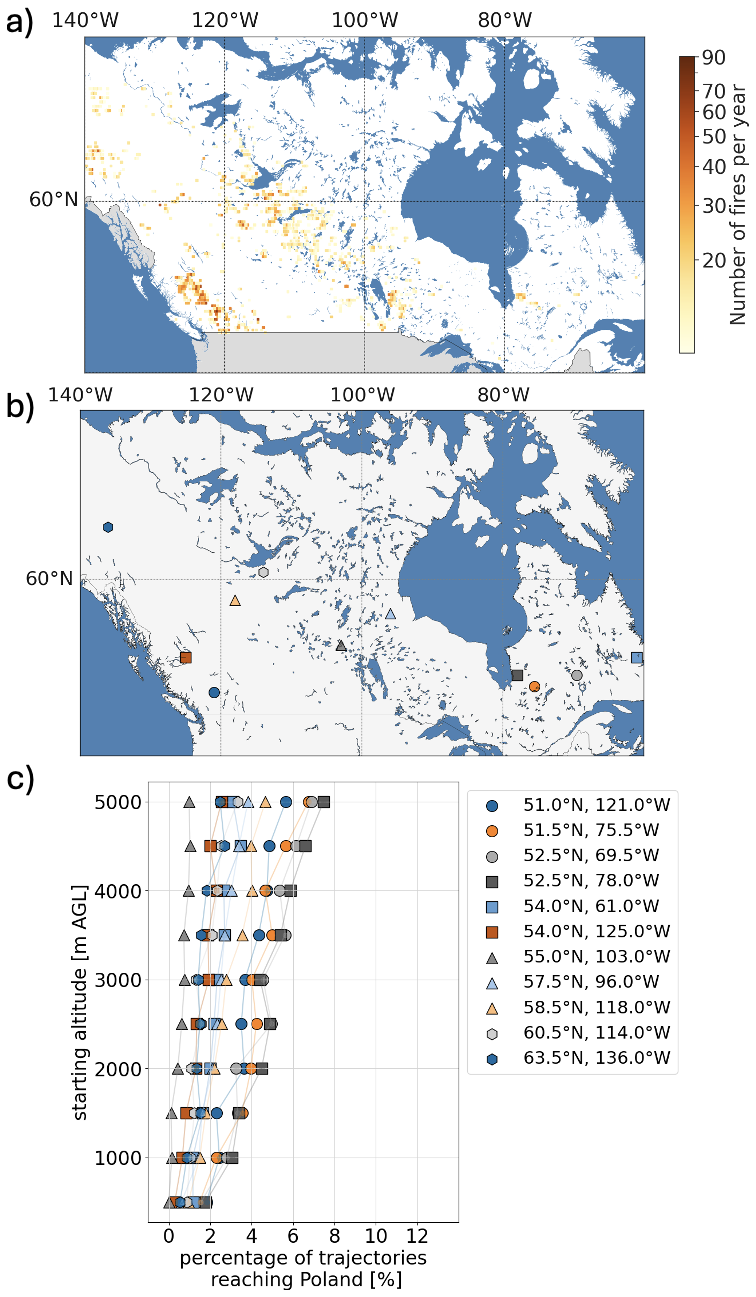
Figure 7Spatial analysis of fire events and trajectory analysis in Canada. (a) displays the average number of fires during BB season (in months May–September) in Canada over the period 2001–2022, with fire frequency represented on a logarithmic color scale. (b) shows the specific locations selected for trajectory analysis within this region. (c) presents the percentage of trajectories reaching Poland during BB season from each location defined in (b) as a function of starting altitude. Each symbol corresponds to a specific source point, as indicated in the legend.
Fire activity in Europe is most intense in Southern and Southeastern regions (Figs. 2a and 4a). The Balkans exhibit the highest fire density, with over 150 fires annually in some localized areas. This region is strongly influenced by dry Mediterranean climates and human activities, such as agricultural burning, vegetation management, and deliberate burning (Tedim et al., 2022). In Eastern Europe (Fig. 4a and b), fire activity is concentrated in Ukraine and the European part of Russia. Ukraine experiences frequent agricultural and grassland fires, particularly in its southern and eastern regions, where the number of fires in BB season reaches 150. These fires are often linked to stubble burning and other land-use practices during dry seasons (Hall et al., 2021). Fire activity in Russia (Fig. 4b) is predominantly concentrated in its boreal forests. Western Siberia and the European part of Russia experience some of the highest fire frequencies globally, with annual counts exceeding 500 in many areas. These fires are typically large-scale wildfires in remote, forested regions, driven by dry conditions, lightning activity, and climatic factors such as prolonged droughts and high temperatures (Tomshin and Solovyev, 2022). In the Iberian Peninsula (Fig. 3a), fire activity is particularly intense in the northern and central regions of Portugal. These areas experience over 60 fires in BB season, while the southern regions show lower fire frequencies, typically below 20 fires per year. This pattern is driven by the hot, dry Mediterranean climate, flammable vegetation like pine and eucalyptus (Rodrigues et al., 2020), human activity such as changes in farming and land use (Pereira et al., 2005), and the effects of climate change, including rising temperatures and prolonged droughts (Ruffault et al., 2020).
The western United States, particularly California, Oregon, and Washington (Fig. 5a), displays the highest fire activity, with localized areas experiencing over 500 fires annually. This is primarily due to dry climates, dense vegetation, prolonged droughts, and climate change increasing fuel aridity, which has doubled the cumulative forest fire area since the 1980s (Abatzoglou and Williams, 2016). In Alaska (Fig. 6a), fire activity is concentrated in central and northern regions, with annual counts exceeding 200 in some areas. These fires are largely driven by lightning and affect boreal forests and tundra ecosystems (Veraverbeke et al., 2017). Fire activity in Canada (Fig. 7a) is most pronounced in Western provinces, such as British Columbia and Alberta, where annual fire counts often reach 90. These regions are dominated by boreal forests and experience frequent wildfires due to dry summers and lightning activity (Wierzchowski et al., 2002).
There were also analyzed fire occurrences in Poland to take into account potential contribution of local BB to BB AOD. However, analysis showed that the frequency of fires in Poland is negligible, indicating that local BB has a minimal impact on BB AOD variability in Poland.
3.2 Trajectory analysis of air parcels and identification of smoke aerosol source regions
Based on the fire activity results, there were selected points to conduct the percentage statistics of air parcels flowing over Poland – see Figs. 2b, 3b, 4c and d, 5b–7b. The selected points, as well as the results of the statistical calculations, are shown in Figs. 2c, 3c, 4e and f, 5c–7c. These statistics show what is the percentage that an air parcel having such starting altitude as depicted on the y-axis will reach the Poland area. The points for conducting the trajectory analysis were selected based on a 0.25°×0.25° grid in the HYSPLIT model. This approach was chosen to balance the computational cost while ensuring representative results for the simulations.
The forward trajectory analysis revealed that points in Southern Europe (Fig. 2c) showed varying statistics. Some locations, such as 46° N, 21° E, and 39.75° N, 20.5° E, exhibited a less than 0.5 % chance of an air parcel from these regions reaching Poland during May–September. However, other points showed higher probabilities, ranging between 2 %–6 % (e.g. 43.5° N, 24.25° E). A particularly distinct point, located at 42° N, 20° E, had the highest probability, with values ranging from 8 % to 12.5 %. There was no significant variability observed between the starting altitude and the percentage chance of an air parcel reaching Poland, except for the point at 42° N, 20° E. For this point, a lower starting altitude of the air parcel increased the probability of reaching Poland. In conclusion, the region of Southern Europe should be considered when assessing contributions from these areas. The region is shown in Fig. 8a.
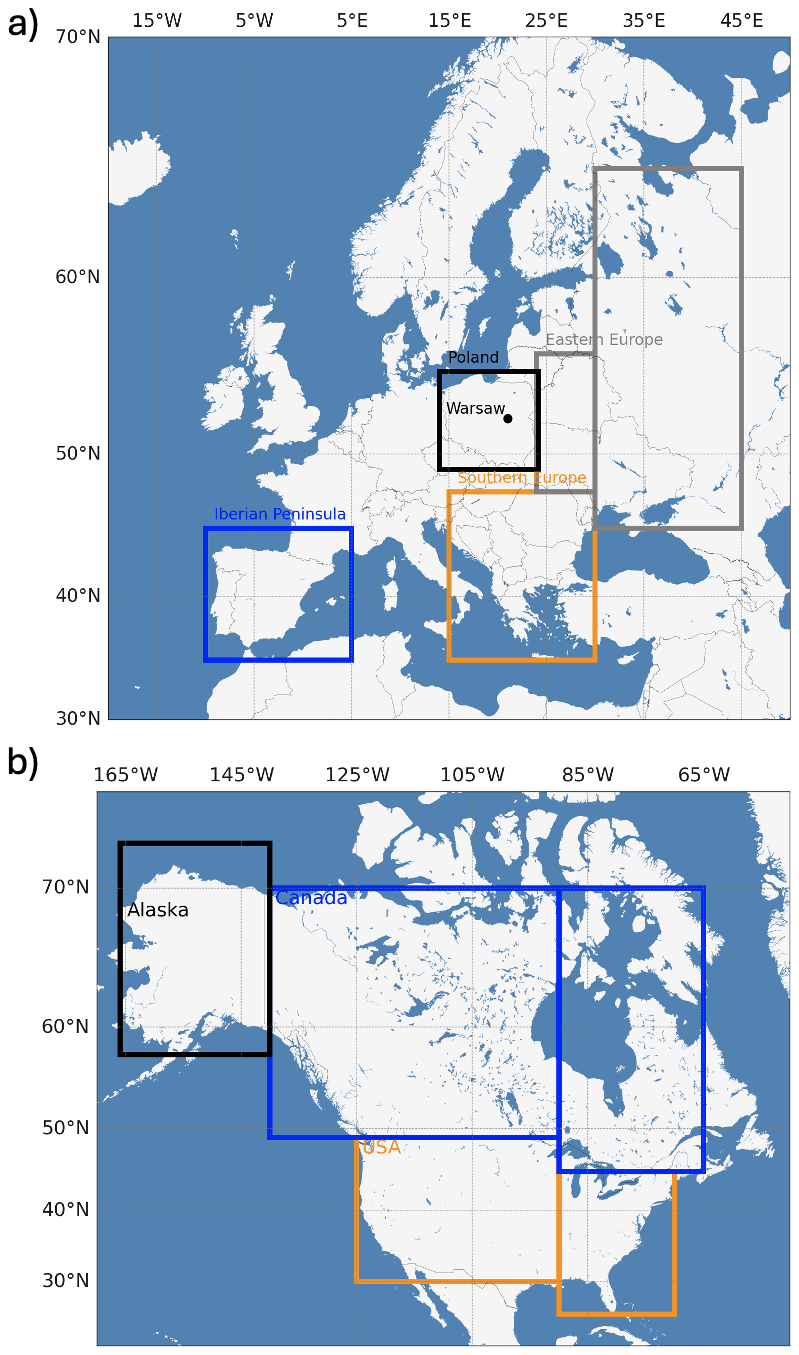
Figure 8Geographic regions used in the analysis of AOD, BB AOD, and contributions to BB AOD in Warsaw. (a) shows Europe with the designated areas: Poland (highlighted by the black rectangle), Iberian Peninsula (blue rectangle), Southern Europe (orange rectangle), and Eastern Europe (gray rectangles). Warsaw, marked as a point within Poland at coordinates 52.2° N, 21° E, served as the location for estimating BB AOD contribution, launching backward trajectories and for conducting AOD and BB AOD analyses. (b) displays North America with designated areas for the USA, Canada and Alaska. The USA region is outlined in orange, the Canada in blue and the Alaska in black. These regions were analyzed for their contributions to BB AOD levels in Warsaw, with each area serving as a source region of BB aerosol.
Examining the results obtained for Portugal (Fig. 3c), a noticeable pattern emerges: up to a starting altitude of 3000 m, the probability that an air parcel will reach Poland increases with altitude, following an almost linear relationship. This probability ranges from approximately 6 % for a starting altitude of 500 m, up to 11 % for a starting altitude of 3000 m. Above this altitude, the percentage chance decreases with increasing altitude, ranging from 9 % to 11 %. Based on this analysis, Portugal exhibits a significant probability of air parcels inflowing over Poland. Additionally, considering the fire activity on the whole Iberian Peninsula (see Fig. 2a), the entire Iberian Peninsula was included in the contribution assessment, as shown in Fig. 8a.
Analyzing the results for Russia beyond the Ural Mountains(Fig. 4f), it is evident that the probability of air parcels from these regions reaching Poland is so low that these points can be excluded from further research. In contrast, in the European part of Russia and Ukraine (Fig. 5e), there are points where the probability does not vary with starting altitude, ranging from 1 % (e.g. 51.5° N, 27° E) to 6 % (e.g. 48.25° N, 30.5° E). Two points exhibited the highest probability: 45.5° N, 41.5° E, and 45.75° N, 29.5° E. For these locations, the probability ranged from 6 % for the highest starting altitudes and increased up to 11 % for the lowest starting altitudes. Eastern Europe, which is expected to be a significant source of BB aerosol, is shown in Fig. 8a.
The trajectory analysis for North America suggests that Alaska (Fig. 6c) has a very low probability of air parcels from that region reaching Poland. When the starting altitude of an air parcel is below 4000 m, the probability of it reaching Poland is less than 0.5 %, and even at a starting altitude of 5000 m, the probability only increases to about 1 %. Although this probability is low, it exceeds the imposed threshold of 0.5 %, and therefore this region is included in further analysis. For the USA (Fig. 5c) and Canada (Fig. 7c), the probability of an air parcel reaching Poland is below 3.5 % when the starting altitude is below 1000 m, but increases with altitude. For example, at a starting altitude of 4000 m, the probability can reach up to 6 % (e.g. 52.5° N, 78° W). The USA, Alaska and Canada regions considered are shown in Fig. 8b.
For North America regions there was also performed an extended version of this analysis, using starting altitudes up to 10 . Results of such analysis are depicted in the Appendix (Fig. A1). For Alaska (Fig. A1c), the probability of trajectories reaching Poland increases sharply above 5 km, reaching about 6 % at 10 km. An altitude-dependent increase between 6–10 is also evident for Canada (Fig. A1a), where probabilities reach ∼12 % at 10 km. For the USA (Fig. A1b), some points show a rise with altitude (up to ∼12 % at 10 km), whereas others change little with height and remain in the 1 %–6 % range. This altitude dependence may reflect large-scale midlatitude westerly flow and trans-Atlantic transport associated with the polar jet stream, which can enhance the likelihood of trajectories reaching Poland. On the other hand, the probability of smoke from BB being lifted to altitudes above 5 km (based on CAMS GFAS data) is very low (see Sect. 3.5).
3.3 Monthly variability of BB AOD in Europe
Figure 9a–h depict the mean values of BB AOD in Europe averaged over the period 2006–2022 in each month from March to October. Data was obtained from NAAPS reanalysis at 550 nm. The highest BB AOD values are observed in August, with a peak over Ukraine (up to 0.125), likely driven by BB (wildfires, peatland fires, and residual burning), which is common in Eastern Europe during this time of year (Stohl et al., 2007; Markowicz et al., 2021a; Swindles et al., 2019; Galytska et al., 2017; Amiridis et al., 2008, 2010). Elevated BB AOD values are also noticeable over the Iberian Peninsula and parts of Southern Europe, reflecting regional contributions from wildfires and BB activities. Interestingly, BB AOD values are higher in March and April compared to May and June. This pattern can be attributed to early spring BB practices, such as agricultural waste burning and land management fires, which are prevalent during the planting season, particularly in Eastern Europe and Russia (Stohl et al., 2007; McCarty et al., 2012; Hall et al., 2021). BB activities decline in May and June as vegetation cover increases, with natural regrowth limiting the availability of burnable material and reducing the need for agricultural field clearing during this period (Stohl et al., 2007).
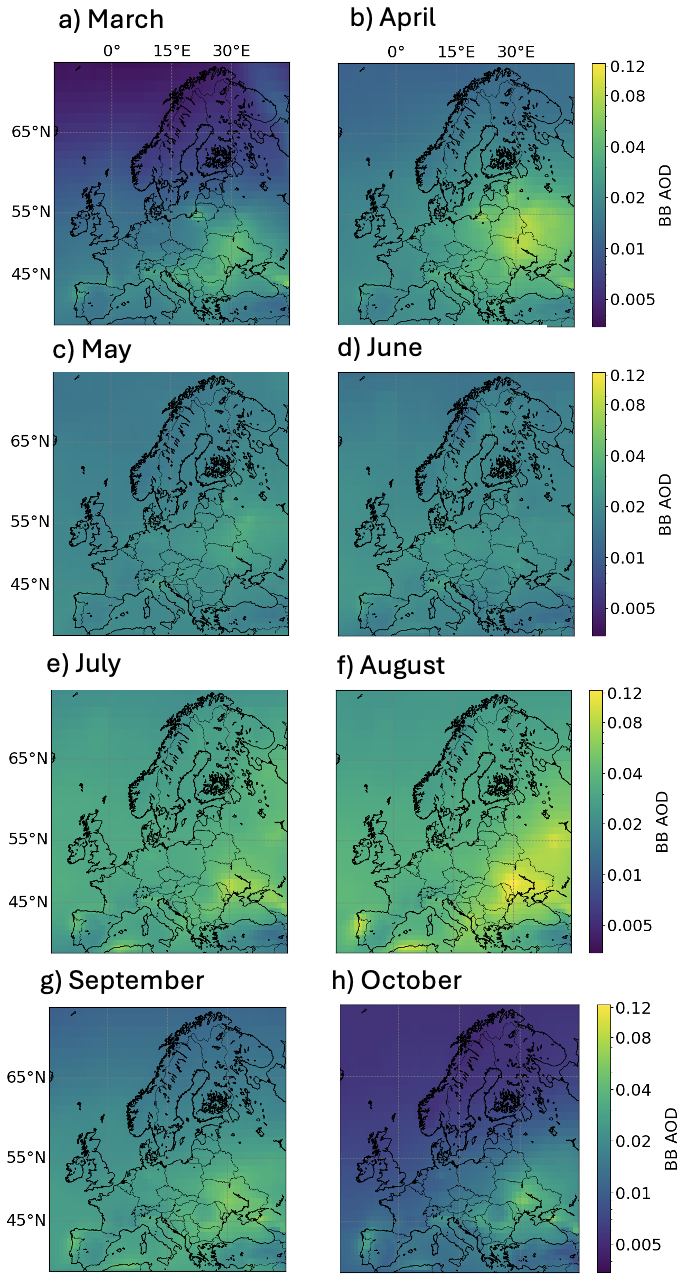
Figure 9Monthly mean values of BB AOD across Europe, displayed as spatial maps for selected months averaged over the period 2006–2022. Panels represent individual months from March (a) through October (h), illustrating the geographic variation in BB AOD concentrations. Each map shows BB AOD values averaged over the years 2006–2022. The color scale on the right denotes BB AOD values on a logarithmic scale.
The lowest BB AOD values occur in June, as seen in Fig. 9d, when burning activity is typically minimal due to agricultural cycles and early summer weather conditions. By contrast, late summer, i.e. July and August (Fig. 9e and f), experiences a sharp increase in BB AOD, with peaks in BB across Europe due to wildfires driven by high temperatures and dry conditions. This is particularly evident in regions such as Ukraine, the Iberian Peninsula, and the Balkans, where vegetation fires contribute significantly to elevated BB AOD values.
September and October (Fig. 9g and h) mark the start of the post-harvest burning period in some regions, particularly in Eastern Europe, where agricultural residue is burned to prepare fields for the next planting cycle (Hall et al., 2021). However, BB AOD values during these months are generally lower than those in early spring and late summer.
3.4 Monthly variability of BB AOD and AOD in Poland and Warsaw
The monthly mean values of NAAPS BB AOD, AOD, and BB AOD/AOD at 550 nm averaged over the period 2006–2022 are presented respectively in Fig. 10a–c. They are almost identical for both Warsaw (interpolated from grid space) and the whole of Poland. Figure 10a shows the monthly average BB AOD for both Poland and Warsaw, highlighting two distinct peaks: one in April (around 0.035) and another in August (around 0.04). The monthly variability of BB AOD in Poland and Warsaw aligns with the monthly variability of BB AOD in Europe described in Sect. 3.3 and fire activity occurring in summer in North America. The peak in April is closely related to agricultural residue burning during the spring planting season in Eastern Europe. Despite the observed peak in BB AOD over Eastern Europe during April, it was decided not to consider April as a BB month in our analysis due to the absence of significant fire detections by the MODIS satellite's Fire Active product in these regions during this period, especially in other regions than Eastern Europe, which leads to the conclusion that nothing else can influence the BB AOD variability. The second peak in August may be attributed to increased wildfire activity during the summer months in Europe and North America, exacerbated by drier conditions and elevated temperatures. The decrease in BB AOD during May and June aligns with the results presented in Fig. 9c and d and is attributed to vegetation regrowth. July also shows a noticeable rise in BB AOD (around 0.032), though it is lower than the August peak. In September, the BB AOD value (around 0.030) is slightly lower than in July and coincides with the still-lasting BB season in identified regions and may be enhanced by post-harvest agricultural residue burning in Eastern Europe. During late fall and winter, BB AOD remains low (below 0.01) due to the near absence of fire outbreaks in the Northern Hemisphere.
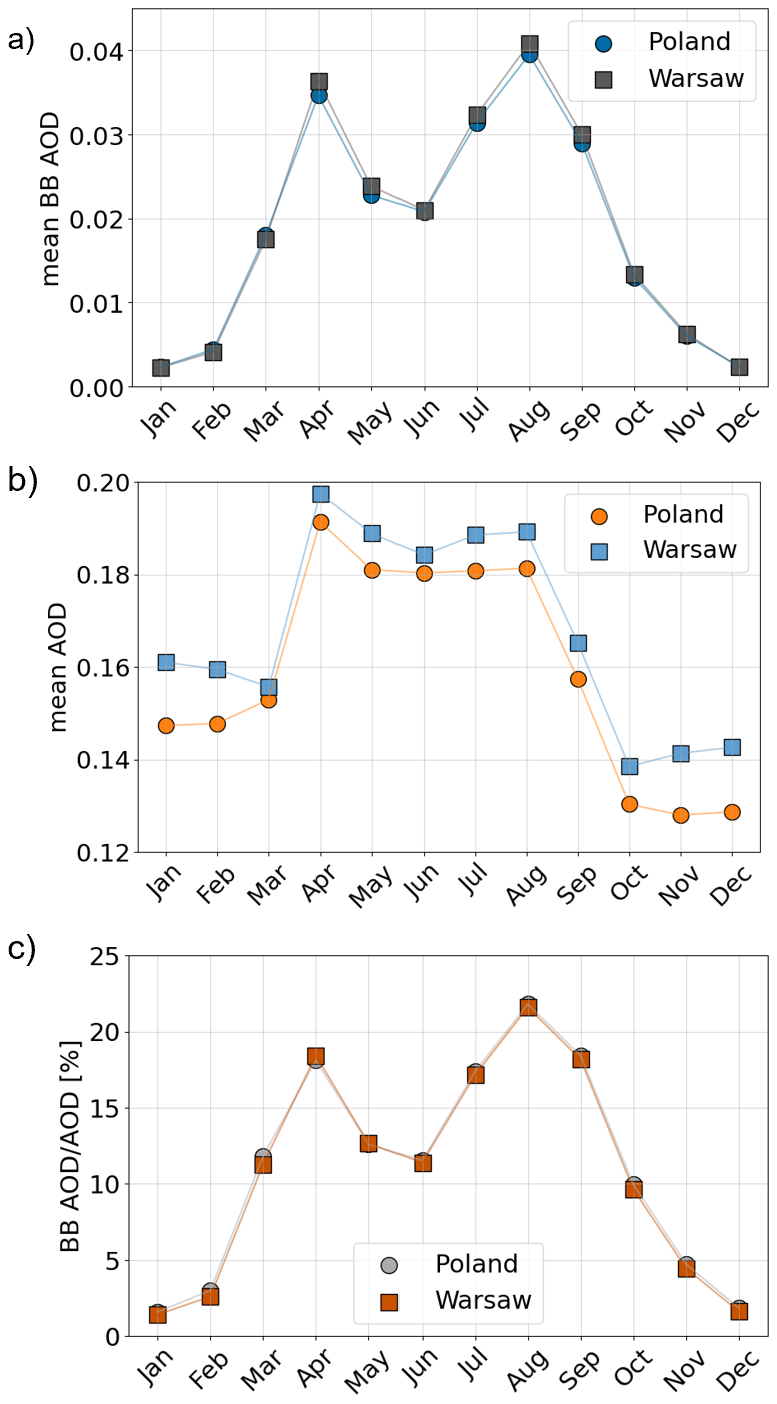
Figure 10Monthly values of BB AOD, total AOD at 550 nm, and their ratio for Poland and Warsaw averaged over the period 2006–2022. (a) displays the mean BB AOD values for each month, comparing Poland and Warsaw. (b) shows the monthly mean total AOD values for both Poland and Warsaw. (c) presents the ratio of BB AOD to total AOD, expressed as a percentage, for each month, comparing values between Poland and Warsaw.
The highest total AOD values are observed during the spring (April and May) and summer (June–August) months, with peak AOD value reaching approximately 0.2 in April, as shown in Fig. 10b. The April peak is primarily driven by agricultural residue burning in Eastern Europe during the planting season (Zawadzka et al., 2018; Markowicz et al., 2021b), occasional Saharan dust transport in late spring (Varga et al., 2013; Chilinski et al., 2016) and secondary aerosol formation (Li et al., 2012). From May to August, AOD levels remain relatively stable, ranging between 0.18–0.19. This stability can be attributed to consistent contributions from secondary aerosol formation (Li et al., 2012), BB, Saharan dust transport, and limited wet deposition during the dry summer months. AOD levels begin to drop in September due to reduced wildfire activity, cooler temperatures, and increased precipitation, which collectively lower aerosol concentrations. The lowest AOD values, around 0.125–0.140, are recorded in fall and winter (October–December). However, from October to January, AOD values in Warsaw are consistently higher than Poland's average by approximately 0.01, likely due to urban emissions from domestic heating, traffic, and industrial activities. These emissions are further intensified by winter temperature inversions that trap pollutants near the ground (Chambers and Podstawczyńska, 2019). AOD values in January–March are slightly higher than in October–December, reflecting more severe smog episodes caused by prolonged cold weather and increased heating emissions. In contrast, the milder temperatures and more frequent precipitation in the fall help reduce aerosol concentrations, leading to lower AOD levels during this period.
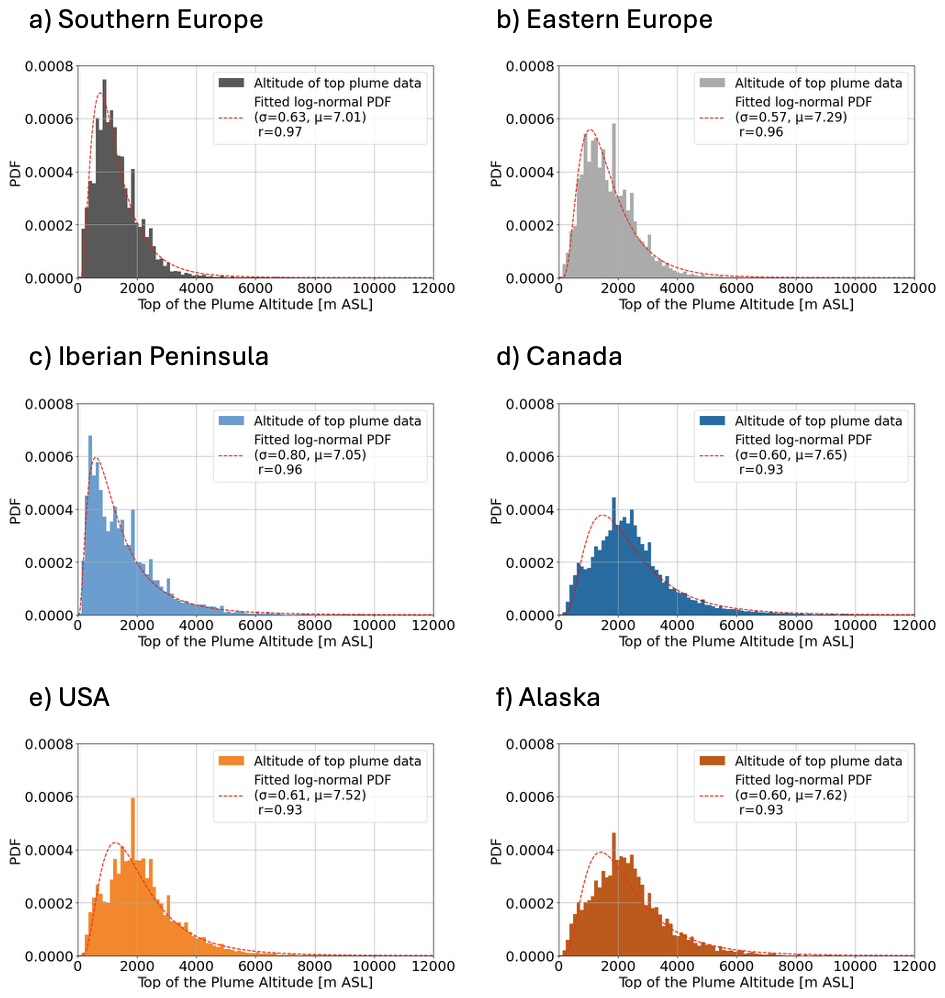
Figure 11Probability density functions (PDFs) of the top of plume altitude data () for selected regions. (a–f) represent Southern Europe, Eastern Europe, the Iberian Peninsula, Canada, the USA and Alaska respectively. Each panel displays the PDF of the observed plume altitude data (bars) alongside a fitted log-normal distribution (dashed red line). The fitting parameters, standard deviation (σ) and mean (μ) of the variable's natural logarithm, are provided for each region, along with the Pearson correlation coefficient (r).
3.5 Altitude dynamics of fire plumes and their impact on BB AOD estimation
Using the data of the altitude of the top plume provided by CAMS GFAS during the years 2006–2022 for the months of May–September, density histograms of this parameter were plotted density histograms of this parameter were plotted, alongside the fitted log-normal PDF , described by the parameters μ and σ, which are the mean and standard deviation of ln x, respectively (see Fig. 11a–f). For each fit, the Pearson correlation coefficient r was calculated. It can be observed that for Canada, the USA, and Alaska (Fig. 11d–f), where the correlation coefficient is the lowest (0.93), the fitted PDF is skewed to the left, which could raise doubts about whether this PDF fit captures fire-plume dynamics well; however, the fitted CDF (Fig. A2a–f) yields r=1 for all regions, and because the contribution analysis uses the CDF, this indicates that the fit is reliable.
The fitted PDF parameter μ, representing the mean of the natural logarithm of the plume-top altitude in a log-normal distribution, can reveal differences in plume-elevation dynamics. From a physical standpoint, the quantity is more informative, as it corresponds directly to the mean plume-top altitude. However, because CAMS GFAS altitudes are reported in , local terrain elevation must also be taken into account. Among the European regions, Southern Europe exhibits the lowest mean plume-top altitude, (μ=7.01), followed by the Iberian Peninsula, (μ=7.05). Eastern Europe shows a higher value of (μ=7.29). In North America, plume tops are generally higher: Canada (μ=7.65); the USA (μ=7.52); and Alaska (μ=7.62).
Since CAMS GFAS data are reported in , and the variability of terrain elevation significantly affects the interpretation of plume rise above ground level, it is not possible to clearly predict how the different methods will estimate contributions. Based on the forward trajectory analysis for Alaska, the No Threshold method is likely to overestimate the contribution from that region. Aside from this case, there is no clear basis to determine how the results of the various methods will differ for certain BB aerosol source regions. Among the methods considered, the CAMS-based approach is expected to provide the most reliable estimates of regional contributions to BB AOD, as it statistically accounts for differences in fire plume rise dynamics across the identified BB aerosol source regions.
3.6 Regional contributions to BB AOD in Warsaw
The contributions to BB AOD in Warsaw from selected regions – Southern Europe, Eastern Europe, the Iberian Peninsula, the USA, and Canada – during May–September are presented in Tables 1 and 2. Each table includes contributions calculated using the No Threshold, PBL, and CAMS method across dispersion radii of 5 %, 10 %, 15 %, and 20 % of the trajectory length, along with the mean values. Visualizations of the mean contributions for each month are shown in Fig. 12a–e.
Table 1Results of calculating the contribution to BB AOD in Warsaw for European regions (Southern Europe, Eastern Europe, and the Iberian Peninsula) using the No Threshold method (denoted as No Thres), PBL method (denoted as PBL), and CAMS method (denoted as CAMS) during selected months May–September. The leftmost column lists the months (with the label of the column Mon). The next column, labeled R, represents the dispersion radius chosen as 5 %, 10 %, 15 %, and 20 % of the trajectory length, concluded with the mean values. The following columns present the contribution values from each region and method expressed as percentages.
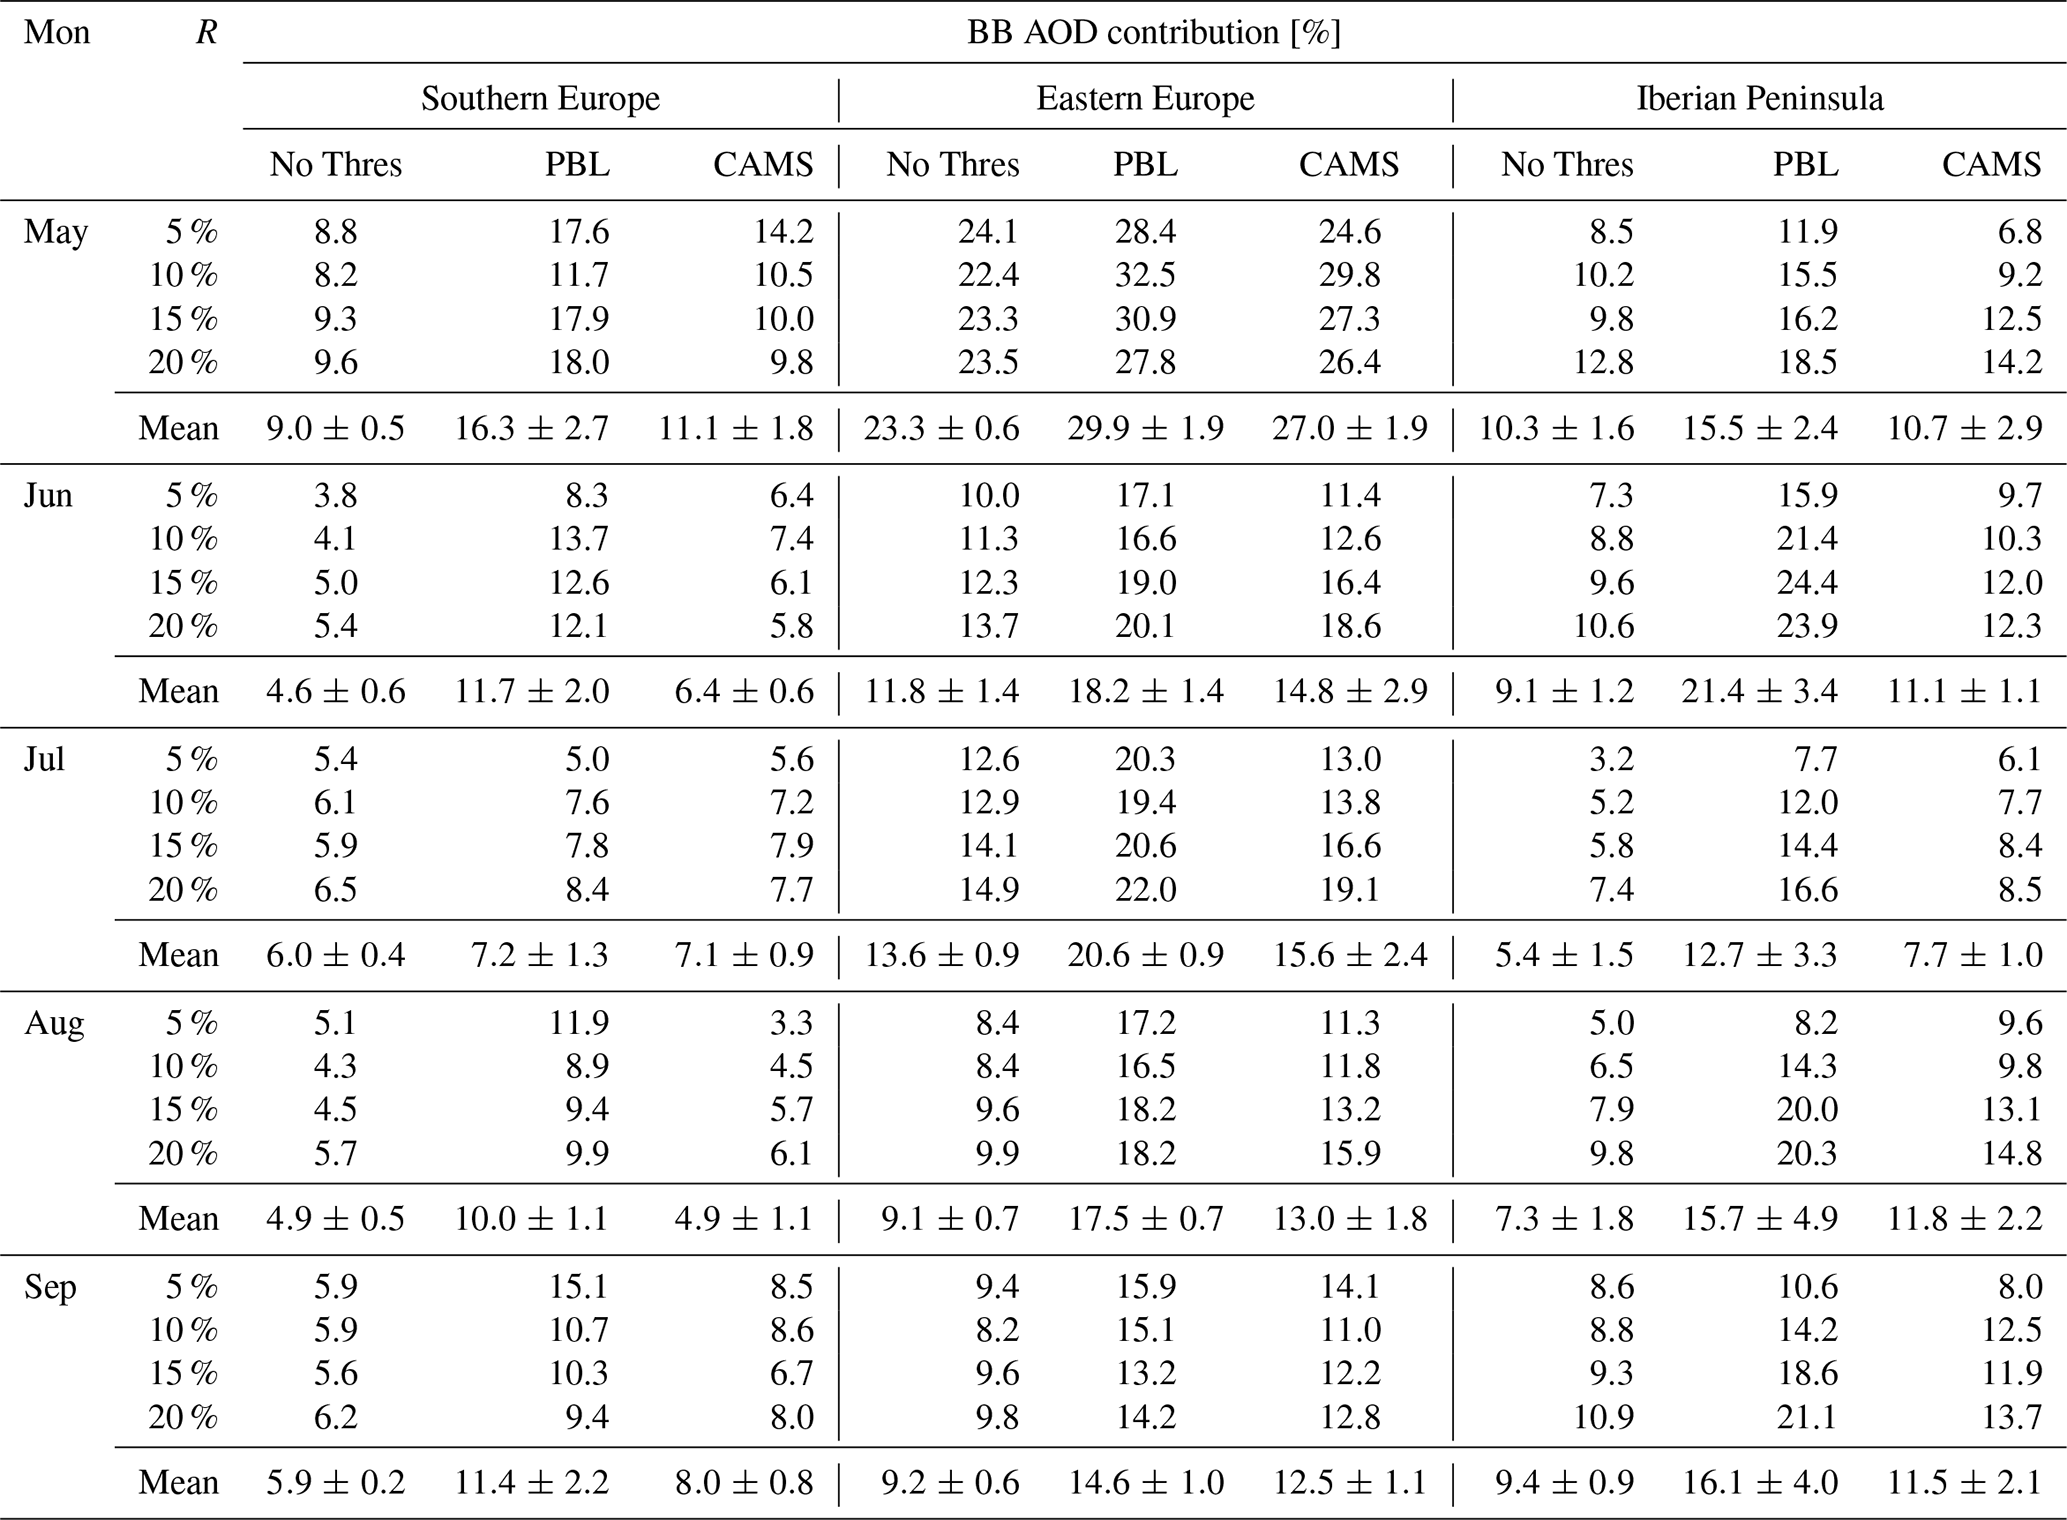
Table 2Results of calculating the contribution to BB AOD in Warsaw for North American regions (USA and Canada) using the No Threshold method (denoted as No Thres), PBL method (denoted as PBL), and CAMS method (denoted as CAMS) during selected months May–September. The leftmost column lists the months (with the label of the column Mon). The next column, labeled R, represents the dispersion radius chosen as 5 %, 10 %, 15 %, and 20 % of the trajectory length, concluded with the mean values. The following columns present the contribution values from each region and method expressed as percentages.
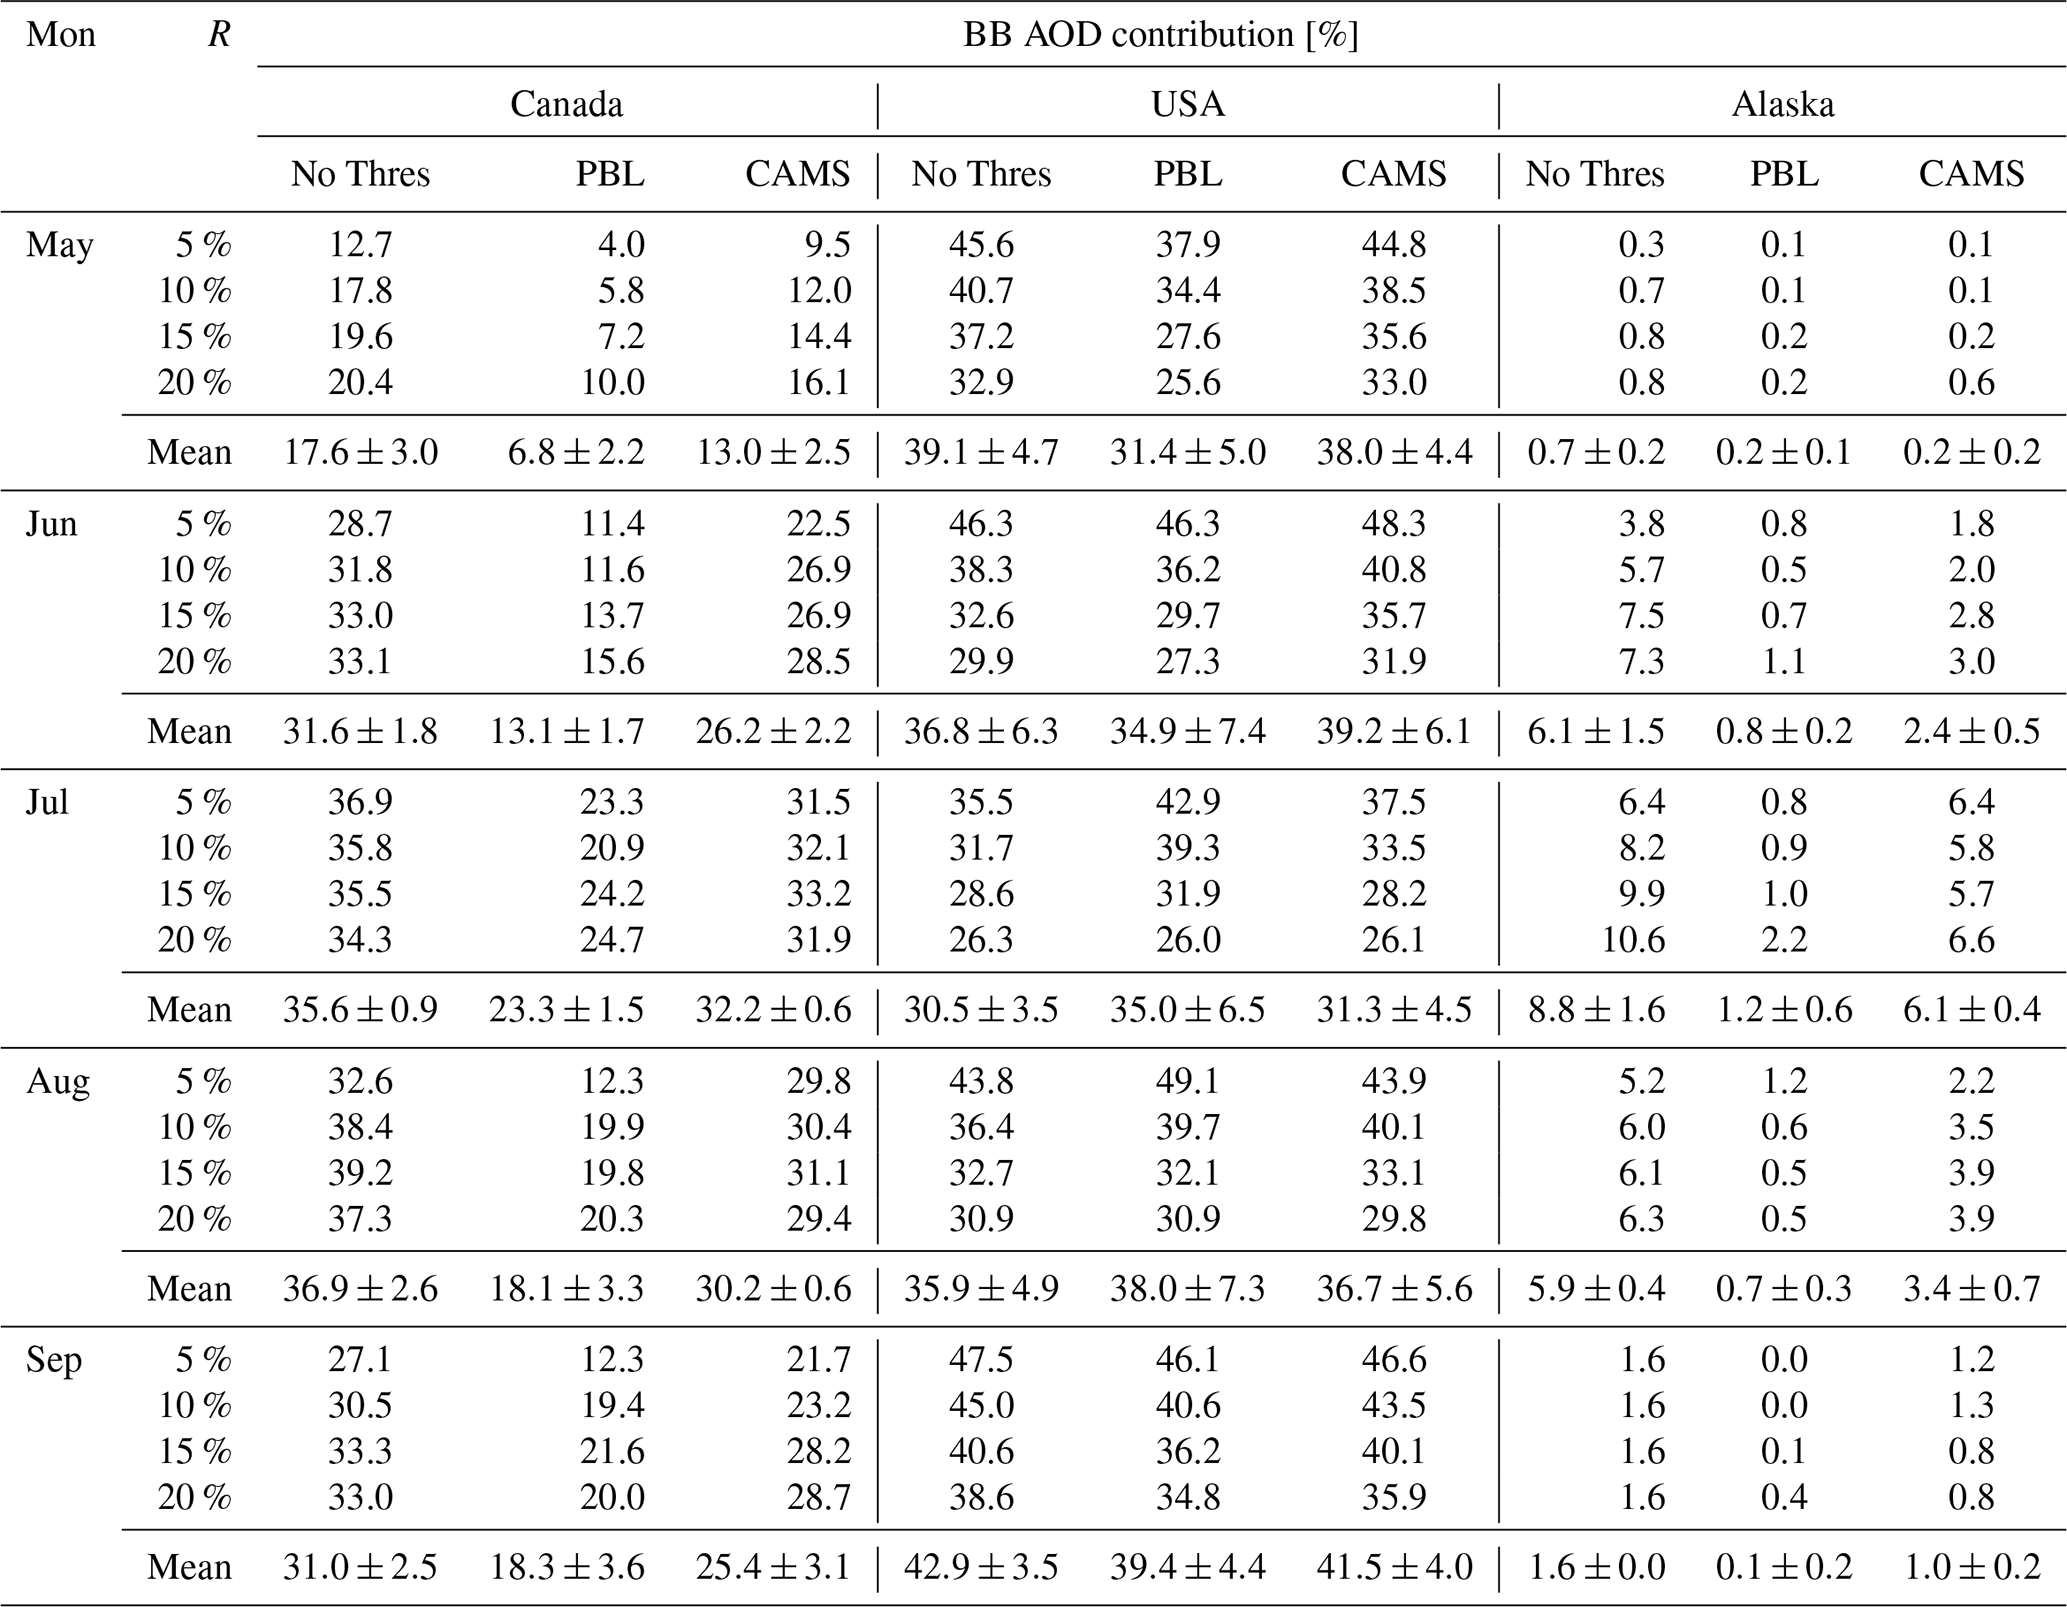
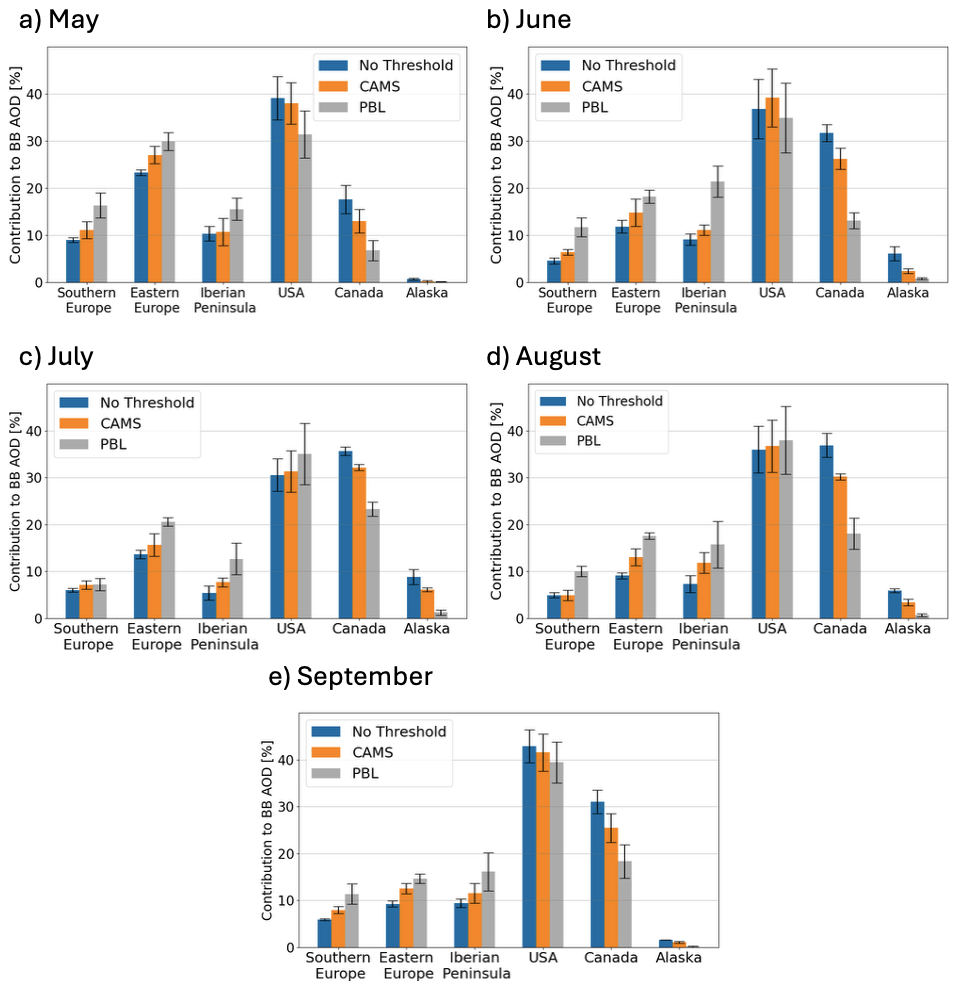
Figure 12Monthly contributions to BB AOD across selected regions (Southern Europe, Eastern Europe, Iberian Peninsula, USA, Canada and Alaska) for May (a), June (b), July (c), August (d), and September (e). The contributions are calculated using three methods: No Threshold, CAMS, and PBL.
The annual average contributions to BB AOD in Warsaw, as determined using the CAMS method for the period May–September, indicate that the largest influence originates from the USA, with an average contribution of 37.3 %±3.4 %. Canada ranks second at 25.4 %±6.7 %, followed by Eastern Europe (16.6 %±5.3 %), the Iberian Peninsula (10.6 %±1.5 %), and Southern Europe (7.5 %±2.1 %). Alaska contributes marginally, with 2.6 %±2.1 %. These findings identify the USA and Canada as the dominant source regions influencing BB AOD over Poland during the Northern Hemisphere fire season. Among the European regions, Eastern Europe contributes the most, although its impact is approximately half that of the USA. The Iberian Peninsula follows, contributing less than one-third of the USA level. The combined average contribution from the USA, Alaska, and Canada, exceeding 65 %, underscores the strong influence of long-range transatlantic transport on BB AOD levels in Warsaw. This highlights the relevance of North American BB emissions for aerosol conditions not only in Poland but potentially across a broader European context.
The significant contribution of BB aerosol Canada and the USA to BB AOD in Warsaw can be attributed to several atmospheric processes. Intense wildfires in these regions emit large quantities of BB aerosol that reach the upper troposphere, facilitating long-range transport. The mid-latitudes of the Northern Hemisphere are characterized by dominant westerly winds and upper-level jet streams, which can efficiently carry BB aerosol eastward across the Atlantic Ocean towards Europe (Guerova et al., 2006; Messori et al., 2016). Additionally, BB aerosol at higher altitudes experiences less atmospheric turbulence and slower deposition rates (Bond et al., 2013), extending its atmospheric residence time and enhancing the likelihood of transatlantic transport to regions like Warsaw.
Estimations derived from the CAMS method revealed distinct regional and monthly variability in contributions to BB AOD (Tables 1, 2, and Fig. 12a–e). In Southern Europe, contributions ranged from a minimum in August (4.9 %±1.1 %) to a maximum in May (11.1 %±1.8 %). Eastern Europe exhibited its lowest contribution in September (12.5 %±1.1 %) and its highest in May (27.0 %±1.9 %). For the Iberian Peninsula, the smallest contribution occurred in July (7.7 %±1.0 %) and the largest in August and in September (11.8 %±2.1 % and 11.5 %±2.1 % respectively). Contributions from the USA ranged from a minimum in July (31.3 %±4.5 %) to a maximum in September (41.5 %±4.0 %). Canada showed its lowest contribution in May (13.0 %±2.5 %) and its highest in July (32.2 %±0.6 %). In the case of Alaska, the contribution was minimal in May (0.2 %±0.2 %) and reached its maximum in July (6.1 %±0.4 %).
Changing the dispersion radius significantly affects the contributions from different regions to BB AOD in Warsaw (Tables 1 and 2). Altering the dispersion radius can lead to a different ranking of regional contributions for CAMS method. For example, in May, when the dispersion radius is set to 5 % of the trajectory length, the contribution from Southern Europe (14.2 %) exceeds that from the Iberian Peninsula (6.8 %) and Canada (9.5 %). However, when the dispersion radius is increased to 20 %, the latter regions show higher contributions – 14.2 % for the Iberian Peninsula and 16.1 % for Canada – while the contribution from Southern Europe decreases to 9.5 %. The largest absolute change in contribution resulting from altering the dispersion radius is observed for the USA. In June, the contribution decreases from 46.3 % at a 5 % dispersion radius to 27.3 % at a 20 % radius, representing a difference of nearly 20 percentage points. The largest relative increase in contribution is observed in May for the Iberian Peninsula, where increasing the dispersion radius from 5 % to 20 % more than doubles the contribution – from 6.8 % to 14.2 %. In general, increasing the dispersion radius results in a higher contribution from the Iberian Peninsula and a lower contribution from the USA. For Canada, notable changes in estimated contribution were observed in May, June, and September, with absolute differences reaching up to 7 %, while in July and August the contribution remained relatively stable regardless of the dispersion radius. In the case of Southern Europe, a larger dispersion radius led to increased contributions in July and August, but decreased values in May and June. For Eastern Europe, an increasing trend in contribution with larger dispersion radius was observed in June, July, and August, whereas no clear pattern was found in the remaining months. Such discrepancies in results when changing the dispersion radius may be related to the fact that, for example, in the case of the Iberian Peninsula, enlarging the dispersion radius can lead to the detection of fire outbreaks even when the trajectory does not explicitly pass over this region. The observed shifts in North American contributions – where the share from the USA decreases while that from Canada increases – may suggest that trajectories passing over the USA begin to intersect with fire activity in Canada when the dispersion radius is sufficiently large, thereby increasing Canada's estimated contribution to BB AOD. However, the trends in contribution estimated using the CAMS method as a function of dispersion radius are not always straightforward and cannot be fully explained by these effects alone.
Based on Tables 1 and 2, the PBL method exhibits systematic deviations from the CAMS results, generally overestimating contributions from European regions while underestimating contributions from Canada and Alaska. For Southern Europe, the PBL method overestimates contributions compared to CAMS in almost every month, with the largest overestimation – exceeding 5 % – observed in May, June, and August.. A similar overestimation is observed for Eastern Europe, where the largest deviation occurs in July (5.0 %), while in other months, the differences range from 2.1 % to 3.9 %. For the Iberian Peninsula, the overestimation by the PBL method ranges between 3.9 % in August and 10.3 % in June. The PBL method's underestimation of Canada's contribution is most evident in June, with a maximum deviation of 13.1 %, while in May the difference is equal to 6.2 %. The USA contributions are underestimated in May, June and September, with deviations of 6.6 %, 4.3 %, and 2.1 %, respectively. Alaska's contribution estimated using the PBL method is below 1 % in almost all months, remaining slightly above this value only in June (1.2 %), which is nearly 5 % lower than the estimate using the CAMS method. In other months, the contribution is so small that any possible noticeable underestimation is limited, with the exception of August, where it reaches 2.7 %. The No Threshold method underestimates contributions from European regions while overestimating contributions from Canada and from Alaska. For Southern Europe, the No Threshold method performs with deviations, ranging from none in August up to 2.1 % in May and September. The deviations for Eastern Europe are slightly more pronounced, with underestimations varying from 2.0 % in July to 3.9 % in August.. For the Iberian Peninsula, the No Threshold method shows deviations ranging from 0.4 % in May to 4.5 % in August. These deviations are smaller compared to the PBL method for Southern Europe and Iberian Peninsula. In contrast, the No Threshold method systematically overestimates contributions from Canada and Alaska. The overestimation is most evident in August, where the deviation reaches 6.7 %, while in May, the difference decreases to 4.6 %. For Alaska, the No Threshold method shows the lowest overestimation in May and September, where the deviation is marginal (approximately 0.5 %), and the highest in June, reaching 3.7 %.. For the USA, the No Threshold method replicates the CAMS results well in almost every month except June. In all other months, deviations remain below 1.1 %, while in June the method underestimates the contribution by 2.4 %.
3.7 Temporal variability of contributions to BB AOD in Warsaw and of AOD, BB AOD in Warsaw and Poland
The annual mean values of contributions to BB AOD for selected regions in Europe and North America from 2006 to 2022 are presented in Fig. 13a and b, respectively.
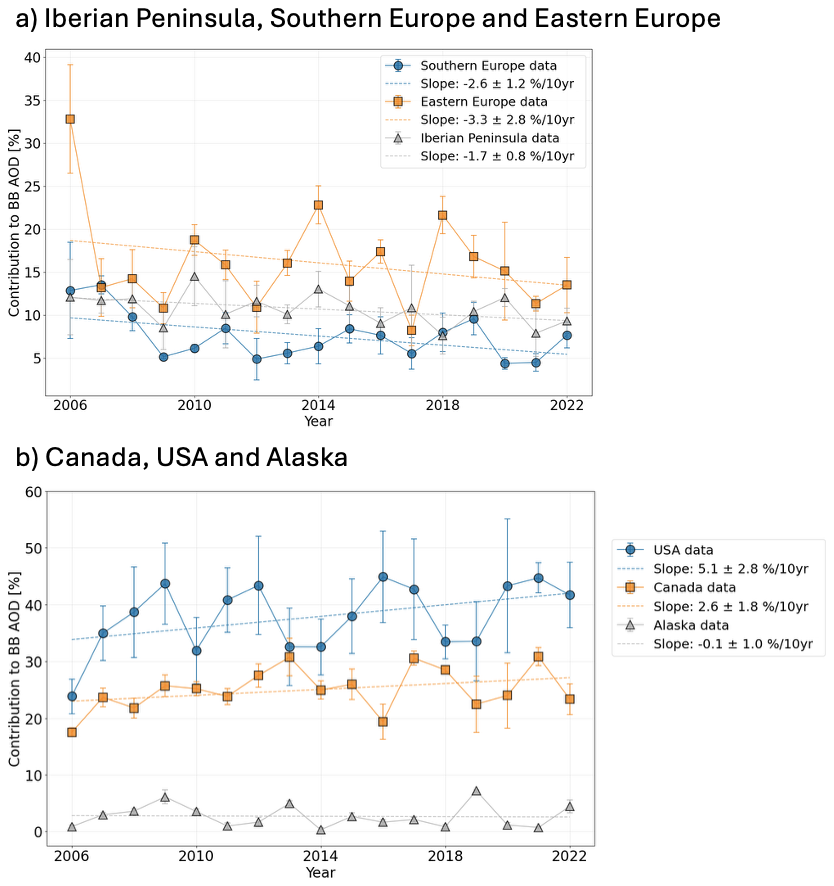
Figure 13Temporal variability in contributions to BB AOD at 550 nm in years 2006–2022, calculated for the regions: (a) Iberian Peninsula, Southern Europe, and Eastern Europe, and (b) Canada, the USA and Alaska. Contributions were determined using the CAMS method and averaged over months May–September and averaged over four dispersion radii (5 % , 10 % , 15 % , and 20 % of the trajectory length).
In Europe (Fig. 13a), all observed trends remain negative, but their statistical significance varies. Southern Europe exhibits a statistically significant decreasing trend, with a slope of (, p=0.045). Eastern Europe shows a stronger, yet statistically insignificant, decline of (, p=0.27). The Iberian Peninsula displays a weaker negative trend of (, p=0.068), which is marginally above the 0.05 significance threshold. In North America (Fig. 13b), the USA shows a positive trend of (r=0.43, p=0.084), while Canada has a positive but smaller slope of (r=0.35, p=0.17). Alaska presents virtually no trend, with a slope of (, p=0.89). Although all three North-American regions suggest potential changes in BB AOD contributions, none of these trends reach statistical significance.
In the additional analysis (Fig. A3), annual BB AOD contributions in Warsaw were examined for aggregated European regions (Southern Europe, Eastern Europe, Iberian Peninsula; Fig. A3a) and Northern American regions (Canada, USA and Alaska; Fig. A3b). The European regions displayed a negative trend (, , p=0.082), while the North American regions showed a positive trend of the same magnitude (, r=0.43, p=0.082). Although both correlations are moderately strong, they do not reach statistical significance, and substantial interannual variability limits the ability to draw definitive conclusions about long-term trends.
The annual mean values for May–September of BB AOD, AOD, and the BB AOD/AOD ratio for the years 2006–2022 are presented in Fig. 14a–c, respectively. The annual mean BB AOD (Fig. 14a) exhibits a slight decreasing trend over the study period (2006–2022). For Poland, the trend is weakly negative, with a slope of per decade. The Pearson correlation coefficient (r) and p-value were calculated as , p=0.24, indicating a weak and statistically insignificant negative correlation. Similarly, Warsaw shows a steeper slope of per decade, with , p=0.15. These results suggest that the observed decline in BB AOD is inconsistent and primarily driven by interannual variability rather than a robust long-term trend.
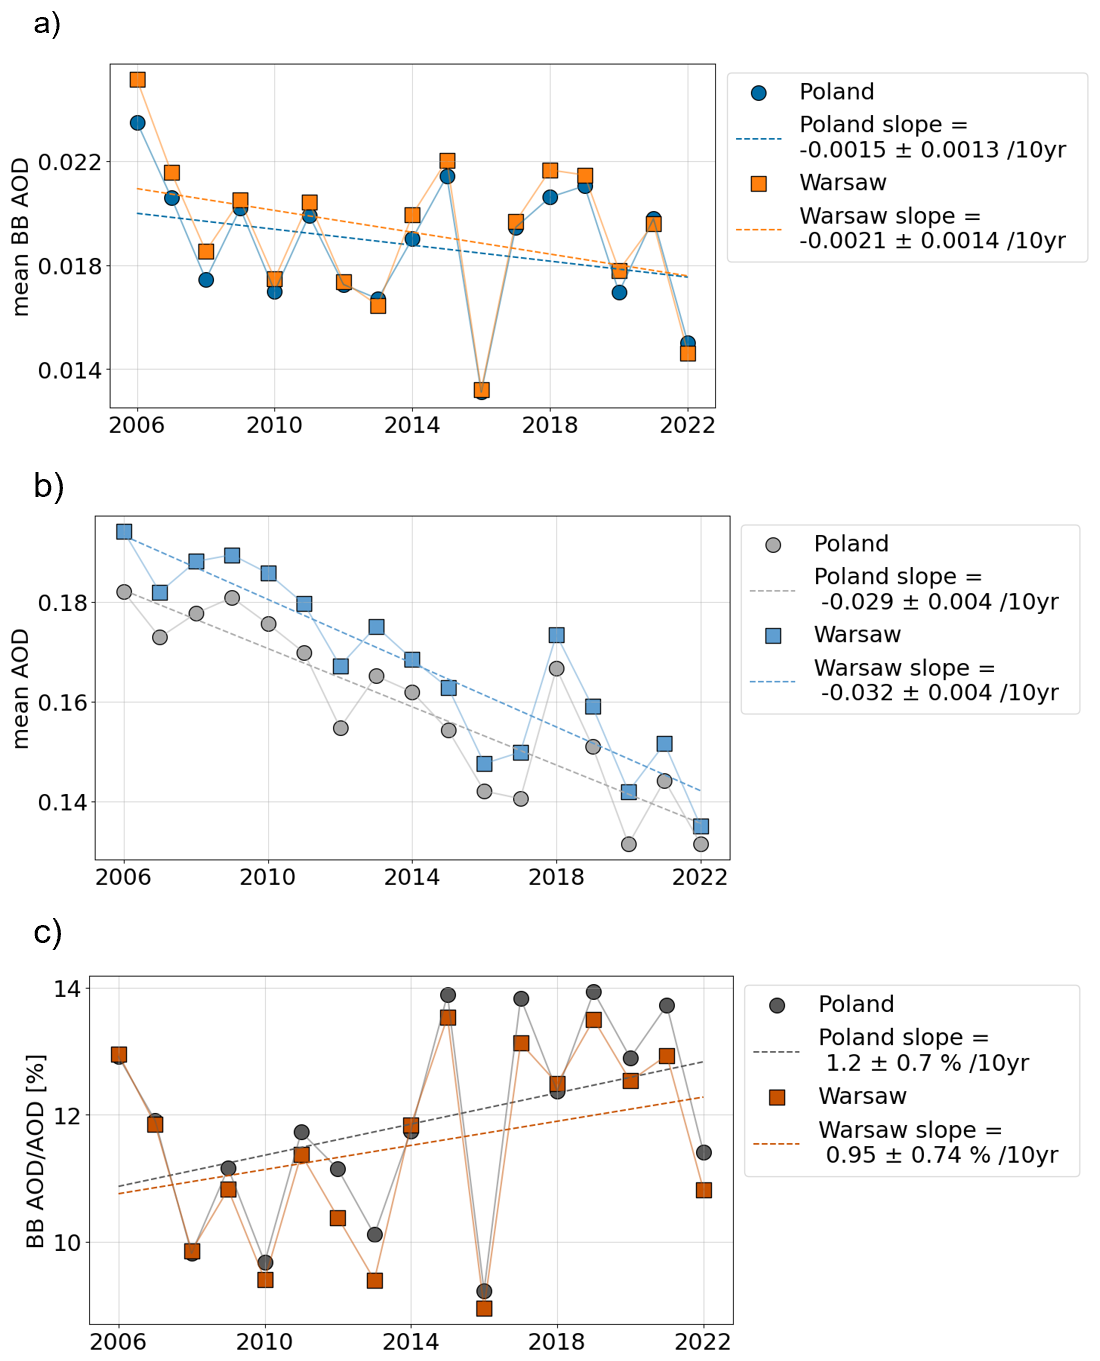
Figure 14Temporal analysis of BB AOD and AOD at 550 nm data for Poland and Warsaw from 2006 to 2022 for the months May–September. (a) shows the mean BB AOD values for Poland and Warsaw as time series, with linear regression trend lines fitted. (b) presents the mean AOD values for Poland and Warsaw, also with fitted linear regression trend lines. (c) depicts the ratio of BB AOD to AOD for both Poland and Warsaw, expressed as a percentage, with linear regression trend lines.
The annual mean AOD (Fig. 14b) displays a statistically significant decreasing trend for both Poland and Warsaw. In Poland, the slope is per decade, with , , confirming a strong and highly significant negative correlation. Similarly, Warsaw shows a slightly steeper slope of per decade, with , . These results reflect a substantial decline in AOD over the study period, suggesting significant improvements in air quality due to reductions in aerosol emissions (Markowicz et al., 2021b).
The annual mean BB AOD/AOD ratio for May–September shows a weakly increasing trend for both Poland and Warsaw. For Poland, the slope is 1.2±0.7 % per decade, with r=0.40, p=0.11, indicating a weak positive correlation that is not statistically significant. Warsaw shows a slightly smaller slope of 0.95±0.74 % per decade, with r=0.31, p=0.22, also statistically insignificant. These results suggest that while there is a slight upward trend in the relative contribution of BB aerosols to total AOD, the variability and statistical uncertainty indicate that this trend is not strongly established over the study period.
This study proposes a new framework to estimate the sources and contributions of BB aerosol to BB AOD at a specific location. While this approach does not account for aerosol aging or the distinct types of emitted particles – factors that are crucial for assessing impacts on atmospheric physical properties – it represents a significant step forward in understanding the influence of BB aerosol on the climatology of a given region.
The model exhibits certain limitations, particularly in the selection of the dispersion radius. A smaller dispersion radius may yield higher contributions from distant sources, like the USA, by excluding nearby fire outbreaks in neighboring regions, while a larger radius can increase the detection of closer but more dispersed sources, such as those in Eastern Europe. Future improvements may include a detailed analysis of trajectory dispersion associated with long-range transport, for instance, trajectories originating in Warsaw and reaching North America. This refinement could be achieved by applying a smaller dispersion radius while simultaneously accounting for multiple starting altitudes.
Our results indicate that USA is the primary contributor to BB AOD in Warsaw, ranging from approximately 31 % in July to about 41.5 % in September. The Canada follows, varying from 13 % in May to around 32 % in July. Alaska, the third North American region, contributes the least among all regions, with values ranging from 0.2 % in May to about 6 % in July. Among the European regions, Eastern Europe is the most influential, providing between about 12.5 % in September and 27 % in May, followed by the Iberian Peninsula, ranging from 7.7 % in July to 11.8 % in August, and Southern Europe contributing between roughly 5 % in August and 11.1 % in May. Notably, distant regions in North America often have a more substantial impact on BB AOD levels in Warsaw than proximate European sources, emphasizing the importance of long-range transport and suggesting that these findings may extend to other parts of Europe.
This study also underscores the critical importance of accurately representing vertical fire plume distributions when attributing BB AOD contributions. Incorporating plume-top altitude information provides more reliable estimates than relying solely on a altitude threshold – such as the PBL altitude over the considered regions – which can systematically overestimate European contributions while underestimating those from North America. In contrast, removing all altitude constraints tends to substantially overestimate contributions from Canada and Alaska while underestimating those from European regions. Our findings indicate that differences in estimated contributions between these approaches can reach up to about 20 % – for instance, comparing the PBL and No Threshold methods for Canada's contribution in June and August – underscoring the necessity of carefully modeling plume-rise processes and altitude distributions to faithfully capture regional transport dynamics.
From a temporal perspective, total AOD in Poland and in the Warsaw has significantly decreased, reflecting improved air quality likely due to emission reductions and the adoption of cleaner technologies. In contrast, BB AOD displays only a weak, statistically insignificant downward trend. Among the examined regions, only Southern Europe shows a statistically significant negative trend in BB AOD contributions. Although the downward trend in European contributions and the concurrent rise in North-American sources is not statistically significant, contradicted with insignificant downward trend in total BB AOD over Warsaw raise questions about underlying drivers. A possible explanation may lie in the fact that European circulation is driven by westerly winds and jet streams that can pass over North America, and that basing on comparison betweend PBL method and CAMS method BB aerosols from North America may be often lifted into the free troposphere or even into the stratosphere (Lestrelin et al., 2021). This vertical transport facilitates long-range movement of aerosols. Although the observed pattern is statistically marginal, it highlights the need for further research into the long-range transport of BB aerosols and their potential impacts on European aerosol conditions. It also raises the question of whether BB aerosol emissions from North America can influence global circulation patterns.
The methodology presented here can be applied to other regions to evaluate the influence of BB aerosol on local climatology and air quality. Future research should incorporate aerosol aging processes and more detailed BB aerosol characterizations, enabling a better understanding of their roles in atmospheric thermodynamics, radiative forcing, and cloud microphysics. Such efforts, combined with integrated observational and modeling approaches, will help clarify how BB emissions interact with and potentially influence broader atmospheric circulation patterns.
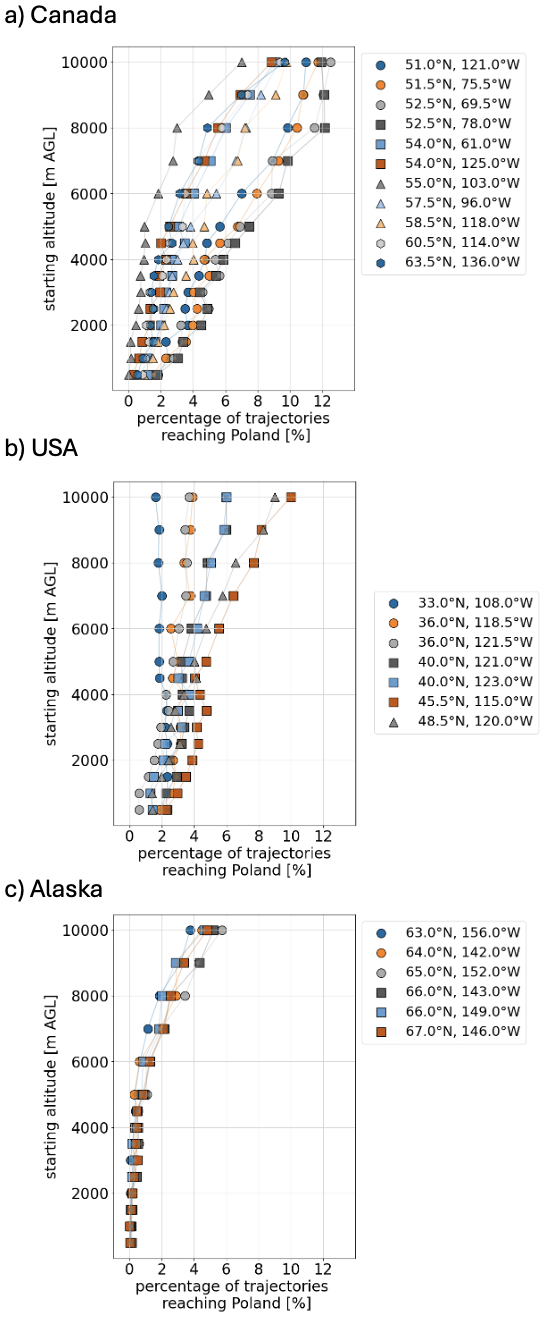
Figure A1Trajectory analysis for (a) Canada, (b) USA, and (c) Alaska. Each panel presents the percentage of trajectories reaching Poland from each source point as a function of starting altitude, using an extended altitude range up to 10 . Each symbol corresponds to a specific source location, as indicated in the legend.
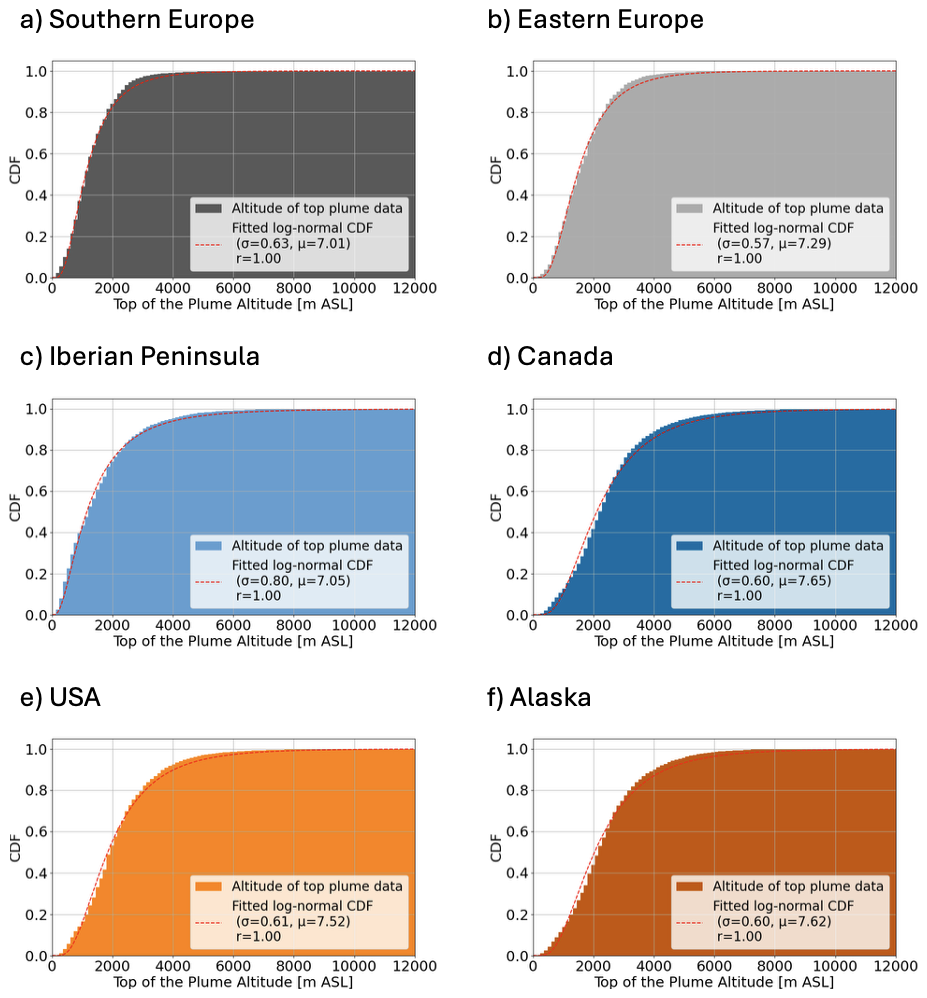
Figure A2Cumulative distribution functions (CDFs) of the top of plume altitude data () for selected regions. (a–f) represent Southern Europe, Eastern Europe, Iberian Peninsula, Canada, the USA and Alaska, respectively. Each panel shows the CDF of the observed plume altitude data along with a fitted log-normal distribution (dashed red line). The fitting parameters, standard deviation (σ) and mean (μ) of the variable's natural logarithm, are indicated in each panel, along with the Pearson correlation coefficient (r).
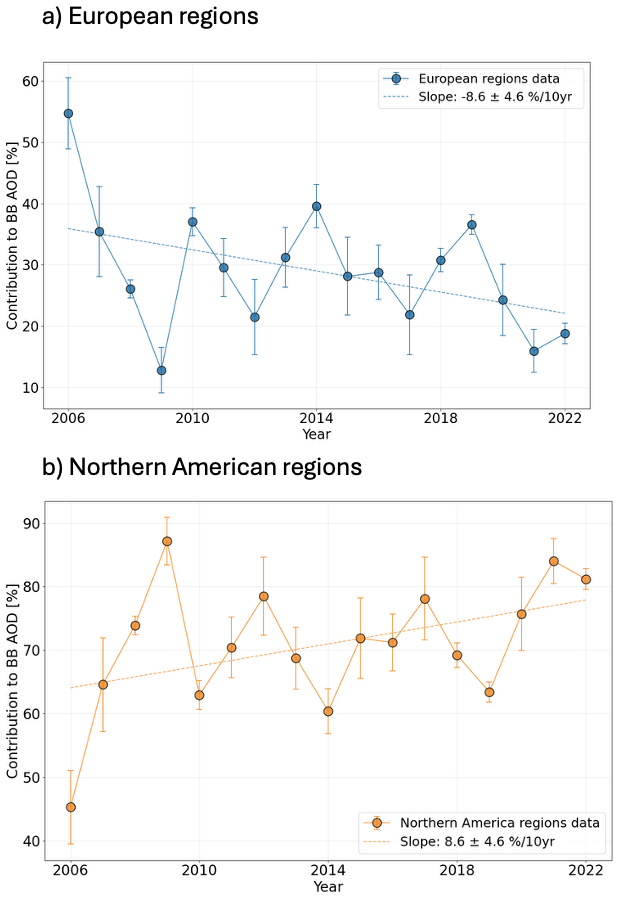
Figure A3Temporal variability in BB AOD contributions from 2006 to 2022 for (a) aggregated European regions (Iberian Peninsula, Southern Europe, and Eastern Europe) and (b) aggregated Northern American regions (Canada, the USA and Alaska. Contributions were calculated using the CAMS method, averaged over May–September, and further averaged across four dispersion radii (5 %, 10 %, 15 %, and 20 % of the trajectory length).
HYSPLIT trajectories are archived in the PolandAOD database and are available upon request at this point. FLAMBE data were made available by the Naval Research Laboratory upon our request. Other data can be obtained as follows: MODIS Active Fire data are available from https://firms.modaps.eosdis.nasa.gov/active_fire/ (last access: 24 October 2025), Aerosol Optical Depth and Aerosol Optical Depth associated with biomass burning data can be obtained from https://usgodae.org/ftp/outgoing/nrl/NAAPS-REANALYSIS/ (last access: 24 October 2025), altitude of plum top can be downloaded from https://ads.atmosphere.copernicus.eu/datasets/cams-global-fire-emissions-gfas?tab=download (last access: 24 October 2025).
Conceptualization: OZM, KM; Data curation: MB, OZM; Formal analysis: MB; Funding acquisition: OZM; Investigation: MB; Methodology: KM, OZM; Project administration: OZM; Resources: KM, PX, EH; Software: MB; Supervision: OZM; Writing – original draft preparation: MB; Writing – review and editing: OZM, KM, PX.
The contact author has declared that none of the authors has any competing interests.
Publisher's note: Copernicus Publications remains neutral with regard to jurisdictional claims made in the text, published maps, institutional affiliations, or any other geographical representation in this paper. While Copernicus Publications makes every effort to include appropriate place names, the final responsibility lies with the authors. Views expressed in the text are those of the authors and do not necessarily reflect the views of the publisher.
This research was carried out within Polish Grant no. 2022/47/D/ST10/02099 of the National Science Centre coordinated by the Institute of Geophysics, Faculty of Physics, University of Warsaw.
We acknowledge the use of data from NASA's Fire Information for Resource Management System (FIRMS) (https://earthdata.nasa.gov/firms, last access: 24 October 2025), part of NASA's Earth Science Data and Information System (ESDIS). We also acknowledge the use of the HYSPLIT model, developed and provided by the NOAA Air Resources Laboratory (ARL) (https://www.arl.noaa.gov/hysplit/, last access: 24 October 2025). The Navy Aerosol Analysis and Prediction System (NAAPS) data, provided by the Naval Research Laboratory (NRL), were utilized in this study (https://www.nrl.navy.mil/, last access: 24 October 2025). We further acknowledge the use of the FLAMBE (Fire Locating and Monitoring of Burning Emissions) dataset, developed by the Naval Research Laboratory (NRL). Finally, we acknowledge the use of Copernicus Atmosphere Monitoring Service (CAMS) GFAS data (https://www.ecmwf.int/en/forecasts/dataset/global-fire-assimilation-system, last access: 24 October 2025), which were generated by ECMWF (European Centre for Medium-Range Weather Forecasts) as part of the CAMS initiative.
This research has been supported by the Narodowe Centrum Nauki (grant no. 2022/47/D/ST10/02099).
This paper was edited by Carl Percival and reviewed by three anonymous referees.
Abatzoglou, J. and Williams, A. P.: Impact of anthropogenic climate change on wildfire across western US forests, P. Natl. Acad. Sci. USA, 113, 11770–11775, https://doi.org/10.1073/pnas.1607171113, 2016. a
Amiridis, V., Balis, D. S., Giannakaki, E., Stohl, A., Kazadzis, S., Koukouli, M. E., and Zanis, P.: Optical characteristics of biomass burning aerosols over Southeastern Europe determined from UV-Raman lidar measurements, Atmos. Chem. Phys., 9, 2431–2440, https://doi.org/10.5194/acp-9-2431-2009, 2009. a
Amiridis, V., Giannakaki, E., Balis, D. S., Gerasopoulos, E., Pytharoulis, I., Zanis, P., Kazadzis, S., Melas, D., and Zerefos, C.: Smoke injection heights from agricultural burning in Eastern Europe as seen by CALIPSO, Atmos. Chem. Phys., 10, 11567–11576, https://doi.org/10.5194/acp-10-11567-2010, 2010. a
Ancellet, G., Pelon, J., Totems, J., Chazette, P., Bazureau, A., Sicard, M., Di Iorio, T., Dulac, F., and Mallet, M.: Long-range transport and mixing of aerosol sources during the 2013 North American biomass burning episode: analysis of multiple lidar observations in the western Mediterranean basin, Atmos. Chem. Phys., 16, 4725–4742, https://doi.org/10.5194/acp-16-4725-2016, 2016. a
Bond, T., Doherty, S., Fahey, D., Forster, P., Berntsen, T., DeAngelo, B., Flanner, M., Ghan, S., Kärcher, B., Koch, D., Kinne, S., Kondo, Y., Quinn, P., Sarofim, M., Schultz, M., Schulz, M., Venkataraman, C., Zhang, H., Zhang, S., Bellouin, N., Guttikunda, S., Hopke, P., Jacobson, M., Kaiser, J., Klimont, Z., Lohmann, U., Schwarz, J., Shindell, D., Storelvmo, T., Warren, S., and Zender, C.: Bounding the role of black carbon in the climate system: a scientific assessment, J. Geophys. Res.-Atmos., 118, 5380–5552, https://doi.org/10.1002/jgrd.50171, 2013. a, b, c
Brown, H., Liu, X., Pokhrel, R., Murphy, S., Lu, Z., Saleh, R., Mielonen, T., Kokkola, H., Bergman, T., Myhre, G., Skeie, R. B., Watson-Paris, D., Stier, P., Johnson, B., Bellouin, N., Schulz, M., Vakkari, V., Beukes, J. P., van Zyl, P. G., Liu, S., and Chand, D.: Biomass burning aerosols in most climate models are too absorbing, Nat. Commun., 12, https://doi.org/10.1038/s41467-020-20482-9, 2021. a, b
Chambers, S. and Podstawczyńska, A.: Improved method for characterising temporal variability in urban air quality part II: Particulate matter and precursors in central Poland, Atmos. Environ., 219, 117040, https://doi.org/10.1016/j.atmosenv.2019.117040, 2019. a
Chilinski, M., Markowicz, K., Zawadzka, O., Stachlewska, I., Kumala, W., Petelski, T., Makuch, P., Westphal, D., and Zagajewski, B.: Modelling and observation of mineral dust optical properties over Central Europe, Acta Geophys., 64, 2550–2590, https://doi.org/10.1515/acgeo-2016-0069, 2016. a
Christensen, J. H.: The Danish eulerian hemispheric model – a three-dimensional air pollution model used for the arctic, Atmos. Environ., 31, 4169–4191, https://doi.org/10.1016/S1352-2310(97)00264-1, 1997. a
Chuvieco, E., Pettinari, M. L., Koutsias, N., Forkel, M., Hantson, S., and Turco, M.: Human and climate drivers of global biomass burning variability, Sci. Total Environ., 779, 146361, https://doi.org/10.1016/j.scitotenv.2021.146361, 2021. a
Crutzen, P. and Andreae, M.: Biomass burning in the tropics: impact on atmospheric chemistry and biogeochemical cycles, Science, 250, 1669–1678, https://doi.org/10.1126/science.250.4988.1669, 1990. a
Di Giuseppe, F., Rémy, S., Pappenberger, F., and Wetterhall, F.: Using the Fire Weather Index (FWI) to improve the estimation of fire emissions from fire radiative power (FRP) observations, Atmos. Chem. Phys., 18, 5359–5370, https://doi.org/10.5194/acp-18-5359-2018, 2018. a
Engelhart, G. J., Hennigan, C. J., Miracolo, M. A., Robinson, A. L., and Pandis, S. N.: Cloud condensation nuclei activity of fresh primary and aged biomass burning aerosol, Atmos. Chem. Phys., 12, 7285–7293, https://doi.org/10.5194/acp-12-7285-2012, 2012. a
Forster, C., Wandinger, U., Wotawa, G., James, P., Mattis, I., Althausen, D., Simmonds, P., O'Doherty, S., Jennings, S., Kleefeld, C., Schneider, J., Trickl, T., Kreipl, S., Jäger, H., and Stohl, A.: Transport of boreal forest fire emissions from Canada to Europe, J. Geophys. Res., 106, 22887–22906 https://doi.org/10.1029/2001JD900115, 2001. a
Freitag, S., Clarke, A. D., Howell, S. G., Kapustin, V. N., Campos, T., Brekhovskikh, V. L., and Zhou, J.: Combining airborne gas and aerosol measurements with HYSPLIT: a visualization tool for simultaneous evaluation of air mass history and back trajectory consistency, Atmos. Meas. Tech., 7, 107–128, https://doi.org/10.5194/amt-7-107-2014, 2014. a
Galytska, E., Danylevsky, V., Hommel, R., and Burrows, J. P.: Increased aerosol content in the atmosphere over Ukraine during summer 2010, Atmos. Meas. Tech., 11, 2101–2118, https://doi.org/10.5194/amt-11-2101-2018, 2018. a
GFAS: CAMS global biomass burning emissions based on fire radiative power (GFAS): data download, European Centre for Medium-Range Weather Forecasts (ECMWF) [data set], https://ads.atmosphere.copernicus.eu/cdsapp#!/dataset/cams-global-fire-emissions-gfas, last access: 17 October 2024. a
Giglio, L., Descloitres, J., Justice, C. O., and Kaufman, Y. J.: An enhanced contextual fire detection algorithm for MODIS, Remote Sens. Environ., 87, 273–282, https://doi.org/10.1016/S0034-4257(03)00184-6, 2003. a
Guerova, G., Bey, I., Attié, J.-L., Martin, R. V., Cui, J., and Sprenger, M.: Impact of transatlantic transport episodes on summertime ozone in Europe, Atmos. Chem. Phys., 6, 2057–2072, https://doi.org/10.5194/acp-6-2057-2006, 2006. a
Gupta, S., McFarquhar, G. M., O'Brien, J. R., Delene, D. J., Poellot, M. R., Dobracki, A., Podolske, J. R., Redemann, J., LeBlanc, S. E., Segal-Rozenhaimer, M., and Pistone, K.: Impact of the variability in vertical separation between biomass burning aerosols and marine stratocumulus on cloud microphysical properties over the Southeast Atlantic, Atmos. Chem. Phys., 21, 4615–4635, https://doi.org/10.5194/acp-21-4615-2021, 2021. a
Hall, J., Zibtsev, S., Giglio, L., Skakun, S., Myroniuk, V., Zhuravel, O., Goldammer, J., and Kussul, N.: Environmental and political implications of underestimated cropland burning in Ukraine, Environ. Res. Lett. 16, https://doi.org/10.1088/1748-9326/abfc04, 2021. a, b, c
Hogan, T., Liu, M., Ridout, J., Peng, M., Whitcomb, T., Ruston, B., Reynolds, C., Eckermann, S., Moskaitis, J., Baker, N., McCormack, J., Viner, K., McLay, J., Flatau, M., Xu, L., Chen, C., and Chang, S.: The Navy Global Environmental Model, Oceanography, 27, 116–125, https://doi.org/10.5670/oceanog.2014.73, 2014. a
Jacobson, M.: Effects of biomass burning on climate, accounting for heat and moisture fluxes, black and brown carbon, and cloud absorption effects, J. Geophys. Res.-Atmos., 119, 8980–9002, https://doi.org/10.1002/2014JD021861, 2014. a, b, c
Jacobson, M. Z.: Strong radiative heating due to the mixing state of black carbon in atmospheric aerosols, Nature, 409, 695–697, https://doi.org/10.1038/35055518, 2001. a
Janicka, L., Davuliene, L., Bycenkiene, S., and Stachlewska, I. S.: Long term observations of biomass burning aerosol over Warsaw by means of multiwavelength lidar, Opt. Express, 31, 33150–33174, https://doi.org/10.1364/OE.496794, 2023. a
Kaiser, J. W., Heil, A., Andreae, M. O., Benedetti, A., Chubarova, N., Jones, L., Morcrette, J.-J., Razinger, M., Schultz, M. G., Suttie, M., and van der Werf, G. R.: Biomass burning emissions estimated with a global fire assimilation system based on observed fire radiative power, Biogeosciences, 9, 527–554, https://doi.org/10.5194/bg-9-527-2012, 2012. a
Koracin, D., Vellore, R., Lowenthal, D., Watson, J., Koracin, J., McCord, T., DuBois, D., Chen, L. W. A., Kumar, N., Knipping, E., Wheeler, N., Craig, K., and Reid, S. B.: Regional source identification using Lagrangian stochastic particle dispersion and HYSPLIT backward-trajectory models, J. Air Waste Manage., 61, 660–672, https://doi.org/10.3155/1047-3289.61.6.660, 2011. a
Lestrelin, H., Legras, B., Podglajen, A., and Salihoglu, M.: Smoke-charged vortices in the stratosphere generated by wildfires and their behaviour in both hemispheres: comparing Australia 2020 to Canada 2017, Atmos. Chem. Phys., 21, 7113–7134, https://doi.org/10.5194/acp-21-7113-2021, 2021. a
Li, B., Su, S., shi Yuan, H., and Tao, S.: Spatial and temporal variations of AOD over land at the global scale, Int. J. Remote Sens., 33, 2097–2111, https://doi.org/10.1080/01431161.2011.605088, 2012. a, b
Li, J., Han, Z., Surapipith, V., Fan, W., Thongboonchoo, N., Wu, J., Li, J., Tao, J., Wu, Y., Macatangay, R., Bran, S. H., Yu, E., Zhang, A., Liang, L., and Zhang, R.: Direct and indirect effects and feedbacks of biomass burning aerosols over Mainland Southeast Asia and South China in springtime, Sci. Total Environ., 842, 156949, https://doi.org/10.1016/j.scitotenv.2022.156949, 2022. a
Liu, L., Cheng, Y., Wang, S., Wei, C., Pöhlker, M. L., Pöhlker, C., Artaxo, P., Shrivastava, M., Andreae, M. O., Pöschl, U., and Su, H.: Impact of biomass burning aerosols on radiation, clouds, and precipitation over the Amazon: relative importance of aerosol–cloud and aerosol–radiation interactions, Atmos. Chem. Phys., 20, 13283–13301, https://doi.org/10.5194/acp-20-13283-2020, 2020. a
Luo, H., Dong, L., Chen, Y., Zhao, Y., Zhao, D., Huang, M., Ding, D., Liao, J., Ma, T., Hu, M., and Han, Y.: Interaction between aerosol and thermodynamic stability within the planetary boundary layer during wintertime over the North China Plain: aircraft observation and WRF-Chem simulation, Atmos. Chem. Phys., 22, 2507–2524, https://doi.org/10.5194/acp-22-2507-2022, 2022. a
Lynch, P., Reid, J. S., Westphal, D. L., Zhang, J., Hogan, T. F., Hyer, E. J., Curtis, C. A., Hegg, D. A., Shi, Y., Campbell, J. R., Rubin, J. I., Sessions, W. R., Turk, F. J., and Walker, A. L.: An 11-year global gridded aerosol optical thickness reanalysis (v1.0) for atmospheric and climate sciences, Geosci. Model Dev., 9, 1489–1522, https://doi.org/10.5194/gmd-9-1489-2016, 2016. a, b, c, d, e
Markowicz, K., Chilinski, M., Lisok, J., Zawadzka, O., Stachlewska, I., Janicka, L., Rozwadowska, A., Makuch, P., Pakszys, P., Zielinski, T., Petelski, T., Posyniak, M., Pietruczuk, A., Szkop, A., and Westphal, D.: Study of aerosol optical properties during long-range transport of biomass burning from Canada to Central Europe in July 2013, J. Aerosol Sci., 101, 156–173, https://doi.org/10.1016/j.jaerosci.2016.08.006, 2016. a, b
Markowicz, K., Zawadzka-Manko, O., Lisok, J., Chilinski, M., and Xian, P.: The impact of moderately absorbing aerosol on surface sensible, latent, and net radiative fluxes during the summer of 2015 in Central Europe, J. Aerosol Sci., 151, 105627, https://doi.org/10.1016/j.jaerosci.2020.105627, 2021a. a, b, c, d
Markowicz, K. M., Stachlewska, I., Zawadzka-Manko, O., Wang, D., Kumala, W., Chilinski, M., Makuch, P., Markuszewski, P., Rozwadowska, A., Petelski, T., Zielinski, T., Posyniak, M., Kaminski, J., Szkop, A., Pietruczuk, A., Chojnicki, B., Harenda, K., Poczta, P., Uscka-Kowalkowska, J., Struzewska, J., Werner, M., Kryza, M., Drzeniecka-Osiadacz, A., Sawinski, T., Remut, A., Mietus, M., Wiejak, K., Markowicz, J., Belegante, L., and Nicolae, D.: A decade of Poland-AOD aerosol research network observations, Atmosphere-Basel, 1583, https://doi.org/10.3390/atmos12121583, 2021b. a, b
Markowicz, K. M., Okrasa, I., Chiliński, M. T., Makuch, P., Nurowska, K., Posyniak, M. A., Rozwadowska, A., Sobolewski, P., and Zawadzka-Mańko, O.: Long-term variability of the MERRA-2 radiation budget over Poland in Central Europe, Acta Geophys., 72, 2907–2924, https://doi.org/10.1007/s11600-023-01256-5, 2024. a
Martins, L. D., Hallak, R., Alves, R. C., de Almeida, D. S., Squizzato, R., Moreira, C. A., Beal, A., da Silva, I., Rudke, A., and Martins, J. A.: Long-range transport of aerosols from biomass burning over southeastern South America and their implications on air quality, Aerosol Air Qual. Res., 18, 2700–2715, https://doi.org/10.4209/aaqr.2017.11.0545, 2018. a
McCarty, J., Ellicott, E., Romanenkov, V., Rukhovitch, D., and Koroleva, P.: Multi-year black carbon emissions from cropland burning in the Russian Federation, Atmos. Environ., 63, 223–238, https://doi.org/10.1016/J.ATMOSENV.2012.08.053, 2012. a
Messori, G., Caballero, R., and Gaetani, M.: On cold spells in North America and storminess in western Europe, Geophys. Res. Lett., 43, 6620–6628, https://doi.org/10.1002/2016GL069392, 2016. a
Moroni, B., Ritter, C., Crocchianti, S., Markowicz, K., Mazzola, M., Becagli, S., Traversi, R., Krejci, R., Tunved, P., and Cappelletti, D.: Individual particle characteristics, optical properties and evolution of an extreme long-range transported biomass burning event in the European Arctic (Ny-Ålesund, Svalbard Islands), J. Geophys. Res.-Atmos., 125, e2019JD031535, https://doi.org/10.1029/2019JD031535, 2020. a
Myhre, G., Samset, B. H., Schulz, M., Balkanski, Y., Bauer, S., Berntsen, T. K., Bian, H., Bellouin, N., Chin, M., Diehl, T., Easter, R. C., Feichter, J., Ghan, S. J., Hauglustaine, D., Iversen, T., Kinne, S., Kirkevåg, A., Lamarque, J.-F., Lin, G., Liu, X., Lund, M. T., Luo, G., Ma, X., van Noije, T., Penner, J. E., Rasch, P. J., Ruiz, A., Seland, Ø., Skeie, R. B., Stier, P., Takemura, T., Tsigaridis, K., Wang, P., Wang, Z., Xu, L., Yu, H., Yu, F., Yoon, J.-H., Zhang, K., Zhang, H., and Zhou, C.: Radiative forcing of the direct aerosol effect from AeroCom Phase II simulations, Atmos. Chem. Phys., 13, 1853–1877, https://doi.org/10.5194/acp-13-1853-2013, 2013. a
NASA FIRMS: Active Fire Data for Near-Real Time Monitoring and Applications, NASA FIRMS [data set], https://firms.modaps.eosdis.nasa.gov/download/ (last access: 17 October), 2024a. a, b
NASA FIRMS: MODIS Collection 61 NRT Hotspot/Active Fire Detections MCD14DL distributed from NASA FIRMS, NASA FIRMS [data set], https://doi.org/10.5067/FIRMS/MODIS/MCD14DL.NRT.0061 (last access: 17 October 2024), 2024b. a
Naval Research Laboratory, Marine Meteorology Division: NRLMRY Aerosol Page, https://www.nrl.navy.mil/ (last access: 30 October 2024), 2024. a
NOAA: HYSPLIT Trajectory Model, https://www.ready.noaa.gov/HYSPLIT_traj.php (last access: 30 October 2024), 2024. a
Ortiz-Amezcua, P., Guerrero-Rascado, J. L., Granados-Muñoz, M. J., Benavent-Oltra, J. A., Böckmann, C., Samaras, S., Stachlewska, I. S., Janicka, Ł., Baars, H., Bohlmann, S., and Alados-Arboledas, L.: Microphysical characterization of long-range transported biomass burning particles from North America at three EARLINET stations, Atmos. Chem. Phys., 17, 5931–5946, https://doi.org/10.5194/acp-17-5931-2017, 2017. a, b
Pereira, M., Trigo, R., Camara, C. D., Pereira, J., and Leite, S.: Synoptic patterns associated with large summer forest fires in Portugal, Agr. Forest Meteorol., 129, 11–25, https://doi.org/10.1016/J.AGRFORMET.2004.12.007, 2005. a
Poulain, L., Fahlbusch, B., Spindler, G., Müller, K., van Pinxteren, D., Wu, Z., Iinuma, Y., Birmili, W., Wiedensohler, A., and Herrmann, H.: Source apportionment and impact of long-range transport on carbonaceous aerosol particles in central Germany during HCCT-2010, Atmos. Chem. Phys., 21, 3667–3684, https://doi.org/10.5194/acp-21-3667-2021, 2021. a
Reid, J., Hyer, E., Prins, E., Westphal, D., Zhang, J., Wang, J., Christopher, S., Curtis, C., Schmidt, C., Eleuterio, D., Richardson, K., and Hoffman, J.: Global monitoring and forecasting of biomass-burning smoke: description of and lessons from the Fire Locating and Modeling of Burning Emissions (FLAMBE) program, IEEE Journal of Selected Topics in Applied Earth Observations and Remote Sensing, 2, 144–162, https://doi.org/10.1109/JSTARS.2009.2027443, 2009. a, b, c, d
Reid, J. S., Eck, T. F., Christopher, S. A., Koppmann, R., Dubovik, O., Eleuterio, D. P., Holben, B. N., Reid, E. A., and Zhang, J.: A review of biomass burning emissions part III: intensive optical properties of biomass burning particles, Atmos. Chem. Phys., 5, 827–849, https://doi.org/10.5194/acp-5-827-2005, 2005. a
Rémy, S., Veira, A., Paugam, R., Sofiev, M., Kaiser, J. W., Marenco, F., Burton, S. P., Benedetti, A., Engelen, R. J., Ferrare, R., and Hair, J. W.: Two global data sets of daily fire emission injection heights since 2003, Atmos. Chem. Phys., 17, 2921–2942, https://doi.org/10.5194/acp-17-2921-2017, 2017. a, b
Rodrigues, M., Trigo, R., Vega-García, C., and Cardil, A.: Identifying large fire weather typologies in the Iberian Peninsula, Agr. Forest Meteorol., 280, 107789, https://doi.org/10.1016/j.agrformet.2019.107789, 2020. a
Rubin, J. I., Reid, J. S., Hansen, J. A., Anderson, J. L., Collins, N., Hoar, T. J., Hogan, T., Lynch, P., McLay, J., Reynolds, C. A., Sessions, W. R., Westphal, D. L., and Zhang, J.: Development of the Ensemble Navy Aerosol Analysis Prediction System (ENAAPS) and its application of the Data Assimilation Research Testbed (DART) in support of aerosol forecasting, Atmos. Chem. Phys., 16, 3927–3951, https://doi.org/10.5194/acp-16-3927-2016, 2016. a
Ruffault, J., Curt, T., Moron, V., Trigo, R., Mouillot, F., Koutsias, N., Pimont, F., Martin-StPaul, N., Barbero, R., Dupuy, J., Russo, A., and Belhadj-Khedher, C.: Increased likelihood of heat-induced large wildfires in the Mediterranean Basin, Sci. Rep.-UK, 10, https://doi.org/10.1038/s41598-020-70069-z, 2020. a
Sena, E. T., Artaxo, P., and Correia, A. L.: Spatial variability of the direct radiative forcing of biomass burning aerosols and the effects of land use change in Amazonia, Atmos. Chem. Phys., 13, 1261–1275, https://doi.org/10.5194/acp-13-1261-2013, 2013. a
Shi, S., Cheng, T., Gu, X., Guo, H., Wu, Y., and Wang, Y.: Biomass burning aerosol characteristics for different vegetation types in different aging periods, Environ. Int., 127, 202–210, https://doi.org/10.1016/j.envint.2019.02.073, 2019. a
Singh, P., Sarawade, P., and Adhikary, B.: Transport of black carbon from planetary boundary layer to free troposphere during the summer monsoon over South Asia, Atmos. Res., 240, 104943, https://doi.org/10.1016/j.atmosres.2019.104761, 2020. a
Stachlewska, I. S., Samson, M., Zawadzka, O., Harenda, K. M., Janicka, L., Poczta, P., Szczepanik, D., Heese, B., Wang, D., Borek, K., Tetoni, E., Proestakis, E., Siomos, N., Nemuc, A., Chojnicki, B. H., Markowicz, K. M., Pietruczuk, A., Szkop, A., Althausen, D., Stebel, K., Schuettemeyer, D., and Zehner, C.: Modification of local urban aerosol properties by long-range transport of biomass burning aerosol, Remote Sens.-Basel, 10, https://doi.org/10.3390/rs10030412, 2018. a, b
Stein, A. F., Draxler, R. R., Rolph, G. D., Stunder, B. J. B., Cohen, M. D., and Ngan, F.: NOAA's HYSPLIT atmospheric transport and dispersion modeling system, B. Am. Meteorol. Soc., 96, 2059–2077, https://doi.org/10.1175/BAMS-D-14-00110.1, 2015. a
Stohl, A., Berg, T., Burkhart, J. F., Fjǽraa, A. M., Forster, C., Herber, A., Hov, Ø., Lunder, C., McMillan, W. W., Oltmans, S., Shiobara, M., Simpson, D., Solberg, S., Stebel, K., Ström, J., Tørseth, K., Treffeisen, R., Virkkunen, K., and Yttri, K. E.: Arctic smoke – record high air pollution levels in the European Arctic due to agricultural fires in Eastern Europe in spring 2006, Atmos. Chem. Phys., 7, 511–534, https://doi.org/10.5194/acp-7-511-2007, 2007. a, b, c
Su, L., Yuan, Z., Fung, J., and Lau, A.: A comparison of HYSPLIT backward trajectories generated from two GDAS datasets, Sci. Total Environ., 506–507, 527–537, https://doi.org/10.1016/j.scitotenv.2014.11.072, 2015. a
Swindles, G., Swindles, G., Swindles, G., Morris, P., Mullan, D., Payne, R., Roland, T., Amesbury, M., Amesbury, M., Lamentowicz, M., Turner, T., Gallego-Sala, A., Sim, T., Barr, I., Blaauw, M., Blundell, A., Chambers, F., Charman, D., Feurdean, A., Galloway, J., Galloway, J., Gałka, M., Green, S., Kajukało, K., Karofeld, E., Korhola, A., Łukasz Lamentowicz, Langdon, P., Marcisz, K., Mauquoy, D., Mazei, Y., Mckeown, M., Mitchell, E., Novenko, E., Novenko, E., Plunkett, G., Roe, H., Schoning, K., Sillasoo, Ü., Tsyganov, A., Tsyganov, A., Linden, M. V. D., Väliranta, M., and Warner, B.: Widespread drying of European peatlands in recent centuries, Nat. Geosci., 1–7, https://doi.org/10.1038/s41561-019-0462-z, 2019. a
Szkop, A. and Pietruczuk, A.: Analysis of aerosol transport over southern Poland in August 2015 based on a synergy of remote sensing and backward trajectory techniques, Journal of Applied Remote Sensing, 11, 016039, https://doi.org/10.1117/1.JRS.11.016039, 2017. a, b
Szopa, S., Naik, V., Adhikary, B., Artaxo, P., Berntsen, T., Collins, W. D., Fuzzi, S., Gallardo, L., Kiendler-Scharr, A., Klimont, Z., Liao, H., Unger, N., and Zanis, P.: Short-lived climate forcers, Cambridge University Press, https://doi.org/10.1017/9781009157896.008, 2021. a
Tedim, F., Lovreglio, R., Xanthopoulos, G., Chas-Amil, M., Ganteaume, A., Efe, R., Royé, D., Fuerst-Bjeliš, B., Nikolov, N., Musa, S., Milenković, M., Correia, F., Conedera, M., and Pezzatti, G.: Forest fire causes and motivations in Southern and South-Eastern Europe through the perception of experts: contribution to enhance the current policies, Forests, https://doi.org/10.3390/f13040562, 2022. a
Thornhill, G. D., Collins, W. J., Kramer, R. J., Olivié, D., Skeie, R. B., O'Connor, F. M., Abraham, N. L., Checa-Garcia, R., Bauer, S. E., Deushi, M., Emmons, L. K., Forster, P. M., Horowitz, L. W., Johnson, B., Keeble, J., Lamarque, J.-F., Michou, M., Mills, M. J., Mulcahy, J. P., Myhre, G., Nabat, P., Naik, V., Oshima, N., Schulz, M., Smith, C. J., Takemura, T., Tilmes, S., Wu, T., Zeng, G., and Zhang, J.: Effective radiative forcing from emissions of reactive gases and aerosols – a multi-model comparison, Atmos. Chem. Phys., 21, 853–874, https://doi.org/10.5194/acp-21-853-2021, 2021. a
Tomshin, O. and Solovyev, V.: Features of the extreme fire season of 2021 in Yakutia (Eastern Siberia) and heavy air pollution caused by biomass burning, Remote Sens.-Basel, 14, 4980, https://doi.org/10.3390/rs14194980, 2022. a
van der Werf, G. R., Randerson, J. T., Giglio, L., Collatz, G. J., Kasibhatla, P. S., and Arellano Jr., A. F.: Interannual variability in global biomass burning emissions from 1997 to 2004, Atmos. Chem. Phys., 6, 3423–3441, https://doi.org/10.5194/acp-6-3423-2006, 2006. a
van Leeuwen, T. T. and van der Werf, G. R.: Spatial and temporal variability in the ratio of trace gases emitted from biomass burning, Atmos. Chem. Phys., 11, 3611–3629, https://doi.org/10.5194/acp-11-3611-2011, 2011. a
Varga, G., Kovács, J., and Újvári, G.: Analysis of Saharan dust intrusions into the Carpathian Basin (Central Europe) over the period of 1979–2011, Global Planet. Change, 100, 333–342, https://doi.org/10.1016/J.GLOPLACHA.2012.11.007, 2013. a
Veraverbeke, S., Rogers, B., Goulden, M., Jandt, R., Miller, C., Wiggins, E., and Randerson, J.: Lightning as a major driver of recent large fire years in North American boreal forests, Nat. Clim. Change, 7, 529–534, https://doi.org/10.1038/NCLIMATE3329, 2017. a
Walter, C., Freitas, S. R., Kottmeier, C., Kraut, I., Rieger, D., Vogel, H., and Vogel, B.: The importance of plume rise on the concentrations and atmospheric impacts of biomass burning aerosol, Atmos. Chem. Phys., 16, 9201–9219, https://doi.org/10.5194/acp-16-9201-2016, 2016. a, b
Wierzchowski, J., Heathcott, M., and Flannigan, M.: Lightning and lightning fire, central cordillera, Canada, Int. J. Wildland Fire, 11, 41–51, https://doi.org/10.1071/WF01048, 2002. a
Xian, P., Reid, J. S., Ades, M., Benedetti, A., Colarco, P. R., da Silva, A., Eck, T. F., Flemming, J., Hyer, E. J., Kipling, Z., Rémy, S., Sekiyama, T. T., Tanaka, T., Yumimoto, K., and Zhang, J.: Intercomparison of aerosol optical depths from four reanalyses and their multi-reanalysis consensus, Atmos. Chem. Phys., 24, 6385–6411, https://doi.org/10.5194/acp-24-6385-2024, 2024. a
Zawadzka, O., Posyniak, M., Nelken, K., Markuszewski, P., Chilinski, M., Czyzewska, D., Lisok, J., and Markowicz, K.: Study of the vertical variability of aerosol properties based on cable cars in-situ measurements, Atmospheric Pollution Research, 8, 968–978, https://doi.org/10.1016/j.apr.2017.03.009, 2017. a
Zawadzka, O., Stachlewska, I., Markowicz, K., Nemuc, A., and Stebel, K.: Validation of new satellite aerosol optical depth retrieval algorithm using Raman LIDAR observations at radiative transfer laboratory in Warsaw, EPJ Web of Conferences, 176, 04008, https://doi.org/10.1051/epjconf/201817604008, 2018. a
Zhang, F., Wang, J., Ichoku, C., Hyer, E. J., Yang, Z., Ge, C., Su, S., Zhang, X., Kondragunta, S., Kaiser, J. W., Wiedinmyer, C., and da Silva, A.: Sensitivity of mesoscale modeling of smoke direct radiative effect to the emission inventory: a case study in northern sub-Saharan African region, Environ. Res. Lett., 9, 075002, https://doi.org/10.1088/1748-9326/9/7/075002, 2014. a
Zhang, X., Xu, J., Kang, S., Liu, Y., and Zhang, Q.: Chemical characterization of long-range transport biomass burning emissions to the Himalayas: insights from high-resolution aerosol mass spectrometry, Atmos. Chem. Phys., 18, 4617–4638, https://doi.org/10.5194/acp-18-4617-2018, 2018. a