the Creative Commons Attribution 4.0 License.
the Creative Commons Attribution 4.0 License.
 | 28 Oct 2025
Siberian wildfire smoke observations from space-based multi-angle imaging: a multi-year regional analysis of smoke particle properties, their evolution, and comparisons with North American boreal fire plumes
Katherine T. Junghenn Noyes
Ralph A. Kahn
The physical and chemical properties of biomass burning (BB) smoke particles vary with fuel type and burning conditions, greatly affecting their impact on climate and air quality. However, the factors affecting smoke particle properties are not well characterized on a global scale, and the factors controlling their evolution during transport are not well constrained. From observations of the Multi-Angle Imaging Spectrometer (MISR) instrument aboard NASA's Terra satellite, smoke aerosol optical depth (AOD) can be retrieved, along with constraints on near-source plume vertical extent, smoke age, and particle size, shape, light-absorption, and absorption spectral dependence. Previous work demonstrated the robust, statistical characterization of BB particles across Canada and Alaska using MISR and other remote sensing data. Here we expand upon this work, studying over 3600 wildfire plumes across Siberia. We leverage the MISR Research Aerosol (RA) algorithm to retrieve smoke particle properties and the MISR Interactive Explorer (MINX) tool to retrieve plume heights and the associated wind vectors. These results are compared statistically to available observations of fire radiative power (FRP), land cover characteristics, and meteorological information. Correlations appear between the retrieved smoke particle properties, smoke age, local ambient conditions, and fuel type, allowing us in many cases to infer the dominant aging mechanisms and the timescales over which they occur. Specifically, we find that plumes located in areas with higher peat content are subject to less oxidation and condensation/hydration compared with other plume types (e.g., forest and grassland), and are predominantly affected by dilution instead.
- Article
(4280 KB) - Full-text XML
-
Supplement
(5902 KB) - BibTeX
- EndNote


Wildfires are an integral component of the Earth system, influencing ecosystem processes across the globe. Although a certain degree of fire activity is natural and expected, the past two decades have been marked by a surge in large, uncontrolled fires that often take significant tolls on human society (e.g., Bowman et al., 2009). This phenomenon is only expected to worsen in the coming decades due to changing temperature and precipitation patterns brought on by man-made climate change (Liu et al., 2014; IPCC, 2021). The already fire-prone regions of eastern Australia, the Amazon, Canadian and Alaskan boreal zones, southern Europe, and the western United States may experience enhanced fire activity, and areas that were not previously particularly disposed to significant fire activity may become more fire-prone.
Wildfires have significant potential to impact regional air quality and climate conditions – often emitting substantial amounts of trace gases and airborne particles, which can alter atmospheric chemistry and physics across time and space. The precise impacts of wildfire smoke depend upon plume transport processes, smoke composition, and particle evolution, which can vary widely. Although CO2 and water vapor tend to dominate emissions, smoke from wildfires is a rich mixture of greenhouse gases such as methane, volatile and semi-volatile organic gases/particles, light-scattering aerosols, and the light-absorbing particles containing black carbon (BC) and brown carbon (BrC). Globally, wildfires are the most significant source of light-absorbing airborne particles (Bond et al., 2013; Feng et al., 2013). In addition to exhibiting distinct chemical properties, BC and BrC are optically unique in that BC is highly absorbing across all visible wavelengths, whereas BrC is less absorbing overall and displays enhanced light absorption at shorter wavelengths (Kirchstetter et al., 2004; Samset et al., 2018). These light-absorbing particles have the potential to affect the local radiative budget, impacting atmospheric stability (Taubman et al., 2004; Liu et al., 2014), whereas light-scattering smoke aerosols may seed clouds by serving as cloud-condensation nuclei (CCN) and thus increase cloud albedo (Albrecht, 1989; Kaufman and Fraser, 1997; Koch and Del Genio, 2010; Warner and Twomey, 1967; Hansen et al., 1997; Hobbs and Radke, 1969). Often, smoke aerosols also contribute towards poor air quality regionally, as particulate matter is dangerous to respiratory health and can produce long-term medical consequences (Naeher et al., 2007; Reid et al., 2016; Elser et al., 2024), and lofted smoke plumes through plume-rise processes can lead to long-range horizontal transport. Such plume-rise processes may lead to smoke aerosols escaping the planetary boundary layer (PBL) and entering the free troposphere (FT; Kahn et al., 2008), where they can stay aloft for several days or more, travel great distances, and affect conditions far downwind (Damoah et al., 2004; Taubman et al., 2004; Vant-Hull et al., 2005; Colarco et al., 2004).
The microphysical properties and mixing state of smoke particles can change dramatically even a short distance away from the source. For example, particles may increasingly undergo oxidation as they mix with background air, trace gases, and sunlight, leading to both chemical and physical changes (Zhou et al., 2017; Kleinman et al., 2020). As smoke cools downwind, semi-volatile gases (known as volatile organic compounds, or VOCs) can condense onto existing emitted particles, creating organic or inorganic coatings that result in increased particle size and alter particle scattering and absorption as well as CCN efficiency, especially in the case of BC, which is hydrophobic in its pure form. These VOCs can also spontaneously condense into new, small particles (Wang et al., 2013; Yokelson et al., 2009; Akagi et al., 2012; Hennigan et al., 2012; Ahern et al., 2019; Kleinman et al., 2020; Hodshire et al., 2019). These and other processes often occur in combinations that may change on relatively short temporal and spatial scales. However, the factors that determine which mechanism or mechanisms affect the observable particle properties most are currently not well understood.
Wildfires display a range of fire behavior and smoke characteristics that depend on factors such as vegetation type and fuel structure, terrain characteristics, and soil, climate, and weather conditions; together, they influence, among other things, the relative degree of flaming or smoldering combustion at the source. Differences in smoke particle properties are at least partially linked to differences in fire regimes and environmental conditions, with evidence suggesting systematic differences in particle size distribution, particle light absorption, and the spectral dependence of absorption (Dubovik et al., 2002; Eck et al., 2003; Junghenn Noyes et al., 2022; Shi et al., 2019; O'Neill et al., 2002). For example, studies have suggested a connection between fire regime and particle size at the point of emission, with smoldering fires (lower combustion efficiency, or CE) generating larger particles than flaming fires (higher CE) under many conditions (Reid and Hobbs, 1998; Reid et al., 2005). These fire regimes have also been linked to smoke particle type – although BC is often the dominant absorbing aerosol component in biomass burning (BB) smoke, smoldering fires tend to produce higher fractions of BrC than flaming ones (Chakrabarty et al., 2010, 2016; Petrenko et al., 2012).
Based on current knowledge of the factors controlling smoke particle properties, we might expect that geographic and meteorological conditions are important drivers of particle speciation, plume chemistry, and evolution. However, to date there have been no global observational studies to help constrain these relationships on a large scale. As wildfire frequency and severity are expected to increase, it is becoming increasingly important to improve our understanding of the factors controlling wildfire smoke particle properties and to constrain these parameters for climate modeling. In previous work, we leveraged the multi-angle, multi-spectral observing capabilities of the Multi-Angle Imaging Spectroradiometer (MISR) instrument aboard NASA's Terra satellite to study wildfire smoke across multiple years in Canada and Alaska (Junghenn Noyes et al., 2022). Using the MISR Interactive Explorer tool (Nelson et al., 2013) to retrieve plume heights and their associated wind vectors, as well as to estimate smoke age, and the MISR Research Aerosol (RA) algorithm (Limbacher et al., 2022) to qualitatively determine particle properties, it was shown that there are distinct patterns in particle light-absorption, size, and the timescales over which particles evolve, based on the dominant land cover type present in the fire.
In the current work, we apply the MISR tools to a large ensemble of smoke plumes across Siberia, expanding upon the methods used in our previous study of Canadian and Alaskan wildfires in Junghenn Noyes et al., 2022. This represents the second instalment of an ongoing effort to characterize wildfire smoke particles in different ecosystems across the globe, with the eventual goal of building a global, region-specific inventory that (1) characterizes emitted and evolved smoke particle properties; (2) identifies patterns and establishes relationships among fuel type, burning conditions, ambient meteorology, and plume properties; and (3) infers the relevant aging mechanisms and associated timescales from the observed patterns. To this end, we compare the retrieved patterns associated with different ecosystems and environmental conditions with an array of other data, including fire radiative power (FRP) and land cover type from the MODerate resolution Imaging Spectroradiometer (MODIS), and meteorological reanalysis from the Modern Era Retrospective-analysis for Research and Applications (MERRA-2). Trends in particle properties are also studied in the context of smoke age estimates derived from MINX wind vectors. Statistical analysis of the relationships among these observations provides insight into the factors controlling BB particle type emissions and allows inferences about the associated aging processes, directly addressing key elements missing from current climate and air quality modeling efforts.
Siberia was chosen as the second region of study for our global inventory because of its distinct similarities and differences with our previous Canada and Alaska work, and the important role the different biomes play in the fire-climate system. Further, they represent the only two major boreal zones (Siberia, in a broad sense, spans across continental Russia from the Ural Mountains to the Pacific Ocean) in which major biomass burning frequently occurs. These regions also represent the largest forest biomes in the world, and are about one-third of global forest cover (de Groot et al., 2013). In the last several decades, northern-latitude boreal fires have released significant carbon into the atmosphere, which accelerates warming over the Arctic and leads to a positive feedback loop in warming (Lavoué et al., 2000). Wildfires are also the most important factor in taiga dynamics, as larch and Scots pine trees have evolved under conditions of periodic fires to gain an evolutionary advantage over less-adapted species; in permafrost zones such fires are necessary for larch to thrive (Kharuk et al., 2021). In addition, periodic wildfires decrease the danger of fuel buildup that can lead to larger, catastrophic fires having the potential to destroy natural ecosystems and encroach on human settlements if not managed.
Despite the important role boreal fires play in the Earth system, there is still a considerable lack of understanding of fire activity and variability in permafrost zones. In addition, the North American and Eurasian boreal zones have different vegetation and meteorological characteristics that translate into differences in wildfire characteristics and smoke properties, although these factors are currently not well characterized. For example, wildfires in Russia tend to be mostly limited to the surface, and therefore are usually of low-to-moderate in intensity, whereas wildfires in Canada are more likely to occur as high intensity crown fires (de Groot et al., 2013; Kharuk et al., 2021). From this, one might expect Siberian wildfires to emit larger fractions of BrC than North American boreal fires, but this has not yet been studied on a large scale. Extensive work has been done quantifying particle and trace gas emissions locally in boreal regions via field campaigns and ground-based remote studies (e.g. Wiggins et al., 2021; Junghenn Noyes and Kahn, 2024) and modeling (e.g., Soja et al., 2004; Kukavskaya et al., 2013). MISR offers a unique opportunity to observe both biomes on a large scale over multiple burning seasons.
Section 2 describes the data and methodology used in this study. Results and discussion are given in Sect. 3. Conclusions are presented in Sect. 4.
2.1 The MISR instrument
The MISR instrument flies aboard the Terra satellite, which resides in a polar orbit that crosses the equator at ∼ 10:30 a.m. local time. With a ∼ 380 km swath width, it provides global sampling about once per week, more frequently toward the poles. There are nine cameras aboard, viewing Earth in the nadir, forward, and aft directions along the orbital path (0, ±26.1, ±45.6, ±60.0, and ±70.0°), with four spectral bands observed at each angle, centered at approximately 446, 558, 672, and 866 nm (Diner et al., 1998). MISR's unique multi-angle, multi-spectral capabilities allow for: (1) the stereoscopic retrieval of height and motion vectors of contrast features in clouds and aerosol plumes, and (2) the radiometric retrieval of aerosol amount, along with key aerosol optical properties that can be used to constrain particle type.
Table 1Summary of the main features for the MISR components included in the Research Aerosol (RA) retrieval climatology, using the algorithm version summarized in Sect. 2.1. SSA558 denotes single-scattering albedo at 558 nm; re denotes effective radius. Table S1 in the Supplement quantifies the particle refractive indices and SSA at each wavelength as well as the upper/lower bounds and variance for the different particle size distributions.
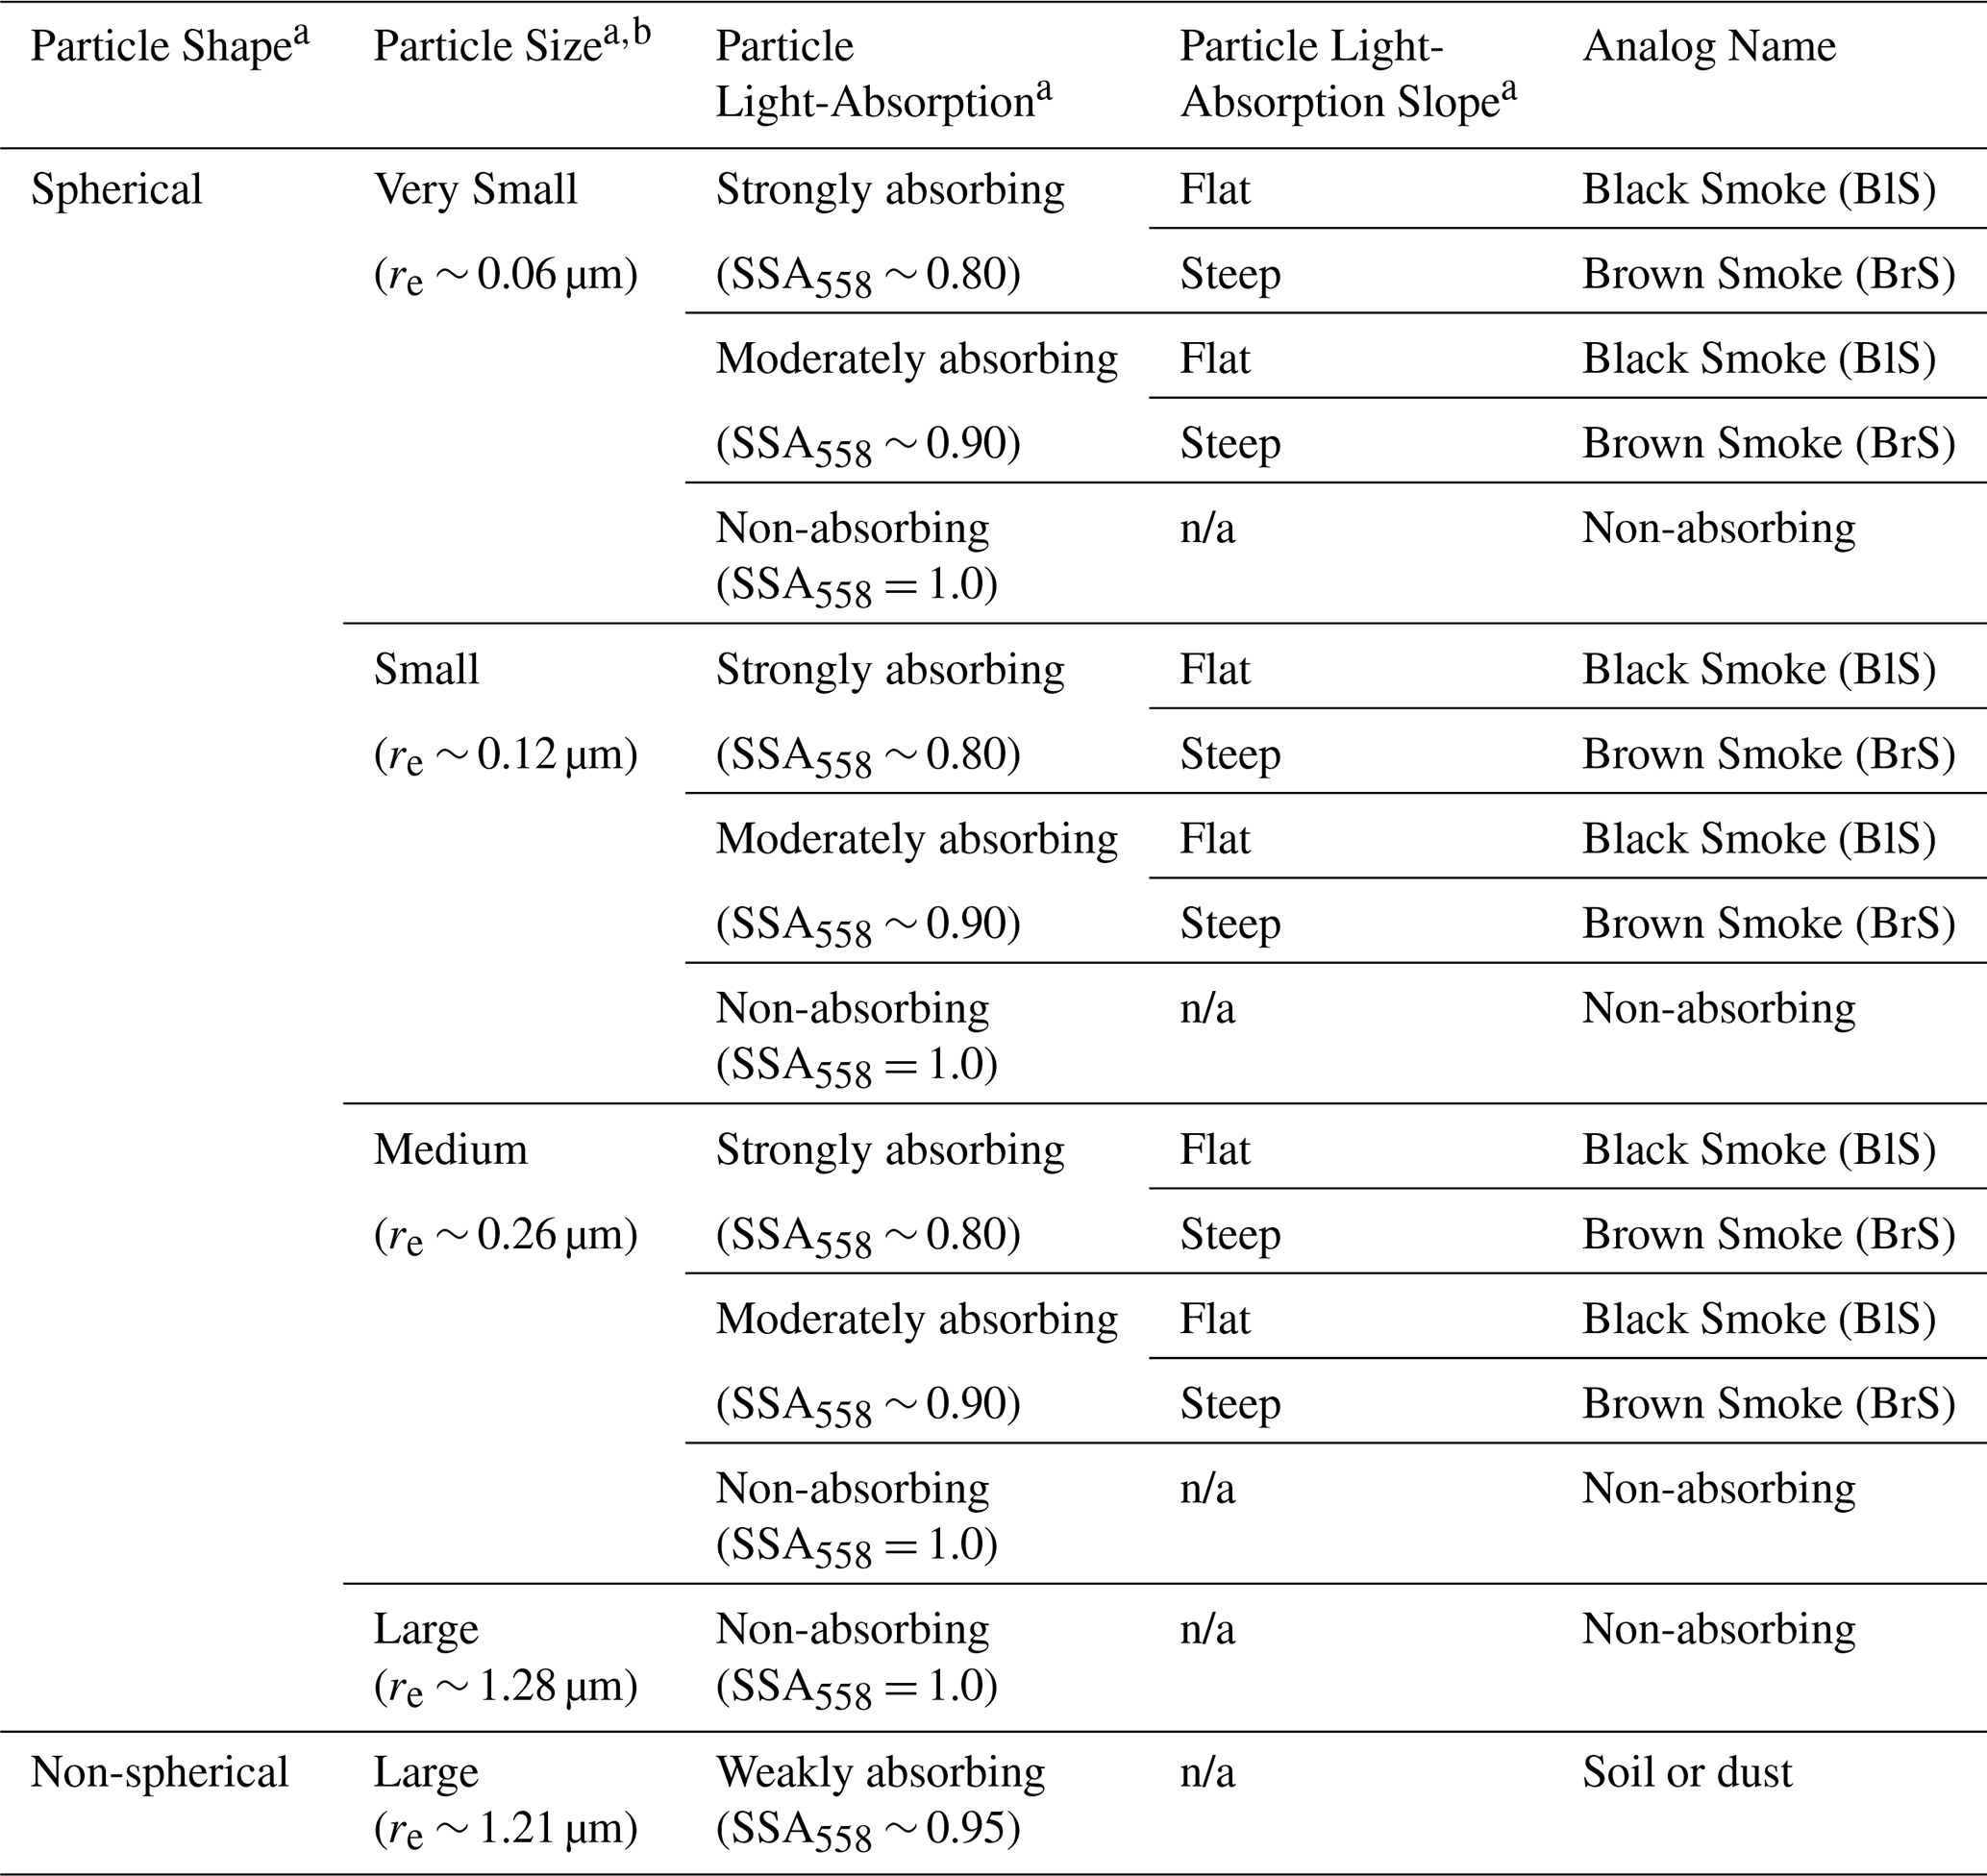
a Particles are classified using four elements: shape – spherical vs. non-spherical; size – very small, small, medium, and large; light-absorption – non-absorbing, weakly absorbing, moderately absorbing, strongly absorbing; and spectral light-absorption profile – equal in all bands (flat) or varying between bands (steep). The SSA values at each wavelength can be found in Table S1 in the Supplement. b Each component size category assumes a lognormal distribution around a designated effective radius re (further details can be found in Table S1 in the Supplement). n/a – not applicable.
The MISR Interactive Explorer (MINX) software tool calculates plume heights and wind vectors by observing the parallax of contrast features within a plume (Nelson et al., 2008, 2013). MINX is a user-friendly, publicly available tool (https://github.com/nasa/MINX, Val and Nelson, 2025) in which the operator manually identifies the plume source, plume extent, and wind direction in the MISR imagery, from which MINX determines heights and wind speeds locally. In conditions where the plume exhibits sufficient contrast features and optical thickness relative to the surface, MINX plume height estimates are accurate to within ±0.5 km or better. MINX has been used extensively to retrieve heights and wind vectors for volcanic plumes (e.g., Kahn and Limbacher, 2012; Scollo et al., 2012; Flower and Kahn, 2017a, b, 2018, 2020a, b; Kahn et al., 2024), wildfire plumes (e.g., Val Martin et al., 2010, 2018; Tosca et al., 2011; Vernon et al., 2018; Junghenn Noyes et al., 2020a, b, 2022), and dust plumes (e.g., Yu et al., 2018; Kahn and Limbacher, 2025, O'Neill et al., 2025). For this work and related wildfire studies (e.g., Junghenn Noyes et al., 2022), we use the MINX wind vectors, along with the distance from the source in the MISR images, to calculate approximate plume-age horizons at discrete intervals within each plume snapshot. From this, we are then able to associate any patterns in the downwind evolution of smoke particles with general timescales. We also use MINX stereo heights to determine whether plumes were injected into the free troposphere, and to study how plume height and thickness may relate statistically to the retrieved smoke particle properties, ambient weather conditions, burning intensity as indicated by fire radiative power (FRP; assessed as the 4 µm brightness temperature anomaly), and fuel characteristics based on land cover type mapping. Approximately a third of the plumes included in this study were identified and digitized with MINX as part of the MISR Plume Height Project (Nelson et al., 2013, 2023), through which we obtained the data. The others were digitized specifically for the current study.
The MISR Research Aerosol (RA) algorithm compares the observed MISR radiances to a look-up table of simulated top-of-atmosphere (TOA) reflectances for a range of aerosol amounts and types, to retrieve aerosol optical depth (AOD), and to constrain particle extinction Ångström exponent (ANG), particle shape (spherical vs. non-spherical), and particle single-scattering albedo (SSA) and its spectral slope. The algorithm climatology can be customized depending on the intended use of the RA (e.g., wildfire vs. volcanic vs. dust plumes), with each particle “type” having distinct size and light-absorption properties. The retrieved particle property information is qualitative, typically with three to five bins in size (e.g., “small,” “medium,” or “large”), two to four bins in SSA (e.g., “highly absorbing,” “weakly absorbing,” and non-absorbing), and spherical vs. non-spherical in shape (Kahn et al., 2010; Kahn and Gaitley, 2015). For light-absorbing aerosols, particle type is further classified by the variation in SSA across the four MISR wavelengths, where the light-absorption by “flat” aerosols displays little to no wavelength dependence and is modelled on the spectral properties of urban pollution or black smoke (BlS), whereas the light-absorption by “steep” aerosols decreases with wavelength and is more typical of that observed in brown smoke (BrS) (Chen et al., 2008; Samset et al., 2018; Limbacher and Kahn, 2014; Andreae and Gelencsér, 2006).
The algorithm determines the most likely mixture of aerosol candidates for each ∼ 1.1 km MISR pixel, interpreted as the fraction of total mid-visible aerosol optical depth that can be attributed to each particle type. For wildfire studies, the algorithm climatology is currently comprised of one non-spherical optical analog and 16 spherical components ranging in size and SSA. Spherical particles are categorized as very small, small, medium, or large in size, strongly absorbing, weakly absorbing, or non-absorbing in the mid-visible range, and spectrally flat or spectrally steep in SSA. The non-spherical component is a large and weakly absorbing dust analog. Table 1 summarizes the RA component climatology, and more detailed information can be found in Table S1 in the Supplement. The operation of the RA is described by Limbacher and Kahn (2014, 2019; Limbacher et al., 2022). It should be noted that for high-confidence MISR aerosol-type retrievals, AOD usually needs to exceed 0.5, depending on the surface properties, and a given component needs to comprise at least 20 % of the total AOD (Kahn et al., 2001; Kahn and Gaitley, 2015). As such, near-source smoke plumes generally provide excellent signal/noise for MISR particle property retrievals.
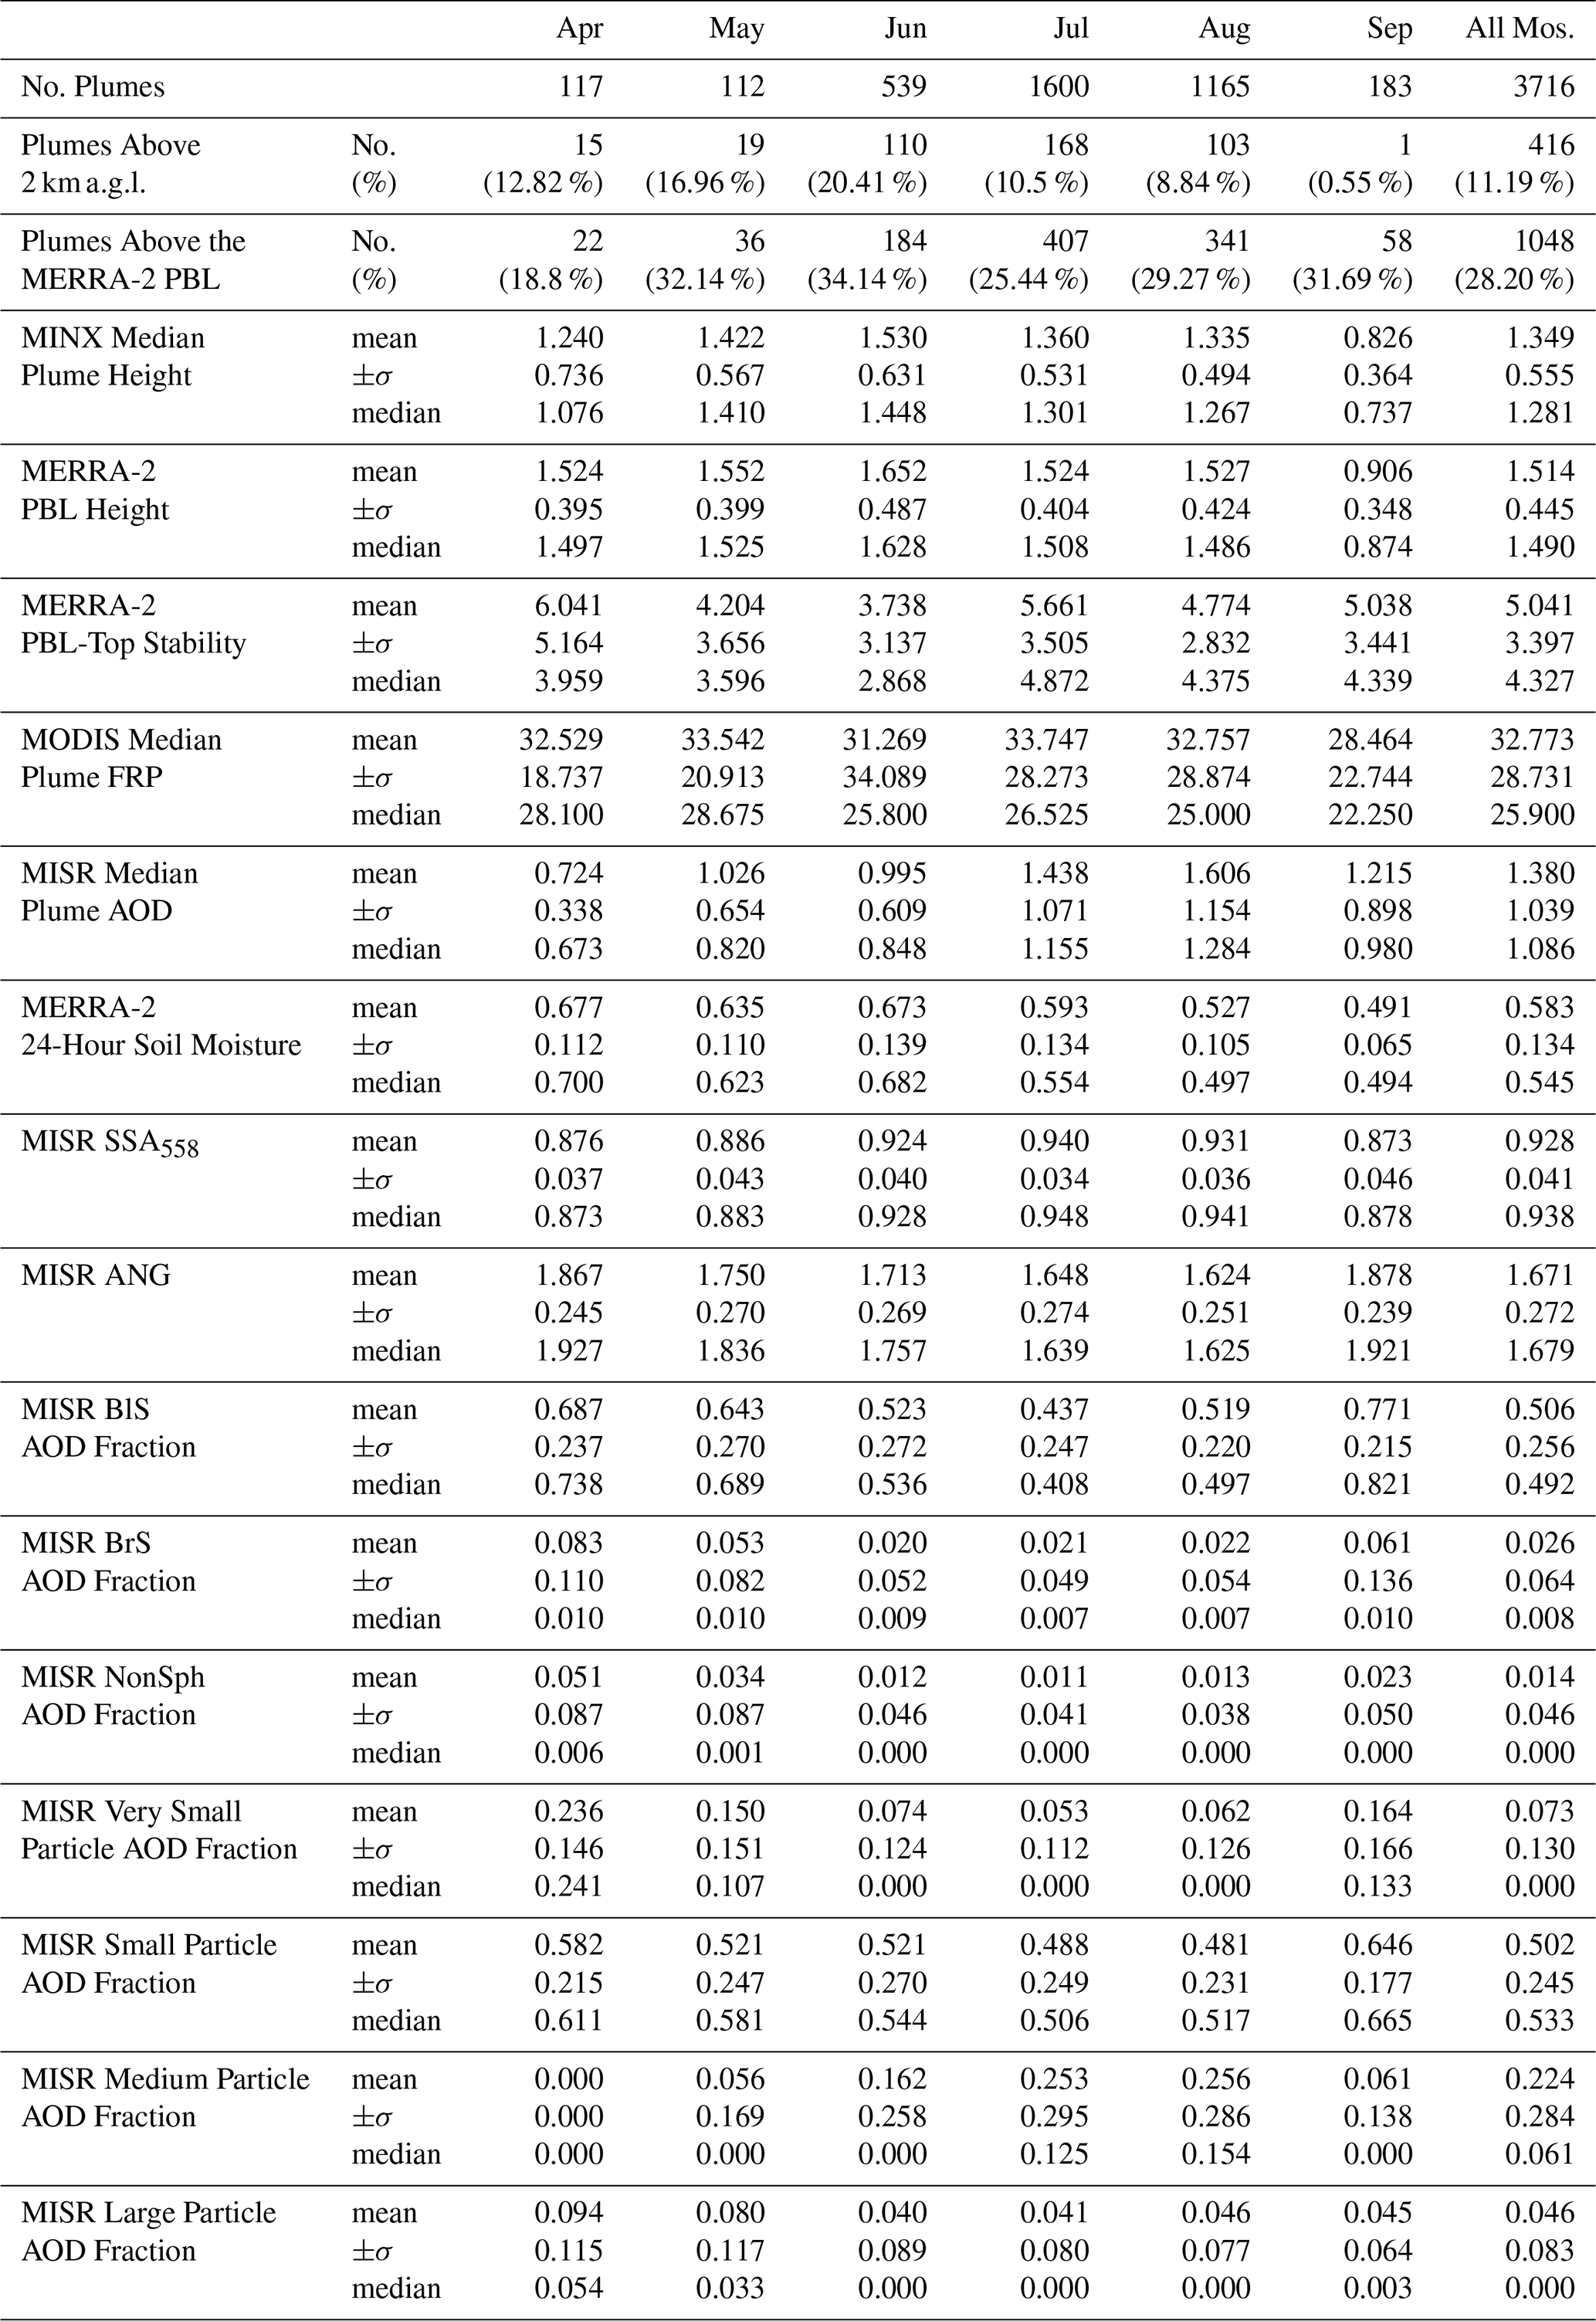
Table 2Basic plume properties for all Siberian plumes included in this study, stratified by month across all years 2017–2021.
There is a need to differentiate between aerosol properties obtained in situ, from direct samples of particles, and those obtained from space-based remote sensing, e.g., by MISR, which represent an interpretation of column-effective radiance measurements. We therefore refer to RA particle size and light-absorption results as retrieved effective particle size (REPS) and retrieved effective particle absorption (REPA), respectively. These terms reflect the limitations of the retrieved quantities (i.e., qualitative, indirectly measured properties sampling the atmospheric column), while still communicating the measured content. For this and related studies, we observe along-plume changes in AOD, REPS, and REPA, combined with MINX-derived plume age estimates, to infer the relevant aging mechanisms for aerosol plumes. For example, Flower and Kahn (2020a, b) observed that decreasing AOD accompanied by decreasing REPS may indicate size-selective particle deposition, whereas constant or increasing AOD accompanied by decreasing REPS downwind may indicate the formation of secondary aerosols in volcanic plumes. In Canadian and Alaskan wildfire plumes, we inferred that plumes with relatively constant AOD yet decreasing REPA downwind probably experienced oxidation or particle hydration, whereas smoke plumes with decreasing AOD and decreasing REPS downwind are more strongly affected by dilution or gravitational settling (Junghenn Noyes et al., 2022).
2.2 Experiment setting and case selection
True-color imagery and thermal anomalies in coincident data from the MODIS instrument aboard Terra, displayed in the NASA Worldview web application, were used to identify suitable fires within the MISR field of view. Well-defined plumes with minimal cloud contamination and adequate optical thickness were favored for analysis. In Siberia, most plumes that are visible in the MISR imagery meet these criteria (unlike in tropical fire-prone regions such as the Amazon or southeast Asia). It is important to note that agricultural fires, although common in Siberia, are usually too small to be observed from space by MISR and MODIS and are therefore beyond the scope of the current study.
A total of 3716 plumes spanning April through September across the years 2017–2021 were selected. Only plumes east of the Ural Mountains were considered – the most westward plume was located at 60.25° E, and the most southward plume was located at 48.69° N (Fig. 1). The distribution of plumes by month and year can be found in Table 2 and Table S2 in the Supplement, respectively.
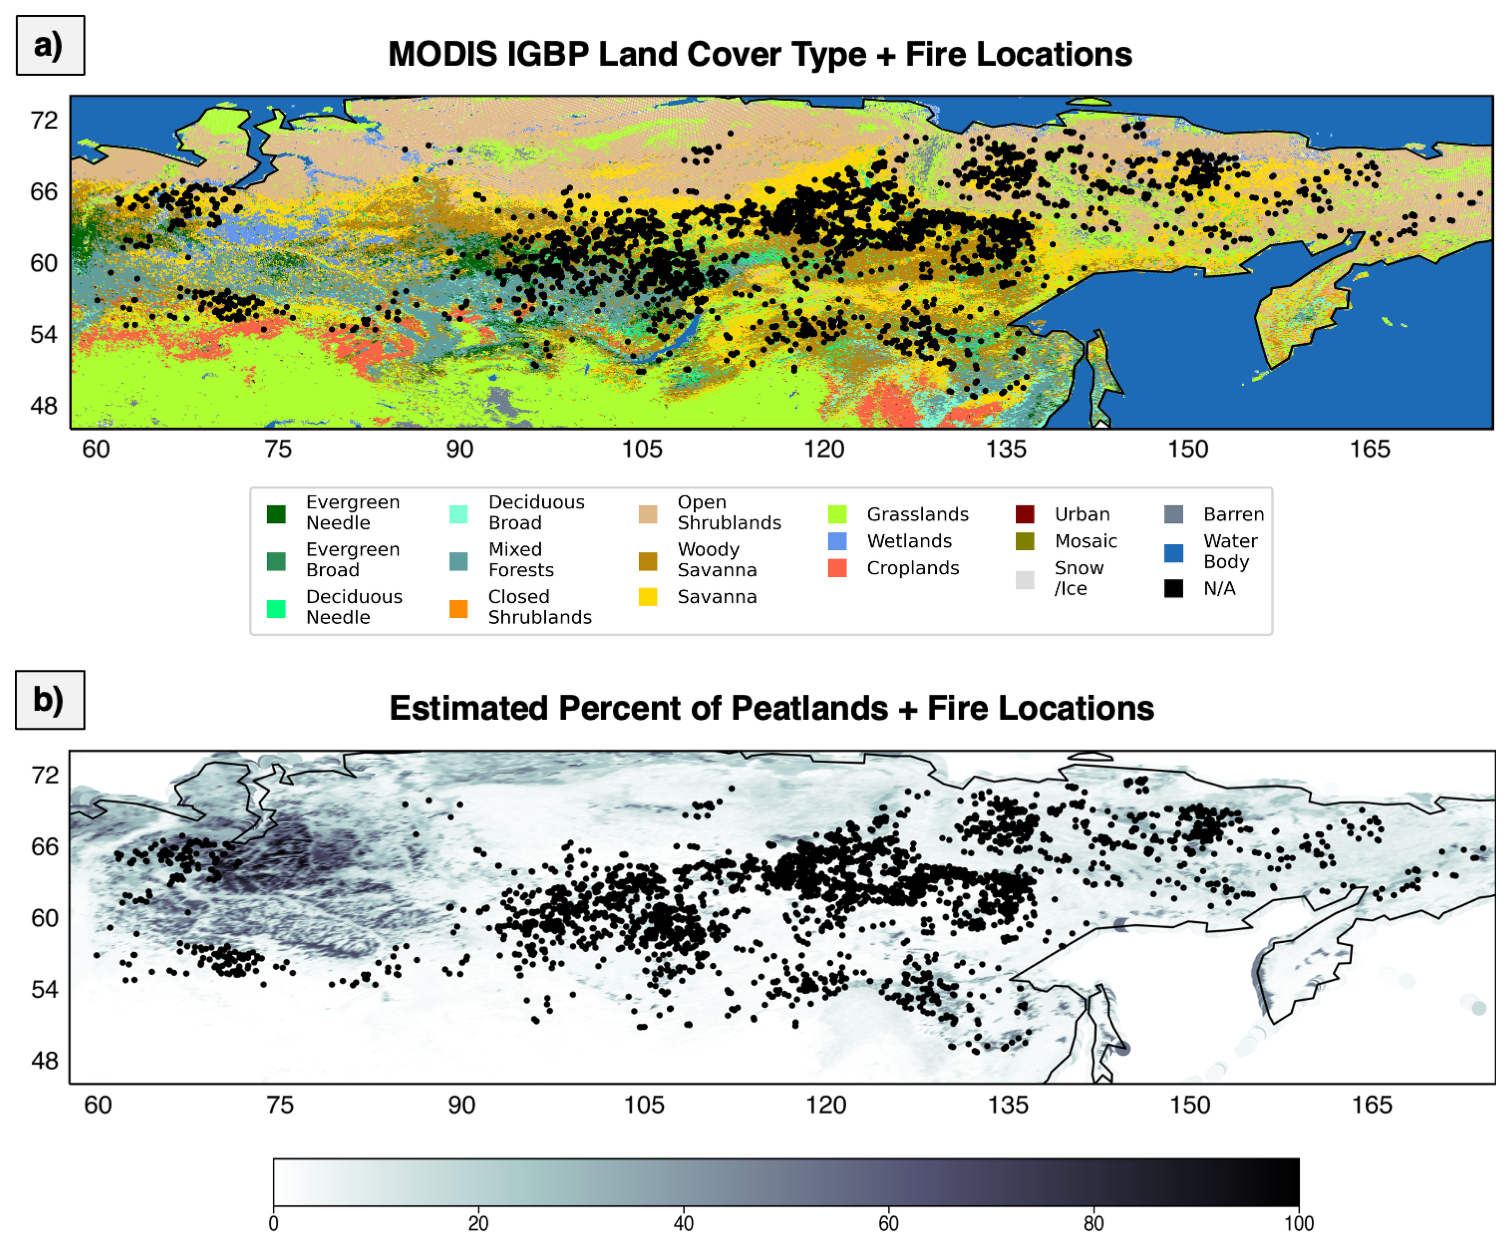
Figure 1Locations of all fires included in this study (black dots), overlaid on (a) the 2017 MODIS IGBP land-cover-type map, and (b) the estimated percent of peatlands from Hugelius et al. (2021). See Table S3 in the Supplement for IGBP land cover type definitions. Note: “needle” = needleleaf; “broad” = broadleaf; “mosaic” = cropland/natural vegetation mosaics.
2.3 MODIS fire radiative power and land cover type
The MODIS/Terra Thermal Anomalies/Fire product (MOD14) was used to locate fire pixels and retrieve the 5 min FRP values at the time of MISR observation (Giglio and Justice, 2015). The user-defined MINX smoke-plume boundary, combined with the MODIS/Terra RGB imagery from NASA Worldview (https://worldview.earthdata.nasa.gov, last access: 29 October 2024) were used to assign each plume a mutually exclusive set of hotspots. The MOD14 product has a spatial resolution of 1 km, and it reports FRP based on a detection algorithm that evaluates differences in the hotspot vs. background brightness temperature using the 4 and 11 µm channels (Giglio et al., 2003). FRP is often used as a qualitative indicator of fire intensity; however, MODIS might underestimate FRP values under cloudy or dense-smoke conditions, when the active fire only partly fills the MODIS pixel, and for plumes in the smoldering phase that exhibit lower radiant emissivity and therefore produce lower FRP values (Kahn et al., 2008).
We systematically coupled the fire pixels with annual 0.5 km land cover type data from the MODIS MCD12Q1 product (Friedl and Sulla-Menashe, 2019), classifying the type(s) of vegetation burning in each hotspot using the International Geosphere–Biosphere Programme (IGBP) classification system. This product does not contain sufficient information to determine the actual fuel type consumed by fires, which also depends on factors such as meteorology and seasonality. However, land cover and fuel type are closely related, and we use the MODIS product to make inferences as to the types of fuels that are present. As the MCD12Q1 spatial resolution is finer than that of MOD14, some MODIS hotspots cover multiple land cover types, in which case we assigned land type as a split between the two that comprise the largest fractions of the fire pixel. Descriptions of the IGBP land cover types identified in this study are included in Table S3 in the Supplement.
2.4 Peatlands distribution
Peat consists of plant detritus that has accumulated, typically on the forest floor, due to incomplete decomposition under water-saturated conditions, and is therefore a major reservoir of terrestrial carbon. However, climate-driven increases in peatland disturbance such as drought, thawing of permafrost, and higher fire frequency have the potential to reintroduce sequestered carbon into the atmosphere (Turetsky et al., 2015). As boreal forests are the major locations for peat fires compared to lower-latitude forest biomes due to generally colder weather, wildfires in Siberian peatlands may have significant climate impacts in the future. For this study, we hypothesize which wildfires were burning in peatlands using GIS grids of peatland properties from Hugelius et al. (2021). The dataset provides several different peat maps quantifying the percentage of peat coverage, its depth in cm, and peat nitrogen and carbon storage at a 0.1° × 0.1° resolution for the full northern hemisphere north 23° N (Hugelius et al., 2020).
2.5 MERRA-2 reanalysis
We retrieve the estimated height of the planetary boundary layer (PBLH) for each plume from the MERRA-2 reanalysis model (Bosilovich et al., 2016; Gelaro et al., 2017; Global Modeling and Assimilation Office, 2015b). The PBLH data are provided at 0.625° longitude × 0.5° latitude spatial resolution and hourly temporal resolution, so we select the data point closest to the time and location of each fire plume origin. Note that, throughout this work, we alternate between using the phrases “above the PBL” and “in the free troposphere (FT)” for plumes that we estimate were injected above the MERRA-2-defined PBL. These terms have identical meaning and are used interchangeably.
We calculate atmospheric stability profiles for the column above each plume using three-dimensional (3D) MERRA-2 meteorological data, reported every 6 h, at 0.625° longitude × 0.05° latitude spatial resolution (Global Modeling and Assimilation Office, 2015a). We define atmospheric stability as the vertical gradient of potential temperature, calculated using Eq. (1) (Holton, 1992), where S is the stability value at the midpoint between two model levels, dθ is the calculated difference in potential temperature between the levels, and dz is the difference in geopotential height. Potential temperature is calculated using Eq. (2) (Holton, 1992), where T and P are the atmospheric temperature and pressure, respectively, at altitude z. P0 is the surface pressure (taken as 1000 mbar), R is the gas constant for dry air, and Cp is the specific heat for dry air.
We interpolate the temperature and pressure fields to the time of MISR observation for each plume. The height of a stable atmospheric layer is defined as the height of the first maximum in the stability profile, so long as the stability is at least 1 K km−1 larger than the layers above and below. This definition is consistent with how layers of relative stability have been defined in similar work by Kahn et al. (2007) and Val Martin et al. (2010), as well as in our study of Canadian and Alaskan wildfires.
To estimate the antecedent moisture conditions of vegetation and surface soil nearby a wildfire, we leverage surface moisture content from MERRA-2 hourly land surface diagnostics data (provided at 0.625° × 0.5° spatial resolution), averaged into daily means for the 24 h preceding MISR observation of each plume. Surface soil moisture is provided on a scale of 0 to 1 (unitless), with 1 representing a fully saturated soil layer and 0 representing a dry surface.
Figure 1 maps the locations of the plumes included in this study over Siberia, (a) superimposed on the 2017 MODIS IGBP land cover type map and (b) on the Hugelius et al. (2021) peatlands distribution map. The largest number of plumes in our study was observed in 2019 (nearly 1000), and the fewest in 2017 (529 plumes; Table S2 in the Supplement). Most plumes formed during the peak of the burning season in July (1600 plumes), followed by the month of August (1165 plumes) (Table 2, Fig. 2a). Of the total number of thermal anomalies identified in the study, over 50 % were located at least partially in savannas, ∼ 40 % in woody savannas, ∼ 17 % in open shrublands, ∼ 17 % in various forested biomes, and < 2 % in grasslands, as identified by the MODIS IGBP schema. (Note that because of the different spatial resolutions of the MOD14 and the MCD12Q1 products, one thermal anomaly can be located across two different land cover types; all other MODIS land cover types were present ≪1 % of the time.) Of the total number of plumes in the experiment, the majority were located in 0.1° × 0.1° grid cells containing relatively low fractions of peat, with 62 % of plumes associated with 5 % or less peat content, and only 11 % of plumes associated with peat fractions of 20 % or greater.
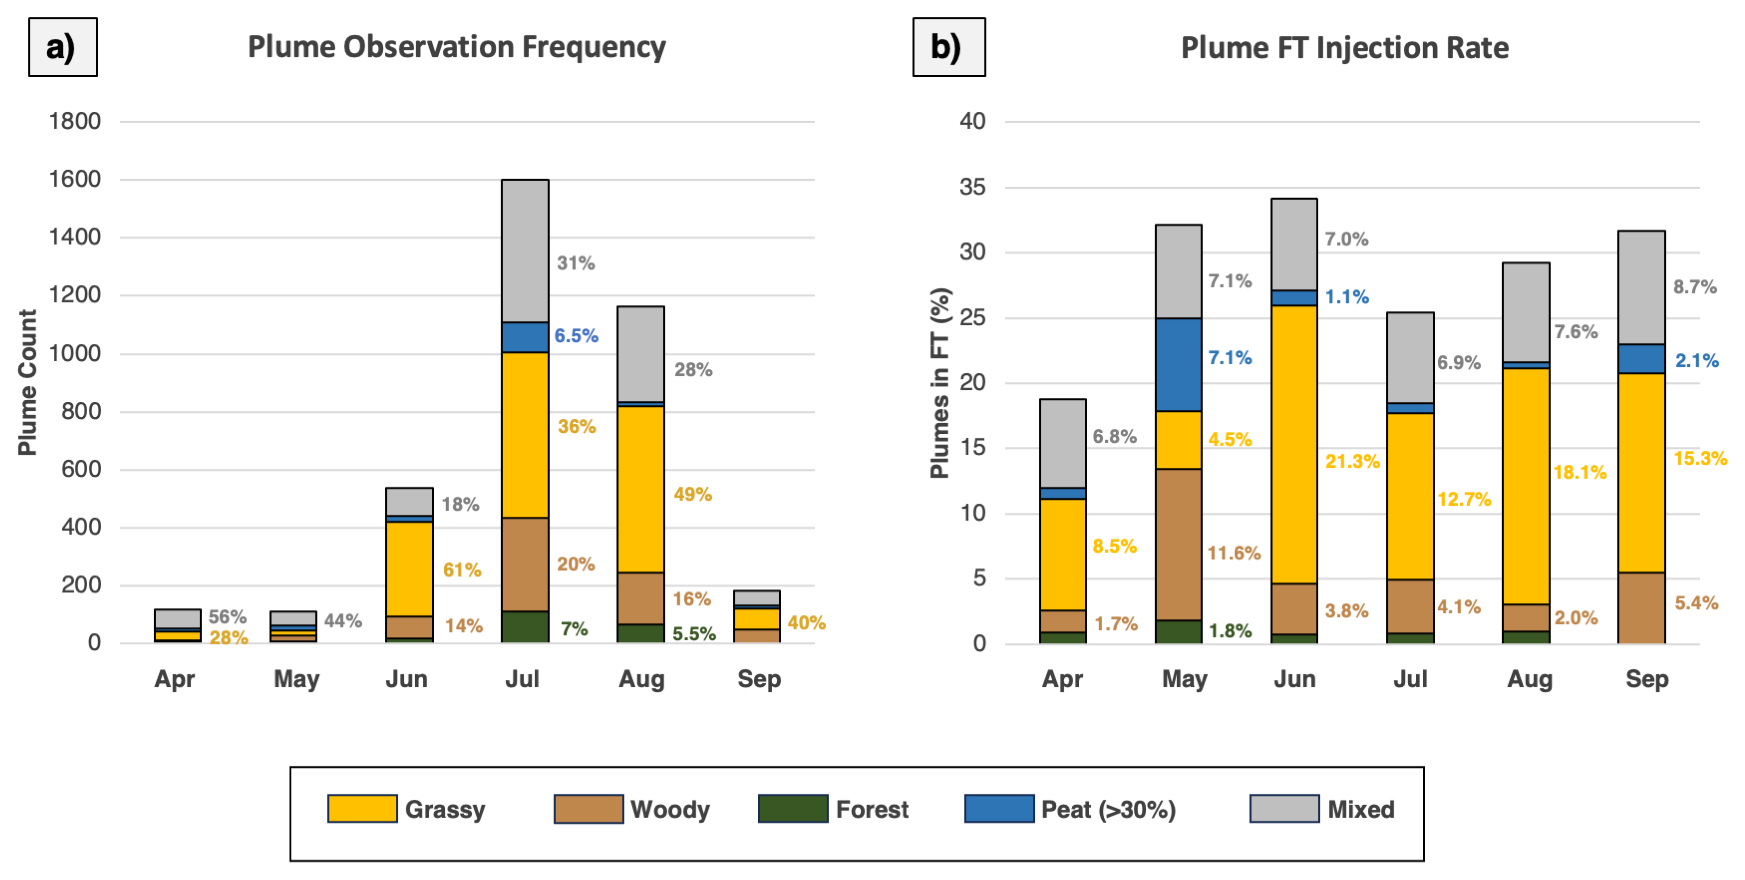
Figure 2Monthly variability in (a) the number of plumes observed, and (b) the percentage of plumes in the free troposphere. Each bar is divided by color according to the relative contribution from each fire type in the given month, with quantitative annotations where space allows. For example, 1600 plumes were identified in July (a), 7 % of which were F fires, 20 % of which were W fires, 36 % of which were G fires, and 6.5 % of which were P fires (with 31 % of the plumes not falling into any of the four plume categories, i.e., “mixed” fires). Of the 1600 July fires, ∼ 34 % were in the free troposphere (b; <1 % classified as F fires, 3.8 % classified as W fires, 21.3 % classified as G fires, 1.1 % classified as P fires, and 7 % mixed). Note that a plume is considered to be in the FT if its MINX-retrieved median height is 100 m greater than the PBL height as defined in the MERRA-2 dataset.
We partition our Siberia fire map into domains based on the dominant land cover type present near the fire, and categorize plumes based on the following definitions:
-
“Forest” (F) plumes: at least 80 % of the MODIS thermal anomalies burn in MODIS IGBP deciduous, evergreen, or mixed forests, and the estimated fraction of peat is less than 30 %
-
“Woody” (W) plumes: at least 80 % of the MODIS thermal anomalies burn in MODIS IGBP woody savannas, and the estimated fraction of peat is less than 30 %
-
“Grassy” (G) plumes: at least 80 % of the MODIS thermal anomalies burn in MODIS IGBP savannas, grasslands, or open shrublands, and the estimated fraction of peat is less than 30 %
-
“Peat” (P) plumes: the estimated fraction of peat is at least 30 %, regardless of IGBP land cover type
-
“Mixed” (M) plumes: plumes that do not meet the criteria for the other four categories
Based on these definitions, the experiment contains 1596 Grassy plumes, 649 Woody plumes, 210 Forest plumes, and 173 Peat plumes. There are also 1088 Mixed plumes, in which peat content is less than 30 % and the MODIS land cover types present are more evenly distributed, so that the 80 % threshold is not reached. In these plumes, savannas, woody savannas, and forests are the major land cover types present. It should be noted that although agricultural fires are common in Siberia, the typically low AOD and the spatial resolution of both MODIS and MISR limited our ability to detect these relatively small fires. The large fraction of fires burning in savanna-like ecosystems is consistent with other studies of the northern boreal regions (e.g., van der Werf et al., 2010).
Figure 2a quantifies the monthly frequency of these plume types from April through September across all years in the study (see Fig. S1 in the Supplement for their geographic distribution, also stratified by month). Figure 3 provides statistical summaries of plume height, PBL height and PBL-top stability, FRP, AOD, and surface soil moisture for plumes within the PBL, stratified by land-cover type. Similarly, Fig. 4 presents the summary of these key variables for plumes that inject above the PBL. (Figure S2 in the Supplement illustrates this information for all plumes both within and above the PBL, for reference.) Statistical summaries of MISR-retrieved ANG, SSA, and AOD as a function of estimated smoke age, stratified by land-cover type and seasonal groupings, are given in Fig. 5. Figures 6 and 7 show retrieved particle-size category and inferred aerosol type, respectively, as a function of estimated smoke age, partitioned by land-cover type and season.
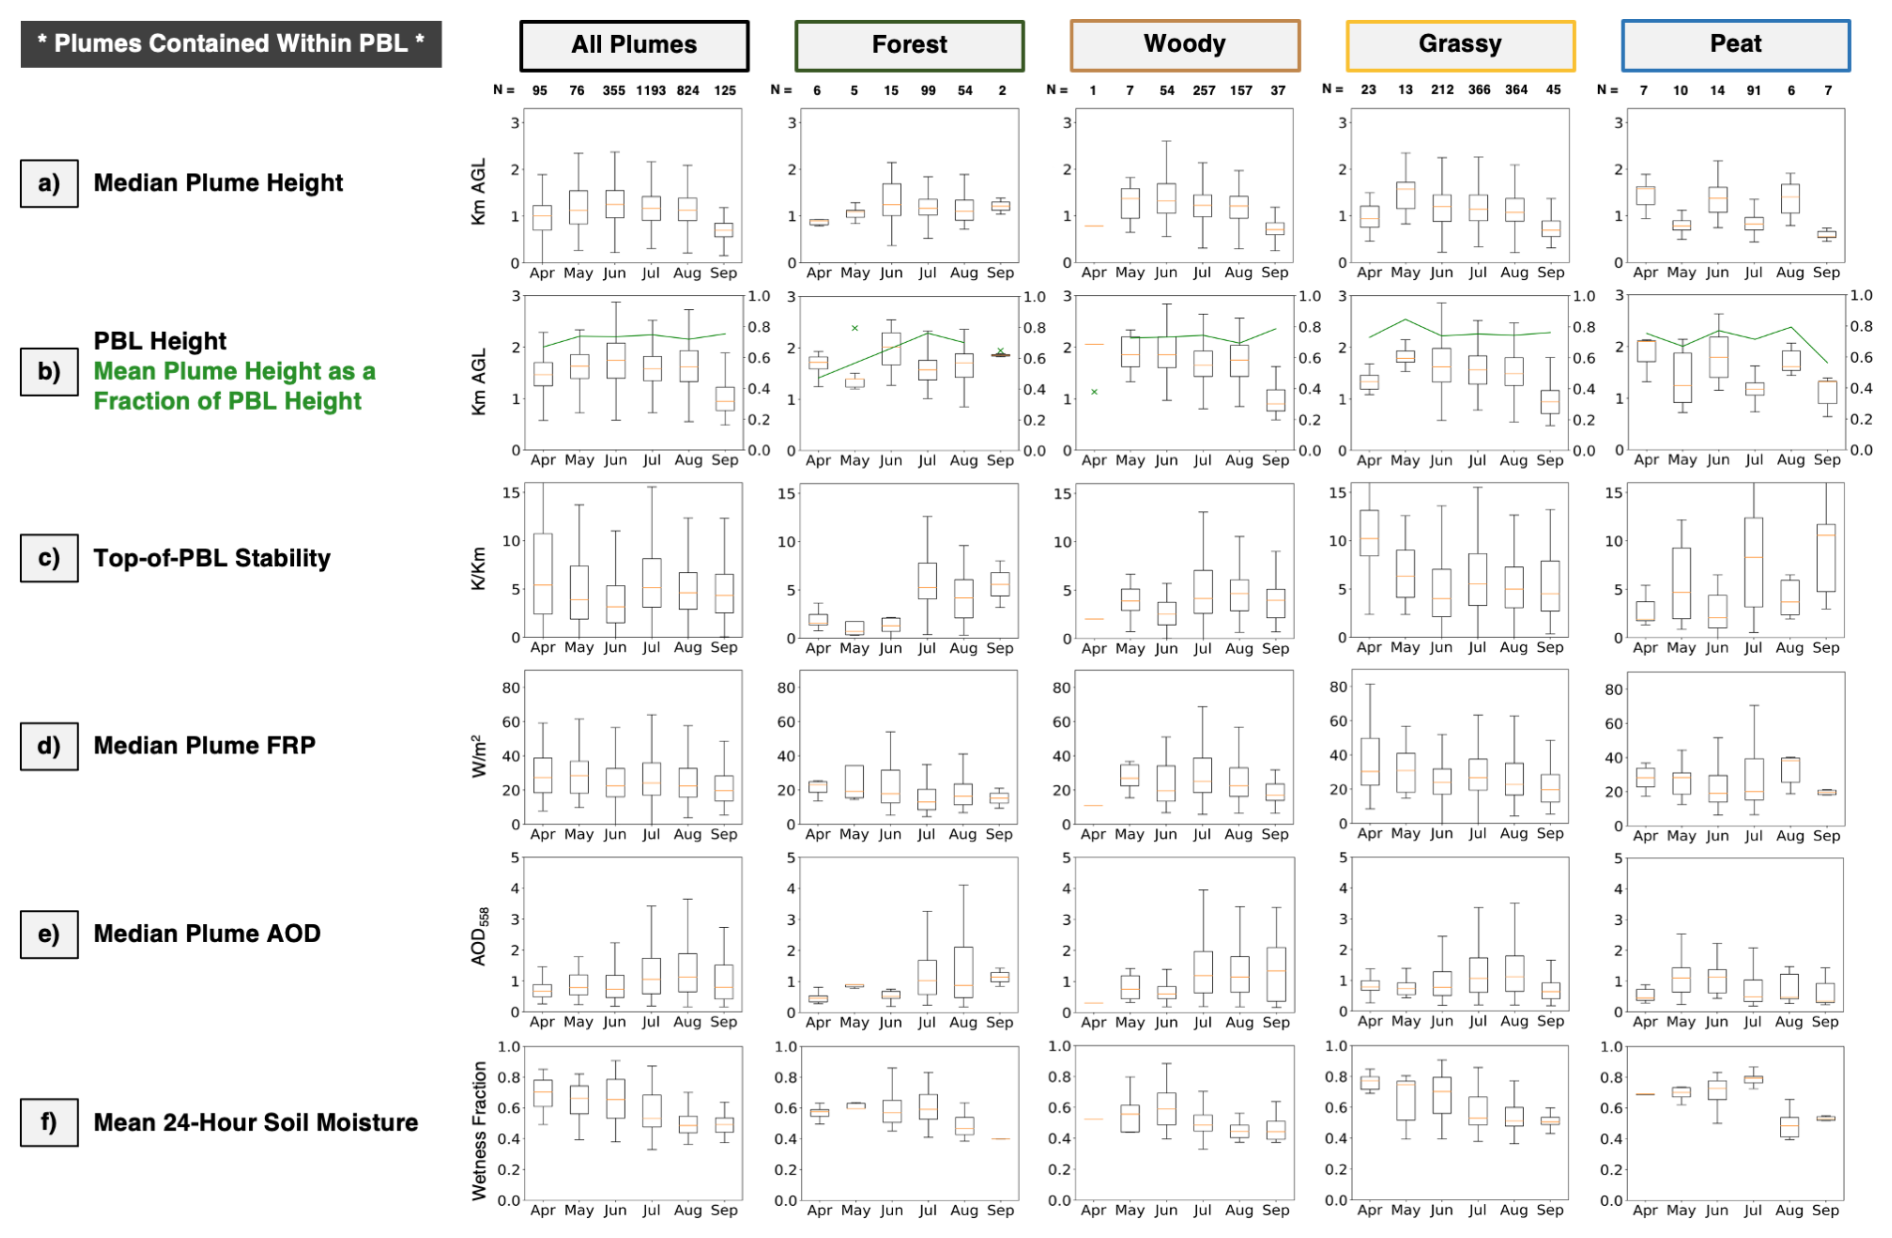
Figure 3Box plots of several key plume properties for the 2668 Siberian plumes confined to the planetary boundary layer, stratified by month. The leftmost column corresponds to all such plumes, regardless of type, whereas columns 2–5 each correspond to one plume type. The boxes represent the central 50 % of the data, with the lower quartile (Q1) on the bottom, the upper quartile (Q3) on the top, and the median in the middle depicted with a red line. The whiskers extend to 1.5 times the interquartile range from the first and third quartiles of the data ( and ; points outside this range are considered outliers and are not plotted. (a) The median plume height, as retrieved by MINX. (b) The height of the planetary boundary layer (PBL) from MERRA-2 reanalysis (left vertical axis), and the MINX plume height as a fraction of PBL height (right vertical axis). (c) Estimated atmospheric stability at the top of MERRA-2 PBL. (d) The plume-median MODIS fire radiative power (FRP). (e) The plume-median aerosol optical depth at 558 nm, as retrieved by MISR. (f) The mean surface moisture content from the 24 h preceding MISR observation, from MERRA-2 reanalysis.
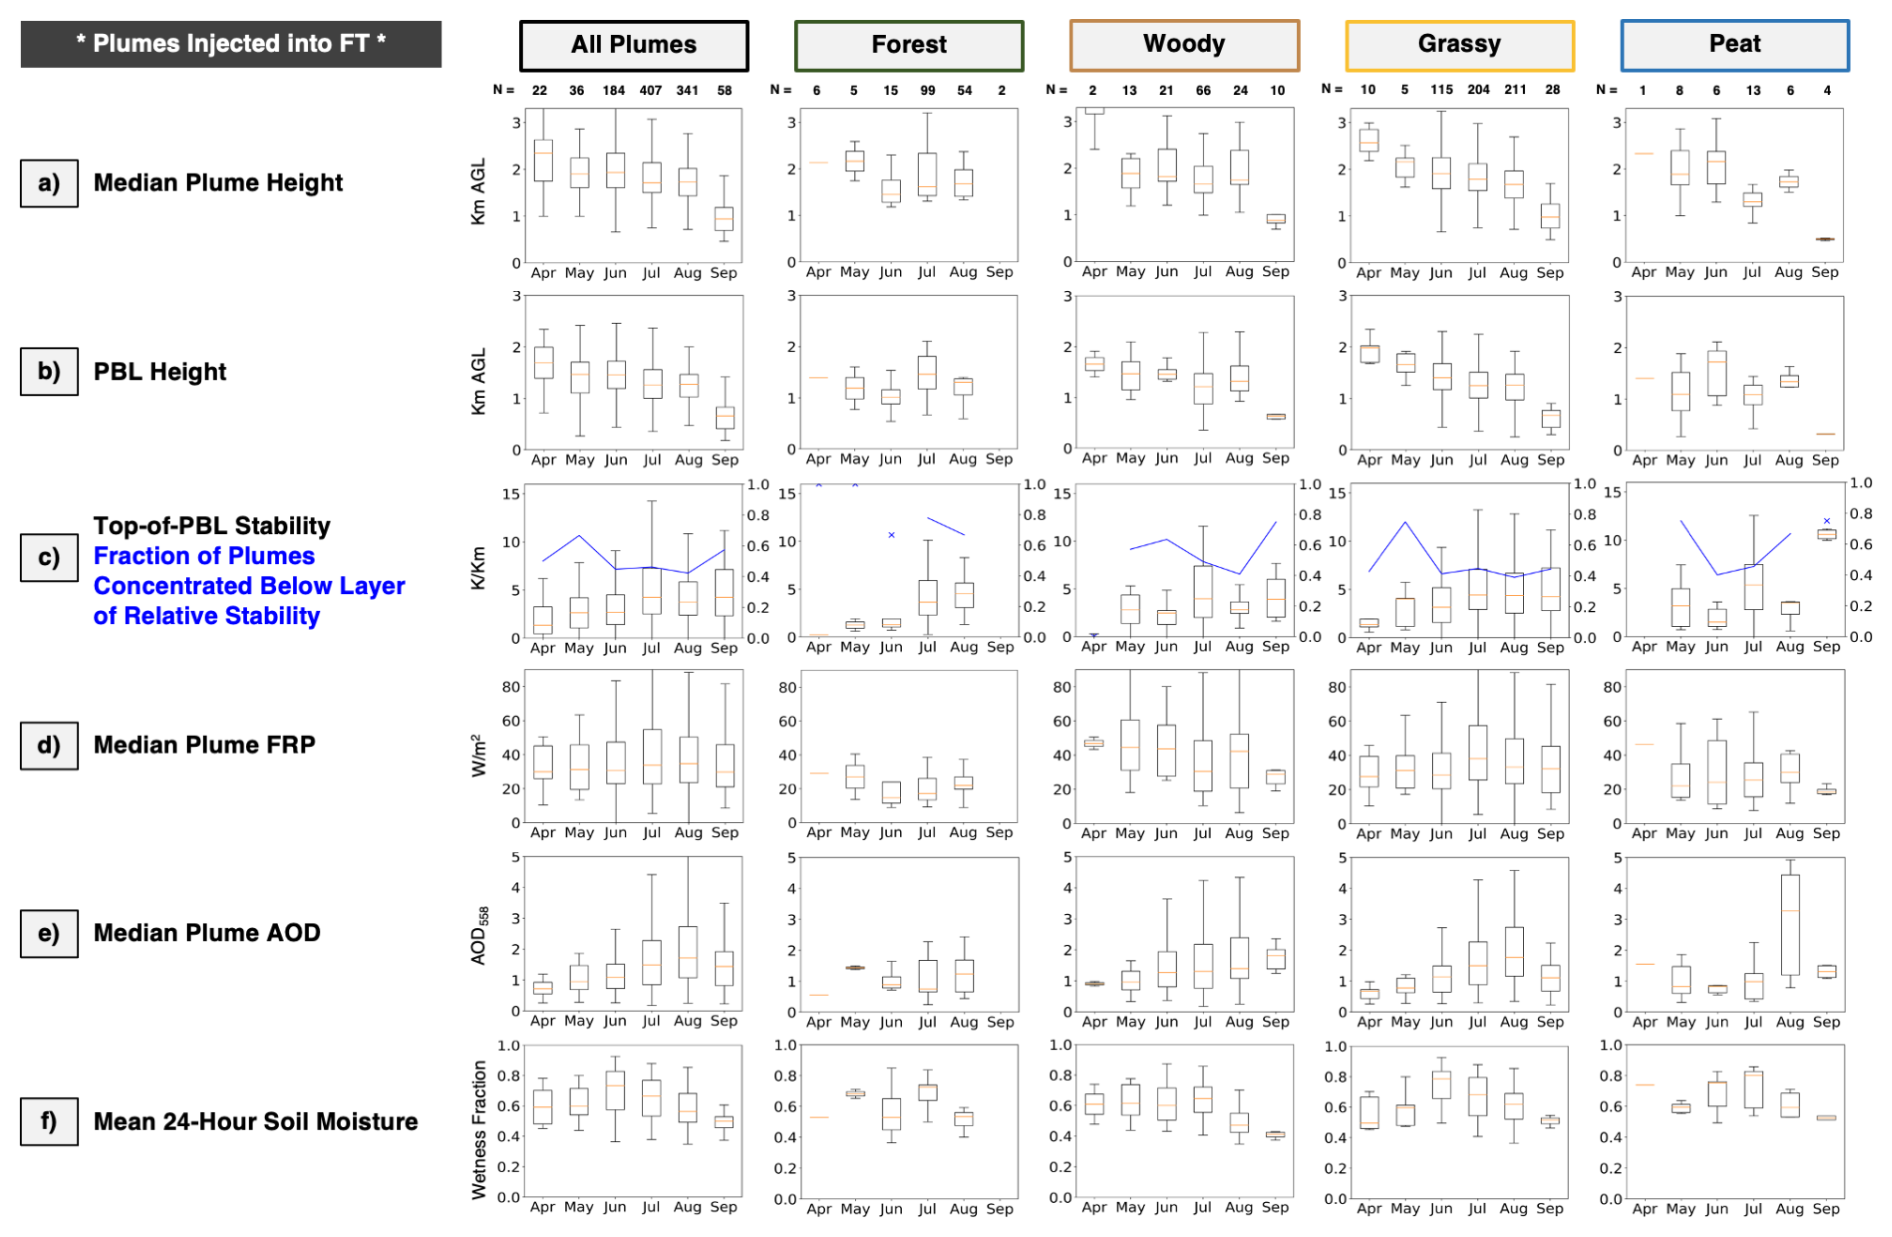
Figure 4The same as Fig. 3, but for the 1048 plumes in the free troposphere, based on FT elevation from MERRA-2 reanalysis. Unlike in Fig. 3, there is no value plotted on the secondary vertical axis for plots in row (b). Instead, the secondary vertical axes in row (c) displays the fraction of plumes concentrated below a layer of relative stability, from MERRA-2 reanalysis and Eqs. (1) and (2) described in Sect. 2.6.
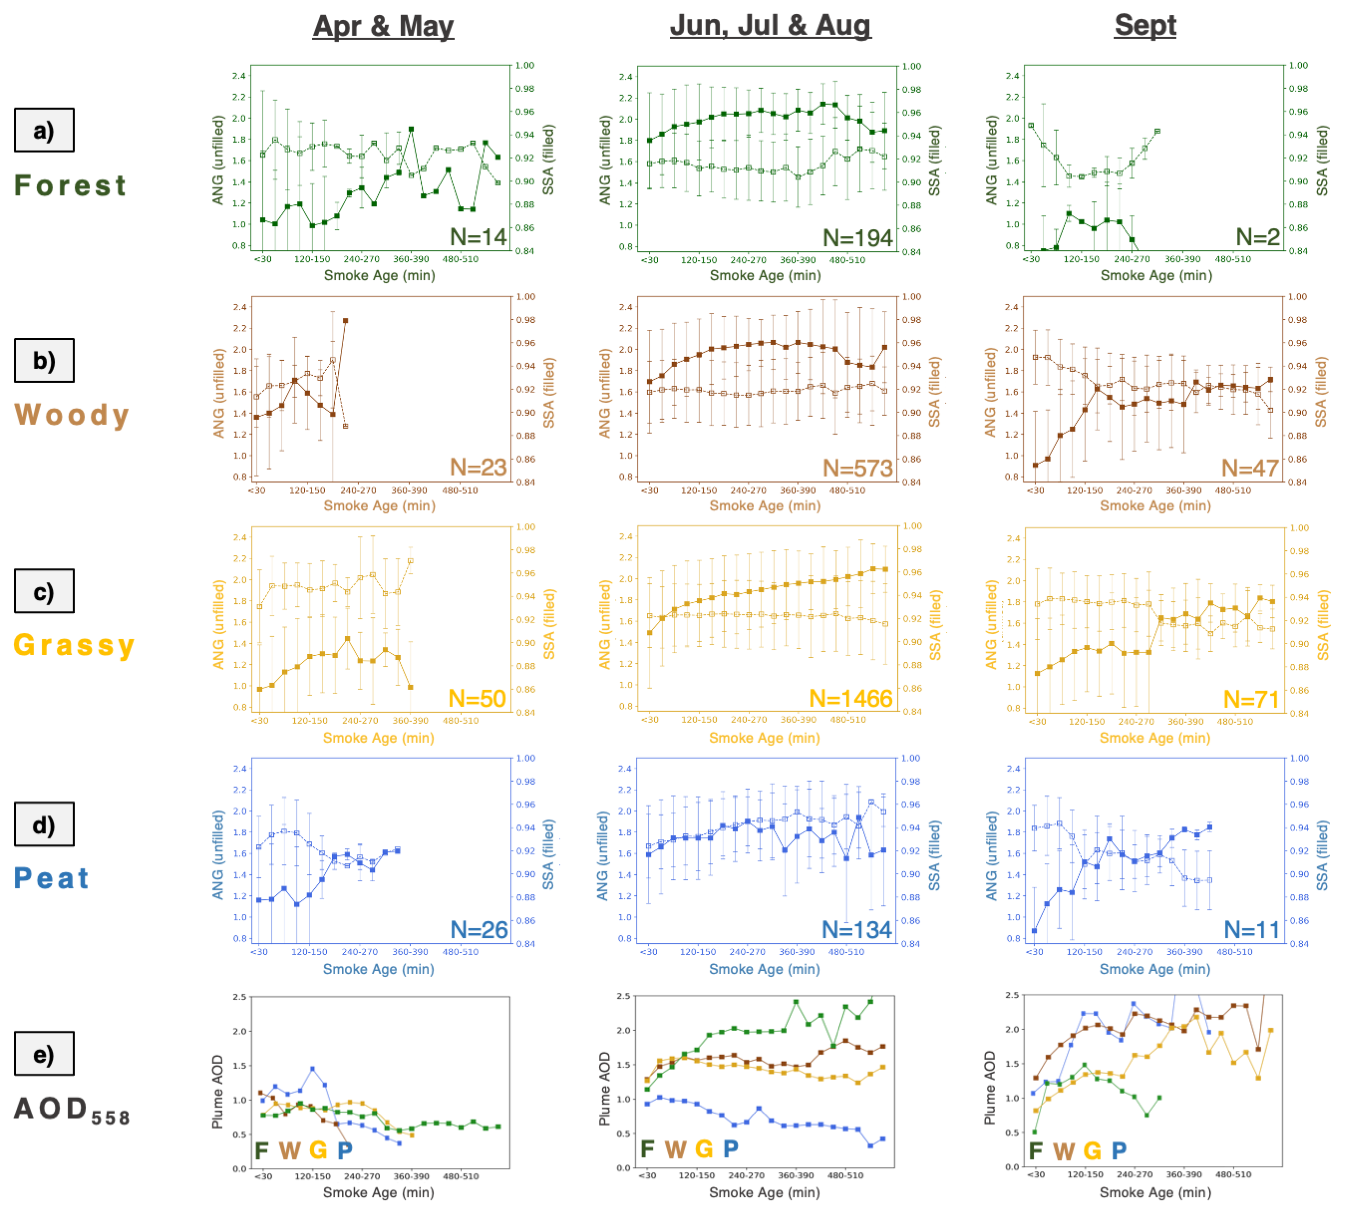
Figure 5MISR Ångström exponents (unfilled markers, dotted lines, left vertical axes) and mid-visible single-scattering albedos (filled markers, solid lines, right vertical axes) by smoke age for (a) Forest plumes, (b) Woody plumes, (c) Grassy plumes, and (d) Peat plumes, stratified by season. The points represent the mean values, and the whiskers show the standard deviations. In (e), the MISR mid-visible AOD is plotted by age for the four plume types.
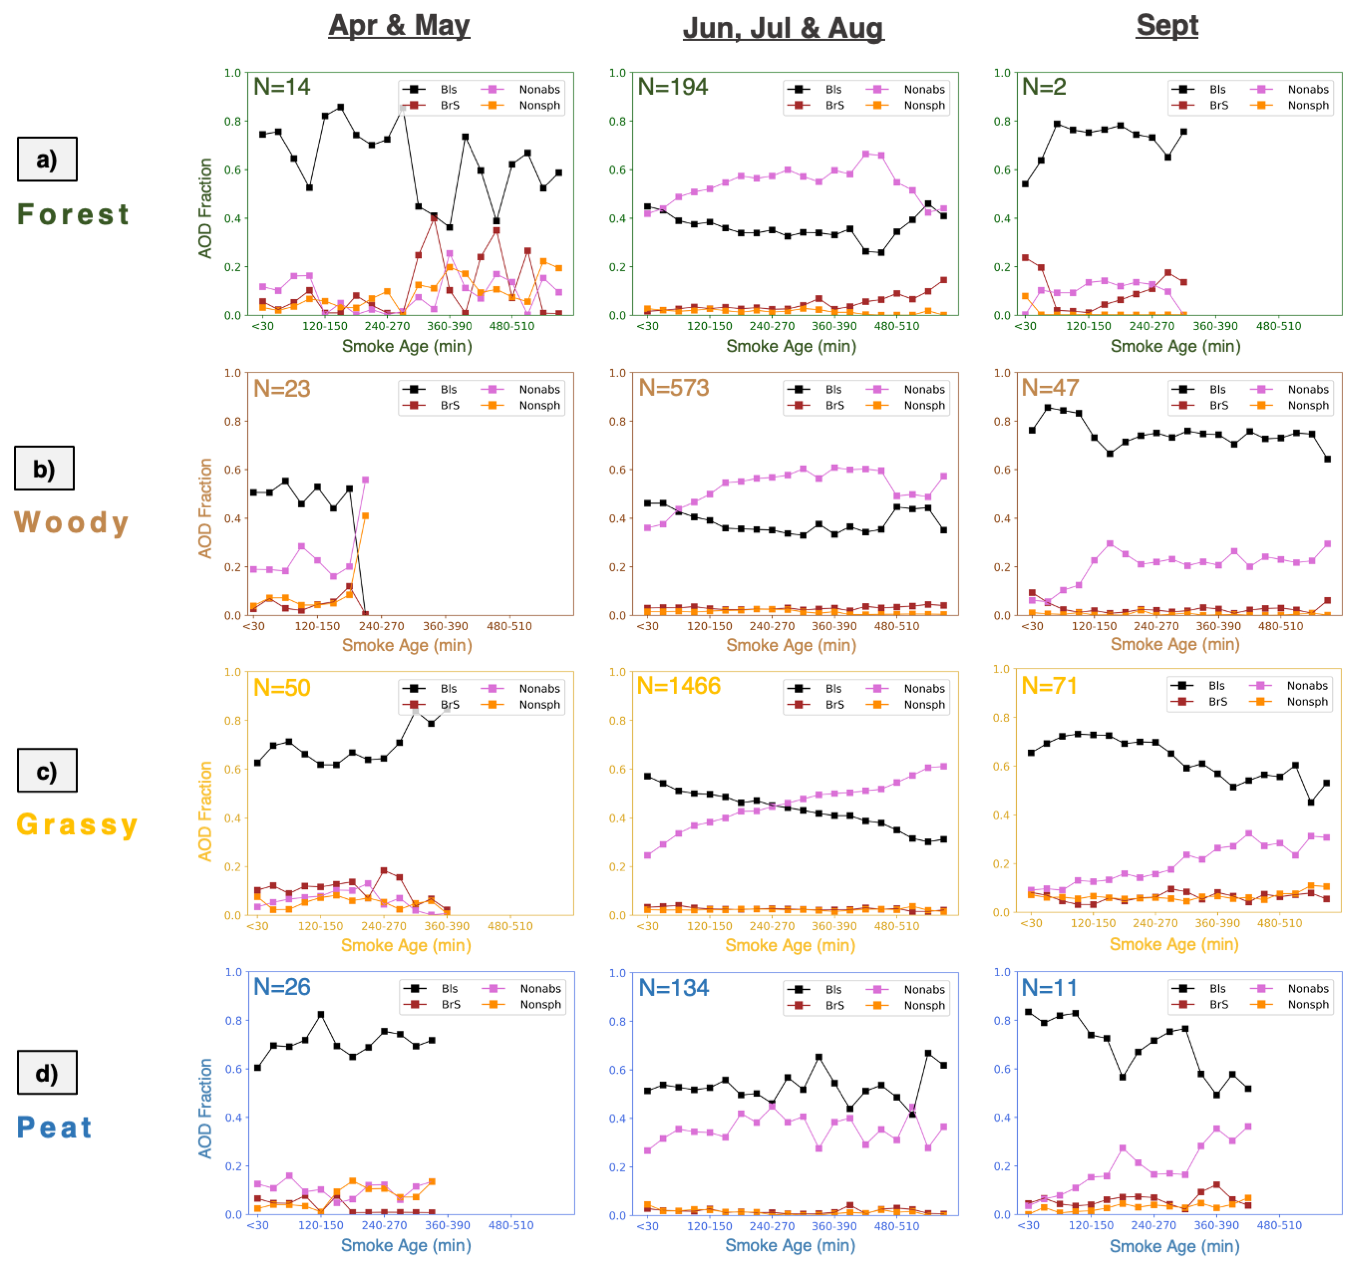
Figure 6Mean MISR particle-type component AOD fractions (in terms of the contribution to the total AOD, from 0 to 1) by smoke age for (a) Forest plumes, (b) Woody plumes, (c) Grassy plumes, and (d) Peat plumes, stratified by season. BlS = black smoke (black line and markers); BrS = brown smoke (red-brown); Nonabs = non-absorbing (pink); Nonsph = non-spherical (orange).
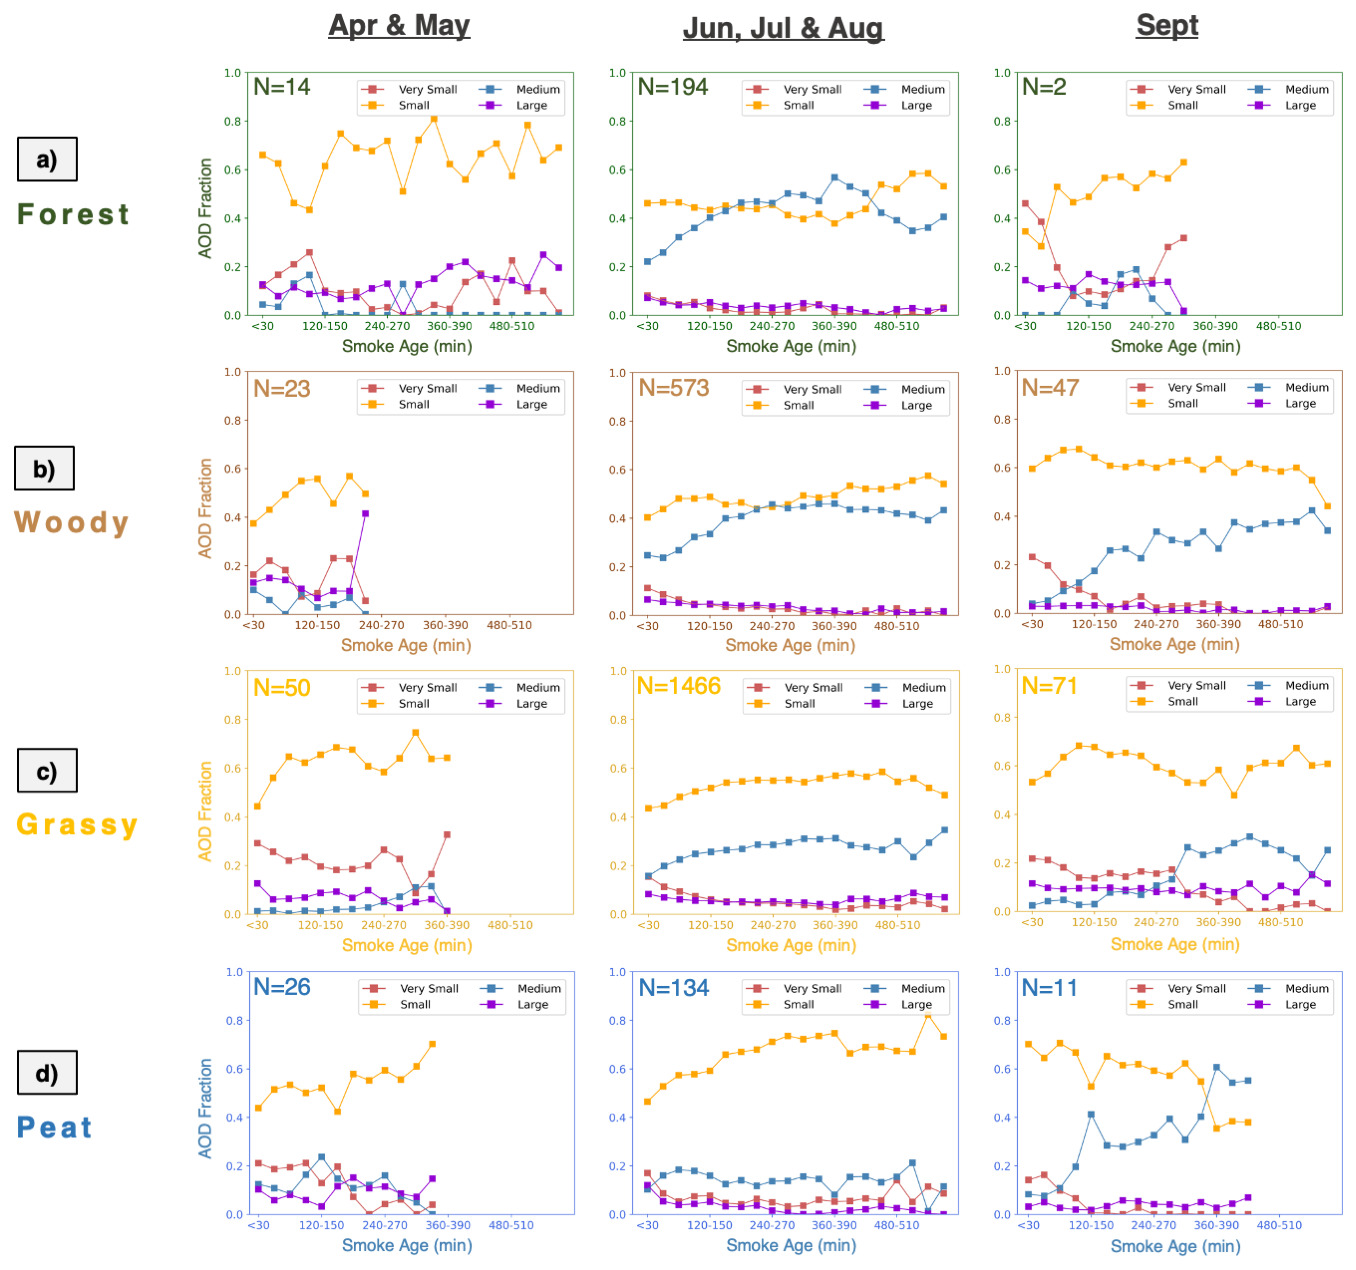
Figure 7Mean MISR particle-size component AOD fractions (in terms of the contribution to the total AOD, from 0 to 1) by smoke age for (a) Forest plumes, (b) Woody plumes, (c) Grassy plumes, and (d) Peat plumes, stratified by season. BlS = black smoke (black line and markers); BrS = brown smoke (red-brown); Nonabs = non-absorbing (pink); Nonsph = non-spherical (orange).
Median plume height, assessed over the entire dataset, is centered at ∼ 1.35 km a.g.l. (above ground level), i.e., largely within the PBL (Table 2), and maximum plume heights are ∼ 2.07 km a.g.l., with only 11 % of plumes having median heights above 2 km. Overall, PBL heights were on average ∼ 1.5 km a.g.l. and PBL-top stability ∼ 4.3 K km−1. For May, June, and August, the aggregate of plumes of all types was more or less equally likely to inject into the FT (Table 2, Fig. 2b) – around ∼ 29 %–34 %; in July, it is about 25 %, and in April, only 18 % of all plumes injected into the FT. Of all the plumes injected into the FT, 78.5 % were associated with a distinct layer of relative stability within the FT, as might be expected (Kahn et al., 2007; Val Martin et al., 2010). In cases where no stable layer is present within the FT, plume heights are in general statistically greater than when a stable layer is present (1.92 vs. 1.80 km a.g.l. for median-heights, p<0.05). Smoke plumes injected into the FT were associated with significantly higher (p<0.05) FRP values than those within the PBL – median FRP values are centered at 43.2 and 28.6 W m−2 for plumes above and within the PBL, respectively. For cumulative FRP (the sum of FRP for all hotspots associated with a plume), the corresponding values are 1332 and 440 W m−2, respectively. Thus, both FRP and ambient atmospheric structure favor plume injection above the PBL when FT injection is observed, as might be expected on physical grounds (e.g., Kahn et al., 2007; Val Martin et al., 2012).
Retrieved particles in essentially all Siberian smoke plumes in this dataset are spherical (Fig. 6), with only 4.5 % of plumes having median AOD fractions of non-spherical particles exceeding 10 %, and less than 1.5 % of plumes exceeding 20 %. (Based on sensitivity and validation studies, under the best retrieval conditions, mid-visible AOD must exceed about 0.2, and an aerosol component must comprise at least 20 % of total AOD to be identified with confidence in the MISR retrievals (Kahn et al., 2001; Kahn and Gaitley, 2015).) In terms of retrieved particle types, Siberian plumes are a mixture of primarily BlS and non-absorbing particles, as the AOD fractions of BrS are also low throughout most of the dataset, with median-plume AOD fractions centered at ∼ 2.6 %. In terms of retrieved particle sizes, plumes are dominated by small and medium particles, together comprising at least half the total plume AOD in 82 % of plumes. Less than 1 % of plumes have median ANG values below 1.0 (generally larger particles) across the entire dataset. The partitioning of particle type and size, as well as plume AOD, varies based on both season and plume type, the latter of which is discussed in Sect. 3.1–3.4.
When stratified by season, Siberian plumes in this study were generally the darkest (i.e., they contain the highest overall AOD fractions of BlS) in meteorological spring (April and May). Spring plumes also contain the highest fractions of BrS, seen most clearly in Figs. 6 and S3 in the Supplement, although the amount is still small and varies by smoke age and plume type, with the highest values downwind of the source. Mid-visible SSA tends to increase throughout the summer months to a peak in July/August, before decreasing again through September to values similar to those seen in the spring (Table 2, Fig. 5). It follows that summer months are generally marked by comparatively lower AOD fractions of BlS and higher fractions of non-light-absorbing particles, compared to spring and fall. September plumes contain high AOD fractions of BlS, particularly near-source, but contain higher fractions of non-absorbing particles compared to spring plumes (Figs. 6, S3 in the Supplement).
Plumes observed in spring contain consistently high fractions of small particles both near-source and downwind (at least 40 % of the total AOD and always the plurality; Figs. 7, S3 in the Supplement). Contributions from very small, medium, and large particles vary inconsistently by age at this time of year, but nearly always remain below 20 % each (the exception is Grassy plumes, which contain fractions of very small particles ∼ 25 %–30 % near-source). The partitioning of small particle AOD vs. a relatively even mixture of very small, medium, and large particle AOD appears to be the driver in particle REPS at this time of year. Summer plumes, however, are by far dominated by both small and medium particles throughout all smoke ages (the exact partitioning of which is reflected in different trends in REPS between plume types) except for very near-source, where AOD fractions of very small and large particles can reach up to 20 % before falling to values approaching zero within 2–3 h. For Fall plumes, where there is sufficient sampling (in this case, all plume types except Forest), REPS increases slightly downwind (decreasing ANG; Fig. 5), as the AOD fraction of small particles decreases and is accompanied by a corresponding increase in the fraction of medium-sized particles, although the degree of this change varies by plume type (Fig. 7).
For the most part, plumes are generally optically thinnest on average in the spring compared to summer and fall, although exact month-to-month variability differs between plume types (more on this in subsequent sections). Spring plumes tend to exhibit AOD ranging from ∼ 0.75–1.1 on average near-source, depending on plume type, which either decreases slightly or remains relatively constant downwind (also depending on plume type; Fig. 5). Summer plumes have higher AOD near-source, which becomes even higher within the first hour (which may partially be a product of where we define our fire fronts); subsequently, AOD either increases, decreases, or remains relatively constant depending on fire type. Fall plumes all tend to show consistently increasing AOD with smoke age, with the caveat that there isn't sufficient sampling of Forest plumes (N=2) at this time of year to report a meaningful trend for that plume type. Fall plumes are also significantly lower than plumes observed in spring and summer, with median and maximum plume heights of ∼ 0.82 and ∼ 1.31 km a.g.l., on average (compared to ∼ 1.3 and ∼ 2.0 km a.g.l. for spring and summer).
Below, we summarize the key attributes of Siberian plumes within each land-cover type, highlighting overall characteristics and key differences, and to the extent possible, explore the factors driving them in terms of particle aging, atmospheric structure, and burning conditions. We use MINX wind speeds combined with distance from the fire source to estimate smoke age at various points downwind, allowing us to divide each smoke plume into discrete age bins at approximately 30 min intervals, where possible. (In ∼ 1 % of cases, poor retrieval quality and/or gaps in the retrieved plume area prevented us from estimating smoke age horizons.) The following four subsections examine in detail the observed smoke plume characteristics for each fire type. A synthesis and overall summary is given subsequentially in Sect. 3.5 and in Table 3. We then compare Siberian plumes to our previous findings on Canadian and Alaskan plumes from Junghenn Noyes et al. (2022) in Sect. 3.6. Unless stated otherwise, the trends and differences we discuss are statistically significant (p-values < 0.05).
3.1 Forest plumes
Sampling of Forest plumes was somewhat poor in meteorological spring (N=14), and very poor in the fall (N=2). We therefore largely exclude September data from our analysis of seasonal variability of these observations, and refrain from placing too much confidence in observations from April and May. Median plume heights in Forest plumes were centered at ∼ 1.3 km a.g.l. overall, with heights increasing from their minimum in April to a peak in June, then decreasing through September (Table S4A in the Supplement). Forest plume AOD is ∼ 1.25, on average, with higher AOD values in late summer and lower values in April, May, and June. In spring, smoke AOD remains relatively consistent with increasing age, perhaps slightly decreasing. In summer, smoke AOD increases significantly downwind (Fig. 5).
Particles in Forest plumes are very fine, with ANG ∼ 1.63 on average, and small particles dominate over medium particles across all smoke-age horizons in spring and fall (Fig. 7). In summer months, the AOD fraction of medium-sized particles becomes comparable to that of small particles after ∼ 3 h downwind, and even becomes the dominant particle size for a short period of time. This translates to only small changes in net ANG downwind (Fig. 5), however, resulting in relatively consistent REPS with smoke age across most months of the year.
Forest plumes, along with Woody plumes, are the brightest of the four plume types analyzed here, with median-plume SSA ∼ 0.94 and median-plume AOD fractions of BlS ∼ 44 %, on average. REPA decreases steadily downwind (Fig. 5), particularly so in the spring months when near-source smoke is highly absorbing (SSA 0.86–0.88) and comprised of up to 80 % BlS, whereas spring smoke ∼ 5 h and older is a mixture of BlS, BrS, non-absorbing, and non-spherical particle types and SSA reaches as high as 0.94 (Fig. 6). Fractions of BrS reach as high as ∼ 40 % of the total AOD for spring Forest smoke older than 5 h, the highest values observed in the dataset across all seasons and plume types. Summer Forest plumes also exhibit decreasing plume REPA downwind, but to a much lesser extent – near-source smoke is already comprised of roughly equal fractions of BlS and non-absorbing particles by the 1 h mark and has a higher initial SSA of ∼ 0.94, reaching to ∼ 0.96 far downwind, as non-absorbing particle fractions increasingly dominate over BlS.
3.2 Woody plumes
As with Forest plumes, median Woody plume heights are centered ∼ 1.3 km a.g.l. Unlike Forest plumes, however, Woody plume heights are at their peak in April, at the beginning of the burning season (∼ 2.9 km a.g.l.), and decrease steadily through September to ∼ 0.8 km a.g.l., on average (Table S4B in the Supplement). Woody plume AOD is statistically no different from that of Forest plumes at ∼ 1.4, and experiences the same seasonal trends when averaged across all time horizons. There are, however, differences between Forest and Woody plumes in terms of AOD trends as a function of smoke age – with spring Woody plumes experiencing decreasing AOD downwind and shorter observed plume lifetimes (Fig. 5e), and summer plumes exhibiting relatively constant, perhaps slightly increasing, smoke AOD after the initial sharp increase in the first hour or so.
Woody plume REPS and REPA are also essentially equivalent to those of Forest plumes, with ANG ∼ 1.65 and mid-visible SSA ∼ 0.93 when averaged across all seasons and time horizons (Table S4B in the Supplement). As with Forest plumes, BlS dominates over other particle types across all time horizons in the spring and fall (though REPA still decreases downwind), and in the summer is overtaken by a steadily increasing fraction of non-absorbing particle types downwind shortly after the 1 h mark. The partitioning of particle-size categories in Woody plumes is similar to that observed in Forest plumes, with small particles dominating both near-source and downwind in the spring and fall, but medium-size particles becoming competitive downwind in the summer. (However, this takes ∼ 4 h for Woody plumes, and medium particles never make up the plurality as they do at times in Forest plumes.)
3.3 Grassy plumes
Grassy plumes make up the plurality of the plume types analyzed here. Median plume heights are statistically indistinguishable from those of both Forest and Woody plumes at ∼ 1.4 km a.g.l. Plume heights increase from April to May, then decrease steadily to a minimum of ∼ 0.86 km a.g.l. in September, on average (Table S4C in the Supplement). Median-plume AOD for Grassy fires is, on average, statistically no different from that of Forest and Woody plumes at ∼ 1.4, and exhibits the same seasonal trend as Forest and Woody fires when averaged across all time horizons. Smoke AOD as a function of smoke age in Grassy plumes is similar to the trends observed in Woody fires, with spring plumes exhibiting decreasing AOD downwind (although to a lesser degree than Woody plumes), and summer plumes maintaining relatively constant AOD values downwind (Fig. 5).
Grassy plume REPS is statistically no different from REPS in Forest and Woody plumes, with ANG ∼ 1.68 on average (Table S4C in the Supplement). In April and May, REPS decreases slightly downwind (increasing ANG; Fig. 5), with plumes becoming increasingly dominated by small particles (Fig. 7). In summer months, REPS is relatively constant downwind, as the fraction of medium-particle AOD never increases significantly, much less-so than is seen in Forest and Woody plumes, and the fraction of other particle sizes is constant after the first hour or two of aging.
Grassy plumes are darker than Woody and Forest plumes, with mid-visible SSA ∼ 0.92 (p<0.05) and median-plume AOD fractions of BlS approaching 54 % on average (Table S4C in the Supplement). Plume REPA generally decreases downwind across all three seasons observed here, with smoke becoming the brightest in summer months as the AOD fraction of non-absorbing particles surpasses that of BlS after ∼ 4 h (a transition which does not occur in other seasons), much longer than it takes for summer Forest and Woody plumes (Fig. 6).
3.4 Peat plumes
Median plume heights in Peat fires are lower compared to the other three plume types at ∼ 1.1 km a.g.l. on average (Table S4D in the Supplement). There are also no clear trends in plume heights from month to month, although September plumes are significantly lower compared to the other months studied. Compared to F, W, and G plumes, median plume AOD is lowest among Peat plumes at ∼ 0.99 (when averaged across all months and plume age horizons). In summer months, when the vast majority of Peat plumes were identified, smoke AOD significantly decreases downwind (Fig. 5), which is accompanied by decreasing REPS (increasing ANG) and decreasing REPA (increasing SSA). Peat plumes are the one type identified here where fractions of non-absorbing particle types do not overtake fractions of BlS downwind during the summer months (Fig. 6), likely driving the overall low SSA values compared to other plume types. They are also the only plume type with increasing AOD fractions of small particles downwind in summer months, corresponding with fractions of medium-sized particles that are constant and much lower compared to other plume types. The reverse is true in fall – Peat plumes are the only type identified here where medium-sized particles overtake fractions of small particles downwind, resulting in a decrease in ANG that is much steeper with age compared to other plume types (Fig. 7).
3.5 Summary and inferred aging mechanisms
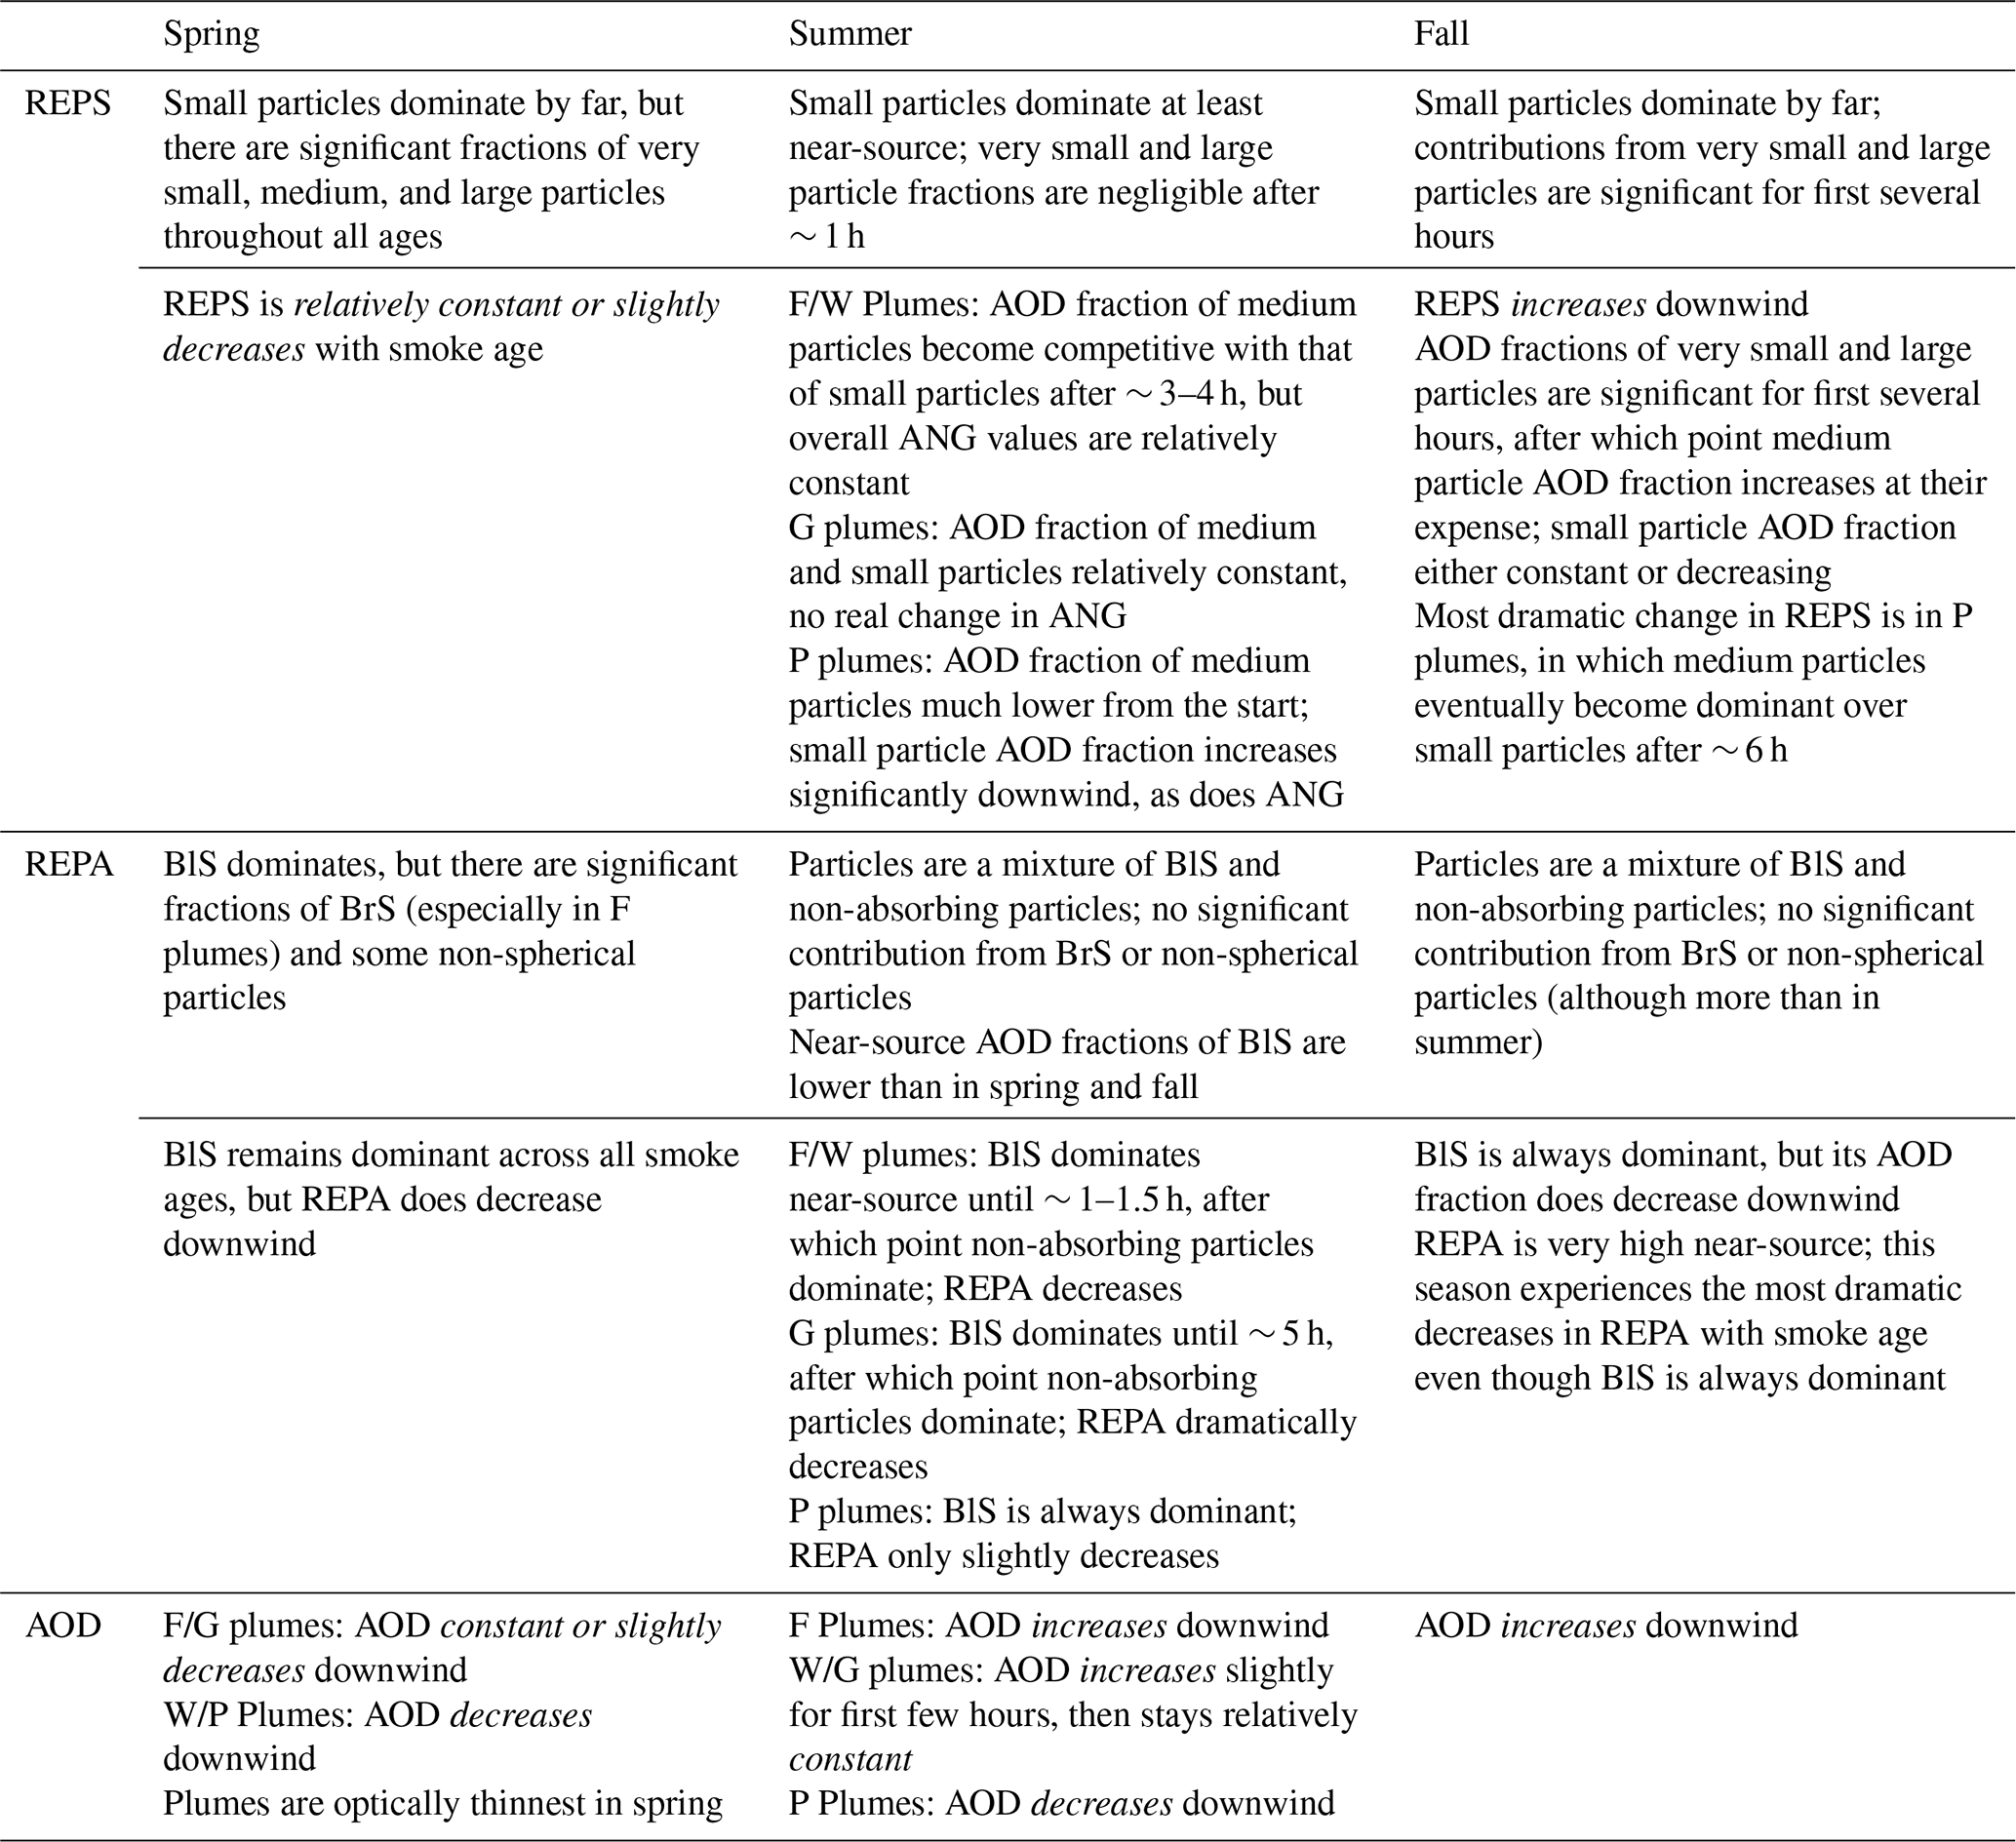
In summary, we find key similarities and differences in plume AOD, REPS, and REPA across the four plume types discussed here, with a significant seasonal component in many cases. Table 3 provides a summary of the main trends observed by season and plume type. Overall, summer plumes experience the most dramatic downwind changes in particle type, with plumes transitioning from BlS-dominated to non-absorbing-dominated. However, near-source fractions of BlS are much higher in spring and fall plumes, so summer plumes actually experience smaller decreases in plume REPA overall compared to other seasons. This suggests there may be seasonal differences in fuel properties, with spring and fall wildfires burning in areas that emit higher fractions of BlS compared to summer wildfires.
Fall plumes experience the most dramatic downwind changes in particle size, with REPS, as well as AOD, increasing as smoke ages. Together, this suggests that Fall plumes may be more subject to a combination of coagulation, hydration, and/or condensation compared to other seasons, as particles increase in size and therefore scatter more light.
Among the four plume types defined in this study, Peat plumes are the most distinct in terms of their overall particle properties and downwind evolution. Peat plumes are the optically thinnest overall (∼ 0.99), with Forest, Woody, and Grassy plumes all exhibiting similar median-plume AOD values (1.25–1.4). This is likely driven by the fact that summer P plumes experience significant decreases in AOD with smoke age, whereas W and G plume AOD remains relatively constant and F plume AOD increases with age. (Trends in smoke AOD with age do not differ much between plume types in Spring and Fall.) Peat plumes are also the only plume type that experience decreasing REPS in summer months, whereas other plume types show more constant particle size downwind. Together, these suggest that dilution with background air may be more important in particle evolution for Peat plumes compared to other plume types, at least in the summer months when we observe the highest number of Peat plumes. As cleaner background air is mixed into the plume, this can shift the equilibrium for semi-volatile compounds from the particle phase to the gas phase, resulting in stronger rates of evaporation and a particle size distribution that reflects smaller overall particles (May et al., 2013; Garofalo et al., 2019; Hodshire et al., 2019). In contrast, Forest, Woody, and Grassy plumes are likely more affected by a combination of oxidation, hydration, and/or condensation in the summer. This is evidenced by the transition from BlS-dominated smoke to non-light-absorbing-dominated smoke as plume age increases, together with the fact that AOD is constant or increasing. As particles oxidize, VOCs may condense onto their surface, which often reduces light-absorption and increases particle size. However, the fact that the overall retrieved ANG is relatively constant, despite the fluctuations MISR particle-size AOD fractions, suggests that the formation of small secondary aerosols may also be an important factor modulating REPS for these plumes.
The timescales over which the transition from BlS-dominated to non-absorbing dominated occurs varies between F, W, and G plumes in summer. Forest and Woody plumes experience the transition within the first 90 min, whereas Grassy plumes maintain a dominance of BlS until ∼ 5 h. This may mean that plumes burning in areas associated with increased tree cover experience more rapid and significant oxidation or condensation/hydration compared to plumes burning in more open, grassy biomes, at least in summer. The increasing AOD with smoke age observed in Forest plumes supports this idea, as a potential combination of secondary aerosol formation and condensational growth could act to thicken smoke downwind.
3.6 Comparison with wildfires in Canada and Alaska
In previous work, we applied the same techniques used here to study the particle properties of 663 plumes throughout Canada and Alaska, spanning from May through September across the years 2016 to 2019 (Junghenn Noyes et al., 2022). Here, we conduct a preliminary comparison of these results to Siberian plumes, with future work geared towards conducting additional in-depth comparisons as we investigate other major fire-prone regions and incorporate new datasets. The data products and processing methods described in this paper are identical to those used in the study of Canadian and Alaskan plumes, with the exception of the Hugelius et al. peatlands map, which was not applied in the previous study.
We find several distinct differences in smoke plume properties between Canada/Alaska and Siberia. In the former, the MISR particle properties are more strongly correlated with the dominant MODIS land cover type present, as we were able to stratify plumes using looser constraints and still observed statistically significant differences in many particle properties. This suggests that Canadian and Alaskan wildfire smoke properties are more dependent on fuel type than those in Siberia. For the purpose of this subsection, we re-define our Siberian wildfire plumes to match those used in our paper on Canadian and Alaskan plumes, with the addition of the Peat plume category, which was not incorporated into our previous study:
-
“Forest-like” (FL) plumes, which contain any number of MODIS hotspots located in evergreen, deciduous, or mixed forests
-
“Woody-like” (WL) plumes, which do not burn in forest but have at least 30 % of their hotspots located in woody savanna, and up to 70 % in savanna, grassland, or shrubland
-
“Grassy-like” (GL) plumes, which also do not have forest but have at least 70 % of their hotpots in savannas, grasslands, or shrublands, and no more than 30 % in woody savanna
-
“Peat” (P) plumes, defined using the same methods as in the rest of the text, as the peatland dataset extends to the entire northern Hemisphere
We compare how the observed wildfires are distributed among peatlands and the MODIS land cover types in an effort to understand how differences in particle properties between regions may be linked to differences in fuel types. Taken as an aggregate, about 15 % of the MODIS hotspots were associated with forested land cover types for both regions. However, within the remaining 85 %, Siberian plumes are heavily concentrated in grasslands/savannas, whereas Canadian/Alaskan plumes are more evenly partitioned between woody savannas and grasslands/savanna land cover types. The fraction of peat present in the observed plumes also differs between study regions – Canadian/Alaska plumes are associated with ∼ 12.3 % peat content on average, whereas Siberian plumes are associated with ∼ 7.6 % peat (Figs. S4, S6 in the Supplement). The type of peat also differs; Canadian/Alaskan plumes are associated with relatively even fractions of non-permafrost and permafrost peatlands, whereas Siberian plumes strongly favor permafrost peatlands.
Although plume REPS was essentially equivalent, Siberian plumes had generally lower plume REPA compared Canadian/Alaskan plumes, with mid-visible SSAs of ∼ 0.93 and 0.91, respectively. Although fires in both biomes contain ∼ 50 % BlS plume-wide on average, plumes in Canada/Alaska produce significantly higher fractions of BrS (6.0 % vs. 2.6 % of the total AOD) and somewhat lower fractions of non-absorbing particles (32 % vs. 35 %). This may be at least partially driven by differences in the type of vegetation burning, as discussed in the previous paragraph; peatlands tend to produce higher amounts of BrS compared to other fires, and the fraction of peatlands present was higher across all plume types in Canada/Alaska. Differences in the meteorological conditions present at the time of MISR observation may also shape fuel availability and emissions. For example, coarse, woody fuels (known for emitting higher fractions of BrS compared to finer fuels; Urbanski, 2013) must be dry enough to burn. MERRA-2 reanalysis data suggests that Siberian plumes are consistently associated with higher mean surface moisture contents compared to plumes in Canada and Alaska, and that the difference is most notable in Peat plumes (70.4 % vs. 62.2 %; differences are on the order of ∼ 3 % for other plume types). Other factors such as temperature and wind speeds may also play a role; these will be investigated in future work.
Table 3Qualitative summary of the of the key trends in Siberia in MISR mid-visible AOD, REPS, and REPA by season.
Seasonal trends in median plume heights, as retrieved by MINX, are indistinguishable between Siberia and Canada/Alaska, with the exception that the Siberian wildfire season begins a month earlier, at least over the time periods included in these studies (Fig. S5a in the Supplement). The retrieved plume height values themselves are similar between the two regions, with maximum plume heights being statistically indistinguishable. Median plume heights are greater in Siberia compared to Canada/Alaska (1.35 km a.g.l. (above ground level) vs. 1.22 km a.g.l., p<0.05); however, the regional difference is not large relative to the aggregated uncertainties in the MINX retrievals.
When averaged across all months, the height of the PBL is statistically indistinguishable across the two continents. Similarly, although exact PBLH values differed in a given month, overall monthly trends in PBLH are similar. The stability at the top of the PBL is also indistinguishable between the two regions, ∼ 5 K km−1 on average. Of the plumes observed in both studies, Siberia wildfires injected into the FT at a rate 7 % greater than that observed in Canada/Alaska. Median plume FRP is consistently lower in Siberia across all three observed seasons and across all four plume types (32.77 W m−2 vs. 47.44 W m−2, as a whole). Cumulative plume FRP (the sum of all hotspots in a given plume) is lower in Siberia across all three seasons, but the only statistically significant differences between plume types were observed in GL and P plumes (for which values in Siberia were lower). The lower overall FRP in Siberia is consistent with current knowledge on how fires burn differently in the two continents – in Canada and Alaska, crown fires are more common, which are generally more intense than the surface fires that predominate in Siberia (Kharuk et al., 2021; Rogers et al., 2015). The observed differences in FRP, the higher plume heights in Siberia, and the greater rate of FT injection in Siberia all suggest that fire intensity may not play as strong of a role in plume-rise processes in Siberia.
In meteorological spring, Siberian plumes are optically thinner compared to Canadian/Alaskan plumes (0.871 vs. 1.82 mid-visible AOD), whereas the two regions share similar AOD values in summer and fall. Furthermore, the seasonal intra-continental trend in AOD differs between the two regions; plumes within Siberia are at their optically thinnest in spring, and plumes in Canada/Alaska are at their optically thickest in spring. Future work will aim to investigate the potential driving forces behind these differences, such as differences in meteorological seasonality.
The nature of downwind particle aging also differs between the two regions. Siberian plumes experience more rapid transitions from BlS-dominated to non-absorbing-dominated plumes. Furthermore, unlike in Canadian and Alaskan plumes, medium particles never truly dominate over small particles as smoke ages in Siberia.
As has been mentioned, further work is needed to tease out some of the driving forces behind the observed differences in smoke plume properties between Siberia and Canada/Alaska. Although both regions are major boreal zones, it is well-known that different tree species dominate in each continent (Rogers et al., 2015), that the regional meteorology is also different, and therefore that the response to fires is likely to be different as well. Further investigation is certainly warranted. However, we note that the current study represents the first large-scale regional comparison of wildfires between the world's only two large, vegetated boreal zones, which together emit an average of 9.1 % of global fire emissions (van der Werf et al., 2010).
This work, focused on Siberia, represents the second instalment in an ongoing effort to characterize wildfire smoke particles and smoke-plume evolution for the major burning regions across the globe. We apply known relationships between particle chemistry/microphysics and the optical signatures retrieved by MISR to create a regional inventory of particle size (four qualitative size bins ranging from very small to large; Table 1) and particle type (black smoke vs. brown smoke vs. soil/dust vs. non-light-absorbing particles), as well as the inferred particle aging mechanisms present (e.g., dilution, oxidation, hydration, etc.) and the modulating forces behind these. The multi-angle nature of MISR observations allows us to derive plume-age horizons that provide us with the timescales over which critical particle type and size transitions occur under different conditions, representing new territory in wildfire smoke aerosol remote-sensing science and regional-scale statistical characterization.
Specifically, we find distinct patterns in smoke plume properties when the data are partitioned into four categories based on the relative fractions of forests (F plumes), woody savanna (W plumes), and savannas/grasslands (G plumes) present from the MODIS IGBP land cover type dataset, and peat (P plumes) present from a dataset provided by Hugelius et al. (2021). We find P plumes to be the most distinct of the four plume types, containing the smallest, darkest particles, and having the lowest plume AOD and lowest median plume heights. Forest and Woody plumes are the overall brightest plume types, whereas Grassy plumes exhibit REPA between that of F/W and P plumes. We observed no statistically significant differences in plume AOD, median plume height, or REPS between F, W, and G plumes in Siberia.
We also find distinct seasonal differences in the retrieved particle properties, with plumes observed in spring (April and May) containing the highest overall AOD fractions of both BlS and BrS as well as the smallest particles, compared to other seasons. Spring plumes also exhibit the lowest overall plume AOD compared to summer and fall months. Plumes burning in spring and fall are associated with higher fractions of light-absorbing particles near the source, and therefore experience larger swings in REPA compared to plumes observed in summer, although they maintain their BlS-dominance throughout their observed lifetimes. In contrast, summer plumes experience a transition from BlS-dominated to non-light-absorbing-dominated. We also observe that the timescales over which particle type transitions occur differ significantly between the four plume types in summer, with non-light-absorbing particles becoming dominant over BlS in less than 2 h in F and W plumes and ∼ 6 h in G plumes, but never in P plumes. Similarly, the fraction of medium particles increases downwind to be nearly equal to or slightly dominant over that of small particles after ∼ 3 h in F plumes, increases but never quite equals the small-particle AOD fractions in W plumes, and barely changes at all in G plumes. In P plumes, the AOD fraction of small particles increases downwind at the expense of other particle size categories, and plume AOD decreases. However, P plumes are the only plume type with ANG values that reflect a meaningfully changing particle size distribution. Based on these trends, we infer that the plume types experience varying types and degrees of atmospheric aging. Namely, we infer that:
-
P plumes experience less oxidation and/or condensation/hydration compared to F, W, and G plumes, evidenced by the persistently higher overall absorbing aerosol fraction retrieved by MISR
-
Dilution/evaporation may play a larger role in particle size evolution for P plumes, supported by decreasing particle sizes downwind combined with reduced AOD downwind
-
Seasonal differences in fuel properties and meteorology might account for emission differences, as spring and fall plumes contain much higher fractions of BlS near-source compared to summer plumes
Our previous work on Canadian and Alaskan wildfires allowed us to create a regional inventory of particle type and evolution that was stratified by MODIS land cover type. In the current study, we have expanded upon those methods with the incorporation of peatlands extent, a greatly expanded sample size, and the analysis of seasonal differences in particle properties. We compare observations between the two regions and find that, overall, Siberian plumes are associated with lower FRP, less light-absorption, and lower fractions of BrS. Such differences in particle properties are likely because fires in Siberia burned in areas associated with comparatively lower fractions of peatlands and woody savannas, instead favoring grasslands. Particle-type transitions are also more rapid in Siberia compared to Canada/Alaska. Lastly, although particle properties were associated with land cover type in both continents, this relationship was much stronger in Canadian/Alaskan plumes.
Future work will involve applying the MISR RA and associated tools to plumes in other major fire-prone regions, such as the western United States, Australia, and the Amazon. As we expand our repertoire, more in-depth comparisons among regions will become possible. The incorporation of new or unique datasets, such as fuel modelling, will allow us to gain new insights into the relationships between particle properties and fire properties. Such large-scale, statistical observational constraints on smoke particle type, evolutionary mechanisms, and the timescales over which they occur represent new territory that can greatly benefit climate and air quality modeling efforts.
The MISR Research Aerosol (RA) algorithm is a proprietary product. MINX is available for public use and can be downloaded at https://github.com/nasa/MINX (Val and Nelson, 2025). The RA and MINX results for individual plumes are archived online and available for download at https://doi.org/10.5281/zenodo.17127395 (Junghenn Noyes and Kahn, 2025).
The supplement related to this article is available online at https://doi.org/10.5194/acp-25-13879-2025-supplement.
The project was first conceptualized by RK, and the development and design of the methodology were a collaboration between RK and KJN. The RA algorithm used in this project was developed by RK.. KJN developed the tools used to process, analyze, and visualize all data presented here. Formal analysis of the results was conducted by KJN and RK, who together wrote and edited the original draft.
The contact author has declared that neither of the authors has any competing interests.
Publisher's note: Copernicus Publications remains neutral with regard to jurisdictional claims made in the text, published maps, institutional affiliations, or any other geographical representation in this paper. While Copernicus Publications makes every effort to include appropriate place names, the final responsibility lies with the authors. Also, please note that this paper has not received English language copy-editing. Views expressed in the text are those of the authors and do not necessarily reflect the views of the publisher.
The authors would like to thank James A. Limbacher for his role in the development and maintenance of the RA algorithm.
The work of Katherine T. Junghenn Noyes is supported by NASA's Atmospheric Composition Modeling and Analysis Program (ACMAP) under Richard Eckman. Ralph A. Kahn is supported by ACMAP and the NASA EOS Terra and MISR Projects.
This paper was edited by Stephanie Fiedler and reviewed by three anonymous referees.
Ahern, A. T., Robinson, E. S., Tkacik, D. S., Saleh, R., Hatch, L. E., Barsanti, K. C., Stockwell, C. E., Yokelson, R. J., Presto, A. A., Robinson, A. L., Sullivan, R. C., and Donahue, N. M.: Production of secondary organic aerosol during aging of biomass burning smoke from fresh fuels and its relationship to VOC precursors, J. Geophys. Res.-Atmos., 124, 3583–3606, https://doi.org/10.1029/2018JD029068, 2019.
Akagi, S. K., Craven, J. S., Taylor, J. W., McMeeking, G. R., Yokelson, R. J., Burling, I. R., Urbanski, S. P., Wold, C. E., Seinfeld, J. H., Coe, H., Alvarado, M. J., and Weise, D. R.: Evolution of trace gases and particles emitted by a chaparral fire in California, Atmos. Chem. Phys., 12, 1397–1421, https://doi.org/10.5194/acp-12-1397-2012, 2012.
Albrecht, B. A.: Aerosols, Cloud Microphysics, and Fractional Cloudiness, Science, 245, 1227–1230, https://doi.org/10.1126/science.245.4923.1227, 1989.
Andreae, M. O. and Gelencsér, A.: Black carbon or brown carbon? The nature of light-absorbing carbonaceous aerosols, Atmos. Chem. Phys., 6, 3131–3148, https://doi.org/10.5194/acp-6-3131-2006, 2006.
Bond, T. C., Doherty, S. J., Fahey, D. W., Forster, P. M., Berntsen, T., DeAngelo, B. J., Flanner, M. G., Ghan, S., Kaercher, B., Koch, D., Kinne, S., Kondo, Y., Quinn, P. K., Sarofim, M. C., Schultz, M. G., Schulz, M., Venkataraman, C., Zhang, H., Zhang, S., Bellouin, N., Guttikunda, S. K., Hopke, S. K., Jacobson, M. Z., Kaiser, J. W., Klimont, Z., Lohmann, U., Schwarz, J. P., Shindell, D., Storelvmo, T., Warren, S. G., and Zender, C. S.: Bounding the role of black carbon in the climate system: A scientific assessment, J. Geophys. Res.-Atmos., 118, 5380–5552, https://doi.org/10.1002/jgrd.50171, 2013.
Bosilovich, M., Lucchesi, R., and Suarez, M. MERRA-2: File specification, https://gmao.gsfc.nasa.gov/pubs/docs/Bosilovich785.pdf (last access: 20 March 2021), 2016.
Bowman, D. M. J. S., Balch, J. K., Artaxo, P., Bond, W. J., Carlson, J. M., Cochrane, M. A., D'Antonio, C. M., Defries, R. S., Doyle, J. C., Harrison, S. P., Johnston, F. H., Keeley, J. E., Krawchuk, M. A., Kull, C. A. Marston, J. B., Moritz, M. A., Prentice, I. C., Roos, C. I., Scott, A. C., Swetnam, T. W., van der Werf, G. R., and Pyne, S. J.: Fire in the Earth system, Science, 324, 481–484, https://doi.org/10.1126/science.1163886, 2009.
Chakrabarty, R. K., Moosmüller, H., Chen, L.-W. A., Lewis, K., Arnott, W. P., Mazzoleni, C., Dubey, M. K., Wold, C. E., Hao, W. M., and Kreidenweis, S. M.: Brown carbon in tar balls from smoldering biomass combustion, Atmos. Chem. Phys., 10, 6363–6370, https://doi.org/10.5194/acp-10-6363-2010, 2010.
Chakrabarty, R. K., Gyawali, M., Yatavelli, R. L. N., Pandey, A., Watts, A. C., Knue, J., Chen, L.-W. A., Pattison, R. R., Tsibart, A., Samburova, V., and Moosmüller, H.: Brown carbon aerosols from burning of boreal peatlands: microphysical properties, emission factors, and implications for direct radiative forcing, Atmos. Chem. Phys., 16, 3033–3040, https://doi.org/10.5194/acp-16-3033-2016, 2016.
Chen, W.-T., Kahn, R. A., Nelson, D., Yau, K., and Seinfeld, J. H.: Sensitivity of Multiangle Imaging to the Optical and Microphysical Properties of Biomass Burning Aerosols, J. Geophys. Res., 113, D10203, https://doi.org/10.1029/2007JD009414, 2008.
Colarco, P. R., Schoeberl, M. R., Doddridge, B. G., Marufu, L. T., Torres, O., and Welton, E. J.: Transport of Smoke from Canadian Forest Fires to the Surface near Washington, D.C.: Injection Height, Entrainment, and Optical Properties, J. Geophys. Res., 109, https://doi.org/10.1029/2003JD004248, 2004.
Damoah, R., Spichtinger, N., Forster, C., James, P., Mattis, I., Wandinger, U., Beirle, S., Wagner, T., and Stohl, A.: Around the world in 17 days - hemispheric-scale transport of forest fire smoke from Russia in May 2003, Atmos. Chem. Phys., 4, 1311–1321, https://doi.org/10.5194/acp-4-1311-2004, 2004.
de Groot, W. J., Cantin, A. S., Flannigan, M. D., Soja, A. J., Gowman, L. M., and Newbery, A.: A comparison of Canadian and Russian boreal forest fire regimes, Forest Ecol. Manag., 294, 23–34, https://doi.org/10.1016/j.foreco.2012.07.033, 2013.
Diner, D. J., Beckert, J. C., Reilly, T. H., Bruegge, C. J., Conel, J. E., Kahn, R. A., Martonchik, J. V., Ackerman, T. P., Davies, R., Gerstl, S. A. W., Gordon, H. R., Muller, J.-P., Myneni, R. B., Sellars, P. J., Pinty, B., and Verstraete, M. M.: Multi-Angle Imaging SpectroRadiometer (MISR) Instrument Description and Experiment Overview, IEEE Trans., 36, 1072–1087, https://doi.org/10.1109/36.700992, 1998.
Dubovik, O., Holben, B., Eck, T. F., Smirnov, A., Kaufman, Y. J., King, M. D., Tanre, D., and Slutsker, I.: Variability of Absorption and Optical Properties of Key Aerosol Types Observed in Worldwide Locations, J. Atmos. Sci., 59, 19, https://doi.org/10.1175/1520-0469(2002)059<0590:VOAAOP>2.0.CO;2, 2002.
Eck, T. F., Holben, B. N., Reid, J. S., O'Neill, N. T., Schafer, J. S., Dubovik, O., Smirnov, A., Yamasoe, M. A., and Artaxo, P.: High Aerosol Optical Depth Biomass Burning Events: A Comparison of Optical Properties for Different Source Regions, Geophys. Res. Lett., 30, https://doi.org/10.1029/2003GL017861, 2003.
Elser, H., Frankland, T. B., Chen, C., Tartof, S. Y., Mayeda, E. R., Lee, G. S., Northrop, A. J., Torres, J. M., Benmarhnia, T., and Casey, J. A.: Wildfire Smoke Exposure and Incident Dementia, JAMA Neurol, https://doi.org/10.1001/jamaneurol.2024.4058, 2024.
Feng, Y., Ramanathan, V., and Kotamarthi, V. R.: Brown carbon: a significant atmospheric absorber of solar radiation?, Atmos. Chem. Phys., 13, 8607–8621, https://doi.org/10.5194/acp-13-8607-2013, 2013.
Flower, V. J. B. and Kahn, R. A.: Assessing the Altitude and Dispersion of Volcanic Plumes Using MISR Multi-Angle Imaging from Space: Sixteen Years of Volcanic Activity in the Kamchatka Peninsula, Russia, J. Volcanal. Geoth. Res., 337, 1–15, https://doi.org/10.1016/j.jvolgeores.2017.03.010, 2017a.
Flower, V. J. B. and Kahn, R. A.: Distinguishing Remobilized Ash From Erupted Volcanic Plumes Using Space-Borne Multiangle Imaging: Remobilized Ash Plumes, Geophys. Res. Lett., 44, 10772–10779, https://doi.org/10.1002/2017GL074740, 2017b.
Flower, V. J. B. and Kahn, R. A.: Karymsky volcano eruptive plume properties based on MISR multi-angle imagery and the volcanological implications, Atmos. Chem. Phys., 18, 3903–3918, https://doi.org/10.5194/acp-18-3903-2018, 2018.
Flower, V. J. B. and Kahn, R. A.: Interpreting the Volcanological Processes of Kamchatka, Based on Multi-Sensor Satellite Observations, Remote Sens. Environ., 237, 111585, https://doi.org/10.1016/j.rse.2019.111585, 2020a.
Flower, V. J. B. and Kahn, R. A.: The evolution of Icelandic volcano emissions, as observed from space in the era of NASA's Earth Observing System (EOS), J. Geophys. Res. Atmos., 125, e2019JD031625, https://doi.org/10.1029/2019JD031625, 2020b.
Friedl, M. and Sulla-Menashe, D.: MCD12Q1 MODIS/Terra+Aqua Land Cover Type Yearly L3 Global 500m SIN Grid V006, NASA EOSDIS Land Processes DAAC [data set], https://doi.org/10.5067/MODIS/MCD12Q1.006, 2019.
Garofalo, L. A., Pothier, M. A., Levin, E. J. T., Campos, T., Kreidenweis, S. M., and Farme, D. K.: Emission and Evolution of Submicron Organic Aerosol in Smoke from Wildfires in the Western United States, ACS Earth Space Chem., 3, 1237–1247, https://doi.org/10.1021/acsearthspacechem.9b00125, 2019.
Gelaro, R., McCarty, W., Suárez, M. J., Todling, R., Molod, A., Takacs, L., Randles, C. A., Darmenov, A., Bosilovich, M. G., Reichle, R., Wargan, K., Coy, L., Cullather, R., Draper, C., Akella, S., Buchard, V., Conaty, A., da Silva, A. M., Gu, W., Kim, G.-K., Koster, R., Lucchessi, R., Merkova, D., Nielsen, J. E., Partyka, G., Pawson, S., Putman, W., Rienecker, M., Schubert, S. D., Sienkiewicz, M., and Zhao, B.: The Modern-Era Retrospective Analysis for Research and Applications, Version 2 (MERRA-2), J. Climate, 30, 5419–5454, https://doi.org/10.1175/JCLI-D-16-0758.1, 2017.
Giglio, L. and Justice, C.: MOD14 MODIS/Terra Thermal Anomalies/Fire 5-Min L2 Swath 1km V006, NASA EOSDIS Land Processes DAAC [data set], https://doi.org/10.5067/MODIS/MOD14.006, 2015.
Giglio, L., Descloitres, J., Justice, C. O., and Kaufman, Y. J.: An enhanced contextual fire detection algorithm for MODIS, Remote Sens. Environ., 87, 273–282, https://doi.org/10.1016/S0034-4257(03)00184-6, 2003.
Global Modeling and Assimilation Office: MERRA-2 inst6_3d_ana_Np: 3d,6-Hourly,Instantaneous,Pressure-Level,Analysis,Analyzed Meteorological Fields V5.12.4, Greenbelt, MD, USA, Goddard Earth Sciences Data and Information Services Center (GES DISC) [data set], https://doi.org/10.5067/A7S6XP56VZWS, 2015a.
Global Modeling and Assimilation Office: MERRA-2 tavg1_2d_flx_Nx: 2d,1-Hourly,Time-Averaged,Single-Level,Assimilation,Surface Flux Diagnostics V5.12.4, Greenbelt, MD, USA, Goddard Earth Sciences Data and Information Services Center (GES DISC) [data set], https://doi.org/10.5067/7MCPBJ41Y0K6, 2015b.
Hansen, J., Sato, M., and Ruedy, R.: Radiative forcing and climate response, J. Geophys. Res., 102, https://doi.org/10.1029/96JD03436, 1997.
Hennigan, C. J., Westervelt, D. M., Riipinen, I., Engelhart, G. J., Lee, T., Collett, J. L., Pandis, S. N., Adams, P. J., and Robinson, A. L.: New particle formation and growth in biomass burning plumes: An important source of cloud condensation nuclei, Geophys. Res. Lett., 39, L09805, https://doi.org/10.1029/2012GL050930, 2012.
Hobbs, P. V. and Radke, L. F.: Cloud Condensation Nuclei from a Simulated Forest Fire, Science, 163, 279–280, https://doi.org/10.1126/science.163.3864.279, 1969.
Hodshire, A. L., Bian, Q., Ramnarine, E., Lonsdale, C. R., Alvarado, M. J., Kreidenweis, S. M., Jathar, S. H., and Pierce, J. R.: More than emissions and chemistry: Fire size, dilution, and background aerosol also greatly influence near-field biomass burning aerosol aging, J. Geophys. Res. Atmos., 124, 5589–5611, https://doi.org/10.1029/2018JD029674, 2019.
Holton, J. R.: An Introduction to Dynamic Meteorology, Elsevier, New York, ISBN 0-12-354015-1, 1992.
Hugelius, G., Loisel, J., Chadburn, S., Jackson, R. B., Jones, M., MacDonald, G., Marushchak, M., Olefeldt, D., Packalen, M., Siewert, M. B., Treat, C., Turetsky, M., Voigt, C., and Yu, Z.: Large stocks of peatland carbon and nitrogen are vulnerable to permafrost thaw, Proc. Natl. Acad. Sci, https://doi.org/10.1073/pnas.1916387117, 2020.
Hugelius, G., Loisel, J., Chadburn, S., Jackson, R. B., Jones, M., MacDonald, G., Marushchak, M., Olefeldt, D., Packalen, M., Siewert, M. B., Treat, C., Turetsky, M., Voigt C., and Yu, Z.: Maps of northern peatland extent, depth, carbon storage and nitrogen storage, Version 2, Bolin Centre Database [data set], https://doi.org/10.17043/hugelius-2020-peatland-2, 2021.
IPCC: Climate Change 2021: The Physical Science Basis. Contribution of Working Group I to the Sixth Assessment Report of the Intergovernmental Panel on Climate Change, edited by: Masson-Delmotte, V., Zhai, P., Pirani, A., Connors, S. L., Péan, C., Berger, S., Caud, N., Chen, Y., Goldfarb, L., Gomis, M. I., Huang, M., Leitzell, K., Lonnoy, E., Matthews, J. B. R., Maycock, T. K., Waterfield, T., Yelekçi, O., Yu, R., and Zhou, B., Cambridge University Press, Cambridge, United Kingdom and New York, NY, USA, 2391 pp., https://doi.org/10.1017/9781009157896, 2021.
Junghenn Noyes, K. T. and Kahn, R. A.: Satellite Multi-angle Observations of Wildfire Smoke Plumes during the CalFiDE Field campaign: Aerosol Plume Heights, Particle Property Evolution, and Aging Timescales. J. Geophys. Res. 129, e2023JD039041, https://doi.org/10.1029/2023JD039041, 2024.
Junghenn Noyes, K. and Kahn, R.: Siberian wildfire smoke observations from space-based multi-angle imaging: A multi-year regional analysis of smoke particle properties, their evolution, and comparisons with North American boreal fire plumes, Zenodo [data set], https://doi.org/10.5281/zenodo.17127395, 2025.
Junghenn Noyes, K., Kahn, R., Sedlacek, A., Kleinman, L., Limbacher, J., and Li, Z.: Wildfire Smoke Particle Properties and Evolution, from Space-Based Multi-Angle Imaging. Remote Sens., 12, 769, https://doi.org/10.3390/rs12050769, 2020a.
Junghenn Noyes, K. T., Kahn, R. A., Limbacher, J. A., Li, Z., Fenn, M. A., Giles, D. M., Hair, J. W., Katich, J. M., Moore, R. H., Robinson, C. E., Sanchez, K. J., Shingler, T. J., Thornhill, K. L., Wiggins, E. B., and Winstead, E. L.: Wildfire Smoke Particle Properties and Evolution, From Space-Based Multi-Angle Imaging II: The Williams Flats Fire during the FIREX-AQ Campaign, Remote Sens., 12, 3823, https://doi.org/10.3390/rs12223823, 2020b.
Junghenn Noyes, K. T., Kahn, R. A., Limbacher, J. A., and Li, Z.: Canadian and Alaskan wildfire smoke particle properties, their evolution, and controlling factors, from satellite observations, Atmos. Chem. Phys., 22, 10267–10290, https://doi.org/10.5194/acp-22-10267-2022, 2022.
Kahn, R. A. and Gaitley, B. J.: An Analysis of Global Aerosol Type as Retrieved by MISR: MISR Aerosol Type, J. Geophys. Res. Atmos., 120, 4248–4281, https://doi.org/10.1002/2015JD023322, 2015.
Kahn, R. A. and Limbacher, J.: Eyjafjallajökull volcano plume particle-type characterization from space-based multi-angle imaging, Atmos. Chem. Phys., 12, 9459–9477, https://doi.org/10.5194/acp-12-9459-2012, 2012.
Kahn, R. A. and Limbacher, J. A.: Particle-Microphyscial-Property Evolution in a North African Dust Plume During Trans-Atlantic Transport, J. Geophys. Res. Atmos., 30, e2025JD043779, https://doi.org/10.1029/2025JD043779, 2025.
Kahn, R. A., Banerjee, P., and McDonald, D.: Sensitivity of multiangle imaging to natural mixtures of aerosols over ocean, J. Geophys. Res., 106, 18219–18238, https://doi.org/10.1029/2000JD900497, 2001.
Kahn, R. A., Li, W.-H., Moroney, C., Diner, D. J., Martonchik, J. V., and Fishbein, E.: Aerosol source plume physical characteristics from space-based multiangle imaging, J. Geophys. Res., 112, D11205, https://doi.org/10.1029/2006JD007647, 2007.
Kahn, R. A., Chen, Y., Nelson, D. L., Leung, F.-Y., Li, Q., Diner, D. J., and Logan, J. A.: Wildfire Smoke Injection Heights: Two Perspectives from Space, Geophys. Res. Lett., 35, L04809, https://doi.org/10.1029/2007GL032165, 2008.
Kahn, R. A., Gaitley, B. J., Garay, M. J., Diner, D. J., Eck, T., Smirnov, A., and Holben, B. N.: Multiangle Imaging SpectroRadiometer global aerosol product assessment by comparison with the Aerosol Robotic Network, J. Geophys. Res., 115, D23209, https://doi.org/10.1029/2010JD014601, 2010.
Kahn, R. A., Limbacher, J. A., Junghenn Noyes, K. T., Flower, V. J. B., and McKee, K.: Evolving Particles in the 2022 Hunga-Tonga Hunga-Ha'apai Volcano Eruption Plume, J. Geophys. Res., 129, e2023JD039041, https://doi.org/10.1029/2023JD039041, 2024.
Kaufman, Y. J. and Fraser, R. S.: The Effect of Smoke Particles on Clouds and Climate Forcing, Science, 277, 1636–1639, https://doi.org/10.1126/science.277.5332.1636, 1997.
Kharuk, V. I., Ponomarev, E. I., Ivanova, G. A., Dvinskaya, M. L., Coogan, S. C. P., and Flannigan, M. D.: Wildfires in the Siberian taiga, Ambio, 50, 1953–1974, https://doi.org/10.1007/s13280-020-01490-x, 2021.
Kirchstetter, T. W., Novakov, T., and Hobbs, P. V.: Evidence that the spectral dependence of light absorption by aerosols is affected by organic carbon, J. Geophys. Res. Atmos., 109, D21208, https://doi.org/10.1029/2004JD004999, 2004.
Kleinman, L. I., Sedlacek III, A. J., Adachi, K., Buseck, P. R., Collier, S., Dubey, M. K., Hodshire, A. L., Lewis, E., Onasch, T. B., Pierce, J. R., Shilling, J., Springston, S. R., Wang, J., Zhang, Q., Zhou, S., and Yokelson, R. J.: Rapid evolution of aerosol particles and their optical properties downwind of wildfires in the western US, Atmos. Chem. Phys., 20, 13319–13341, https://doi.org/10.5194/acp-20-13319-2020, 2020.
Koch, D. and Del Genio, A. D.: Black carbon semi-direct effects on cloud cover: review and synthesis, Atmos. Chem. Phys., 10, 7685–7696, https://doi.org/10.5194/acp-10-7685-2010, 2010.
Kukavskaya, E. A., Soja, A. J., Petkov, A. P., Ponomarev, E. I., Ivanova, G. A., and Conard, S. G.: Fire emissions estimates in Siberia: evaluation of uncertainties in area burned, land cover, and fuel consumption, Canadian Journal of Forest Research, 43, 493–506, https://doi.org/10.1139/cjfr-2012-0367, 2013.
Lavoué, D., Liousse, C., Cachier, H., Stocks, B. J., and Goldammer, J. G.: Modeling of carbonaceous particles emitted by boreal and temperate wildfires at northern latitudes, J. Geophys. Res., 105, 26871–26890, https://doi.org/10.1029/2000JD900180, 2000.
Limbacher, J. A. and Kahn, R. A.: MISR research-aerosol-algorithm refinements for dark water retrievals, Atmos. Meas. Tech., 7, 3989–4007, https://doi.org/10.5194/amt-7-3989-2014, 2014.
Limbacher, J. A. and Kahn, R. A.: Updated MISR over-water research aerosol retrieval algorithm – Part 2: A multi-angle aerosol retrieval algorithm for shallow, turbid, oligotrophic, and eutrophic waters, Atmos. Meas. Tech., 12, 675–689, https://doi.org/10.5194/amt-12-675-2019, 2019.
Limbacher, J. A., Kahn, R. A., and Lee, J.: The new MISR research aerosol retrieval algorithm: a multi-angle, multi-spectral, bounded-variable least squares retrieval of aerosol particle properties over both land and water, Atmos. Meas. Tech., 15, 6865–6887, https://doi.org/10.5194/amt-15-6865-2022, 2022.
Liu, Y., Goodrick, S., and Heilman, W.: Wildland fire emissions, carbon, and climate: Wildfire–climate interactions, Forest Ecol. Manag., 317, 80–96, https://doi.org/10.1016/j.foreco.2013.02.020, 2014.
May, A. A., Levin, E. J. T., Hennigan, C. J., Riipinen, I., Lee, T., Collett, J. L., Jimenez, J. L., Kreidenweis, S. M., and Robinson, A. L.: Gas-particle partitioning of primary organic aerosol emissions: 3. Biomass burning, J. Geophys. Res. Atmos., 118, 11327–11338, https://doi.org/10.1002/jgrd.50828, 2013.
Naeher, L. P., Brauer, M., Lipsett, M., Zelikoff, J. T., Simpson, C. D., Koenig, J. Q., and Smith, K. R.: Woodsmoke health effects: a review, Inhal. Toxicol., 19, 67–106, https://doi.org/10.1080/08958370600985875, 2007.
Nelson, D., Garay, M., Kahn, R., and Dunst, B.: Stereoscopic Height and Wind Retrievals for Aerosol Plumes with the MISR INteractive EXplorer (MINX), Remote Sens., 5, 4593–4628, https://doi.org/10.3390/rs5094593, 2013.
Nelson, D., Val, S., Kahn, R., Koeberlein, E., Tosca, M., Diner, D., and Lawshe, C.: “MISR Plume Height Project 2”, MISR, NASA Jet Propulsion Laboratory, https://misr.jpl.nasa.gov/getData/accessData/MisrMinxPlumes2/ (last access: 10 November 2023), 2023.
Nelson, D. L., Chen, Y., Kahn, R. A., Diner, D. J., and Mazzoni, D.: Example Applications of the MISR INteractive EXplorer (MINX) Software Tool to Wildfire Smoke Plume Analyses, Remote Sens. Fire Sci. Appl., 708909, https://doi.org/10.1117/12.795087, 2008.
O'Neill, N. T., Eck, T. F., Holben, B. N., Smirnov, A., Royer, A., and Li, Z.: Optical properties of boreal forest fire smoke derived from Sun photometry, J. Geophys. Res. Atmos., 107, https://doi.org/10.1029/2001JD000877, 2002.
O'Neill, N. T., Ranjbar, K., Ivănescu, L., Blanchard, Y., Sayedain, S. A., and AboEl-Fetouh, Y.: Remote-sensing detectability of airborne Arctic dust, Atmos. Chem. Phys., 25, 27–44, https://doi.org/10.5194/acp-25-27-2025, 2025.
Petrenko, M., Kahn, R., Chin, M., Soja, A., Kucsera, T., and Harshvardhan: The Use of Satellite-Measured Aerosol Optical Depth to Constrain Biomass Burning Emissions Source Strength in the Global Model GOCART, J. Geophys. Res., 117, https://doi.org/10.1029/2012JD017870, 2012.
Reid, C. E., Brauer, M., Johnston, F. H., Jerrett, M., Balmes, J. R., and Elliot, C. T.: Critical Review of Health Impacts of Wildfire Smoke Exposure, Environ. Health Persp., 124, 9, 1334–13343, https://doi.org/10.1289/ehp.1409277, 2016.
Reid, J. S. and Hobbs, P. V.: Physical and optical properties of young smoke from individual biomass fires in Brazil, J. Geophys. Res., 103, https://doi.org/10.1029/98JD00159, 1998.
Reid, J. S., Koppmann, R., Eck, T. F., and Eleuterio, D. P.: A review of biomass burning emissions part II: intensive physical properties of biomass burning particles, Atmos. Chem. Phys., 5, 799–825, https://doi.org/10.5194/acp-5-799-2005, 2005.
Rogers, B., Soja, A., Goulden, M. L., and Randerson, J. T.: Influence of tree species on continental differences in boreal fires and climate feedbacks, Nat. Geosci., 8, 228–234, https://doi.org/10.1038/ngeo2352, 2015.
Samset, B. H., Stjern, C. W., Andrews, E., Kahn, R. A., Myhre, G., Schulz, M., and Schuster, G. L.: Aerosol Absorption: Progress Towards Global and Regional Constraints, Curr. Clim. Chang. Rep., 4, 65–83, https://doi.org/10.1007/s40641-018-0091-4, 2018.
Scollo, S., Kahn, R. A., Nelson, D. L., Coltelli, M., Diner, D. J., Garay, M. J., and Realmuto, V. J.: MISR Observations of Etna Volcanic Plumes, J. Geophys. Res., 117, https://doi.org/10.1029/2011JD016625, 2012.
Shi, S., Cheng, T., Gu, X., Guo, H., Wu, Y., and Wang, Y.: Biomass Burning Aerosol Characteristics for Different Vegetation Types in Different Aging Periods, Environ. Int., 126, 504–511, https://doi.org/10.1016/j.envint.2019.02.073, 2019.
Soja, A. J., Cofer, W. R., Shugart, H. H., Sukhinin, A. I., Stackhouse Jr., P. W., McRae, D. J., and Conard, S. G.: Estimating fire emissions and disparities in boreal Siberia (1998–2002), J. Geophys. Res., 109, D14S06, https://doi.org/10.1029/2004JD004570, 2004.
Taubman, B. F., Marufu, L. T., Vant-Hull, B. L., Piety, C. A., Doddridge, B. G., Dickerson, R. R., and Li, Z.: Smoke over haze: Aircraft observations of chemical and optical properties and the effects on heating rates and stability, J. Geophys. Res., 109, D02206, https://doi.org/10.1029/2003JD003898, 2004.
Tosca, M. G., Randerson, J. T., Zender, C. S., Nelson, D. L., Diner, D. J., and Logan, J. A.: Dynamics of Fire Plumes and Smoke Clouds Associated with Peat and Deforestation Fires in Indonesia, J. Geophys. Res., 116, D08207, https://doi.org/10.1029/2010JD015148, 2011.
Turetsky, M., Benscoter, B., Page, S., Rein, G., van der Werf, G. R., and Watts, A.: Global vulnerability of peatlands to fire and carbon loss, Nature Geosci., 8, 11–14, https://doi.org/10.1038/ngeo2325, 2015.
Urbanski, S. P.: Combustion efficiency and emission factors for wildfire-season fires in mixed conifer forests of the northern Rocky Mountains, US, Atmos. Chem. Phys., 13, 7241–7262, https://doi.org/10.5194/acp-13-7241-2013, 2013.
Val, S. and Nelson, D.: MINX V4.1, GitHub [code], https://github.com/nasa/MINX (last access: 9 August 2025), 2025.
Val Martin, M., Logan, J. A., Kahn, R. A., Leung, F.-Y., Nelson, D. L., and Diner, D. J.: Smoke injection heights from fires in North America: analysis of 5 years of satellite observations, Atmos. Chem. Phys., 10, 1491–1510, https://doi.org/10.5194/acp-10-1491-2010, 2010.
Val Martin, M., Kahn, R. A., Logan, J. A., Paugam, R., Wooster, M., and Ichoku, C: Space-based observations constraints for 1-D plume-rise models, J. Geophys. Res., 117, D22204, https://doi.org/10.1029/2012JD018370, 2012.
Val Martin, M., Kahn, R., and Tosca, M.: A Global Analysis of Wildfire Smoke Injection Heights Derived from Space-Based Multi-Angle Imaging, Remote Sens., 10, 1609, https://doi.org/10.3390/rs10101609, 2018.
van der Werf, G. R., Randerson, J. T., Giglio, L., Collatz, G. J., Mu, M., Kasibhatla, P. S., Morton, D. C., DeFries, R. S., Jin, Y., and van Leeuwen, T. T.: Global fire emissions and the contribution of deforestation, savanna, forest, agricultural, and peat fires (1997–2009), Atmos. Chem. Phys., 10, 11707–11735, https://doi.org/10.5194/acp-10-11707-2010, 2010.
Vant-Hull, B., Li, Z., Taubman, B. F., Levy, R., Marufu, L., Chang, F.-L., Doddridge, B. G., and Dickerson, R. R.: Smoke over haze: Comparative analysis of satellite, surface radiometer, and airborne in situ measurements of aerosol optical properties and radiative forcing over the eastern United States, J. Geophys. Res., 110, D10S21, https://doi.org/10.1029/2004JD004518, 2005.
Vernon, C. J., Bolt, R., Canty, T., and Kahn, R. A.: The impact of MISR-derived injection height initialization on wildfire and volcanic plume dispersion in the HYSPLIT model, Atmos. Meas. Tech., 11, 6289–6307, https://doi.org/10.5194/amt-11-6289-2018, 2018.
Wang, Z. B., Hu, M., Yue, D. L., He, L. Y., Huang, X. F., Yang, Q., Zheng, J., Zhang, R. Y., and Zhang, Y. H.: New particle formation in the presence of a strong biomass burning episode at a downwind rural site in PRD, China, Tellus B, 65, 19965, https://doi.org/10.3402/tellusb.v65i0.19965, 2013.
Warner, J. and Twomey, S.: The Production of Cloud Nuclei by Cane Fires and the Effect on Cloud Droplet Concentration, J. Atmos. Sci., 24, 704–706, https://doi.org/10.1175/1520-0469(1967)024<0704:TPOCNB>2.0.CO;2, 1967.
Wiggins, E. B., Andrews, A., Sweeney, C., Miller, J. B., Miller, C. E., Veraverbeke, S., Commane, R., Wofsy, S., Henderson, J. M., and Randerson, J. T.: Boreal forest fire CO and CH4 emission factors derived from tower observations in Alaska during the extreme fire season of 2015, Atmos. Chem. Phys., 21, 8557–8574, https://doi.org/10.5194/acp-21-8557-2021, 2021.
Yokelson, R. J., Crounse, J. D., DeCarlo, P. F., Karl, T., Urbanski, S., Atlas, E., Campos, T., Shinozuka, Y., Kapustin, V., Clarke, A. D., Weinheimer, A., Knapp, D. J., Montzka, D. D., Holloway, J., Weibring, P., Flocke, F., Zheng, W., Toohey, D., Wennberg, P. O., Wiedinmyer, C., Mauldin, L., Fried, A., Richter, D., Walega, J., Jimenez, J. L., Adachi, K., Buseck, P. R., Hall, S. R., and Shetter, R.: Emissions from biomass burning in the Yucatan, Atmos. Chem. Phys., 9, 5785–5812, https://doi.org/10.5194/acp-9-5785-2009, 2009.
Yu, Y., Kalashnikova, O. V., Garay, M. J., Lee, H., and Notaro, M.: Identification and Characterization of Dust Source Regions Across North Africa and the Middle East Using MISR Satellite Observations, Geophys. Res. Lett., 45, 6690–6701, https://doi.org/10.1029/2018GL078324, 2018.
Zhou, S., Collier, S., Jaffe, D. A., Briggs, N. L., Hee, J., Sedlacek III, A. J., Kleinman, L., Onasch, T. B., and Zhang, Q.: Regional influence of wildfires on aerosol chemistry in the western US and insights into atmospheric aging of biomass burning organic aerosol, Atmos. Chem. Phys., 17, 2477–2493, https://doi.org/10.5194/acp-17-2477-2017, 2017.