the Creative Commons Attribution 4.0 License.
the Creative Commons Attribution 4.0 License.
Measurement Report: Changes in ammonia emissions since the 18th century in south-eastern Europe inferred from an Elbrus (Caucasus, Russia) ice-core record
Michel Legrand
Daria Bokuchava
Stanislav Kutuzov
Andreas Plach
Andreas Stohl
Alexandra Khairedinova
Vladimir Mikhalenko
Maria Vinogradova
Sabine Eckhardt
Susanne Preunkert
Atmospheric ammonia (NH3) is a key transboundary air pollutant that contributes to the impacts of nitrogen and acidity on terrestrial ecosystems. Ammonia also contributes to the atmospheric aerosol that affects air quality. Emission inventories indicate that NH3 was predominantly emitted by agriculture over the 19th and 20th centuries but, up to now, these estimates have not been compared to long-term observations. To document past atmospheric NH3 pollution in south-eastern Europe, ammonium (NH) was analysed along an ice core extracted from Mount Elbrus in the Caucasus, Russia. The NH ice-core record indicates a 3.5-fold increase in concentrations between 1750 and 1990 CE. Remaining moderate prior to 1950 CE, the increase then accelerated to reach a maximum in 1989 CE. Comparison between ice-core trends and estimated past emissions using state-of-the-art atmospheric transport modelling of submicron-scale aerosols (FLEXPART (FLEXible PARTicle dispersion) model) indicates good agreement with the course of estimated NH3 emissions from south-eastern Europe since ∼ 1750 CE, with the main contributions from south European Russia, Türkiye, Georgia, and Ukraine. Examination of ice deposited prior to 1850 CE, when agricultural activities remained limited, suggests an NH ice concentration related to natural soil emissions representing ∼ 20 % of the 1980–2009 CE NH level, a level mainly related to current agricultural emissions that almost completely outweigh biogenic emissions from natural soil. These findings on historical NH3 emission trends represent a significant contribution to the understanding of ammonia emissions in Europe over the last 250 years.
- Article
(10204 KB) - Full-text XML
-
Supplement
(901 KB) - BibTeX
- EndNote


Gaseous ammonia (NH3) is the most abundant alkaline gas in the atmosphere and represents a major component of total reactive nitrogen. It plays an important role in determining the overall acidity (alkalinity) of precipitation. A large portion of atmospheric aerosols, acting as cloud condensation nuclei, consists of sulfate neutralized to various extents by NH3. Ammonia and ammonium (collectively abbreviated as NHx) are key nutrients that fertilize plants. Overly large inputs of N to the environment may, however, lead to eutrophication of terrestrial and aquatic ecosystems and thus threaten the biodiversity (Asman et al., 1998; Galloway et al., 2003). Therefore, the growing NH3 emissions resulting from fertilization applied to meet the need to sustain food production for a growing human population impact the environment. Consequently, it is important to have a clear understanding of the NH3 sources. Natural sources include wildfires, especially at high northern latitudes; natural soil; and the ocean, whereas anthropogenic emissions are dominated by agriculture, including animal husbandry and NH3-derived fertilizer application (Galloway et al., 2004). The temporal change in anthropogenic emissions needs to be accurately documented since increasing temperature resulting from climate change may amplify the NH3 emissions from the soil to the atmosphere (Skjøth and Geels, 2013; Sutton et al., 2013), counteracting the expected benefits from emission control measures (Simpson et al., 2014). The uncertainties in natural/biogenic emissions over continents are much larger than those associated with anthropogenic sources, partly due to the complexity and variability in natural ecosystems. Furthermore, the NH3 present in seawater mainly comes from the biological decomposition of organic matter by bacteria (Johnson et al., 2007); however, there is still an ongoing debate regarding the significance of this natural source in the global atmospheric budget (Paulot et al., 2015).
Past ammonium (NH) aerosol concentration trends extracted from ice cores contain key information on past growth of anthropogenic NH3 emissions, as well as the partitioning between natural and anthropogenic emissions at regional scales. Such studies remain scarce, and up to now only two studies have compared ammonium trends extracted from Alpine ice cores to atmospheric chemistry–transport models (Engardt et al., 2017; Fagerli et al., 2007), with the aim of constraining past ammonia emissions in western Europe over the 20th century. The short lifetime of atmospheric aerosols (days to weeks) and the regional character of ammonia emissions, however, have motivated further studies in other regions, extending back to the 19th century when agricultural activities started to be significant.
Here we present a seasonally resolved ice-core record of NH deposition extracted from a 182 m long ice core drilled in 2009 CE at Mount Elbrus in the Caucasus. Our main goals were to assess the magnitude of natural NH3 sources in south-eastern Europe and the importance of anthropogenic emissions since ∼ 1750 CE. This was accomplished by comparing the ice-core records to estimated past anthropogenic NH3 emissions, using state-of-the-art FLEXPART (FLEXible PARTicle dispersion model) atmospheric transport and deposition simulations of aerosol.
2.1 Ice-core dating and analyses
A deep ice core was drilled to bedrock (182.6 m) in 2009 CE on the western plateau of Mount Elbrus (ELB, 43° N, 42° E; 5115 m a.s.l., metres above sea level) in the Caucasus (Russia). The upper 168.6 m (131.5 m w.e, metres water equivalent) of the ice core was first dated by annual-layer counting using pronounced seasonal variations in ammonium and succinate concentrations, both exhibiting well-marked winter minima (Mikhalenko et al., 2015; Preunkert et al., 2019). The annual counting was found to be very accurate (±1 year) over the last hundred years when anchored to the stratigraphy of the 1912 CE Katmai horizon located at 116.7 m (87.7 m w.e.) in depth (Mikhalenko et al., 2015). As a result of glacier ice flow, the annual ice layer thickness decreases with depth, also rendering the dating increasingly uncertain with depth. Although dating uncertainties prior to 1912 CE were not quantified in these two previous studies, an age of 1774 CE was assigned to the 168.6 m layer (Preunkert et al., 2019); the ice layer corresponding to the large eruption of Tambora (1815 CE), however, was not identified. Based on complementary data that includes the acidity, the dating was recently revisited by Mikhalenko et al. (2024), suggesting the presence of the 1815 CE Tambora horizon at either 153.7 or 154.7 m in depth and an age of 1752 CE ±4 years at 168.6 m in depth. This more accurate dating was used in this study, as the uncertainty around 1815 CE was 4 years. Note that as discussed in Sect. 5.1, the ammonium concentration increase remained limited between 1750 and 1850 CE compared to the post-1950 CE period, implying that the dating uncertainty in the bottom part of the record does not significantly modify discussions about the main changes that have occurred over the 2 most recent centuries.
Ice cores were subsampled and decontaminated at −15 °C using an electric plane tool, as detailed in Preunkert and Legrand (2013). In brief, ice samples were first cut with a band saw, and all surfaces of the cut samples were decontaminated by removing ∼ 3 mm with a pre-cleaned electric plane tool under a clean-air bench. Due to the glacier ice flow, annual-layer thickness decreases from 1.5 m w.e. near the surface to 0.18 m w.e. at 157 m (i.e. 122 m w.e.) in depth. As detailed in Preunkert et al. (2019), a total of 3724 subsamples were obtained along the upper 168.6 m of the core, and to minimize the loss of temporal resolution with depth, the sample depth resolution was decreased from 10 cm at the top to 5 cm at 70 m (47 m w.e.) and 2 cm at 157 m (121.8 m w.e.) in depth and below. With that, we still sampled 10–12 samples on average per year at 157 m in depth (compared to 25–30 samples per year near the surface), rendering identification of winter layers possible down to 168.6 m in depth.
Chemical measurements were done with a Dionex ICS-1000 chromatograph equipped with a CS12 separator column for cations (Na+, K+, Mg2+, Ca2+, and NH) and a Dionex 600 equipped with an AS11 separator column for anions (Cl−, NO, and SO) and light carboxylates. Detailed working conditions are given in Legrand et al. (2013). For all ions investigated, blanks in the ice decontamination procedure were found to be insignificant with respect to the levels found in the ice cores. The detection limit for ammonium was close to 1 ng g−1, thus remaining well below mean (low) winter concentrations that typically ranged from 10 to 20 ng g−1.
2.2 FLEXPART model simulations
The NH trends in ELB ice will be examined with respect to estimates of past anthropogenic NH3 emissions from south-eastern Europe. Present in the gas phase, NH3 is rapidly converted into submicron-scale aerosol, preferentially reacting with H2SO4 to produce stable ammonium salts ((NH4)2SO4 and/or NH4HSO4) rather than with HNO3 to produce semi-volatile NH4NO3. Having longer atmospheric lifetimes than NH3 (owing to removal by precipitation in a few days to a week instead of less than 1 d for NH3), ammonium salts are transported further and deposited at larger distances from the source regions (Van Pul et al., 2009).
Ideally, comparing observed NH ice concentrations (or deposition fluxes) with past NH3 emissions would require simulations made with a chemistry–transport model that accounts for the conversion of gaseous NH3 into NH aerosol and for the transport/deposition of NHx from countries located around the drill site. The increase in acidity following the growth of SO2 and NO2 emissions in western Europe was shown to increase the formation of NH aerosol, permitting transport of NHx over longer distances and inducing non-linearity between NH3 emissions in source regions and NH deposition over the Alps (Fagerli et al., 2007). The situation in the Caucasus is even more complex due to a large increase in dust emissions over recent decades (Kutuzov et al., 2019; Preunkert et al., 2019) that may have counterbalanced the effect of growing SO2 and NO2 on the NHx partitioning (see discussions in Sect. 5.1). Finally, most chemistry–transport models dealing with past NH3 emissions did not consider the effect of climate fluctuations on the volatility of NH3 emitted from the soil.
A fully coupled chemistry–transport model, with accurate pH calculations that consider changes in SO2 and NO2, as well as dust and the potential impact of climatic conditions on the volatility of NH3, is presently not available. We here used a simpler approach that only accounts for the effects of atmospheric transport and deposition of submicron-scale sulfate aerosol without considering the NHx partitioning (assuming that a large fraction of NH3 is rapidly converted into submicron-scale NH aerosol). To do that, we used backward simulations of the state-of-the-art Lagrangian particle dispersion model FLEXPART (FLEXible PARTicle dispersion model; Eckhardt et al., 2017) that determine the sensitivity of deposition at the ELB site to submicron-scale aerosol emissions in Europe. The model was run at monthly intervals for the years 1980–2019 CE, and particles were traced backward from the observation site for 30 d. Simulations were done with the recent ERA-5 reanalysis at a resolution of 0.5° × 0.5° (137 vertical layers, of which 41 are located below 5000 m a.s.l.; Hersbach et al., 2020), with the ELB grid point located at a model elevation of 2400 m. Since the model topography at the ELB location is substantially lower than the real altitude of the ELB site, deposition fluxes simulated by FLEXPART are somewhat ambiguous. We chose to simulate deposition at the model surface at the ELB location, as well as by accounting for wet deposition only above the real height of ELB, i.e. removing all simulated deposition below the real ELB altitude. Figure 1 shows averaged emission sensitivities for the ELB site, representing a source–receptor relationship that maps the sensitivity of deposition at the site (receptor) to an emission flux (source).
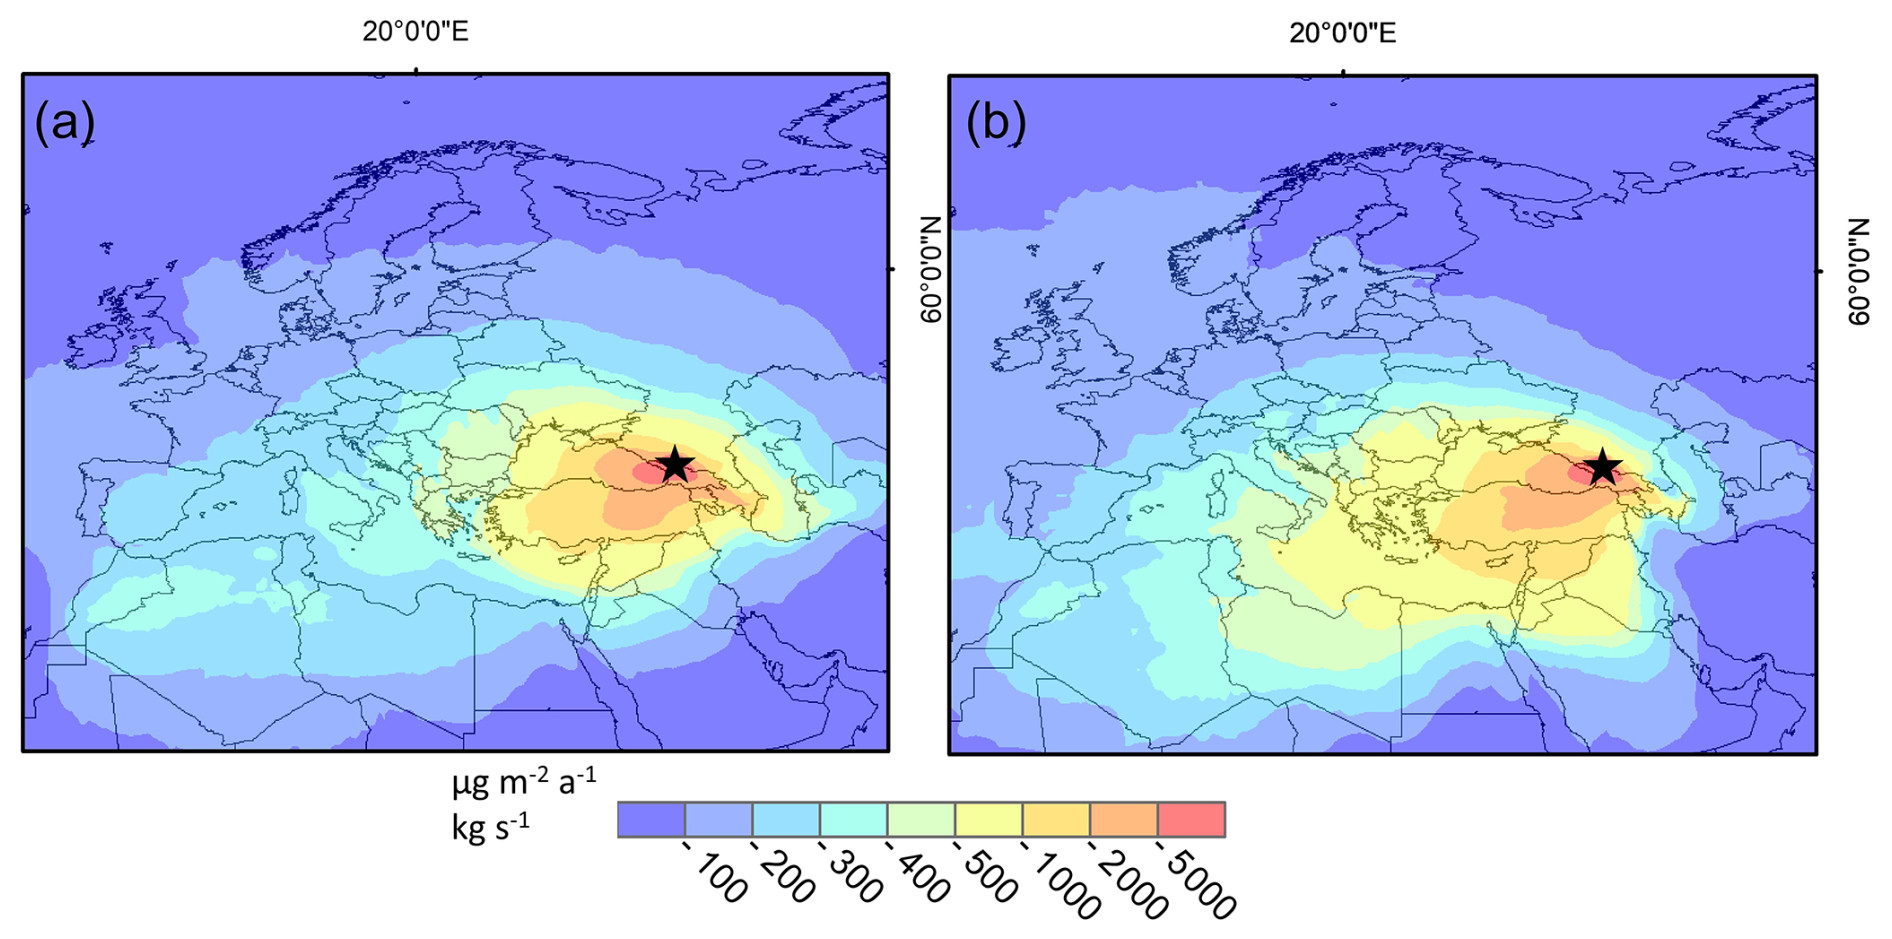
Figure 1Emissions sensitivities at the ELB ice-core site (black star) based on FLEXPART model simulations of sulfate aerosol transport and deposition for summer (a) and winter (b) (real elevation).
Past NH deposition fluxes at the ELB site were calculated by weighting past NH3 emissions from each grid cell in the inventory by its emission sensitivity and then summing over all grid cells to obtain the simulated deposition rate. Calculations were conducted with the CDO (climate data operator) software. We used the global dataset of anthropogenic NH3 emissions (Hoesly et al., 2018), in which data are presented in the Network Common Data Form (NetCDF) format and have a 0.5° × 0.5° spatial resolution. Hoesly et al. (2018) provided anthropogenic emissions from the Community Emissions Data System (CEDS) for the years 1750 to 2014 CE, with a monthly time resolution, and data are divided into eight sectors: the transportation, energy, international shipping, industrial, agriculture, waste, solvent production and application, and residential sectors. Figure 2 illustrates the change in annual gridded ammonia emissions in Europe from 1880 to 2005 CE.
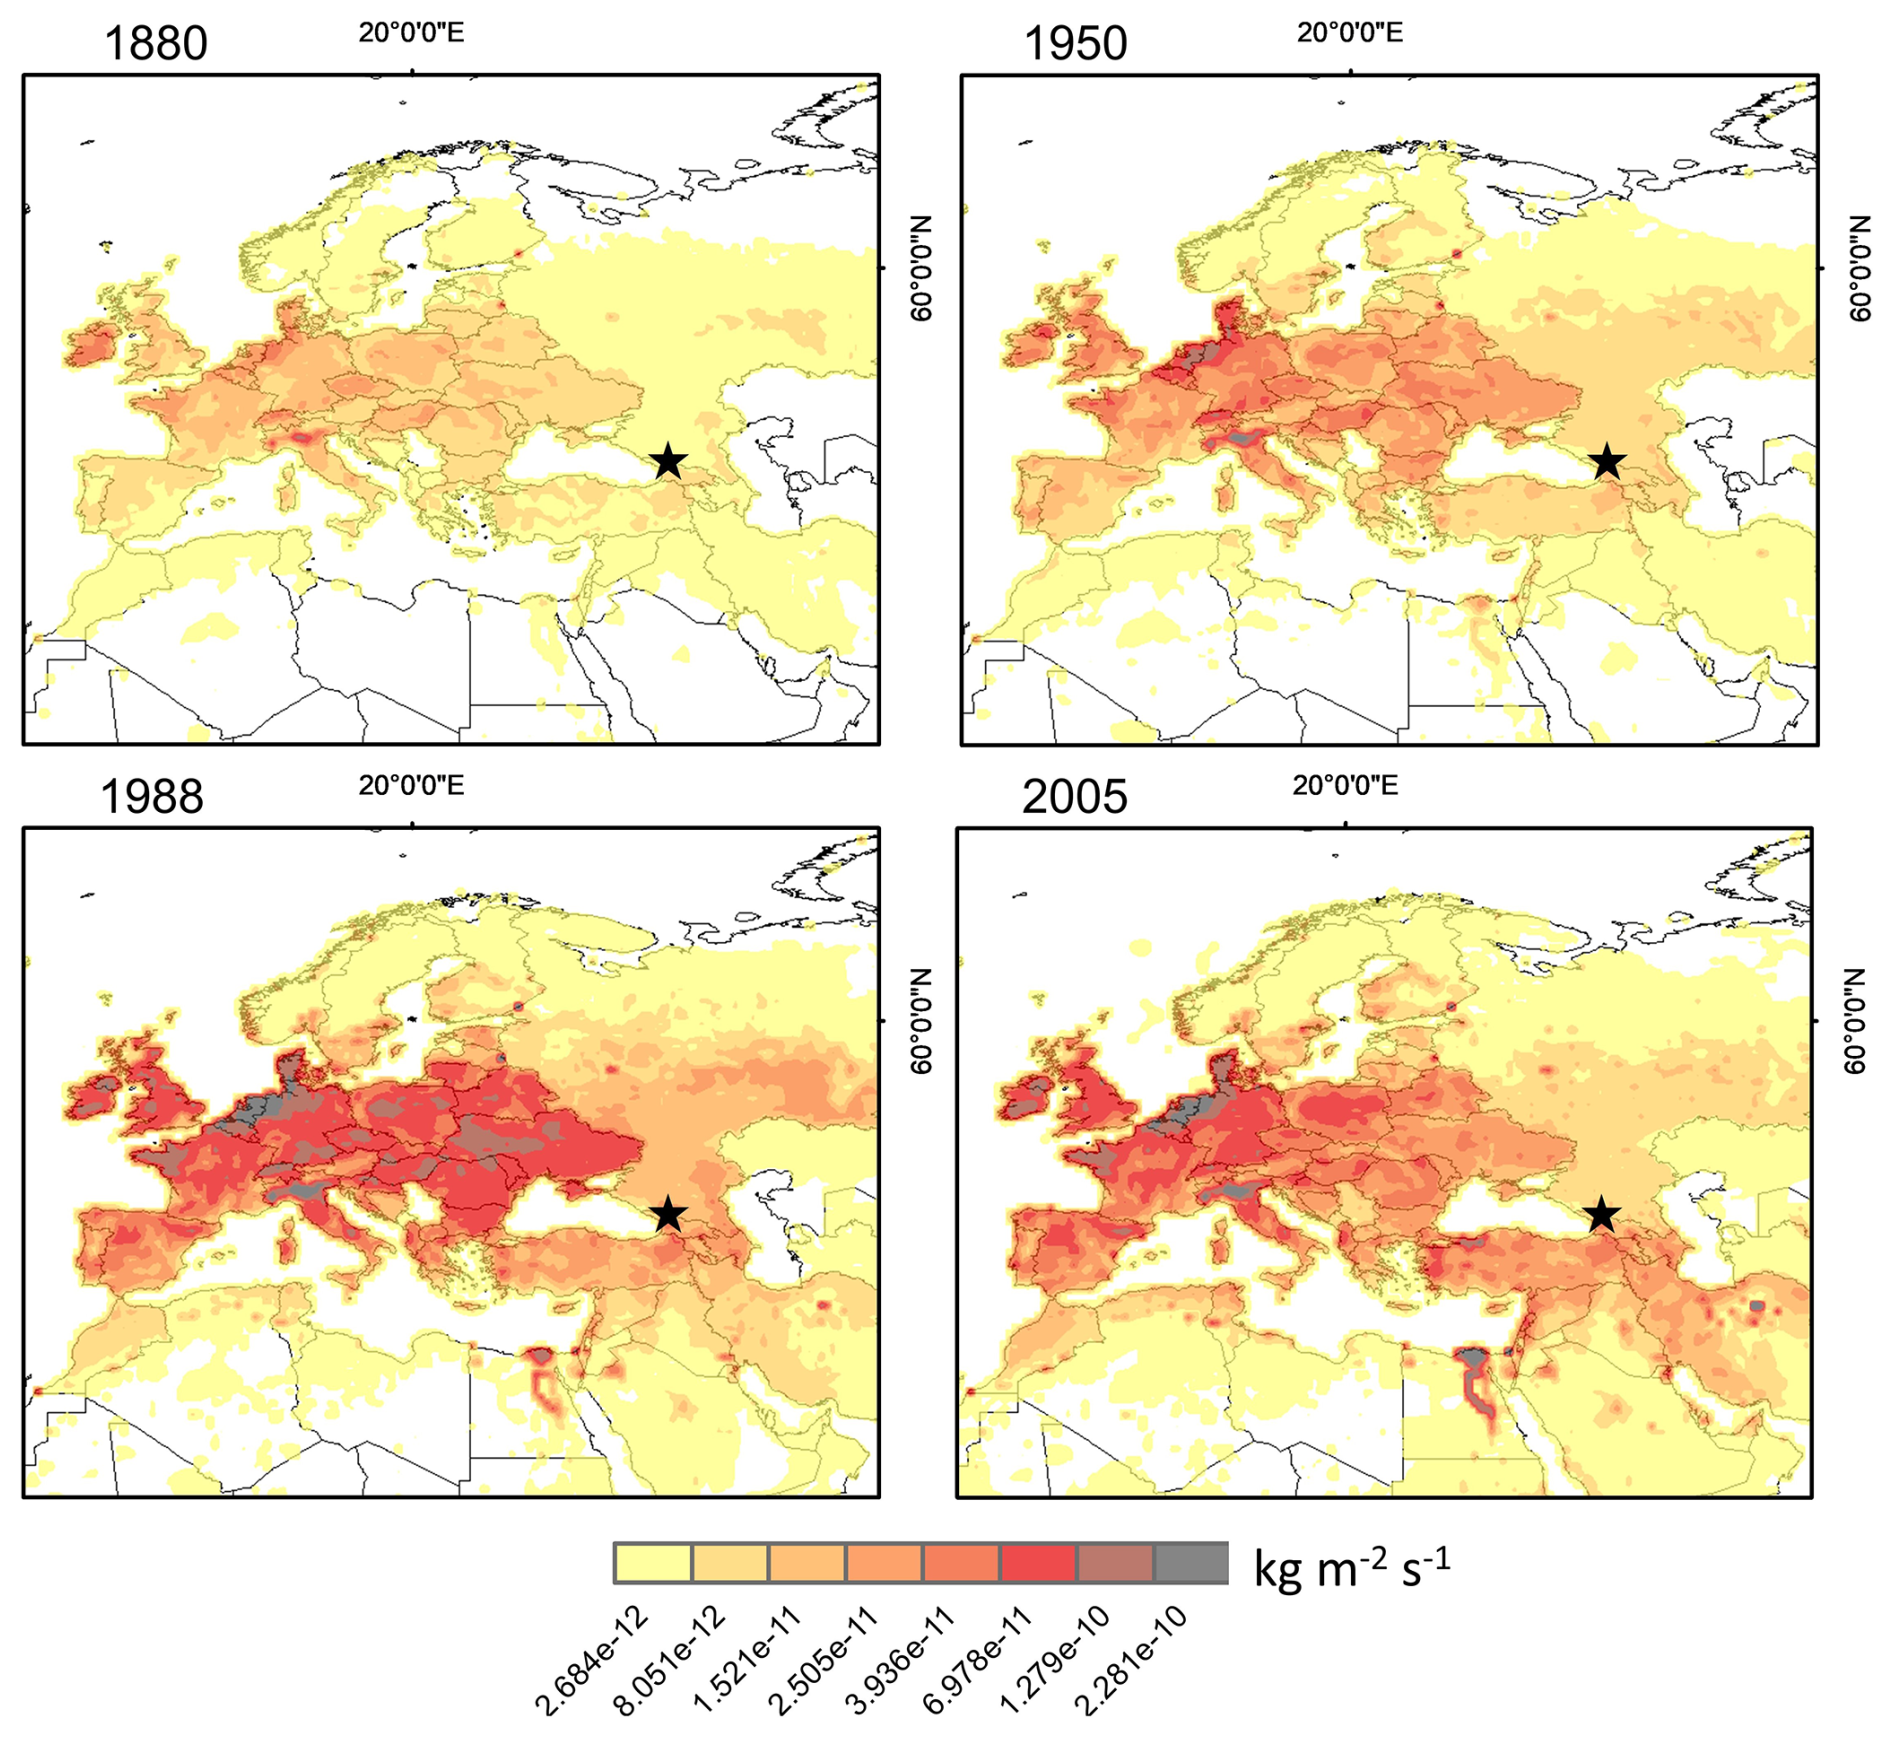
Figure 2Gridded anthropogenic ammonia emissions (0.5° × 0.5°; Hoesly et al., 2018, https://github.com/JGCRI/CEDS/, last access: 29 March 2024) in western and south-eastern Europe in 1880 CE, 1950 CE, 1988 CE, and 2005 CE.
The validity of the approach that compares NH ice-core trends with estimates of past NH3 emissions using the FLEXPART model for dispersion of submicron-scale aerosol will be discussed in Sect. 5. However, important assumptions are that the atmospheric transport has not changed systematically over the course of the ice-core record and that the climatological emission sensitivity values obtained for the period of 1980–2019 CE can thus be applied to the full ice-core record. While this assumption may not be fully valid, it is likely that changes in the atmospheric transport climatology had a much smaller effect on simulated deposition at the ELB site than the changes in emissions over the same period. The emission sensitivities reported in Fig. S1 in the Supplement indicate that at least over the 1980–2019 CE time period, their temporal variability remained low and had no significant impact on the simulations. Finally, to evaluate the bias due to the non-consideration of NH3 loss, FLEXPART simulations were also done and compared to ELB observations for the deposition of sulfate using past SO2 anthropogenic emissions (Sect. 6).
Using the winter ammonium/succinate minima, we determined half-year summer and winter means from 1748 to 2009 CE (Fig. 3). Despite a more pronounced loss of resolution in winter layers (12 samples per winter near the surface and 1–2 samples per winter at 157 m in depth), the seasonal dissection was still possible down to 168.6 m in depth (Sect. 2.1), but some of the winter ammonium/succinate minima used to define a winter layer were too thin to reliably determine winter NH concentrations in that part of the core. Of the 262 winters (1748–2009 CE), 21 winters were missing along the lowest 20 m (i.e. prior to ∼ 1850 CE) of the core. In Fig. 3, we also report annual concentrations calculated as the arithmetic mean of winter and summer. When the winter half-year value was missing, we averaged the values of the preceding and the following winters to calculate the arithmetic annual value. In order to minimize the effect of the interannual variability in meteorological conditions on the ice record, as it is generally observed at mountain sites (Fagerli et al., 2007), we smoothed the ice-core records (the first component of the single-spectrum analysis with a 5-year time window; Fig. 3).
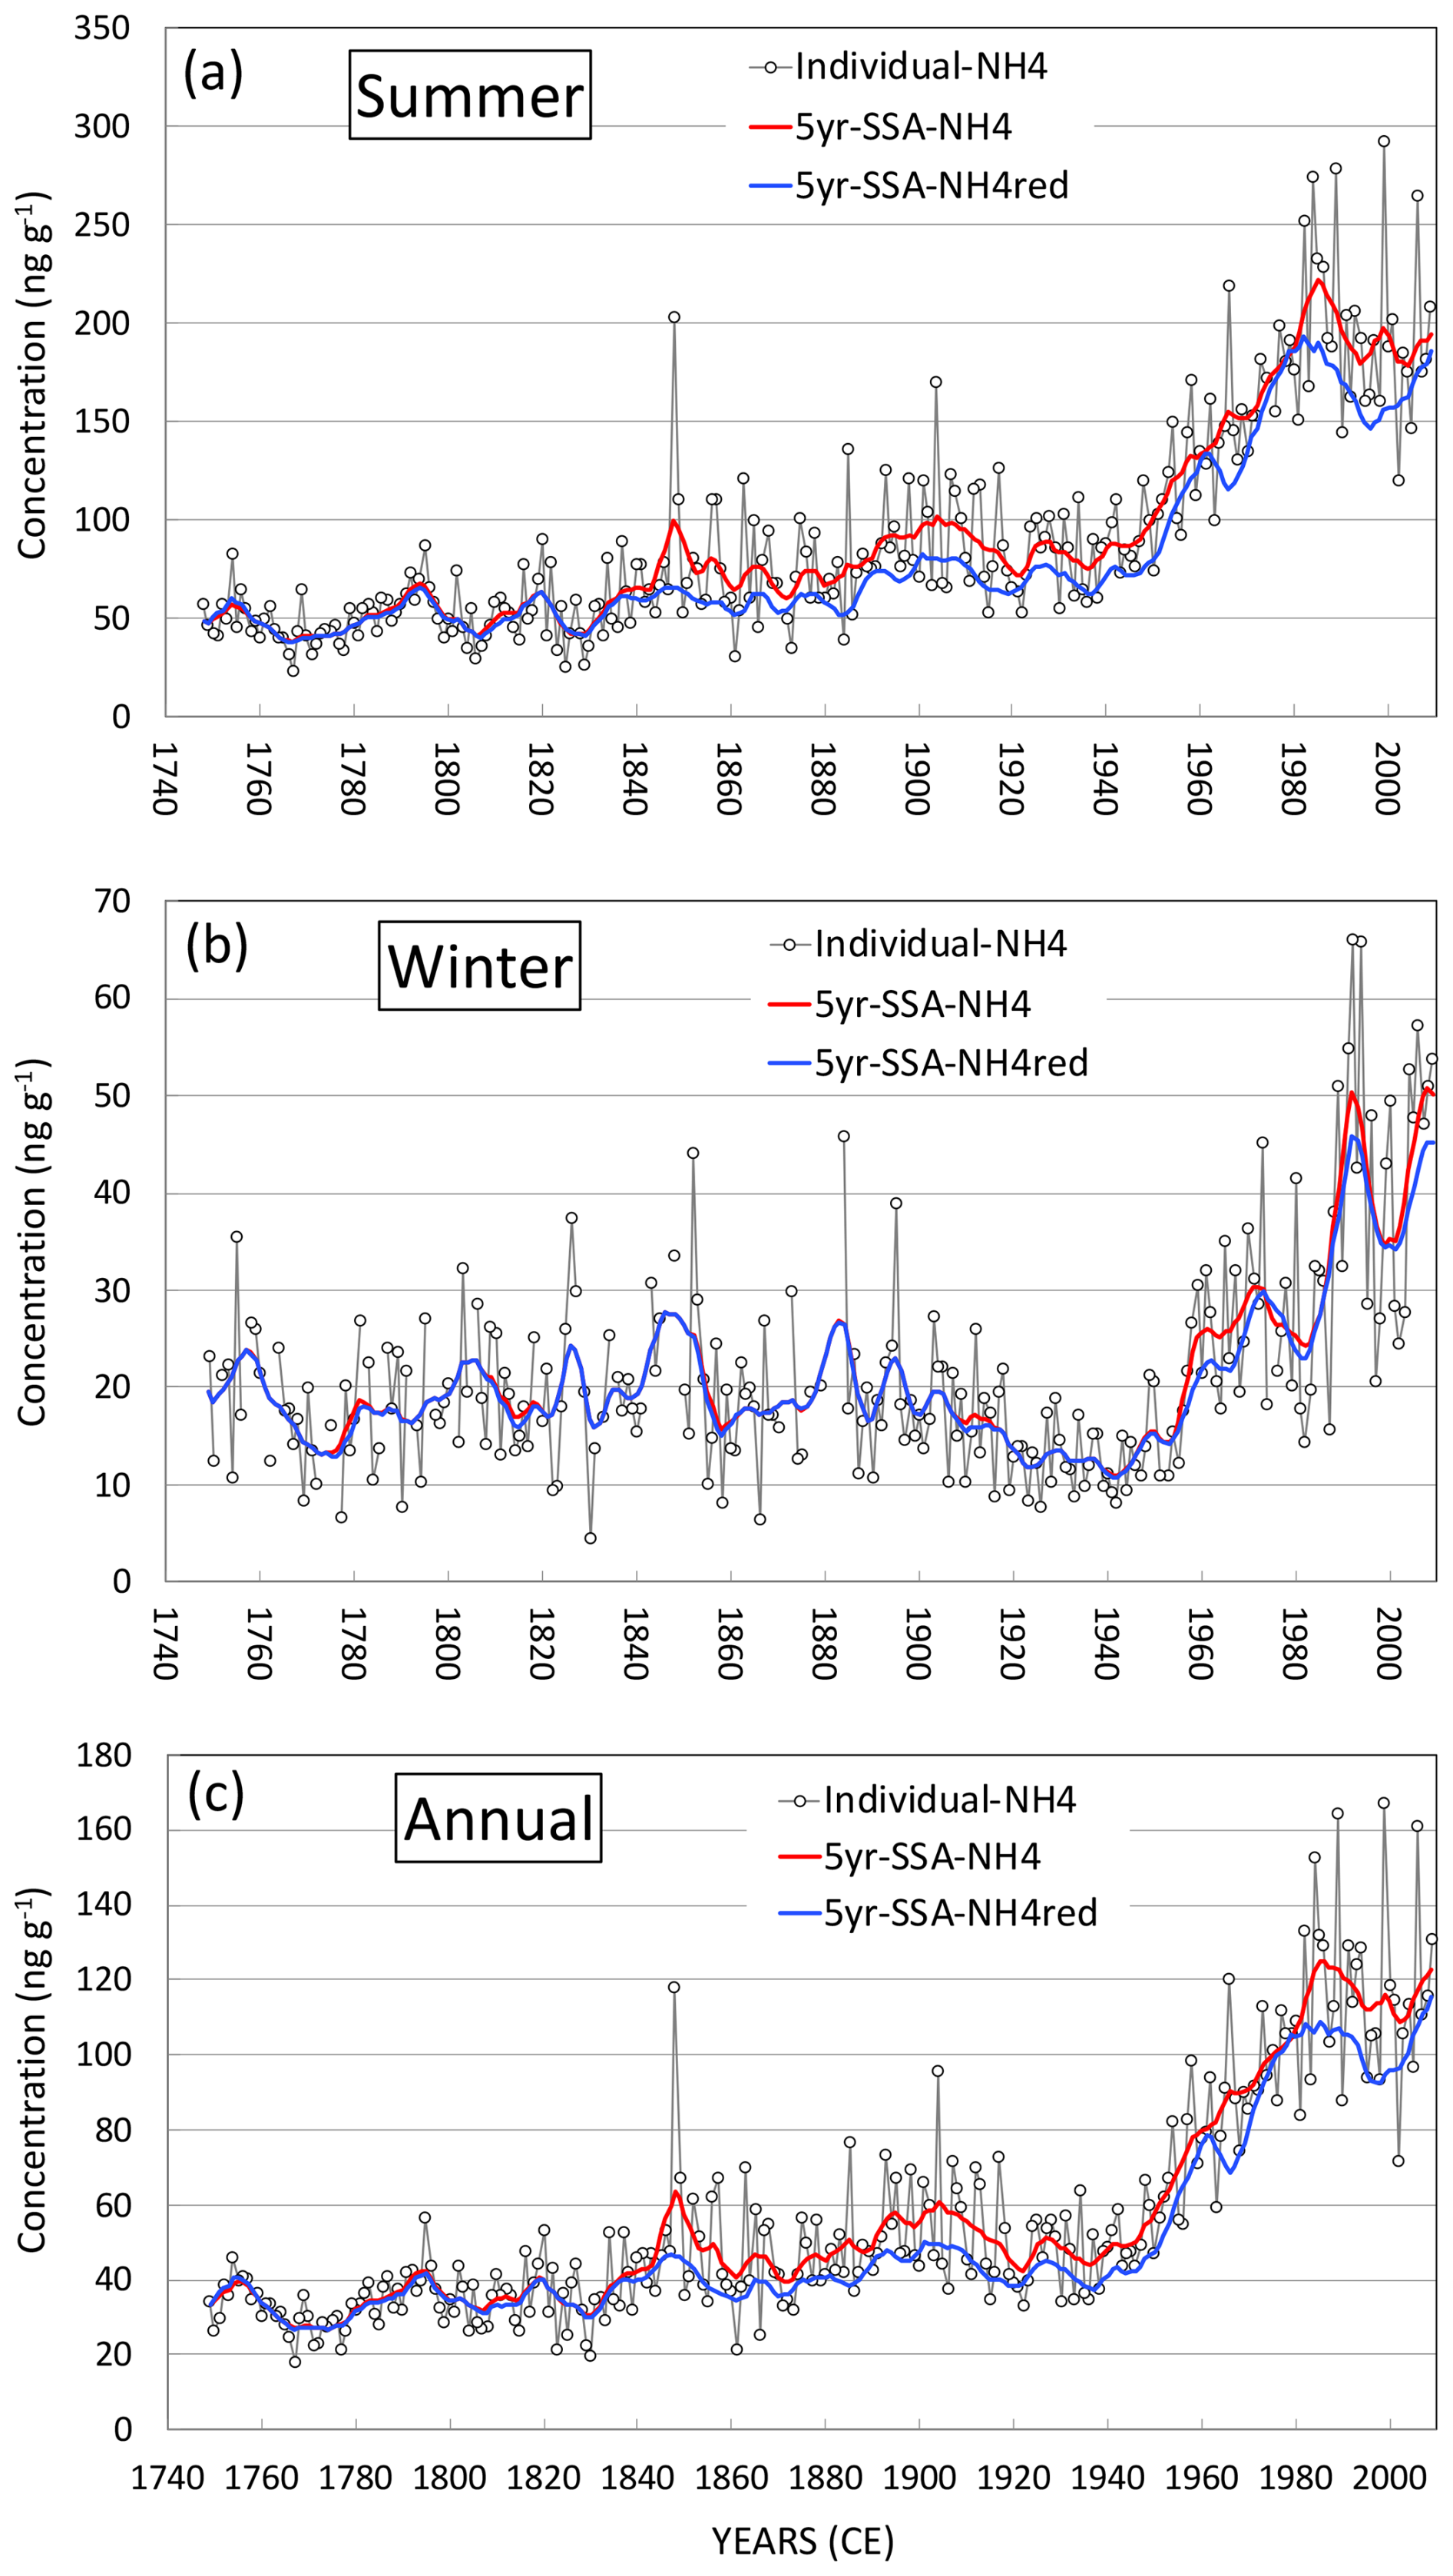
Figure 3Past summer (a), winter (b), and annual (c) changes in ammonium ice concentrations. Open dots are individual values; red curves are smoothed profiles (the first component of the single-spectrum analysis with a 5-year time window). The blue curves are the smoothed profiles when samples containing dust have been removed (Sect. 3).
As discussed by Preunkert et al. (2019), the arrival of large amounts of dust material at ELB is accompanied by enhanced ice concentrations for numerous species including sulfate, nitrate, and ammonium. Large dust plumes originating in both the Middle East and the Sahara reach the Caucasus (Kutuzov et al., 2013), and dust emissions from the Levant region have changed over time in response to the enhanced occurrence of droughts in the northern Africa/Middle Eastern regions and decreased soil moisture content in the Levant regions, respectively (Kutuzov et al., 2019). The causes of such increased ammonium concentrations in samples containing large amounts of dust are not clear. On the one hand, the presence of dust may increase the uptake and oxidation of SO2 as well as the uptake of nitric acid (Dentener et al., 1996), decreasing their availability to form (NH4)2SO4 and/or NH4HSO4 aerosols. On the other hand, it promotes the uptake of NH3 together with nitric acid and the formation of NH4NO3 aerosol (Usher et al., 2003). In Fig. 3, we examined to what extent these past changes in dust impacted those in ammonium by comparing the ammonium trends when samples containing large amounts of dust were considered (NH) or not (reduced NH is denoted NHred in the following). We saw that regardless of the season, the effect of dust remained insignificant prior to 1845 CE but became significant essentially in summer, with a mean difference between NH and NHred of 32 ng g−1 for the summer half-year values from 1985 to 2000 CE. Since the difference remained close to 15 ng g−1 from 1900 to 1950 CE and 19 ng g−1 from 1950 to 2000 CE, the dust changes did not significantly modify the overall ammonium trend. In the following, when discussing the long-term trends in NH in ELB ice with respect to past anthropogenic NH3 emissions, we will consider the trend in NHred concentrations.
In addition to oceanic emissions, ammonia is naturally emitted by natural soil, wild animals, and natural fires. On the global scale, wild animals and the soil under natural vegetation are estimated to emit 2.5 and 2.4 Tg N yr−1, respectively (Sutton et al., 2013); natural fires emit 1.6 Tg N yr−1 (Galloway et al., 2004). These natural emissions represent ∼ 20 %–30 % of the present-day NH3 budget, which is dominated by emissions from agricultural activities. While they were related to manure use prior to World War I, anthropogenic NH3 emissions then changed to become mainly due to the use of nitrogen fertilizers produced from NH3 synthesized by the Haber–Bosch process. Compared to other continents such as America, Europe is very poor in fauna in terms of both diversity and number, weakening the contribution of natural emissions by wild animals. Natural lightning-induced forest fires in Europe are limited compared to in Siberia and Canada. Quantification of sources of ammonia from the natural soil and vegetation remains a challenge, with bi-directional NH3 fluxes, magnitude and direction of which vary with the type of ecosystem, as well as management and environmental variables (Sutton et al., 2013). While Buijsman et al. (1987) proposed emissions of 0.6 Tg N yr−1 from the natural soil in Europe (i.e. 10 % of total emissions in the early 1980s), using a more recent estimate of fluxes from the natural soil, Sutton et al. (1995) derived far lower emissions. From that and by setting natural soil emissions to zero, Simpson et al. (1999) estimated that in Europe natural NH3 sources only represent ∼ 1 % of the present-day budget, mainly due to wild animals and forest fires. If correct and referring to NH levels observed in recently deposited ice at ELB (Fig. 3), natural sources would contribute only 2 ppb to NH concentrations in ELB ice (Fig. 3). The present-day situation, with an absence of natural soil emissions and anthropogenic sources representing 99 % of total NH3 emissions, has changed over the past due to a decrease in anthropogenic emissions and a growth in the natural soil at the expense of agricultural areas. In the following, neglecting the contribution from wild animals and forest fires, we have assumed that when agricultural activities reached a maximum at the end of the 20th century, i.e. in the near-absence of soil left unmanaged in Europe, NH concentrations in ELB ice were only due to anthropogenic activities without any contribution from natural emissions.
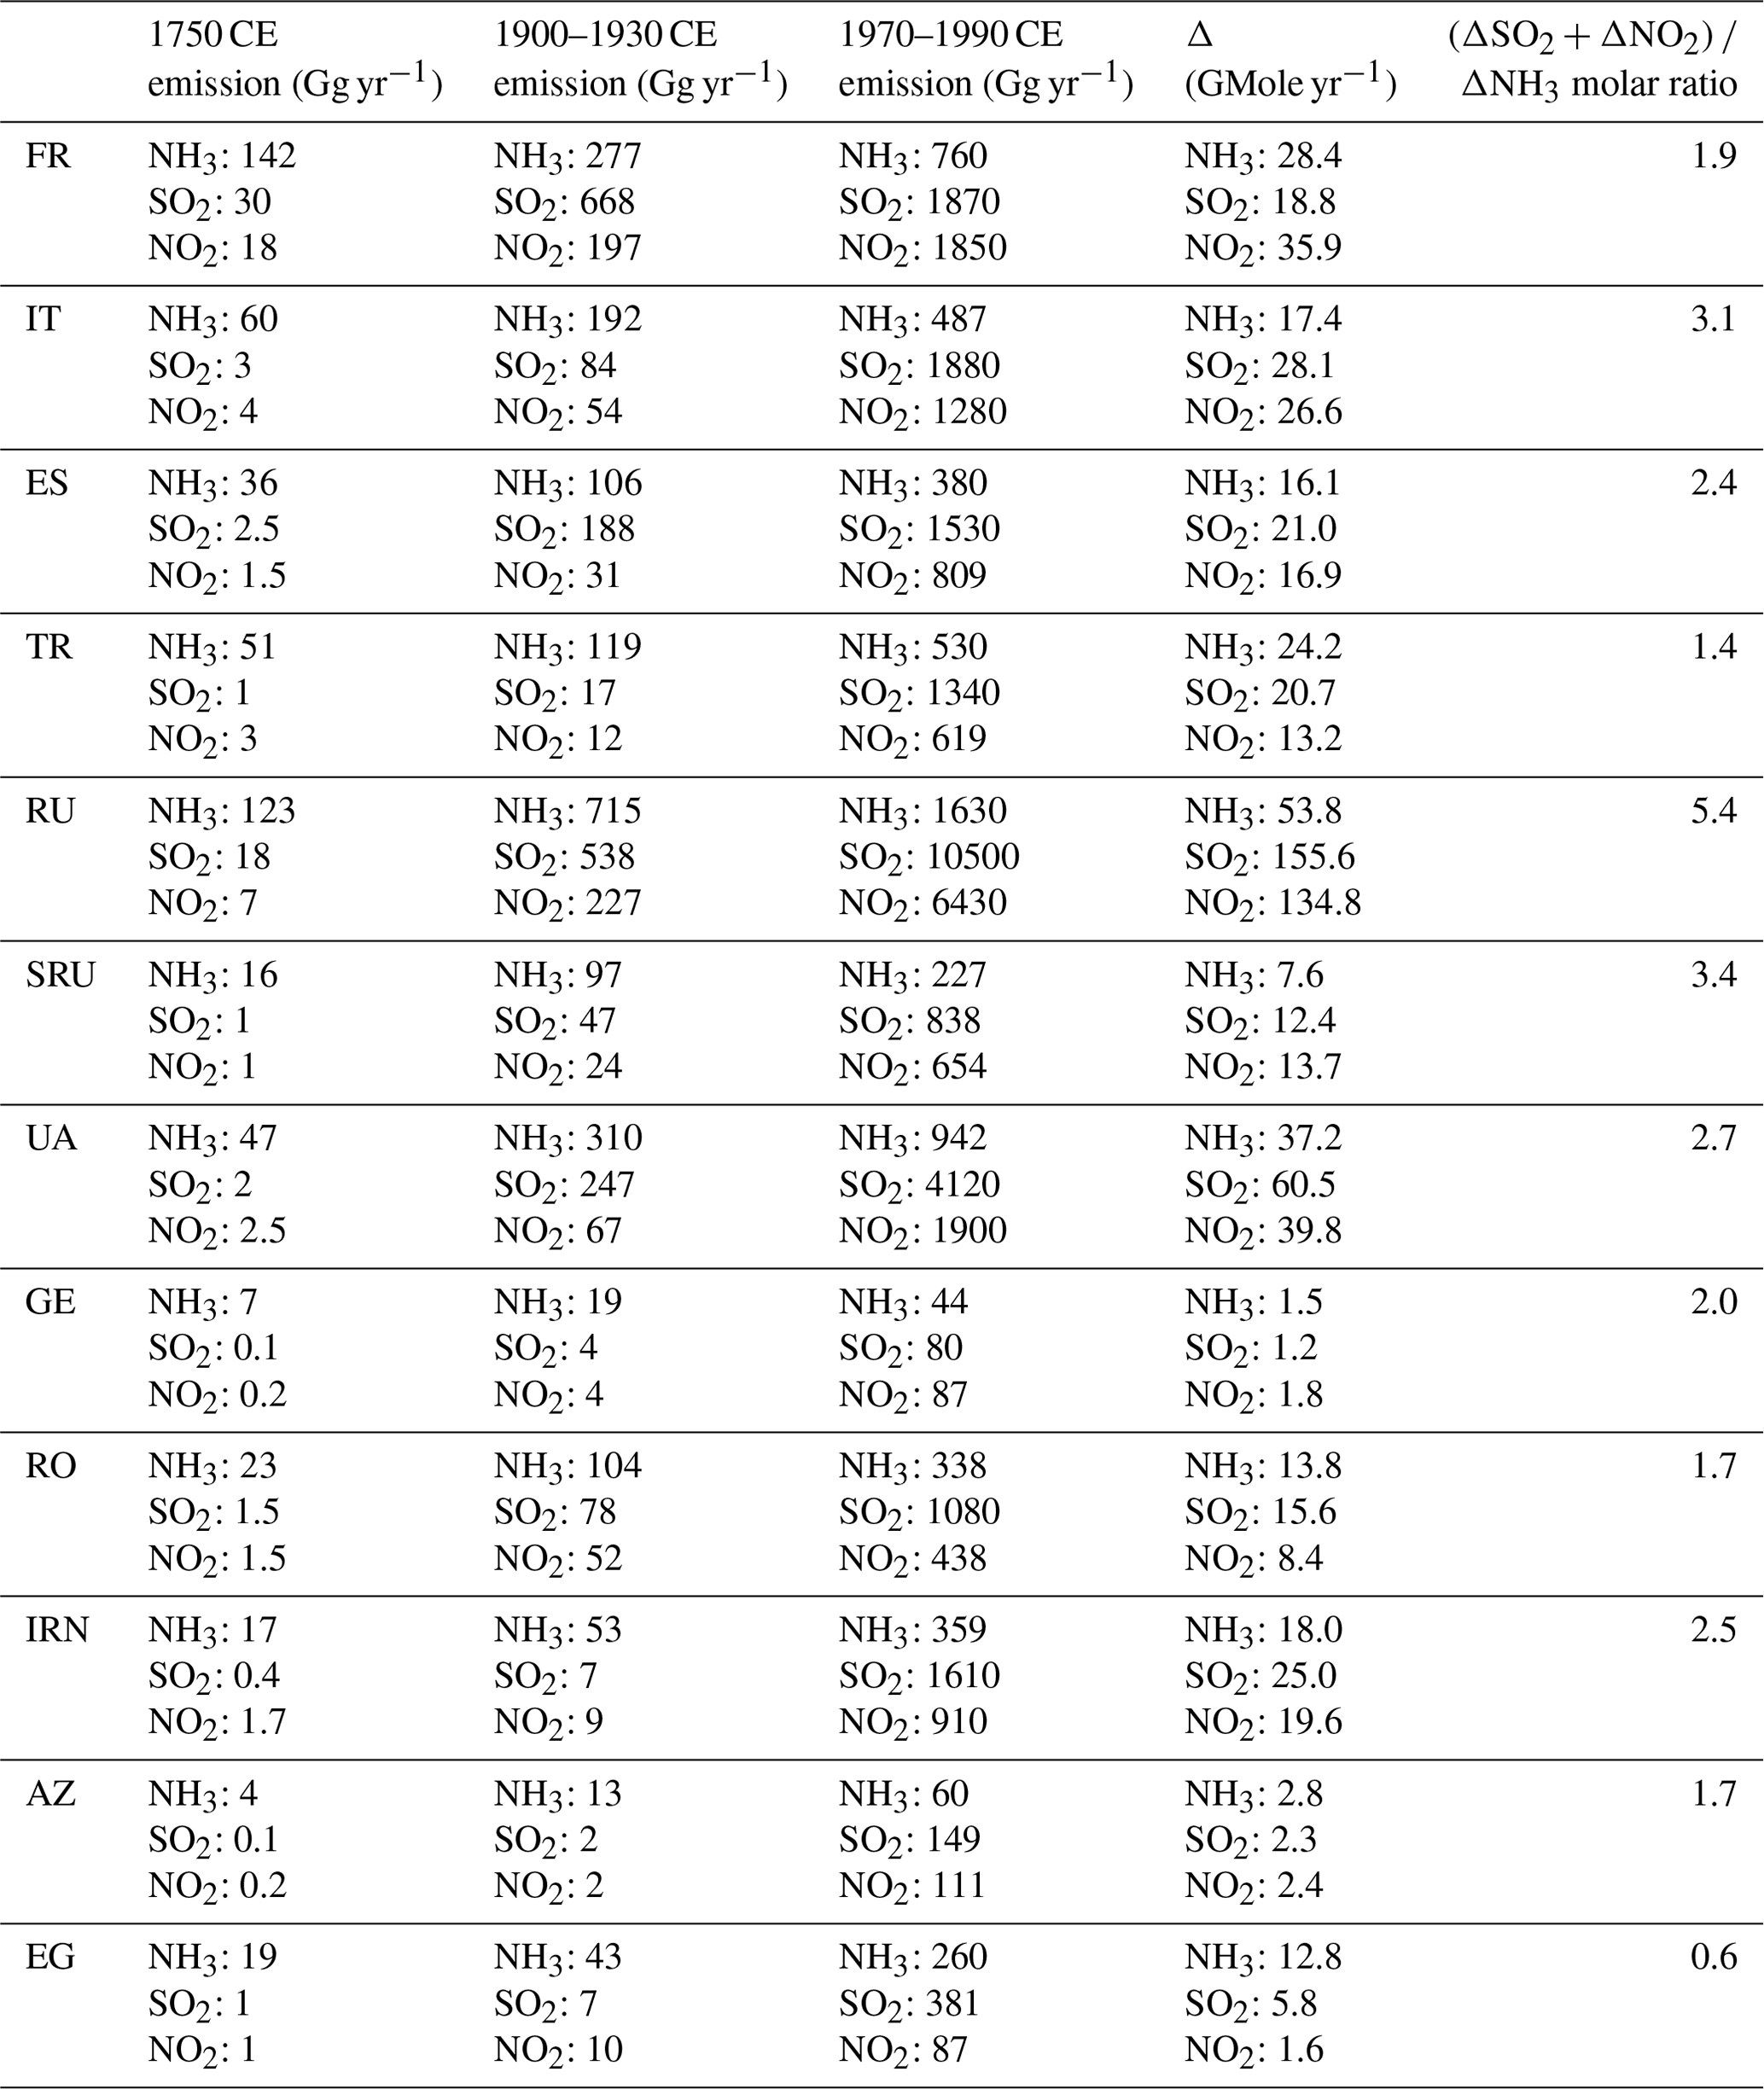
It is likely that the NH minimum observed in ELB ice deposited during the second part of the 18th century (mean annual concentration of 34±7 ng g−1 from 1750 to 1800 CE; Fig. 3c) already exceeded the natural background level in this region. While emissions of SO2 and NO2 in 1750 CE (i.e. well before the onset of the industrial era in Europe, which was in ∼ 1850 CE) represented less than 1 % of recent emissions, those of NH3 were already 5 % to 16 % of their 1980-2000 CE values in most countries contributing to NH deposition at the ELB site (Table 1). This earlier occurrence of significant NH3 pollution compared to that of SO2 and NO2 in south-eastern Europe is also clearly depicted in past emission inventories, with emissions from southern Russia, for instance, reaching 10 % of their 1980–2000 CE mean values in 1810 CE for NH3 compared to 1913 for SO2 and 1934 CE for NO2 (Hoesly et al., 2018).
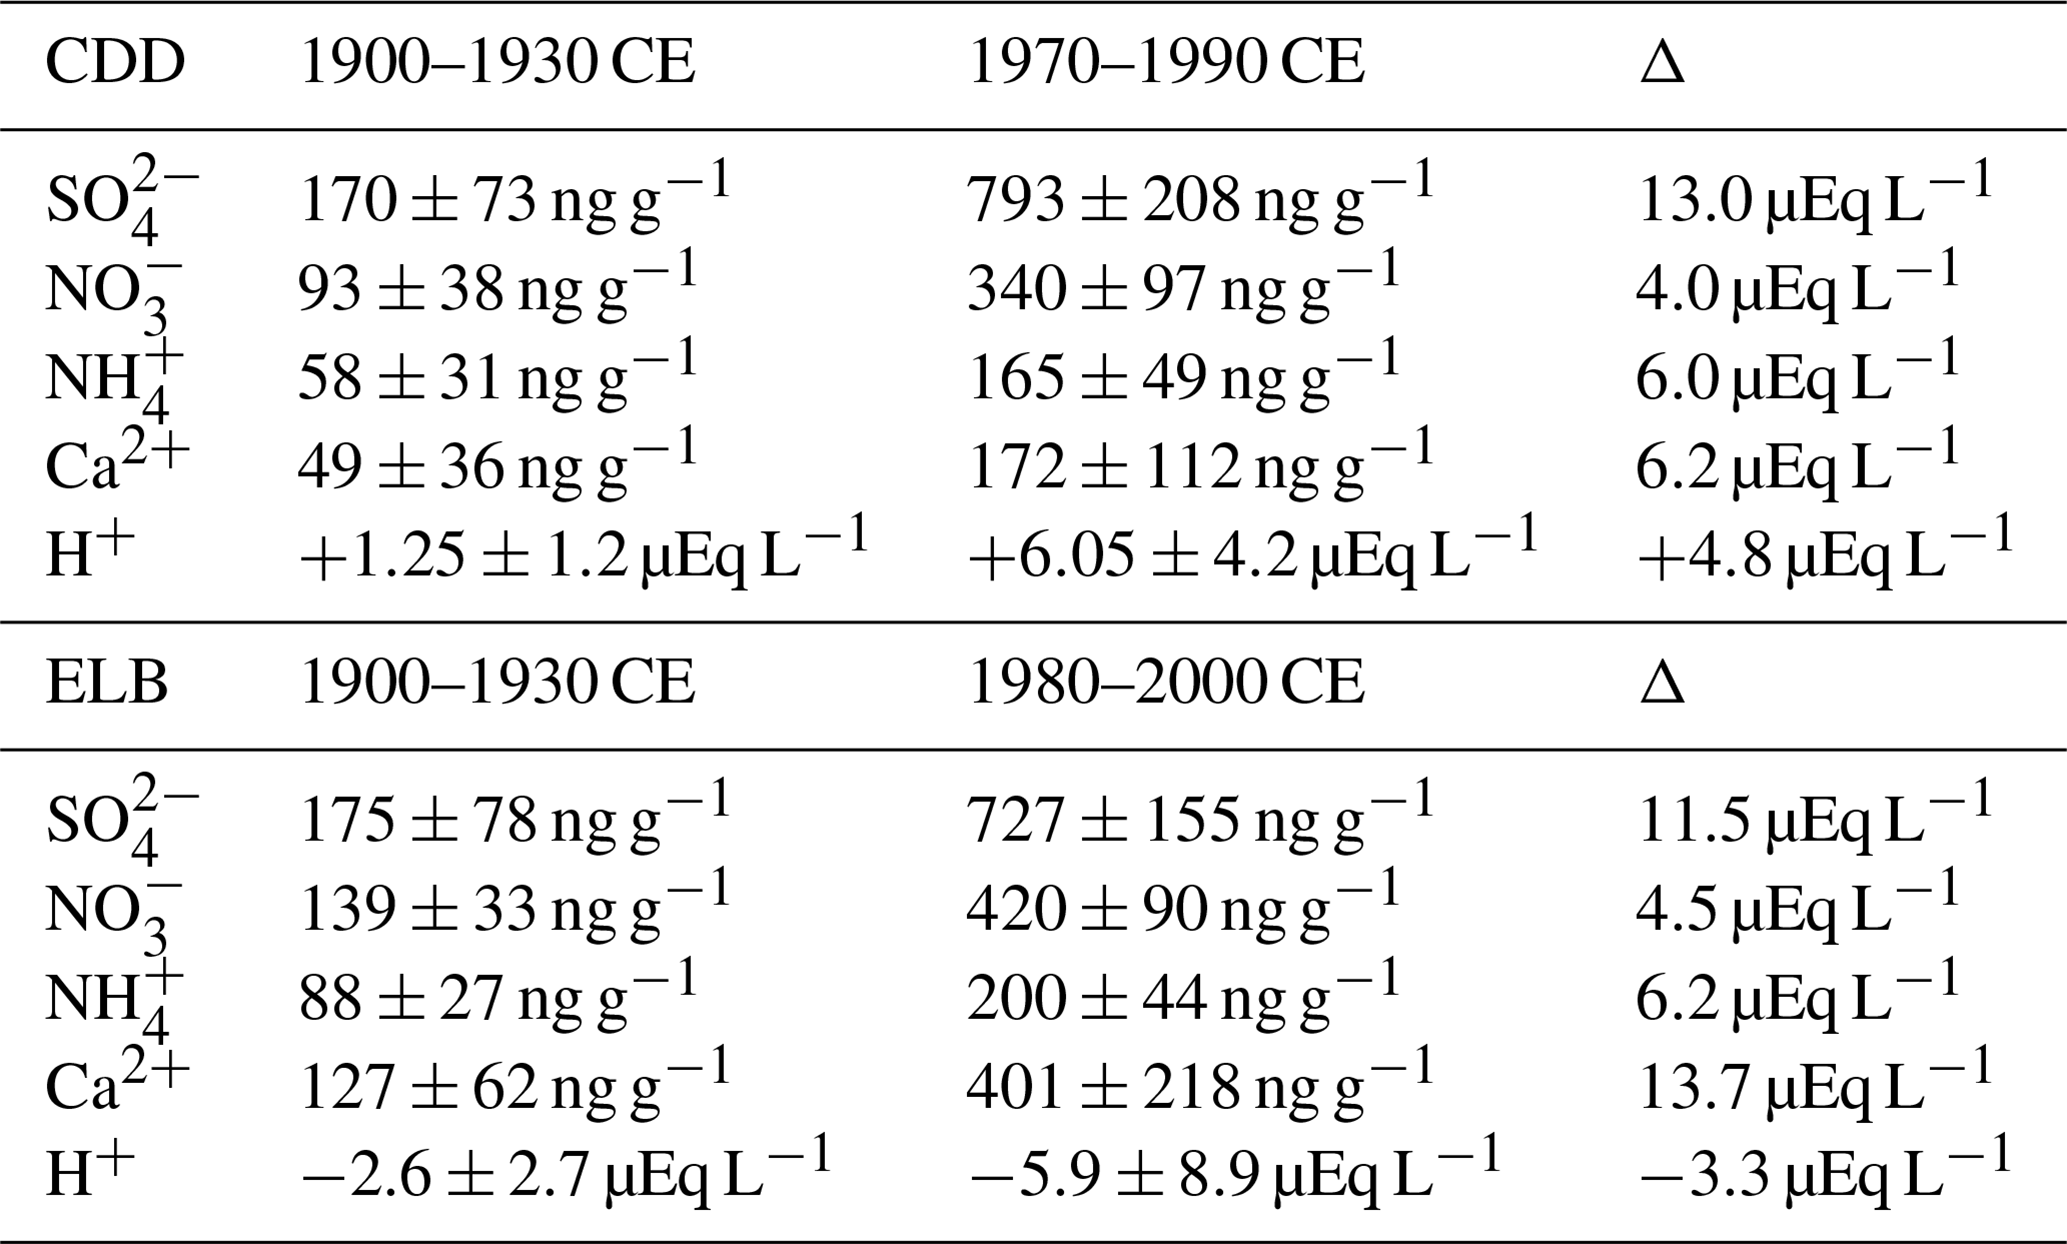
Table 1Emissions of NH3, SO2, and NO2 (CEDS inventories; Hoesly et al., 2018) from countries mainly contributing to NH deposition at the at the Col du Dôme (CDD, Mont Blanc, French Alps) (France – FR; Italy – IT; and Spain – ES) and ELB (Türkiye – TR; Russia – RU, southern Russia – SRU; Ukraine – UA; Georgia – GE; Romania – RO; Iran – IRN; Azerbaijan – AZ; and Egypt – EG) sites. Δ denotes the change from the years 1900–1930 CE to the years 1970–1990 CE (1980–2000 CE).
To estimate the natural NH levels, we examined the relationship between ice concentrations (C) and deposition fluxes (φ) calculated by the FLEXPART model (Fig. 4a) using past NH3 emissions. As seen in Fig. 5a for summer, when using calculated φ values at the real elevation of the ELB site, the C and φ parameters are linearly correlated, with a y intercept of 39.7±2.4 ng g−1 that would correspond to the NH concentration related to natural soil emissions before occurrence of significant agricultural NH3 emissions, which started with the agricultural revolution at the beginning of the 15th century. Using φ values at the surface elevation, we obtained a similar y intercept (C = 0.85 φ+ 39.2 with R2= 0.77 instead of C = 1.5 φ+ 39.7 with R2= 0.77). Only the use of the NHred values instead of NH ones leads to a slight decrease in the y intercepts for summer (35.0±2.2 ng g−1; Fig. 5b).
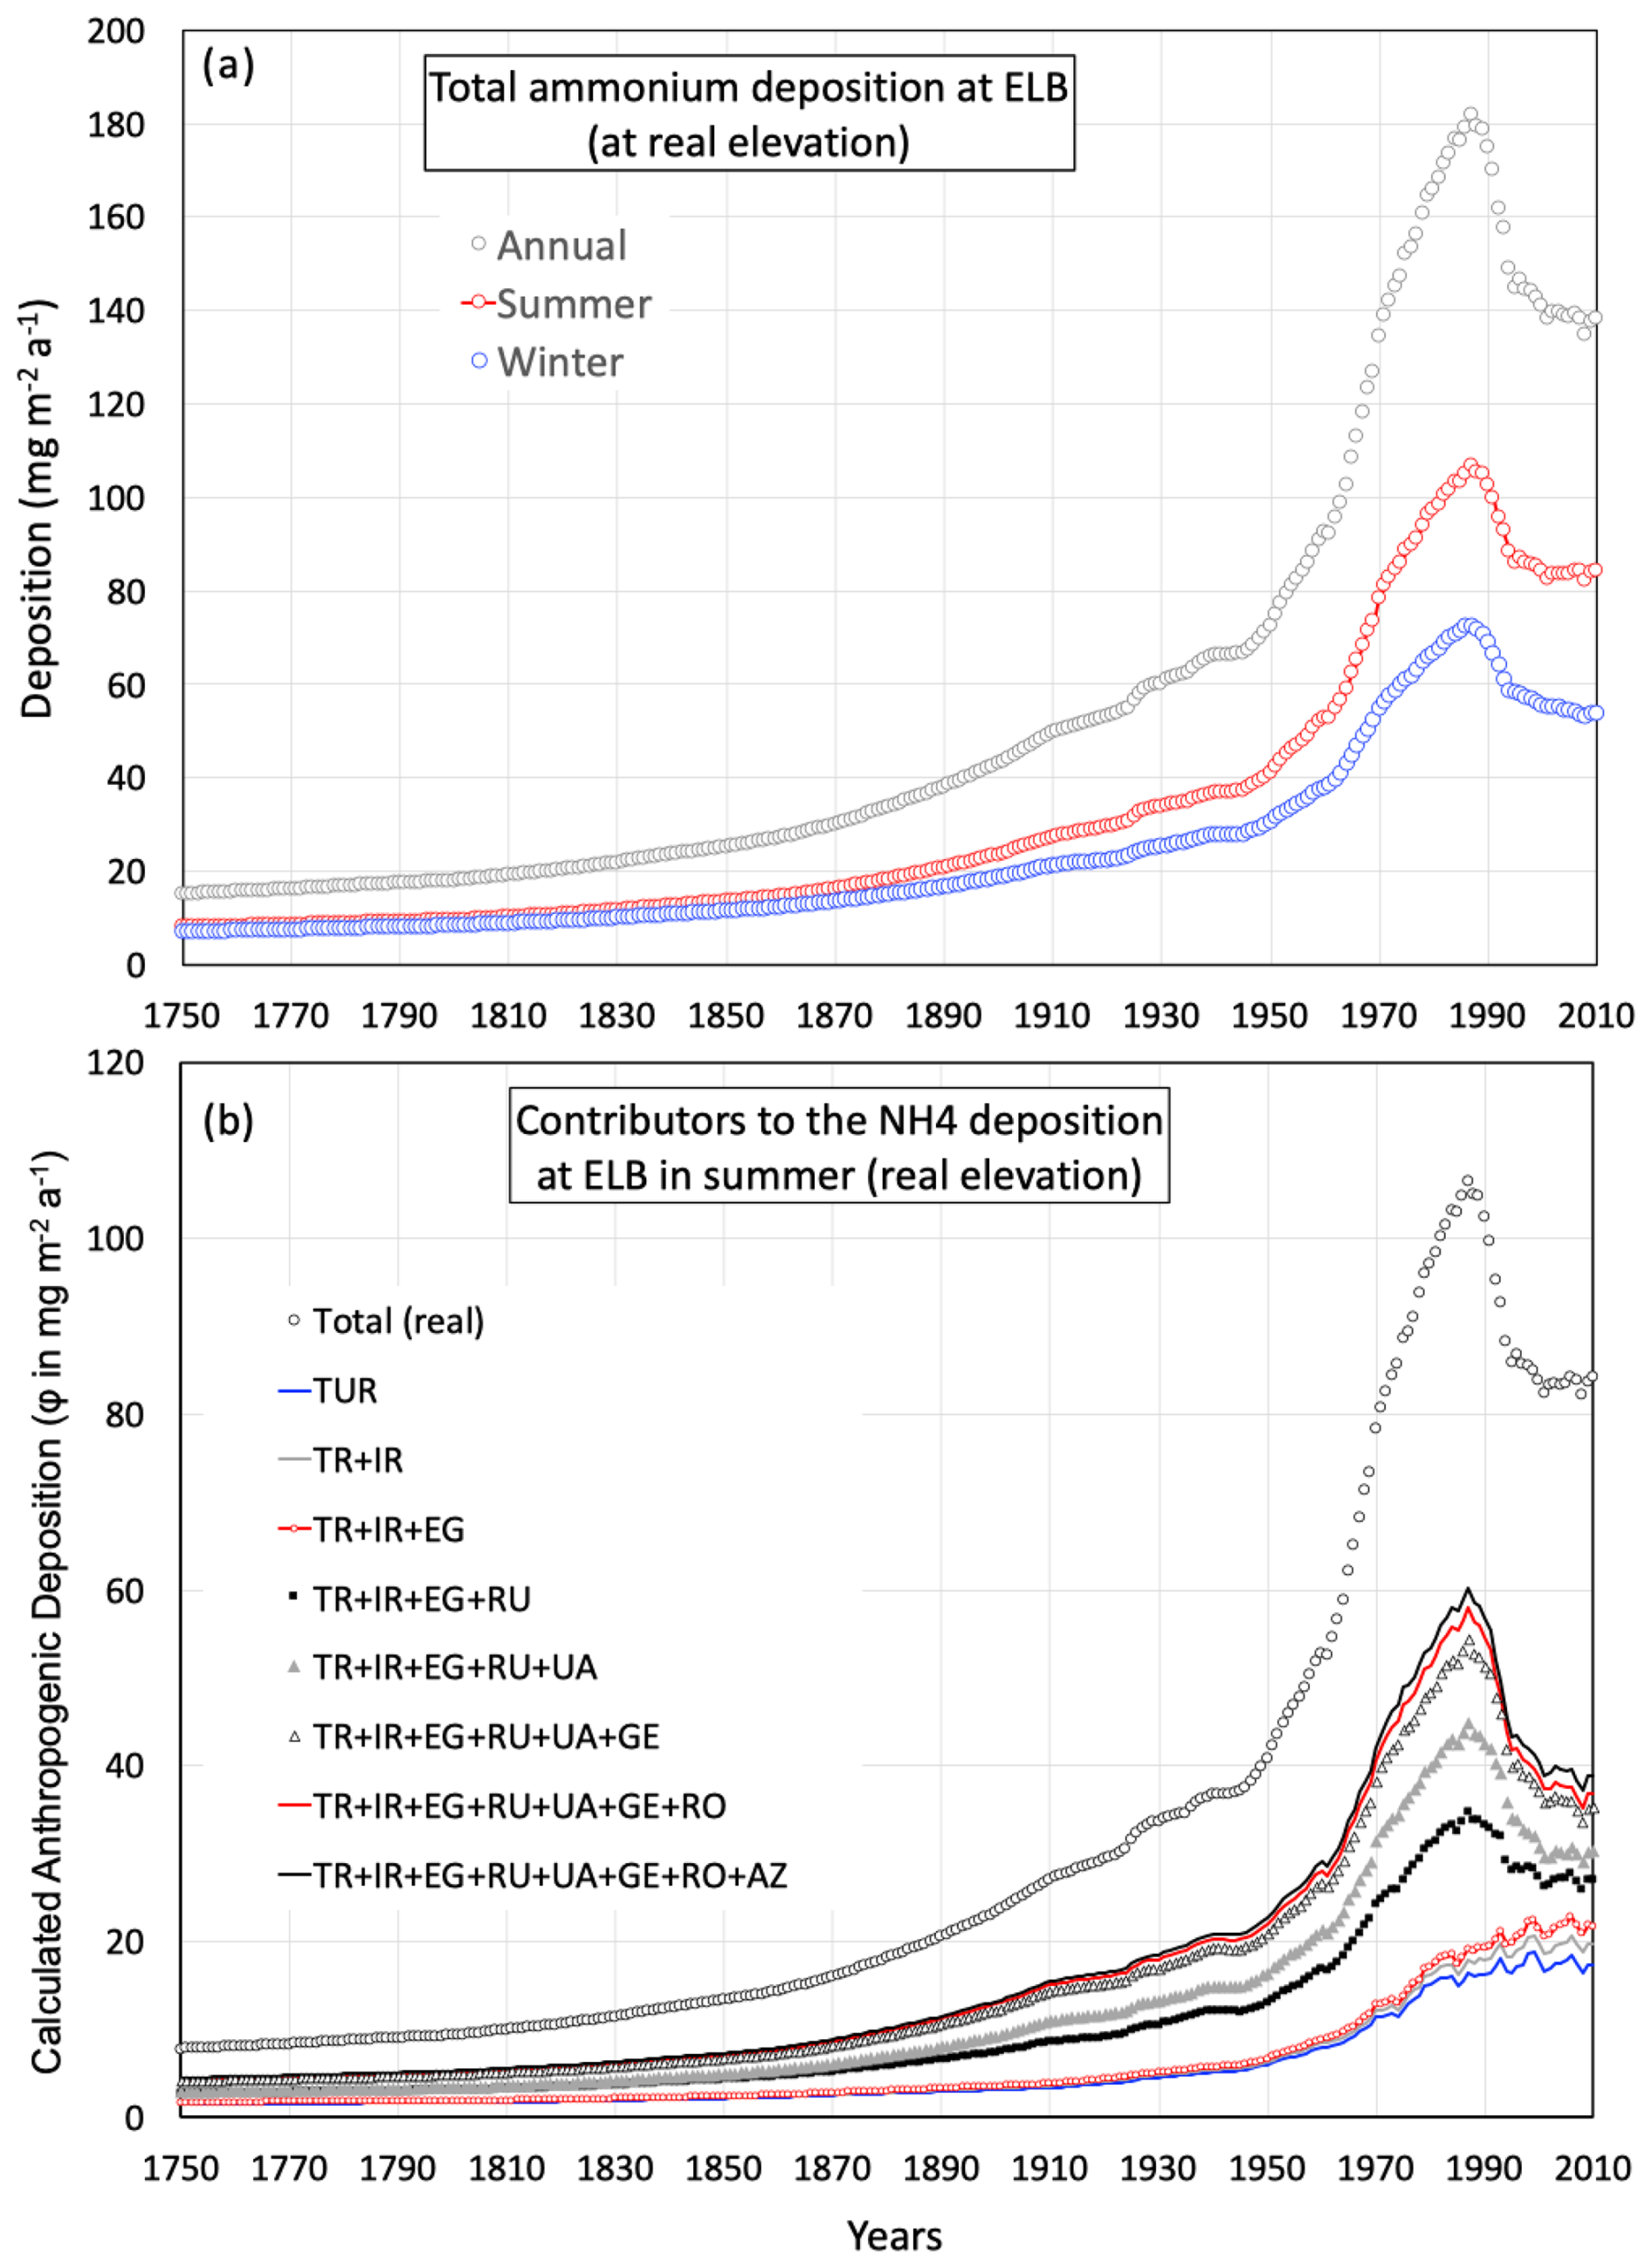
Figure 4Ammonium deposition calculated by FLEXPART at the Elbrus site. (a) Deposition calculated at the real elevation (Sect. 2.2) for the summer and winter half-years and over the year using the seasonal CEDS inventories (Hoesly et al., 2018). (b) Countries contributing to the ammonium deposition at the real elevation at the Elbrus site in summer using past NH3 summer inventories (CEDS; Hoesly et al. (2018)). The solid black line refers to the total deposition. The main contributors were Türkiye (TR), Russia (RU), Ukraine (UA), Georgia (GE), Romania (RO), Iran (IRN), Azerbaijan (AZ), and Egypt (EG).
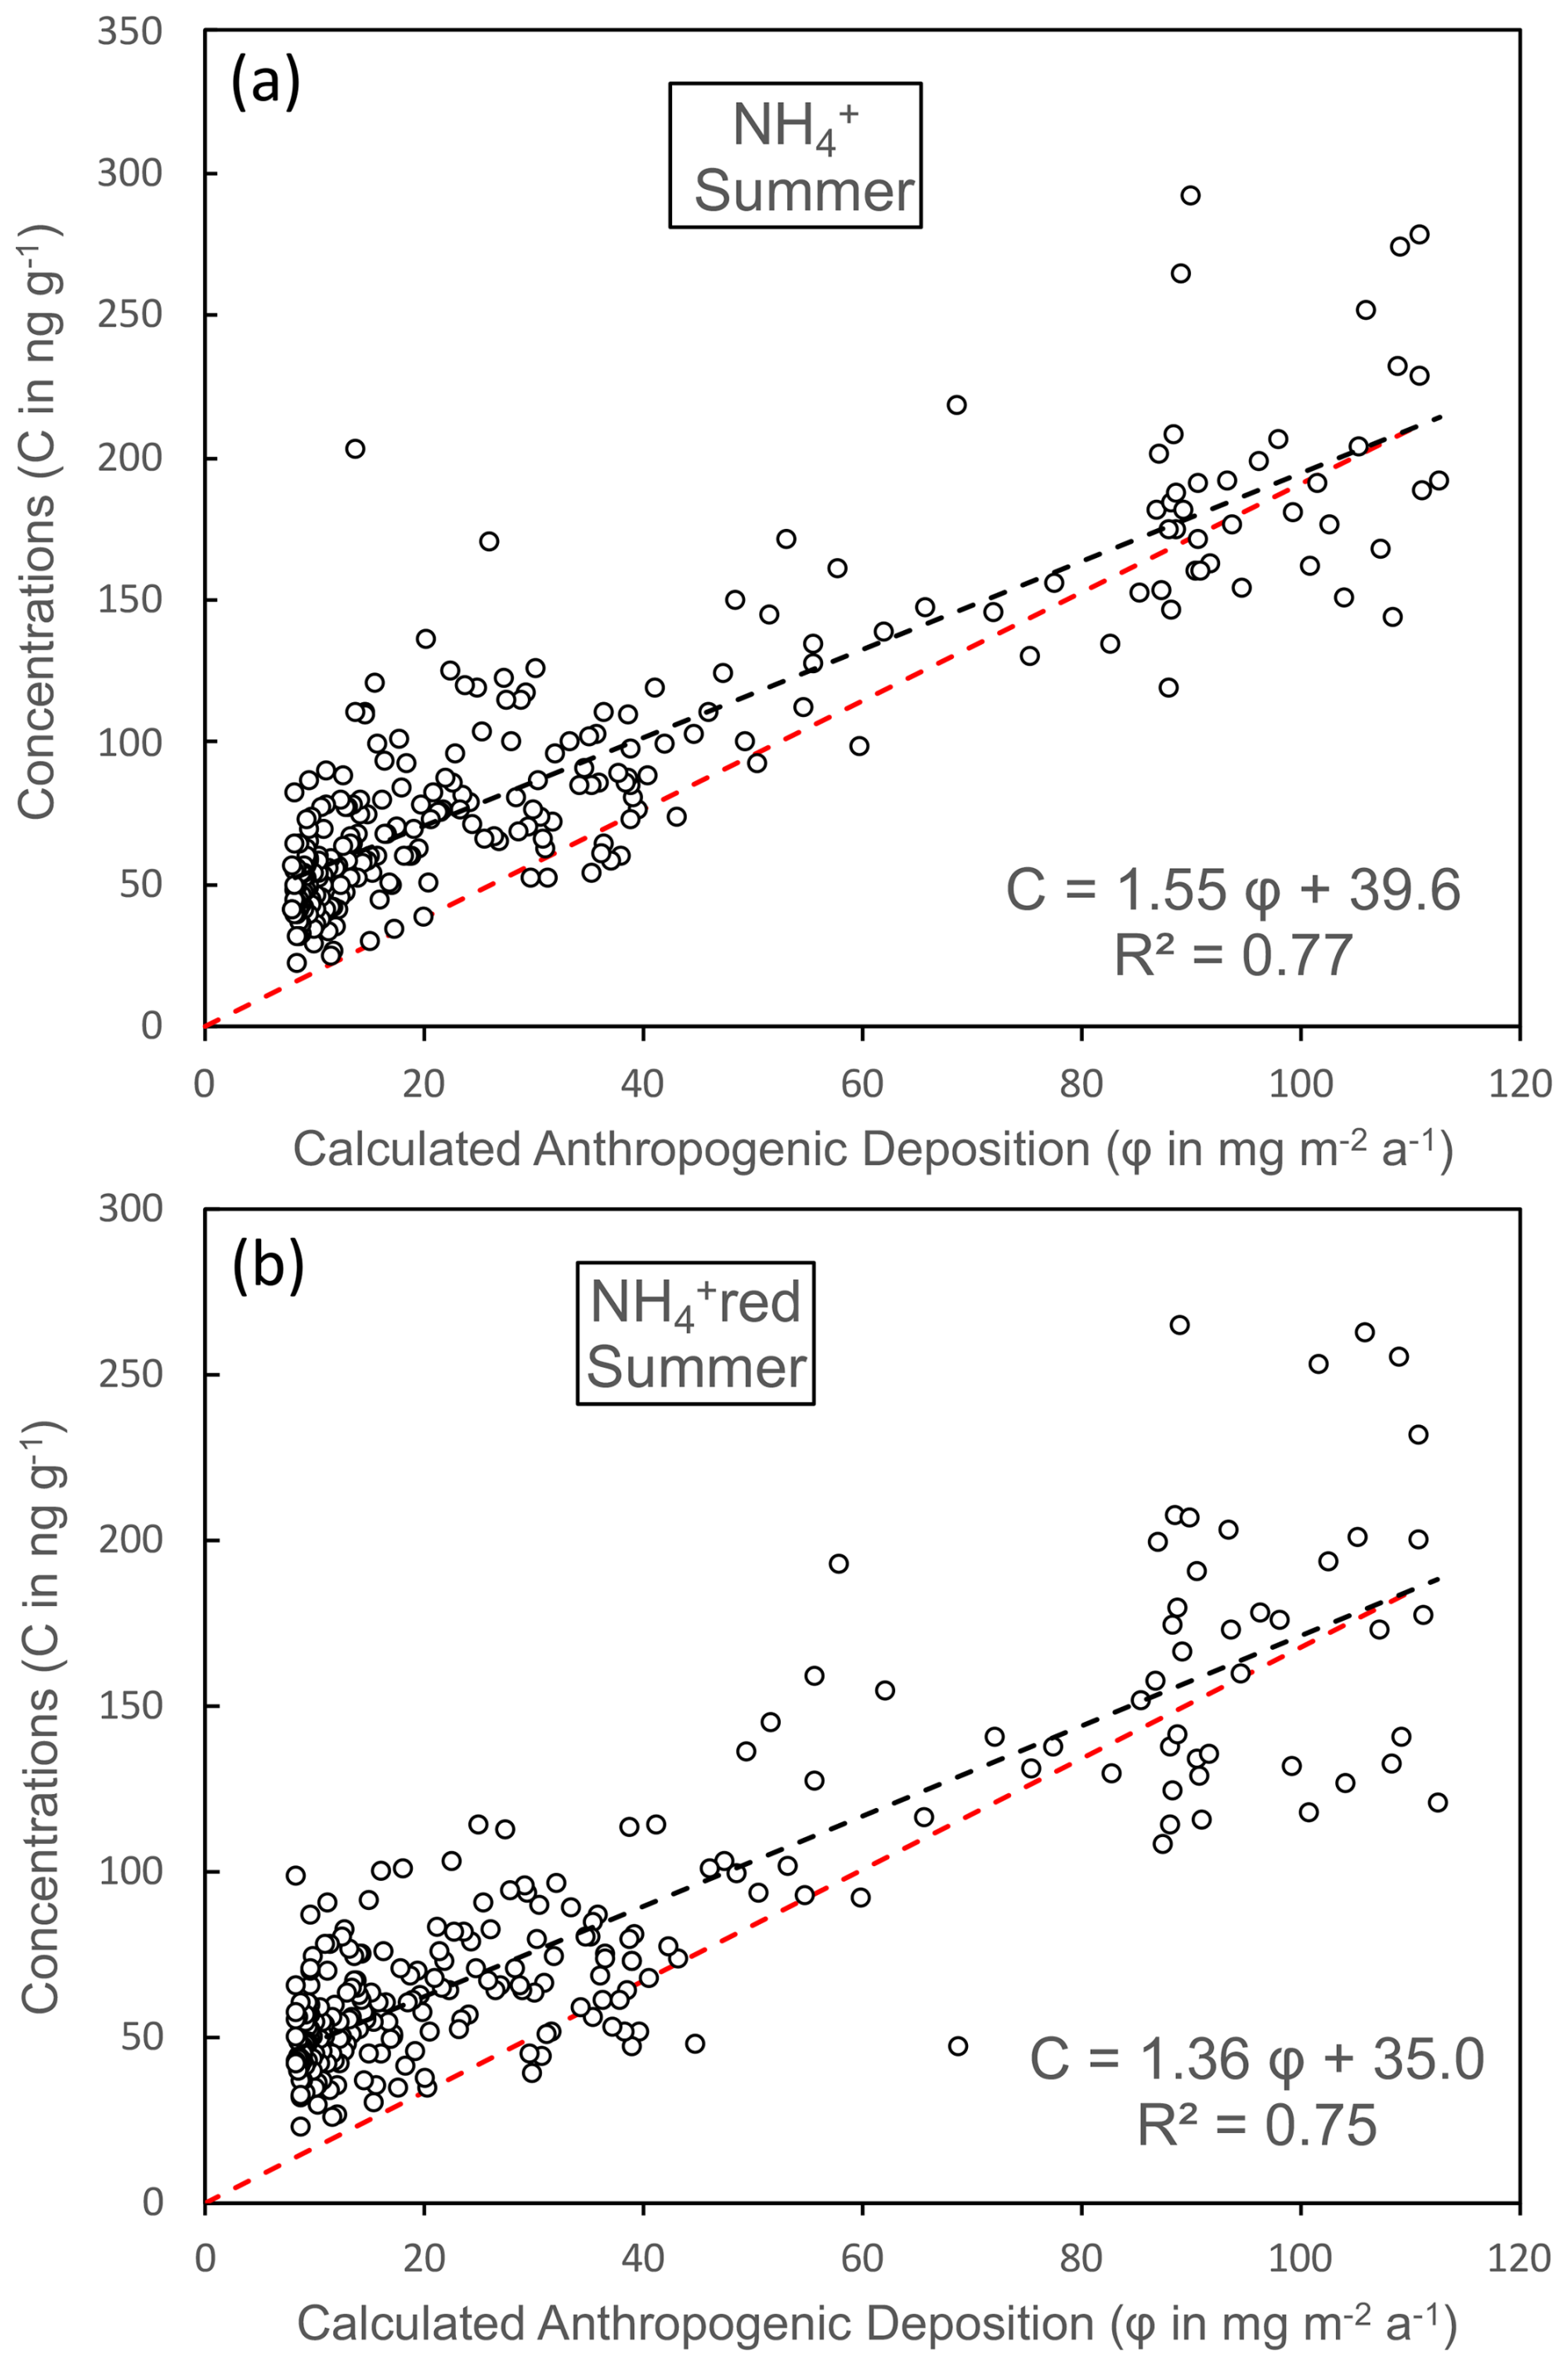
Figure 5Relationships between summer ice concentrations of ammonium: panel (a) is NH and panel (b) is NHred and deposition fluxes (φ) at ELB calculated at the real elevation in summer by FLEXPART using estimated past anthropogenic NH3 emissions (CEDS inventories; Hoesly et al. (2018).
For winter, no significant difference between NH and NHred concentrations can be observed (Fig. 3b). In contrast to summer, the winter trend surprisingly indicates a mean value of ice deposited over the second part of the 18th century (18±6 ng g−1 from 1750 to 1800 CE; Fig. 3b) that is significantly higher than the one over the 1920–1945 CE time period (12±6 ng g−1), with no significant difference between NH and NHred concentrations. Furthermore, the C and φ parameters are less well correlated for winter (C = 0.28 φ+ 14.2 with R2 = 0.26; Fig. 6b) than for summer (Fig. 5a), leading to a more uncertain estimate of the y intercept. As discussed in Sect. 3, due to the lowering of the sampling resolution with the depth in the winter layers, the winter half-year values were calculated with a limited number of samples and are therefore more uncertain, particularly prior to the middle of the 19th century (see also Fig. 6a). That may have an impact on the winter trend, as suggested by the eight winter half-year values exceeding 30 ng g−1 in ice deposited prior to 1900 CE (Figs. 3b and 6a), which were calculated using only one sample. Discarding winter half-year values calculated using one sample reduced the number of winter values exceeding 25 ng g−1 prior to 1900 CE, improved the correlation between C and φ (C= 0.34 φ+11.5 with R2= 0.37), and resulted in a slightly lower y intercept (11.5±1.3 ng g−1) than when all values, including those based on one sample, were considered (14.2 ng g−1). An even lower y intercept (8.1±1.6 ng g−1) is calculated when considering winter layers consisting of more than three samples. In spite of these uncertainties, ice-core data suggest a typical natural winter concentration close to ∼ 10 ng g−1.
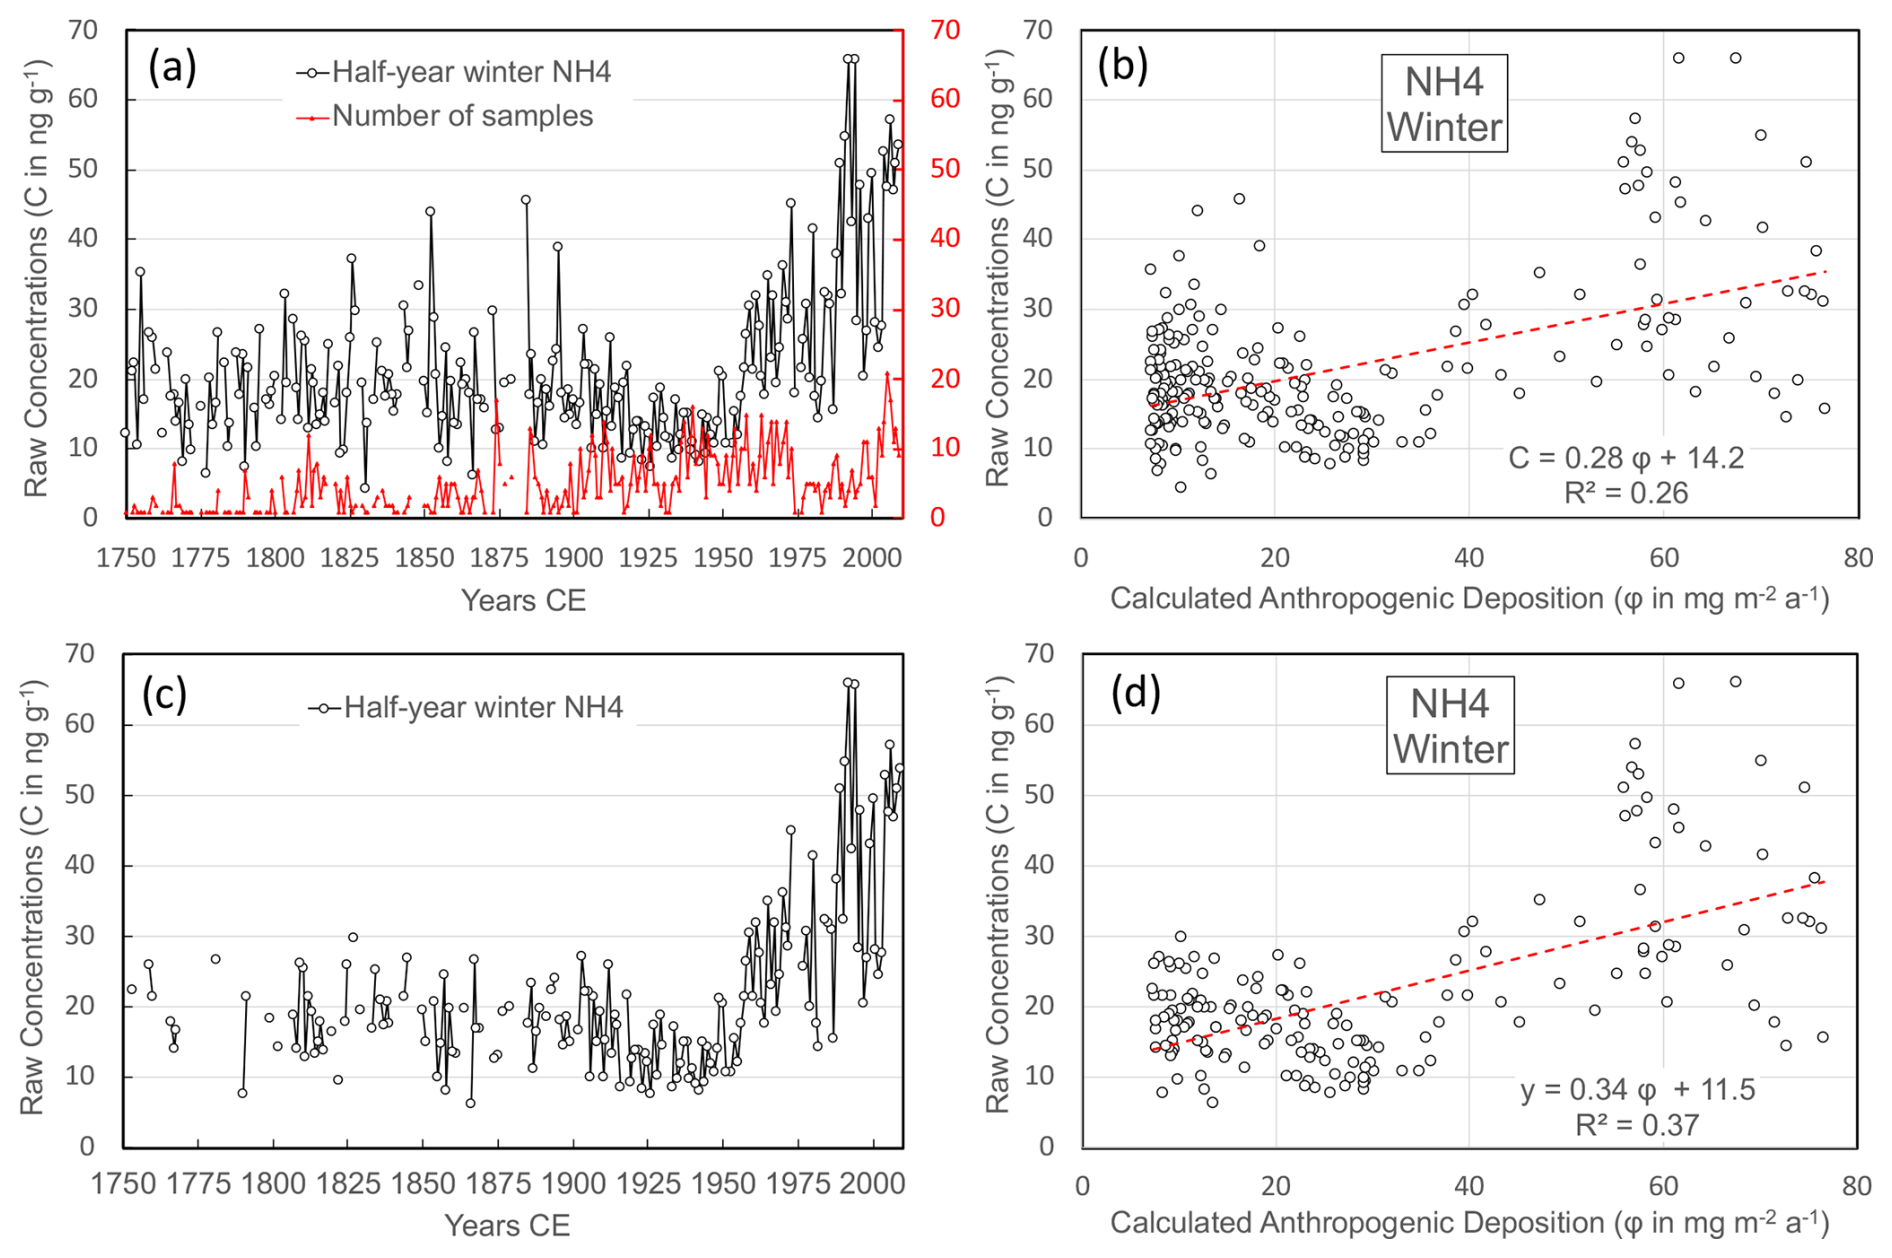
Figure 6(a) The winter ice-core record of ammonium concentrations (black dots); the red line indicates the number of values available to calculate individual half-year winter means. (b) The relationship between winter ice concentrations of NH (c) and deposition fluxes (φ) at ELB calculated at the real elevation in winter by FLEXPART using estimated past anthropogenic NH3 emissions (CEDS inventories; Hoesly et al. (2018)). Panels (c) and (d) are similar to (a) and (b) but discard the winter half-year means when only one sample was available.
The preceding findings suggest a natural NH level close to 37 and 10 ng g−1 in summer and winter, respectively, leading to an annual value of ∼ 22 ng g−1, representing ∼ 20 % of the mean 1980–2009 CE NH value compared to of 1 % at the end of the 1980s.
In the following, we focus on the summer trend and only briefly discuss the winter trend since (1) the ice-core record of pollution is better documented for summer and (2) the NH3 pollution is higher in summer than in winter.
5.1 Ammonium pollution in summer
Comparison of estimated past anthropogenic emissions with changes in ice requires accurate assessment and removal of the contribution of natural emissions to ice concentrations. Mainly related to soil under natural vegetation, these are nearly non-existent for ammonia at the end of the 20th century and have changed over the past. The natural NH level in 1750 CE can be estimated from the relationship between observed ice concentrations and the deposition fluxes calculated by FLEXPART. For NHred in summer, extrapolation of the recent values (φ of 110 mg m−2 yr−1 for C of 184 ng g−1) to the simulated deposition of 8 mg m−2 yr−1 in 1750 CE (Fig. 5b) suggests a remaining anthropogenic contribution of 14 ng g−1 to the total NHred concentration of 46 ng g−1 and thus a natural NHred contribution of 32 ng g−1 in 1750 CE.
Accurate estimation of past natural NHred concentrations between 1750(32 ng g−1) and 2009 CE (∼ 0 ng g−1) is not straightforward, as it uses either available data on past changes in agricultural area (and unmanaged soil area) in south-eastern Europe or past anthropogenic deposition simulated by FLEXPART to estimate the growth of natural soil area back in time at the expense of decreasing agricultural area. Indeed, on the one hand, the increase in agricultural soil areas and the subsequent decrease in natural soil areas from 1750 to 2009 CE were not linearly correlated with growing anthropogenic emissions, with growing amounts of fertilizers applied to managed soil areas. On the other hand, regions for which FLEXPART simulations indicate a significant contribution to the NH deposition in ELB ice include the former USSR (Russia, Ukraine, and Georgia) and the Middle East (Türkiye) (Fig. 4b), for which agricultural areas are documented since 1600 CE (HYDE, 2023, https://ourworldindata.org/grapher/total-agricultural-area-over-the-long-term, last access: 29 March 2024). The data are, however, not detailed enough to weight the emissions from the different countries to the NH natural level at the ELB site. Given these uncertainties, we calculated past natural soil contributions estimated from past changes in both (1) total agricultural areas in the Middle East and Russia and (2) anthropogenic deposition at the site simulated by FLEXPART (Fig. S2). These estimates were obtained by scaling the natural contribution of NHred to zero in 1990 CE and 32 ng g−1 in 1750 CE. From that, we calculated the contribution of anthropogenic sources to past NHred concentrations in ELB ice (Fig. 7), denoted anthropogenic-1 and anthropogenic-2, by subtracting from the total concentrations the soil contributions derived from agricultural areas and simulated anthropogenic deposition, respectively.
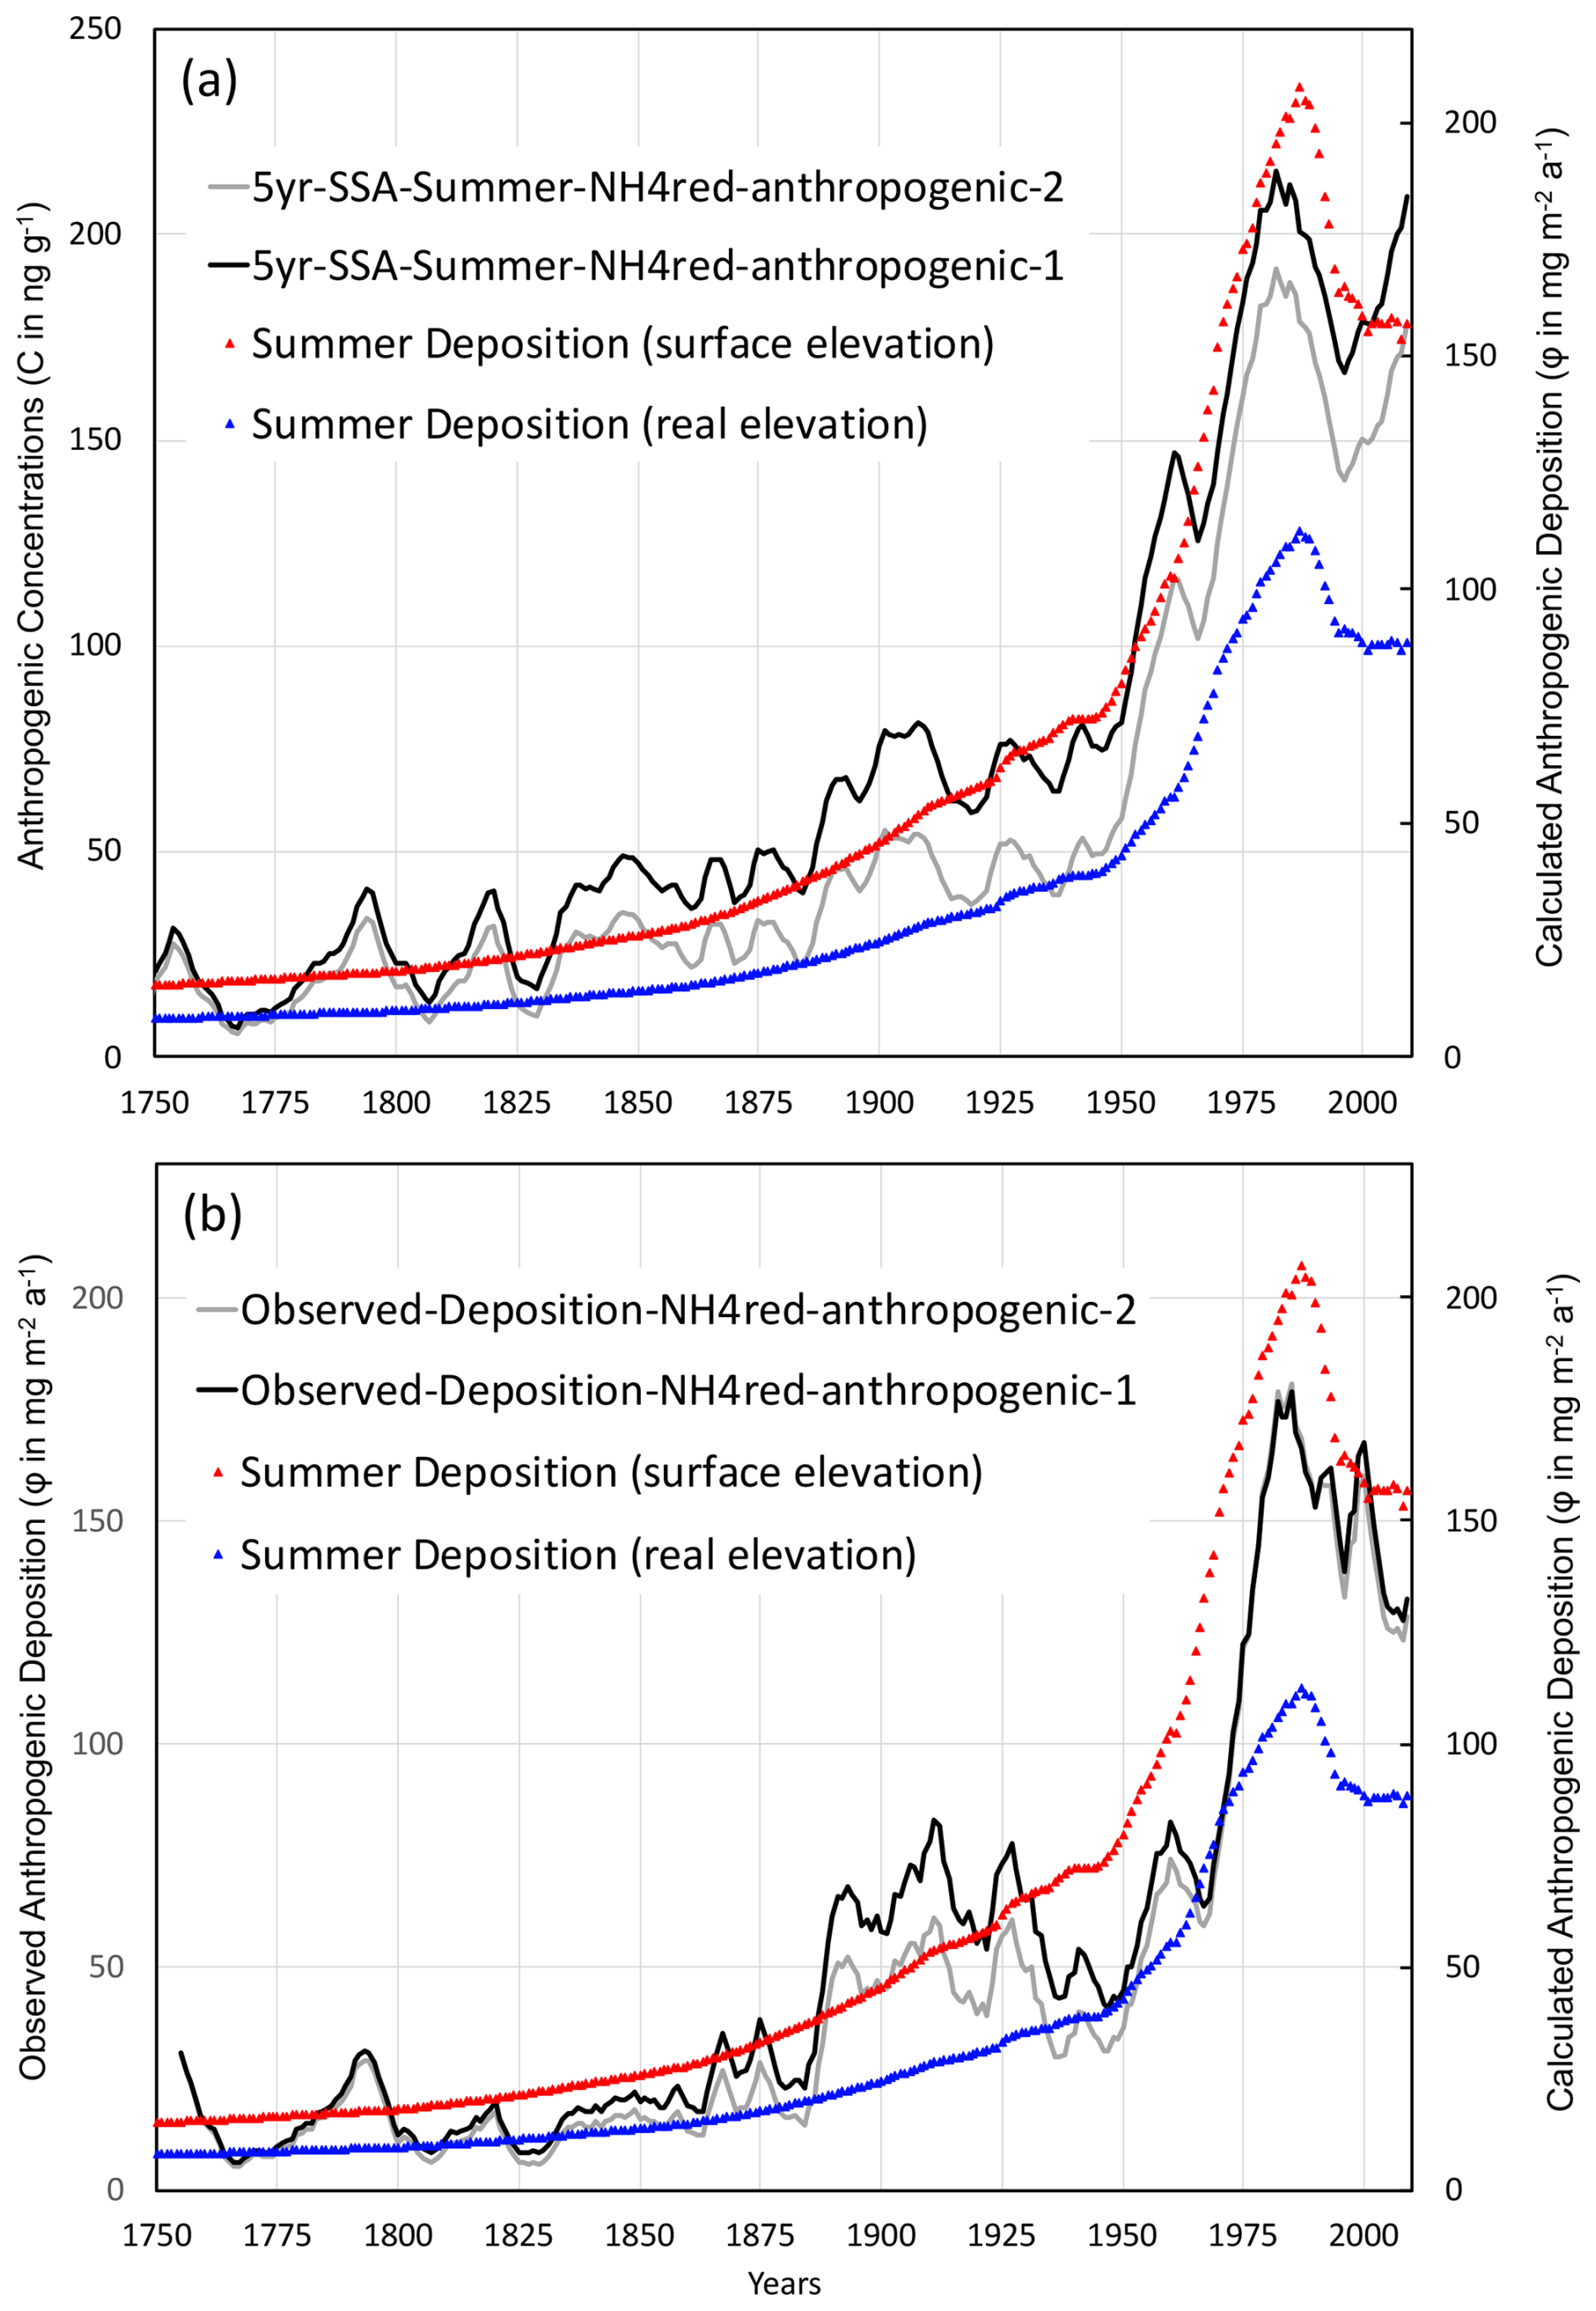
Figure 7(a) The summer smoothed ice-core trends in NHred concentrations, from which the natural level applying the assumptions detailed in Sect. 4 (denoted anthropogenic-1 and anthropogenic-2) was subtracted, and deposition fluxes at ELB calculated by FLEXPART (real and surface elevation) using estimated past anthropogenic NH3 emissions (CEDS inventories; Hoesly et al. (2018)). (b) Same but for the deposition fluxes observed in ice.
Figure 7a compares the summer trend in NHred in ELB ice to deposition fluxes simulated at the real and surface elevation at the site using past anthropogenic emissions of NH3 from CEDS. The summer ice-core trend is characterized by an increase that remained limited to ∼ 0.1 % yr−1 from 1750 to ∼ 1850 CE. The increase strengthened slightly from 1850 to 1950 CE (∼ 0.2 % yr−1) and became pronounced after ∼ 1950 CE (∼ 2.8 % yr−1 between 1950 and 1988 CE). By 1988 CE, concentrations reached a maximum of 180 ng g−1 and then decreased again in the early 1990s to reach a plateau at ∼ 165 ng g−1 until 2009 CE. These past changes in NHred ice concentrations are very consistent with past changes in deposition simulated by FLEXPART at both the real and surface elevations of the ELB site. These deposition flux changes reflect past emission changes characterized by the growth of NH3 emissions that took place after World War II in many European countries, with major contributions from Russia, Türkiye, Georgia, and Ukraine. As seen in Fig. 4b, even with weakened emission sensitivities (Fig. 1) due to large NH3 emissions (Fig. 2), other countries located further west, such as Bulgaria, Albania, Hungary, Macedonia, part of Italy, Slovakia, and the Czech Republic, still significantly contribute to the deposition at the ELB site. Furthermore, the maximum in emissions that took place in the late 1980s during the perestroika in the USSR is also well recorded in ELB summer ice. As a result of decreasing NH3 emissions in Russia and Ukraine in 1988–1989 CE (Fig. 2), in the 1990s, Türkiye became the main contributor to NH deposition at the ELB site (Fig. S3).
The preceding comparison between NH ice concentrations and deposition fluxes at the site simulated by FLEXPART using estimates of past anthropogenic NH3 emissions is based on the assumption that ice concentration changes are mainly associated with changes in depositional fluxes and are influenced by both changes in emissions and transport pathways. It also assumes that the conditions for deposition, in particular the precipitation rates at the site, did not change significantly over the time period covered by the record. Information on past precipitation at alpine sites cannot always be derived from the ice-core records because the ice-core annual-layer ice thickness is affected by wind-driven accumulation or erosion and is therefore not consistently representative of past precipitation. Snow redistribution by the wind at the ELB drill site was measured by stakes on the plateau during three field seasons, showing, however, a zero balance between erosion and accumulation there (Mikhalenko et al., 2024) and offering the possibility of reconstructing past accumulation rates over the last 260 years. It was shown that while summer precipitation fluctuated around 0.8±0.5 m w.e., no significant trend was detected from the middle of the 18th century to the beginning of the 21st century. It is therefore not surprising that we observed a rather similar temporal trend in observed ice concentration (Fig. 7a) and observed deposition fluxes, calculated by multiplying ice concentrations by reconstructed summer precipitation rates (Fig. 7b). On average, observed deposition fluxes ranged between depositions calculated by FLEXPART at the model surface (2400 m a.s.l.) and at the real elevation of the site (5115 m a.s.l.), with the deposition at the real elevation being almost only half that at the model surface elevation. The fact that there is good agreement does not imply that FLEXPART accurately simulates the transport and deposition of submicron-scale aerosols at the ELB site since FLEXPART is neglecting the immediate loss of NH3 after emission. This point will be further discussed in Sect. 6. However, it is expected that for an otherwise perfect model, the observed deposition should fall in between the two modelled values since they represent the extreme range of values plausible for the model when considering the differences between real and model topography.
As already seen in Fig. 5, past NH ice concentrations (or calculated deposition fluxes) are linearly correlated with deposition fluxes at the site simulated by FLEXPART. This finding is interesting since FLEXPART calculations consider past changes in NH3 emissions but no changes in the NHx speciation or transport pathways. This linearity between NH deposition and NH3 emissions differs from what was seen at the CDD Alpine site (Fagerli et al., 2007), where the ice record showed increasing NH concentrations by a factor of 3 in summer, whereas NH3 emissions from countries that contribute to deposition at CDD increase only by a factor of 2. Such a higher enhancement of NH levels in Alpine ice than of the NH3 emission input suggested a higher rate of NH aerosol formation over recent decades due to a larger availability of sulfuric and nitric acid resulting from SO2 and NOx emissions, which increased more than NH3 emissions up to 1980 CE in western Europe. As seen in Table 1, although the molar NH3/(SO2+NO2) ratio of emissions in countries impacting ELB and CDD are not very different and cannot explain the difference between the two ice records. That is confirmed by the ice data reported in Table 2, showing similar recent changes in NH, SO, and NO between the two sites. In contrast, Table 2 indicates a larger increase in calcium over the recent decades at ELB than at CDD. As a result, it seems plausible that the larger increase in alkaline dust material at ELB compared to CDD partly neutralized the effect of acidic compounds there. This net effect of changes in acidic species and dust is thus an increase in acidity at CDD but not at ELB. This may have led to a change in the NHx partitioning in summer that favours the formation of NH over the recent decades in the Alps but not in the Caucasus, where the formation of NH remained unchanged over the last 2 centuries.
Table 2Concentrations of major ions and acidity in the Alpine (CDD) and Caucasus (ELB) ice deposited from 1900 to 1930 CE and during the ammonium maximum (1970–1990 CE at CDD, 1980–2000 CE at ELB). Δ refers to the mean changes from 1900–1930 CE relative to the time period of the ammonium maximum. Negative concentrations of H+ reflect alkaline samples.
5.2 Ammonium pollution in winter
As discussed in Sect. 4, the ELB ammonium ice-core trends are less well documented in winter layers. Prior to 1900 CE, the number of samples available to calculate the mean winter half-years is often limited (Fig. 6), rendering inaccurate estimates of mean winter half-year concentrations. This lack of documentation of winter layers also affects the reconstruction of past winter accumulation rates (Mikhalenko et al., 2024), and therefore in the following, we restricted our discussion of winter trends to the years 1900–2009 CE. Over the 20th century, winter concentrations are on average one-fifth of the summer values (Fig. 3). The deposition fluxes calculated by FLEXPART from 1900 to 2009 CE are 40 % and 30 % lower in winter than in summer at the surface and real elevations, respectively (Fig. 4a). The decrease in simulated deposition fluxes from summer to winter is mainly due to higher NH3 emissions in May, and to a lesser extent in September, compared to over the rest of the year in source regions impacting the ELB site (Fig. S4).
As was done for summer (Fig. 7), the observed deposition fluxes calculated by multiplying winter concentrations by reconstructed winter accumulation rates (0.45±0.27 m w.e. instead of 0.86±0.36 m w.e. in summer; Mikhalenko et al., 2024) were compared to the deposition fluxes calculated by FLEXPART at the surface and the real elevation of the site over the 20th century (Fig. 8). While consistent with observations in ice, a marked post-1950 CE increase is simulated by FLEXPART in contrast to what was observed in summer: the course of post-1950 CE changes matched poorly between ice observations and FLEXPART simulations. Furthermore, simulated φ FLEXPART deposition fluxes are far larger than those observed in ice (Fig. 8b). For instance, between 1950 and 2009 CE, the deposition fluxes observed in ice were some 4 and 6 times lower than simulated deposition at the real and surface elevations, respectively. Such a discrepancy may have several causes, including an overestimation of NH3 emissions in winter, incorrect FLEXPART simulations of the inversion layers that are frequent in winter, or an underestimation of the observed winter deposition due to winter snow being blown away at the ELB site. These questions will be discussed further in the following section.
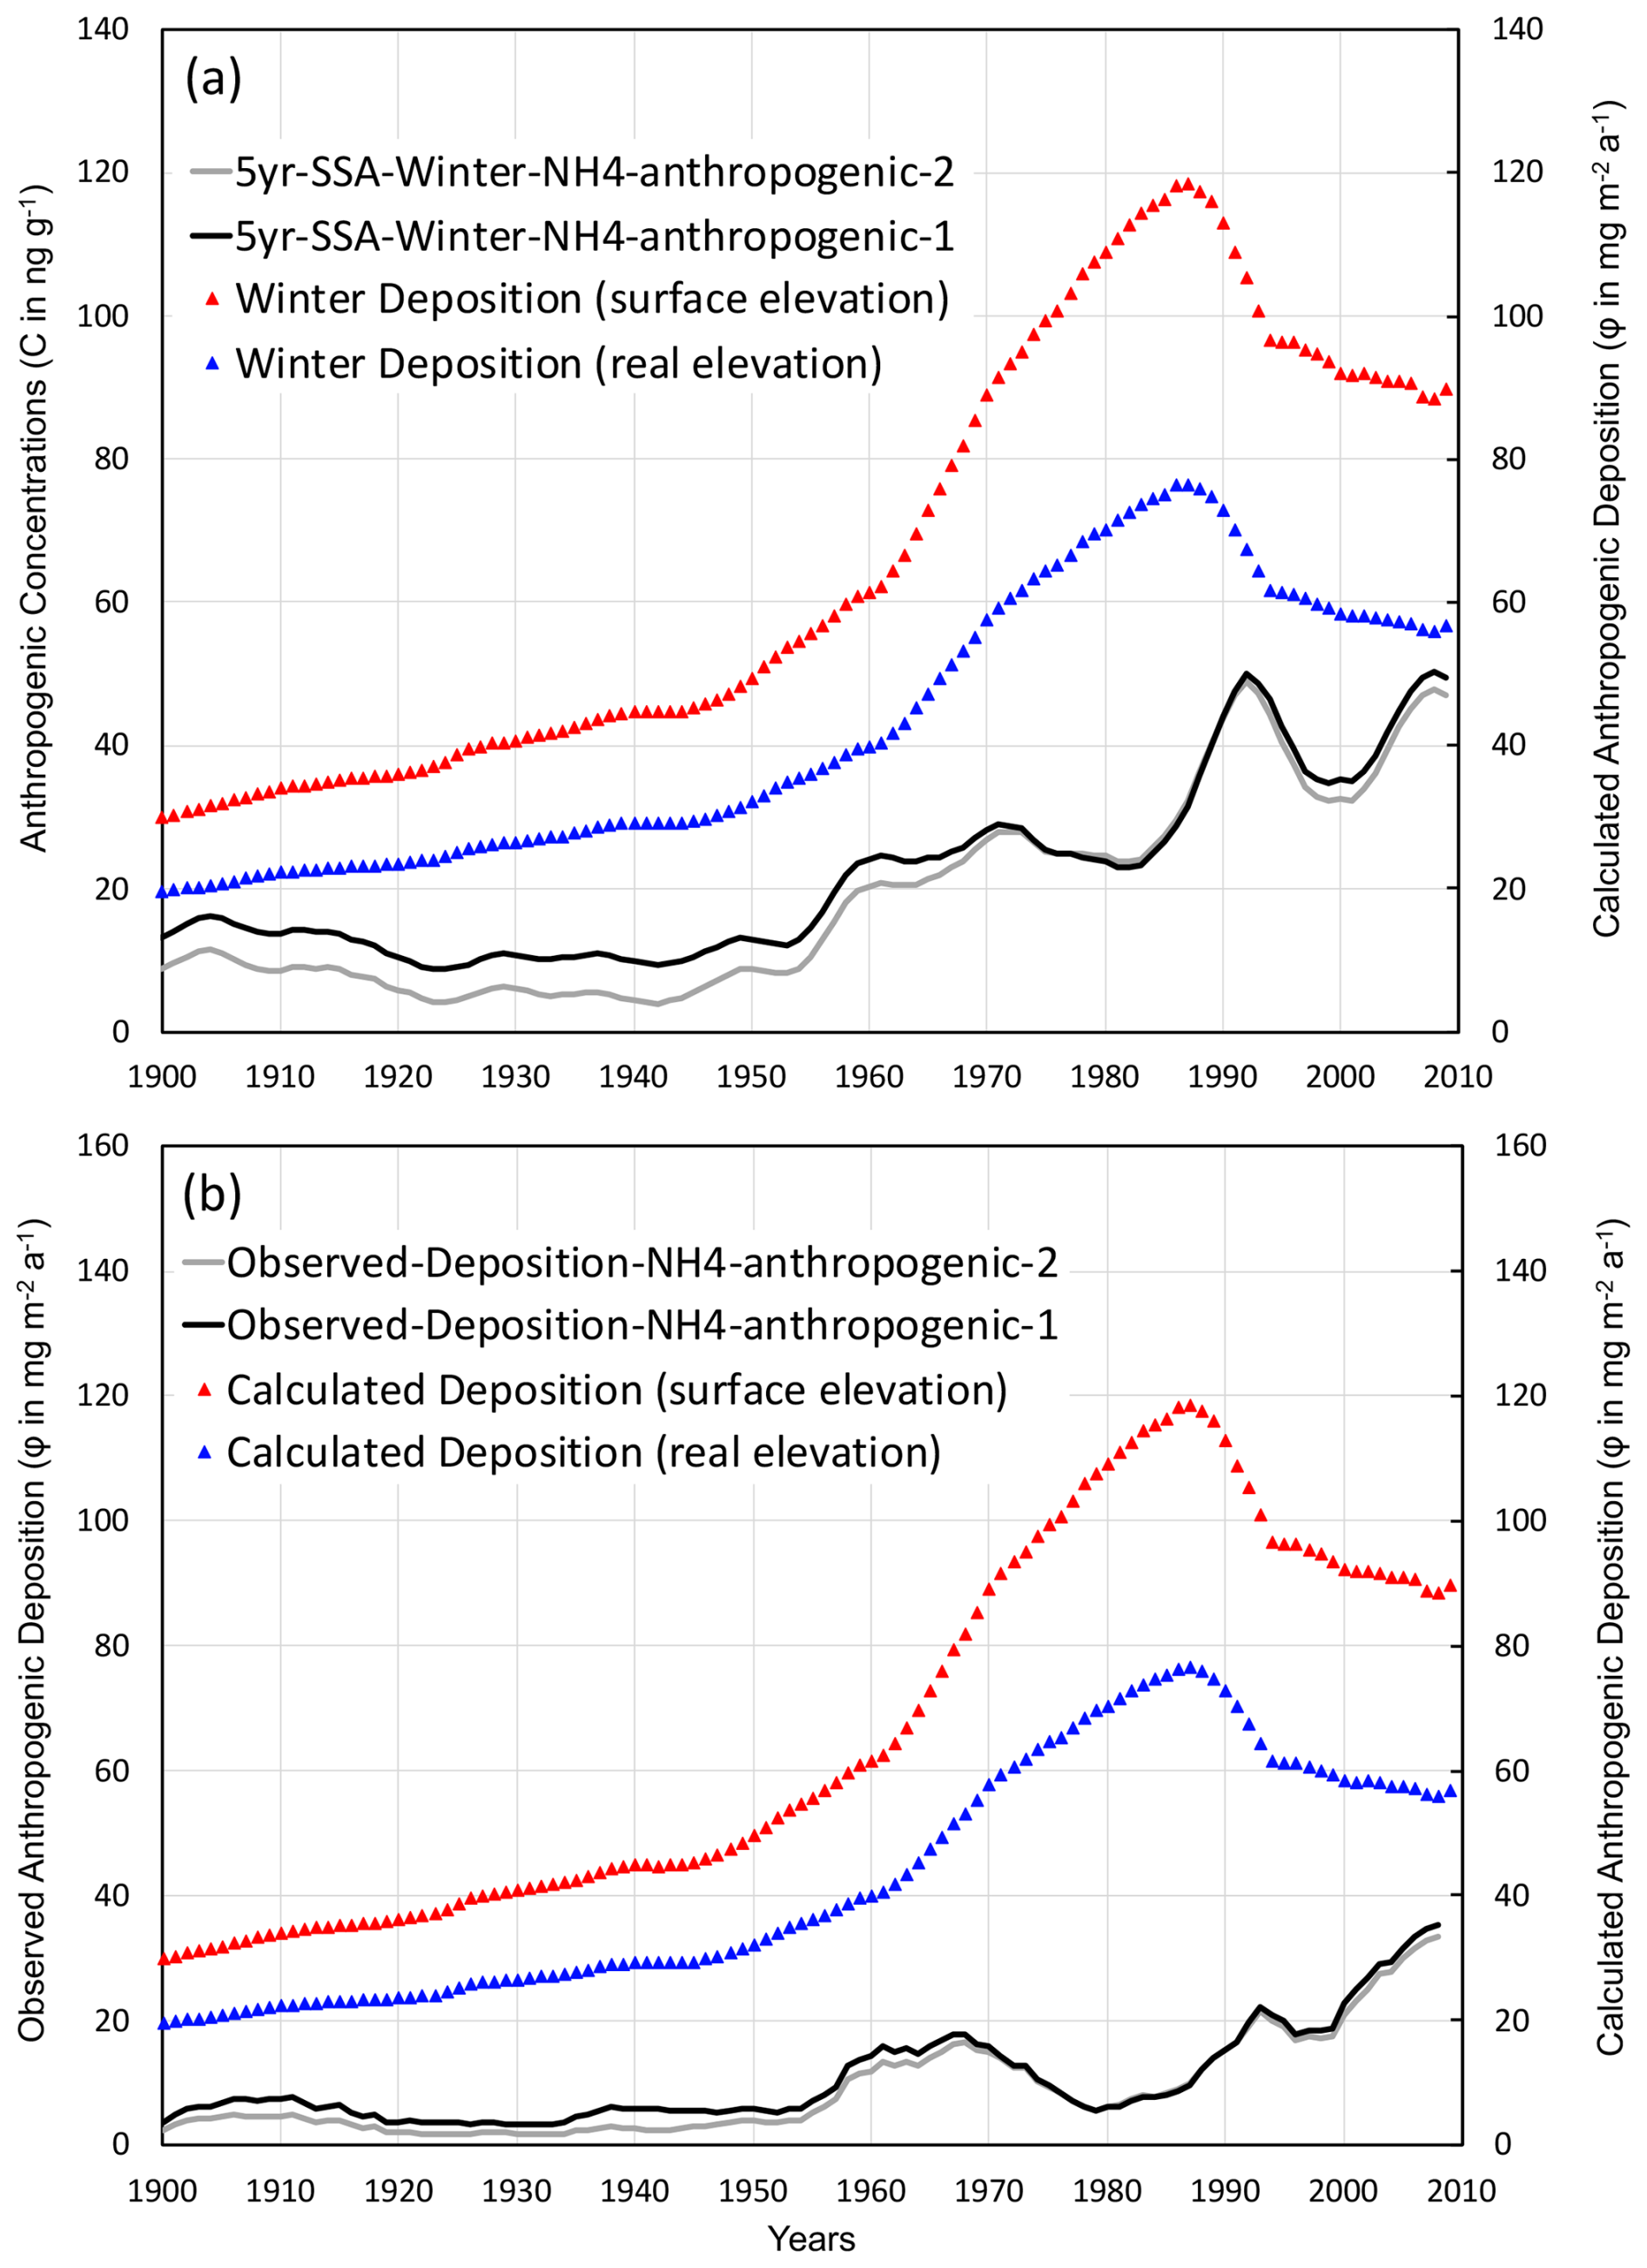
Figure 8(a) The winter smoothed ice-core trends in NH concentrations, from which the natural level applying the assumptions detailed in Sect. 4 (denoted anthropogenic-1 and anthropogenic-2) was subtracted, and deposition fluxes at ELB calculated by FLEXPART (real and surface elevation) using estimated past anthropogenic NH3 emissions (CEDS inventories; Hoesly et al. (2018)). (b) Same but for the deposition fluxes observed in ice.
To evaluate the bias in simulated deposition fluxes of ammonium from FLEXPART due to the non-consideration of NH3 loss, we tested the FLEXPART model for sulfate deposition using SO2 emissions that, similar to NH3 emissions, would overestimate the sulfate deposition. Although for both species we expect an overestimate of simulated deposition fluxes, historical SO2 emissions are better documented than those of NH3 (Hoesly et al., 2018). The better knowledge about anthropogenic emissions of SO2 compared to those of NH3 may also help us to further discuss the large difference between observed and simulated NH deposition in winter (Sect. 5.2). Seasonally resolved ELB ice-core trends were already available for sulfate (Preunkert et al., 2019) and were recently compared to a state-of-the-art of chemistry–transport model (an earth system model (ESM); Moseid et al., 2022).
As was done for NH, we compare trends in observed anthropogenic concentrations and deposition of SOred to past deposition calculated by FLEXPART using SO2 inventories. In summer, concentration and deposition of SOred remained nearly unchanged from 1750 to ∼ 1900 CE and increased modestly at a rate of 3.5 % yr−1 between 1900 and 1950 CE. The increase then accelerated until approximately the middle of the 1980s (12 % yr−1), followed by a strong decrease from the early 1990s to 2009 CE (11 % yr−1; Fig. 9). The observed well-marked 1980–1992 CE maxima are very consistent with the maximum of deposition simulated by FLEXPART using past SO2 emissions from south-eastern European countries. The maximum of sulfur pollution in these regions occurred slightly later than in western Europe and was also impacted by the consequences of the perestroika at the end of the 1980s.
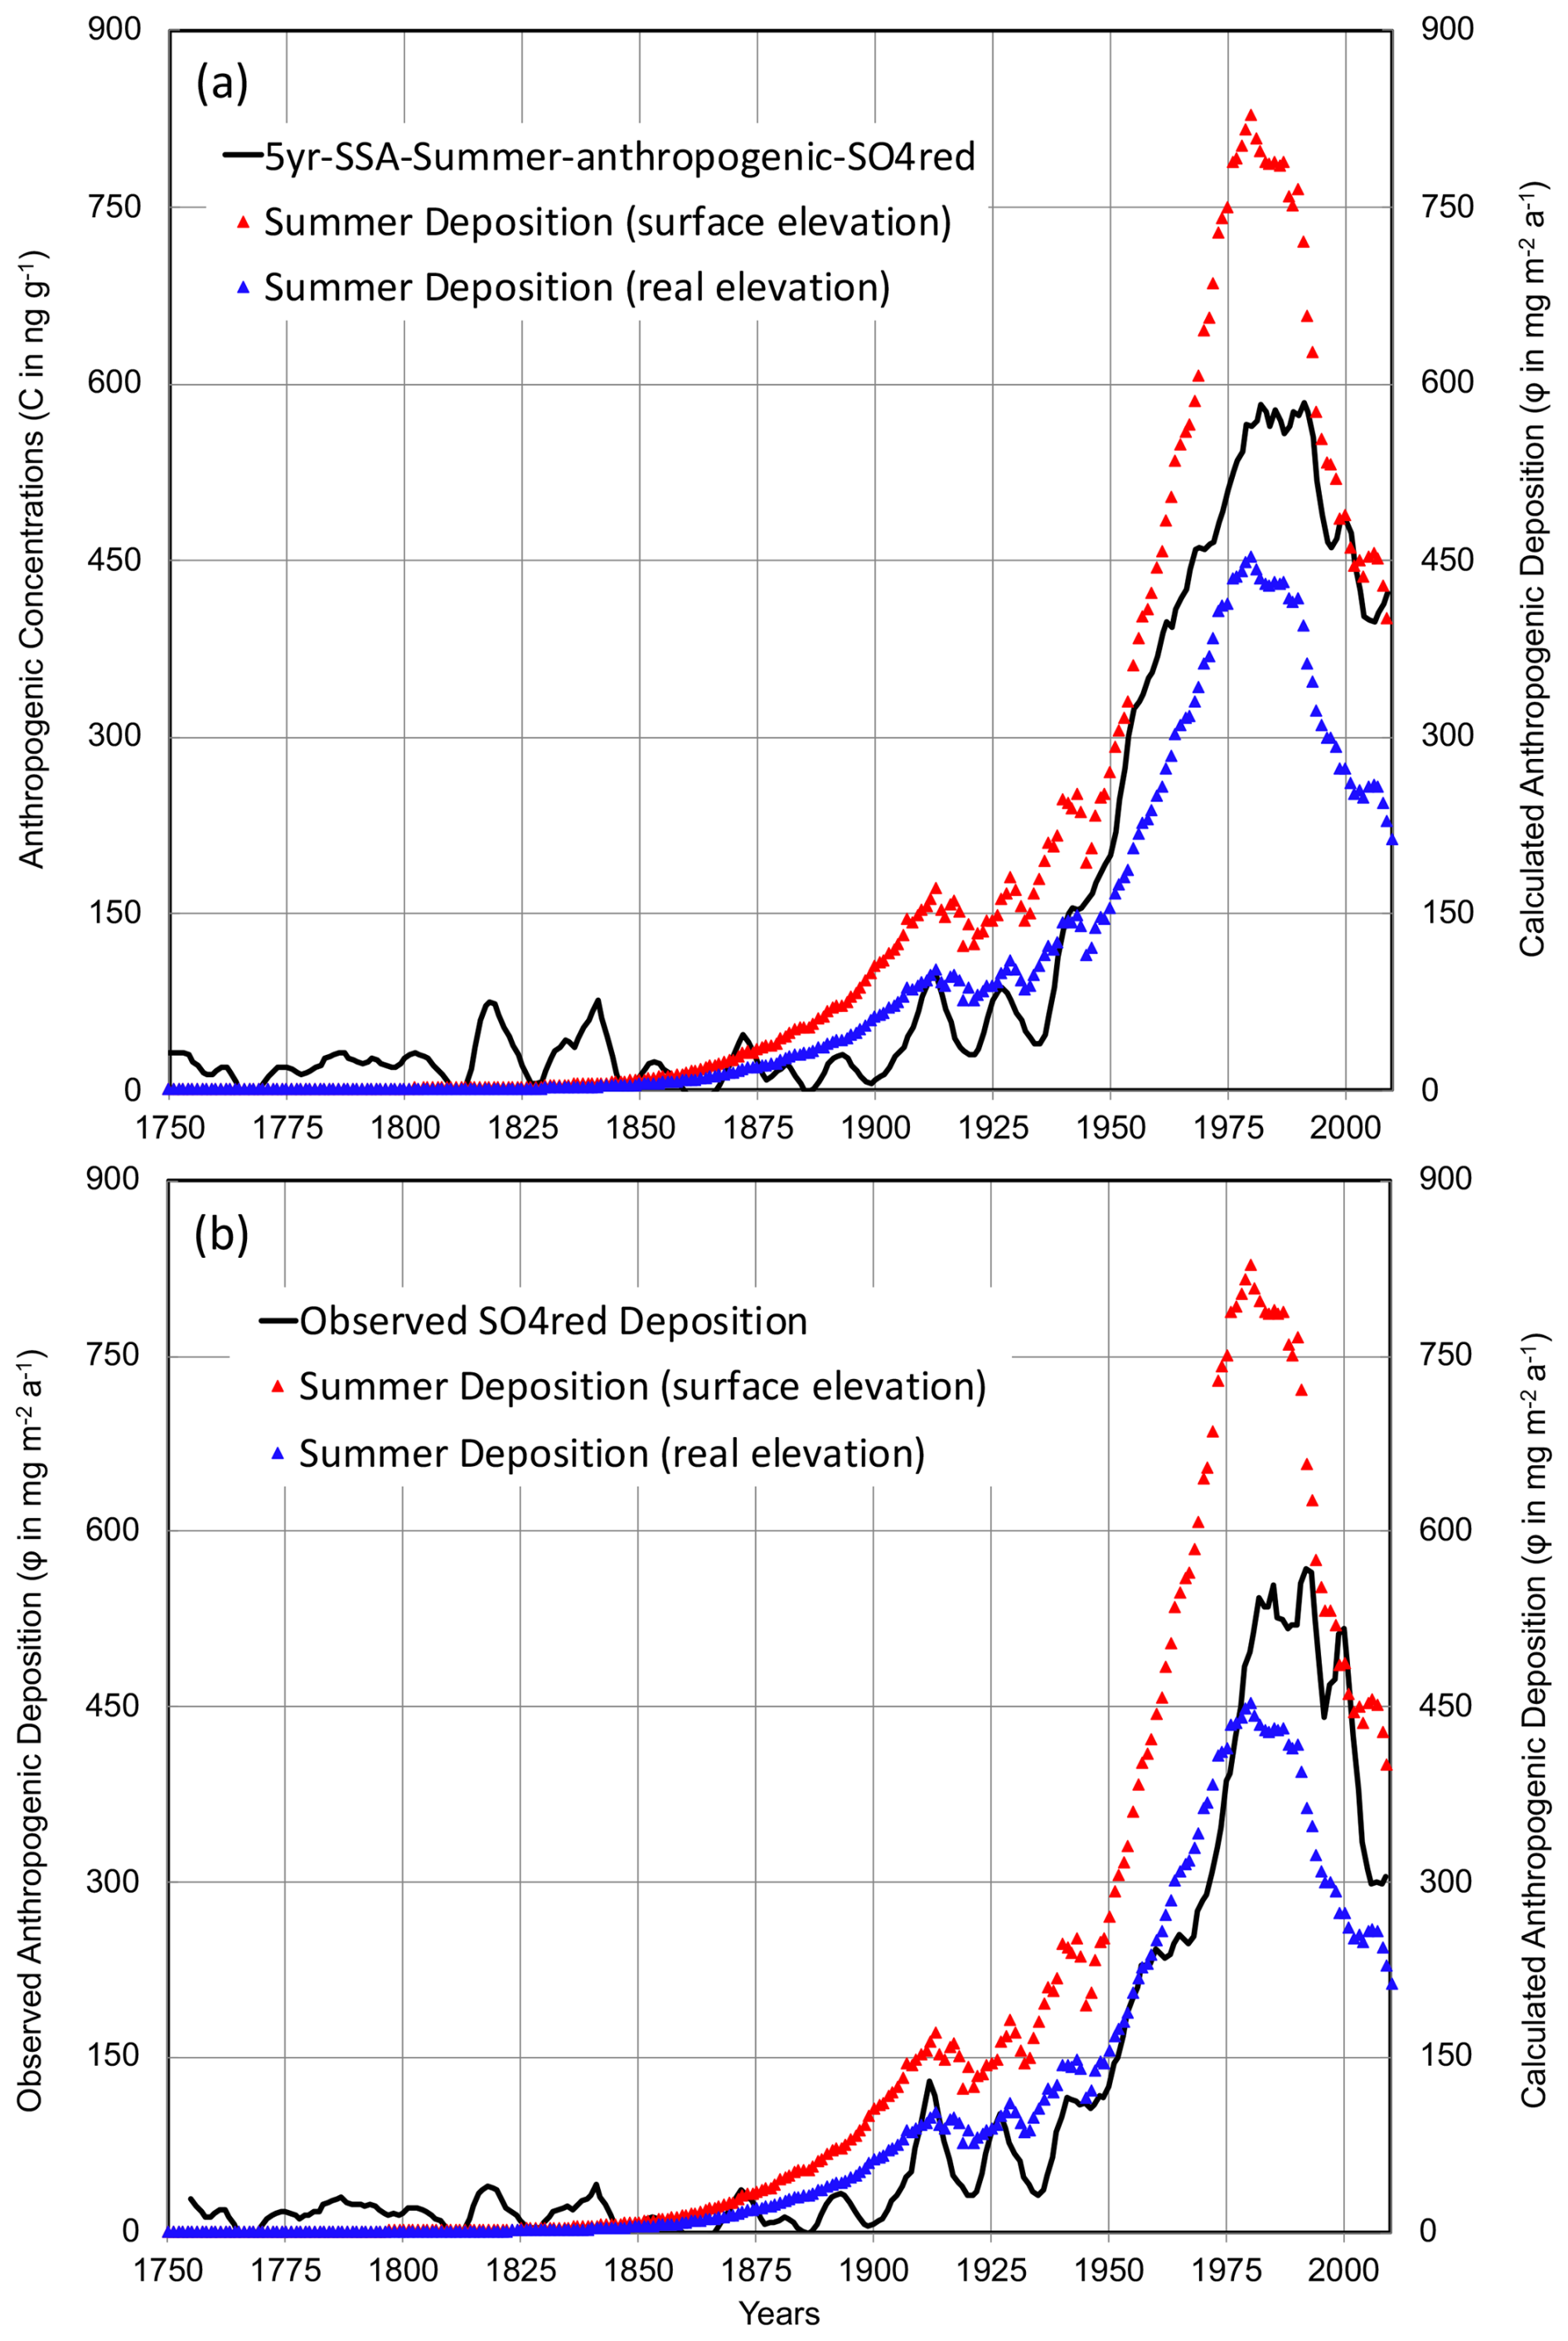
Figure 9(a) The summer smoothed ice-core trends in SOred concentrations, from which the natural level (90 ng g−1; Sect. 6) was subtracted, and deposition fluxes at ELB calculated by FLEXPART (real and surface elevation) using estimated past anthropogenic SO2 emissions (CEDS inventories; Hoesly et al. (2018)). (b) Same but for the deposition fluxes observed in ice.
Despite the differences in the timing, from 1750 to 2009 CE, the observed SOred and NHred deposition fluxes generally remained close to the FLEXPART-simulated depositions calculated at the real and model elevations of the site. More precisely, considering first the recent 1980–2009 CE time period that overlaps with the years 1980–2019 CE of the FLEXPART simulations, the observed deposition of 470 mg m−2 yr−1 lies between simulated depositions at the model (610 mg m−2 yr−1) and real (340 mg m−2 yr−1) elevations. A similar finding is observed for NHred deposition fluxes, with an observed value of 154 mg m−2 yr−1 compared to 178 and 98 mg m−2 yr−1 from simulations (Fig. 9). From ∼ 1950 to 1980 CE, observed depositions were closer to the deposition simulated at the real elevation for both ammonium and sulfate. This similar decrease in observed deposition with respect to the 1980–2009 CE simulations would suggest a decrease in atmospheric transport towards the site by the middle of the 20th century, compared to recent decades. This comparison between ammonium and sulfate over the recent decades suggests that the losses of NH3 and SO2 that may bias the FLEXPART results are of similar magnitudes.
Finally, at the beginning of the 20th century, simulated depositions were higher than observations for NHred but not for SOred. The larger uncertainties in calculating the anthropogenic NHred deposition over the middle of the 20th century (Fig. 7) did not seem large enough to explain this finding. This suggests that either SO2 emissions in south-eastern Europe were slightly underestimated or, more likely, those of NH3 were overestimated.
In winter, the SOred deposition fluxes observed in ice deposited between 1950 and 2009 CE were some 5 and 7.5 times lower than simulated depositions at the real and surface elevations, respectively (Fig. 10). The differences between observed and simulated depositions are similar for sulfate and ammonium, and we can therefore rule out the hypothesis that NH3 emissions in winter were overestimated. Rather, these differences may be a result of deficiencies in the FLEXPART simulations, e.g. related to an under-representation of wintertime atmospheric inversion layers in the meteorological input data that would hinder vertical transport or related to an underestimation of the observed winter deposition due to winter snow being blown away at the ELB site. Incorrect FLEXPART simulations of inversion layers that are frequent in winter or an underestimation of the observed winter deposition due to winter snow being blown away at the ELB site could be the causes of this common sulfate and ammonium discrepancy between observations and simulations. Field analyses of summer and winter accumulation at the ELB site have shown that while in summer, snow accumulation is evenly distributed over the plateau (Mikhalenko et al., 2024), a relocation of winter snow was observed, with a net loss in the southern and western parts of the plateau and a net accumulation in the northern and eastern parts of the plateau, mainly due to the local topography. Although the drill site is located between these two areas, a loss of winter snow rendering unrepresentative winter ammonium means, as well as an underestimation of winter snow accumulation (and observed deposition), is possible. Further long-term field observations based on stake measurements, for instance, would permit us to better evaluate this effect.
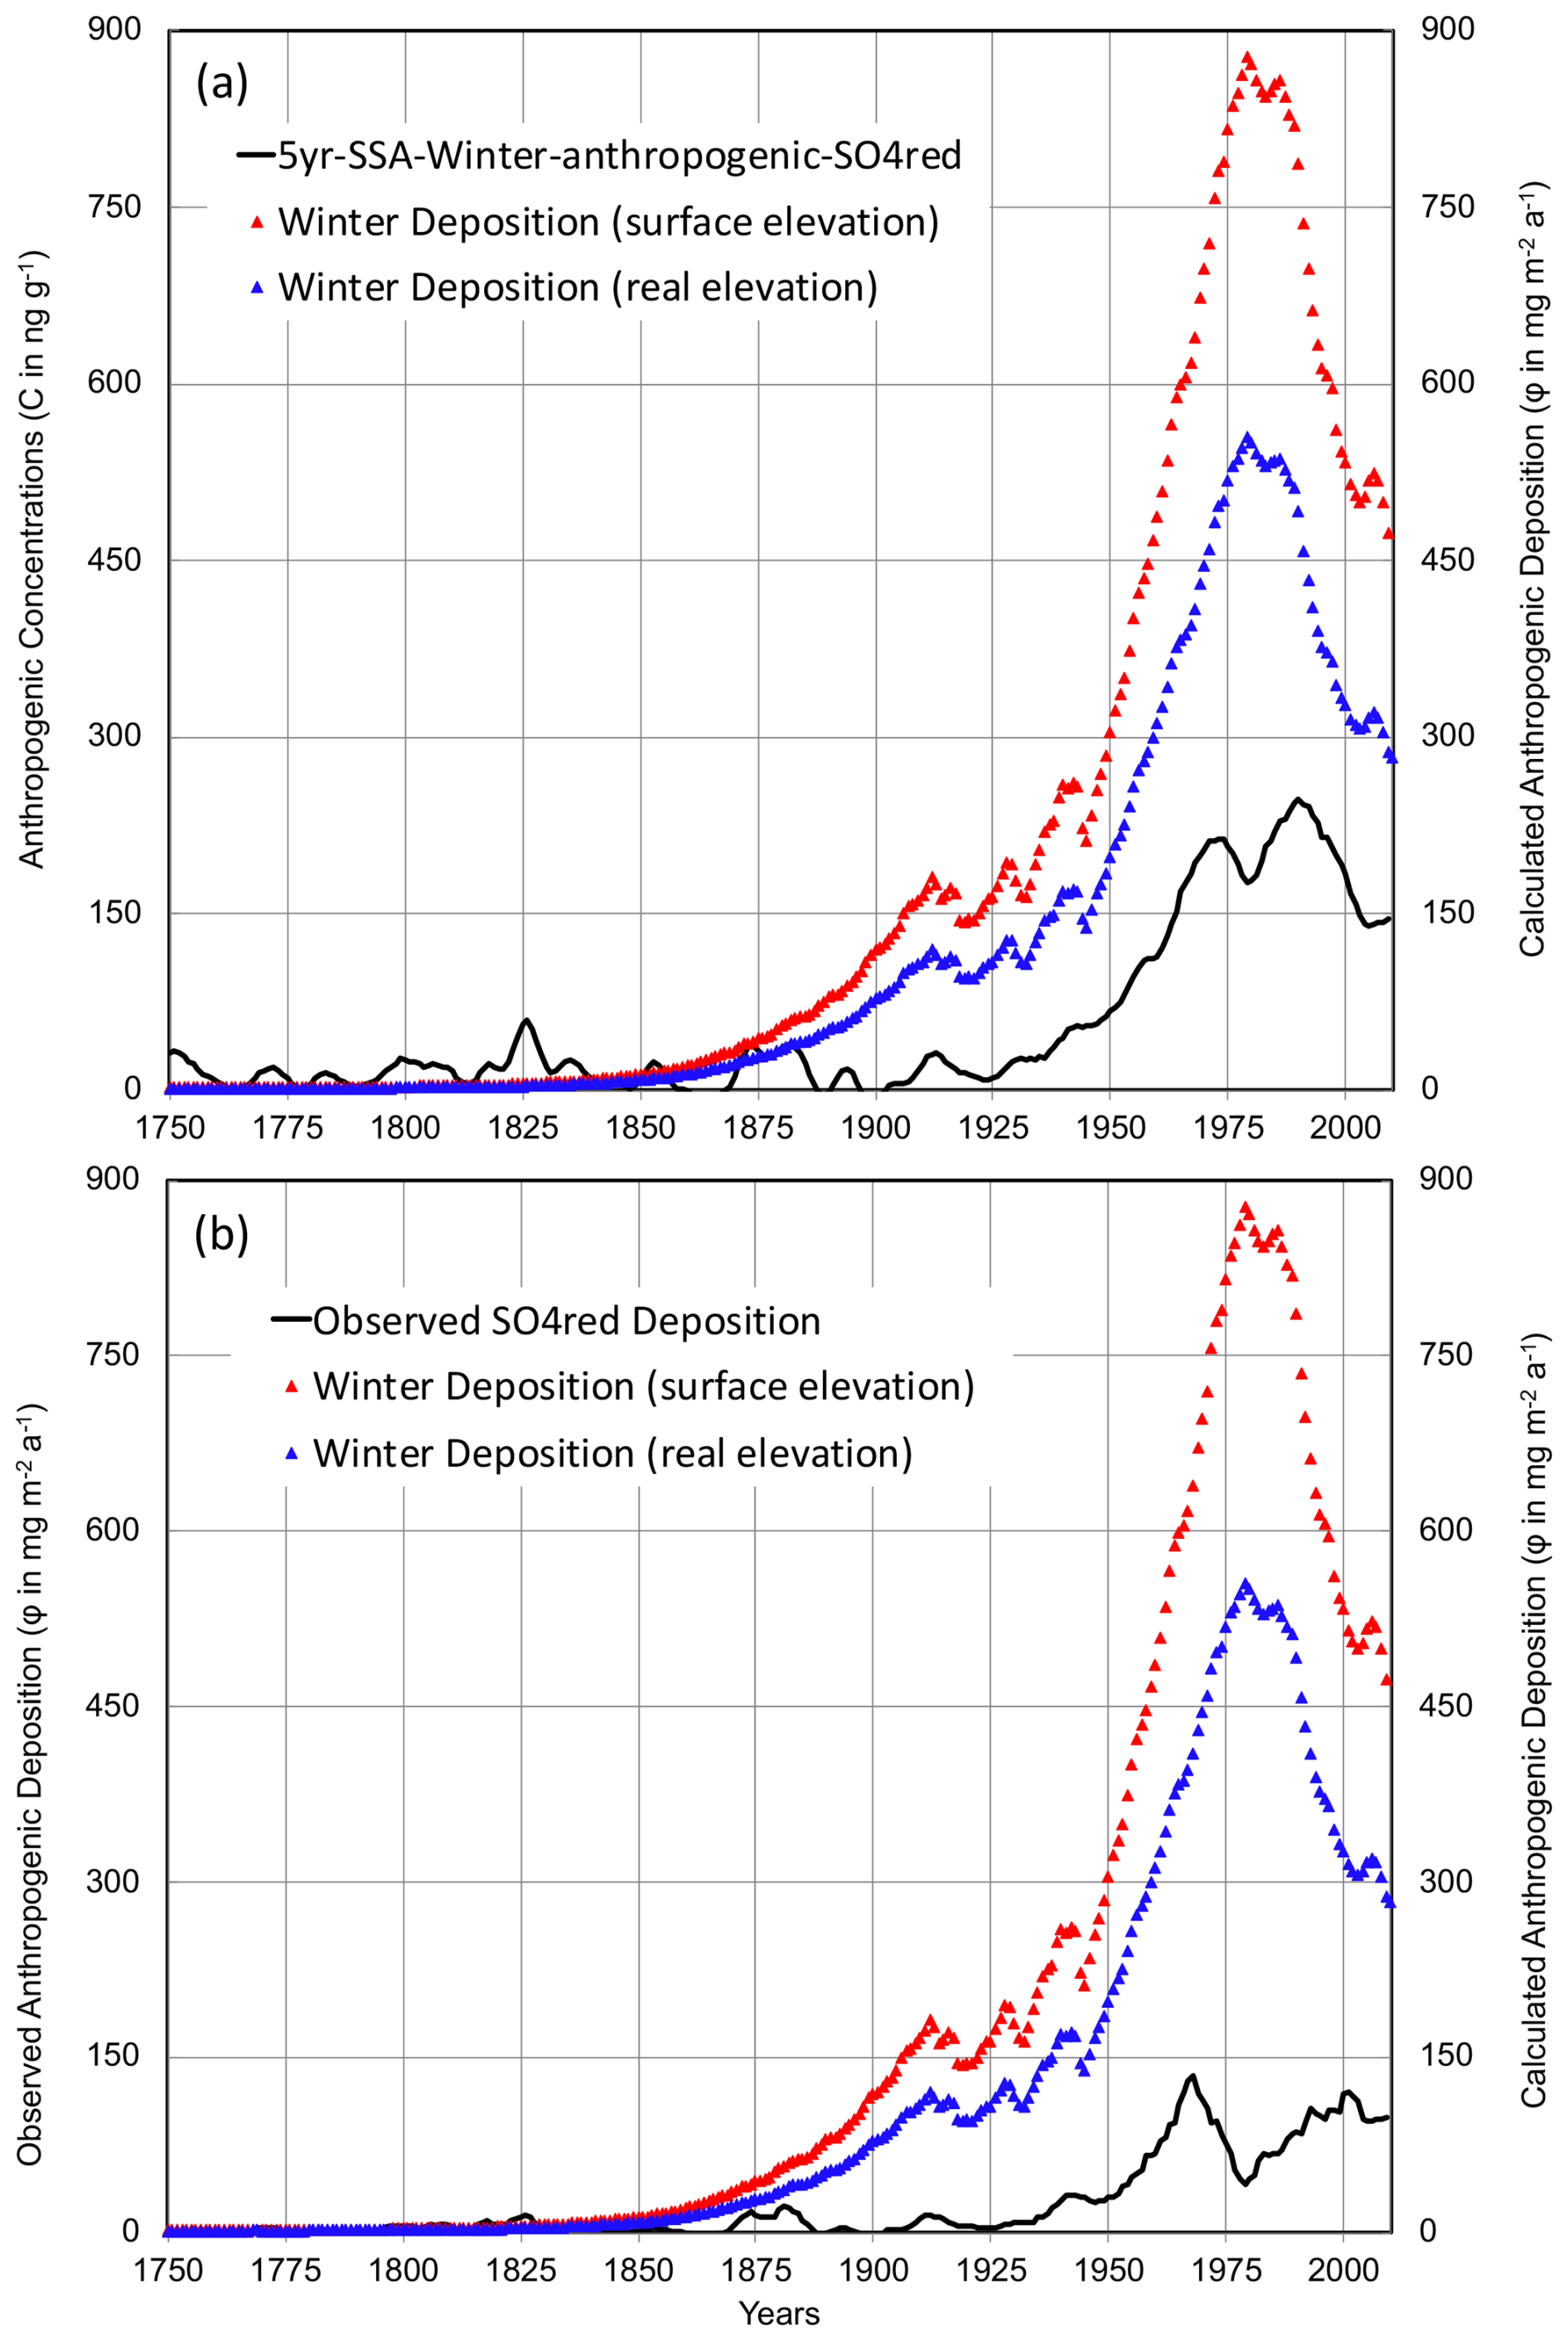
Figure 10(a) The winter smoothed ice-core trends in SO concentrations, from which the natural level (50 ng g−1; Sect. 6) was subtracted, and deposition fluxes at ELB calculated by FLEXPART (real and surface elevation) using estimated past anthropogenic SO2 emissions (CEDS inventories; Hoesly et al. (2018)). (b) Same but for the deposition fluxes observed in ice.
A record of ammonium covering the years 1750–2008 CE was extracted from a 182 m long ice core drilled in 2009 CE at Mount Elbrus in the Caucasus, Russia. With respect to previous studies conducted in the Alps in relation to pollution in western Europe since 1850 CE, this study permitted us to investigate ammonia pollution in south-eastern Europe and to do so well before the onset of the industrial period in 1850 CE. The NH ice-core record indicates a 3.5-fold increase in concentrations: from 34±7 ng g−1 between 1750 and 1830 CE and 49±14 ng g−1 between 1830 and 1950 CE to a maximum close to 120 ng g−1 in 1989 CE, followed by a plateau at ∼ 115 ng g−1 until 2009 CE. Another interesting finding is that the NH level of 35 ng g−1 in 1750 CE is close to the natural level of 25 ng g−1. Representing some 20 % of the 1980–2009 CE level, this natural level indicates a significant contribution of natural sources to the NH3 budget, contrasting with present-day conditions when agricultural activity strongly outweighs biogenic emissions from the natural soil in Europe. Focusing on the summer season, simulations using the FLEXPART atmospheric transport of submicron-scale aerosol using estimated past anthropogenic NH3 emissions in Europe are in good agreement with ice-core data and indicated that the main contributions came from south European Russia, Türkiye, Georgia, and Ukraine. Although FLEXPART simulations did not consider changes in the NHx partitioning over the past, we find that in contrast to what was observed in western Europe, the observed NH deposition was linearly related to simulated NH deposition and thus, NH3 emissions. This suggests that in these regions, the recent increase in atmospheric dust counteracted the effect of growing emissions of SO2 and NO, limiting enhanced formation and long-range transport of ammonium salts. Transport–chemistry model simulations are welcome to further evaluate NH ice-core records, but they would require consideration of growing SO2 and NO emissions, as well as dust aerosol and its heterogeneous interactions with acidic species and NH3. Finally, the ice-core trends are less documented for winter than for summer. A better understanding of past ammonium changes in winter motivates the search for another glacier site in the Caucasus that has possibly experienced better preservation of winter snow (less wind erosion). Overall, this work on historical NH3 emission trends provides valuable information for atmospheric and environmental science, especially in the context of increasing agricultural practices and climate change.
Ammonium concentration data are available at https://doi.org/10.5281/zenodo.12549687 (Legrand et al., 2024).
The supplement related to this article is available online at: https://doi.org/10.5194/acp-25-1385-2025-supplement.
The paper was written by ML, MV, and SK, with contributions from AP, AS, SE, SP, VM, MaV, and AK. The ice-core chemistry records were produced by SP and ML. MV and DB calculated aerosol deposition fluxes. AP, AS, and SE calculated sensitivity by FLEXPART. All authors read and discussed the manuscript and contributed to improving the final paper.
The contact author has declared that none of the authors has any competing interests.
Publisher's note: Copernicus Publications remains neutral with regard to jurisdictional claims made in the text, published maps, institutional affiliations, or any other geographical representation in this paper. While Copernicus Publications makes every effort to include appropriate place names, the final responsibility lies with the authors.
We thank all the people who provided support at all stages of the work, participated in the field work, and carried out the sampling and analytical processing of the ice core.
The ice-core recovery in 2009 CE was supported by RFBR grants 07-05-00410 and 09-05-10043. The study was completed in the laboratory created within the Megagrant Project (agreement no. 075-15-2021-599 of 8 June 2021). Publisher's note: the article processing charges for this publication were not paid by a Russian or Belarusian institution.
This paper was edited by Amos Tai and reviewed by three anonymous referees.
HYDE: Agricultural area over the long-term, PBL Netherlands Environmental Assessment Agency, “History Database of the Global Environment 3.3” [original data], https://ourworldindata.org/grapher/total-agricultural-area-over-the-long-term (last access: 29 March 2024), 2023.
Asman, W. A. H., Sutton, M. A., and Schjoerring, J. K.: Ammonia: emission, atmospheric transport and deposition, New Phytol., 139, 27-48, https://doi.org/10.1046/j.1469-8137.1998.00180.x, 1998.
Buijsman, E., Mass, H. F. M., and Asman, W. A. H.: Anthropogenic NH3 emissions in Europe, Atmos. Environ., 21, 1009–1022, https://doi.org/10.1016/0004-6981(87)90230-7, 1987.
Dentener, F. J., Carmichael, G. R., Zhang, Y., Lelieveld, J., and Crutzen P. J.: Role of mineral aerosol as a reactive surface in the global troposphere, J. Geophys. Res.-Atmos., 101, 22869–22889, https://doi.org/10.1029/96JD01818, 1996.
Eckhardt, S., Cassiani, M., Evangeliou, N., Sollum, E., Pisso, I., and Stohl, A.: Source–receptor matrix calculation for deposited mass with the Lagrangian particle dispersion model FLEXPART v10.2 in backward mode, Geosci. Model Dev., 10, 4605–4618, https://doi.org/10.5194/gmd-10-4605-2017, 2017.
Engardt, M., Simpson, D., Schwikowski, M., and Granat, L.: Deposition of sulphur and nitrogen in Europe 1900–2050. Model calculations and comparison to historical observations, Tellus B, 69, 1328945, https://doi.org/10.1080/16000889.2017.1328945, 2017.
Fagerli, H., Legrand, M., Preunkert, S., Vestreng, V., Simpson, D., and Cerqueira, M.: Modeling historical long-term trends of sulfate, ammonium, and elemental carbon over Europe: A comparison with ice core records in the Alps, J. Geophys. Res.-Atmos., 112, D23S13, https://doi.org/10.1029/2006jd008044, 2007.
Galloway, J., Dentener, F., Boyer, E., Howarth, R., Seitzinger, S., Asner, G., Cleveland, C., Green, P., Holland, E., Karl, D., Michaels, A., Porter, J., Townsend, A.R., and Vöosmarty, C.: Nitrogen cycles: past, present, and future, Biogeochemistry, 70, 153–226, https://doi.org/10.1007/s10533-004-0370-0, 2004.
Galloway, J. N., Aber, J. D., Erisman, J. W., Seitzinger, S. P., Howarth, R. W., Cowling, E. B., and Cosby, B. J.: The nitrogen cascade, Bioscience, 53, 341-356, https://doi.org/10.1641/0006-3568(2003)053[0341:TNC]2.0.CO;2, 2003.
Hersbach, H., Bell, B., Berrisford, P., Hirahara, S., Horanyi, A., Muñoz-Sabater, J., Nicolas, J., Peubey, C., Radu, R., Schepers, D., Simmons, A., Soci, C., Abdalla, S., Abellan, X., Balsamo, G., Bechtold, P., Biavati, G., Bidlot, J., Bonavita, M., Chiara, G., Dahlgren, P., Dee, D., Diamantakis, M., Dragani, R., Flemming, J., Forbes R.B., Fuentes, M., Geer, A., Haimberger, L., Healy, S. B., Hogan, R. J., Hólm, E., Janisková, M., Keeley, S., Laloyaux, P., Lopez, P., Lupu, C., Radnoti, G., de Rosnay, P., Rozum, I., Vamborg, F. S. E., and Villaume, S.: The ERA5 global reanalysis, Q. J. Roy. Meteor. Soc., 146, 1999–2049, https://doi.org/10.1002/qj.3803, 2020.
Hoesly, R. M., Smith, S. J., Feng, L., Klimont, Z., Janssens-Maenhout, G., Pitkanen, T., Seibert, J. J., Vu, L., Andres, R. J., Bolt, R. M., Bond, T. C., Dawidowski, L., Kholod, N., Kurokawa, J.-I., Li, M., Liu, L., Lu, Z., Moura, M. C. P., O'Rourke, P. R., and Zhang, Q.: Historical (1750–2014) anthropogenic emissions of reactive gases and aerosols from the Community Emissions Data System (CEDS), Geosci. Model Dev., 11, 369–408, https://doi.org/10.5194/gmd-11-369-2018, 2018.
Johnson, M., Sanders, R., Avgoustidi, V., Lucas, M., Brown, L., Hansell, D., Moore, M., Gibb, S., Liss, P., and Jickells, T.: Ammonium accumulation during a silicate-limited diatom bloom indicates the potential for ammonia emission events, Mar. Chem., 106, 63–75, https://doi.org/10.1016/j.marchem.2006.09.006, 2007.
Kutuzov, S., Shahgedanova, M., Mikhalenko, V., Ginot, P., Lavrentiev, I., and Kemp, S.: High-resolution provenance of desert dust deposited on Mt. Elbrus, Caucasus in 2009–2012 using snow pit and firn core records, The Cryosphere, 7, 1481–1498, https://doi.org/10.5194/tc-7-1481-2013, 2013.
Kutuzov, S., Legrand, M., Preunkert, S., Ginot, P., Mikhalenko, V., Shukurov, K., Poliukhov, A., and Toropov, P.: The Elbrus (Caucasus, Russia) ice core record – Part 2: history of desert dust deposition, Atmos. Chem. Phys., 19, 14133–14148, https://doi.org/10.5194/acp-19-14133-2019, 2019.
Legrand, M., Preunkert, S., May, B., Guilhermet, J., Hoffman, H., and Wagenbach, D.: Major 20th century changes of the content and chemical speciation of organic carbon archived in Alpine ice cores: Implications for the long-term change of organic aerosol over Europe, J. Geophys. Res.-Atmos., 118, 3879–3890, https://doi.org/10.1002/jgrd.50202, 2013.
Legrand, M., Vorobyev, M., Kutuzov, S., Preunkert, S.: Elbrus Ice Core, Caucasus record of ammonia (NH4+), Zenodo [data set], https://doi.org/10.5281/zenodo.12549687, 2024.
Mikhalenko, V., Sokratov, S., Kutuzov, S., Ginot, P., Legrand, M., Preunkert, S., Lavrentiev, I., Kozachek, A., Ekaykin, A., Faïn, X., Lim, S., Schotterer, U., Lipenkov, V., and Toropov, P.: Investigation of a deep ice core from the Elbrus western plateau, the Caucasus, Russia, The Cryosphere, 9, 2253–2270, https://doi.org/10.5194/tc-9-2253-2015, 2015.
Mikhalenko, V., Kutuzov, S., Toropov, P., Legrand, M., Sokratov, S., Chernyakov, G., Lavrentiev, I., Preunkert, S., Kozachek, A., Vorobiev, M., Khairedinova, A., and Lipenkov, V.: Accumulation rates over the past 260 years archived in Elbrus ice core, Caucasus, Clim. Past, 20, 237–255, https://doi.org/10.5194/cp-20-237-2024, 2024.
Moseid, K. O., Schulz, M., Eichler, A., Schwikowski, M., McConnell, J. R., Olivieì, D., Criscitiello, A. S., Kreutz, K. J., and Legrand, M.: Using ice cores to evaluate CMIP6 aerosol concentrations over the historical era, J. Geophys. Res.-Atmos., 127, e2021JD036105, https://doi. org/10.1029/2021JD036105, 2022.
Paulot, F., Jacob, D. J., Johnson, M. T., Bell, T. G., Baker, A. R., Keene, W. C., Lima, I. D., Doney, S. C., and Stock, C. A.: Global oceanic emission of ammonia: Constraints from seawater and atmospheric observations, Global Biogeochem. Cy., 29, 1165–1178, https://doi.org/10.1002/2015GB005106, 2015.
Preunkert, S. and Legrand, M.: Towards a quasi-complete reconstruction of past atmospheric aerosol load and composition (organic and inorganic) over Europe since 1920 inferred from Alpine ice cores, Clim. Past, 9, 1403–1416, https://doi.org/10.5194/cp-9-1403-2013, 2013.
Preunkert, S., Legrand, M., Kutuzov, S., Ginot, P., Mikhalenko, V., and Friedrich, R.: The Elbrus (Caucasus, Russia) ice core record – Part 1: reconstruction of past anthropogenic sulfur emissions in south-eastern Europe, Atmos. Chem. Phys., 19, 14119–14132, https://doi.org/10.5194/acp-19-14119-2019, 2019.
Simpson, D., Winiwarter, W., Börjesson, G., Cinderby, S., Ferreiro, A., Guenther, A., Hewitt, C. N., Janson, R., Khalil, M. A. K., Owen, S., Pierce, T. E., Puxbaum, H., Shearer, M., Skiba, U., Steinbrecher, R., Tarrasoìn, L., and Öquist, M. G.: Inventorying emissions from nature in Europe, J. Geophys. Res., 104, 8113–8152, https://doi.org/10.1029/98JD02747 1999.
Simpson, D., Andersson, C., Christensen, J. H., Engardt, M., Geels, C., Nyiri, A., Posch, M., Soares, J., Sofiev, M., Wind, P., and Langner, J.: Impacts of climate and emission changes on nitrogen deposition in Europe: a multi-model study, Atmos. Chem. Phys., 14, 6995–7017, https://doi.org/10.5194/acp-14-6995-2014, 2014.
Skjøth, C. A. and Geels, C.: The effect of climate and climate change on ammonia emissions in Europe, Atmos. Chem. Phys., 13, 117–128, https://doi.org/10.5194/acp-13-117-2013, 2013.
Sutton, M. A., Place, C. J., Eager, M., Fowler, D., and Smith, R. I.: Assessment of the magnitude of ammonia emissions on the United Kingdom, Atmos. Environ., 29, 1393–1411, https://doi.org/10.1016/1352-2310(95)00035-W, 1995.
Sutton, M. A., Reis, S., Riddick, S. N., Dragosits, U., Nemitz, E., Theobald, M. R., Tang, Y. S., Braban, C. F., Vieno, M., Dore, A. J., Mitchell, R.F., Wanless, S., Daunt, F., Fowler, D., Blackall, T. D., Milford, C., Flechard, C. R., Loubet, B., Massad, R., Cellier, P., Personne, E., Coheur, P. F., Clarisse, L., Van Damme, M., Ngadi, Y., Clerbaux, C., Skjøth, C. A., Geels, C., Hertel, O., Wichink, K. R. J., Pinder, R. W., Bash, J. O., Walker, J. T., Simpson, D., Horváth, L., Misselbrook, T. H., Bleeker, A., Dentener, F., and de Vries, W.: Towards a climate-dependent paradigm of ammonia emission and deposition, Philos. T. R. Soc. B, 368, 20130166, https://doi.org/10.1098/rstb.2013.0166, 2013.
Usher, C. R., Michel, A. E., and Grassian, V. H.: Reactions on Mineral Dust, Chem. Rev., 103, 4883–4940, https://doi.org/10.1021/cr020657y, 2003.
Van Pul, A., Hertel, O., Geels, C., Dore, A. J., Vieno, M., Van Jaarsveld, H. A., Bergström, R., Scheep, M., and Fagerli, H.: Modelling of the atmospheric transport and deposition of ammonia at a national and regional scale, in: Atmospheric Ammonia: Detecting emission changes and environmental impacts, edited by: Sutton, M. A., Reis, S., and Baker, S. M. H., Springer, 301–358, https://doi.org/10.1007/978-1-4020-9121-6, 2009.
- Abstract
- Introduction
- Materials and methods
- Ice-core data presentation
- The natural ammonium level
- The anthropogenic ammonium trend
- Comparison between observations and FLEXPART simulations for sulfate
- Conclusions
- Data availability
- Author contributions
- Competing interests
- Disclaimer
- Acknowledgements
- Financial support
- Review statement
- References
- Supplement