the Creative Commons Attribution 4.0 License.
the Creative Commons Attribution 4.0 License.
 | 22 Oct 2025
Speciated volatile organic compounds and hydroxyl radical reactivity characteristics of evaporation emissions from China VI and China V in-use light-duty gasoline vehicles
Liuwei Kong
Yu Wang
Sihua Lu
Shengrong Lou
Wenxin Zhou
Xinping Yang
Yan Ding
Yi Liu
Mengdi Song
Shuyu He
Kai Wang
Feng Wang
Xiaocen Shi
Jian Wang
Yun Zou
Chaofan Lian
Hefan Liu
Miao Feng
Xiaoya Dou
Limin Zeng
Yuanhang Zhang
Vehicle evaporation emission is one of the important sources of volatile organic compounds (VOCs) in the atmosphere. Research on its emission factors and chemical composition, especially the emissions from in-use vehicles under the new regulatory standards, is still scarce and affects the understanding of evaporation emissions. In this work, evaporative emission measurement for in-use gasoline vehicles was carried out for the China VI and China V vehicles, and their emission factors, chemical compositions and hydroxyl radical total reactivity (kOH) were measured. These three evaporative emission processes, hot soak loss (HSL), diurnal breathing loss (DBL) 24 h, and DBL 48 h emission factors, China V vehicles can reach 3.2, 4.6 and 7.6 times that of China VI vehicles, and high mileage vehicle aging and abnormal evaporative emission control systems can significantly increase emissions. In the HSL process, aromatics dominate, with contributions from China VI and China V reaching 44.1 % and 42.8 %, followed by light carbon alkanes (LC-alkanes, ≤ C6). In the DBL process, the chemical components were dominated by LC-alkanes, contributing 40.7 %–50.5 %. The source profiles of evaporative emissions have been established, with n-butane (3.2 %–26.1 %), isopentane (6.2 %–13.5 %), toluene (6.1 %– 16.0 %) being the more important components. It was also discovered that n-pentane/ethane and methyl tert-butyl ether/benzene with can be used to discriminate the sources of evaporative emissions and exhaust. The kOH analysis revealed that branched chain alkenes (BC-alkenes), linear alkenes and aromatics were the most reactive components, such as mainly 2-methyl-2-butene, 2-methyl-1-butene, trans-2-pentene and toluene etc. The measurement of BC-alkenes has expanded our understanding of highly reactive components. It is necessary to strengthen the measurement of high reactivity alkenes, especially BC-alkenes, in future research.
- Article
(2386 KB) - Full-text XML
-
Supplement
(2912 KB) - BibTeX
- EndNote


VOCs are precursors of ozone and secondary organic aerosols, and have significant impacts on air pollution and human health (Li et al., 2019; Guan et al., 2021). Gasoline vehicles are an important source of VOCs emissions which originate mainly from exhaust and evaporative emission processes (Song et al., 2018; Li et al., 2022; Liu et al., 2017; Yan et al., 2021). In recent years, with the update of emission standards, the VOCs emissions from vehicle exhaust have decreased significantly, and the problem of evaporative emissions has gradually become prominent. For example, in 2016, China's vehicle evaporative emissions and exhaust emissions contributed 73 % and 27 % respectively (Yan et al., 2021). Meanwhile, for the vehicle emission factors, the current evaporative emission factor is also significantly greater than the exhaust emission factor (Liu et al., 2015; Zhu et al., 2017; Rodríguez et al., 2019). The annual emission factors of China VI and China V vehicles are 62 and 190 g yr−1 in exhaust emissions, respectively, while they are 284 and 412 g yr−1 in evaporative emissions, respectively (Li et al., 2024). Therefore, evaporative emissions from vehicles have become an important source of VOCs emissions from vehicles. The main processes of evaporative emissions from vehicles are hot soak loss (HSL), diurnal breathing loss (DBL), and running loss etc. (Liu et al., 2015). HSL refers to the emissions during the parking period of a vehicle after driving for a period (one hour after turning off the engine); DBL refers to the situation where the headspace pressure of the fuel tank changes due to temperature fluctuations between day and night, resulting in the emission of headspace vapor; running loss refers to the evaporative emissions during vehicle operation.
From the perspective of evaporative emission factors of vehicles in the fleet, E4 (the European regulations) vehicles are significantly higher than T2 (the United States regulations) vehicles, for example, when DBL24 (emissions on the first day after parking), E4 and T2 were 0.834 and 0.297 g d−1, respectively. This difference was mainly due to differences in the vehicle's evaporative emission control system, with significant differences in control efficiency (Liu et al., 2015). For vehicles with Chinese standards, China V vehicles (equivalent to E4) have an average emission of 0.88 g d−1 in the DBL24, which was also higher than the T2 (Zhu et al., 2022). Research on China VI shows that DBL24 emissions are 0.25 g d−1, significantly lower than the China V standard and close to the emissions results of vehicles in the T2 (Zhu et al., 2022). China vehicle evaporative emissions standard has significantly tightened its evaporative emissions during the China VI standard stage (0.7 g per test) in 2020. The China VI standard has significantly decreased compared to the previous standard (2 g per test). Currently, China VI gasoline vehicles account for 9.9 % of the total emissions of hydrocarbons in China (Ministry of Ecology and Environment, 2024), which implies that most vehicles in the Chinese fleet are in a high emission state under the old regulatory standards. Moreover, the stock of gasoline vehicles accounts for 88.7 % of the Chinese fleet in 2018, while the stock of diesel vehicles accounts for 41.3 % in the European Union in 2015 (Ministry of Ecology and Environment, 2019; Chossière et al., 2018). A higher proportion of gasoline vehicles in the fleet can lead to higher evaporative emissions. Therefore, from the perspective of emission standards and fleet fuel formula, China faces a more severe situation for evaporative emission control compared to the United States and the European Union.
The chemical composition of VOCs emitted by vehicle evaporation mainly consists of alkanes, alkenes, aromatics and oxygenated VOCs (OVOCs) (Man et al., 2020; Liu et al., 2022b). However, there are significant differences in chemical composition understanding in different studies. For example, some studies suggest that the proportion of alkanes in the DBL process reaches 68.5 %–91.6 % (China IV and T2), while others suggest it was 55.3 % (China IV and China V) and 51.1 % (China VI). This difference was mainly due to the different number of species being focused on, with the former testing 57 VOCs and the latter testing 115 VOCs, measuring the number of species directly affects the understanding of the composition of emission components (Yue et al., 2017; Zi et al., 2023). In the study of evaporative emissions, measurement procedures corresponding to national standards are usually used to ensure consistency in measurement methods. However, the fuel formulation is also a factor that affects the chemical composition of evaporative emissions. For example, the use of ethanol gasoline has increased the contribution of low-carbon species (Li et al., 2024). In addition, in the testing of China VI vehicles, there is a significant difference in the contribution results of OVOCs, through comparison, it was found that there are significant differences in fuel formulation and vehicle condition (Liu et al., 2022b; Zi et al., 2023). In the study of gasoline evaporation, branched chain alkenes (BC-alkenes) were considered as important OH radical reactive species in gasoline evaporation (Wu et al., 2015). In addition, emissions of BC-alkenes have also been observed in oil sands facilities, such as 2-methyl-2-butene and 2-methyl-1-butene (Li et al., 2017). Measurement of BC-alkenes emissions was also noted in early studies on evaporative emissions (Liu et al., 2008; Lu et al., 2003; Zhang et al., 2013). However, there are currently few measurements of this species in research on vehicles in China VI and China V. At present, GC-MS/FID (Gas Chromatography-Mass Spectrometry/Flame Ionization Detection) is commonly used for measuring VOCs, with reference gases such as PAMS (Photochemical Assessment Monitoring Stations) and TO-15 (Toxic Organics-15) (Liu et al., 2022b; Zi et al., 2023; Yue et al., 2017). However, there is still insufficient attention paid to the measurement of BC-alkenes, which directly affects the understanding of the evaporation and emission characteristics of China VI and China V vehicles. Therefore, improvements can be made in the measurement method by determining the measurement species based on the characteristics of evaporative emission sources, and obtaining a more comprehensive VOCs emission source profile. Moreover, in terms of emission factors, the DBL24 emissions of in-use vehicle and new vehicle in China V were 5.27 and 0.81 g per test, respectively, indicating that in use vehicles may have significantly increased emissions due to aging vehicle configurations (Liu et al., 2022b). However, previous study has also suggested that the in-use vehicle of China V (DBL24) was 0.55 g per test (Yue et al., 2020). This significant difference in chemical composition and emission factors also lead to inconsistent understanding of evaporative emissions. Improvements can be made in measurement techniques and experimental procedures, such as adding measurement methods, customizing experimental fuel formulation, and selecting test vehicles, to ensure a complete and accurate understanding of evaporation emissions. Therefore, further research is needed on the composition of chemical components and emission factors, especially on the China VI vehicles after the revision of evaporative emission standards, which are still relatively rare compared to vehicle research in China V and before.
In this work, we focus on the emission and chemical reactivity components characteristics of VOCs evaporative emission from gasoline vehicles in-use by China VI and China V vehicles. By utilizing a designed measurement system, and improving VOCs measurement methods, the measurement of reactive species can be achieved. Quantified and evaluated the emission factors and chemical composition of different vehicle models and emission processes, established corresponding evaporative emission source profiles, and identified the key reactive components of evaporative emissions through OH radical reactivity analysis (Lou et al., 2010; Sha et al., 2022). Improved the understanding of VOCs reactive species in the evaporative emissions of China VI and China V vehicles, providing important reference for the emission control and management of vehicle emissions.
2.1 Vehicle testing procedures
The experiment takes light-duty gasoline vehicles as the test objects, all of which was in-use, including a total of 9 vehicles, with 4 China VI vehicles and 5 China V vehicles. More common sedan and sport utility vehicles were chosen, while also considering compact and intermediate car, to reflect the actual composition characteristics of the Chinese fleet as much as possible (Table 1). In the emission standards of China V and previous stages, the implementation of emission limits is consistent (2 g per test), and the test methods from China III to China V were also the same. According to statistical data, hydrocarbons emitted by vehicles in the stages of China III to China V are the main source of emissions for gasoline vehicles (Ministry of Ecology and Environment, 2022, 2024). Therefore, in the experimental design of this study, China V vehicles were used as the vehicles for the previous stage of emission standards for testing, in order to compare with China VI emission stage vehicles. The gasoline used in the experiment was China VI stage 95# gasoline, which was obtained through customization (The composition can refer to Table S1 in the Supplement). This experiment compared different emission stages of vehicle models during testing, so by using a uniform gasoline in the experiment, the influence of emission results caused by differences in gasoline products can be avoided. Evaporative emissions test was carried out in the variable-temperature sealed housing for evaporative determination (SHED, AVL MAGNUM), which can achieve a constant temperature and simulate diurnal temperature changes, meeting the measurement requirements for evaporative emissions. To facilitate the comparison of emission differences among different vehicles, this study adopted a unified test method in the experiment. The pretreatment and testing procedures of the all vehicles in the experiment were based on the China VI stage emission standard method, this ensures the consistency and comparability of the experimental results (Fig. S1a). In addition, we also conducted tests on the China V method, which differs from the China VI method in terms of testing temperature and pre-treatment process, compare the differences in different test methods for China V vehicles (Fig. S1b). After the vehicle undergoes various processes, such as draining gasoline, refueling, pre-treatment driving, draining gasoline and refueling again, carbon canister loading, and high-temperature driving, etc. The carbon canister of the vehicle's evaporative emission system is loaded and breakdown, and the vehicle is soaking in high temperature. After the evaporative emission control system fails, it undergoes a unified driving cycle, activating the carbon canister's adsorption capacity. At this point, it can reflect the actual situation of the vehicle's ability to control evaporative emissions. Based on this state, conducting evaporative emission testing can obtain the true evaporative emission results of the vehicle. After the vehicle is driven at high temperatures, HSL, DBL24 and DBL48 (emissions on the second day after parking) measurement are conducted in the SHED.
Table 1Test vehicle information.
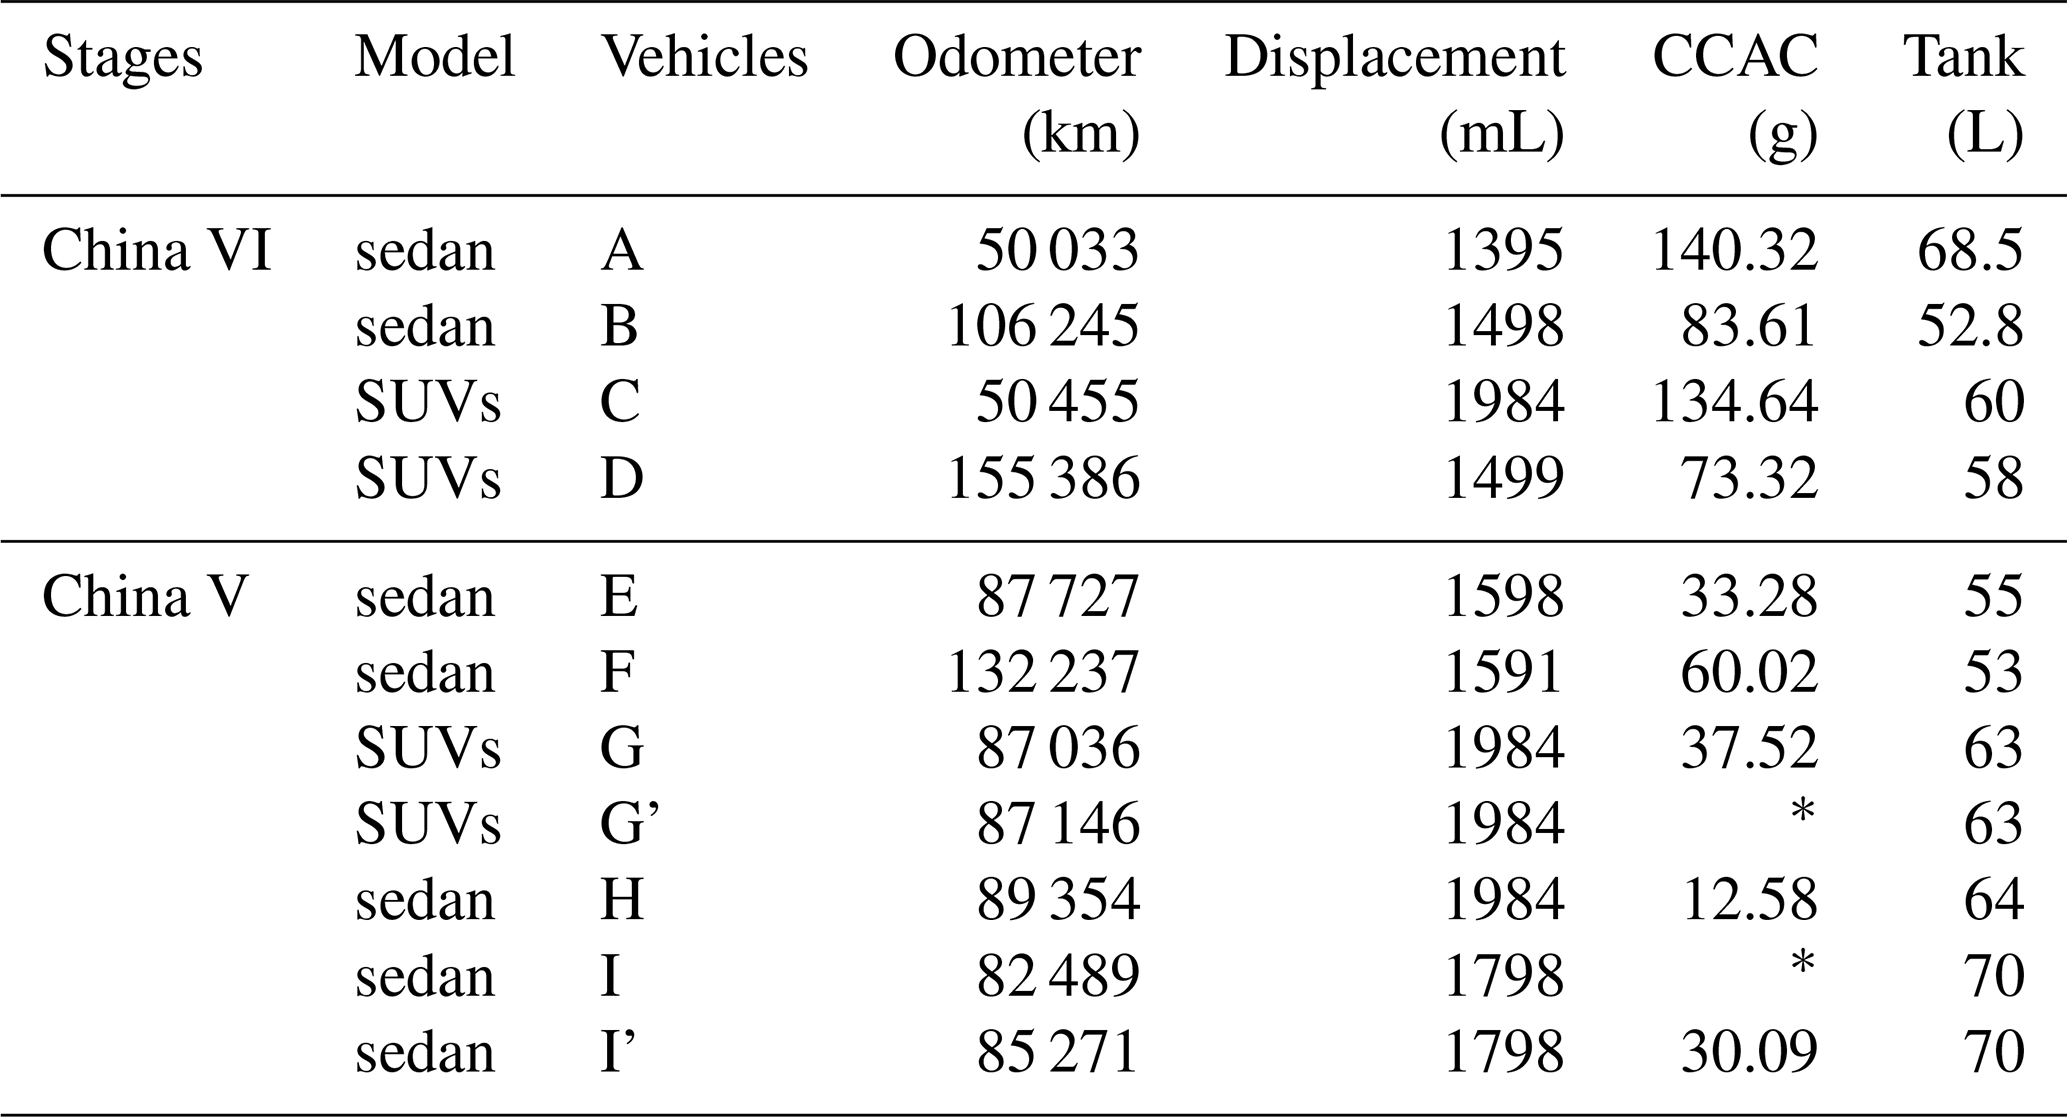
G': Using the China V evaporative emission test method; I': replace the carbon canister of vehicle I; CCAC: carbon canister adsorption capacity; ∗: the loading capacity of the carbon canister cannot be counted, please refer to Sect. 2.1 for details.
In the carbon canister loading process, n-butane was used to load and test the carbon canister adsorption capacity (CCAC). The n-butane loading rate was set to 40 g h−1, and the gas will first pass through the tested carbon canister. A second carbon canister was connected to the tested carbon canister outlet. When the mass of the second carbon canister increases by 2 g, it was considered that the tested carbon canister was fully loaded. At this point, the increase in mass of the tested carbon canister was the CCAC. During the experiment, the carbon canister of vehicle I was clogged due to aging issues during the loading process. After multiple attempts, until the breakdown value of n-butane reaches the breakthrough point of 2 g, the loading was completed. So, vehicle I did not obtain a loading amount that can reflect the actual CCAC. Vehicle G' was subjected to the China V test method, in which the first step is to load the carbon canister. As the vehicle has just completed the China VI test method process (parking time greater than two days), a portion of the gasoline vapor adsorbed in the canister does not have the actual CCAC loading amount, so this test does not focus on the CCAC value. For the HSL sampling schedule, sampling was performed at the beginning and end. DBL was sampled at 0, 24, and 48 h. A total of 11 experimental tests were carried out.
2.2 Sample collection and analysis
To simultaneously characterize the chemical components and OH radical total reactivity (kOH) characteristics of evaporative emissions, we designed an evaporative emission dilution sampling system. Total hydrocarbons (THC), VOCs, inorganic gases, and kOH from evaporative emissions were measured. Figure 1 shows the conceptual diagram of the evaporative emission measurement system.
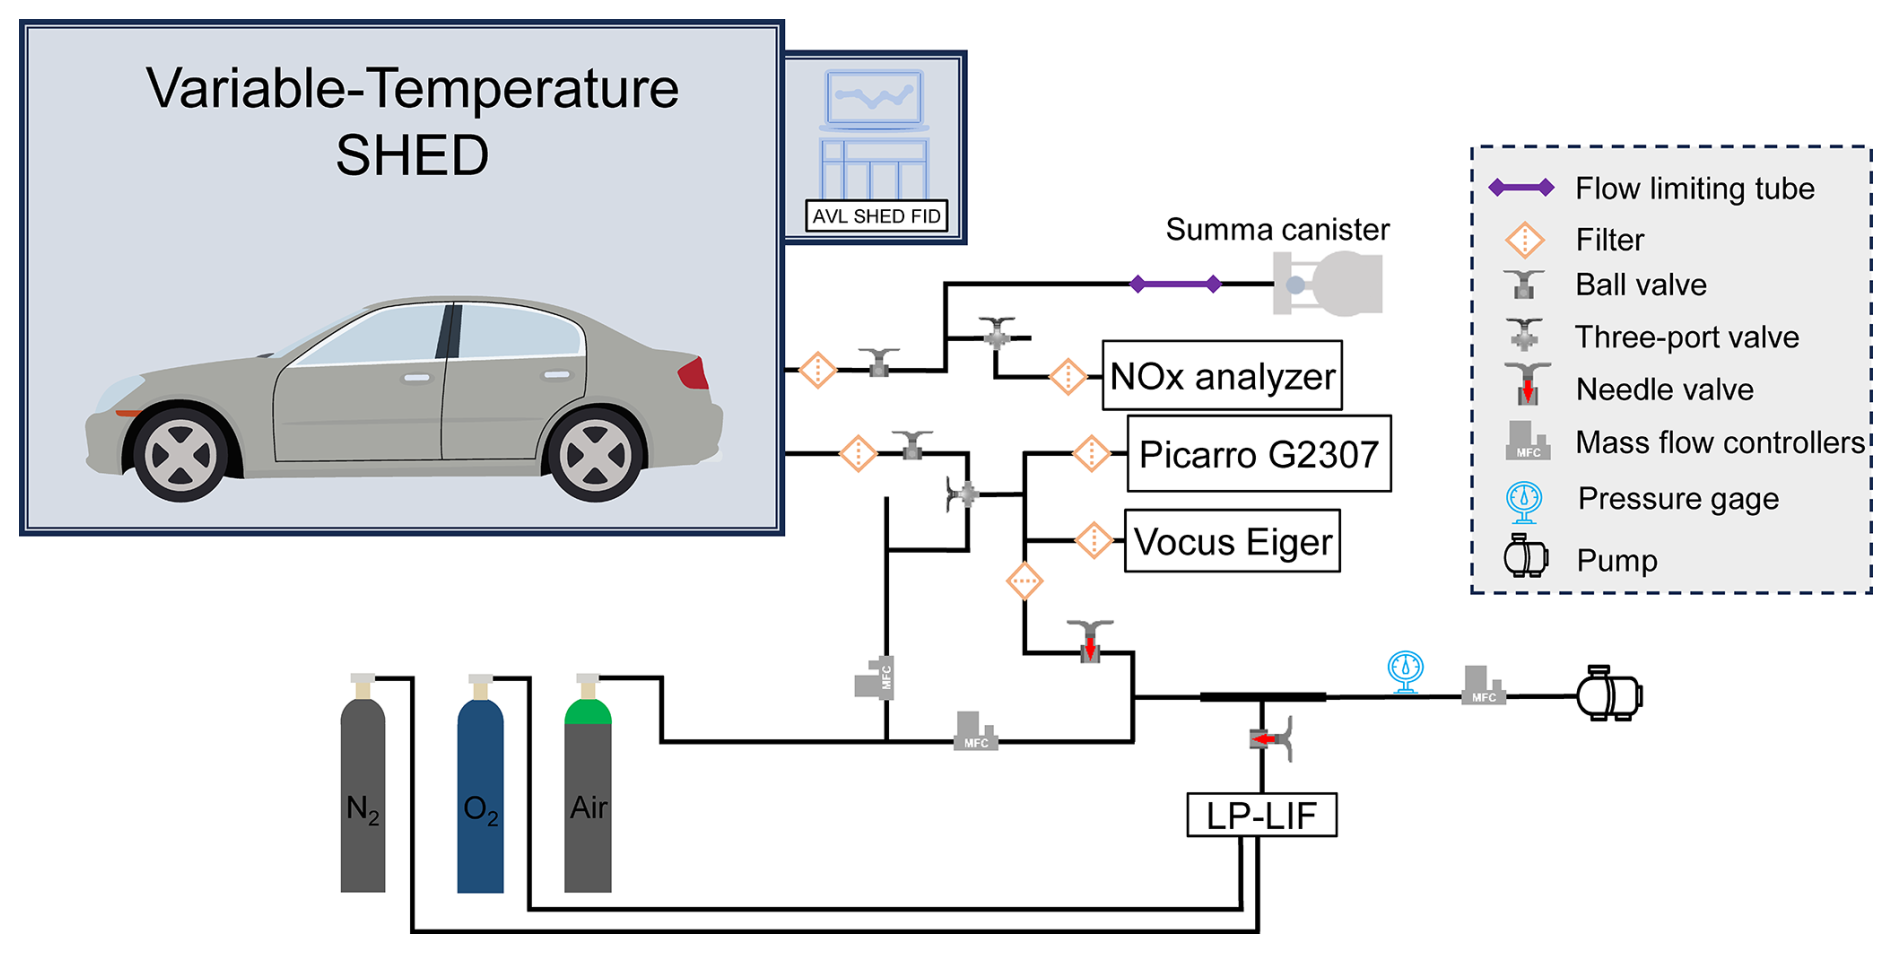
The measurement of THC was carried out by equipment configured in the SHED, with equipment model AVL SHED FID I60 LH (unit is g). Calibration of the equipment was performed before and after each test. The concentrations of nitrogen oxides were also examined, using a commercial SAILHERO XHN200B instrument (with a sample flow rate of 0.5 L min−1, the detection limit was 0.4 ppb) and a Thermo Fisher Scientific Model 42i Trace Level instrument (sample flow rate of 1 L min−1, the detection limit was 0.05 ppb). A commercial instrument by cavity ring-down spectroscopy method (Picarro G2307) was used to measure formaldehyde, and the sampling flow rate was approximately 0.4 L min−1, and the detection limit was 0.16 ppb (1σ).
A proton transfer reaction time-of-flight mass spectrometry (VOCUS-Eiger, ToFWerk) was used for real-time measurement of OVOCs components (sampling flow rate of approximately 0.08 L min−1). During the experiment, standard gas was injected every day to compare the changes in the sensitivity of the equipment and evaluate the working state of the equipment (e.g. m-xylene was approximately 1000 cps ppb−1). Tofware v3.2.3 was used for mass spectrometry peak identification and fitting. Six OVOCs were used for quantification (Table S2).
The main VOCs components of evaporative emissions were sampled using silica-lined SUMMA canisters, and following using GC-MS/FID for quantitative analysis. To prevent errors caused by the instantaneous sampling of the SUMMA canisters, a flow limiting tube was used to stabilize the sampling flow. The collected offline samples (SUMMA canisters) were undergoing pressure dilution pretreatment (ENTECH 4700) and preconcentrated using an atmospheric volatile organic compound preconcentrator (ZF-PKU-VOC1007) before the GC-MS/FID (Agilent Technologies 8890+5977B) analysis. During the experiment sample analysis, the equipment was regularly calibrated, and the calibration curve was updated. The detection limit for species was between 5–50 ppt. Before each sample measurement, a nitrogen sample will be measured to ensure equipment stability before conducting sample testing. The quantitative curve of GC-MS/FID was performed using a customized mixed standard gas of 116 VOCs components. Set five concentration gradients were set during calibration, namely 0.5, 1, 2, 4 and 8 ppb, and repeat each concentration gradient twice. The R2 of calibration curve was 0.98 or above. The VOCs species were shown in Table S3. For species with overlapping OVOCs components and VOCUS-Eiger measurements, use VOCUS-Eiger measurement results. We have customized 7 BC-alkenes, isobutene, 3-methyl-1-butene, 2-methyl-1-butene, 2-methyl-2-butene, 4-methyl-1-pentene, 2-methyl-1-pentene and 2-methyl-2-pentene. Characteristic ion fragments were considered in the measurement, peak retention times were identified and these fragments were added to the GC-MS/FID measurement method to obtain calibration data, thereby achieving quantitative determination of the sample concentration (Table S4). The establishment of the standard curve is consistent with the 116 VOCs component method mentioned above. The R2 of the calibration curve can reach 0.99. Considering the measurement of isoprene in 116 VOCs components, a total of 8 BC-alkenes were quantitatively measured in this study.
The kOH refers to the comprehensive ability of OH radicals in the atmosphere to react with reactive gas components, which can be directly measured and calculated based on the reactive gas components (Kovacs and Brune, 2001; Yang et al., 2019). Direct measurement of the OH total reactivity () was carried out using the laser photolysis laser-induced fluorescence (LP-LIF) device deployed by Lou et al. (2010), which has been applied in field observations and vehicle source emissions (Lou et al., 2010; Liu et al., 2023; Sha et al., 2022; Liu et al., 2019). A detailed description of the LP-LIF equipment details was provided in the Supplement (Sect. S1 and Fig. S2). Considering the working flow rate and measurement range of LP-LIF, the allowed sampling volume of SHED and the kOH range of evaporative emissions are not suitable for the normal operation of LP-LIF. A dilution sampling system was designed to measure the evaporative emissions kOH (Fig. 1). The kOH measurement was divided into two stages of dilution. The first stage was achieved by suppling 3 L min−1 of synthetic air and mixing it with approximately 1 L min−1 of sampling in a mixing tube. The second stage involves LP-LIF sampling approximately 1 L min−1 of gas from the mixing tube and mixing it with 12 L min−1 of the gas supplied by the LP-LIF system to achieve second stage dilution. By adjusting and measuring the primary and secondary sampling flow rates during the experiment, specific dilution coefficients can be obtained to achieve the measurement of kOH. By conducting zero gas (background testing) testing on LP-LIF and repeating it 7 times, the method detection limit of LP-LIF was 0.6 s−1 (3σ). The variation characteristics were tested within 50 s−1, which revealed linear changes that met the measurement requirements of this experiment. Considering the combination of the dilution sampling system and the LP-LIF measurement system, and through standard gas testing, comparing reactivity measurement and calculation, the error of this measurement system estimated at approximately 15 %. To increase the number of samples and reduce measurement errors, resulting in a total sampling time of about 8 minutes. This time setting considers both the impact of sampling volume on the normal operation of SHED and the reliability of equipment testing results.
2.3 Calculation of evaporated emission mass
The emission calculation of THC in the experiment was carried out by the SHED online measurement system, and its calculation method refers to the calculation process of THC in the China VI standard (GB 18352.6-2016). The description is as follows:
where EFTHC is the evaporative emission mass of THC, g; k is a constant, 1.2 × (12 + H C), in the HSL and DBL processes, H C was set to 2.2 and 2.33, respectively; V is the corrected volume of SHED, m3; CTHC,f is the final concentration of THC within SHED, ppm; CTHC,i is the initial concentration of THC within SHED, ppm; Pf and Pi are the pressure at the end and start of the sampling process, kPa; Tf and Ti are the pressure at the end and start of the sampling process, K; MTHC,out and MTHC,in are the amounts of THC emitted and entering SHED during the experiment, respectively; there was no exchange of THC between SHED and the ambient atmosphere during this experiment. Based on this formula, the evaporation emission factors of HSL, DBL24, and DBL48 were calculated separately. In the evaporative emission process, the unit of HSL is g h−1, and, the unit of DBL is g d−1.
The VOCs evaporation compositions mass was given by:
where EFi is the evaporative emission mass of species i, g; Ci,end is the final concentration of species i within SHED, ppb; Ci,start is the initial concentration of species i within SHED, ppb; P is the average pressure at the start and end of the sampling process, Pa; Mi is the molar mass of species i, g mol−1; R is the gas constant, 8.314 J mol−1 K−1; and T is the average temperature at the start and end of the sampling process, K.
2.4 Calculation of the OH total reactivity
The calculation of is based on the sum of the measured concentration of the reactive gas multiplied by the corresponding rate constant of the OH radical reaction. The expression can be expressed as in Eq. (3).
where Reactive gasi (molecule cm−3) is the measured concentration of organic and inorganic gases in this experiment. ki (cm3 molec.−1 s−1) is the reaction rate constant of the OH radicals corresponding to the reactive gases. k obtained from NIST Chemical Kinetics Database, Master Chemical Mechanism (v3.3.1), and International Union of Pure and Applied Chemistry (IUPAC) databases. For detailed data on the parameter ki, please refer to Table S5.
3.1 Emission factors of THC
Figure 2 presents the measurement results for the evaporative emissions of THC together with the relevant literature research results. The THC emissions of the China VI vehicles are significantly lower than those of the China V vehicles. The THC values of China V vehicles during HSL, DBL24 and DBL48 were 0.205 g h−1, 0.599 g d−1, and 0.904 g d−1, respectively. The corresponding values for the China VI vehicles were 0.065 g h−1, 0.132 g d−1, and 0.119 g d−1, respectively. Thus, the China V values were significantly higher than the China VI values, with the HSL, DBL24 and DBL48 values 3.2, 4.6 and 7.6 times higher, respectively. The difference can be explained by the working ability of the carbon canister. The carbon canister configured in China VI vehicles has a higher CCAC compared to China V vehicles, with 119.52 and 35.85 g respectively. The larger CCAC reduces the volatile emissions of gasoline vapor from the fuel tank. The evaporative emission limit of China VI standard, which was fully implemented in 2020, is 0.7 g per test, which is close to the evaporative emission limit of 0.65 g per test in the T2 stage of the United States. Through literature testing data, it can also reflect the current emission control level of China VI vehicles. The T2 data in Fig. 2 summarizes the research results of the literature, with HSL, DBL24, and DBL48 values of 0.065 g h−1, 0.308 g d−1, and 0.281 g d−1, respectively (Liu et al., 2015). Both China VI and T2 emissions can meet the emission limit requirements, but from the DBL processes, the emission level of China VI was slightly lower than that of T2. A study found that the DBL24 and DBL48 test results for China VI were 0.16 and 0.198 g d−1, slightly higher than the results for China VI in this study. Comparing the CCAC of the vehicles, the CACC of the literature research vehicle was 81.04 g, which was lower than that of the vehicle in this study (Zi et al., 2023). For both the China V vehicle and literature study, the China VI test method was used, and it was found that the DBL results were basically consistent within the fluctuation range. At the same time, it was also found that the carbon canister CCAC (15.45 and 40.35 g) used in this study was basically consistent (Zi et al., 2023). Therefore, from this comparison, it can also be found that the working capacity of carbon canister has an impact on evaporative emissions. However, for the HSL process with lower emissions, there was slight differences, such as the results of China V, which was slightly higher in this study than in literature research. For example, the results of China V were slightly higher than the literature research's 0.071 g h−1 (Zi et al., 2023). This subtle difference may be due to differences in experimental vehicles, mileage, and gasoline, or it may be within the normal error range. More experiments will be needed in the future to verify this.
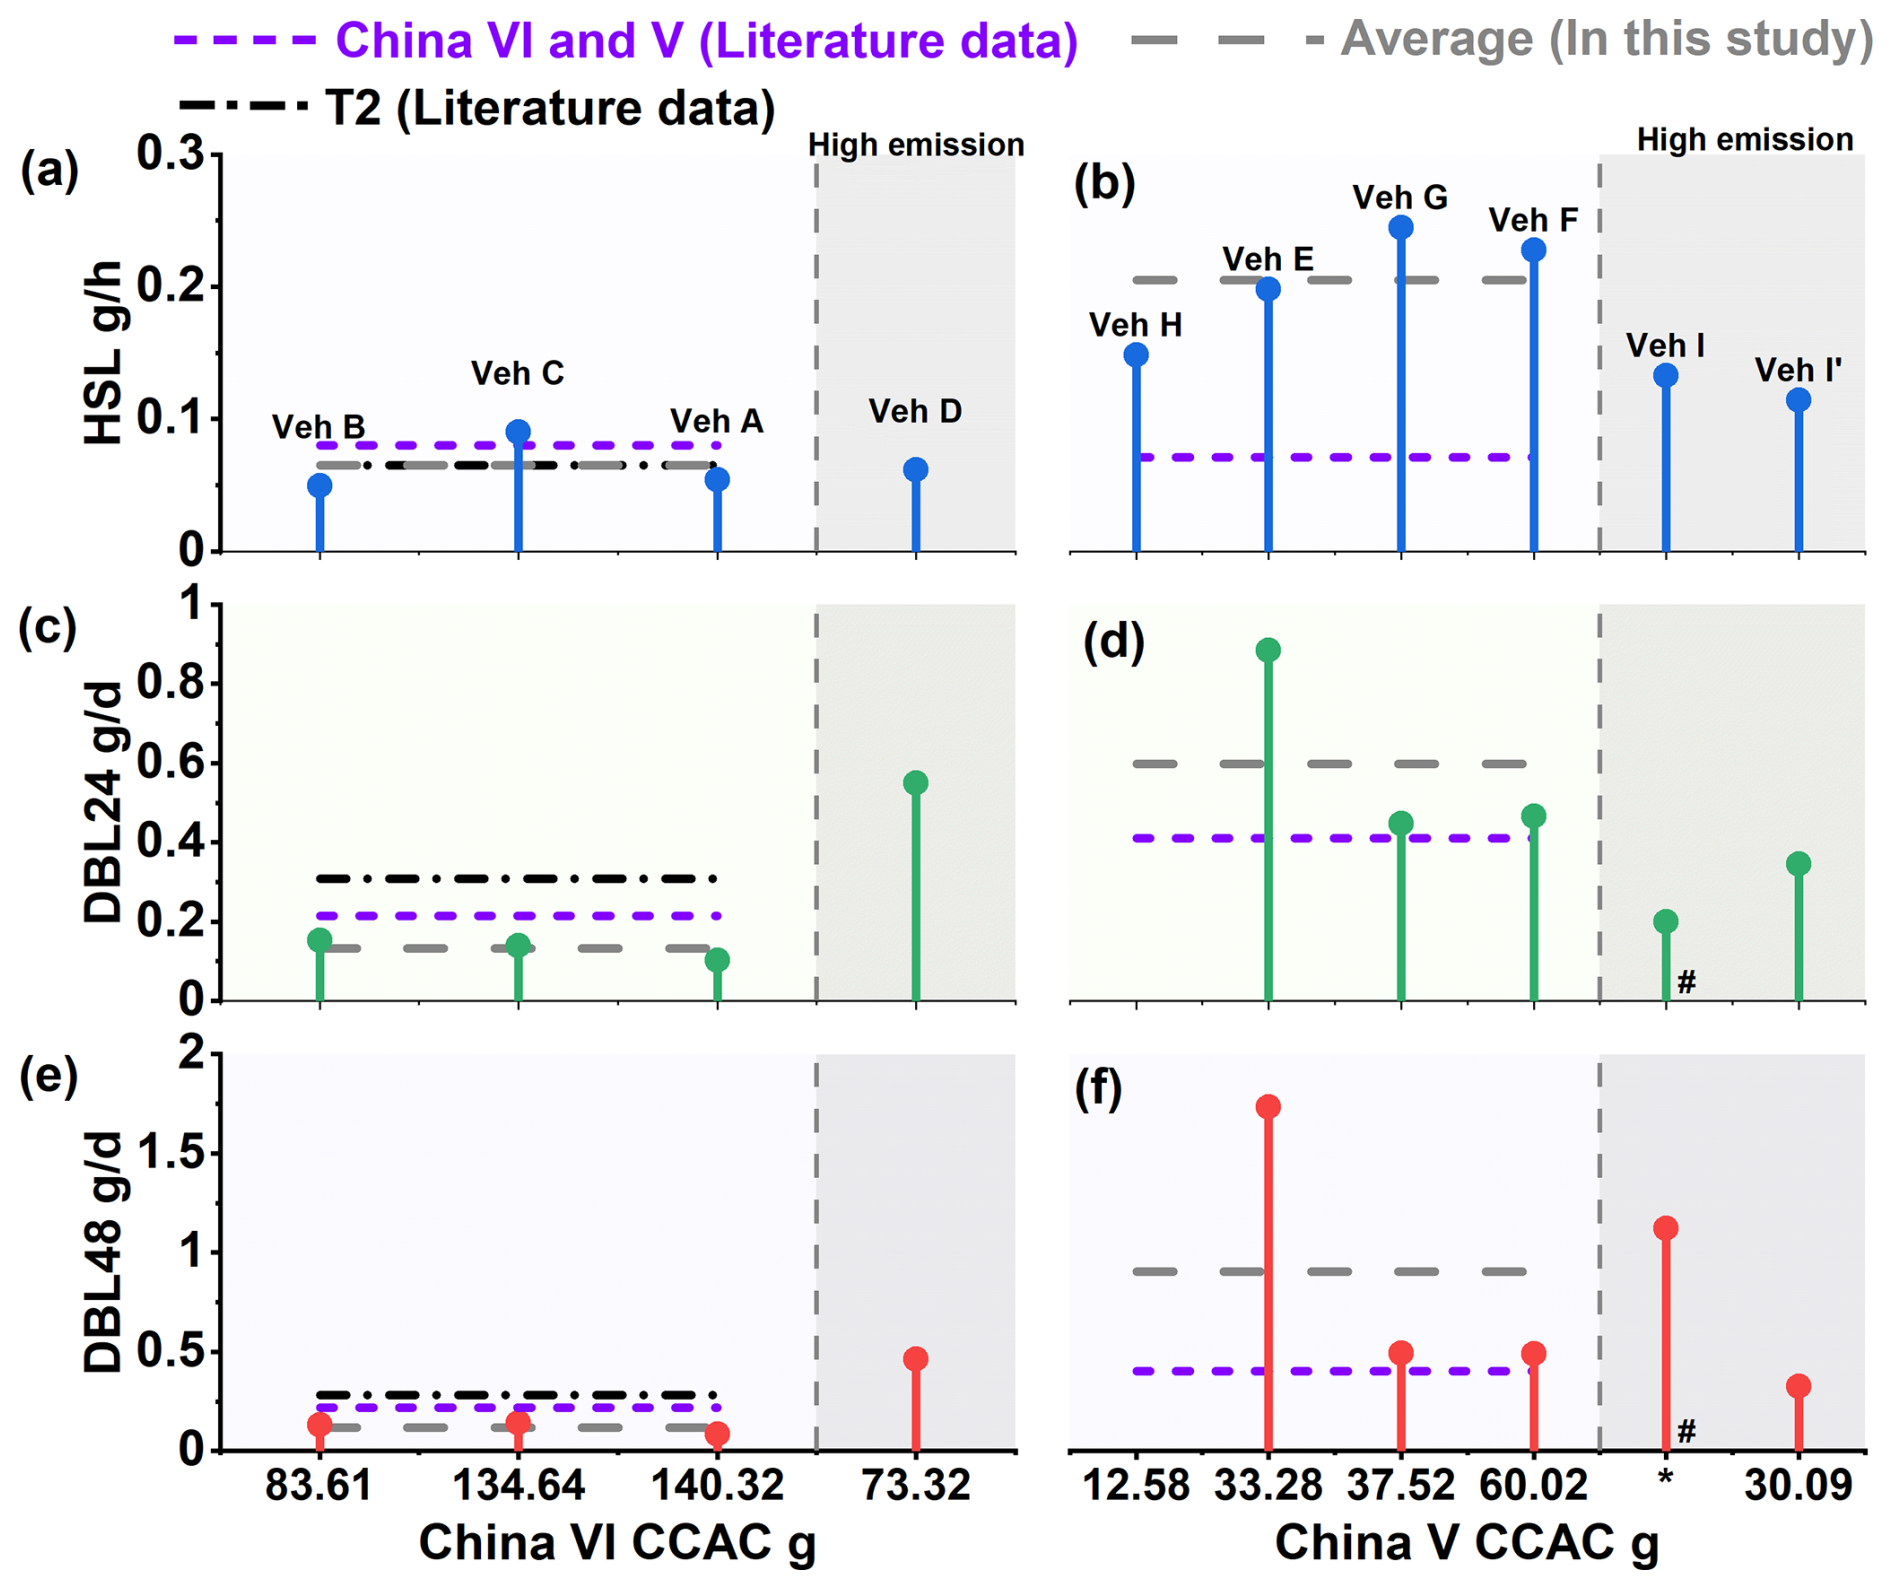
Figure 2Evaporative emission factors of different vehicles and processes (Liu et al., 2015; Zi et al., 2023). (a) China VI HSL; (b) China V HSL; (c) China VI DBL24; (d) China V DBL24; (e) China VI DBL48; (f) China V DBL48; CCAC: carbon canister adsorption capacity; *: CACC data could not be obtained, please refer to Sect. 2.1 for details; #: the data has been reduced by 10 times.
If the control system (carbon canister) malfunctions, emissions increase significantly. For example, in vehicle I (China V), there was an abnormal carbon canister, resulting in a significant decrease in the adsorption efficiency. In DBL24 and DBL48, the THC reached 1.987 and 11.209 g d−1, which was significantly higher than those of other China V vehicles (Fig. 2). For the sake of comparison, we have replaced the carbon canister of vehicle I with an equivalent model. The results (I', China V) after the carbon canister were replaced were 0.345 and 0.326 g d−1, respectively. Comparing the results of I and I', abnormal malfunctions of the carbon canister will significantly affect the evaporative emissions (Fig. 2). Compared with HSL, abnormal carbon canister has a greater impact on DBL emissions, which may be mainly due to the increased workload of the carbon canister caused by the headspace vapor of the fuel tank in response to temperature changes (20–35 °C), resulting in higher emissions from DBL. As the evaporation control system of motor vehicles, the working state of the carbon canister determines the control efficiency of evaporation emissions. Previous research has shown that the qualification rate of evaporative emission control systems in fleets was tested, and it was found that the qualification rate of vehicles in the China V stage was between 44 %–75 %, and other studies have also shown it to be 33.83 % (Lu et al., 2022; Zhang and Hua, 2024). This indicates that abnormal conditions in the evaporative emission control system are a common problem, and also suggests that in the management of VOCs in vehicles, this part of the vehicles should be a key focus of supervision.
Higher ambient temperatures promote evaporative emissions (Huang et al., 2022). The China VI test method shows a significant improvement in the temperature setting of the testing program compared to the China V test method. In order to demonstrate the differences in results between different test methods, the same vehicle (vehicle G) was selected and a comparison was made between the China VI and China V test methods. Using vehicle G (China VI test method) for testing, the THC of HSL was 1.5 times higher than the corresponding G' (China V test method) values (Fig. S3). The testing procedure of China V has a temperature setting of 23–31 °C (test setting at 25 °C) in the HSL, which may not reflect the actual environmental conditions. By contrast, the 38 °C set by China VI HSL is closer to the environmental characteristics of the summer high temperature weather and also enhances the representativeness of the test results (Rodríguez et al., 2019). For example, in Chengdu from 7 to 24 August 2022, the daily maximum temperature ranges from 36.1–41.6 °C (Lei et al., 2024). Study has confirmed that when the temperature increases from 25 to 35 °C, the anthropogenic source VOCs concentration can increase by about 2 times (Qin et al., 2025). This also reflects the importance of testing evaporative emissions at high temperatures. In the DBL comparison, the China V test method was 14.4 % higher than the China VI test method (Fig. S3). The main reason for this difference may be due to the difference in the soak temperature setting during preprocessing. In China V, the requirement is 20–30 °C, while in China VI, it is 38 °C (Fig. S1). A higher soak temperature is beneficial for the volatilization of pollutants. Therefore, in the DBL process, so there was a situation in the DBL process where the test method in China VI was lower than that in China V.
Previous studies have shown that the THC of China V new vehicles have emissions of 0.81 g d−1 for DBL24 (Liu et al., 2022b). For the DBL of China V in-use vehicles, the results of this study were higher than those of new vehicles, and the emissions of China V in-use vehicles were 5.27 g d−1 for DBL24; this may be due to the high vehicle mileage, which causes aging and increases VOCs emissions, the mileage range of the new car were 2987–3065 km, and the in-use cars were 32 012 and 36 854 km (Liu et al., 2022b). However, high mileage vehicles may also be due to the reduced efficiency of the evaporative emission control system, resulting in higher evaporative emission results. In this experiment, we also found that the THC values of DBL24 and DBL48 from vehicle D, which was a China VI vehicle, were 0.55 and 0.464 g d−1 (Fig. 2), respectively, significantly higher (by approximately a factor of 4) than the average levels of other the China VI test vehicles. But the difference in HSL emissions is not significant (approximately 5.1 %). The mileage of vehicle D was 1.6 × 10⁵ km, which is approximately 2.3 times higher than the average mileage (6.9 × 10⁴ km) of the other China VI test vehicles. We found that the CCAC of vehicle D was 73.32 g, which was lower than the average 83.61–140.32 g of other vehicles. Due to the significant temperature changes (20–35 °C) during the DBL process, the fuel tank undergoes a breathing process through the carbon canister. The lower adsorption capacity of the carbon canister can lead to a decrease in control efficiency. This indicates that higher mileage may also significantly degrade the operational capability of the evaporative emission control system. In the future, it is necessary to establish a quantitative relationship between evaporative emissions and carbon canister efficiency for high mileage vehicles, which will help further analyze the influence of this high mileage vehicle aging factor.
3.2 Evaporative emission chemical compositions and source profiles
Figure 3 shows the chemical composition results of the VOCs evaporation emissions from the China VI and China V vehicles. LC-alkanes (≤ C6, light carbon alkanes), aromatics and OVOCs were the main emission components. Compared with the DBL, the HSL has higher aromatics emission, whereas LC-alkanes contribute the most to the DBL. In the HSL process, the aromatics, LC-alkanes and OVOCs contents in China VI vehicles (A, B and C) were 44.1 %, 22.2 % and 18.6 %, respectively, while those in China V vehicles (E, F, G and H) were 42.8 %, 26.6 % and 10.1 %, respectively. For DBL24, the aromatics, LC-alkanes and OVOCs contents in China VI vehicles (A, B and C) were 20.2 %, 40.7 % and 19.1 %, respectively, while those in China V vehicles (E, F and G) were 20.9 %, 42.9 % and 9.7 %, respectively. For DBL48, the aromatics, LC-alkanes and OVOCs contents in China VI vehicles (A, B and C) were 14.3 %, 45.8 % and 17.6 %, respectively, while those in China V vehicles (E, F and G) were 15.3 %, 50.5 % and 8.5 %, respectively. There was also a significant difference in the proportion of OVOCs between China VI and China V vehicles, contribution of OVOCs in China VI vehicles was greater than that in China V; this situation will be further analyzed from the emission source profiles in the following text. For L-alkenes (linear alkenes) and BC-alkenes, China V vehicles showed higher values than China VI vehicles, DBL values were higher than HSL values, and DBL48 values were higher than DBL24 values. Overall, the average proportion of L-alkenes (4.0 %–10.9 %) was slightly higher than that of BC-alkenes (2.7 %–7.8 %). In addition, different test methods were used for the China V vehicle, with vehicle G using the China VI test method and G' using the China V test method, HSL and DBL24 were tested, and the chemical composition and proportion were basically the same.
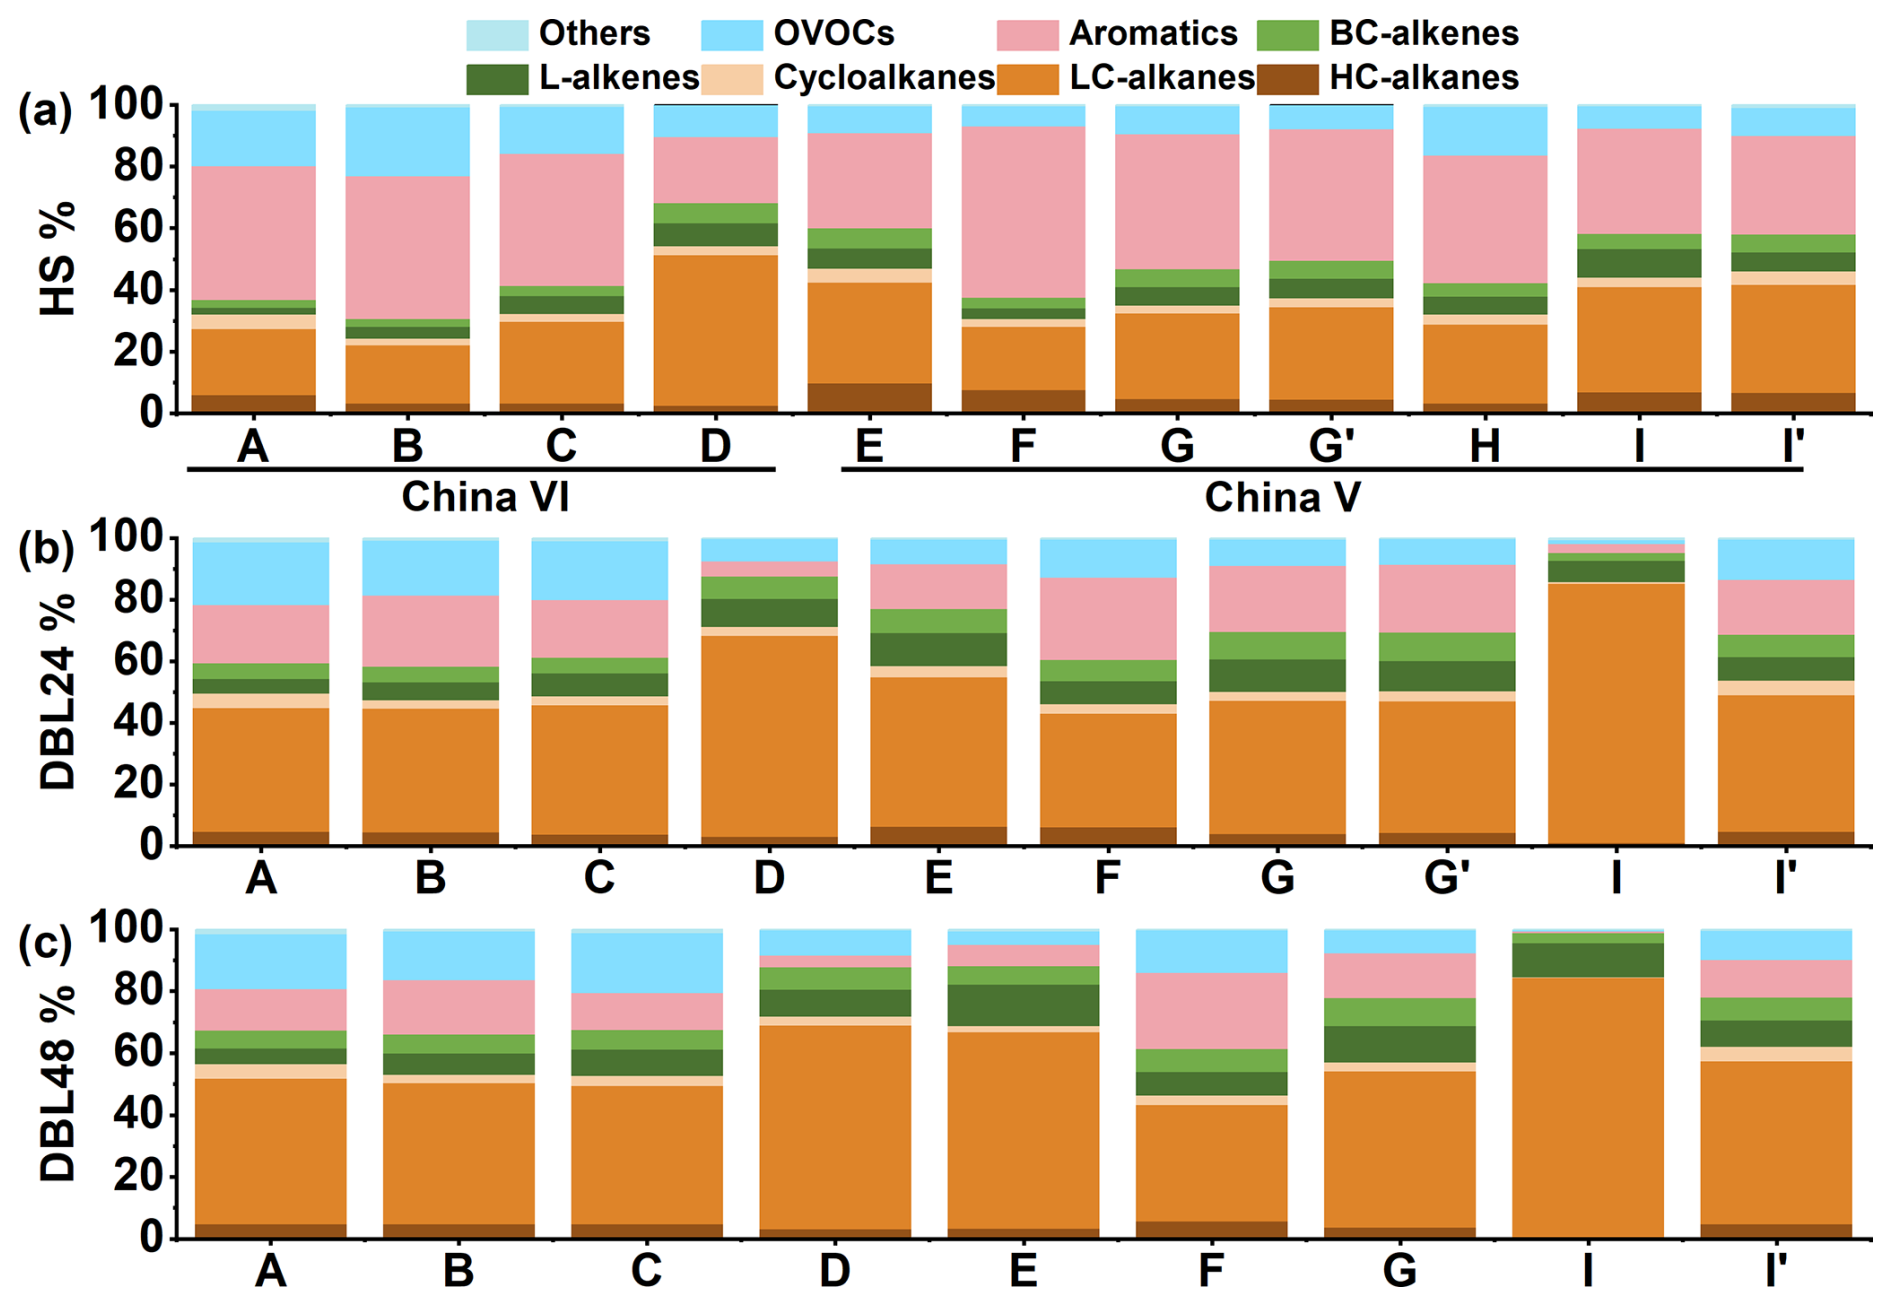
Figure 3Composition characteristics of VOCs evaporation emissions from different vehicles. (a) HSL; (b) DBL24; (c) DBL48; vehicle information can be found in Table 1.
The vehicle with higher emissions of THC were accompanied by a higher proportion of LC-alkanes, such as in the case of vehicle D (China VI high mileage, HSL, DBL24 and DBL48 were 48.8 %, 65.4 % and 65.8 %, respectively). Meanwhile, in DBL24 and DBL48 of vehicle I (China V), the high emissions caused by abnormal carbon canister accounted for 84.2 % of LC-alkanes, far higher than the average level of the China V vehicles. After replacing the carbon canister in Vehicle I (the result is denoted as I'), a significant decrease in emissions was observed, and the composition was also essentially the same as that for the other China V vehicles. In a previous study, Liu et al. focused on PAMS and TO-15 species, and quantified the number of 108 VOCs species (Liu et al., 2022b). In this study, by increasing quantitative measurements of BC-alkenes, it was found that evaporative emissions exhibit distinct characteristics of BC-alkenes emissions, and their contribution levels were also close to those of L-alkenes. By contrast, if only the PAMS component was considered, the proportion of alkanes will be overestimated and the contribution of OVOCs will be ignored, for example, in the DBL24 process, alkanes proportion can reach 68.5 %–82.6 % (Yue et al., 2017). The contribution of BC-alkenes was comparable to that of L-alkenes, indicating the need to include BC-alkenes in future vehicle emission tests to achieve the most comprehensive assessment of pollutants possible. A study on refueling emission and headspace vapor testing found that alkanes dominate, accounting for 70.54 % and 66.0 %, the contribution of aromatics was only 1.43 % and 1.13 %, respectively (Man et al., 2020). Comparing the evaporative emission process, the DBL process of normal vehicles was lower than this proportion, but for high emission vehicles, it was close to this proportion. But for aromatics, evaporative emissions (14.3 %–44.1 %) were significantly higher than the proportion of refueling emission and headspace vapor. Aromatics and alkanes have relatively high contributions in gasoline vehicle exhaust emission, accounting for 43.2 % and 32.27 % respectively (Liu et al., 2024). Among them, the contribution of aromatics was close to that of the HSL process in evaporative emissions, but the difference from the DBL process was obvious. Aromatics in DBL are not the largest contributing VOCs component. And the exhaust emissions also have a high characteristic of alkynes (9.57 %) emissions, with alkynes being extremely low in evaporative emissions (Liu et al., 2024).
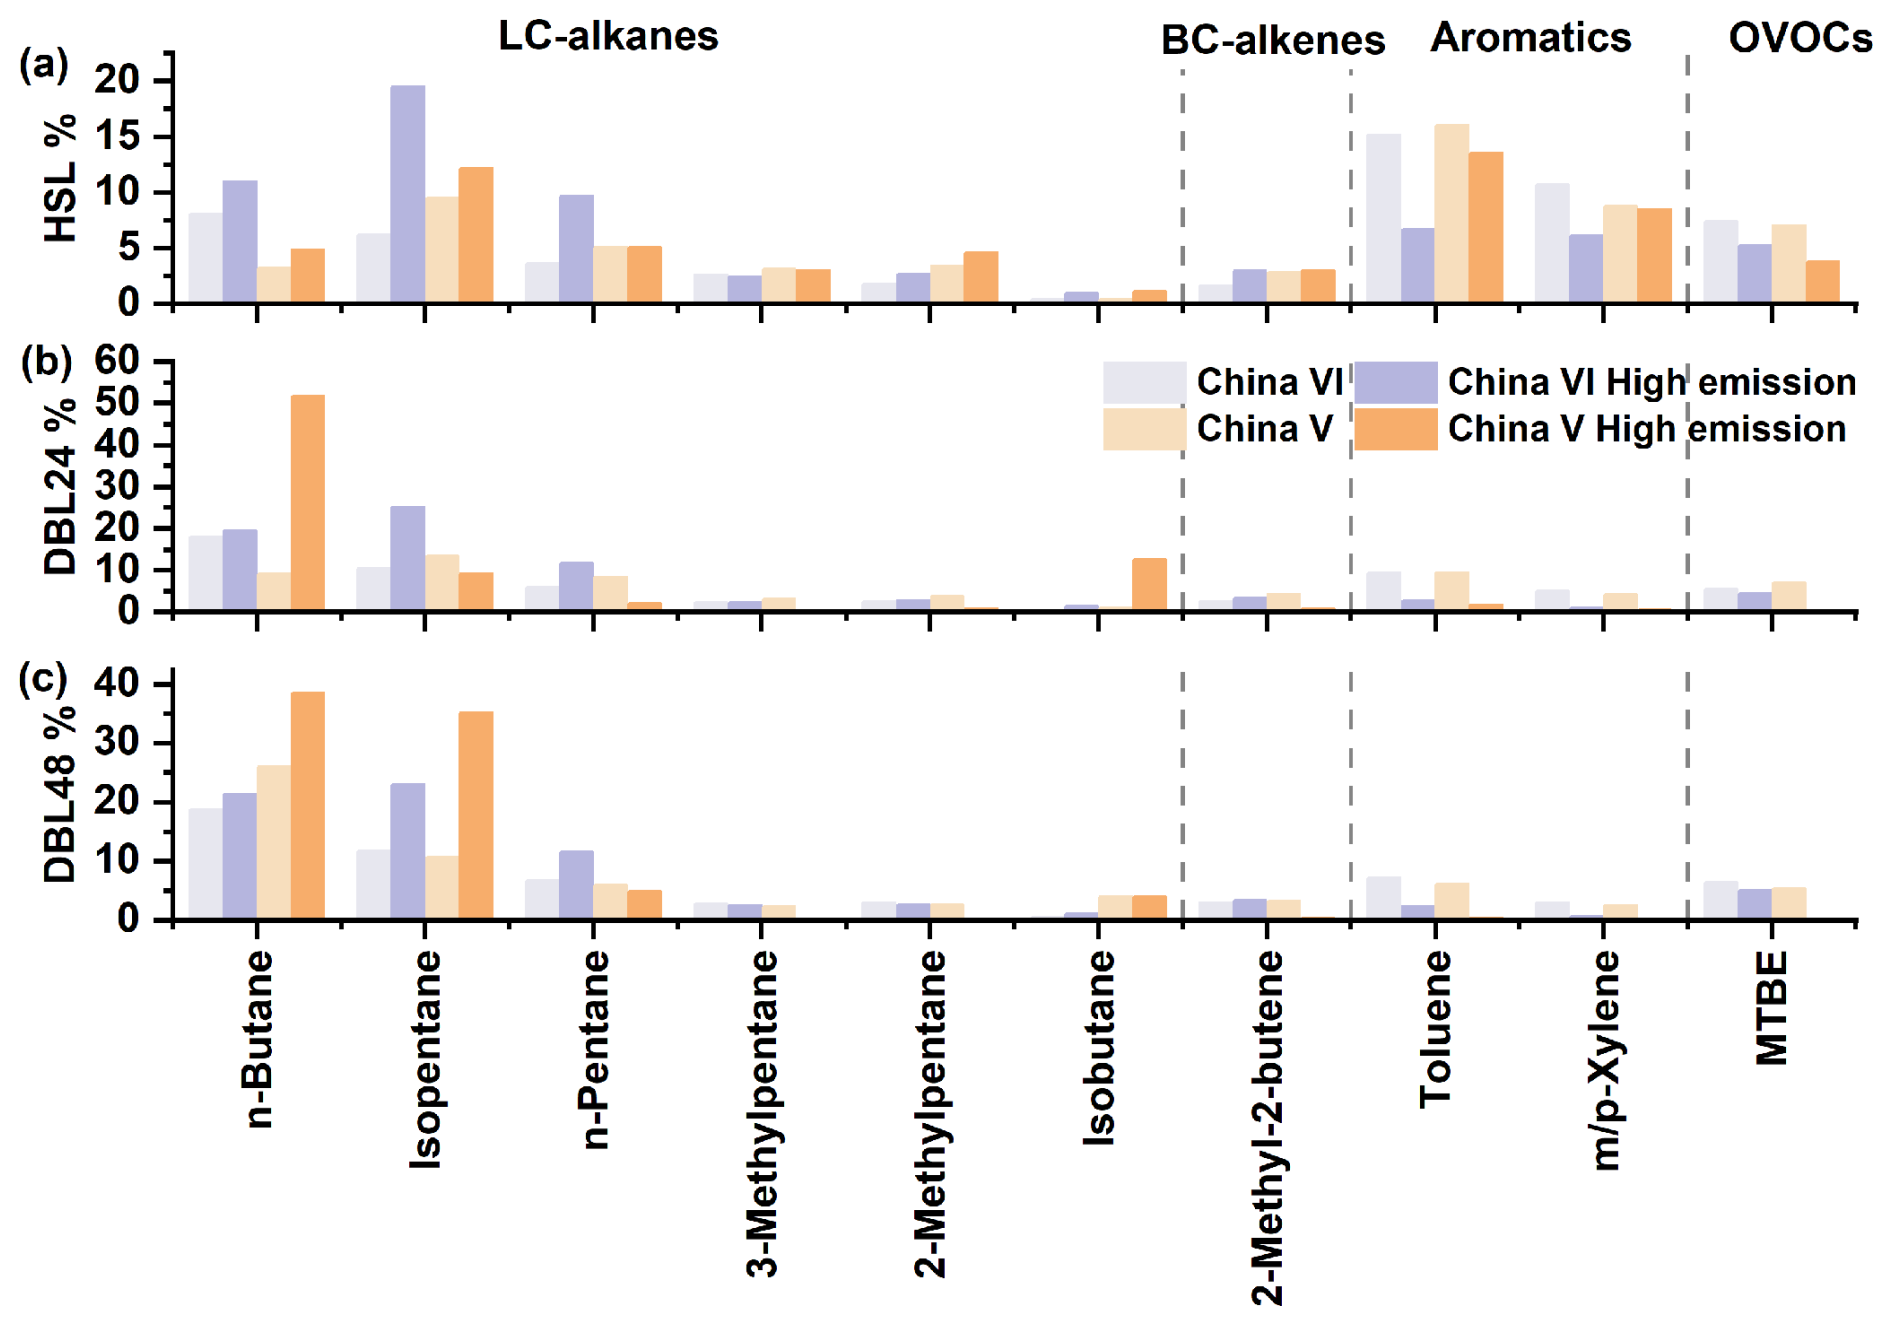
Figure 4Weight percentage of HSL, DBL24 and DBL48 key species in the source profiles for evaporative emissions; the complete source profiles information is shown in Fig. S4.
The measurement results of the evaporative emission source profiles for the China VI and China V vehicles were shown in Figs. 4 and S4. The key source profiles species are shown in Fig. 4, and complete source profiles information can be found in Fig. S4. The source profiles calculation accounted for both normal and high-emission vehicle scenarios, and emission source profiles were obtained for different emission processes. Sixty-three VOC species were selected, including 8 HC-alkanes (high carbon alkanes, the number of carbon atoms > C6), 10 LC-alkanes, 4 cycloalkanes (alkanes with cyclic structures), 9 L-alkenes, 5 BC-alkenes, 15 aromatics and 12 OVOCs, accounting for more than 95 % of the total VOCs mass. Overall, n-butane (3.2 %–26.1 %), isopentane (6.2 %–13.5 %), n-pentane (3.6 %–8.4 %), toluene (6.1 %–16.0 %), m/p-xylene (2.5 %– 10.7 %), methyl tert-butyl ether (MTBE) (5.3 %–7.4 %) and 4-methyl-2-pentanone (0.4 %–5.8 %) were the main contributors. Compared with that during the HSL process, the proportion of n-butane during the DBL process significantly increases, whereas the proportions of toluene and m/p-xylene decrease. During each emission process, OVOCs were significantly higher in the China VI vehicles than in the China V vehicles, which was due mainly to species such as 4-methyl-2-pentanone and MTBE. The proportions of 4-methyl-2-pentanone in China VI and China V were 2.2 %–5.8 % and 0.4 %–0.9 %, respectively, with the corresponding MTBE values of 5.5 %–7.4 % and 5.3 %–7.1 %. From the DBL24 process to the DBL48 process, the proportion of n-butane in the China V vehicles increased significantly compared with that in the China VI vehicles. In the emission profiles of gasoline headspace, isopentane was the main component, and aromatics were not significant (Wu et al., 2015). Although LC-alkanes was very important in gasoline headspace and evaporative emissions, there are still differences in the main species. At the same time, there was still significant differences compared to the HSL process, such as aromatics. Gasoline headspace is an important source of evaporative emissions, due to different emission processes, there are also significant differences in its compositions, which reflects the importance of conducting tests on different evaporative emission process. For BC-alkenes and L-alkenes, 2-methyl-2-butene (1.6 %–4.3 %), 2-methyl-1-butene (0.7 %–2.0 %), and trans-2-pentene (1.6 %–3.4 %) were found to be the main components. Lu et al. tested the source profiles of BC-alkenes in gasoline vapor (Lu et al., 2003). Zhang et al. reported that the contribution of BC-alkenes in headspace vapor was approximately 6.2 % (Zhang et al., 2013). Liu et al. also observed the emission of BC-alkenes in the 2004–2005 evaporative emission test (Liu et al., 2008). The research on BC-alkenes related to vehicle emissions sources is relatively early. Therefore, the addition of 2-methyl-2-butene and 2-methyl-1-butene also improved the previous evaporative emission profiles of China V and China VI vehicles (Liu et al., 2022b; Li et al., 2024; Zi et al., 2023). In addition, formaldehyde was an important emission characteristic of China VI vehicles, particularly in the HSL, with emissions reaching 1.6 %, which is much higher than those of DBL and China V vehicles, and this result is consistent with the OVOCs results in Fig. 3.
Figure 4 also compares the source profiles of high emission vehicles, such as China VI vehicles with high mileage features and China V vehicles with abnormal carbon canister. Compared with normal China VI vehicle emissions, n-butane, isopentane, and n-pentane of China VI have a significant increase. For example, for high emission vehicles in China VI, n-butane, isopentane, and n-pentane were 11.0 %–21.3 %, 19.5 %–25.1 %, and 9.7 %– 11.8 %, respectively. For high emission China V vehicles, carbon canister breakthrough emissions were observed at DBL48, with n-butane and isopentane reaching 38.5 % and 35.2 %, far higher than the normal China V vehicle emissions of 26.1 % and 10.6 %, respectively. For aromatics and OVOCs species, under high emission conditions, the contribution of major species such as toluene, m/p-xylene, and MTBE in the source profiles will decrease compared to normal vehicles. Overall, due to vehicle anomalies such as aging at high mileage and abnormal carbon canister, resulting in high evaporative emissions, the proportion of tracer species in the source profile will increase compared to normal emission vehicles.
The species composition of evaporative emissions is characterized by relatively high proportion of n-butane (3.2 %–26.1 %) and isopentane (6.2 %–13.5 %), significantly exceeding the proportion of ethane (0.0 %–1.0 %). In contrast, in the exhaust emissions of gasoline vehicles, the contribution of ethane was comparable to or even exceeds that of n-butane and isopentane; for example, in China V gasoline vehicles, ethane, n-butane, and isopentane were approximately 2.3 %, 3.5 %, and 2.0 %, respectively; in China VI gasoline vehicles, they correspond to approximately 6.5 %, 0.8 %, and 0.7 %, respectively (Li et al., 2024). This also reflects the VOCs species differences in evaporative emissions and exhaust emissions. From the analysis of the ratio of characteristic species n-pentane to ethane, the exhaust ratios of China V and China VI are approximately 1.1 and 0.6 (Li et al., 2024), respectively, corresponding to 6.5–121.2 and 9.2–174.3 in evaporative emissions. It was also found that the ratio (n-pentane/ethane) of HSL was significantly higher than that of DBL. Additionally, the MTBE/benzene (MTBE/B) ratio of HSL and DBL process ranged from 5.7–7.1. This ratio was significantly higher in evaporative emissions than in exhaust related emission sources, such as 1.2 and 0.6 in tunnels (Sun et al., 2019; Liu et al., 2022a), 1.3 in underground parking (Chai et al., 2023), 0.4 in diesel exhaust (Huang et al., 2020). There are significant differences between evaporative emission sources and process and solvent usage sources in terms of tracer species. There are usually high levels of OVOCs species such as acetone, ethyl acetate, and n-butyl acetate in the process and solvent sources, but the evaporative emissions have obvious MTBE and 4-methyl-2-pentanone emission characteristics, which can be used to identify evaporative emissions (Zhao et al., 2018; Wang et al., 2017). Therefore, the above species parameters can be used as important references for identifying vehicle evaporative emissions.
3.3 OH reactivity characteristics
The direct measurement results of kOH () for China VI and China V vehicles were shown in Fig. 5. Overall, the level of the China VI vehicles was significantly lower than that of the China V vehicles. The values of China VI vehicles (B and C) were 34.6 and 72.2, 157.4 and 174.3, 160.9 and 194.7 s−1 for HSL, DBL24 and DBL48, and the corresponding values for the China V vehicles (E and G) were 213.4 and 278.7, 1389.5 and 690.0, 2851.9 and 805.3 s−1, respectively. The values of HSL, DBL24 and DBL48 of vehicle D were 107.3, 708.9 and 609.4 s−1, respectively, which were significantly higher than those of China VI vehicles (B and C), approaching the level of China V vehicles. This indicates that high mileage vehicles may have higher evaporative emission characteristics due to evaporative emission control systems and vehicle aging.
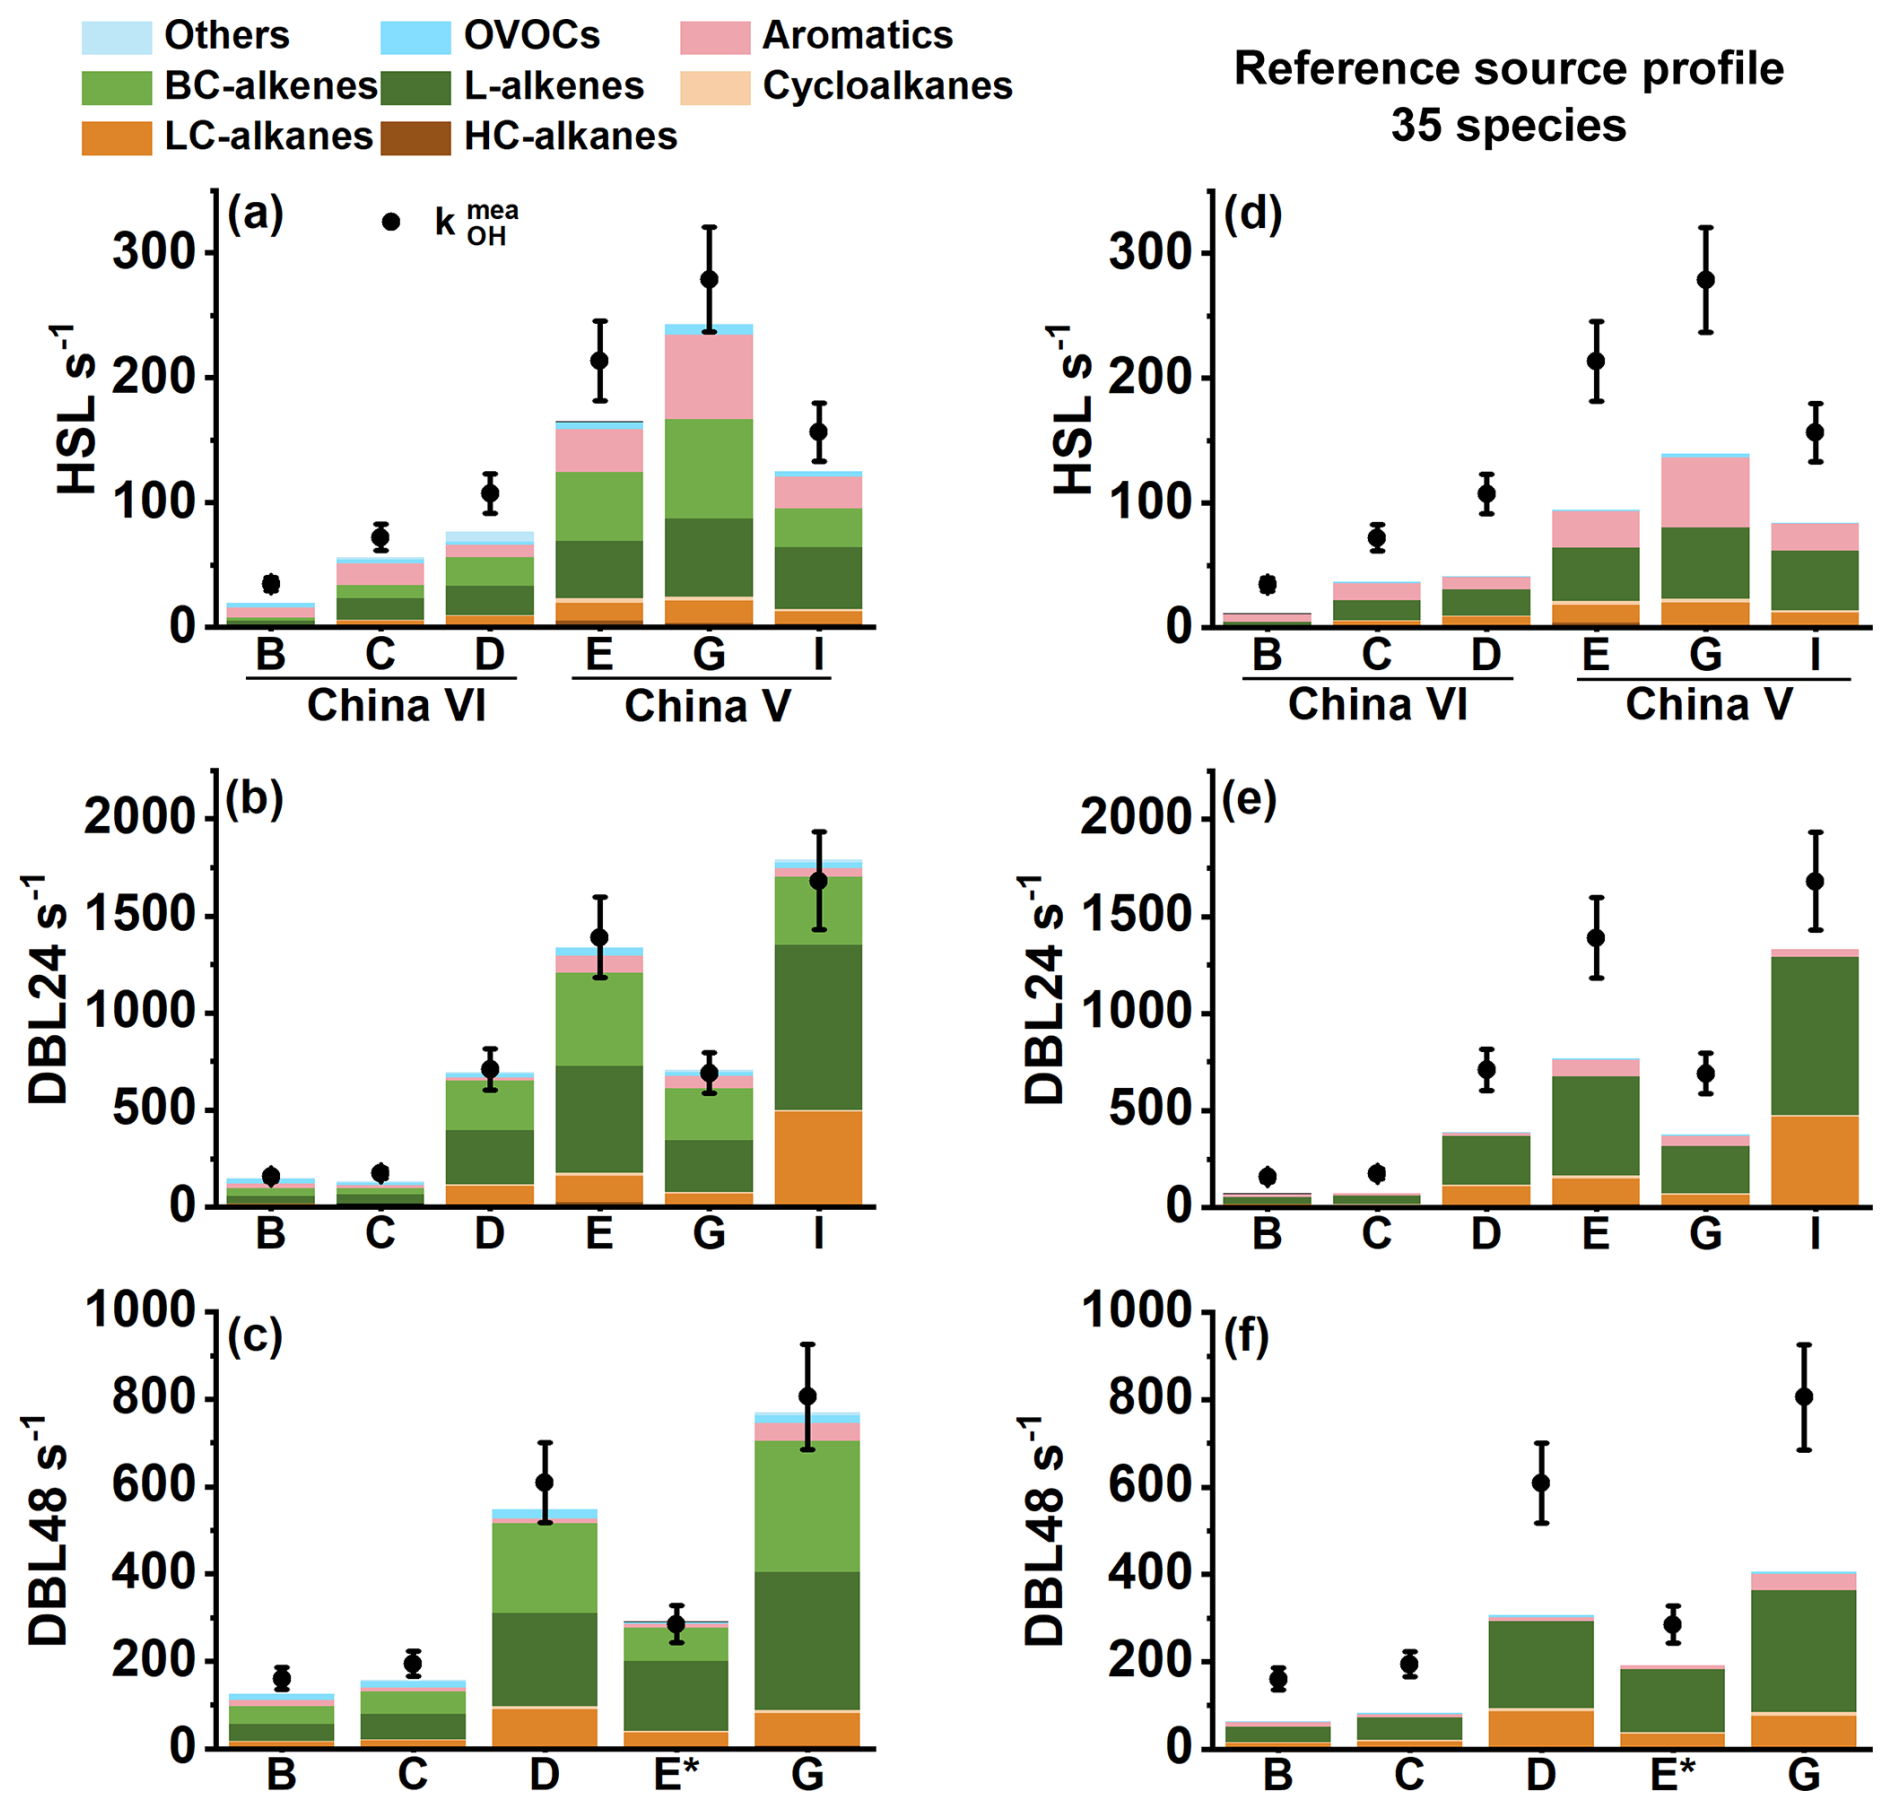
Figure 5Comparative analysis of calculation () and direct measurement () of total OH reactivity; (a) HSL; (b) DBL24; (c) DBL48; panels (d), (e) and (f) show the HSL, DBL24 and DBL48 reactivity closure calculation using species provided by literature source profiles (Liu et al., 2022b); *: the data has been reduced by 10 times; vehicle information can be found in Table 1.
Figures 5a, b, c and 6 show the composition proportion characteristics of the kOH components calculated based on VOCs component measurements. There was a significant difference in the composition of the components compared to the results presented in Fig. 3, L-alkenes, BC-alkenes and aromatics dominate the kOH. In the reactive composition of the HSL process, L-alkenes account for 18.3 %–30.4 %, BC-alkenes account for 14.8 %–33.4 %, and aromatics contribute 20.9 %–39.8 %. The contribution of L-alkenes and BC-alkenes to the reactivity in the DBL process occupies an absolute dominant position. During the DBL24 process, L-alkenes account for 26.6 %–41.2 %, BC-alkenes account for 25.7 %–38.2 %, and aromatics contribute 6.8 %–16.0 %; in the DBL48 process, the proportions of these three components were 30.9 %–54.9 %, 26.7 %–39.0 % and 3.0 %–11.3 %, respectively. In the composition of chemical components, LC-alkanes was relatively important contributors, especially in the DBL process, occupying a dominant position. However, in the composition of kOH, the proportion of LC-alkanes in the DBL process was only 8.8 %–12.0 %. This indicates that in VOCs emission reduction and control, priority can be given to L-alkenes and BC-alkenes with significant reactivity impact, thereby improving the effectiveness of atmospheric VOCs emission reduction and control. In the VOCs total emission reduction control strategy, considering the characteristics of emission sources and incorporating considerations based on reactive species is beneficial for achieving significant environmental benefits (Zhong et al., 2021; Wang et al., 2024).
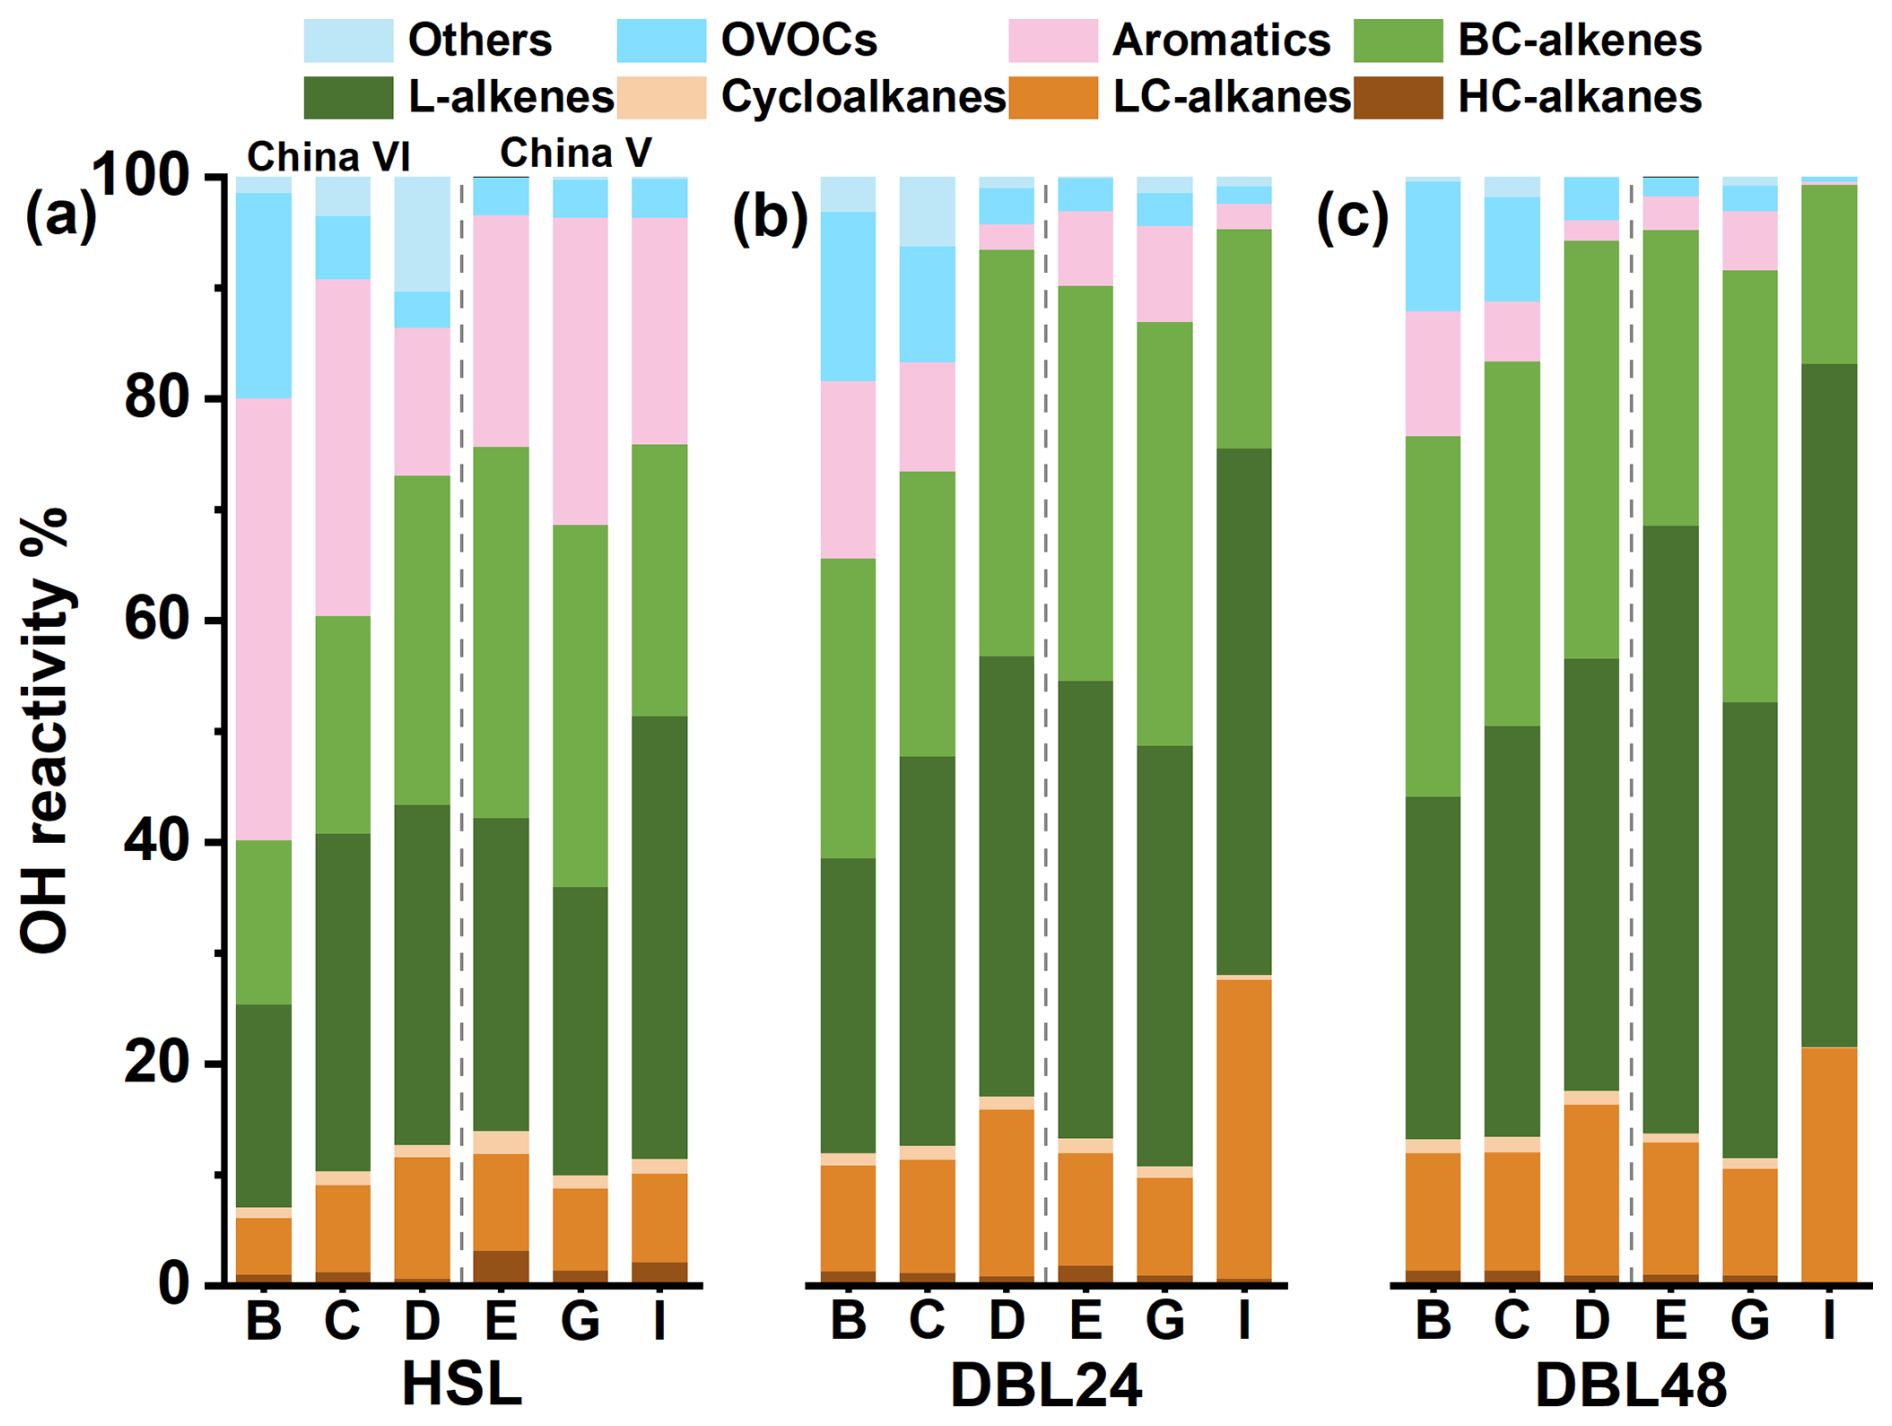
Figure 6Contribution characteristics of the OH reactivity calculation results of the evaporation emission components. (a) HSL; (b) DBL24; (c) DBL48; vehicle information can be found in Table 1.
For vehicles with abnormally high VOCs emissions, such as high mileage China VI vehicle (vehicle D) and the China V vehicle with the abnormal carbon canister (vehicle I), the contribution of L-alkenes and BC-alkenes significantly increased and dominated, particularly during DBL24 and DBL48, where vehicle D (China VI) contributed 76.4 % and 76.6 %, respectively, and vehicle I (China V) contributed 67.2 % and 77.7 %. This indicates that vehicles with higher evaporative emission characteristics have significantly increased contributions to reactivity from L-alkenes and BC-alkenes in their reactivity component composition compared to normal emission vehicles. Based on the abnormal situation of the carbon canister in vehicle I, after replacing the canister, it was measured that in DBL48, the reactive components of L-alkenes, BC-alkenes, LC-alkanes, OVOCs and aromatics were 35.0 %, 35.5 %, 11.9 %, 6.6 %, and 6.0 %, respectively; however, under the abnormal situation of the carbon canister, they were 61.6 %, 16.1 %, 21.3 %, 0.5 % and 0.3 %, respectively. It can be observed that the proportion of L-alkenes in vehicle I with abnormal carbon canister has significantly increased (61.6 %). For the reactive composition of high mileage emission vehicle D, it was found that there would be differences between the two emission mechanisms. When the vehicle was in high mileage use, aging brings high emissions, and the carbon canister working system is in normal condition, species with branched structures will be more conducive to emissions, so the contribution of BC-alkenes in vehicle D has increased compared to vehicle B and vehicle C. On the contrary, when the carbon canister system was abnormal, gasoline vapor was emission directly, and low-carbon L-alkenes ware more conducive to emissions, resulting in a higher reactivity proportion of L-alkenes; for example, comparing the changes in DBL48 L-alkenes and BC-alkenes before and after replacing the carbon canister in vehicle I, the average number of L-alkene species average increased by 71.9 times, while the average number of BC-alkenes average increased by only 30.3 times, corresponding to an average of 4.2 (2–6) and 5.3 (4–6) carbon atoms, respectively.
The kOH can be determined through both and approaches. In theory, if all reactive components are quantified, should equal . However, in practice, current analytical techniques cannot fully capture all chemical species in the measurement. By comparing and (a method referred to as OH reactivity closure analysis) the completeness of the observed chemical composition contributing to kOH can be assessed. If is significantly lower than , it suggests the presence of unmeasured reactive species (OH reactivity missing source). From the perspective of OH reactivity closure, there is a significant missing reactivity in the HSL process compared with the DBL process, and the OH missing reactivity of the China VI vehicles was more pronounced (Fig. 5a, b and c). The missing reactivity values of the HSL process for the China VI and China V vehicles were 31.2 % (22.0 %–43.1 %) and 18.5 % (12.8 %–22.9 %), respectively. Considering a measurement error of 15 %, The HSL of China VI vehicles has missing reactivity, and some vehicles of China V vehicles have missing reactivity, such as vehicle E (22.9 %) and vehicle I (20.0 %). In the DBL process, the China V vehicles essentially demonstrated closure (-6.4 %–4.5 %). By contrast, kOH missing vehicles were found among the China VI vehicles, for example, missed reactivity of DBL24 for vehicle C was 22.8 %, and the missed reactivity values for DBL48 of vehicle B and C was 21.6 % and 19.4 %, respectively. Overall, the tightening of evaporative emission standards has effectively controlled pollutant emissions, but there will be an increase in unknown reactive species, which also highlights the importance of increasing detection capabilities. Previous studies on the reactivity closure of exhaust gases have shown that with the increasing of emission standards, the proportion of OH reactivity missing increases, and the author infers that this missing reactivity may come from unmeasured OVOCs and L-alkenes, unspecified high oxygen components and semi/intermediate volatile components (Sha et al., 2022). In field observation experiments, it was also found that OVOCs make important contributions to compensation for the missing of OH reactivity (Fuchs et al., 2017). In our research, we also found that compared with the HSL of China V vehicles, the HSL of the China VI vehicles with lower emissions shows more significant OH reactivity missing and higher OVOC emissions, but OVOCs were not the main reactivity contributors to evaporative emissions. Compared with the DBL process, HSL shows a higher kOH missing, and the high proportion of aromatics implies that another pathway for exploring OH reactivity missing (Lee et al., 2009). Compare with DBL process, higher temperature of HSL is beneficial for the volatile emissions of large molecular species (such as aromatics) and can also increase the complexity of components. It is important to note that in the study of kOH closure analyzed in exhaust and atmospheric environments, the combustion process of fuel and photochemical reactions in the atmosphere can lead to the oxidation of some organic compounds, generating some OVOCs key reactive components. For evaporative emissions, VOCs are derived mainly come from gasoline vapor and vehicle emissions, implying that the direction for the exploration of the reactivity missing of evaporative emissions is different from those for exhaust and atmospheric environments.
The number of species directly affects the understanding of kOH closure. As shown in Fig. 5e, f and g, using the source profiles provided in the related research, focusing on 35 species, it was found that the missed reactivity would further expand (Liu et al., 2022b). For China VI vehicles, the average reactivity missing of HSL, DBL24, and DBL48 were 59.3 %, 52.2 %, and 56.1 %, respectively, corresponding to 50.6 %, 37.1 %, and 41.2 % for China V vehicles, respectively. By comparison, the addition of BC-alkenes in this study can further improve the understanding of evaporative emission species, and adding these species can enable some vehicles to achieve reactivity closure. This indicates that BC-alkenes were important species in the evaporative emissions of vehicles, and it is necessary to pay attention to this part of the species in the future. Therefore, based on the composition characteristics of reactive chemical components, it can be inferred that L-alkenes, BC-alkenes and aromatics may be important objects to compensate for the missing reactivity.
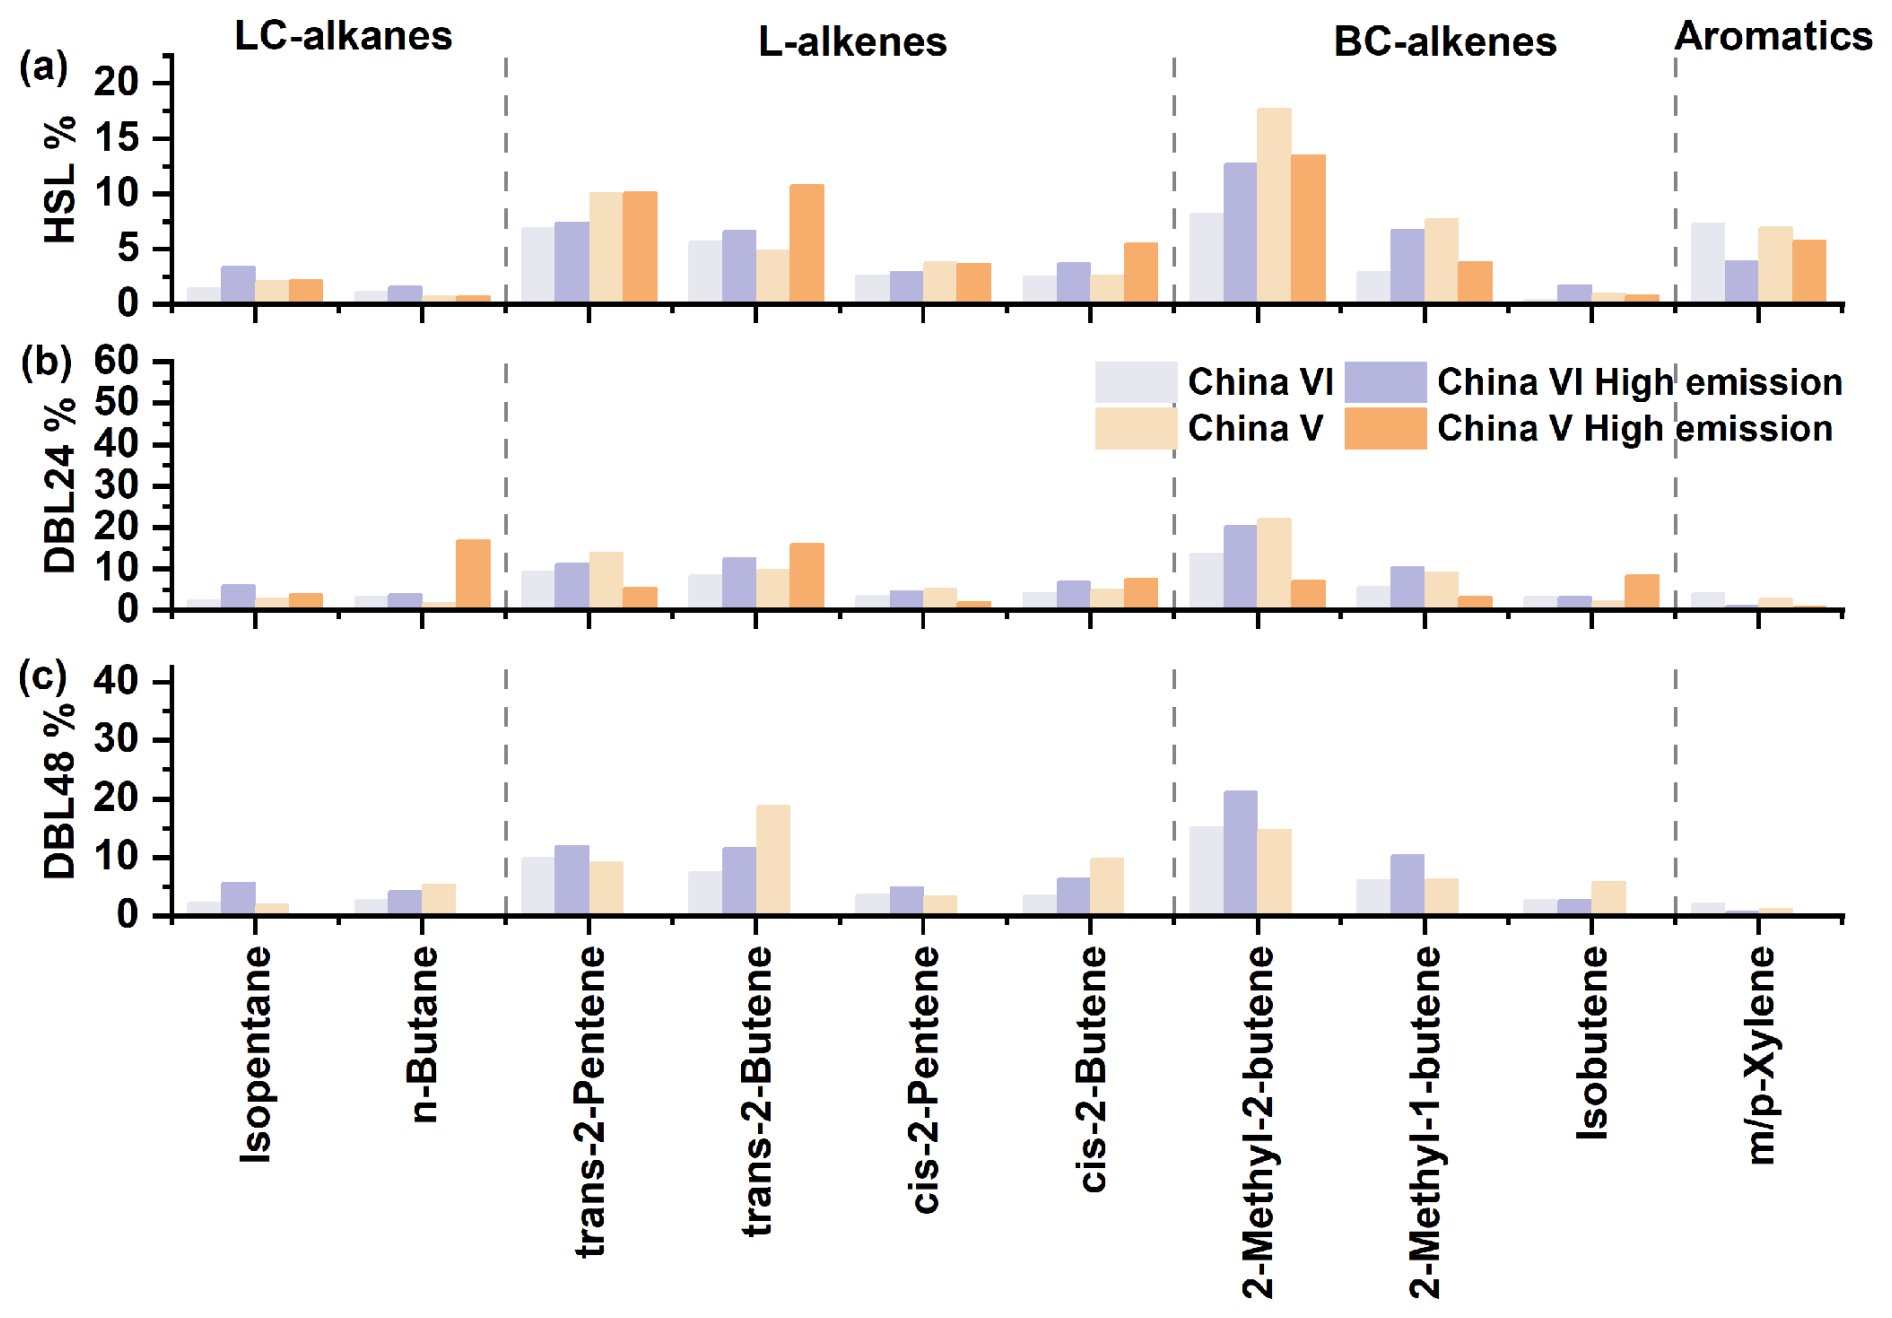
Figure 7OH reactivity percentage of HSL, DBL24 and DBL48 key species in the source profiles for evaporative emissions; the complete source profiles information is shown in Fig. S5.
As shown in Figs. 7 and S5, establishing an evaporative emission VOCs source profiles based on the composition and kOH closure characteristics of vehicles (B, C, E and G), and obtain the reactivity contribution of VOCs components in different vehicle models and emission processes. The key source profiles species are shown in Fig. 7, and complete source profiles information can be found in Fig. S5. In the calculation of the reactive source profiles for VOCs evaporation emissions, the reactivity weight percentage of each VOCs species was determined based on the reactivity closure feature (i.e., reactivity closure is considered when the missing activity is less than 15 %). Forty-seven VOC species were selected, including 2 HC-alkanes, 8 LC-alkanes, 1 cycloalkane, 9 L-alkenes, 7 BC-alkenes, 11 aromatics and 9 OVOCs, accounting for more than 95 % of the . Among the kOH source profiles, 2-methyl-2-butene (8.2 %–22.0 %), trans-2-pentene (6.9 %–13.8 %), trans-2-butene (4.9 %–18.7 %), 2-methyl-1-butene (2.9 %–9.1 %), m/p-xylene (1.2 %–7.3 %) and toluene (1.3 %–4.4 %) etc. were the main contributors. Although the concentrations of n-butane, isopentane, and n-pentane in the LC-alkanes contributed significantly, their contributions to reactivity were not significant. When a vehicle exhibits high emissions, taking vehicle D as an example, high emission was caused by vehicle aging due to high mileage, resulting in a significant increase in 2-methyl-2-butene (12.7 %–21.2 %), 2-methyl-1-butene (6.8 %–10.4 %), trans-2-pentene (7.4 %–11.9 %), trans-2-butene (6.6 %–12.6 %), cis-2-butene (3.7 %–6.8 %), and isopentane (3.4 %–6.0 %). When the high emissions of vehicle (the kOH test for the DBL48 process of China V vehicle I failed, so the reactivity source profiles composition was not shown here) was caused by abnormal evaporative emission control system (carbon canister), the changes in reactive species will be different from the high emissions of vehicle D, and the impact of low-carbon species will be more significant. For example, trans-2-butene, cis-2-butene, and n-butane will significantly increase, while the contributions of 2-methyl-2-butene and 2-methyl-1-butene will decrease. This also indicates that when the vehicle's evaporative emission control system is abnormal, the impact of low-carbon alkenes emissions on OH reactivity will be more prominent. Analysis of key reactive species indicates that L-alkenes, and in particular BC-alkenes, are the main contributors to the OH reactivity of evaporative emission sources. This also indicates that in the control of vehicle evaporative emissions, priority can be given to these highly reactive components, and by improving the chemical composition of fuel formula and vehicle emission technology, the reactive impact of evaporative emissions can be reduced.
In this work, we conducted evaporative emission measurements and evaluated of in-use gasoline vehicles manufactured according to China's current two regulatory standards (China VI and China V) of evaporative emissions. Using improved measurement methods and instruments, the evaporative emission factors, source profiles and OH reactivity characteristics were evaluated. Compared with the China V standard, implementation of the China VI standard can significantly reduce VOCs emissions. During the HSL, DBL24 and DBL48 processes, China V vehicles can reach 3.2, 4.6 and 7.6 times that of China VI vehicles. In the HSL process, aromatics dominate, accounting for 44.1 % and 42.8 % respectively in China VI and China V, followed by LC-alkanes at 22.2 % and 26.6 %, respectively. In the DBL emission process, LC-alkanes dominate, accounting for 40.7 % and 42.9 % respectively for DBL24 in China VI and China V vehicles, and the corresponding proportions were 45.8 % and 50.5 %, respectively in DBL48. For OVOCs, the proportion of China VI (17.6 %–19.1 %) was significantly higher than that of China V (8.5 %–10.1 %). For L-alkenes and BC-alkenes, their proportions were 4.0 %–10.9 % and 2.7 %–7.8 %, respectively, with China V slightly higher than China VI. Under high evaporative emissions from vehicles, the contribution of LC-alkanes will significantly increase. The comparative experiment of carbon canister working conditions shows that in the DBL24 and 48 emission process, the emissions of THC from abnormal conditions (1.987 and 11.209 g d−1) were significantly higher than those from normal working conditions (0.345 and 0.326 g d−1). The emissions of THC from high mileage vehicles can reach about 4 times the normal emissions. Under high emission conditions, the contribution of LC-alkanes will significantly increase. This conclusion also indicates that in the control of vehicle evaporative emissions, the regulation of high emission vehicles should be a key target for evaporative emission sources.
This study conducted measurements of VOCs components in evaporative emissions from in-use vehicles with different emission standards (two evaporative emission standards in the current fleet) and vehicle conditions (normal emissions and high emissions states) using customized China VI stage gasoline. In the chemical composition, n-butane (3.2 %–26.1 %), isopentane (6.2 %–13.5 %), n-pentane (3.6 %–8.4 %), toluene (6.1 %–16.0 %), m/p-xylene (2.5 %–10.7 %), MTBE (5.3 %–7.4 %) and 4-methyl-2-pentanone (0.4 %–5.8 %) were the main contributors. For BC-alkenes and L-alkenes, 2-methyl-2-butene (1.6 %–4.3 %), 2-methyl-1-butene (0.7 %–2.0 %), and trans-2-pentene (1.6 %–3.4 %) were found to be the main components. Simultaneously obtained the source profiles corresponding to high emission vehicles caused by high mileage and abnormal carbon canister. The supplementary measurement of BC-alkenes has also expanded the current understanding of the source profiles evaporative emissions from China VI and China V vehicles. In the analysis of evaporative emission tracer ratio, the n-pentane/ethane and MTBE/B ratio serve as a diagnostic marker to identify evaporative emissions and other vehicle-related sources. The established evaporative emission source profiles and the proposed tracer species ratio in this study can serve as important references for VOCs source apportionment in atmospheric ambient, and further identify the contribution characteristics of evaporative emissions based on vehicle emission sources. It also contributes to the improvement of evaporative emission inventories and the establishment of emission reduction governance systems based on key species.
In the kOH chemical composition of evaporative emissions, the HSL process was mainly composed of L-alkenes, BC-alkenes and aromatics, accounting for 18.3 %–30.4 %, 14.8 %–33.4 % and 20.9 %–39.8 %, respectively. In the DBL process, it was mainly composed of L-alkenes (26.6 %–54.9 %) and BC-alkenes (25.7 %–39.0 %). And under high emission conditions, the proportion of L-alkenes and BC-alkenes will increase, indicating that highly reactive species in high emission vehicles have a greater impact. Based on direct measurement and reactivity calculation of kOH for closed analysis, it was found that the missing reactivity of China VI was more significant than that of China V vehicles, especially in the HSL process, there are still obvious unknown reactivity sources in China VI (22.0 %–43.1 %) and China V (12.8 %–22.9 %).The update of emission standards indicates that the total emissions can be controlled, but there will be an increase in reactive species outside of regulatory monitoring, which hinders the comprehensive understanding of air pollution caused by evaporative emission sources. By comparing with literature, it was found that the measurement of BC-alkenes can significantly improve the understanding of the composition of reactive species in evaporative emissions. Although n-butane and isopentane dominate in emissions, their impact on OH reactivity was not as significant as that of 2-methyl-2-butene, 2-methyl-1-butene, trans-2-pentene, m/p-xylene and toluene. Therefore, in management VOCs evaporation emissions, a strategy combining total emission reduction with prioritized control of highly reactive species can maximize environmental benefits.
The software code is available upon request from the corresponding author (Xin Li).
The research data are available upon request from the corresponding author (Xin Li).
The supplement related to this article is available online at https://doi.org/10.5194/acp-25-13311-2025-supplement.
LK and XL design experiments, conceptualize and draft preparation. YW, SL, YL, SL and WZ analyze data and experimental measurement techniques support. XY, YD, YL, MS and SH contributed suggestions, equipment operation, and data analysis. KW, FW, XS, JW, YZ and CL contributed measurement technology support. HL, MF, XD, LZ and YZ contributed measuring equipment, measuring techniques, and suggestions.
The contact author has declared that none of the authors has any competing interests.
Publisher's note: Copernicus Publications remains neutral with regard to jurisdictional claims made in the text, published maps, institutional affiliations, or any other geographical representation in this paper. While Copernicus Publications makes every effort to include appropriate place names, the final responsibility lies with the authors. Views expressed in the text are those of the authors and do not necessarily reflect the views of the publisher.
This research has been supported by the National Natural Science Foundation of China (grant nos. 42277085 and 42477096) and the Natural Science Foundation of Beijing Municipality (grant no. JQ21030).
This paper was edited by Zhibin Wang and reviewed by two anonymous referees.
Chai, J., Niu, Y., Yan, Y., Duan, X., Zhang, X., Xing, Y., Zheng, X., and Peng, L.: Variation, source and health risk assessment of volatile organic compounds in underground park: A case study of an underground park in Beijing, Environ. Chem., 42, 2292–2303, https://doi.org/10.7524/j.issn.0254-6108.2022112203, 2023.
Chossière, G. P., Malina, R., Allroggen, F., Eastham, S. D., Speth, R. L., and Barrett, S. R. H.: Country- and manufacturer-level attribution of air quality impacts due to excess NOx emissions from diesel passenger vehicles in Europe, Atmos. Environ., 189, 89–97, https://doi.org/10.1016/j.atmosenv.2018.06.047, 2018.
Fuchs, H., Tan, Z., Lu, K., Bohn, B., Broch, S., Brown, S. S., Dong, H., Gomm, S., Häseler, R., He, L., Hofzumahaus, A., Holland, F., Li, X., Liu, Y., Lu, S., Min, K.-E., Rohrer, F., Shao, M., Wang, B., Wang, M., Wu, Y., Zeng, L., Zhang, Y., Wahner, A., and Zhang, Y.: OH reactivity at a rural site (Wangdu) in the North China Plain: contributions from OH reactants and experimental OH budget, Atmos. Chem. Phys., 17, 645–661, https://doi.org/10.5194/acp-17-645-2017, 2017.
Guan, Y., Xiao, Y., Wang, Y., Zhang, N., and Chu, C.: Assessing the health impacts attributable to PM2.5 and ozone pollution in 338 Chinese cities from 2015 to 2020, Environ. Pollut., 287, 117623, https://doi.org/10.1016/j.envpol.2021.117623, 2021.
Huang, H., Hu, H., Zhang, J., and Liu, X.: Characteristics of volatile organic compounds from vehicle emissions through on–road test in Wuhan, China, Environ. Res., 188, 109802, https://doi.org/10.1016/j.envres.2020.109802, 2020.
Huang, J., Yuan, Z., Duan, Y., Liu, D., Fu, Q., Liang, G., Li, F., and Huang, X.: Quantification of temperature dependence of vehicle evaporative volatile organic compound emissions from different fuel types in China, Sci. Total Environ., 813, 152661, https://doi.org/10.1016/j.scitotenv.2021.152661, 2022.
Kovacs, T. A. and Brune, W. H.: Total OH loss rate measurement, J. Atmos. Chem., 39, 105–122, https://doi.org/10.1023/A:1010614113786, 2001.
Lee, J. D., Young, J. C., Read, K. A., Hamilton, J. F., Hopkins, J. R., Lewis, A. C., Bandy, B. J., Davey, J., Edwards, P., Ingham, T., Self, D. E., Smith, S. C., Pilling, M. J., and Heard, D. E.: Measurement and calculation of OH reactivity at a United Kingdom coastal site, J. Atmos. Chem., 64, 53–76, https://doi.org/10.1007/s10874-010-9171-0, 2009.
Lei, L., Zhang, Y., Luo, Y., Zhang, X., and Feng, M.: Analysis of a typical ozone pollution process in the Chengdu Plain under the influence of high temperature extremes, Environ. Sci., 45, 2028–2038, https://doi.org/10.13227/j.hjkx.202305021, 2024.
Li, C., Liu, Y., Cheng, B., Zhang, Y., Liu, X., Qu, Y., An, J., Kong, L., Zhang, Y., Zhang, C., Tan, Q., and Feng, M.: A comprehensive investigation on volatile organic compounds (VOCs) in 2018 in Beijing, China: Characteristics, sources and behaviours in response to O3 formation, Sci. Total Environ., 806, 150247, https://doi.org/10.1016/j.scitotenv.2021.150247, 2022.
Li, K., Jacob, D. J., Liao, H., Zhu, J., Shah, V., Shen, L., Bates, K. H., Zhang, Q., and Zhai, S.: A two-pollutant strategy for improving ozone and particulate air quality in China, Nat. Geosci., 12, 906–910, https://doi.org/10.1038/s41561-019-0464-x, 2019.
Li, R., Zhong, C., Ning, Y., Liu, Y., Song, P., Xu, R., and Mao, H.: Exhaust and evaporative volatile organic compounds emissions from vehicles fueled with ethanol-blended-gasoline, Environ. Pollut., 357, 124163, https://doi.org/10.1016/j.envpol.2024.124163, 2024.
Li, S.-M., Leithead, A., Moussa, S. G., Liggio, J., Moran, M. D., Wang, D., Hayden, K., Darlington, A., Gordon, M., Staebler, R., Makar, P. A., Stroud, C. A., McLaren, R., Liu, P. S. K., O'Brien, J., Mittermeier, R. L., Zhang, J., Marson, G., Cober, S. G., Wolde, M., and Wentzell, J. J. B.: Differences between measured and reported volatile organic compound emissions from oil sands facilities in Alberta, Canada, Proc. Natl. Acad. Sci., 114, E3756–E3765, https://doi.org/10.1073/pnas.1617862114, 2017.
Liu, H., Man, H., Tschantz, M., Wu, Y., He, K., and Hao, J.: VOC from vehicular evaporation emissions: status and control strategy, Environ. Sci. Technol., 49, 14424–14431, https://doi.org/10.1021/acs.est.5b04064, 2015.
Liu, H., Man, H., Cui, H., Wang, Y., Deng, F., Wang, Y., Yang, X., Xiao, Q., Zhang, Q., Ding, Y., and He, K.: An updated emission inventory of vehicular VOCs and IVOCs in China, Atmos. Chem. Phys., 17, 12709–12724, https://doi.org/10.5194/acp-17-12709-2017, 2017.
Liu, P., Wu, Y., Li, Z., Lv, Z., Zhang, J., Liu, Y., Song, A., Wang, T., Wu, L., Mao, H., and Peng, J.: Tailpipe volatile organic compounds (VOCs) emissions from Chinese gasoline vehicles under different vehicle standards, fuel types, and driving conditions, Atmos. Environ., 323, 120348, https://doi.org/10.1016/j.atmosenv.2024.120348, 2024.
Liu, S., Li, X., Shen, X., Zeng, L., Huang, X. Zhu, B., Lin, L., and Lou, S.: Measurement and partition analysis of atmospheric OH reactivity in autumn in Shenzhen, Acta Scien. Circum., 39, 3600–3610, https://doi.org/10.13671/j.hjkxxb.2019.0194, 2019.
Liu, X., Zhu, R., Jin, B., Mei, H., Zu, L., Yin, S., Zhang, R., and Hu, J.: Characteristics and source apportionment of vehicular VOCs emissions in a tunnel study, Environ. Sci., 43, 1777–1787, https://doi.org/10.13227/j.hjkx.202108192, 2022a.
Liu, X., Yuan, Z., Sha, Q., Lou, S., Wang, H., Li, X., Zheng, J., Yuan, B., and Shao, M.: Direct identification of total and missing OH reactivities from light-duty gasoline vehicle exhaust in China based on LP-LIF measurement, J. Environ. Sci., 133, 107–117, https://doi.org/10.1016/j.jes.2022.03.041, 2023.
Liu, Y., Shao, M., Fu, L., Lu, S., Zeng, L., and Tang, D.: Source profiles of volatile organic compounds (VOCs) measured in China: Part I, Atmos. Environ., 42, 6247–6260, https://doi.org/10.1016/j.atmosenv.2008.01.070, 2008.
Liu, Y., Zhong, C., Peng, J., Wang, T., Wu, L., Chen, Q., Sun, L., Sun, S., Zou, C., Zhao, J., Song, P., Tong, H., Zhang, L., Wang, W., and Mao, H.: Evaporative emission from China 5 and China 6 gasoline vehicles: Emission factors, profiles and future perspective, J. Cleaner Prod., 331, 129861, https://doi.org/10.1016/j.jclepro.2021.129861, 2022b.
Lou, S., Holland, F., Rohrer, F., Lu, K., Bohn, B., Brauers, T., Chang, C. C., Fuchs, H., Häseler, R., Kita, K., Kondo, Y., Li, X., Shao, M., Zeng, L., Wahner, A., Zhang, Y., Wang, W., and Hofzumahaus, A.: Atmospheric OH reactivities in the Pearl River Delta – China in summer 2006: measurement and model results, Atmos. Chem. Phys., 10, 11243–11260, https://doi.org/10.5194/acp-10-11243-2010, 2010.
Lu, J., Huang, C., Xiu, G., Ma, D., Li, Y., Liang, Z., and Lai, Y.: Study on leakage test of fuel evaporation control system based on light-duty gasoline vehicle, Adm. Tech. Environ. Monit., 34, 45–48, https://doi.org/10.19501/j.cnki.1006-2009.2022.03.008, 2022.
Lu, S., Bai, Y., Zhang, G., and Ma, J.: Study on the characteristics of VOCs source profiles of vehicle exhaust and gasoline emission, Acta Sci. Nat. Univ. Pekin., 39, 507–511, https://doi.org/10.13209/j.0479-8023.2003.077, 2003.
Man, H., Liu, H., Niu, H., Wang, K., Deng, F., Wang, X., Xiao, Q., and Hao, J.: VOCs evaporative emissions from vehicles in China: species characteristics of different emission processes, Environ. Sci. Ecotechnol., 1, 100002, https://doi.org/10.1016/j.ese.2019.100002, 2020.
Ministry of Ecology and Environment: China Mobile Source Environmental Management Annual Report, https://www.mee.gov.cn/hjzl/sthjzk/ydyhjgl/ (last access: 17 October 2025), 2019.
Ministry of Ecology and Environment: China Mobile Source Environmental Management Annual Report, https://www.mee.gov.cn/hjzl/sthjzk/ydyhjgl/ (last access: 17 October 2025), 2022.
Ministry of Ecology and Environment: China Mobile Source Environmental Management Annual Report, https://www.mee.gov.cn/hjzl/sthjzk/ydyhjgl/ (last access: 17 October 2025), 2024.
Qin, M., She, Y., Wang, M., Wang, H., Chang, Y., Tan, Z., An, J., Huang, J., Yuan, Z., Lu, J., Wang, Q., Liu, C., Liu, Z., Xie, X., Li, J., Liao, H., Pye, H. O. T., Huang, C., Guo, S., Hu, M., Zhang, Y., Jacob, D. J., and Hu, J.: Increased urban ozone in heatwaves due to temperature-induced emissions of anthropogenic volatile organic compounds, Nat. Geosci., 18, 50–56, https://doi.org/10.1038/s41561-024-01608-w, 2025.
Rodríguez, F., Bernard, Y., Dornoff, J., Mock, P.: Recommendations for post-Euro 6 standards for light-duty vehicles in the European Union, The International Council on Clean Transportation Europe, https://theicct.org/sites/default/files/publications/Post_Euro6_standards_report_20191003.pdf (last access: 17 October 2025), 2019.
Sha, Q., Liu, X., Yuan, Z., Zheng, J., Lou, S., Wang, H., Li, X., and Yu, F.: Upgrading emission standards inadvertently increased OH reactivity from light-duty diesel truck exhaust in China: evidence from direct LP-LIF measurement, Environ. Sci. Technol., 56, 9968–9977, https://doi.org/10.1021/acs.est.2c02944, 2022.
Song, M., Tan, Q., Feng, M., Qu, Y., Liu, X., An, J., and Zhang, Y.: Source apportionment and secondary transformation of atmospheric nonmethane hydrocarbons in Chengdu, southwest China, J. Geophys. Res.-Atmos., 123, 9741–9763, https://doi.org/10.1029/2018JD028479, 2018.
Sun, L., Liu, Y., Zhao, J., Sun, S., Song, C., Zhang, J., Li, Y., Lin, Y., Wang, T., and Mao, H.: Pollution characteristics and emission factors of VOCs from vehicle emissions in the Tianjin tunnel, Environ. Sci., 40, 104–113, https://doi.org/10.13227/j.hjkx.201804187, 2019.
Wang, H., Yang, Z., and Jing, S.: Volatile organic compounds (VOCs) source profiles of industrial processing and solvent use emissions: A review, Environ. Sci., 38, 2617–2628, https://doi.org/10.13227/j.hjkx.201611119, 2017.
Wang, R., Wang, X., Cheng, S., Zhu, J., Zhang, X., Cheng, L., and Wang, K.: Determining an optimal control strategy for anthropogenic VOC emissions in China based on source emissions and reactivity, J. Environ. Sci., 136, 248–260, https://doi.org/10.1016/j.jes.2022.10.034, 2024.
Wu, Y., Yang, Y., Shao, M., and Lu, S.: Missing in total OH reactivity of VOCs from gasoline evaporation, Chin. Chem. Lett., 26, 1246–1248, https://doi.org/10.1016/j.cclet.2015.05.047, 2015.
Yan, L., Zheng, B., Geng, G., Hong, C., Tong, D., and Zhang, Q.: Evaporation process dominates vehicular NMVOC emissions in China with enlarged contribution from 1990 to 2016, Environ. Res. Lett., 16, 124036, https://doi.org/10.1088/1748-9326/ac3872, 2021.
Yang, X., Wang, H., Tan, Z., Lu, K., and Zhang, Y.: Observations of OH radical reactivity in field studies, Acta Chim. Sinica, 77, 613–624, https://doi.org/10.6023/A19030094, 2019.
Yue, T., Yue, X., Chai, F., Hu, J., Lai, Y., He, L., and Zhu, R.: Characteristics of volatile organic compounds (VOCs) from the evaporative emissions of modern passenger cars, Atmos. Environ., 151, 62–69, https://doi.org/10.1016/j.atmosenv.2016.12.008, 2017.
Yue, T., Wang, M., Huang, Z., Wang, X., Wang, Z., Wang, B., Zhang, L., and Wang, S.: Characteristics of evaporative emissions from light-duty vehicles and effects of ambient temperature on evaporative emissions of light-duty vehicles, Res. Environ. Sci., 33, 73–81, https://doi.org/10.13198/j.issn.1001-6929.2019.07.25, 2020.
Zhang, Y. and Hua, C.: Research on the leakage detection of the operational vehicles fuel evaporation system, Automob. Appl. Technol., 49, 112–115, https://doi.org/10.16638/j.cnki.1671-7988.2024.021.021, 2024.
Zhang, Y., Wang, X., Zhang, Z., Lü, S., Shao, M., Lee, F. S. C., and Yu, J.: Species profiles and normalized reactivity of volatile organic compounds from gasoline evaporation in China, Atmos. Environ., 79, 110–118, https://doi.org/10.1016/j.atmosenv.2013.06.029, 2013.
Zhao, R., Huang, L., Zhang, J., and Ouyang, F.: Emissions characteristics of volatile organic compounds (VOCs) from typical industries of solvent use in Chengdu City, Acta Scien. Circum., 38, 1147–1154, https://doi.org/10.13671/j.hjkxxb.2017.0362, 2018.
Zhong, M., Tian, J., and Ye, D.: China's total VOCs control program research and suggestions during the 14th Five-Year Period, Environ. Impact Assess., 43, 1–6, https://doi.org/10.14068/j.ceia.2021.02.001, 2021.
Zhu, Q., Liu, J., Zhao, X., and Luo, J.: Estimation of light-duty vehicles total evaporative emissions in Beijing, China Environ. Sci., 42, 1066–1072, https://doi.org/10.19674/j.cnki.issn1000-6923.2022.0070, 2022.
Zhu, R., Hu, J., Bao, X., He, L., Lai, Y., Zu, L., Li, Y., and Su, S.: Investigation of tailpipe and evaporative emissions from China VI and Tier 2 passenger vehicles with different gasolines, Transport Res. D-Tr. E, 50, 305–315, https://doi.org/10.1016/j.trd.2016.10.027, 2017.
Zi, T., Wang, P., Liu, B. Zhou, Y., Shen, X., Zhang, L., Lu, Y., Feng, Q., Yang, Y., and Lang, J.: Evaporative emission characteristics of VOCs from in-use light-duty gasoline vehicles, Atmos. Environ., 312, 120024, https://doi.org/10.1016/j.atmosenv.2023.120024, 2023.