the Creative Commons Attribution 4.0 License.
the Creative Commons Attribution 4.0 License.
 | 21 Oct 2025
Unequal socioeconomic exposure to drought extremes induced by stratospheric aerosol injection
Weijie Fu
Chenguang Tian
Rongbin Xu
Yuming Guo
As global temperature rises, the severity and frequency of droughts are projected to increase. Stratospheric aerosol injection (SAI) has been proposed as a potential solution to reduce surface temperatures, but its effectiveness in alleviating drought extremes remains unclear. Here, we assess the global impacts of SAI on drought extremes based on experiments from the Geoengineering Model Intercomparison Project phase 6 (GeoMIP6) and the Geoengineering Large Ensemble Project (GLENS). By 2100, the frequency of extreme droughts is projected to increase by 7.33 % under the high-emission Shared Socioeconomic Pathways 5 (SSP5-8.5) scenario relative to present day. SAI reduces this increase by 1.99 % in GeoMIP6, and by 1.80 % in GLENS compared with Representative Concentration Pathways 8.5 (RCP8.5). Attribution analyses show that SAI-induced cooling alone reduces extreme drought frequency by 3.42 % in GeoMIP6 and 4.28 % in GLENS relative to their respective high-emission scenarios, outweighing the 2.12 % increase driven by SAI-induced precipitation reductions under the same conditions. However, these rainfall deficits lead to substantial inequities in drought exposures. Compared to developed nations, countries with less development experience smaller reductions, or even increases, in economic and population exposure to extreme drought under SAI relative to SSP5-8.5 or RCP8.5. These findings suggest that the current SAI strategies in GeoMIP6 and GLENS may induce the risk of unintentionally worsening regional hydroclimatic disparities.
- Article
(9572 KB) - Full-text XML
- BibTeX
- EndNote


Global warming is profoundly shaping the Earth with reduced sea ice (Diffenbaugh et al., 2013), raised sea level (Tebaldi et al., 2021), and increased climatic extremes (Song et al., 2022). Persistent warming has expanded the land area with decreased precipitation but increased evaporation, enhancing the frequency and severity of global drought events (Dai, 2011b; Trenberth et al., 2014; Samaniego et al., 2018). As one of the most destructive and persistently widespread natural disasters, drought can have significant impacts on human survival, the economy, and societal structures (Dai, 2013; Carrão et al., 2016; Yue et al., 2021). During 1970–2019, droughts were responsible for 34 % of disaster-related fatalities(Smith, 2021) and annually erode 12 million ha of arable land (Diallo, 2008), leading to reduced agricultural yields, increased food prices, and escalated economic instability especially for vulnerable populations (Rusca et al., 2023).
Mitigating global warming requires reducing anthropogenic GHG emissions. However, due to the inertia of climate system, global temperature responses lag behind emission reductions. Geoengineering, particularly Solar Radiation Management (SRM), has been proposed as a potential climate change mitigation approach (Ricke et al., 2012). The SRM aims to reflect incoming solar radiation back into space (Irvine et al., 2012), reducing global surface temperatures (Irvine et al., 2019; Duffey and Irvine, 2024). As one type of SRM, stratospheric aerosol injection (SAI) has gained significant attentions due to its cost-effectiveness and practicality (Smith and Wagner, 2018; Smith, 2020). This method introduces reflective aerosols into the stratosphere to increase the Earth's albedo (Pope et al., 2012), mimicking the cooling effects observed after volcanic eruptions (Wilson et al., 1993).
Earth System Models (ESMs) are vital for analyzing climatic impacts and the potential side effect of SRM before its implementation (MacMartin and Kravitz, 2019). The Geoengineering Model Intercomparison Project phase 6 (GeoMIP6) (Kravitz et al., 2011; Visioni et al., 2023) was established to assess climatic responses to geoengineering using multiple ESMs under various forcing scenarios. In contrast, the Geoengineering Large Ensemble (GLENS) project performed multiple experiments with a single ESM, exploring different injection strategies (Tilmes et al., 2018). Ensemble of these simulations indicated that SAI could alter global hydrological cycle relative to high emission scenario (Jiang et al., 2024; Rezaei et al., 2025). Notably, the magnitude and spatial pattern of rainfall changes exhibit strong dependence on injection latitudes and altitude (Zhao et al., 2021; Krishnamohan and Bala, 2022). Region-specific analyses suggest that specific SAI deployment strategies may mitigate extreme drought risks under the Shared Socioeconomic Pathways 5 (SSP5-8.5) scenario. For instance, in Cape Town, South Africa, model ensembles indicate a potential 90 % reduction in extreme drought risk when applying the GLENS injection protocol (Botai et al., 2017; Odoulami et al., 2020). However, these benefits are highly contingent upon the specific implementation strategy: different SAI designs or distinct greenhouse gas background conditions (e.g., SSP2-4.5) could result in neutral or adverse outcomes (Du et al., 2025). Nevertheless, the benefits of SAI on reducing drought extremes remain unclear on the global scale.
In this study, we use ensemble simulations from both GeoMIP6 and GLENS to assess (1) how SRM strategies alter the magnitude and spatial distribution of extreme drought risk under high-emission scenarios, and the climatic mechanisms that govern these changes; and (2) how the magnitude of SRM-derived drought exposure reduction varies across countries with different levels of socioeconomic development. For GeoMIP6, we consider two types of SRM including G6solar by reducing solar constant and G6sulfur by SAI. We employ the self-calibrating Palmer Drought Severity Index (scPDSI) to quantify drought levels, due to its ability to depict drought state through dynamically calculated climatic thresholds adapted to regional environment (Wells et al., 2004; Dai, 2011a). We quantify changes in the probability of extreme drought with and without SRM interventions under high-warming scenarios (SSP5-8.5 for GeoMIP6 and RCP8.5 for GLENS), both of which assume strong warming with radiative forcing reaching 8.5 W m−2 by the end of this century. We explore uncertainties associated with different SAI strategies, including the fixed equatorial injection approach adopted in G6sulfur (GeoMIP6) and the multi-latitude aerosol placement used in GLENS. We pay special attentions to the possible disparity of extreme drought responses to the SAI among countries with different socioeconomic development.
2.1 Model data
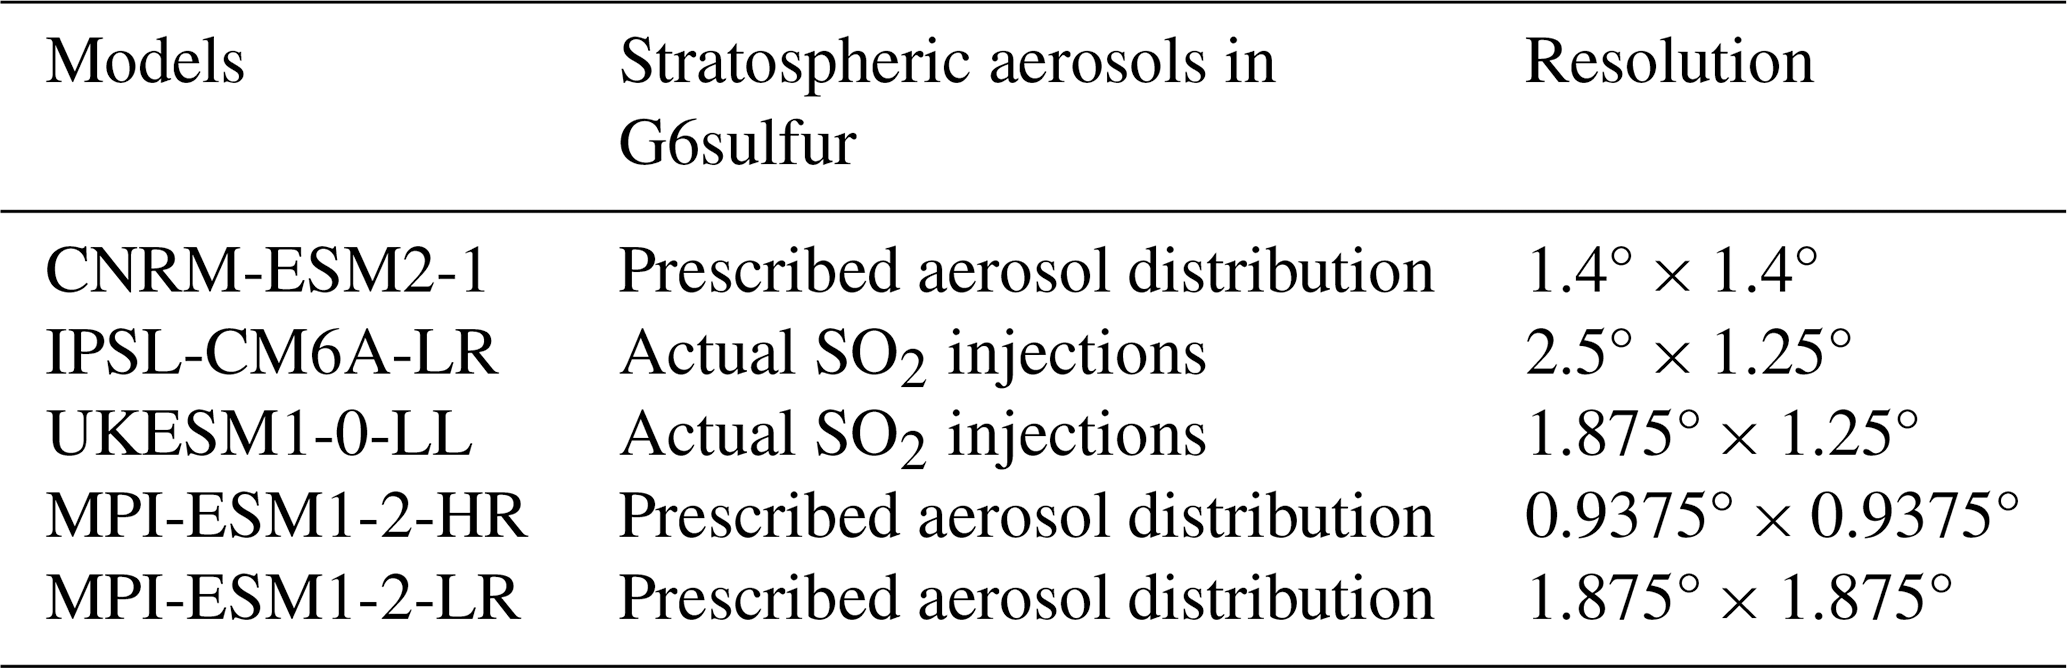
We use outputs from multiple models participating in the G6solar and G6sulfur experiments of GeoMIP6 (Table 1). The G6sulfur experiment involves the injection of sulfur dioxide (SO2) within the 10° S–10° N latitude band along the 0° longitude at altitudes of 18–20 km from the year 2020. The SO2 injection rate is adjusted annually or every decade to lower the global mean surface air temperature from the high forcing scenario (SSP5-8.5) to the medium forcing scenario (SSP2-4.5) (Kravitz et al., 2015). This scheme aims to achieve a more uniform global distribution of sulfate aerosols compared to the single-point injections (English et al., 2012). For some models, prescribed sulfate distribution in stratosphere is applied. As a comparison, G6solar experiment directly reduces the solar constant in an idealized manner to achieve the same reduction in radiative forcing from the high to medium scenario (Kravitz et al., 2015).We use historical simulations and future projections under the SSP5-8.5 scenario to assess the mitigating effects of different SRMs. Some models provide multiple realizations for both historical and SSP5-8.5 experiments. We analyze data only from ensemble members that have the same realizations in both the G6sulfur and G6solar experiments. As a result, we select five available climate models participating in the GeoMIP6 experiment (Table 1) with qualified outputs to calculate changes in drought state from the present day to the end of the 21st century. All model data with varied spatial resolutions are interpolated to the same grid of 1° × 1° to facilitate the calculation of multi-model ensemble mean. Inter-model consistency was evaluated based on the number of models that aligned with the direction of the multi-model ensemble change. Changes in the multi-model ensemble were deemed robust if more than four models exhibited changes with the same sign; otherwise, these changes were considered uncertain.
Table 1Summary of the GeoMIP6 models used in drought assessment.
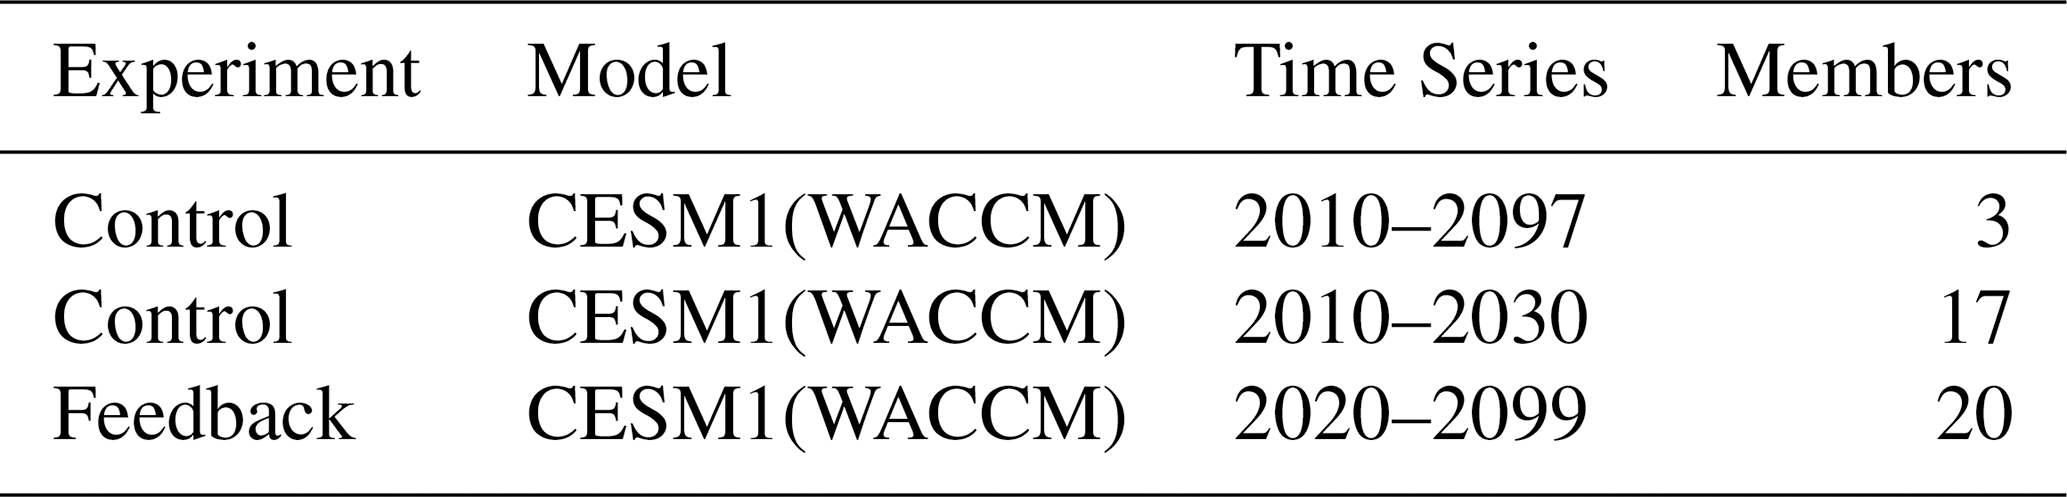
To evaluate the robustness of our findings, we conducted a comparative analysis with the Geoengineering Large Ensemble Project (GLENS) (Tilmes et al., 2018). Unlike the idealized equatorial injection strategy employed in G6sulfur, GLENS implements a feedback-control algorithm designed to maintain global mean surface temperature, interhemispheric temperature gradients, and equator-to-pole temperature gradients at 2020 levels under a high-emission RCP8.5 scenario (Kravitz et al., 2017). This approach injects sulfate aerosols at four locations along 180° longitude (15° N, 15° S, 30° N, and 30° S) at latitudinally optimized altitudes. Based on predefined temperature targets, the sulfate aerosol injection rate is dynamically adjusted at each location. The GLENS dataset consists of a 20-member ensemble generated by the NCAR Community Earth System Model (CESM1), which incorporates the Whole Atmosphere Community Climate Model (WACCM) as its atmospheric component (Table 2). Our analysis exclusively considered ensemble members with continuous simulations spanning the entire 21st century across both feedback and control experiments (001, 002, and 003). This comparative framework allows us to assess the sensitivity of drought extremes and socioeconomic exposure to different SAI deployment strategies.
Table 2Summary of the GLENS experiment used in drought assessment.
2.2 Socioeconomic data and exposure
We use Gross Domestic Product (GDP) data (Geiger, 2018) with a spatial resolution of 0.25° from 2000 to 2020, along with GDP projections for 2025–2100 under the SSP5-8.5 scenario (Dellink et al., 2017). The GDP values are standardized to the 2005 purchasing power parity (PPP) international dollar for comparability (Geiger, 2018; Wang and Sun, 2022). Population data at 1 km resolution, including urban, rural, and total populations, are sourced from the Socioeconomic Data and Applications Center (SEDAC) for five-year intervals from 2000 to 2020 (Jones and O'Neill, 2020). For future projections, we use population data at ten-year intervals and one-eighth degree resolution in space under the SSP5-8.5 scenario for 2020–2100 (Jones and O'Neill, 2016, 2020). The GDP (or population) exposure is calculated as the frequency of extreme drought multiplied by the GDP (or population) values in each grid cell (Sun et al., 2022).
The Human Development Index (HDI) from the Human Development Report is used to differentiate the economic development of various countries and regions (UNDP, 2024). In total, 158 countries with land area larger than 10 000 km2 (the size of at least one 1° × 1° grid) are selected and separated into four HDI groups including low (HDI < 0.55), medium (0.55 < HDI < 0.699), high (0.7 < HDI < 0.799), and very high (HDI > 0.8) levels following the suggested criteria (UNDP, 2024). The gridded GDP or population exposure is summed up for each country, and then aggregated into four HDI groups accordingly.
2.3 Drought indices
We use scPDSI as the primary metric to quantify the spatiotemporal variations of drought events. The scPDSI is calculated separately for each model with the corresponding meteorological variables. At each grid, monthly precipitation (P), potential evapotranspiration (PET) and the available water holding capacity (AWC) are used to assess drought severity based on dynamically computed thresholds from historical reference period climates (Wells et al., 2004). There are two common methods for calculating PET: the Penman-Monteith and Thornthwaite parameterization schemes (Penman and Keen, 1948; Thornthwaite, 1948; Monteith, 1965). In this study, we use the Penman-Monteith equation, which calculates PET base on surface air temperature (T, °C), net surface radiation (Rn, MJ d−1 m−2), surface specific humidity (q, kg kg−1), 2 m wind speed (U, m s−1), and surface air pressure (p, kPa):
where Δ is the slope of the saturation vapor pressure curve, γ is psychrometric coefficient, λ is latent heat of vaporization, (es−ea) is the saturation vapor pressure deficit, which can be calculated by air temperature, specific humidity, and air pressure at the surface:
Since CMIP6 provides wind speeds at 10 m above the surface, we convert them to wind speed at 2 m (Allan et al., 1998):
Here z = 10 m. The calculation of PDSI requires the use of P, PET, and AWC to calculate eight variables related to soil moisture based on the water balance: evapotranspiration (ET), recharge (R), runoff (RO), loss (L), potential evapotranspiration (PE), potential recharge (PR), potential runoff (PRO), and potential loss (PL) (Webb et al., 2000). These variables are then used to calculate the Climatically Appropriate For Existing Conditions' (CAFEC) precipitation ():
Here, α, β, γ and δ are the water-balance coefficients, which are derived from ET, R, RO, and L divided by their potential values, respectively. The difference between P and is defined as moisture departure (d):
The d is scaled to a moisture anomaly index (Z index) using climatic characteristic (K):
K can be calculated by potential evapotranspiration, recharge, runoff, precipitation, loss and moisture departure:
Where is the average monthly moisture departure, 17.67 is an empirical constant. The PDSI for a given month is calculated using the Z index and empirical parameters:
The duration factors (0.897 and ) are empirical parameters obtained by Palmer from previous studies (Alley, 1984). The original drought index, PDSI, is calculated using fixed climatic thresholds that are not comparable across different climatic regions. To address such limitation, the scPDSI employs dynamic climatic characteristic and duration factors based on the regional environment, offering the advantage of both spatial and temporal comparability (Wells et al., 2004; Dai, 2011a; van der Schrier et al., 2013). In the calibration of PDSI, monthly K was adjusted using local climate statistics to ensure that extreme drought events (PDSI ≤ −4.0) and wet periods (PDSI ≥ 4.0) occur at frequencies of approximately 2 %. The duration factors were derived from linear regression analyses of accumulated Z-index values during extreme drought and wet conditions, thereby enhancing sensitivity to regional climate variability.
The standard scPDSI values range from −4 to 4, representing conditions from extremely dry to extremely wet. In this study, an extreme drought month is defined if scPDSI value is lower than −4. The frequency of drought extremes for a given scenario is calculated as the fraction of extreme drought months out of a 240-month period. The absolute changes of such frequency are compared among scenarios and SAI strategies. Additionally, we compute other drought indices for comparisons, including the PDSI, Palmer Modified Drought Index (PMDI), Palmer Hydrological Drought Index (PHDI), and Palmer Z Index (Z-index).
2.4 Mitigation Potential (MP)
We define the MP value to quantify the extent to which SRM could mitigate the increased drought risks induced by climate warming:
Here, Phist represents the drought probability or the exposure (either GDP or population) to drought extremes (scPDSI < −4) at present day averaged for the period of 1995–2014. PSSP585 and PSRM represent the mean drought probability/exposure at 2081–2100 under the SSP5-8.5 and SRM (G6solar or G6sulfur) scenarios, respectively. We calculate the MP values for four different HDI groups of countries by summing the GDP or population exposure within each HDI group. For individual countries, we calculate the MP values based on the GDP or population exposure for that specific country. Our analyses showed that the denominator of Eq. (10) is positive for all four HDI groups and for 96 % of the 158 countries, indicating that extreme drought exposure is projected to increases in the future under the SSP5-8.5 scenario. A negative MP value indicates that SRM helps mitigate the warming-induced increase of extreme drought exposure, and vice versa. The units of the MP value can be expressed as a percentage (when MP < 1) or as a ratio (when MP > 1).
2.5 Drought Exposure Disparity (DED)
The DED values are defined to assess the disparity of extreme drought exposure among countries with different HDI:
Here, Plow HDI represents the sum of the exposure (GDP or population) to drought extremes (scPDSI < −4) for all low HDI countries. Pvery high HDI and Phigh HDI are exposures in very high HDI countries and high HDI countries, respectively. An increase of DED indicates an enhanced inequality for the socioeconomic exposure to drought extremes.
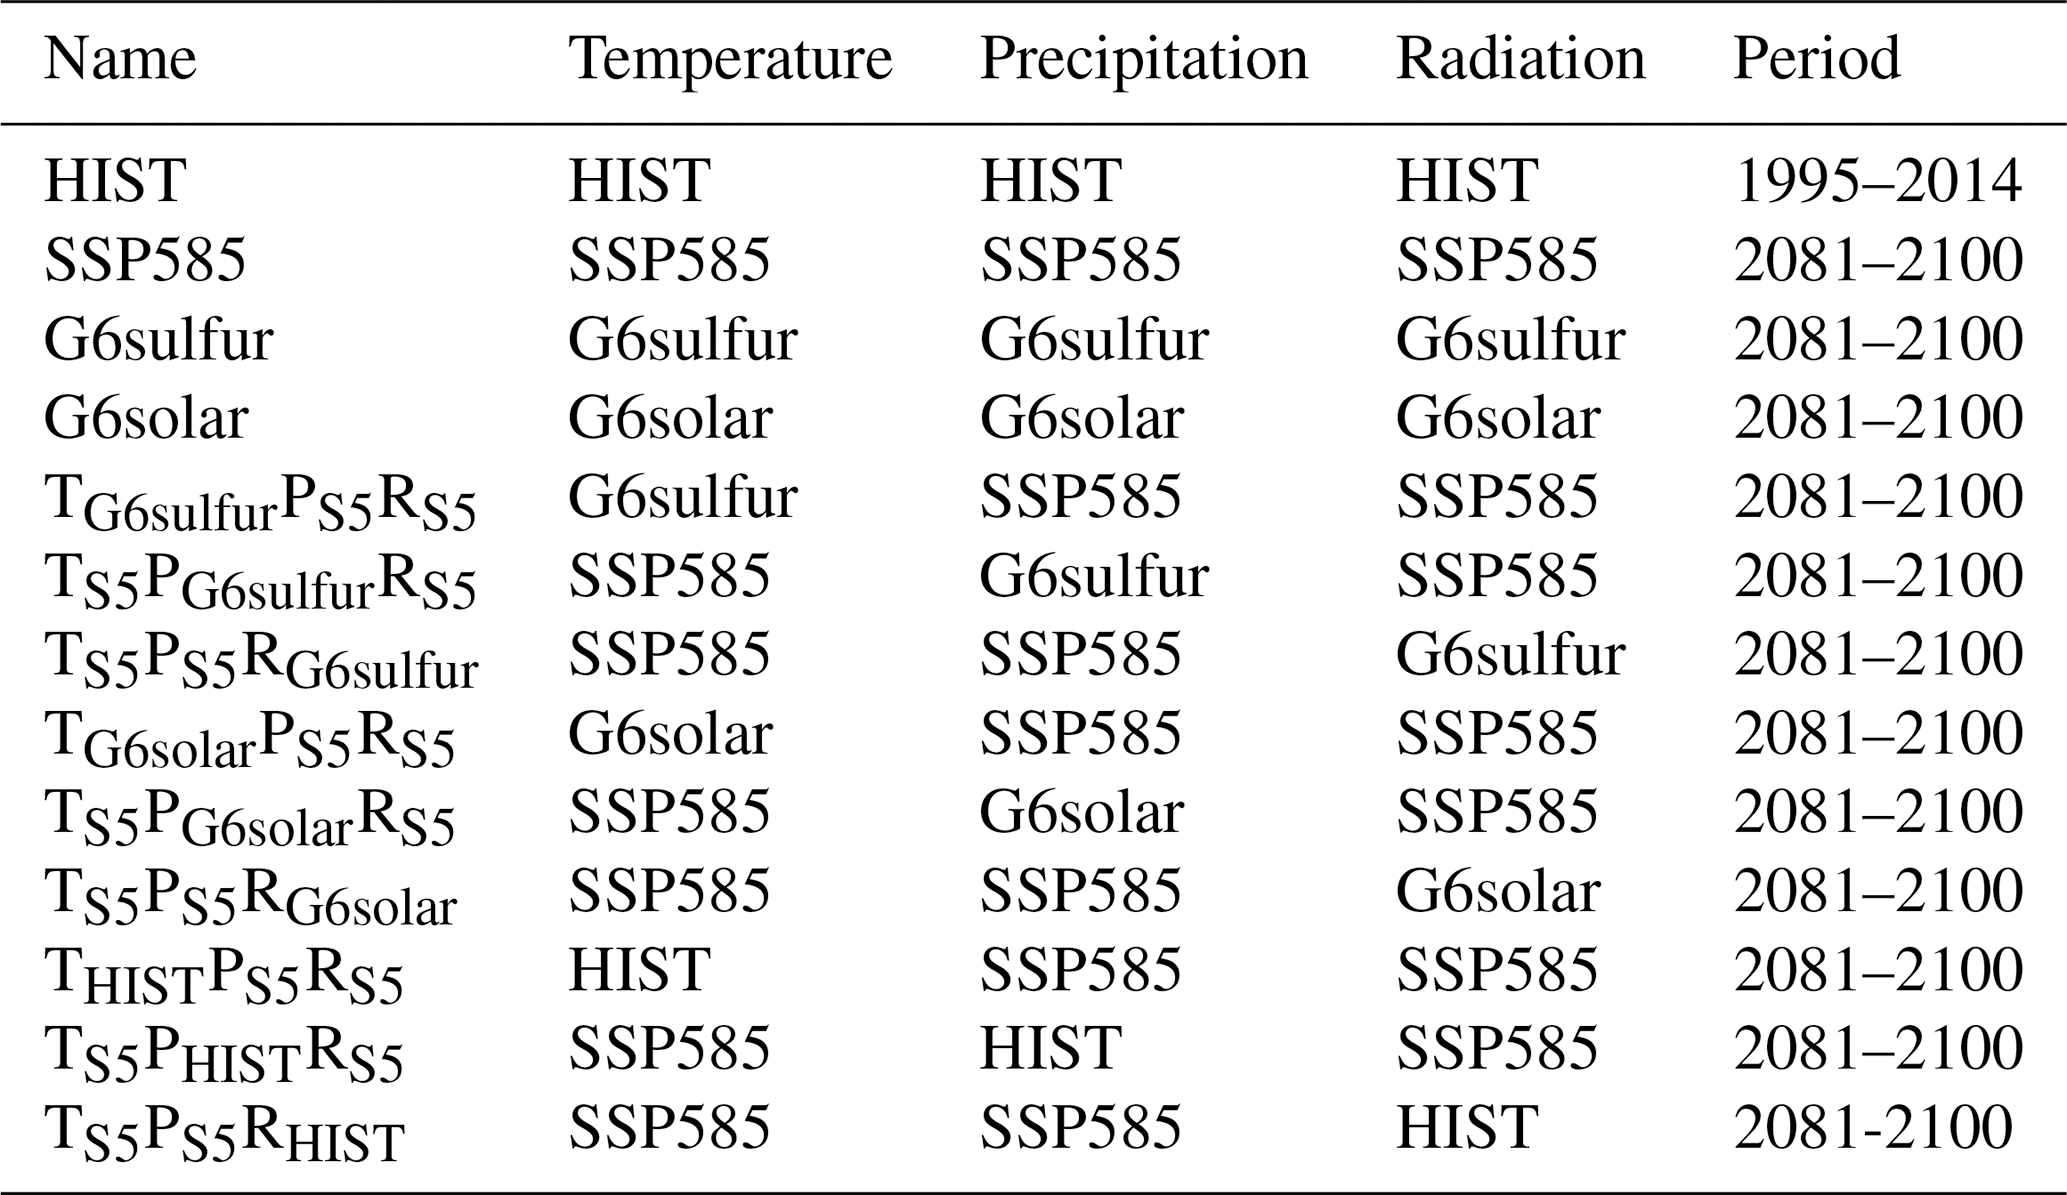
Table 3Summary of scPDSI calculated with varied meteorological forcings.
2.6 Calculations and attributions of scPDSI
For each climate model of GeoMIP6, we collect monthly temperature, precipitation, and radiation to calculate historical scPDSI using present-day climatic variables and future scPDSI using meteorology from the SSP5-8.5, G6sulfur, or G6solar scenarios (Table 3). To identify the main drivers of scPDSI changes, we perform 9 additional sensitivity offline calculations by combining historical meteorological forcings with future projections (Table 3). In these offline calculations, we replace one variable at a time from the SSP5-8.5 scenario with the corresponding future projections from GeoMIP6 scenarios. The differences in scPDSI between sensitivity experiments and the full sets of future projections (SSP5-8.5 or GeoMIP6) indicate the relative impact of individual climatic forcing on changes in scPDSI. We select 1995–2014 as the historical reference period and 2081–2100 as the future projection period for analyses. Similarly, we conducted offline calculations of scPDSI for the GLENS and RCP8.5 scenarios.
2.7 Model evaluations
Monthly precipitation and temperature from the CRU TS (Climate Research Unit Gridded Time Series) dataset version 4.07 are used to evaluate the model's performance in reproducing present-day climate (Harris et al., 2020). Both the CRU data and model output are interpolated to 1° × 1°. We calculate the correlation coefficient (R, 1 is best), standard deviation ratio (SDEV, 1 is best), and centered root-mean-square error (CRMSE, 0 is best) between the CRU data and model simulations (Taylor, 2001). For temperature, all models reproduce the observed spatial pattern with R > 0.98 and SDEV ranging from 0.95 to 1.08 (Fig. 1a). The CRMSE for most models is less than 2, except for IPSL-CM6A-LR (2.24). For precipitation, R ranges from 0.74 to 0.85, SDEV ranges from 0.82 to 1, and CRMSE ranges from 0.99 to 1.55 (Fig. 1b). Although the R for simulated precipitation is lower than that for temperature, the CRMSE is generally lower. Overall, the selected models reasonably reproduce the observed meteorology with low biases. While all models accurately capture the changing characteristics of temperature and precipitation, differences in parameterization schemes for radiation, cloud-aerosol interactions, aerosol microphysics, and other factors result in variations in the simulated patterns of meteorological factors (Mauritsen et al., 2019; Visioni et al., 2021). Therefore, we use the multi-model ensemble to minimize biases caused by inter-model variations.
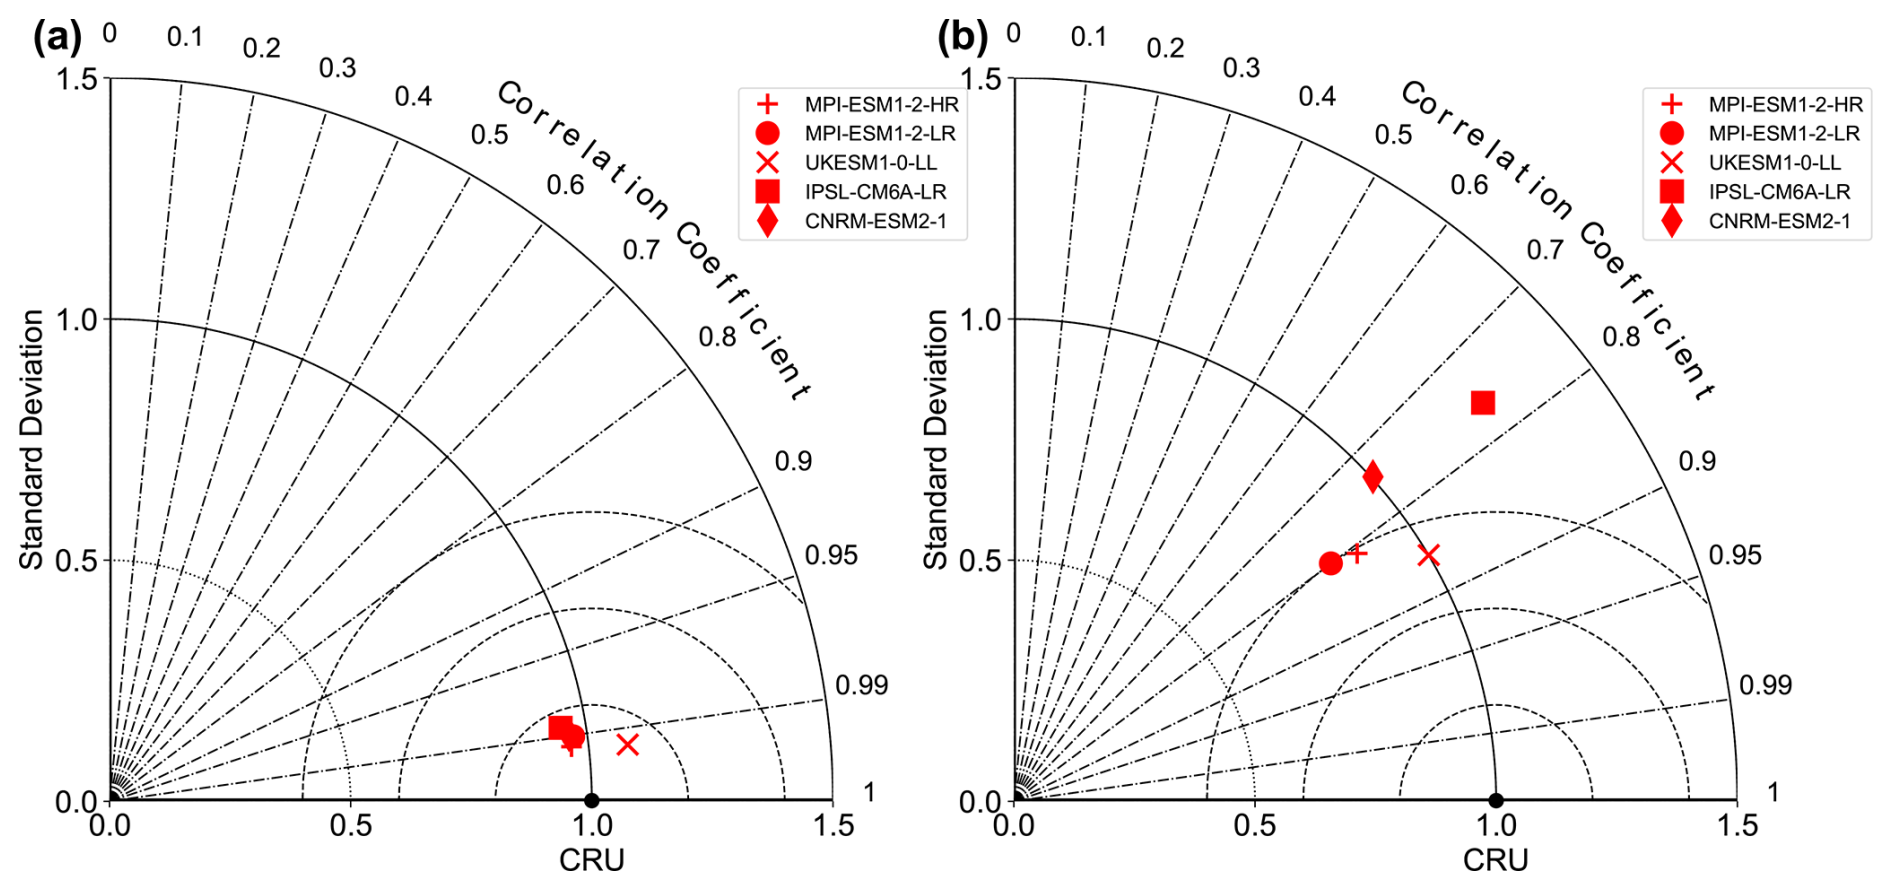
Figure 1Evaluation of climate models from GeoMIP6. Results shown are the Taylor diagram of annual mean (a) temperature and (b) precipitation for GeoMIP6 models during the period of 1995–2014.
3.1 Responses of temperature and precipitation to SRM
By the end of 21st century, global land surface air temperature is projected to increase by 5.73 °C under the SSP5-8.5 scenario relative to 1995–2014 (Fig. 2a). Such warming is more significant at the mid-to-high latitudes in Northern Hemisphere (NH). The pronounced temperature rise intensifies hydrological cycle, evidenced by enhanced water vapor content in lower troposphere (Held and Soden, 2006), resulting in an increased global average precipitation of 0.18 mm d−1 (Fig. 2d). However, a discernible reduction of rainfall is noted in regions including northern South America, southern Africa, Australia, southern North America, and western Europe.
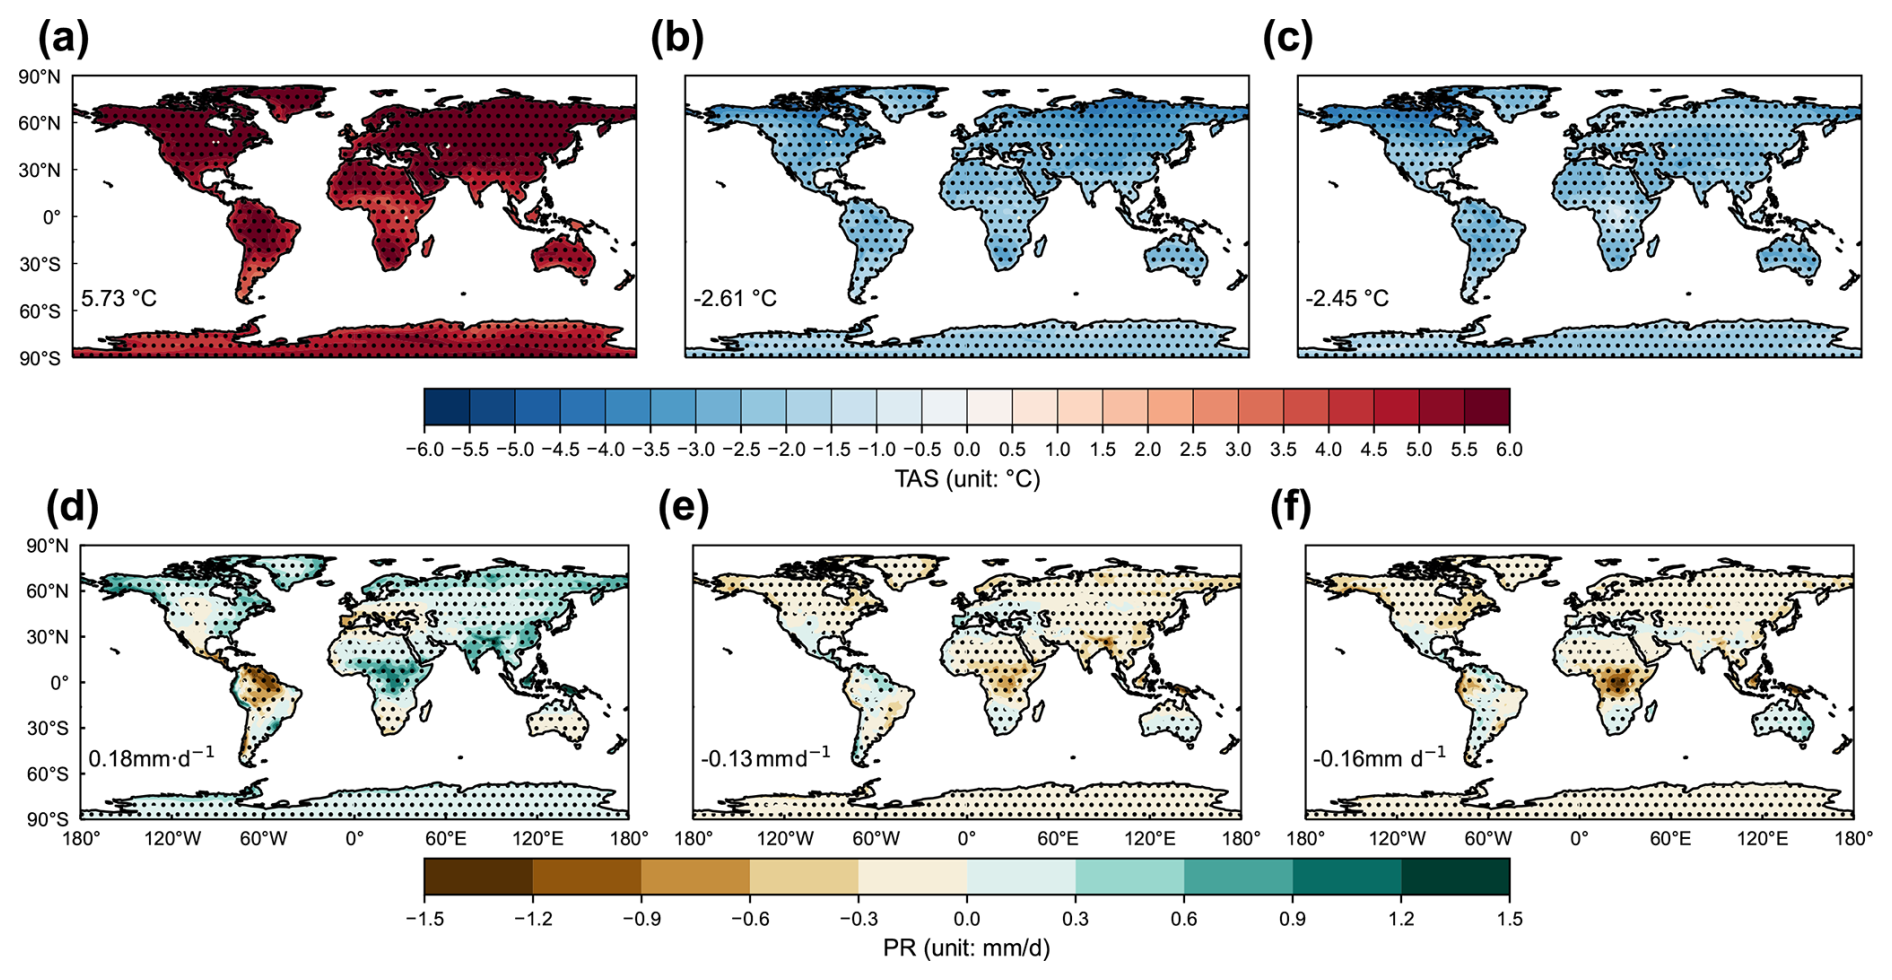
Figure 2Climatic responses to global warming and SRM in GeoMIP. Results shown are the spatial pattern of annual mean changes in (a, b, c) surface air temperature (TAS) and (d, e, f) precipitation (PR) at 2081–2100 under (a, d) SSP5-8.5 scenario relative to the historical period of 1995–2014, as well as that under (b, e) G6solar and (c, f) G6sulfur scenarios relative to SSP5-8.5 both at 2081–2100. The dotted areas indicate regions where at least four out of five models show changes with the same signs. The mean value of the difference over global land surface is shown at the lower-left of each panel.
Reduction of the solar constant in G6solar causes an intense cooling worldwide (Fig. 2b), resulting in a decrease in global average land surface air temperature of approximately −2.61 °C and counteracting 45.6 % of the warming in SSP5-8.5 (Visioni et al., 2021). For G6sulfur, the injection of sulfur aerosols (or SO2) contributes to a reduction in global average surface temperature of about −2.45 °C, offsetting 42.8 % of the SSP5-8.5 warming (Fig. 2c). Although both SRMs mitigate less than half of the temperature rise, they offset most of the increase in precipitation attributable to global warming (Fig. 2e and f) (Niemeier et al., 2013; Ricke et al., 2023). The SRM-induced tropospheric cooling weakens tropical circulation, inhibiting convection and subsequently reducing precipitation (Ferraro et al., 2014). This reduction in temperature and precipitation is more pronounced in the GLENS simulations (Fig. 3). By the end of this century, the GLENS strategy successfully maintained global mean surface temperature at 2020 level, reducing the global average by 5.48 °C compared to the RCP8.5 scenario (Tilmes et al., 2018; Kravitz et al., 2019). Due to the different injection magnitude and locations from GeoMIP6, the GLENS injection results in more pronounced precipitation reduction in central Africa, India, and high-latitude regions of the NH (Da-Allada et al., 2020) (Fig. 3d).
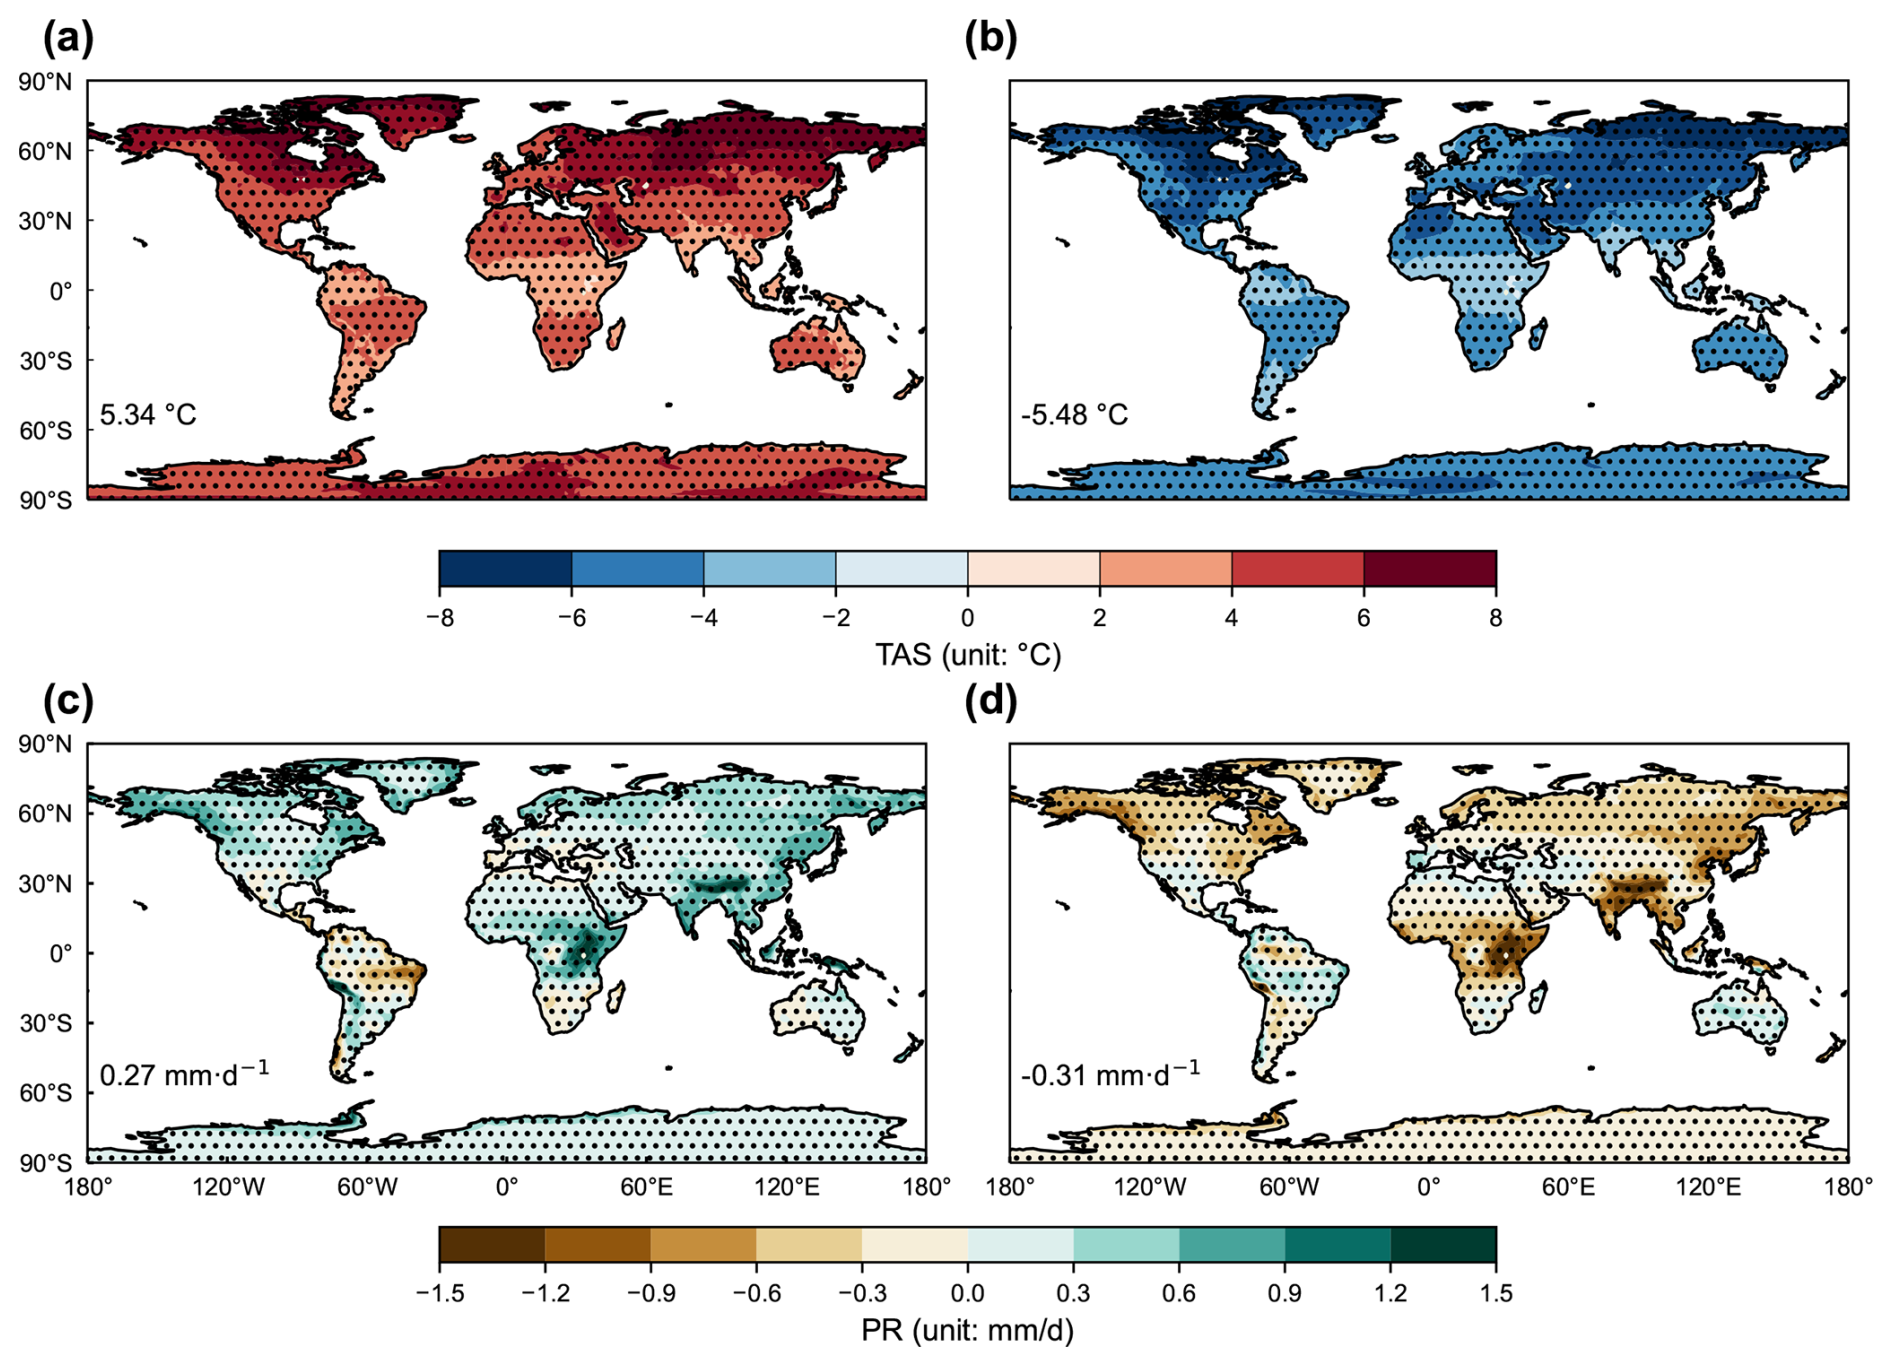
Figure 3Climatic responses to global warming and SAI in GLENS. Results shown are the spatial pattern of annual mean changes in (a, b) temperature (TAS) and (c, d) precipitation (PR) at 2075–2094 under (a, c) RCP8.5 scenario relative to 2010–2030 baseline, as well as that under (b, d) SAI scenarios relative to RCP8.5 at 2075–2094. The dotted areas indicate regions where at least two out of three members show changes with the same signs. The mean value of the difference over global land surface is shown at the lower left of each panel.
3.2 Responses of drought extremes to SRM
Following the intense warming, frequency of extreme drought events increases by 7.33 % globally at 2081–2100 under the SSP5-8.5 scenario compared to the present period (Fig. 4a). Such an enhancement is more pronounced at the mid-to-high latitudes, especially in the Southern Hemisphere (SH, e.g., Australia and southern Africa) where precipitation is projected to decrease (Fig. 2d). In contrast, the wet tendencies in some tropical areas (e.g., India and central Africa) and boreal regions outweigh the local warming, resulting in alleviated drought stresses at the low or high latitudes of both hemispheres.
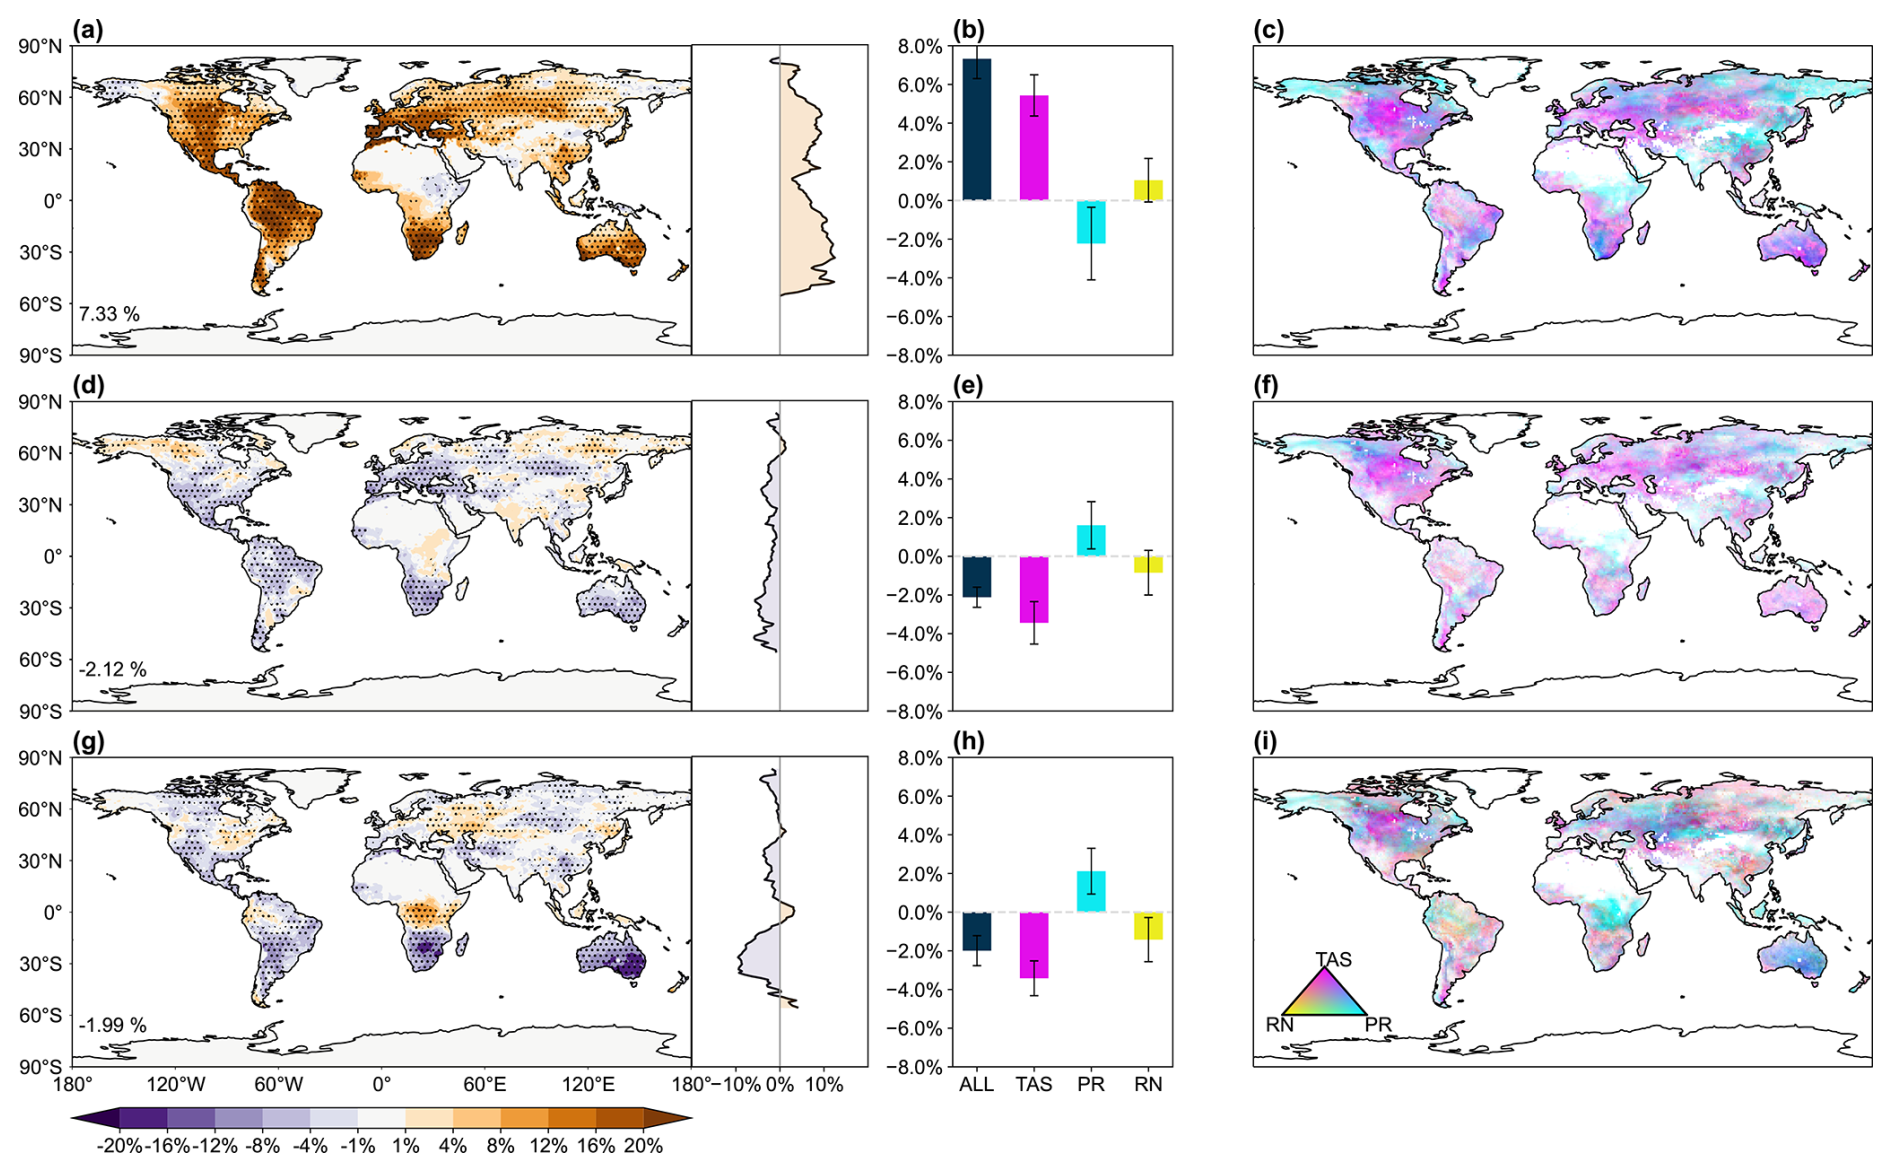
Figure 4Changes in frequency of drought extremes by global warming and SRM in GeoMIP. Results shown are the changes in frequency of drought extremes (scPDSI < −4) at 2081–2100 under (a) SSP5-8.5 scenario relative to the historical period of 1995–2014, as well as that under b G6solar and (g) G6sulfur scenarios relative to SSP5-8.5 both at 2081–2100. The dotted areas indicate regions where at least four out of five models show changes with the same signs. Latitudinal distribution is shown on the right of each panel. Contributions of temperature (TAS), precipitation (PR), and radiation (RN) to changes in drought extremes are also presented, with bars in (b, e, h) representing the mean and errorbars indicating one standard deviation of predictions from five GeoMIP models. Colors in (c, f, i) indicate the dominant drivers of drought extremes.
The SRM shows good potentials to decrease extreme drought occurrences. Compared to SSP5-8.5, G6solar reduces the frequency of extreme drought events by 2.12 % globally at 2081–2100 (Fig. 4d), mitigating 28.9 % of the SSP5-8.5-induced drought stress increment. Regionally, drought extremes are projected to decline uniformly at most latitudes, with stronger amelioration over Europe, Australia, and southern Africa where precipitation increases by G6solar (Fig. 2e). With G6sulfur, a similar reduction of 1.99 % (MP = 27.1 %) is predicted for global drought extremes but with large spatial heterogeneity (Fig. 4g). Most of such reductions are located in the SH, especially over Australia and southern Africa. In contrast, the frequency of drought extremes enhances significantly in central Africa, following the G6sulfur-induced precipitation deficit (Fig. 2f). This region has been enduring prolonged droughts since the 1990s, demonstrating high vulnerability to climate change impacts (Zhou et al., 2014; Kendon et al., 2019; Palmer et al., 2023).
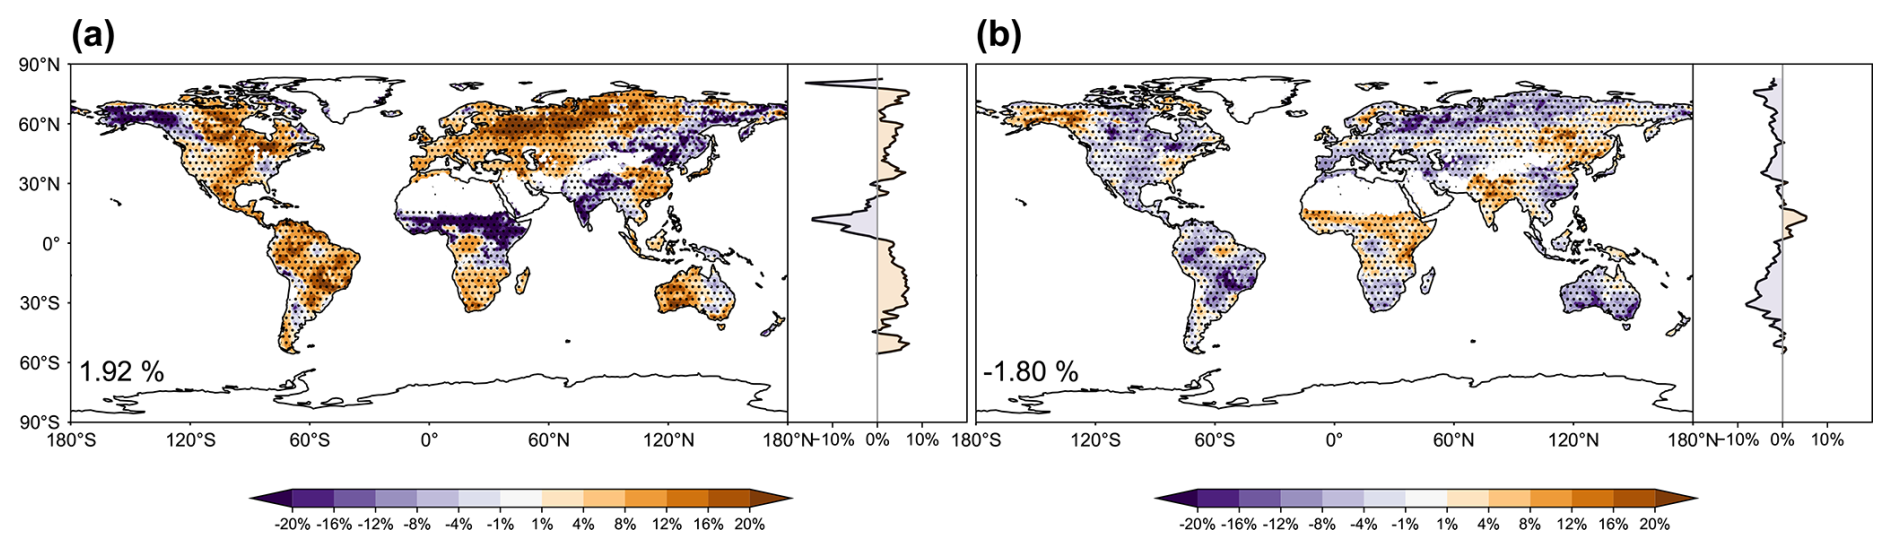
Figure 5Changes in frequency of drought extremes by global warming and SAI in GLENS. Results shown are the changes in frequency of drought extremes (scPDSI < −4) at 2075–2094 under (a) RCP8.5 scenario relative to 2010–2030 baseline, as well as that under (b) SAI scenarios relative to RCP8.5 at 2075–2094. The dotted areas indicate regions where at least two out of three members show changes with the same signs. Latitudinal distribution is shown on the right of each panel. The global mean value of the difference is shown at the lower left of each panel.
The SAI in GLENS exhibits stronger MP than G6sulfur in reducing the frequency of extreme droughts. Compared to the present day, the global drought probability increases by 1.92 % during 2075–2094 under the RCP8.5 scenario (Fig. 5a). This increment is smaller than the 7.33 % projected under SSP5-8.5 (Fig. 4a), because RCP8.5 produces a larger rise in global precipitation (Fig. 3c) than SSP5-8.5 (Fig. 2d). Relative to RCP8.5, SAI in GLENS reduces the global frequency of extreme droughts by 1.8 % (Fig. 5b), offsetting nearly all of the drought increase caused by RCP8.5 warming (MP = 93.8 %). Compared to G6sulfur, GLENS shows enhanced MP over northern Eurasia, South America, and North America. This may be attributed to its multi-latitude injection strategy and the dynamic adjustment of injection amounts at different latitudes to largely offset future warming (Fig. 3). In contrast, significant drought amplification is projected with GLENS in India, northern Asia, and Alaska relative to RCP8.5 (Fig. 5b), a pattern not seen under G6sulfur (Fig. 4g).
3.3 Attribution of extreme drought response to SRM
We performed sensitivity experiments to quantify the contributions of changes in temperature, precipitation, and radiation to the variations of extreme droughts. By the end of the century, changes in temperature and radiation under the SSP5-8.5 scenario lead to an increased frequency of extreme drought events compared to the historical period (Fig. 4b). Significant warming alone (Fig. 2a) enhances the frequency of extreme droughts globally by 5.43 % (Fig. 6a), with the most pronounced increases in the mid- and high-latitudes of the NH. Meanwhile, net radiation increases by 5.28 W m−2, thus intensifying PET and worsening drought frequency by 1.05 % (Fig. 6g). In contrast, the increase in global precipitation (Fig. 2d) under SSP5-8.5 reduces the frequency of drought extremes by 2.12 % globally and across most regions, except for southern Africa, Australia, and western Europe (Fig. 6d). On the global scale, warming is the dominant factor driving changes in drought extremes over 50.17 % of land area (excluding ice and desert), surpassing the 47.97 % influenced by precipitation (Fig. 4c).
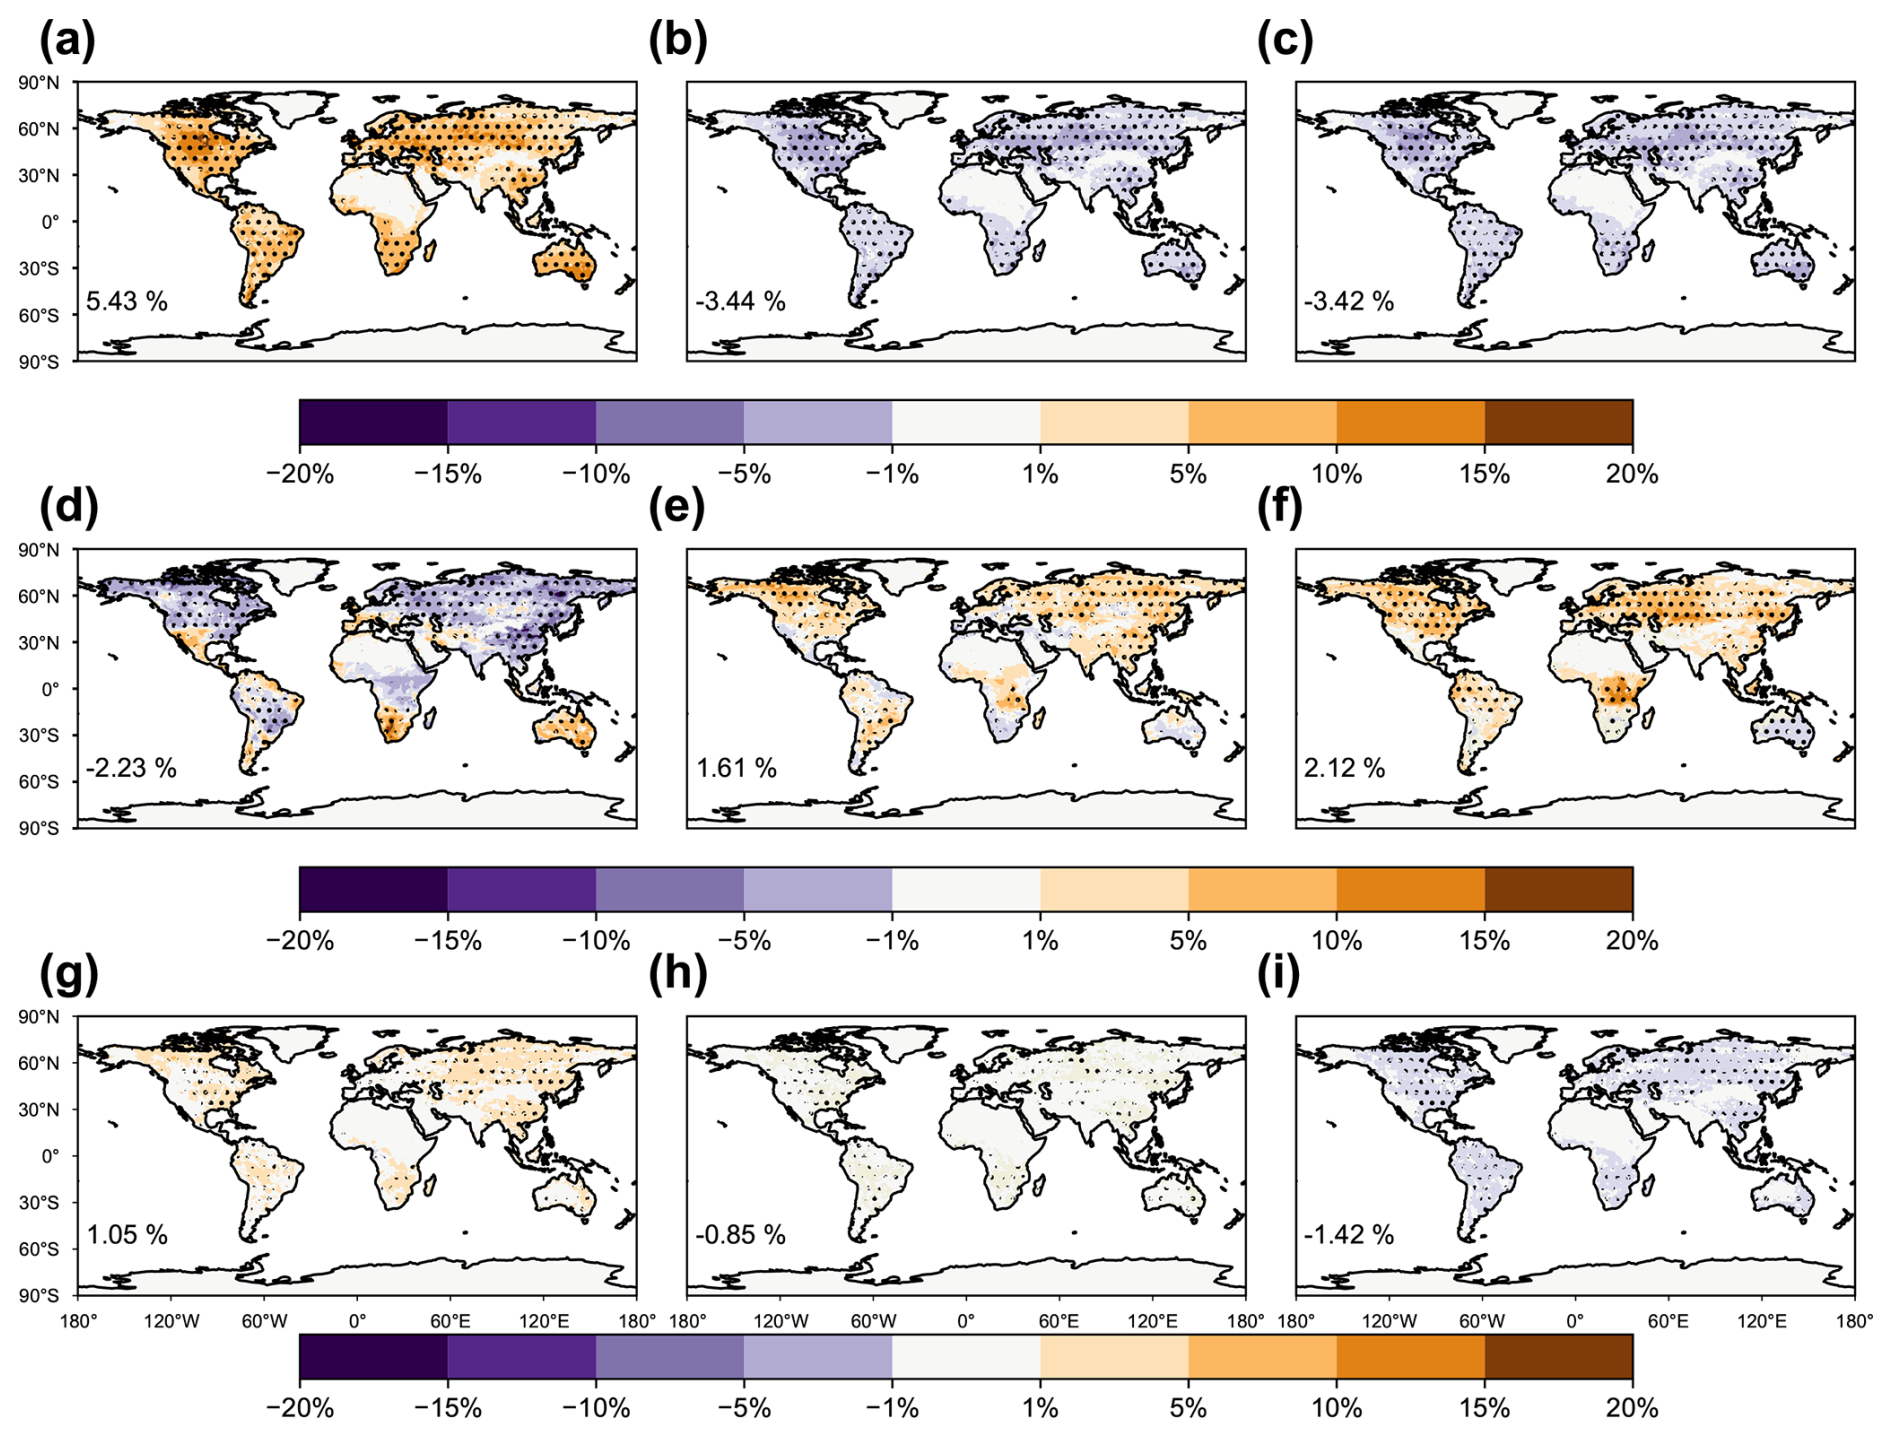
Figure 6Changes in frequency of drought extremes due to different climatic factors. Results shown are the changes in frequency of drought extremes (scPDSI < −4) at 2081–2100 under SSP5-8.5 scenario relative to the historical period of 1995–2014 attributable to (a) temperature, (d) precipitation, and (g) radiation changes, as well as that under (b, e, h) G6solar and (c, f, i) G6sulfur scenarios relative to SSP5-8.5 both at 2081–2100 attributable to (b, c) temperature, (e, f) precipitation, and (h, i) radiation changes. The dotted areas indicate regions where at least four out of five models show changes with the same signs.
Relative to SSP5-8.5, SRM-induced cooling alone reduces extreme drought frequency by 3.44 % in G6solar (Fig. 4e) and 3.42 % in G6sulfur (Fig. 4h). This mitigation shows a very similar spatial pattern between the two SRMs, with a more pronounced effect at mid-high latitudes in the NH (Fig. 6b and c). Additionally, the reduction of solar radiation due to dimming effects further alleviates global drought extremes by 0.85 % for G6solar (Fig. 6h) and 1.42 % for G6sulfur (Fig. 6i). However, SRM-induced rainfall deficits (Fig. 2e and f) increase the frequency of extreme drought by 1.61 % for G6solar (Fig. 6e) and 2.12 % for G6surfur (Fig. 6f) relative to SSP5-8.5 scenario, with the most significant impacts occurring in central Africa where the reduction in precipitation is at its maximum. These changes partly offset the cooling-induced mitigation, resulting in patchy responses of drought extremes in the NH (Fig. 4d and g). Compared to G6solar, the rainfall deficit is larger in G6sulfur, leading to an enhanced frequency of drought extremes in central Africa, the eastern U.S., and eastern Europe. Consequently, changes in precipitation act as the dominant driver of extreme drought over 48.0 % land areas in G6sulfur (Fig. 4i), larger than that of 39.9 % in G6solar (Fig. 4f).
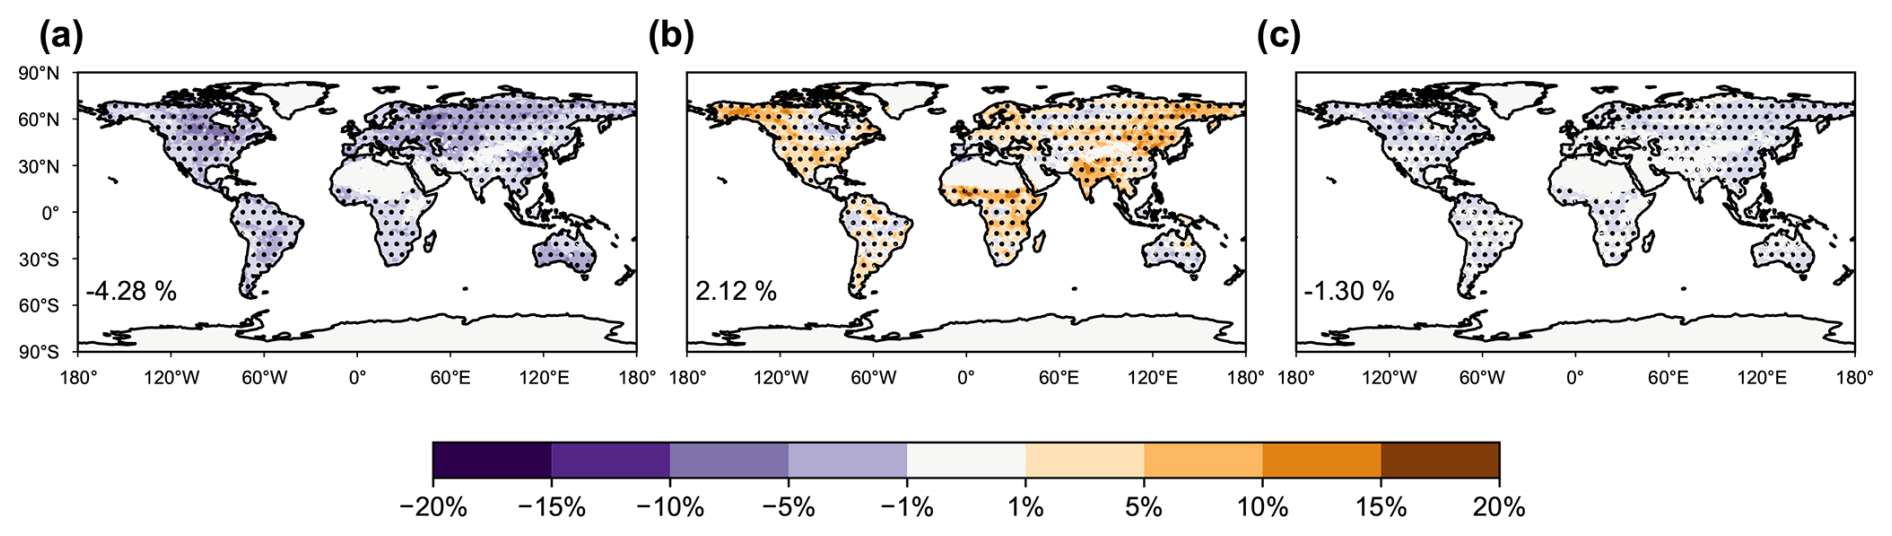
Figure 7The same as Fig. 6 but GLENS is applied. Results shown are the changes in frequency of drought extremes (scPDSI < −4) under SAI scenarios relative to RCP8.5 at 2075–2094 attributable to (a) temperature, (b) precipitation, and (c) radiation changes.
Compared with RCP8.5, the SAI-induced cooling in GLENS reduces the frequency of extreme droughts by 4.28 % by the end of the century (Fig. 7a). In contrast, the precipitation reduction in GLENS increases global extreme drought frequency by 2.12 % (Fig. 7b), with regional hotspots in central Africa, India, North America, and northern Asia, consistent with the spatial pattern of the SAI-induced rainfall deficit (Fig. 3d). These patterns resemble those in G6sulfur (Fig. 6c and f), except that the cooling-induced drought reduction is larger in GLENS, due to its stronger cooling effect (Fig. 3b vs. Fig. 2c). Overall, SAI-induced cooling plays the dominant role in mitigating the projected increase in extreme drought frequency under a warming climate, although the level of alleviation may vary across SAI strategies because of differences in injection locations and sulfate amounts.
3.4 Global socioeconomic disparity in exposure to drought extremes
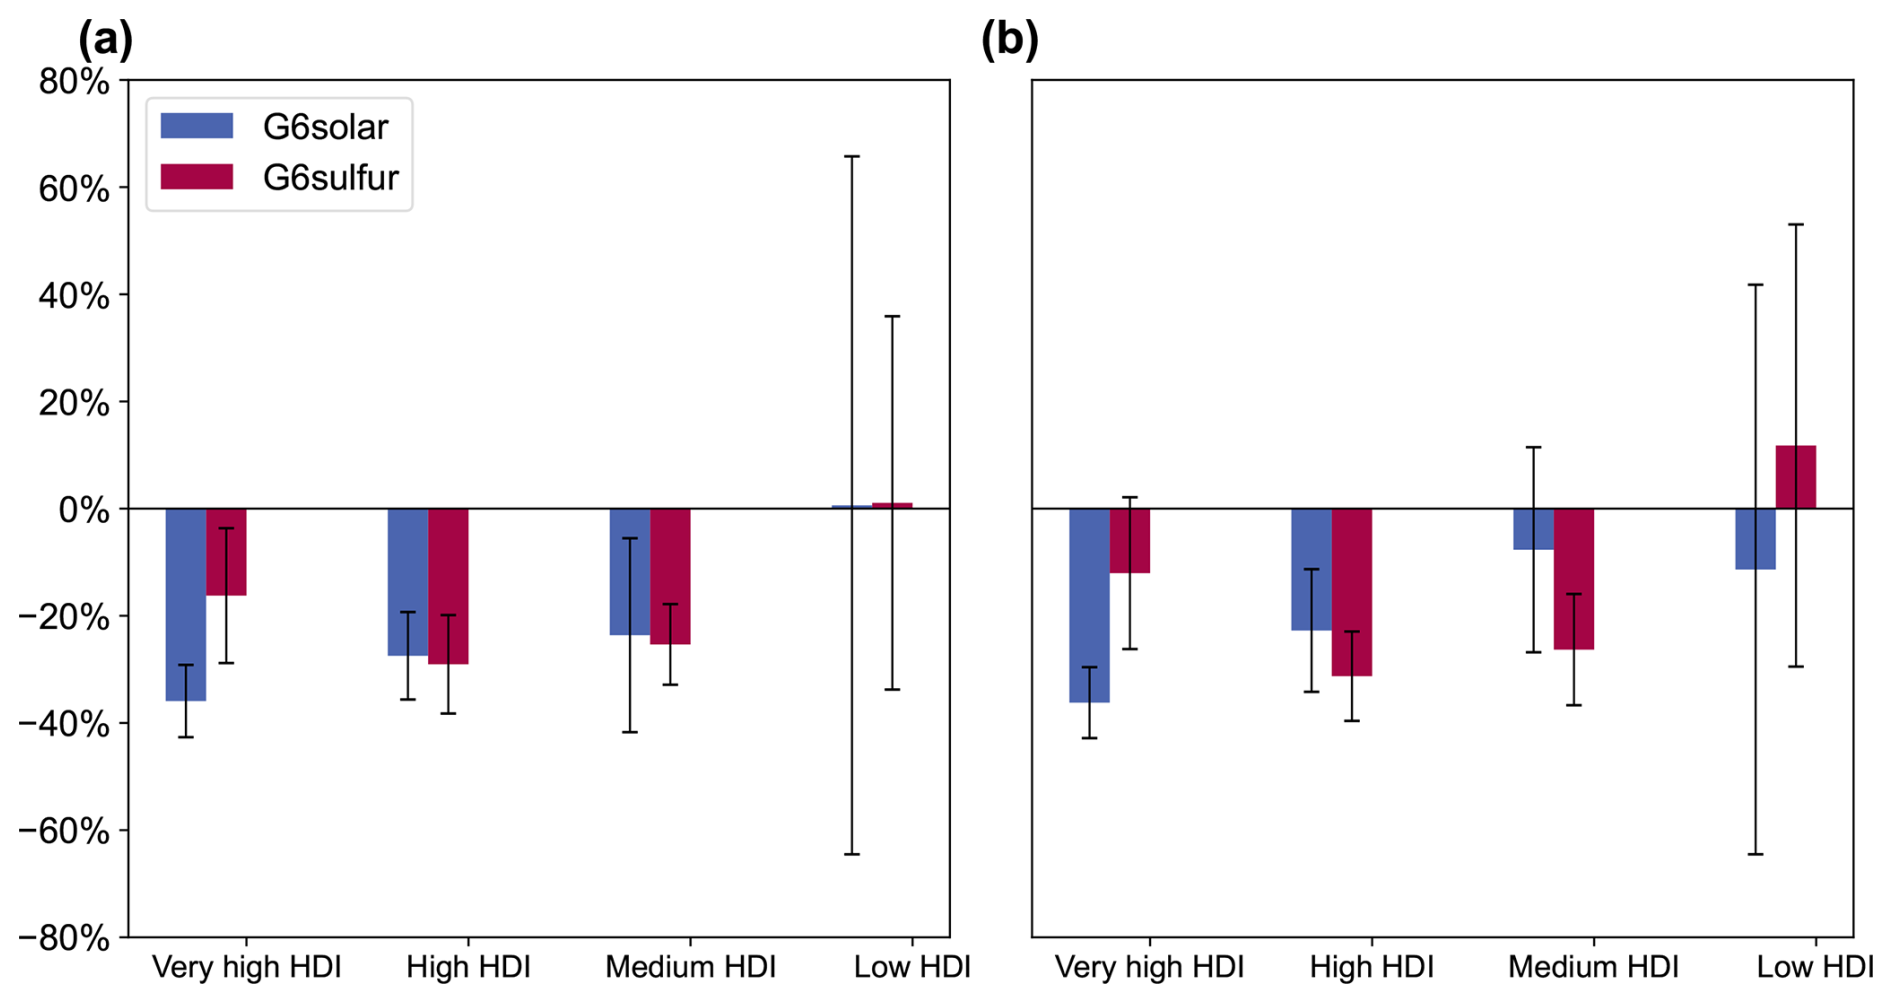
To quantify socioeconomic exposure to drought extremes under future warming and SRM scenarios, we analyzed variations of global GDP and population exposure to drought extremes across different scenarios. Compared to present day, there are significant increases of USD 72.1 trillion in GDP and 460 million in population exposed to extreme drought every year by the end of century under the SSP5-8.5 scenario (Fig. 8a and d). High exposure areas are located in eastern North America, western Europe, and eastern China. As an effective mitigation, G6solar can reduce annual GDP exposure by USD 18.6 trillion and population exposure by 142 million people to extreme drought (Fig. 8b and e), resulting in the MP of −25.8 % for GDP and −30.9 % for population. As a comparison, the MP of G6sulfur is lower at −17.9 % for GDP and −22.5 % for population (Fig. 8c and f). The SAI in GLENS achieves a similar global MP of −19.6 % in GDP to that in G6sulfur (Fig. 9b). However, it results in a 15.9 % increase in global population exposure to extreme drought relative to SSP5-8.5, mainly because of the substantial enhancement of drought risks in India, central Africa, and eastern China (Fig. 9d).
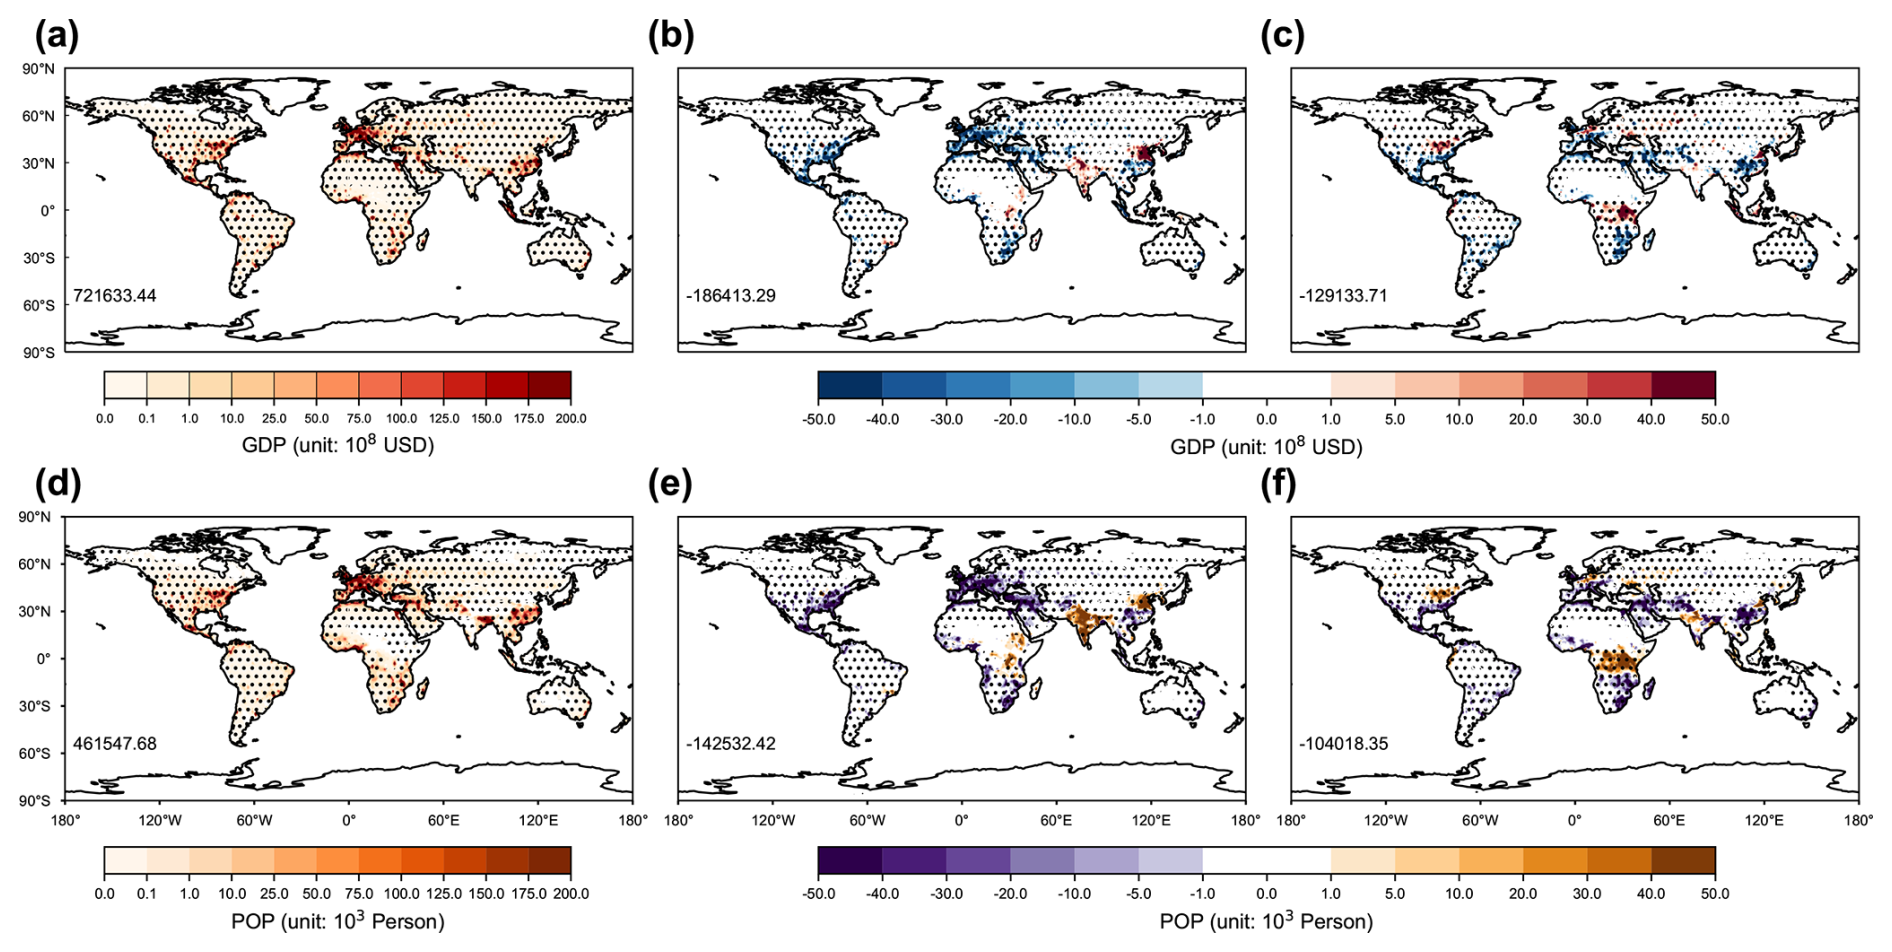
Figure 8Changes in GDP and population exposure to drought extremes. Results shown are the changes of (a, b, c) GDP and (c, d, f) population (POP) exposure to drought extremes at 2081–2100 (a, d) under SSP5-8.5 scenario relative to the historical period of 1995–2014, as well as that (b, e) under G6solar and (c, f) G6sulfur scenarios relative to SSP5-8.5 both at 2081–2100. The dotted areas indicate regions where at least four out of five models show changes with the same signs. The global sum value of the difference is shown at the lower-left of each panel.
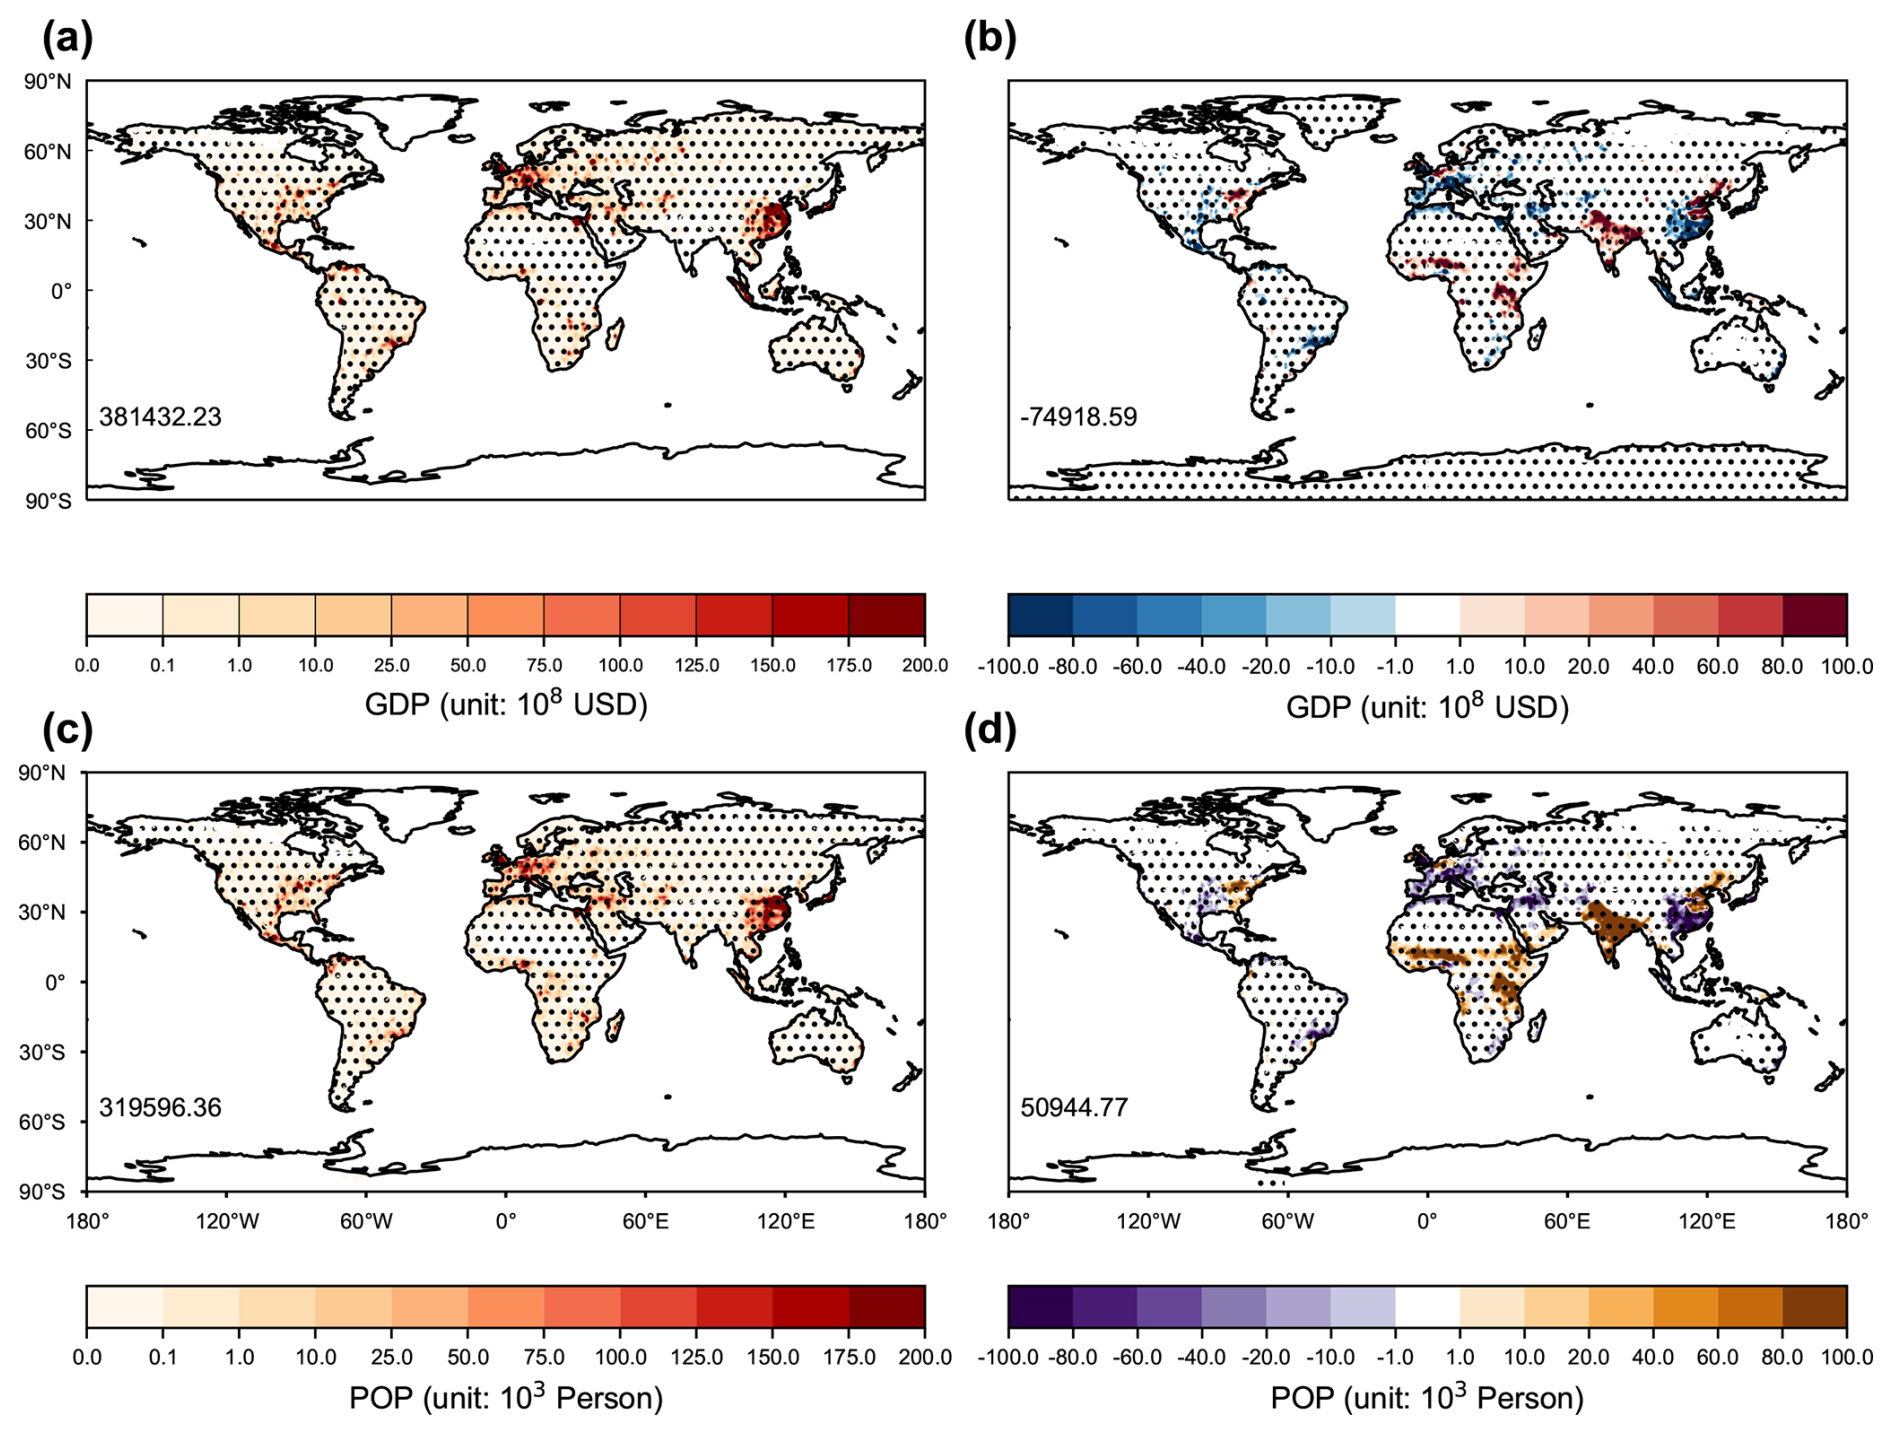
Figure 9Changes in GDP and population exposure to drought extremes by global warming and SAI in GLENS. Results shown are the changes of (a, b) GDP and (c, d) population (POP) exposure to drought extremes at 2075–2094 (a, c) under RCP8.5 scenario relative to 2010–2030 baseline, as well as that (b, d) under SAI scenarios relative to control both at 2075–2094. The dotted areas indicate regions where at least two out of three models show changes with the same signs. The global mean value of the difference is shown at the lower left of each panel.
The spatial heterogeneity of these mitigations results in pronounced disparities among countries at different development levels, as measured by HDI. G6solar reduces GDP exposure to drought extremes by 35.1 % in very high HDI countries and by 19.9 % in high HDI countries, but only 11.2 % in countries with low HDI (Fig. 10a). This disparity becomes even more pronounced under the G6sulfur scenario, in which the frequency of GDP exposure to drought extremes instead increases by 12.6 % relative to SSP5-8.5 for low HDI countries, with the highest risks in South Sudan, Rwanda, and Burundi (Fig. 10e). It is important to note that under both SRMs, the exposure of the GDP and population for the low HDI countries varies strongly across the GeoMIP models. However, most models project elevated risks, suggesting that these nations may remain highly vulnerable. Both SRMs result in relatively weaker MP for population exposure compared to GDP in low and medium HDI countries, with G6sulfur even increasing population exposure by up to 42.9 % in low HDI countries. Similar to GDP, the top 5 countries suffering the largest increases in population exposure are located in central Africa (Fig. 10f). As a comparison, the SAI in GLENS shows elevated drought exposure for medium- and low-HDI countries compared to the SRM approaches in GeoMIP6 (Fig. 10a–b).
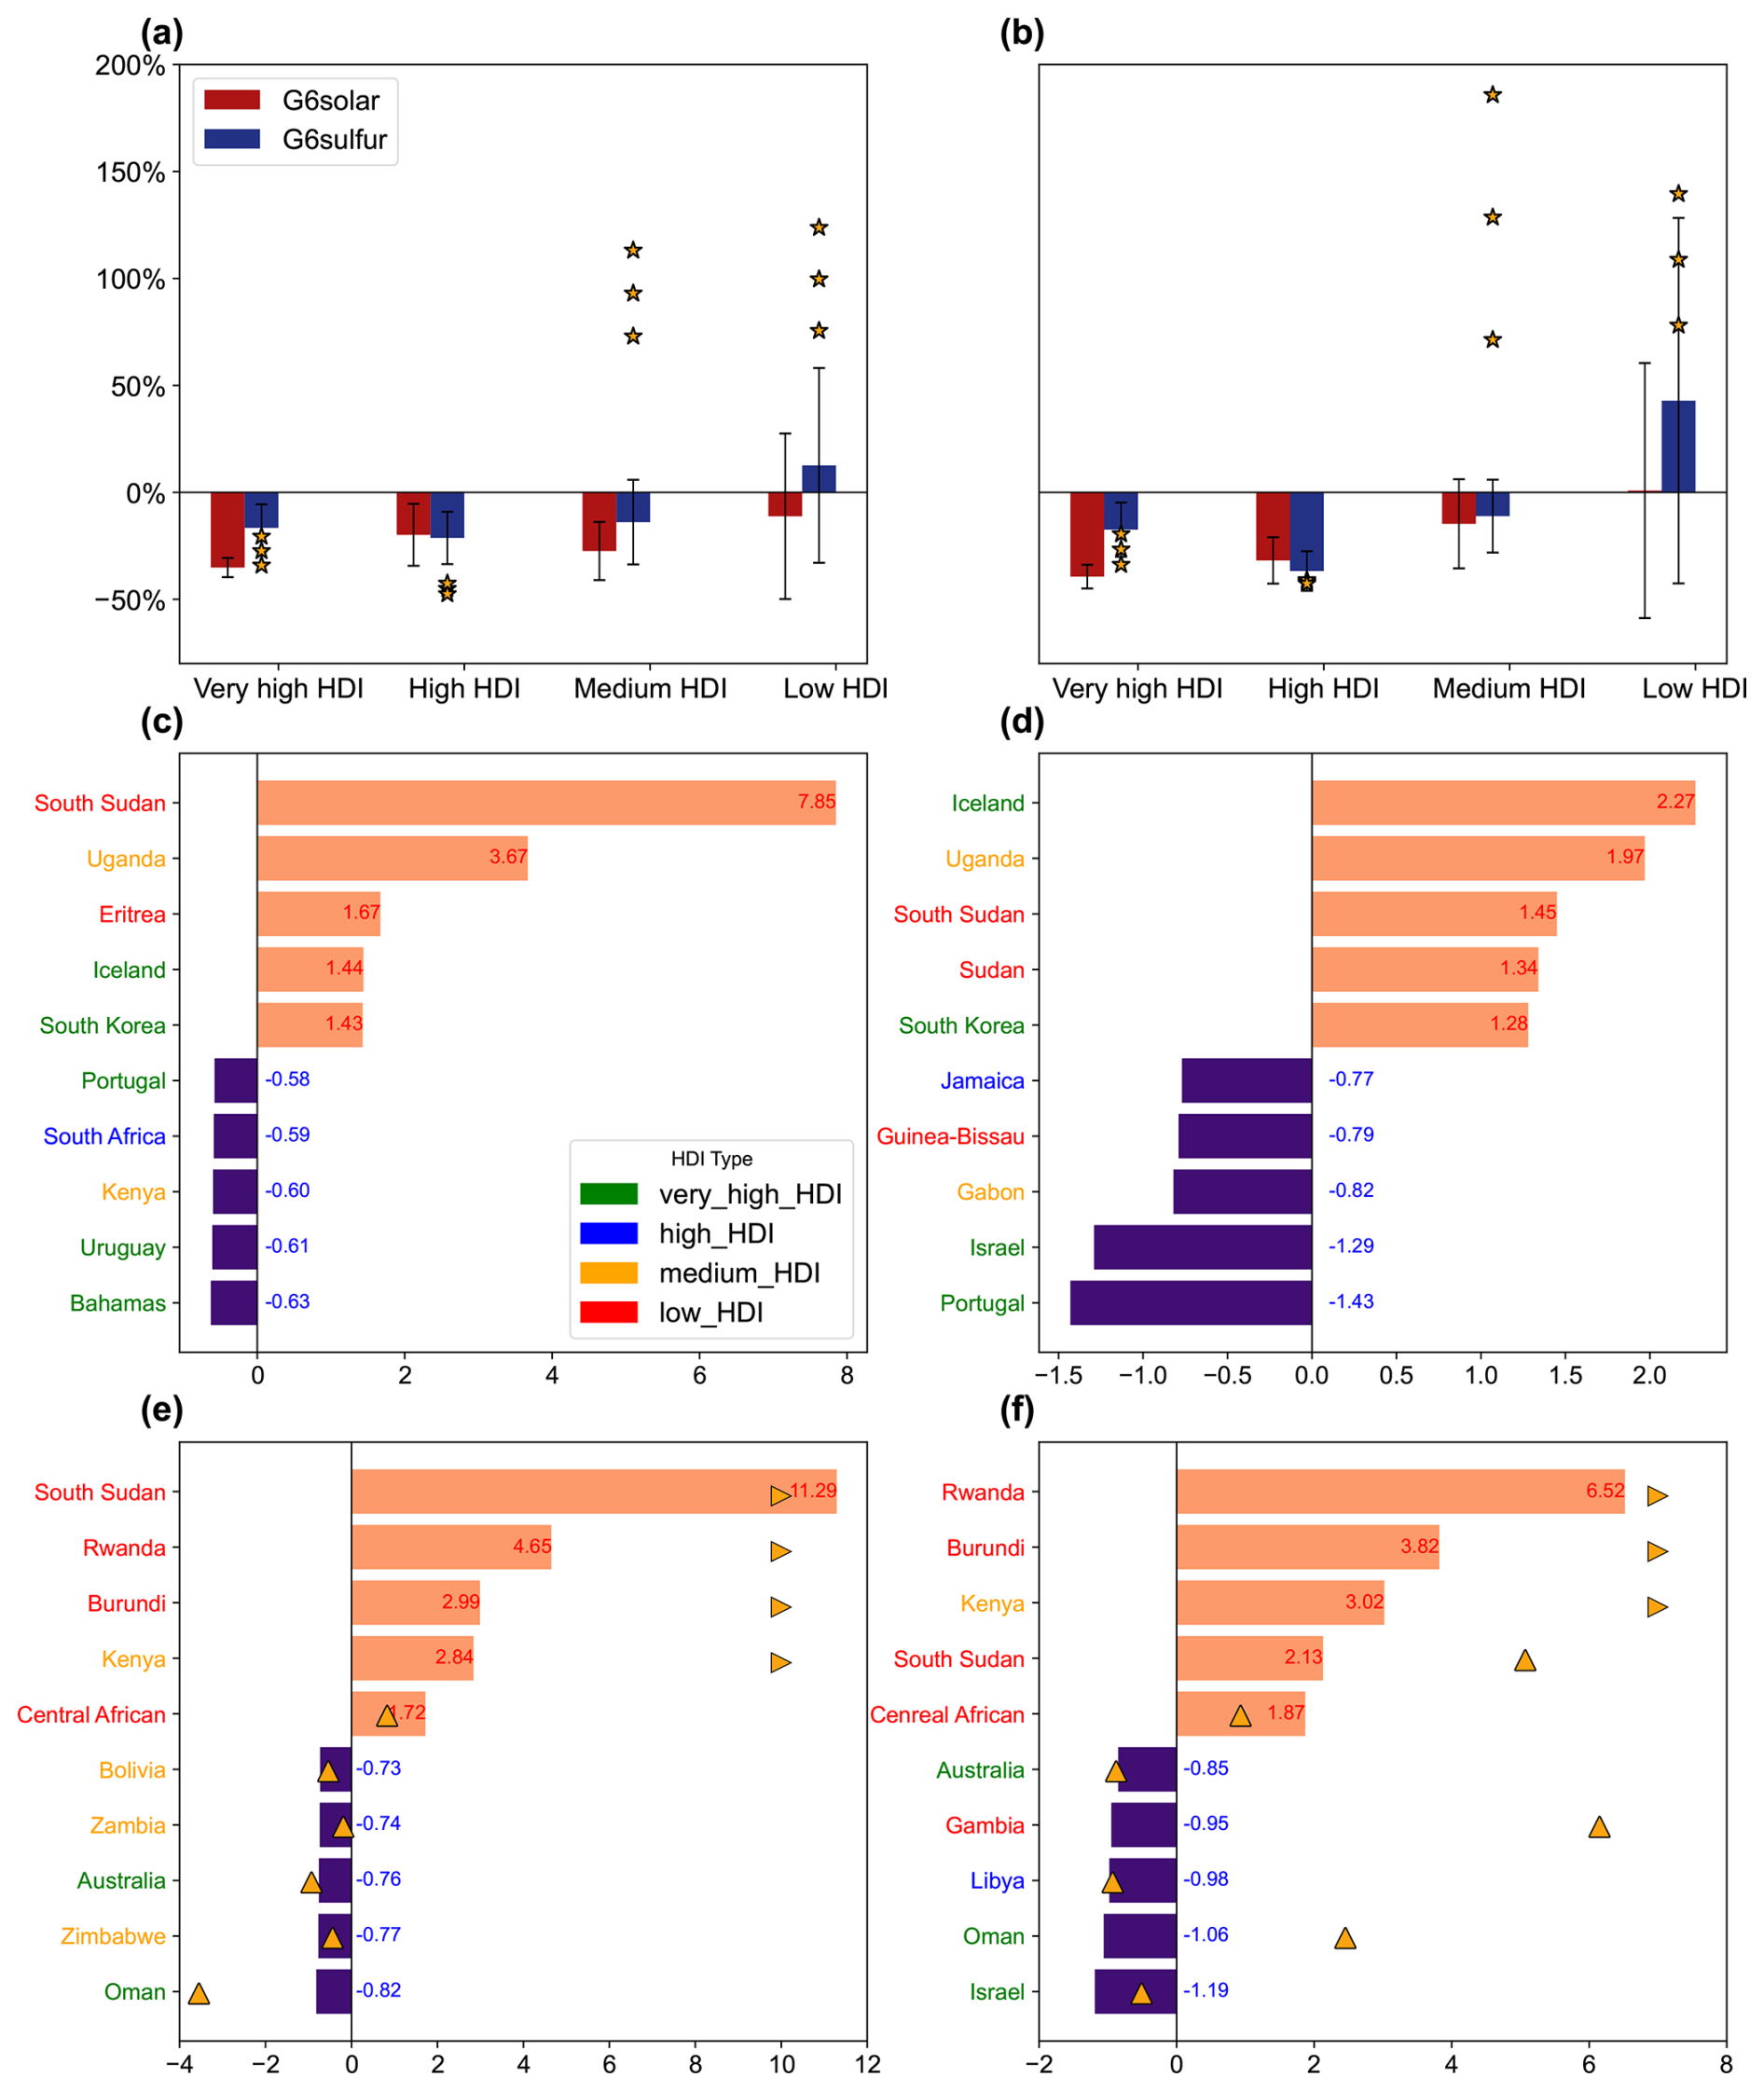
Figure 10Changes in GDP and population exposure to drought extremes by HDI. For each of four HDI groups, changes in (a) GDP or (b) population exposure to drought extremes for 2081–2100 in G6solar (blue) and G6sulfur (red) relative to SSP5-8.5 are normalized by the differences under SSP5-8.5 relative to 1995–2014. The bars represent the mean changes from five models with errorbars indicating one standard deviation for inter-model spread. Yellow stars represent results from three members of GLENS. The mitigation potential (MP, see Methods) is also calculated for individual countries, and the top 5 countries with the greatest mitigation (violet) or aggravation (orange) of (c, e) GDP and (d, f) population exposures to drought extremes are shown for (c, d) G6solar and (e, f) G6sulfur, respectively. The MP values (ratios of changes) are denoted for those top countries. Yellow triangles denote GLENS outcomes (right-aligned for values exceeding axis limits).
We use the index of drought exposure disparity (DED) to indicate the inequity of drought exposure between high- and low-HDI countries. Compared to SSP5-8.5, G6solar increases the DED of GDP by 12.72 % and that of population by 30.58 %. Under G6sulfur, this disparity is even more pronounced, with DED values increasing by 22.74 % for GDP and 36.34 % for population, with GLENS experiment increasing 244.37 % for GDP and 251.18 % for population.
Global warming is projected to enhance future drought risks (Dai, 2013). SRM is hypothesized to partially offset warming, but its regional climatic and societal impacts remain uncertain (Irvine et al., 2019). Our analyses show asymmetric responses in temperature and precipitation to SRM. For example, the SAI in G6sulfur mitigates only 42.8 % of the SSP5-8.5 warming (Fig. 2c) but offsets 88.9 % of the rainfall increase under SSP5-8.5 (Fig. 2f), indicating a disproportionate suppression of the water cycle. While cooling directly reduces evaporation, aerosol-induced increase in atmospheric stability indirectly weakens monsoon circulation (Tilmes et al., 2013; Krishnamohan and Bala, 2022), such as India and China (Fig. 2e). Consequently, SRM may inadvertently degrade hydroclimate security in vulnerable regions under a high-emission scenario.
Relative to G6solar, precipitation is even more inhibited in G6sulfur especially over central Africa (Fig. 2f), because the absorbing sulfate aerosols induces an anomalous stratospheric heating that further enhances air stability (Simpson et al., 2019; Tilmes et al., 2022). In addition, under the GLENS scenario, SAI overcompensates for the greenhouse gas-forced expansion of the Hadley Circulation (Cheng et al., 2022) and offsets the poleward shift of storm tracks in the mid-latitude of NH (Karami et al., 2020). These changes, along with a more positive phase of the North Atlantic Oscillation induced by SAI (Jones et al., 2022), resulting in increased exposures to drought in Europe and the northeastern U.S. (Fig. 4d and g).
Previous studies have revealed the negative impacts of SAI on hydrological cycles, but they mainly highlighted the benefits of SAI in mitigating temperature and precipitation extremes induced by climate warming (Jones et al., 2017; Irvine et al., 2019). However, variations of drought involve complex relationships between temperature and precipitation, leading to nonlinear responses of drought to the perturbations in these climatic variables. For instance, the sum of the contributions of individual climatic factors is not fully equal to the total changes in drought extremes under the SSP5-8.5 and two SRM scenarios (Figs. 4 and 6).
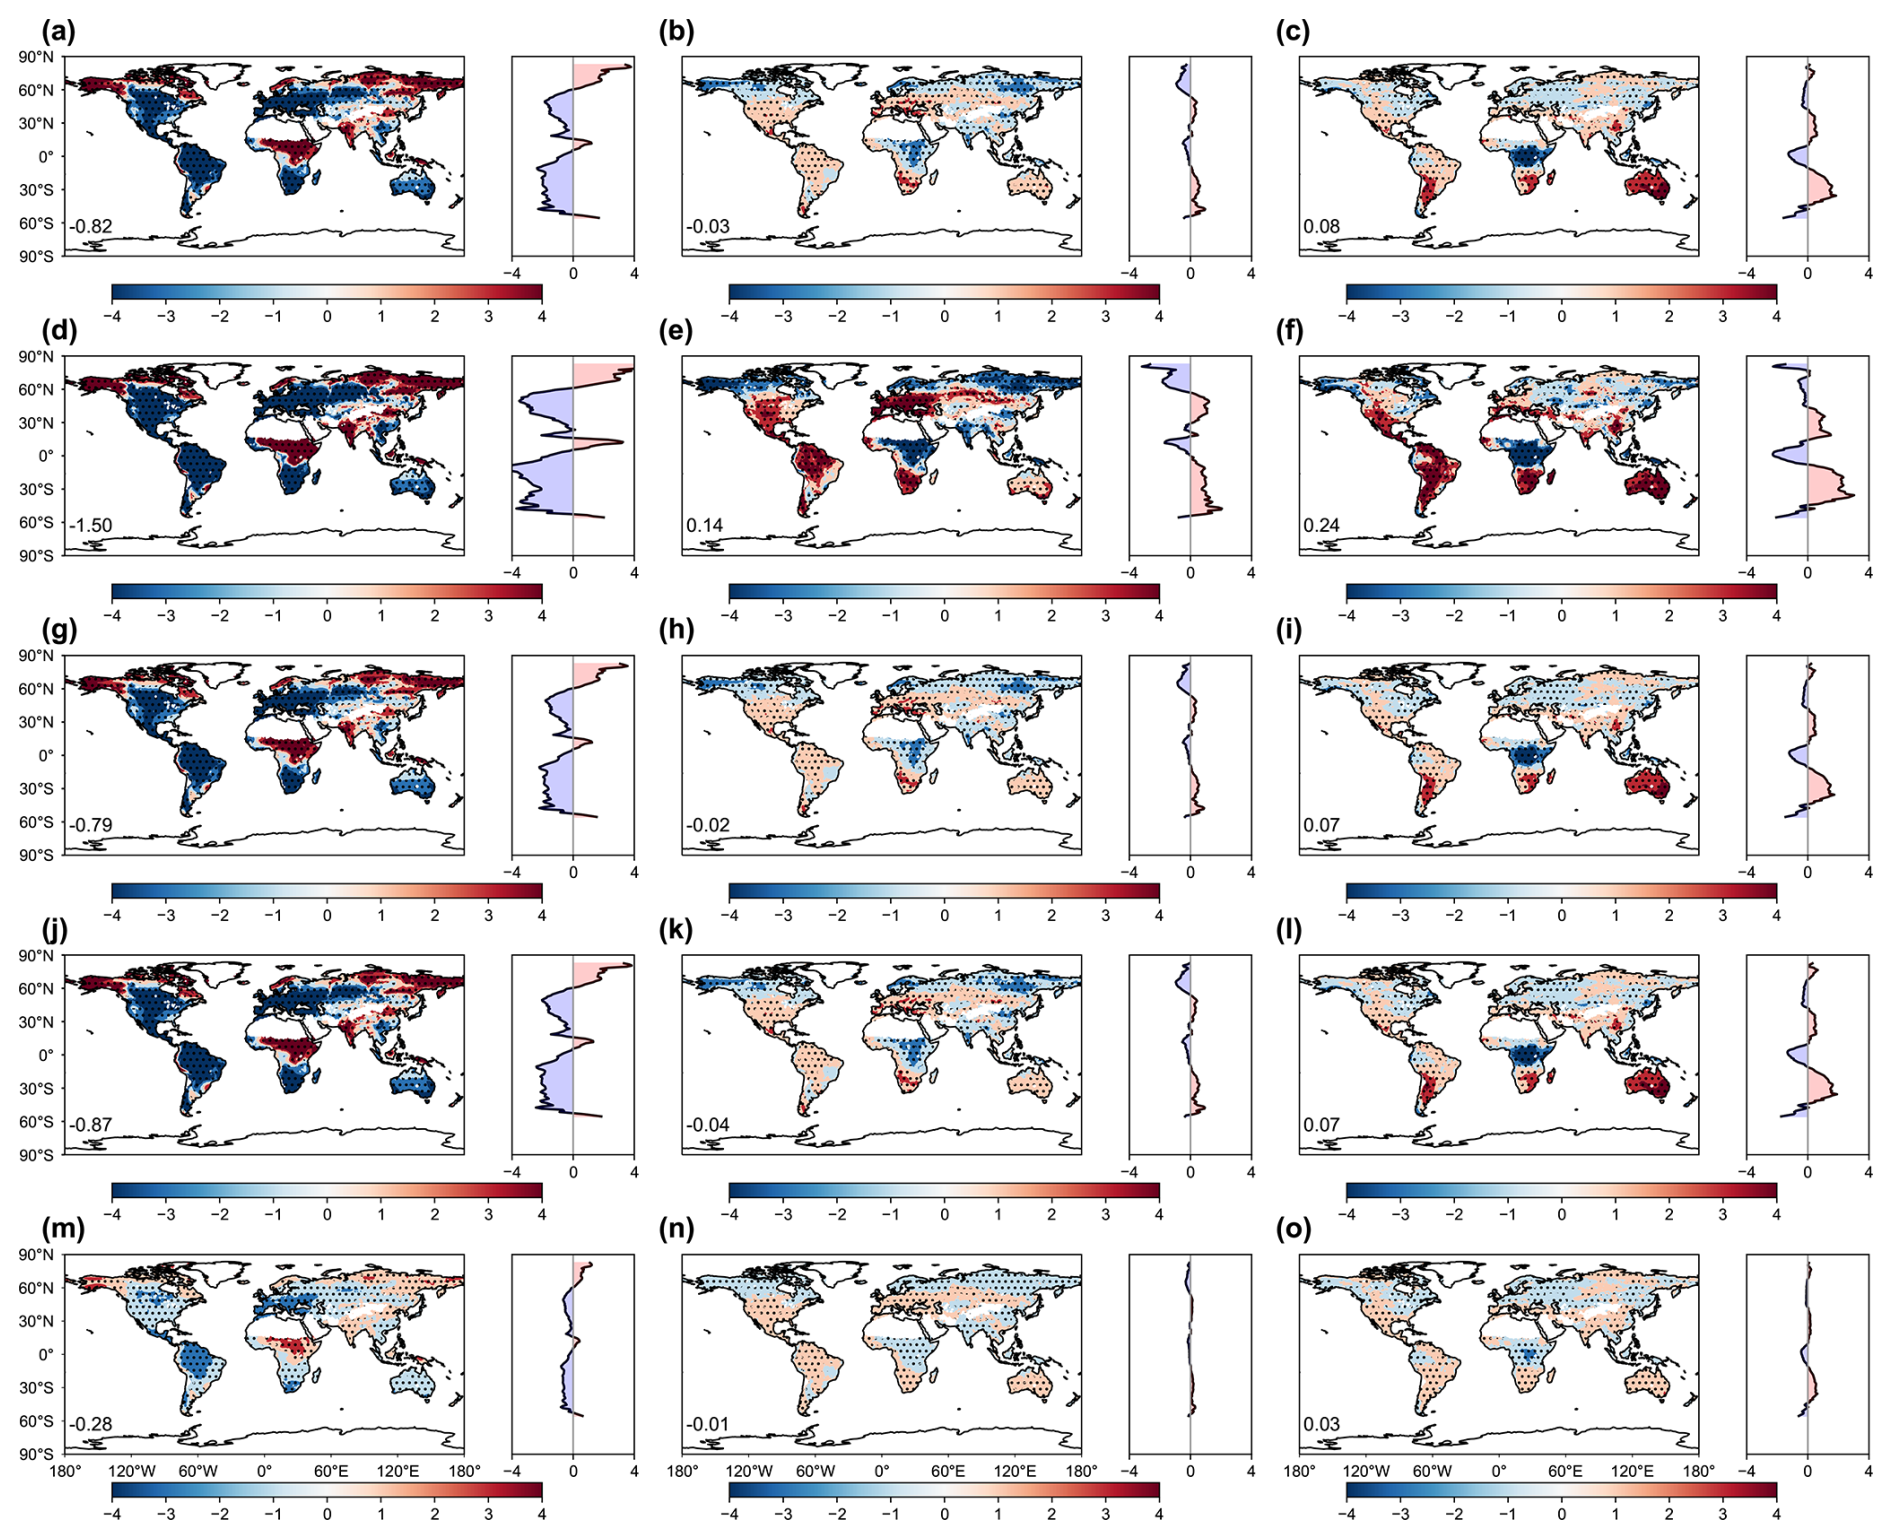
Figure 11Change of drought status indicated by different indices. Results shown are the changes of drought indices (a, d, g, j, m) at 2081–2100 under SSP5-8.5 scenario relative to the historical period of 1995–2014, as well as that under (b, e, h, k, n) G6solar and (c, f, i, l, o) G6sulfur scenarios relative to SSP5-8.5 both at 2081–2100. Drought indices include (a, b, c) self-calibrating Palmer Drought Severity Index (scPDSI), (d, e, f) PDSI, (g, h, i) Palmer Modified Drought Index (PMDI), (j, k, l) Palmer Hydrological Drought Index (PHDI), and (m, n, o) Palmer Z Index. The latitudinal distribution of the changes is shown on the right side of each panel. The dotted areas indicate regions where at least four out of five models show changes with the same signs.
Few studies have explored the SAI impacts on global drought using specific drought indices (Abiodun et al., 2021; Liu et al., 2024), but they tend to focus on the mean state of drought events rather than drought extremes. Our additional analyses showed very limited changes in the mean scPDSI values for both G6solar and G6sulfur relative to the SSP5-8.5 scenario on the global scale (Fig. 11a–c). The regional reduction (indicating a drier state) of scPDSI by G6sulfur is also smaller in magnitude than the increase (indicating a wetter state) under SSP5-8.5 over central Africa, masking the unbalanced responses as shown for the drought extremes (Fig. 4).
The climatic effects of SAI vary depending on the intensity and deployment strategies. Under the same high-emission scenario, the SAI in GeoMIP6 (G6sulfur) experiment aims to limit global warming to a moderate level, whereas GLENS implements SAI intensively to maintain the temperature at the level of 2020 (Tilmes et al., 2015, 2018). Furthermore, these two experiments employ distinct injection methodologies, with the multi-latitude aerosol deployment in GLENS but fixed equatorial injection in G6sulfur. Despite these differences, both GLENS and G6sulfur exhibit similar spatial patterns in their impacts on extreme drought (Figs. 4g and 5b). However, regional differences, particularly in India and northern China, lead to different levels of extreme drought risk for the global economy and population.
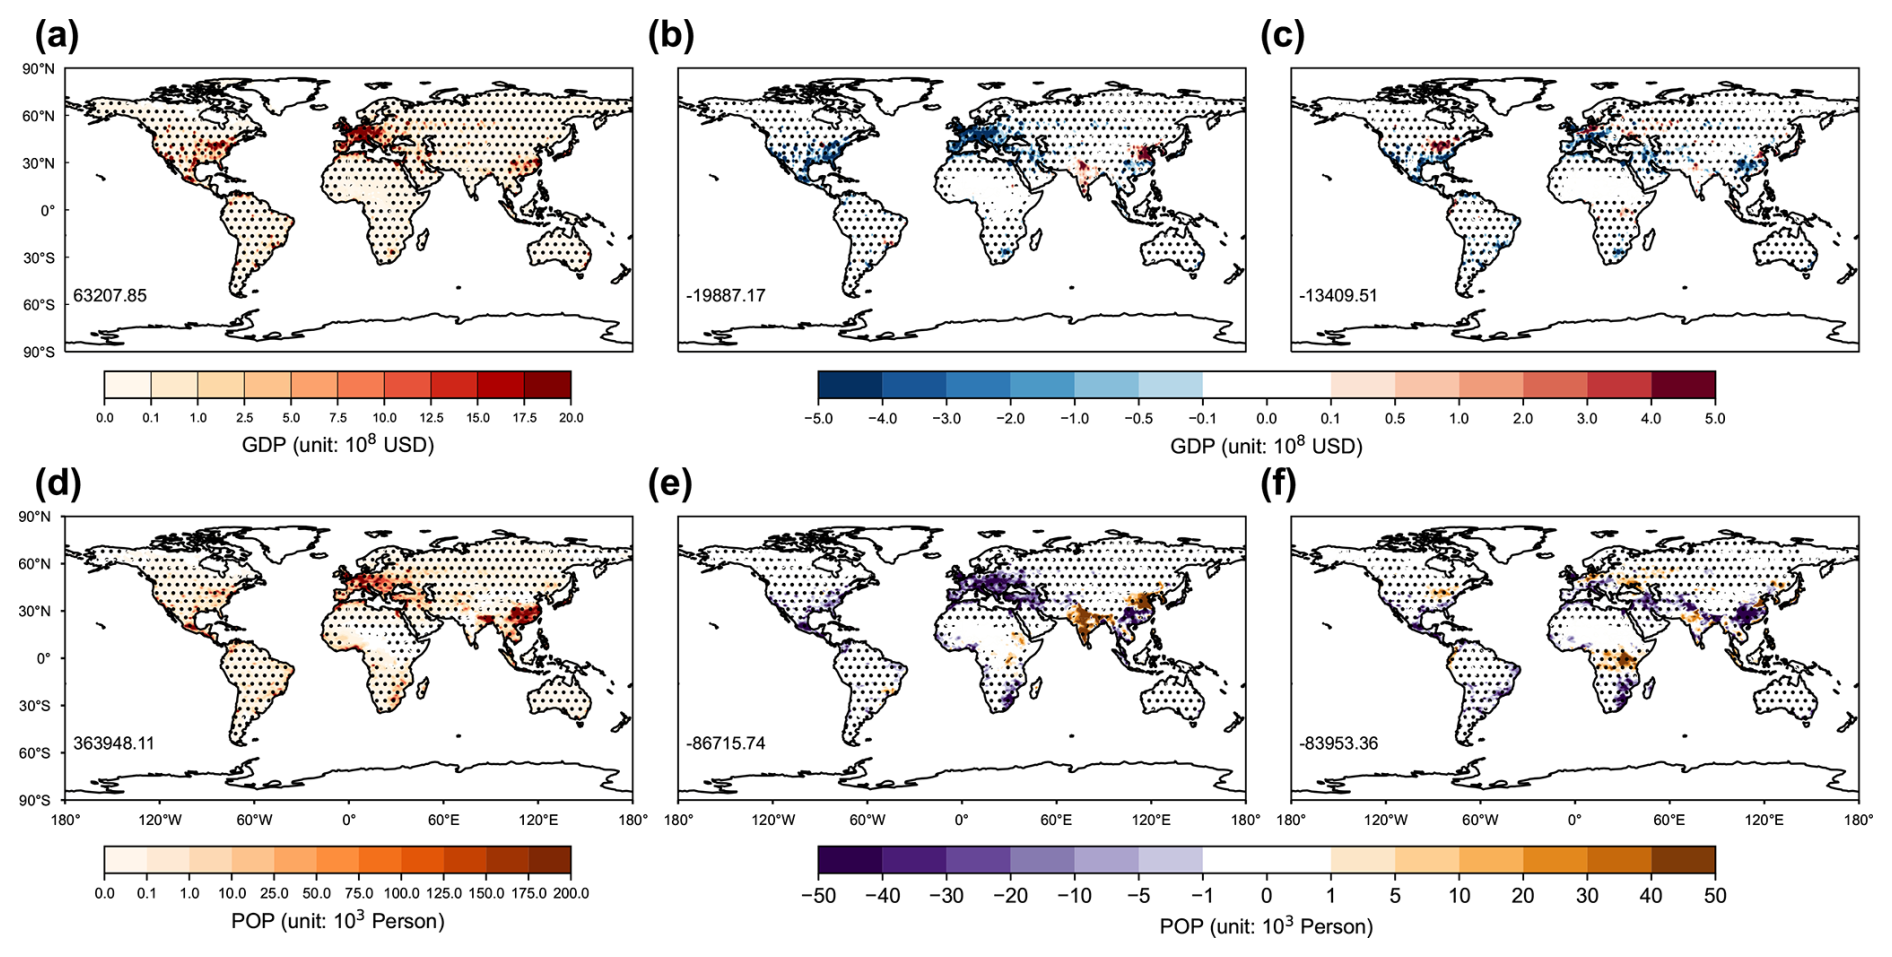
Figure 12The same as Fig. 8 but present-day GDP and population is applied.
Our findings are subject to some limitations and uncertainties. First, differences in model configurations may affect the predicted impacts of SRM. For instance, the IPSL-CM6A-LR and UKESM1-0-LL models simulate changes in stratospheric chemistry by using actual injected SO2, whereas CNRM-ESM2-1 and MPI-ESM1.2 employ prescribed distributions of stratospheric aerosol (Tilmes et al., 2015; Niemeier et al., 2020; Visioni et al., 2021). Although each model predicts comparable cooling effects, variations in the SAI implementation may lead to discrepancies in precipitation perturbations that are vital for predicting drought responses. Here, we employed a multi-model ensemble to derive climatic changes that are consistent among the majority of models. Second, the application of a single drought index may influence the projection results. For this study, we used scPDSI due to its clear physical meaning, adaptive climatic responses, and specific criteria for drought extremes (Wells et al., 2004). As a comparison, we checked other drought indices such as PDSI, Palmer Modified Drought Index (PMDI), Palmer Hydrological Drought Index (PHDI), and Palmer Z Index (Z-index). Projections using these indices showed similar patterns to scPDSI though with spatially varied magnitude (Fig. 11), suggesting that our main conclusions are not affected by the selection of the drought index. Third, uncertainties in future projections of GDP and population may affect exposure to drought extremes. In this study, we applied the future estimates of GDP and population density from the SSP5-8.5 scenario by the end of the 21st century. As a check, we used present-day economic and population data to predict future changes in drought exposure. Although the specific numbers changed, we found similar spatial variations in drought exposure using either present-day (Fig. 12) or future (Fig. 8) GDP and population data. The main conclusion remains that low HDI countries bear the largest exacerbation in both economic and population exposures to drought extremes due to SAI (Fig. 13).
Despite these limitations, our multi-model ensemble projection presents a strong impact of SAI on global drought extremes and the consequent exposures for economy and population. As an effective intervention for global warming, SAI exhibits certain potentials in mitigating drought risks but with large spatial heterogeneity. Particularly, this study emphasizes the heightened vulnerability of low HDI countries to exacerbated drought exposures due to SAI. Future projections indicate that these regions, already at a socio-economic disadvantage, will face the most severe impacts on both economic development and public health. This spatial disparity underscores the importance of considering equity and regional specificities in SAI policies. As we navigate the complexities of geoengineering, it is imperative to weigh the global benefits against the localized risks, ensuring that strategies do not disproportionately burden the most vulnerable regions.
The datasets are downloaded from the Coupled Model Intercomparison Project phase six (CMIP6, https://esgf-node.llnl.gov/search/cmip6/, last access: 16 October 2025) and Geoengineering Large Ensemble Project (GLENS, https://www.cesm.ucar.edu/community-projects/glens, last access: 16 October 2025) for simulated meteorology, and Climate Research Unit Gridded Time Series version4.07 (CRU TS4.07, https://crudata.uea.ac.uk/cru/data/hrg/, last access: 16 October 2025) for observed meteorology. Population data are collected from Socioeconomic Data and Applications Center (SEDAC, https://www.earthdata.nasa.gov/centers/sedac-daac, last access: 16 October 2025). HDI data are from United Nations Development Programme (UNDP, https://hdr.undp.org/, last access: 16 October 2025). Code for calculating scPDSI can be found at https://climate-indices.readthedocs.io/en/latest/, last access: 16 October 2025.
XY conceived this research. CT collected the data. WF analyzed the data and wrote the draft paper. XY, RX and YG reviewed and edited the manuscript.
The contact author has declared that none of the authors has any competing interests.
Publisher's note: Copernicus Publications remains neutral with regard to jurisdictional claims made in the text, published maps, institutional affiliations, or any other geographical representation in this paper. While Copernicus Publications makes every effort to include appropriate place names, the final responsibility lies with the authors. Views expressed in the text are those of the authors and do not necessarily reflect the views of the publisher.
The authors thank the CMIP6 for providing the GeoMIP6 datasets, the NCAR for the GLENS datasets, and the technical support of the National Large Scientific and Technological Infrastructure “Earth System Numerical Simulation Facility” (https://cstr.cn/31134.02.EL, last access: 16 October 2025).
This research has been supported by the National Key Research and Development Program of China (grant no. 2023YFF0805402), National Natural Science Foundation of China (grant no. 42275128), and Postgraduate Research & Practice Innovation Program of Jiangsu Province (grant no. KYCX25_1675).
This paper was edited by Ewa Bednarz and reviewed by two anonymous referees.
Abiodun, B. J., Odoulami, R. C., Sawadogo, W., Oloniyo, O. A., Abatan, A. A., New, M., Lennard, C., Izidine, P., Egbebiyi, T. S., and MacMartin, D. G.: Potential impacts of stratospheric aerosol injection on drought risk managements over major river basins in Africa, Climatic Change, 169, 31, https://doi.org/10.1007/s10584-021-03268-w, 2021.
Allan, R., Pereira, L., and Smith, M.: Crop evapotranspiration-Guidelines for computing crop water requirements, FAO Irrigation and drainage paper 56, http://www.fao.org/docrep/X0490E/X0490E00.htm (last access: 16 October 2025), 1998.
Alley, W. M.: The Palmer Drought Severity Index: Limitations and Assumptions, Journal of Applied Meteorology and Climatology, 23, 1100–1109, https://doi.org/10.1175/1520-0450(1984)023<1100:TPDSIL>2.0.CO;2, 1984.
Botai, C. M., Botai, J. O., De Wit, J. P., Ncongwane, K. P., and Adeola, A. M.: Drought Characteristics over the Western Cape Province, South Africa, Water, https://doi.org/10.3390/w9110876, 2017.
Carrão, H., Naumann, G., and Barbosa, P.: Mapping global patterns of drought risk: An empirical framework based on sub-national estimates of hazard, exposure and vulnerability, Global Environmental Change, 39, 108–124, https://doi.org/10.1016/j.gloenvcha.2016.04.012, 2016.
Cheng, W., MacMartin, D. G., Kravitz, B., Visioni, D., Bednarz, E. M., Xu, Y., Luo, Y., Huang, L., Hu, Y., Staten, P. W., Hitchcock, P., Moore, J. C., Guo, A., and Deng, X.: Changes in Hadley circulation and intertropical convergence zone under strategic stratospheric aerosol geoengineering, npj Climate and Atmospheric Science, 5, 32, https://doi.org/10.1038/s41612-022-00254-6, 2022.
Da-Allada, C. Y., Baloïtcha, E., Alamou, E. A., Awo, F. M., Bonou, F., Pomalegni, Y., Biao, E. I., Obada, E., Zandagba, J. E., Tilmes, S., and Irvine, P. J.: Changes in West African Summer Monsoon Precipitation Under Stratospheric Aerosol Geoengineering, Earth's Future, 8, e2020EF001595, https://doi.org/10.1029/2020EF001595, 2020.
Dai, A.: Characteristics and trends in various forms of the Palmer Drought Severity Index during 1900–2008, Journal of Geophysical Research, 116, https://doi.org/10.1029/2010JD015541, 2011a.
Dai, A.: Drought under global warming: a review, WIREs Climate Change, 2, 45–65, https://doi.org/10.1002/wcc.81, 2011b.
Dai, A.: Increasing drought under global warming in observations and models, Nature Climate Change, 3, 52–58, https://doi.org/10.1038/nclimate1633, 2013.
Dellink, R., Chateau, J., Lanzi, E., and Magné, B.: Long-term economic growth projections in the Shared Socioeconomic Pathways, Global Environmental Change, 42, 200–214, https://doi.org/10.1016/j.gloenvcha.2015.06.004, 2017.
Diallo, H. A.: United Nations convention to Combat desertification (UNCCD), The Future of Drylands: International Scientific Conference on Desertification and Drylands Research Tunis, Tunisia, 19–21 June 2006, 13–16, https://doi.org/10.1007/978-1-4020-6970-3_4, 2006.
Diffenbaugh, N. S., Scherer, M., and Ashfaq, M.: Response of snow-dependent hydrologic extremes to continued global warming, Nature Climate Change, 3, 379–384, https://doi.org/10.1038/nclimate1732, 2013.
Du, H., Tan, M. L., Samat, N., Chen, Z., and Zhang, F.: Integrating a comprehensive index and the SWAT+ model to assess drought characteristics and risks under solar radiation modification, Ecological Indicators, 178, 113852, https://doi.org/10.1016/j.ecolind.2025.113852, 2025.
Duffey, A. and Irvine, P. J.: Accounting for transience in the baseline climate state changes the surface climate response attributed to stratospheric aerosol injection, Environmental Research: Climate, 3, 041008, https://doi.org/10.1088/2752-5295/ad9f91, 2024.
English, J. M., Toon, O. B., and Mills, M. J.: Microphysical simulations of sulfur burdens from stratospheric sulfur geoengineering, Atmos. Chem. Phys., 12, 4775–4793, https://doi.org/10.5194/acp-12-4775-2012, 2012.
Ferraro, A. J., Highwood, E. J., and Charlton-Perez, A. J.: Weakened tropical circulation and reduced precipitation in response to geoengineering, Environmental Research Letters, 9, 014001, https://doi.org/10.1088/1748-9326/9/1/014001, 2014.
Geiger, T.: Continuous national gross domestic product (GDP) time series for 195 countries: past observations (1850–2005) harmonized with future projections according to the Shared Socio-economic Pathways (2006–2100), Earth Syst. Sci. Data, 10, 847–856, https://doi.org/10.5194/essd-10-847-2018, 2018.
Harris, I., Osborn, T. J., Jones, P., and Lister, D.: Version 4 of the CRU TS monthly high-resolution gridded multivariate climate dataset, Scientific Data, 7, 109, https://doi.org/10.1038/s41597-020-0453-3, 2020.
Held, I. M. and Soden, B. J.: Robust Responses of the Hydrological Cycle to Global Warming, Journal of Climate, 19, 5686–5699, https://doi.org/10.1175/JCLI3990.1, 2006.
Irvine, P., Emanuel, K., He, J., Horowitz, L. W., Vecchi, G., and Keith, D.: Halving warming with idealized solar geoengineering moderates key climate hazards, Nature Climate Change, 9, 295–299, https://doi.org/10.1038/s41558-019-0398-8, 2019.
Irvine, P. J., Sriver, R. L., and Keller, K.: Tension between reducing sea-level rise and global warming through solar-radiation management, Nature Climate Change, 2, 97–100, https://doi.org/10.1038/nclimate1351, 2012.
Jiang, J., Xia, Y., Cao, L., Kravitz, B., MacMartin, D. G., Fu, J., and Jiang, G.: Different Strategies of Stratospheric Aerosol Injection Would Significantly Affect Climate Extreme Mitigation, Earth's Future, 12, e2023EF004364, https://doi.org/10.1029/2023EF004364, 2024.
Jones, A., Haywood, J. M., Scaife, A. A., Boucher, O., Henry, M., Kravitz, B., Lurton, T., Nabat, P., Niemeier, U., Séférian, R., Tilmes, S., and Visioni, D.: The impact of stratospheric aerosol intervention on the North Atlantic and Quasi-Biennial Oscillations in the Geoengineering Model Intercomparison Project (GeoMIP) G6sulfur experiment, Atmos. Chem. Phys., 22, 2999–3016, https://doi.org/10.5194/acp-22-2999-2022, 2022.
Jones, A. C., Haywood, J. M., Dunstone, N., Emanuel, K., Hawcroft, M. K., Hodges, K. I., and Jones, A.: Impacts of hemispheric solar geoengineering on tropical cyclone frequency, Nature Communications, 8, 1382, https://doi.org/10.1038/s41467-017-01606-0, 2017.
Jones, B. and O'Neill, B. C.: Spatially Explicit Global Population Scenarios Consistent with the Shared Socioeconomic Pathways, Environmental Research Letters, https://doi.org/10.1088/1748-9326/11/8/084003, 2016.
Jones, B. and O'Neill, B. C.: Global One-Eighth Degree Population Base Year and Projection Grids Based on the Shared Socioeconomic Pathways, Revision 01, NASA Socioeconomic Data and Applications Center (SEDAC) [data set], https://doi.org/10.7927/m30p-j498, 2020.
Karami, K., Tilmes, S., Muri, H., and Mousavi, S. V.: Storm Track Changes in the Middle East and North Africa Under Stratospheric Aerosol Geoengineering, Geophysical Research Letters, 47, e2020GL086954, https://doi.org/10.1029/2020GL086954, 2020.
Kendon, E. J., Stratton, R. A., Tucker, S., Marsham, J. H., Berthou, S., Rowell, D. P., and Senior, C. A.: Enhanced future changes in wet and dry extremes over Africa at convection-permitting scale, Nature Communications, 10, 1794, https://doi.org/10.1038/s41467-019-09776-9, 2019.
Kravitz, B., Robock, A., Boucher, O., Schmidt, H., Taylor, K. E., Stenchikov, G., and Schulz, M.: The Geoengineering Model Intercomparison Project (GeoMIP), Atmospheric Science Letters, 12, 162–167, https://doi.org/10.1002/asl.316, 2011.
Kravitz, B., Robock, A., Tilmes, S., Boucher, O., English, J. M., Irvine, P. J., Jones, A., Lawrence, M. G., MacCracken, M., Muri, H., Moore, J. C., Niemeier, U., Phipps, S. J., Sillmann, J., Storelvmo, T., Wang, H., and Watanabe, S.: The Geoengineering Model Intercomparison Project Phase 6 (GeoMIP6): simulation design and preliminary results, Geosci. Model Dev., 8, 3379–3392, https://doi.org/10.5194/gmd-8-3379-2015, 2015.
Kravitz, B., MacMartin, D. G., Mills, M. J., Richter, J. H., Tilmes, S., Lamarque, J.-F., Tribbia, J. J., and Vitt, F.: First Simulations of Designing Stratospheric Sulfate Aerosol Geoengineering to Meet Multiple Simultaneous Climate Objectives, Journal of Geophysical Research: Atmospheres, 122, 12616–12634, https://doi.org/10.1002/2017JD026874, 2017.
Kravitz, B., MacMartin, D. G., Tilmes, S., Richter, J. H., Mills, M. J., Cheng, W., Dagon, K., Glanville, A. S., Lamarque, J.-F., Simpson, I. R., Tribbia, J., and Vitt, F.: Comparing Surface and Stratospheric Impacts of Geoengineering With Different SO2 Injection Strategies, Journal of Geophysical Research: Atmospheres, 124, 7900–7918, https://doi.org/10.1029/2019JD030329, 2019.
Krishnamohan, K. S. and Bala, G.: Sensitivity of tropical monsoon precipitation to the latitude of stratospheric aerosol injections, Climate Dynamics, 59, 151–168, https://doi.org/10.1007/s00382-021-06121-z, 2022.
Liu, Z., Lang, X., and Jiang, D.: Stratospheric Aerosol Injection Geoengineering Would Mitigate Greenhouse Gas-Induced Drying and Affect Global Drought Patterns, Journal of Geophysical Research: Atmospheres, 129, e2023JD039988, https://doi.org/10.1029/2023JD039988, 2024.
MacMartin, D. G. and Kravitz, B.: Mission-driven research for stratospheric aerosol geoengineering, Proceedings of the National Academy of Sciences, 116, 1089–1094, https://doi.org/10.1073/pnas.1811022116, 2019.
Mauritsen, T., Bader, J., Becker, T., Behrens, J., Bittner, M., Brokopf, R., Brovkin, V., Claussen, M., Crueger, T., Esch, M., Fast, I., Fiedler, S., Fläschner, D., Gayler, V., Giorgetta, M., Goll, D. S., Haak, H., Hagemann, S., Hedemann, C., Hohenegger, C., Ilyina, T., Jahns, T., Jimenéz-de-la-Cuesta, D., Jungclaus, J., Kleinen, T., Kloster, S., Kracher, D., Kinne, S., Kleberg, D., Lasslop, G., Kornblueh, L., Marotzke, J., Matei, D., Meraner, K., Mikolajewicz, U., Modali, K., Möbis, B., Müller, W. A., Nabel, J. E. M. S., Nam, C. C. W., Notz, D., Nyawira, S.-S., Paulsen, H., Peters, K., Pincus, R., Pohlmann, H., Pongratz, J., Popp, M., Raddatz, T. J., Rast, S., Redler, R., Reick, C. H., Rohrschneider, T., Schemann, V., Schmidt, H., Schnur, R., Schulzweida, U., Six, K. D., Stein, L., Stemmler, I., Stevens, B., von Storch, J.-S., Tian, F., Voigt, A., Vrese, P., Wieners, K.-H., Wilkenskjeld, S., Winkler, A., and Roeckner, E.: Developments in the MPI-M Earth System Model version 1.2 (MPI-ESM1.2) and Its Response to Increasing CO2, Journal of Advances in Modeling Earth Systems, 11, 998–1038, https://doi.org/10.1029/2018MS001400, 2019.
Monteith, J. L.: Evaporation and environment, Symposia of the Society for Experimental Biology, 19, 205–234, 1965.
Niemeier, U., Schmidt, H., Alterskjær, K., and Kristjánsson, J. E.: Solar irradiance reduction via climate engineering: Impact of different techniques on the energy balance and the hydrological cycle, Journal of Geophysical Research: Atmospheres, 118, 11905–11917, https://doi.org/10.1002/2013JD020445, 2013.
Niemeier, U., Richter, J. H., and Tilmes, S.: Differing responses of the quasi-biennial oscillation to artificial SO2 injections in two global models, Atmos. Chem. Phys., 20, 8975–8987, https://doi.org/10.5194/acp-20-8975-2020, 2020.
Odoulami, R. C., New, M., Wolski, P., Guillemet, G., Pinto, I., Lennard, C., Muri, H., and Tilmes, S.: Stratospheric Aerosol Geoengineering could lower future risk of “Day Zero” level droughts in Cape Town, Environmental Research Letters, 15, 124007, https://doi.org/10.1088/1748-9326/abbf13, 2020.
Palmer, P. I., Wainwright, C. M., Dong, B., Maidment, R. I., Wheeler, K. G., Gedney, N., Hickman, J. E., Madani, N., Folwell, S. S., Abdo, G., Allan, R. P., Black, E. C. L., Feng, L., Gudoshava, M., Haines, K., Huntingford, C., Kilavi, M., Lunt, M. F., Shaaban, A., and Turner, A. G.: Drivers and impacts of Eastern African rainfall variability, Nature Reviews Earth & Environment, 4, 254–270, https://doi.org/10.1038/s43017-023-00397-x, 2023.
Penman, H. L. and Keen, B. A.: Natural evaporation from open water, bare soil and grass, Proceedings of the Royal Society of London. Series A. Mathematical and Physical Sciences, 193, 120–145, https://doi.org/10.1098/rspa.1948.0037, 1948.
Pope, F. D., Braesicke, P., Grainger, R. G., Kalberer, M., Watson, I. M., Davidson, P. J., and Cox, R. A.: Stratospheric aerosol particles and solar-radiation management, Nature Climate Change, 2, 713–719, https://doi.org/10.1038/nclimate1528, 2012.
Rezaei, A., Moore, J., Tilmes, S., and Karami, K.: Regional and Seasonal Hydrological Changes With and Without Stratospheric Aerosol Intervention Under High Greenhouse Gas Climates, Journal of Geophysical Research: Atmospheres, 130, e2025JD044163, https://doi.org/10.1029/2025JD044163, 2025.
Ricke, K., Wan, J. S., Saenger, M., and Lutsko, N. J.: Hydrological Consequences of Solar Geoengineering, Annu. Rev. Earth Planet. Sci., 51, 447–470, https://doi.org/10.1146/annurev-earth-031920-083456, 2023.
Ricke, K. L., Rowlands, D. J., Ingram, W. J., Keith, D. W., and Granger Morgan, M.: Effectiveness of stratospheric solar-radiation management as a function of climate sensitivity, Nature Climate Change, 2, 92–96, https://doi.org/10.1038/nclimate1328, 2012.
Rusca, M., Savelli, E., Di Baldassarre, G., Biza, A., and Messori, G.: Unprecedented droughts are expected to exacerbate urban inequalities in Southern Africa, Nature Climate Change, 13, 98–105, https://doi.org/10.1038/s41558-022-01546-8, 2023.
Samaniego, L., Thober, S., Kumar, R., Wanders, N., Rakovec, O., Pan, M., Zink, M., Sheffield, J., Wood, E. F., and Marx, A.: Anthropogenic warming exacerbates European soil moisture droughts, Nature Climate Change, 8, 421–426, https://doi.org/10.1038/s41558-018-0138-5, 2018.
Simpson, I. R., Tilmes, S., Richter, J. H., Kravitz, B., MacMartin, D. G., Mills, M. J., Fasullo, J. T., and Pendergrass, A. G.: The Regional Hydroclimate Response to Stratospheric Sulfate Geoengineering and the Role of Stratospheric Heating, Journal of Geophysical Research: Atmospheres, 124, 12587–12616, https://doi.org/10.1029/2019JD031093, 2019.
Smith, A.: The Atlas of Mortality and Economic Losses from Weather, Climate and Water Extremes (1970–2019), ISBN 978-92-63-11267-5, 2021.
Smith, W.: The cost of stratospheric aerosol injection through 2100, Environmental Research Letters, 15, 114004, https://doi.org/10.1088/1748-9326/aba7e7, 2020.
Smith, W. and Wagner, G.: Stratospheric aerosol injection tactics and costs in the first 15 years of deployment, Environmental Research Letters, 13, 124001, https://doi.org/10.1088/1748-9326/aae98d, 2018.
Song, F., Zhang, G. J., Ramanathan, V., and Leung, L. R.: Trends in surface equivalent potential temperature: A more comprehensive metric for global warming and weather extremes, Proceedings of the National Academy of Sciences, 119, https://doi.org/10.1073/pnas.2117832119, 2022.
Sun, F., Wang, T., and Wang, H.: Mapping Global GDP Exposure to Drought, in: Atlas of Global Change Risk of Population and Economic Systems, Springer Nature Singapore, Singapore, 123–130, https://doi.org/10.1007/978-981-16-6691-9_9, 2022.
Taylor, K. E.: Summarizing multiple aspects of model performance in a single diagram, Journal of Geophysical Research: Atmospheres, 106, 7183–7192, https://doi.org/10.1029/2000JD900719, 2001.
Tebaldi, C., Ranasinghe, R., Vousdoukas, M., Rasmussen, D. J., Vega-Westhoff, B., Kirezci, E., Kopp, R. E., Sriver, R., and Mentaschi, L.: Extreme sea levels at different global warming levels, Nature Climate Change, 11, 746–751, https://doi.org/10.1038/s41558-021-01127-1, 2021.
Thornthwaite, C. W.: An Approach toward a Rational Classification of Climate, Geographical Review, 38, 55–94, https://doi.org/10.2307/210739, 1948.
Tilmes, S., Fasullo, J., Lamarque, J.-F., Marsh, D. R., Mills, M., Alterskjær, K., Muri, H., Kristjánsson, J. E., Boucher, O., Schulz, M., Cole, J. N. S., Curry, C. L., Jones, A., Haywood, J., Irvine, P. J., Ji, D., Moore, J. C., Karam, D. B., Kravitz, B., Rasch, P. J., Singh, B., Yoon, J.-H., Niemeier, U., Schmidt, H., Robock, A., Yang, S., and Watanabe, S.: The hydrological impact of geoengineering in the Geoengineering Model Intercomparison Project (GeoMIP), Journal of Geophysical Research: Atmospheres, 118, 11036–11058, https://doi.org/10.1002/jgrd.50868, 2013.
Tilmes, S., Mills, M. J., Niemeier, U., Schmidt, H., Robock, A., Kravitz, B., Lamarque, J.-F., Pitari, G., and English, J. M.: A new Geoengineering Model Intercomparison Project (GeoMIP) experiment designed for climate and chemistry models, Geosci. Model Dev., 8, 43–49, https://doi.org/10.5194/gmd-8-43-2015, 2015.
Tilmes, S., Richter, J. H., Kravitz, B., MacMartin, D. G., Mills, M. J., Simpson, I. R., Glanville, A. S., Fasullo, J. T., Phillips, A. S., Lamarque, J.-F., Tribbia, J., Edwards, J., Mickelson, S., and Ghosh, S.: CESM1(WACCM) Stratospheric Aerosol Geoengineering Large Ensemble Project, Bulletin of the American Meteorological Society, 99, 2361–2371, https://doi.org/10.1175/bams-d-17-0267.1, 2018.
Tilmes, S., Visioni, D., Jones, A., Haywood, J., Séférian, R., Nabat, P., Boucher, O., Bednarz, E. M., and Niemeier, U.: Stratospheric ozone response to sulfate aerosol and solar dimming climate interventions based on the G6 Geoengineering Model Intercomparison Project (GeoMIP) simulations, Atmos. Chem. Phys., 22, 4557–4579, https://doi.org/10.5194/acp-22-4557-2022, 2022.
Trenberth, K. E., Dai, A., van der Schrier, G., Jones, P. D., Barichivich, J., Briffa, K. R., and Sheffield, J.: Global warming and changes in drought, Nature Climate Change, 4, 17–22, https://doi.org/10.1038/nclimate2067, 2014.
UNDP: Human Development Report 2023/2024: breaking the gridlock – reimagining cooperation in a polarized world, New York, https://doi.org/10.2139/ssrn.4934148, 2024.
van der Schrier, G., Barichivich, J., Briffa, K. R., and Jones, P. D.: A scPDSI-based global data set of dry and wet spells for 1901–2009, Journal of Geophysical Research: Atmospheres, 118, 4025–4048, https://doi.org/10.1002/jgrd.50355, 2013.
Visioni, D., MacMartin, D. G., Kravitz, B., Boucher, O., Jones, A., Lurton, T., Martine, M., Mills, M. J., Nabat, P., Niemeier, U., Séférian, R., and Tilmes, S.: Identifying the sources of uncertainty in climate model simulations of solar radiation modification with the G6sulfur and G6solar Geoengineering Model Intercomparison Project (GeoMIP) simulations, Atmos. Chem. Phys., 21, 10039–10063, https://doi.org/10.5194/acp-21-10039-2021, 2021.
Visioni, D., Kravitz, B., Robock, A., Tilmes, S., Haywood, J., Boucher, O., Lawrence, M., Irvine, P., Niemeier, U., Xia, L., Chiodo, G., Lennard, C., Watanabe, S., Moore, J. C., and Muri, H.: Opinion: The scientific and community-building roles of the Geoengineering Model Intercomparison Project (GeoMIP) – past, present, and future, Atmos. Chem. Phys., 23, 5149–5176, https://doi.org/10.5194/acp-23-5149-2023, 2023.
Wang, T. and Sun, F.: Global gridded GDP data set consistent with the shared socioeconomic pathways, Scientific Data, 9, 221, https://doi.org/10.1038/s41597-022-01300-x, 2022.
Webb, R., Rosenzweig, C. E., and Levine, E. R.: Global Soil Texture and Derived Water-Holding Capacities (Webb et al.), ORNL Distributed Active Archive Center, https://doi.org/10.3334/ORNLDAAC/548, 2000.
Wells, N., Goddard, S., and Hayes, M. J.: A Self-Calibrating Palmer Drought Severity Index, Journal of Climate, 17, 2335–2351, https://doi.org/10.1175/1520-0442(2004)017<2335:ASPDSI>2.0.CO;2, 2004.
Wilson, J. C., Jonsson, H. H., Brock, C. A., Toohey, D. W., Avallone, L. M., Baumgardner, D., Dye, J. E., Poole, L. R., Woods, D. C., DeCoursey, R. J., Osborn, M., Pitts, M. C., Kelly, K. K., Chan, K. R., Ferry, G. V., Loewenstein, M., Podolske, J. R., and Weaver, A.: In Situ Observations of Aerosol and Chlorine Monoxide After the 1991 Eruption of Mount Pinatubo: Effect of Reactions on Sulfate Aerosol, Science, 261, 1140–1143, https://doi.org/10.1126/science.261.5125.1140, 1993.
Yue, X., Tian, C., and Lei, Y.: Relieved drought in China under a low emission pathway to 1.5 °C global warming, International Journal of Climatology, 41, E259–E270, https://doi.org/10.1002/joc.6682, 2021.
Zhao, M., Cao, L., Bala, G., and Duan, L.: Climate Response to Latitudinal and Altitudinal Distribution of Stratospheric Sulfate Aerosols, Journal of Geophysical Research: Atmospheres, 126, e2021JD035379, https://doi.org/10.1029/2021JD035379, 2021.
Zhou, L., Tian, Y., Myneni, R. B., Ciais, P., Saatchi, S., Liu, Y. Y., Piao, S., Chen, H., Vermote, E. F., Song, C., and Hwang, T.: Widespread decline of Congo rainforest greenness in the past decade, Nature, 509, 86–90, https://doi.org/10.1038/nature13265, 2014.