the Creative Commons Attribution 4.0 License.
the Creative Commons Attribution 4.0 License.
 | 29 Jan 2025
Regional modeling of surface solar radiation, aerosol, and cloud cover spatial variability and projections over northern France and Benelux
Gabriel Chesnoiu
Isabelle Chiapello
Nicolas Ferlay
Pierre Nabat
Marc Mallet
Véronique Riffault
Investigating the current and future evolution of surface solar radiation (SSR) is essential in the context of climate change and associated environmental issues. We focus on the influence of atmospheric aerosols, along with cloud cover and water vapor content, on northern France and Benelux in spring and summer. Our analysis relies on the National Centre for Meteorological Research–Limited Area Adaptation Dynamic International Development v6.4 (CNRM-ALADIN64) regional climate model at 12.5 km resolution, which includes an interactive aerosol scheme. A regional evaluation of 2010–2020 ALADIN hindcast simulations of clear-sky and all-sky SSR, clear-sky frequency, and aerosols, through comparison to coincident multi-site ground-based measurements, shows reasonable agreement. In addition, these hindcast simulations emphasize how elevated aerosol loads over Benelux and high cloud cover over southwestern England reduce the SSR. Additional ALADIN climate simulations for 2050 and 2100 under Coupled Model Intercomparison Project phase 6 (CMIP6) Shared Socioeconomic Pathway (SSP) 1-1.9 predict a significant reduction in aerosol loads compared to 2005–2014, especially over Benelux, associated with future increases in clear-sky SSR but geographically limited all-sky SSR evolution. In contrast, under SSP3-7.0, clear-sky and all-sky SSR is projected to decline significantly over the domain. This decline is greatest in spring over Benelux due to combined increases in cloud cover and nitrate aerosols projected from 2050 onwards. In summer, projected decreases in cloud cover largely attenuate the reduction in SSR due to aerosols in 2050, while by 2100 rising water vapor contents counteract this attenuation. Thus, our results highlight seasonally and spatially variable impacts of future anthropogenic aerosol emissions on SSR evolution due to cloud cover and water vapor modifications that will likely largely contribute to the modulation of forthcoming aerosol influences.
- Article
(12812 KB) - Full-text XML
-
Supplement
(3713 KB) - BibTeX
- EndNote


As shown by available long-term observational records in Europe and various regions of the world, surface solar radiation (SSR) has not been stable over the past few decades (Wild et al., 2015) and should not be expected to be steady in upcoming decades. Both changing climate and variations in clouds and aerosols will influence its future evolution (Nabat et al., 2014), with possible regional specificities that need to be investigated (Persad et al., 2023). The quantity of solar energy reaching the Earth's surface plays a critical role in the Earth's energy balance and climate dynamics. It influences a wide range of key physical and biological processes, including evaporation, snow and glacier melt, plant photosynthesis, and associated terrestrial carbon uptake (IPCC, 2023). Furthermore, the efficiency of systems relying on the conversion of SSR into other energy forms, such as heat and electricity, directly depends on the availability and variability of the solar resource (Jerez et al., 2015; Tobin et al., 2018; Hou et al., 2021).
In the context of climate change that requires an increase in photovoltaic energy production (relevant for the energy transition), understanding the past and future evolution of the solar radiation incident at the surface is an important environmental and societal issue (Jerez et al., 2015; Tobin et al., 2018). Numerous studies conducted in recent decades, utilizing both observations and modeling, indicate that surface solar radiation has been subject to significant decadal variations in the past, with a worldwide decreasing (dimming) trend until the 1990s and, conversely, an increasing (brightening) trend from then onwards (Wild et al., 2005; Wild, 2009; Liepert, 2002; Norris and Wild, 2007). Determining the causes of these trends has been challenging due to the complex interplay of various forcing agents, which directly affect SSR variability through scattering and absorption and also alter atmospheric dynamics and cloud formation. In Europe, an increasing number of studies suggest that the rise in all-sky radiation since around 1985 is attributable to changes in cloud cover and anthropogenic aerosol emissions (Schwarz et al., 2020; Boers et al., 2017; Dong et al., 2022; Wild et al., 2021). However, it should be noted that due to the high spatial and temporal variability of clouds and aerosols, their influence and the resulting trends in SSR exhibit strong spatiotemporal variations that require further investigation. Pfeifroth et al. (2018) notably show that, over 1992–2015, maximum positive trends occur in spring and autumn across western, central, and eastern Europe, whereas the winter season and southern Europe exhibit weaker increases or even negative trends in SSR. Regarding future evolutions, several studies conducted in Europe, based on either global or regional climate models, project significant changes in meteorological parameters by the end of the 21st century (Coppola et al., 2021), although some uncertainties still persist in the projections associated with Coupled Model Intercomparison Project (CMIP) future climate scenarios. These uncertainties are often related to the type of modeling in terms of regional versus global climate model (Coppola et al., 2021) and robust assessment of aerosols' future evolutions in time (Boé et al., 2020; Gutiérrez et al., 2020; Schumacher et al., 2024). Based on most recent future climate scenarios used in the sixth phase of the Coupled Model Intercomparison Project (CMIP6), Drugé et al. (2021) underline the role of aerosols in the evolution of SSR over the Euro-Mediterranean region, in terms of both aerosol–radiation and aerosol–cloud interactions, while Hou et al. (2021) emphasize the influence of cloud cover changes in Europe. Both studies highlight some SSR increases over large parts of Europe for several Shared Socioeconomic Pathways (SSPs).
The aim of our study is to contribute to refining current knowledge of the recent and future spatiotemporal variability of surface solar radiation related to the evolution of associated atmospheric components, focusing on the Benelux and northern France (BNF) region, a part of western Europe subject to frequent cloudy conditions and regular atmospheric particulate pollution events (Potier et al., 2019; Favez et al., 2021; Velazquez-Garcia et al., 2023). In order to provide further understanding, our analysis encompasses both all-sky and clear-sky global surface solar radiation, as well as the proportion of diffuse irradiance, which impacts the performances of some solar technologies (Kirn et al., 2015; Lindsay et al., 2020), vegetation productivity, and photosynthetic processes (Roderick et al., 2001; Mercado et al., 2009; Niyogi et al., 2004). The variability of all these radiation parameters is examined along with that of three main atmospheric parameters, i.e., cloud cover, atmospheric aerosols, and water vapor content, which have a strong influence on global, direct, and diffuse SSR levels and need to be properly accounted for in modeling exercises, both for the current period and for future climate trajectories. Our study relies on high-resolution (1 h model outputs and a spatial resolution of 12.5 × 12.5 km) simulation datasets from the National Centre for Meteorological Research–Limited Area Adaptation Dynamic International Development v6.4 (CNRM-ALADIN64) regional climate model, which incorporates the recently upgraded Tropospheric Aerosols for Climate in CNRM-CM (TACTIC) interactive aerosol scheme with seven main aerosol species, including ammonium and nitrate particles (Drugé et al., 2019, 2021). The crucial and increasing role of nitrate aerosols in terms of regional climate has been underlined by several studies (Bellouin et al., 2011; Colette et al., 2013; Hauglustaine et al., 2014; Drugé et al., 2019, 2021), especially over western Europe. The regional ALADIN simulations are analyzed in both hindcast (driven at the lateral boundaries by the European Centre for Medium-Range Weather Forecasts (ECMWF) ERA5 reanalysis, covering the years 2010–2020) and climate (driven at the lateral boundaries by the global climate model CNRM-ESM2-1) modes. The regional climate ALADIN simulations allow for the study of the future evolution of SSR components (clear-sky, all-sky, and diffuse fraction) and associated atmospheric parameters (cloud cover, aerosols, water vapor) for mid-term (2045–2054) and long-term (2091–2100) horizons compared to the recent historical period (2005–2014). The future simulations are performed for two contrasting CMIP6 scenarios that use the most recent and more realistic anthropogenic emission datasets, which are supposed to improve the representation of the long-term variability of aerosols (Drugé et al., 2021). We choose Shared Socioeconomic Pathways 1-1.9 and 3-7.0, as they present contrasted climate evolutions, especially for aerosols and precursor emissions, and are thus representative of a large range of possible future scenarios.
Section 2 provides a brief overview of the CNRM-ALADIN64 climate model and the two kinds of simulation datasets, hindcast and climate versions, used in this study. This section also introduces the various sets of ground-based measurements of aerosol loads and SSR components used to evaluate the performances of CNRM-ALADIN64 hindcast simulations over the BNF region for the period 2010–2020, as detailed in Sect. 3. The results of our analysis of the recent and future spatiotemporal variability of the solar environment over the northern France and Benelux regions are presented in Sect. 4. In order to evaluate the influence of future aerosol anthropogenic emission trajectories on SSR evolution, we focus on the spring (i.e., March–April–May) and summer (i.e., June–July–August) seasons. Over the Benelux and northern France region, both aerosol loads and SSR are maximum during this period of the year, coincidently with more frequent clear-sun conditions, as shown by ground-based measurement analysis (Chesnoiu et al., 2024c). Finally, Sect. 5 provides the concluding remarks, including potential directions for future works.
2.1 The CNRM-ALADIN64 regional climate model
In this study, we use regional climate simulations from the most recent version (v6.4) of the CNRM-ALADIN model (Nabat et al., 2020), which includes an interactive aerosol scheme (Drugé et al., 2019, 2021).
CNRM-ALADIN64 is a bi-spectral regional climate model (RCM) with a semi-Lagrangian advection and semi-implicit scheme that provides regional simulations over several areas, such as the Euro-Mediterranean region considered in the present study (Fig. 1), as shown in the previous studies of Drugé et al. (2019, 2021) and Nabat et al. (2020). This model provides outputs at monthly, daily, and hourly frequencies. The horizontal resolution ranges from 0.44° (50 km) to 0.11° (12.5 km). In the present study, only hourly outputs were analyzed to isolate daytime conditions, which are more relevant for the study of surface solar radiation. Moreover, the horizontal resolution was chosen to be 0.11° to optimize comparisons with ground-based measurements, as described in Sect. 3.
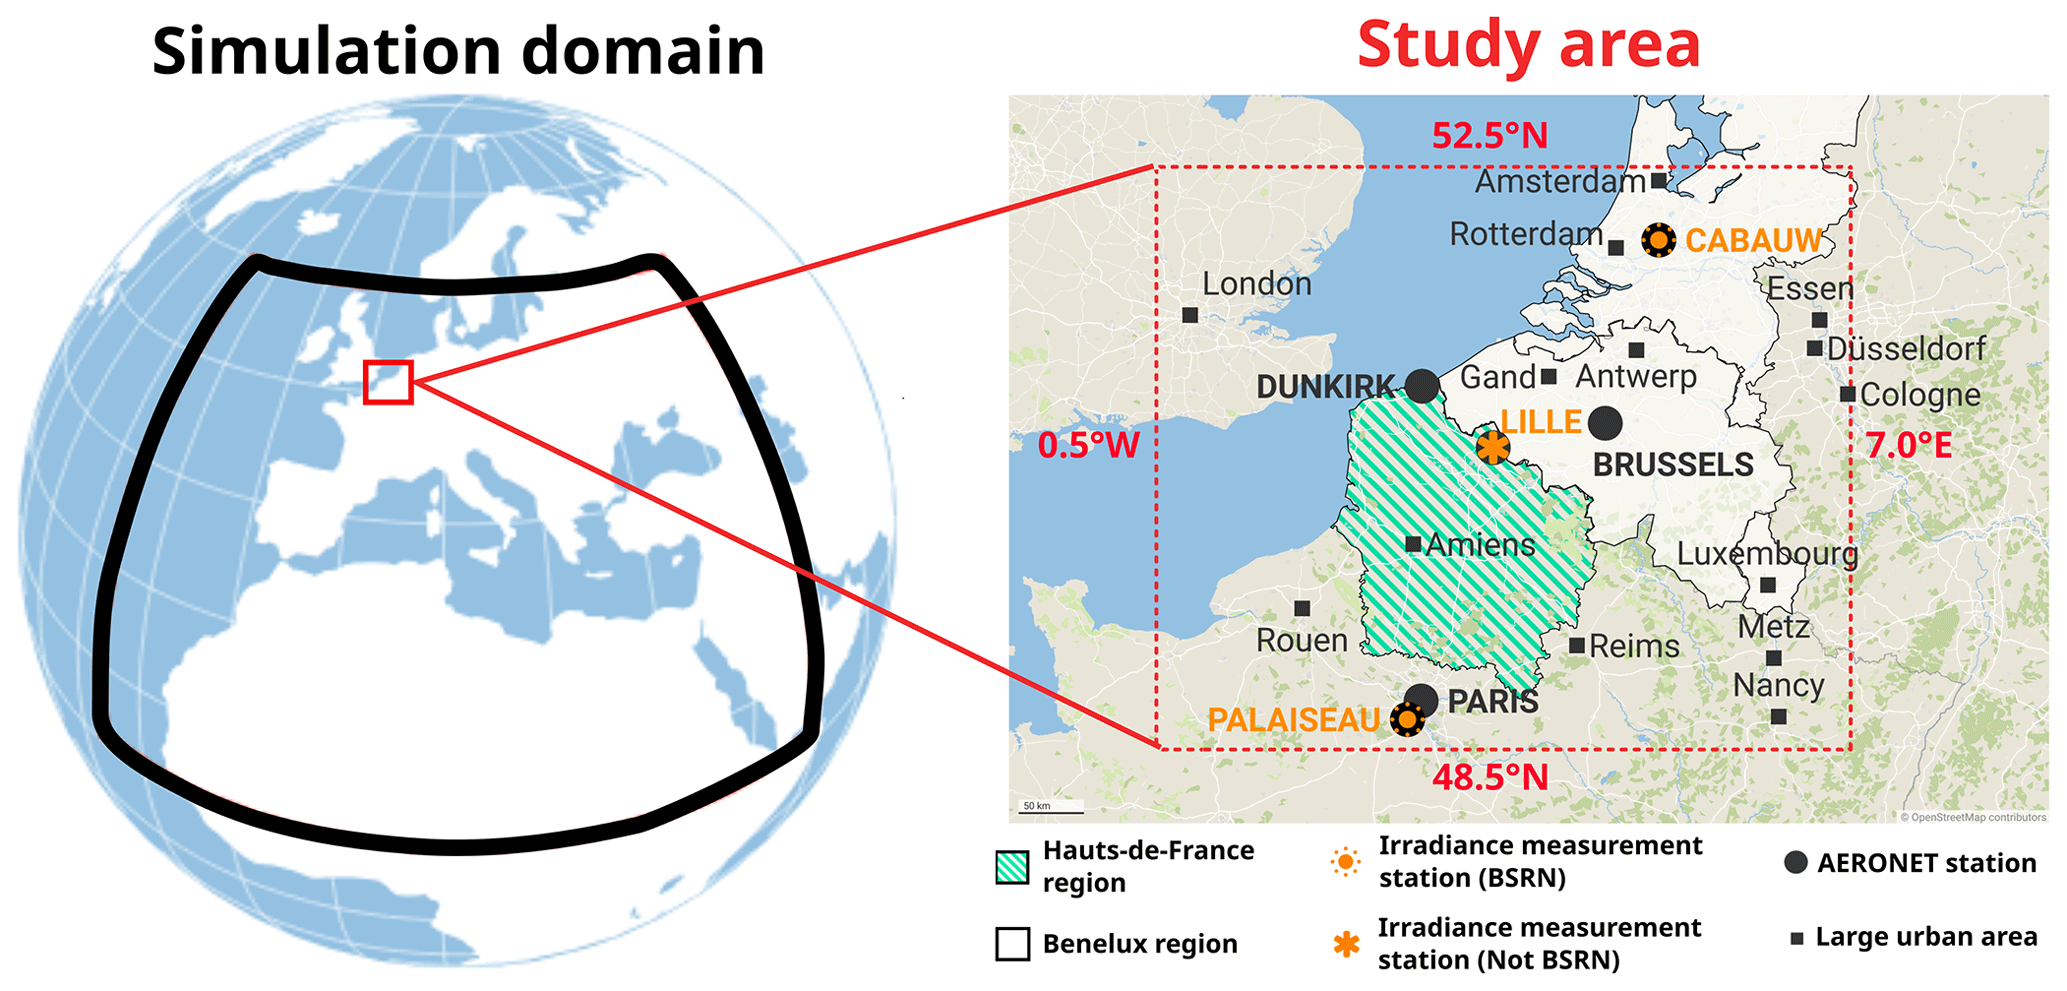
Figure 1Map representing the domain of the simulation (black square on the left-hand side) and the study area (red square) considered in this work. The Hauts-de-France and Benelux regions are also represented on the right-hand side of the figure, as hatched green and white areas, respectively. The locations of the different measurement stations used to evaluate ALADIN hindcast simulations are also depicted. Aerosol Robotic NETwork (AERONET) stations equipped with sun photometers are represented as black dots. An additional orange symbol indicates that coincident irradiance measurements are also available at the station. Large urban areas located in the study area are represented as small black squares. These maps were created with Datawrapper. ©OpenStreetMap contributors 2024. Distributed under the Open Data Commons Open Database License (ODbL) v1.0.
The surface is represented by the SURFace EXternalisée (SURFEX; Masson et al., 2013) continental surface modeling platform version 8, which separates natural land surfaces, lake areas, and maritime zones in surface irradiance calculations. SURFEX provides, in particular, the upward fluxes, latent and sensible heat, and surface albedo required for the radiative scheme of the CNRM-ALADIN64 model. The radiative transfer simulations of CNRM-ALADIN64 are based, for the solar spectrum, on the radiative scheme of Fouquart and Morcrette, which relies on the use of a six-band wavelength k distribution (Fouquart and Bonnel, 1980; Morcrette et al., 2008), while thermal radiance simulations rely on the Rapid Radiative Transfer Model (RRTM) of Mlawer et al. (1997). In what follows, In what follows, the model is interchangeably referred to as CNRM-ALADIN64 and ALADIN.
2.1.1 The TACTIC aerosol scheme
The CNRM-ALADIN64 model includes a tropospheric aerosol scheme named TACTIC, which is based on the GEMS/MACC module (Morcrette et al., 2009) of the ECMWF forecasting model. The TACTIC scheme, described in detail in Nabat et al. (2020), simulates the life cycle (emission, transport, deposition) of the five aerosol species (in an external mixing manner) initially included in the model, i.e., black carbon, organic matter, desert dust, sulfate, and sea salt, as well as nitrate (NO3) and ammonium (NH4) aerosols, which were recently included (Drugé et al., 2019).
While a driving model (global climate model (GCM) or reanalysis model) provides atmospheric lateral boundary forcing at a 6 h frequency for temperature, wind, humidity, and pressure, as well as sea surface temperature and sea ice cover at monthly frequency (linearly interpolated into daily values), the long-distance transport of particles is not included in the boundary condition forcing from global model simulations. However, the CNRM-ALADIN64 simulation domain (Fig. 1) is assumed to be sufficiently large to include the main aerosol sources affecting the Euro-Mediterranean region, including the two main desert dust aerosol sources (i.e., the Sahara and the largest part of the Arabian Peninsula).
Primary emissions of sea salt and dust aerosols are computed based on surface winds and soil characteristics for dust particles, while anthropogenic and biomass burning emissions of aerosols are based on monthly inventories of precursor gases and primary aerosols. Overall, the TACTIC aerosol scheme uses 16 prognostic variables: (i) six size bins for dust and primary sea salt aerosols (three each); (ii) four size bins for organic matter and black carbon aerosols (one hydrophilic and one hydrophobic bin each); (iii) one bin for sulfate particles and another for its precursors, notably sulfur dioxide (SO2); (iv) two different bins for nitrate aerosols (fine and coarse modes); and (v) two bins for ammonium and ammonia tracers. It is noteworthy that one of the ammonium nitrate precursors, nitric acid (HNO3), is implemented in the model as a monthly climatology, constant over the years, based on CAMS reanalysis data (Inness et al., 2019). However, a sensitivity test conducted by Drugé et al. (2019) revealed that the nitrate concentration is relatively unaffected by the use of a constant or time-dependent nitric acid climatology. Additionally, biogenic secondary organic aerosols (SOAs) are included in CNRM-ALADIN64 simulations through the climatology of Dentener et al. (2006), but their formation is not explicitly included in the TACTIC aerosol scheme.
The TACTIC aerosol scheme also accounts for the transport of aerosols inside the domain, the influence of humidity on aerosol optical properties, and dry and wet deposition processes (in and below clouds). The TACTIC aerosol scheme considers both the aerosol–radiation interactions (forcing and adjustments) for all aerosols and the aerosol–cloud interaction forcing (cloud albedo effect) only for sea salt, sulfate, and organic aerosols. However, the other aerosol–cloud interactions (second indirect effect on cloud lifetime) are not included in this aerosol scheme.
The various optical properties of each aerosol species, especially those used as input for the radiative transfer scheme (extinction coefficient, asymmetry parameter, and single-scattering albedo), are set for each aerosol type as in Nabat et al. (2013) and Drugé et al. (2019). These different aerosol optical properties are pre-calculated using a Mie code based on the assumption of aerosol sphericity (Ackerman and Toon, 1981) and depend on relative humidity, except for mineral dust and hydrophobic carbon particles. For more information, including cloud and gas optical properties and the dynamics of the CNRM-ALADIN64 regional climate model, refer to the publication by Nabat et al. (2020) and the references therein.
2.1.2 Study area
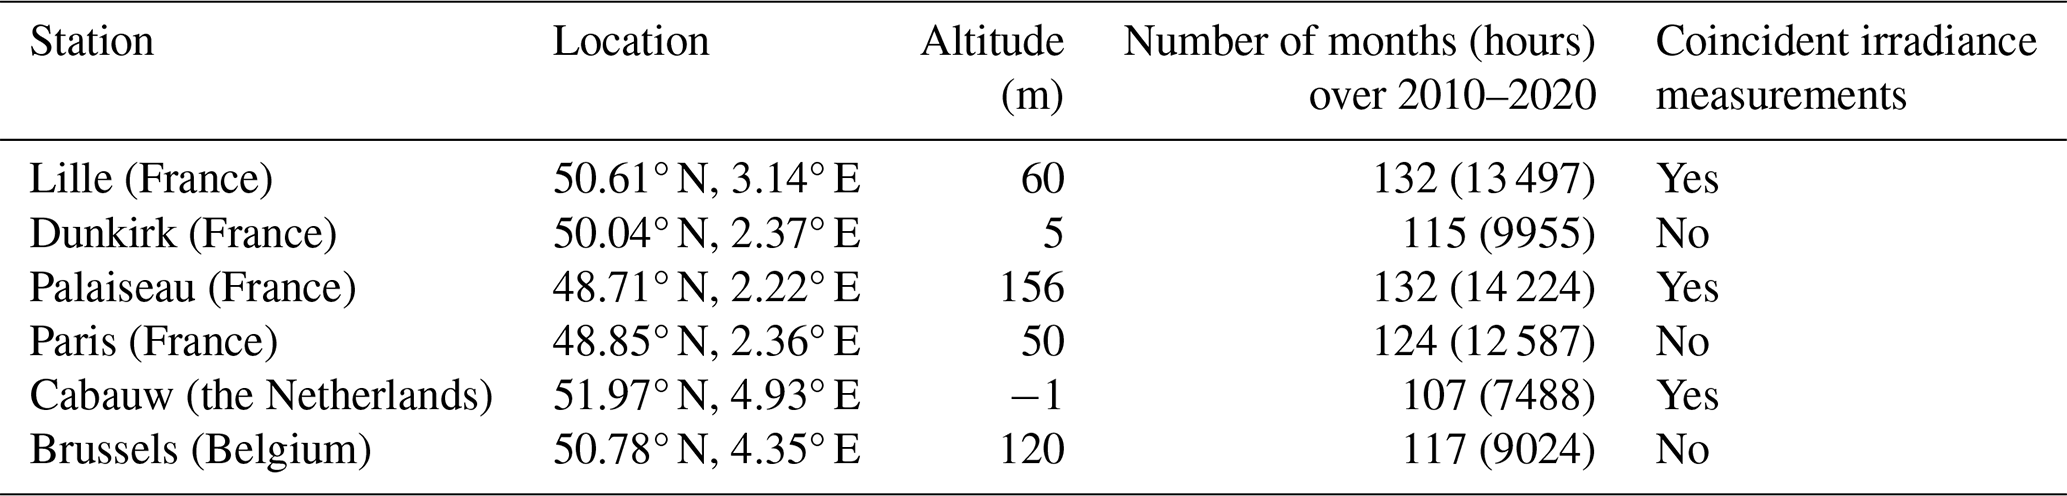
The ALADIN simulation domain used in this study (Fig. 1), close to that used in Nabat et al. (2015), Drugé et al. (2019), Nabat et al. (2020), and Drugé et al. (2021), includes the official domain of the Med-CORDEX initiative (Ruti et al., 2016), as well as the two main sources of desert aerosols represented by the Sahara and the Arabian Peninsula. Thanks to the finer spatial resolution of 12.5 km of version 6.4 of ALADIN used here, we focus on analyzing simulations in a much more restricted area (48.5–52.5° N, 0.5° E–7° W; Fig. 1), hereafter referred to as the Benelux and northern France (BNF) region, spanning Paris to Amsterdam and London to Cologne. This region, which encompasses several European metropolises (London, Paris, Brussels, and Amsterdam), is characterized by both a high population density, with over 70 million inhabitants, and significant levels of anthropogenic activity, particularly from the residential, industrial, transportation, and agricultural sectors, which result in substantial emissions of air pollutants. The BNF region also experiences a significant influence of maritime aerosols originating from the English Channel and the North Sea, along with a relatively high frequency of cloudy conditions throughout the year. Our study area also includes six measurement stations from the Aerosol Robotic NETwork (AERONET; Holben et al., 2001) (namely, Brussels in Belgium; Cabauw in the Netherlands; and Dunkirk, Lille, Palaiseau, and Paris in France) and three surface irradiance measurement sites (Cabauw in the Netherlands; Lille and Palaiseau in France), including two (Cabauw and Palaiseau) from the Baseline Surface Radiation Network (BSRN; Ohmura et al., 1998). This allows for a relatively broad regional evaluation of ALADIN simulations.
2.1.3 Simulation datasets
As previously stated, ALADIN regional climate model simulations are constrained at the boundaries by GCM or reanalysis model simulations. In this study, several datasets of ALADIN simulations were used. A first dataset, hereafter referred to as hindcast, was used to evaluate ALADIN regional climate simulations, as well as to analyze the spatial variability of the solar environment over the BNF region from 2010 to 2020, which represents the longest and most continuous period of coincident photometric and irradiance measurements available for this region. In this case, ALADIN simulations are driven at the lateral boundaries by the ECMWF ERA5 reanalysis (ECMWF, 2016). A spectral nudging method (as in Nabat et al., 2020) is also included to better constrain the large scales in the model (above 850 hPa). In addition, anthropogenic and biomass burning emissions are defined using emission inventories from the CEDS v2021-04-21 release datasets (O'Rourke et al., 2021) and are adjusted following the methodology of Lamboll et al. (2021) to account for the decrease in anthropogenic activities due to lockdown periods of the year 2020.
Using the climate mode of ALADIN, three additional datasets, hereafter referred to as HIST, SSP119, and SSP370, were used to assess the future evolution of the solar environment over the BNF region for two SSPs (O'Neill et al., 2017) from the CMIP6 initiative. These simulations are driven at the boundaries by the CNRM-ESM2-1 global climate model (Séférian et al., 2019). The first dataset corresponds to regional climate simulations over the historical period 2005–2014, while the other two correspond to mid-term (2045–2054) and long-term (2091–2100) future regional climate simulations for the optimistic SSP1-1.9 (Sustainability – Taking the green road, O'Neill et al., 2017) and more pessimistic SSP3-7.0 (Regional rivalry – A rocky road, O'Neill et al., 2017), respectively. To ensure the statistical robustness of our analysis, the HIST, SSP119, and SSP370 datasets are actually composed of three distinct 10-year members for each period, which are aggregated to form a total of five small climate ensembles of 30 years: one for the historical period, two for the mid-term period (one for each scenario), and two for the long-term period. Anthropogenic and biomass burning emissions are defined over the historical period through the emission inventories of Hoesly et al. (2018) and van Marle et al. (2017), respectively, while future emissions vary according to the pathways defined by Gidden et al. (2019). The two scenarios used in our study were chosen as they correspond to very contrasting anthropogenic emission pathways. On the one hand, the SSP1-1.9 scenario is characterized by a relatively limited increase in greenhouse gas emissions, which leads to lower levels of global warming and thus to a reduced increase in surface temperature and water vapor content. Furthermore, as shown in Fig. 2, the SSP1-1.9 scenario is also characterized by the greatest decrease in global aerosol emissions (black carbon and organic carbon) and precursor gases (sulfur dioxide and ammonia) in Europe. On the other hand, the SSP3-7.0 scenario is characterized by an important increase in greenhouse gas emissions and thus in surface temperature and water vapor content. Moreover, the SSP3-7.0 scenario is characterized by the lowest decrease in anthropogenic emissions of aerosol and precursors (Fig. 2), with even an increase in ammonia emissions compared to the reference period of 2005–2014.
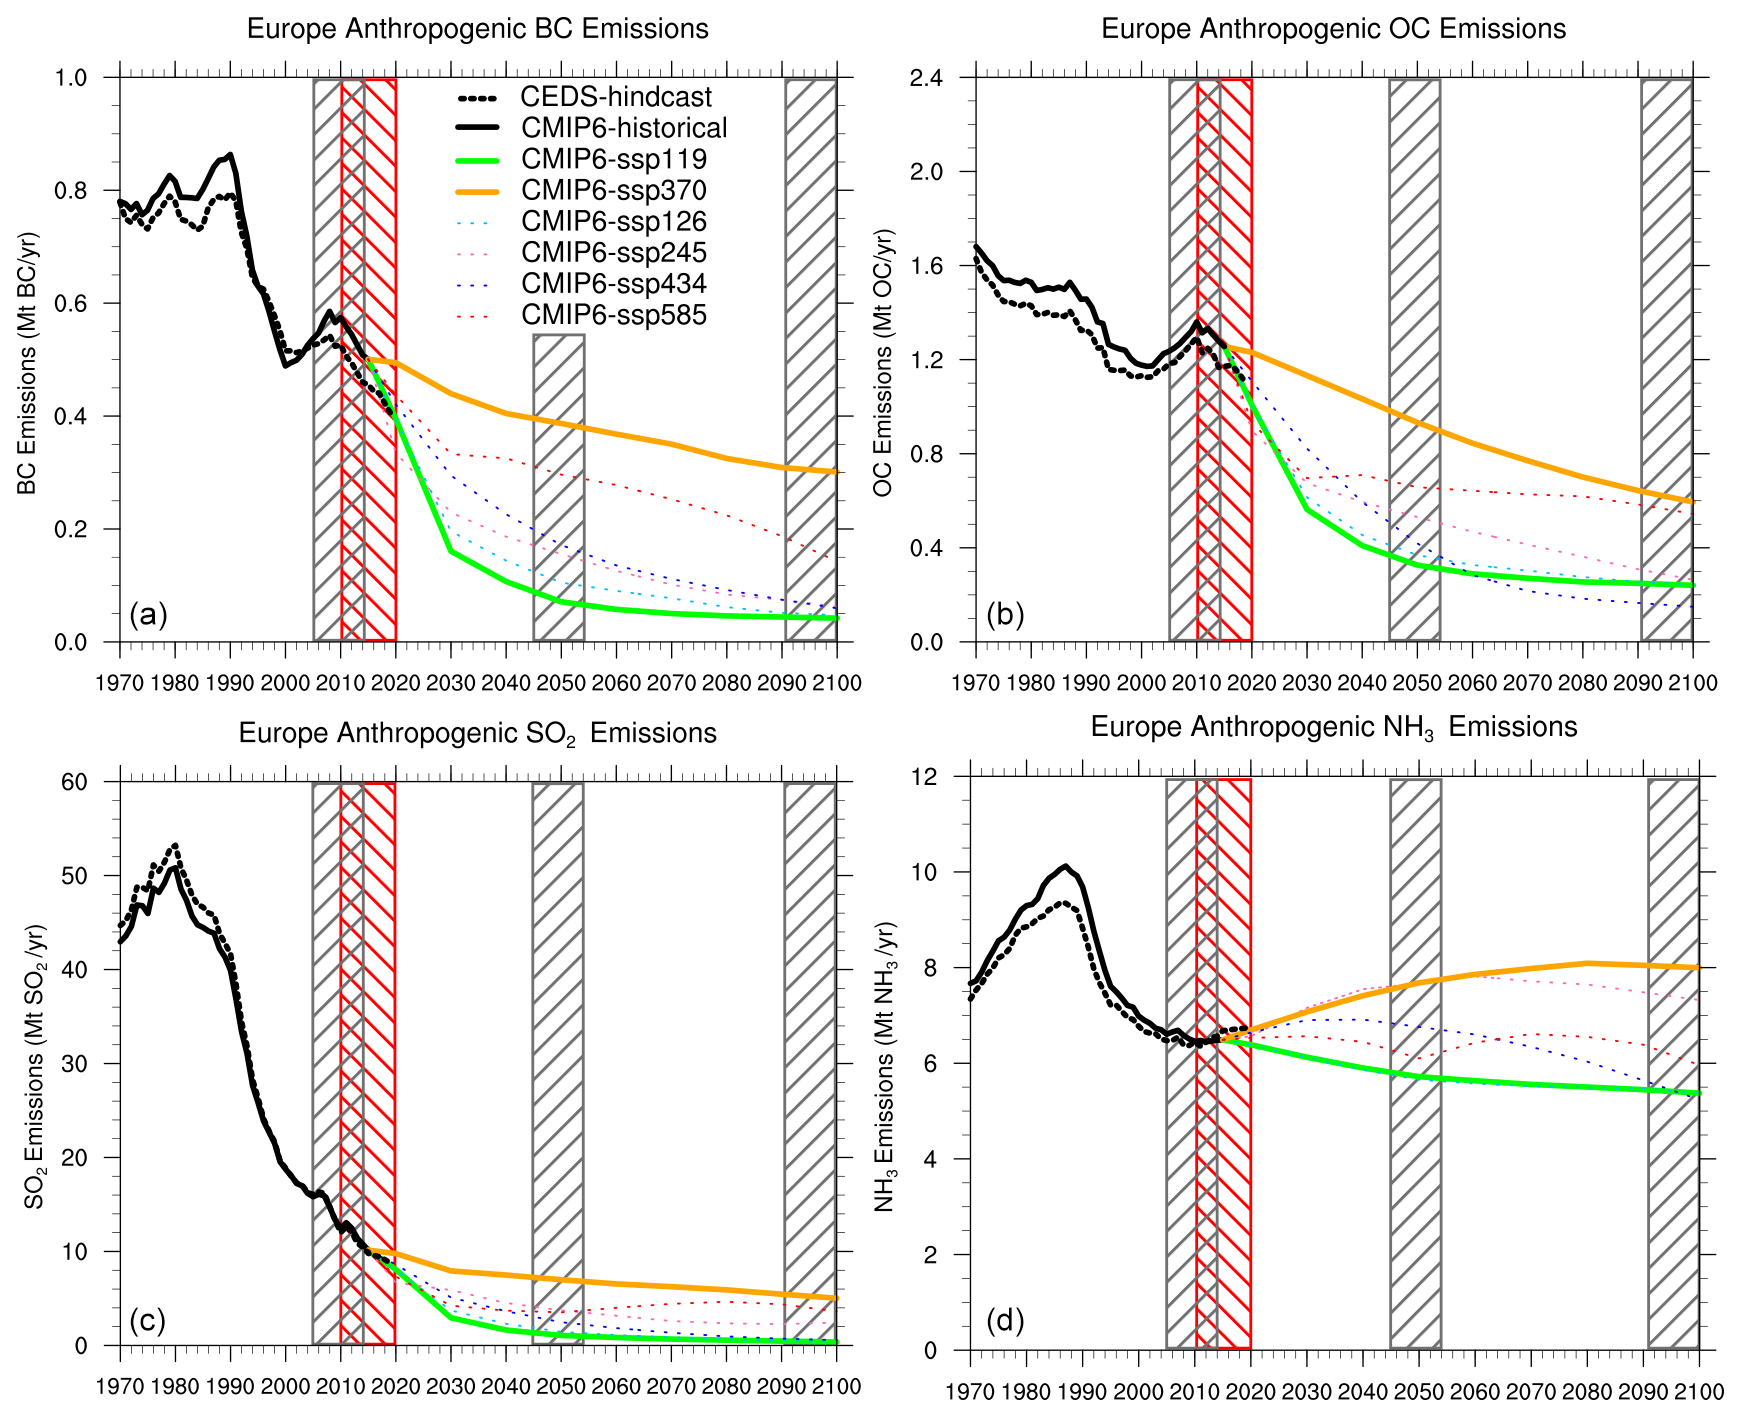
Figure 2Evolution of global aerosol emissions (black carbon and organic carbon, top panels) and precursor gases (sulfur dioxide and ammonia, bottom panels) in Europe from 1970 to 2100 (van Marle et al., 2017; Hoesly et al., 2018; Gidden et al., 2019) for different Shared Socioeconomic Pathways (SSPs). CMIP6 historical emissions over the period 1970–2015 are represented by the thick black curves, while projected emissions for the different SSP scenarios appear as colored lines. Emissions for the two scenarios analyzed in this study are represented as thick green (SSP1-1.9) and orange (SSP3-7.0) lines, while other scenarios appear as smaller dashed lines. The hatched gray areas represent the reference period (2005–2014) and future horizons (2045–2054 and 2091–2100) considered for our analysis of the future evolution of the solar environment. Moreover, CEDS emissions (O'Rourke et al., 2021) used for hindcast simulations are represented by the dashed thick black curves, while the corresponding period (2010–2020) considered for evaluation and analysis of these simulations is highlighted by the hatched red areas.
It is worth noting that a preliminary analysis of ALADIN simulations has shown overall overestimates of nitrate mass concentrations over the BNF region, in agreement with previous results of Drugé et al. (2019). Although this overestimation was mainly observed in spring, for consistency, a global reduction factor of 25 % has been applied to all monthly ammonia (NH3) emissions, as a precursor of nitrate and ammonium aerosols. The choice of the reduction factor has been the subject of an extensive sensitivity analysis. The retained adjustment factor of 25 %, specific to our study, represents a compromise between reducing the overestimation in spring and maintaining realistic nitrate concentrations throughout the rest of the year. It can be emphasized that such corrections are consistent with current uncertainties in ammonia emissions, which remain significant, especially at the local scale (Hoesly et al., 2018).
2.2 Ground-based observations
In this study, several datasets of ground-based measurements have been used to evaluate the performances of ALADIN simulations over the BNF region (Fig. 1). Aerosol optical property simulations (mainly aerosol optical depth and Ångström exponents) are compared with AERONET photometric observations available at six measurement stations (Table 1) with more than 5 years of data over the period 2010–2020 (Brussels, Cabauw, Dunkirk, Lille, Palaiseau, and Paris). Note that AERONET observations also include measurements of integrated precipitable water (PRW), which were used to assess simulations of the water vapor content at all measurement stations. Three of the six stations (Cabauw, Lille, and Palaiseau) also include coincident surface solar radiation (SSR) observations, which were used to evaluate ALADIN radiative transfer simulations of SSR. In addition, in situ long-term measurements of PM1 aerosol surface mass concentrations from the ATmospheric Observations in LiLLE (ATOLL) platform in Lille (Chebaicheb et al., 2023) were used to evaluate ALADIN simulations of the aerosol chemical composition near the surface. Note that in what follows only surface mass concentrations (in µg m−3) are evaluated and are therefore mentioned, for simplicity, as surface concentrations.
Table 1Station name, location, altitude, and number of months and hours available over the study period (2010–2020) of the six AERONET stations considered in this study. The additional availability of irradiance measurements is also indicated.
2.2.1 Surface solar radiation
In Lille, a set of a Kipp & Zonen CH1 pyrheliometer and a CMP22 pyranometer (paired with a shading sphere), mounted on a sun-tracking device, measures the direct (or beam) normal irradiance (DNI) incident at the surface in the direction of the Sun and the diffuse horizontal irradiance (DHI), respectively. The beam horizontal irradiance (BHI) is then derived from the DNI measurements using the cosine of the solar zenith angle (μ0) as . In Cabauw and Palaiseau, which are part of the BSRN (Driemel et al., 2018; Haeffelin, 2022; Knap, 2022), the total SSR, also known as global horizontal irradiance (GHI), is measured directly using an additional CMP22 pyranometer (without a shading sphere), while in Lille the GHI is computed as the sum of the BHI and DHI. All measurements are performed at a 1 min resolution and have been analyzed over the period 2010–2020, which is the most complete period of measurements for all sites considered in this study. According to BSRN requirements, the measurement uncertainties in GHI, BHI, and DHI should be of the order of 2 %, 0.5 %, and 2 % for BSRN stations (McArthur, 2005). However, the study of Vuilleumier et al. (2014) showed that for the direct component, an uncertainty of 0.5 % is probably not achievable in practice, even with the best commercially available technologies. The uncertainties are thus expected to be around 2 % to 3 % for the global and diffuse components and close to 1.5 % for the direct component (Vuilleumier et al., 2014). Note that in Lille, the computation of the GHI from measurements of BHI and DHI can lead to measurement biases of the order of ±1.0 % (Derimian et al., 2008, 2012). However, as both instruments are subject to regular maintenance, including daily cleaning and periodic calibrations, uncertainties similar to those of Cabauw and Palaiseau can be expected for irradiance observations performed in Lille. In addition, it is worth noting that in Lille, a measurement gap occurs for winter months, particularly in January and February, as the instruments are regularly sent to either Delft (the Netherlands) for a recalibration by the manufacturer or M'Bour (Senegal) for calibration of local instruments.
2.2.2 Aerosols
AERONET uses CIMEL sun/sky photometers to characterize and monitor aerosol optical and columnar microphysical properties in various locations around the world (Holben et al., 2001). The photometer provides direct measurements of the aerosol optical depth (AOD) at typically seven wavelengths between 340 and 1020 nm along with their corresponding Ångström exponents (AEs). In addition, precipitable water (PRW; in cm) is derived from measurements at 940 nm. In this study, we used level-2.0 (cloud-screened and quality-controlled) photometric data from six AERONET measurement stations (Fig. 1, Table 1) available within the BNF region. Note that the evaluation of ALADIN simulations of the AOD was carried out at 550 nm. At this wavelength, no measurement is routinely acquired by photometers. Thus, ground-based data of AOD at 550 nm have been interpolated for all AERONET sites considered following the methodology defined by Gueymard and Yang (2020) based on AERONET AOD measurements at 440, 500, 675, and 870 nm. The initial uncertainty in reference AOD measurements is estimated to be approximately 0.02 for the UV channels (340 and 380 nm) and 0.01 otherwise (Giles et al., 2019). Hence, the uncertainty in AOD550 estimates is expected to be about 0.01 to 0.02. The uncertainty in photometric PRW measurements is expected to be below 15 % (Pérez‐Ramírez et al., 2014; Smirnov et al., 2004), with an average dry bias of around +5 % to +6 % (Pérez‐Ramírez et al., 2014).
Near-real-time in situ measurements of surface concentrations and chemical composition of aerosols have been conducted within the ATOLL platform in Lille since 2016 (Chebaicheb et al., 2023). These observations are based on the coincident measurements of a quadrupole aerosol chemical speciation monitor (Q-ACSM; Aerodyne Research) and an Aethalometer (AE33, Magee Scientific Inc). The ACSM provides data on mass concentrations and mass spectra of five submicron non-refractory aerosol species (NR-PM1, Ng et al., 2011): particulate organics (Org), nitrate, sulfate (SO4), ammonium, and chloride (Cl; negligible here). Additionally, the Aethalometer provides, using optical absorption methods, equivalent concentrations of black carbon (eBC; in µg m−3), with an uncertainty estimated to be of the order of 15 %. These measurements, analyzed at an hourly resolution over the period 2016–2020, allow for the assessment of ALADIN simulations of surface concentrations for various types of submicron aerosols, namely sulfate, nitrate, ammonium, black carbon, and organic particles. For consistency with the terminology of ALADIN simulations, equivalent concentrations of black carbon (i.e., eBC) derived by the Aethalometer are hereafter simply referred to as BC. The operational and technical specifications of the instruments are described in more detail in Velazquez-Garcia et al. (2023) and Chebaicheb et al. (2023). Reproducibility-expanded uncertainties associated with ACSM concentrations have been estimated to be 9 %, 15 %, 19 %, 28 %, and 36 % for NR-PM1, nitrate, organics, sulfate, and ammonium, respectively (Crenn et al., 2015).
The evaluation of ALADIN hindcast simulations is conducted using ground-based observations available from the stations of the BNF region described in Sect. 2.2. Here, the main objective is to assess the quality of the representation of the climatological variability of surface solar radiation and the associated main atmospheric parameters within ALADIN simulations, with a focus on sky conditions, aerosols, and water vapor content. Section 3.1 focuses on evaluating the monthly variability of the frequency of clear-sky situations, derived from ALADIN cloud fraction (CLT) simulations, through comparison with ground-based estimates based on the surface solar radiation measurements conducted at Cabauw, Lille, and Palaiseau. Subsequently, Sect. 3.2 presents the results, for all irradiance components (global, direct, and diffuse), of the comparison between ALADIN SSR simulations with ground-based observations under both all-sky and clear-sky conditions. Section 3.3 outlines the evaluation of the climatological variability of the aerosol content at all AERONET stations of the BNF region and a comparison with in situ measurements of the surface concentrations of submicron particles in Lille. Finally, Sect. 3.4 investigates the ability of ALADIN to accurately simulate the inter-annual variability of the clear-sky frequency, all-sky surface solar radiation, and aerosol optical depth. It is noteworthy that this analysis relies solely on daytime measurements and hourly simulations, which are then averaged to the monthly resolution. This approach is necessary, as photometric observations and identification of clear-sky conditions from SSR measurements can only be achieved during daylight hours, between sunrise and sunset.
3.1 Assessment of the clear-sky frequency
3.1.1 Identification of clear-sky situations
Although numerous methods have been described in the literature (Reno and Hansen, 2016; Gueymard et al., 2019; Al Asmar et al., 2021), our study relies on the well-established method of Long and Ackerman (2000) to distinguish clear and cloudy situations based on high-frequency (3 min or less) ground measurements of global and diffuse surface solar radiation. This method, which has been used for numerous studies (e.g., Elias et al., 2024), was chosen for its limited number of input parameters (solar zenith angle, global and diffuse SSR) and high versatility, as it automatically adapts to the specific conditions of any observational station equipped with measurements of both global and diffuse horizontal irradiances. Our choice is also based on the results of the comparative study of Gueymard et al. (2019), which showed its high precision for the identification of clear-sky conditions. The method notably achieved the second-lowest “false positive” score (i.e., percentage of cloudy situations identified as clear sky) of 7.25 %, despite not depending on collocated photometric measurements or clear-sky simulations. The method of Long and Ackerman (2000) relies on a series of four complementary tests. The aim of the first two tests is to remove obvious cloudy situations characterized by extreme values of the normalized SSR (test 1) and measured diffuse irradiance (test 2) through the definition of threshold values. The third and fourth tests are more elaborate as they rely on the analysis of the temporal variability of the global radiation (test 3) and the normalized diffuse irradiance ratio (test 4), respectively, which allows for the detection of more subtle cloud covers. This method follows an iterative process, which allows for automatic tuning to the specific conditions of any observational station equipped with measurements of both global and diffuse irradiances. Note that for this study, the initial values (before iteration) of all parameters involved in the various tests were defined according to the recommended values reported by Long and Ackerman (2000), and similar values were obtained for each measurement station after the iteration process.
The identification of clear-sky ALADIN simulations relies on the definition of a cloud fraction criterion below which a simulation is categorized as clear sky. This threshold has been determined for each station through evaluation of the average cloud fraction simulated by the model during coincident hours identified as clear sky by the cloud-screening algorithm applied to the ground observations of Cabauw, Lille, and Palaiseau. Similar criteria were derived for all three stations, with mean CLT values of 3.4 %, 3.2 %, and 3.2 %, in Cabauw, Lille, and Palaiseau, respectively. Therefore, a fixed criterion of 3.5 % was chosen in this study to identify hourly climate simulations that can be regarded as clear sky within each pixel of the study area. It should be noted that the comparison of SSR simulations with and without clouds (cloud-free simulations) for hourly simulations identified as clear sky indicates a negligible influence of clouds during such occurrences, with discrepancies between simulated surface solar irradiance values with and without clouds of only a few watts per square meter (not shown).
3.1.2 Evaluation of the annual cycle
Figure 3 illustrates the variability of the monthly average daytime frequency of clear-sky situations (in %) over the period 2010–2020 for the three flux measurement sites located in the BNF region (Cabauw, Lille, and Palaiseau). The black curves represent monthly estimates based on the application of the method of Long and Ackerman (2000) to the irradiance measurements at a 1 min resolution at these different sites. The green curves correspond to estimates based on hourly cloud fraction simulations of the ALADIN regional climate model, for which we regard a simulation as clear sky if the associated CLT is less than 3.5 %. The monthly mean differences between the two kinds of estimates are represented as gray columns.
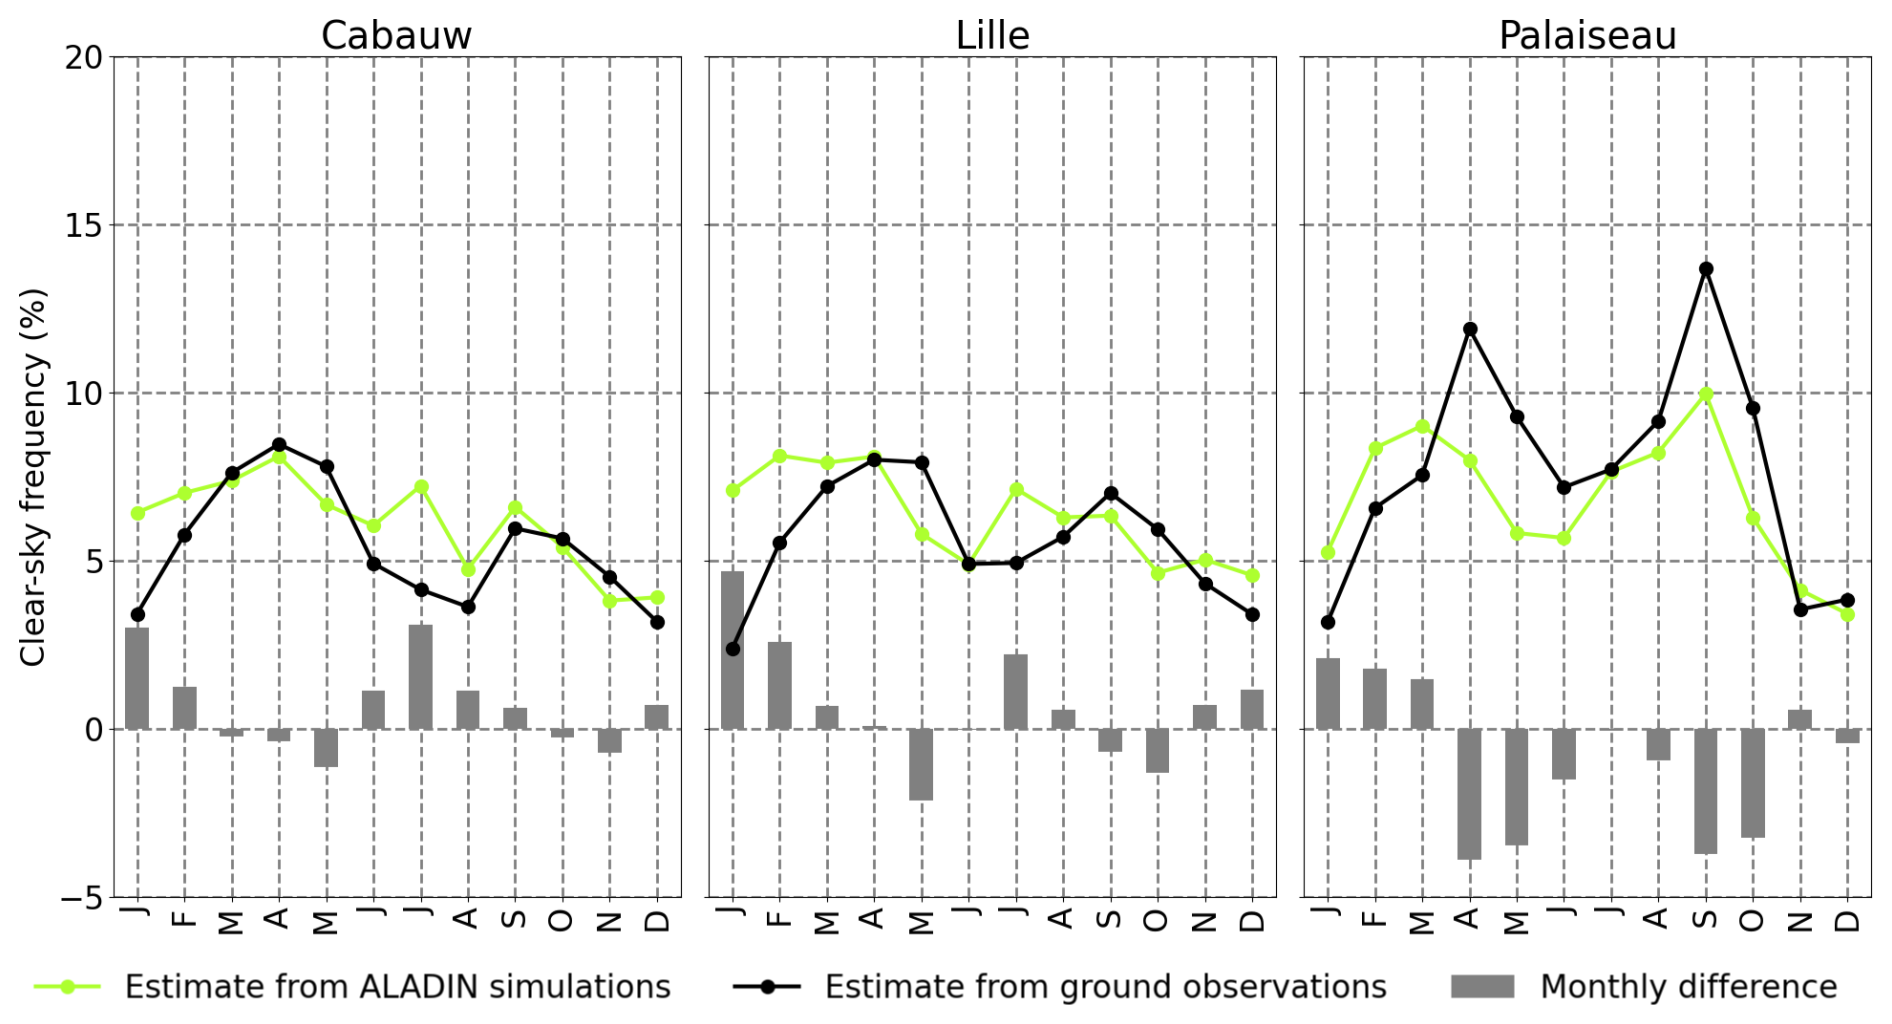
Figure 3Comparisons of the monthly means (2010–2020) of daytime average clear-sky frequency for the three irradiance measurement stations of the BNF region. The green lines correspond to estimates based on ALADIN hindcast simulations (CLT < 3.5 %), while the black lines represent estimates based on the cloud-screening algorithm of Long and Ackerman (2000) applied to the surface solar irradiance measurements of Cabauw, Lille, and Palaiseau. The monthly mean differences between the two kinds of estimates are represented as gray columns.
Estimates based on irradiance measurements show significant intra-annual variability in the estimated clear-sky frequency for the three measurement sites, with a minimum in November–December–January (less than 5 %). Maximum clear-sky frequencies occur in two seasons, with a first peak in April (8 % in Lille and Cabauw, 12 % in Palaiseau) and a second one in September (6 %–7 % in Lille and Cabauw, 14 % in Palaiseau). These results highlight the high frequency of cloudy conditions over the whole BNF region. Figure 3 suggests that ALADIN simulations reasonably reproduce the average annual cycle, with a well-represented peak in spring (8 %) and a less prominent second peak in September (7 %) in Lille and Cabauw. In Palaiseau, the comparison shows that ALADIN slightly underestimates the peaks of clear-sky conditions in September (10 %) and in April (differences of the order of 4 %, as reported Fig. 3), with the first peak occurring earlier (in March, about 9 %). In contrast, the model tends to significantly overestimate the frequency of clear-sky conditions in January and February for all sites (absolute differences of around 2 % to 5 % or 60 % to 200 % in relative terms), although those associated with November and December months are in better agreement (differences less than 1 %). Since the average zenith angle is generally higher, one possible explanation for this overestimation could be related to the performance of the initial method of Long and Ackerman (2000), which tends to misidentify clear-sky situations at large zenith angles (Long and Ackerman, 2000). Additionally, ALADIN estimates show a peak in clear-sky frequency in July of about 7 % in Lille and Cabauw, which is not recorded by ground-based estimates. Overall, despite some specific differences, these comparisons highlight that ALADIN correctly represents the mean seasonal variations in clear-sky conditions as measured over the BNF region. Moreover, a deeper analysis of our ground-based clear-sky conditions shows that the monthly frequency of completely clear-sky hours is significantly lower than the frequency of clear-sky conditions based on the 1 min estimates. Such differences, due to the highly variable nature of the cloud cover at sub-hourly rates, could explain some of the underestimates of hourly ALADIN simulations, such as in September in Palaiseau.
3.2 Simulated surface solar radiation
Figure 4a–b depict the average monthly variability over the period 2010–2020 of the measured (colored lines) and simulated (columns) surface solar radiation for the three measurement sites within the BNF region. Panel (a) corresponds to all-sky conditions, while panel (b) represents irradiances under clear-sky situations identified either from the method of Long and Ackerman (2000) for measurements or from the cloud fraction filter for simulations.
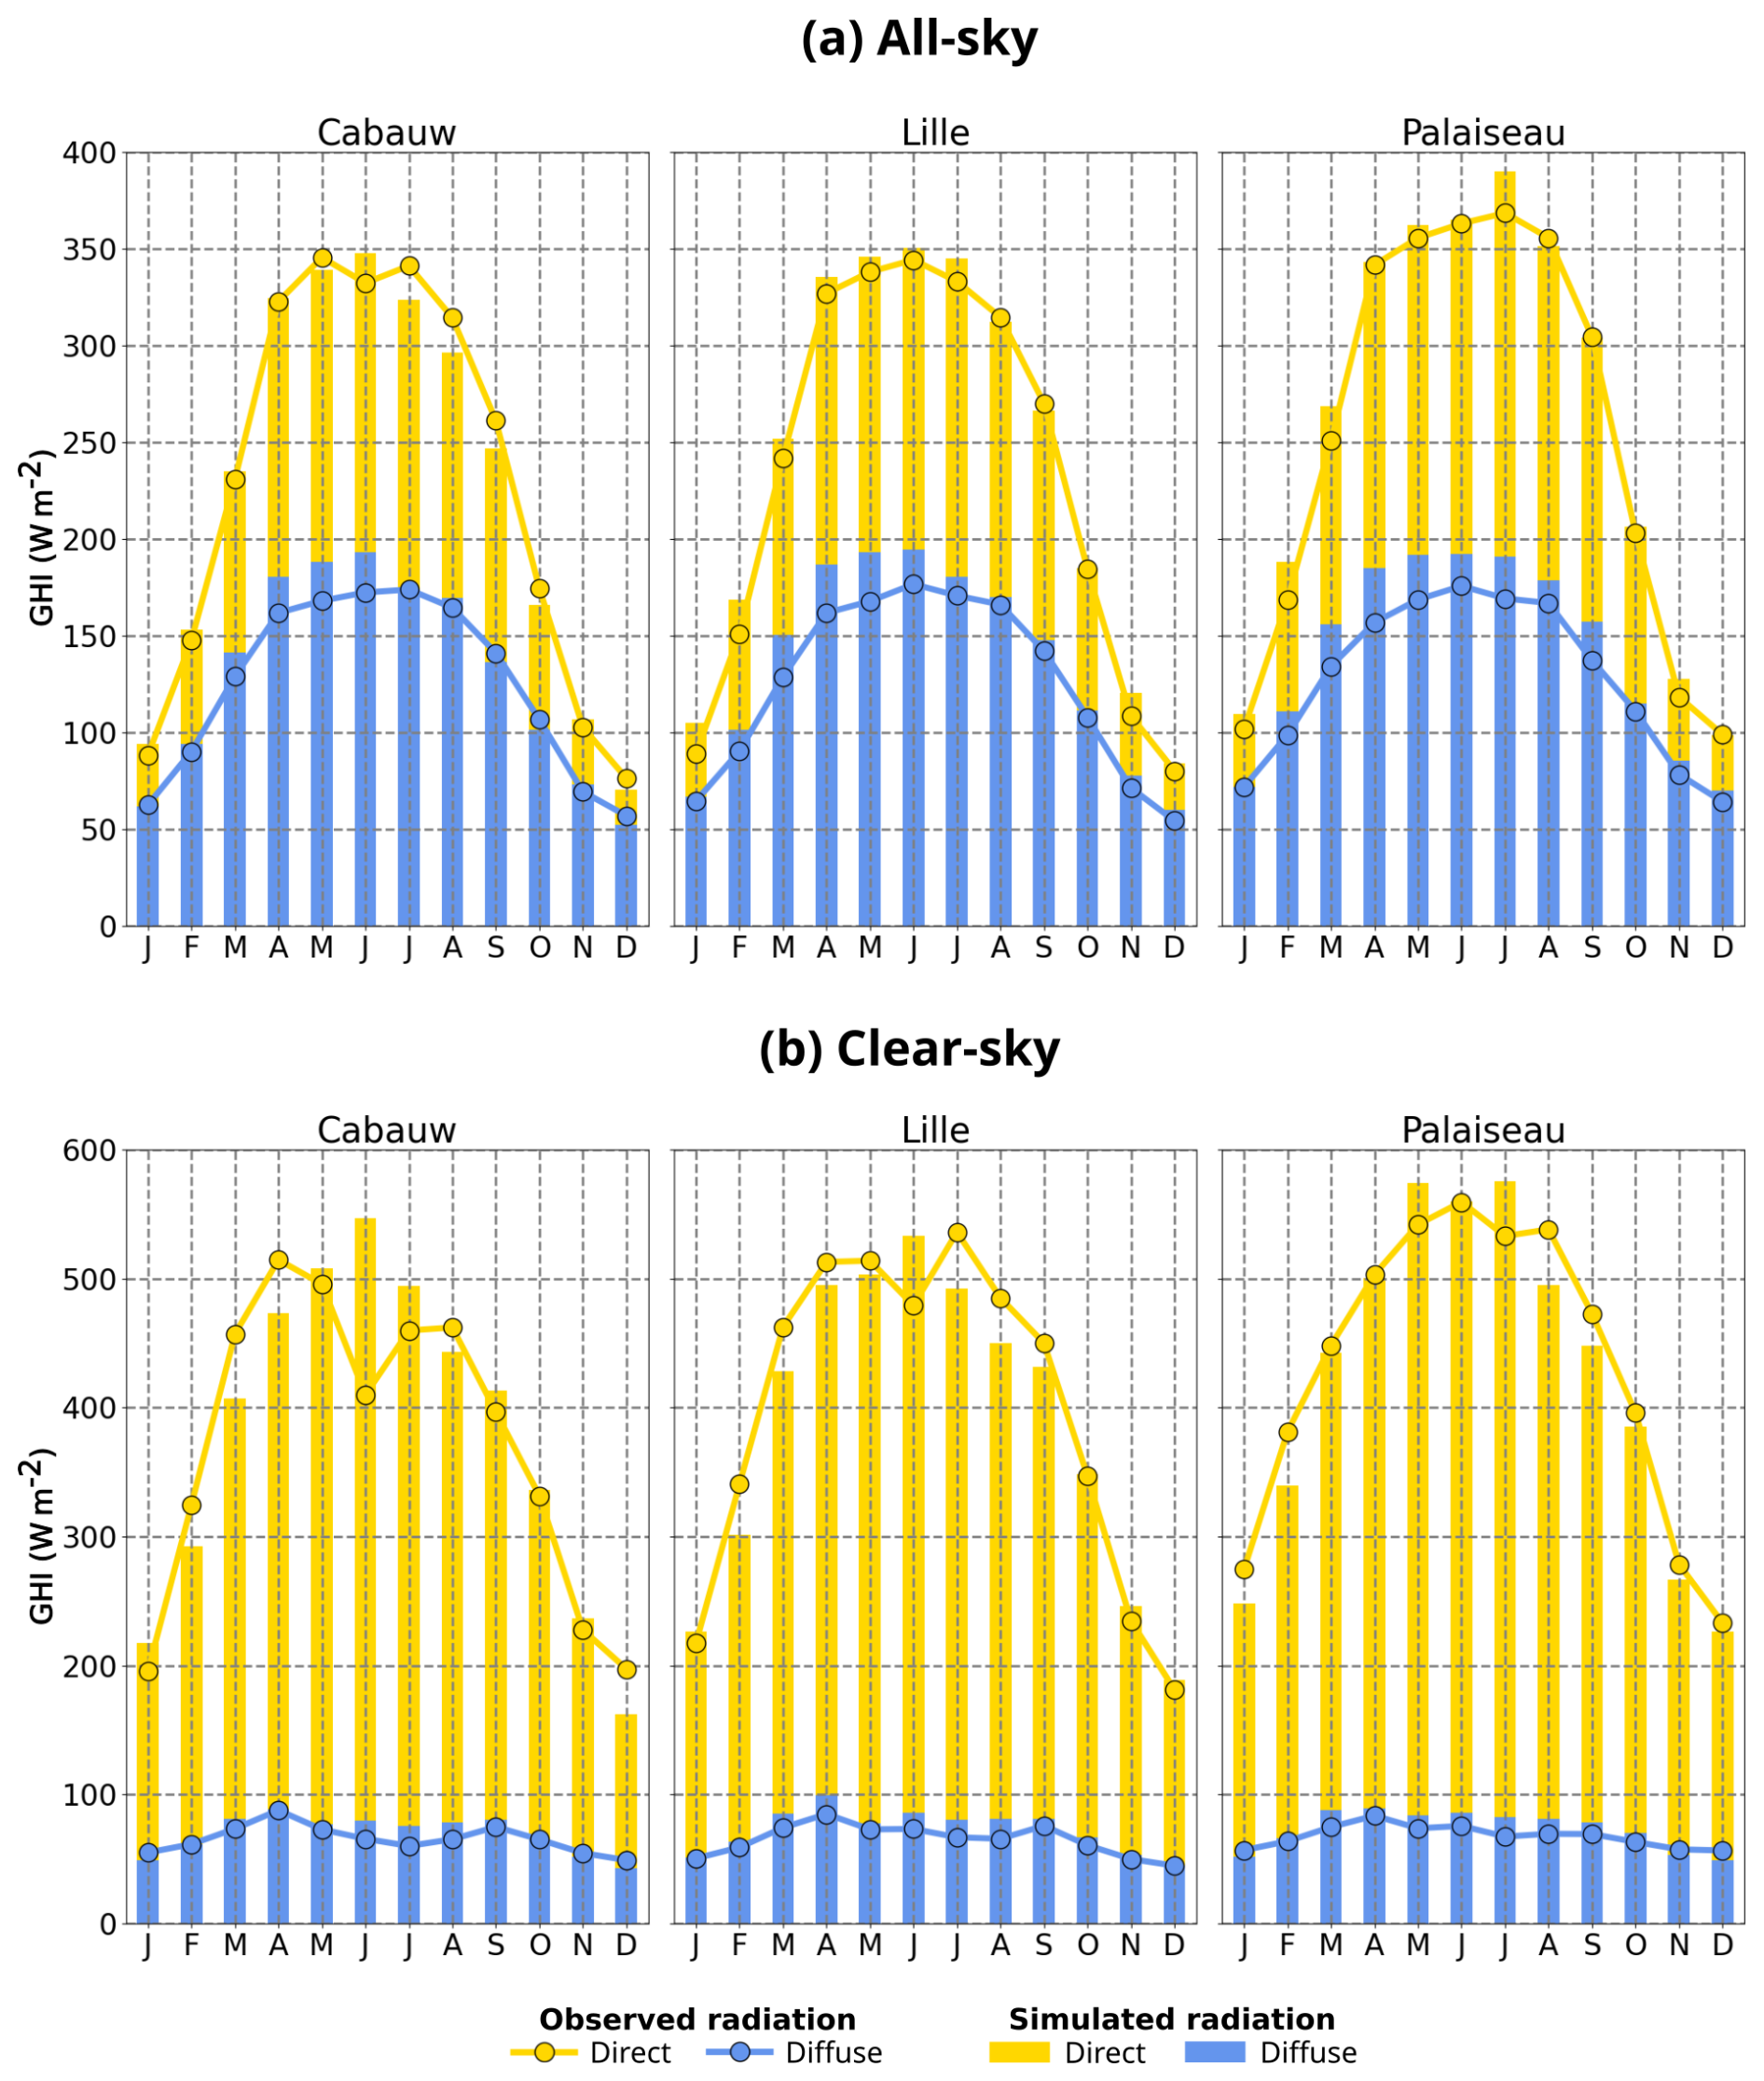
Figure 4Comparisons of the monthly means (2010–2020) of measured (lines) and simulated (columns) daytime average (a) all-sky and (b) clear-sky irradiances in hindcast mode for the three irradiance measurement stations of the BNF region. The total height of each column or line represents the monthly average global irradiance, which is the sum of the direct (in yellow) and diffuse (in blue) components.
The seasonal cycle is characterized by maximum values of all-sky SSR in summer (around 350 W m−2) and a minimum in winter (about 100 W m−2) for all sites, in line with the seasonality of the solar geometry in the region and additional influence of the clear-sky frequency. Thus, the winter (December–January) minimum of all-sky SSR overlaps with the minimum occurrence of clear-sky conditions, as shown in Fig. 3. These influences of the solar geometry and cloud cover also result in high and significantly variable proportions of diffuse irradiance, with average values of the diffuse ratio () being around 68 % in winter and 52 % in spring and summer for all sites. This seasonal variability in all-sky SSR and the direct/diffuse partition is well simulated by ALADIN, with maximum surface solar radiation values around June–August and a minimum around December, as well as an average contribution of diffuse radiation of around 57 %, compared to 53 % according to measurements. The model slightly overestimates the diffuse component of SSR (and underestimates the direct one), especially between March and June in Lille and Cabauw and March and September in Palaiseau, with differences reaching 20 to 30 W m−2 in March–April. These discrepancies may be related to various factors. One possible explanation could be linked to the circumsolar region, an area around the Sun, which is measured by instruments as direct radiation but simulated as diffuse flux and can lead to differences of up to 3 % (Gueymard, 2001, 2010; Blanc et al., 2014). The differences may also be related to the simulations of aerosol and cloud optical depths, as well as cloud fraction. The evaluation of aerosol optical depth simulations is presented in the next section; however, the absence of a similar behavior under clear-sky conditions (Fig. 4b) suggests a minor influence of aerosols and that differences in all-sky SSR are mainly linked to cloud properties, which unfortunately cannot be evaluated using current available ground-based measurements. It is worth mentioning that the δ-Eddington approximation is used to simplify the modeling of the phase function of clouds in ALADIN simulations and to reduce the computational burden. Although this approximation does not impact the simulation of the global SSR, it leads to an overestimation of the direct component and underestimation of the diffuse irradiance, which may compensate for the influence of the other parameters.
Figure 4b shows that the model also seems to accurately reproduce the monthly variability of the global, direct, and diffuse SSR under clear-sky conditions, with a maximum around May–June of about 500–550 W m−2 for all sites. However, comparisons in Lille and Cabauw (left and middle panels) show that ALADIN simulations tend to underestimate the direct component in spring by around −20 to −40 W m−2. The parallel analysis of AOD simulations (described in the next section), water vapor content (Fig. S1 in the Supplement), and solar zenith angle (Fig. S2) suggests opposite influences of the different parameters. Indeed, in spring, the model tends to overestimate the total aerosol optical depth, resulting in an underestimation of the direct component and an overestimation of diffuse radiation. The parallel overall overestimation of the water vapor content (Fig. S1) amplifies the influence of aerosols on the direct component, while, conversely, mitigating the overestimation of diffuse radiation. Moreover, discrepancies in the occurrence of clear-sky conditions, which vary throughout the day or month, lead to overall higher solar zenith angle values for clear-sky situations identified from ALADIN simulations between February and April (Fig. S2). This tends to attenuate the overestimation of diffuse radiation due to aerosols, while it further accentuates the underestimation of the direct component. The combined effects of clear-sky occurrences, aerosols, and water vapor thus result in a significant underestimation of direct radiation, while, conversely, their effects on the diffuse component tend to balance out, leading to a good estimation of diffuse radiation. It should be noted that, conversely, in summer, ALADIN clear-sky SSR simulations appear to overestimate all three irradiance components in Cabauw, Lille and Palaiseau. In this case, there is a strong influence of the occurrences of clear-sky situations, which lead to lower SZA values for clear-sky conditions identified from the simulations (Fig. S2), with a maximum difference in clear-sky SZA of −9° in June in Cabauw and a corresponding overestimation of solar radiation of more than 100 W m−2 for this month.
3.3 Aerosol optical depth and surface concentrations
Figure 5 represents the monthly variability of aerosol optical depth at 550 nm simulated by ALADIN for the AERONET sites present within the BNF region (i.e., Brussels, Cabauw, Dunkirk, Lille, Palaiseau, Paris). The variability of coincident measurements is presented in the form of black boxes whose bounds correspond to the first and third quartiles (i.e., 25 % and 75 %). Monthly averages are also represented by black lines inside the boxes. Colored areas correspond to ALADIN AOD simulations for each of the seven aerosol types considered in the aerosol scheme of the model. The individual contributions of each type are accumulated; hence, the total height of the zones represents the monthly average AOD simulated by ALADIN. As photometric measurements are only reliable in the absence of clouds in the direction of the Sun, they may not be representative of all-sky conditions; thus the evaluation of ALADIN AOD simulations is limited to simulations coincident with measured hourly (diurnal) averages. All measurement stations show a maximum AOD in spring (March–April) and a minimum in winter, with mean values of around 0.2 and 0.1, respectively. The measured summer and autumn mean AOD values are intermediate, mostly around 0.15. This seasonal variability is consistent with that shown by previous analyses in Lille (Chesnoiu et al., 2024c), in Cabauw, and over Europe (Drugé et al., 2019). Figure 5 indicates that the monthly variability of the AOD is well reproduced in ALADIN simulations for all sites. The simulations suggest that the spring AOD maximum is mostly linked to a significant increase in ammonium nitrate aerosol concentrations, a pattern which is consistent with an increase in agricultural activity at this time of the year (Sutton et al., 2013; Roig Rodelas et al., 2019; Van Damme et al., 2022). ALADIN simulations also suggest an increased influence of primary sea salts in winter, particles characterized by low Ångström coefficient values (as reported in Fig. S3). The spring maximum of AOD appears to be often slightly overestimated within ALADIN simulations by around +0.03 to +0.05, while, conversely, the model tends to underestimate summer and winter AOD values for all sites. These results confirm those of Drugé et al. (2019), which highlighted a spring overestimation and summer underestimation of the AOD in Cabauw. As discussed in Sect. 3.2, the overestimation of the AOD in spring could partly explain the underestimation of the direct solar radiation observed under clear-sky conditions (Fig. 4b), while, conversely, the underestimation of the AOD in summer contributes to the overestimation of the direct component between June and August.
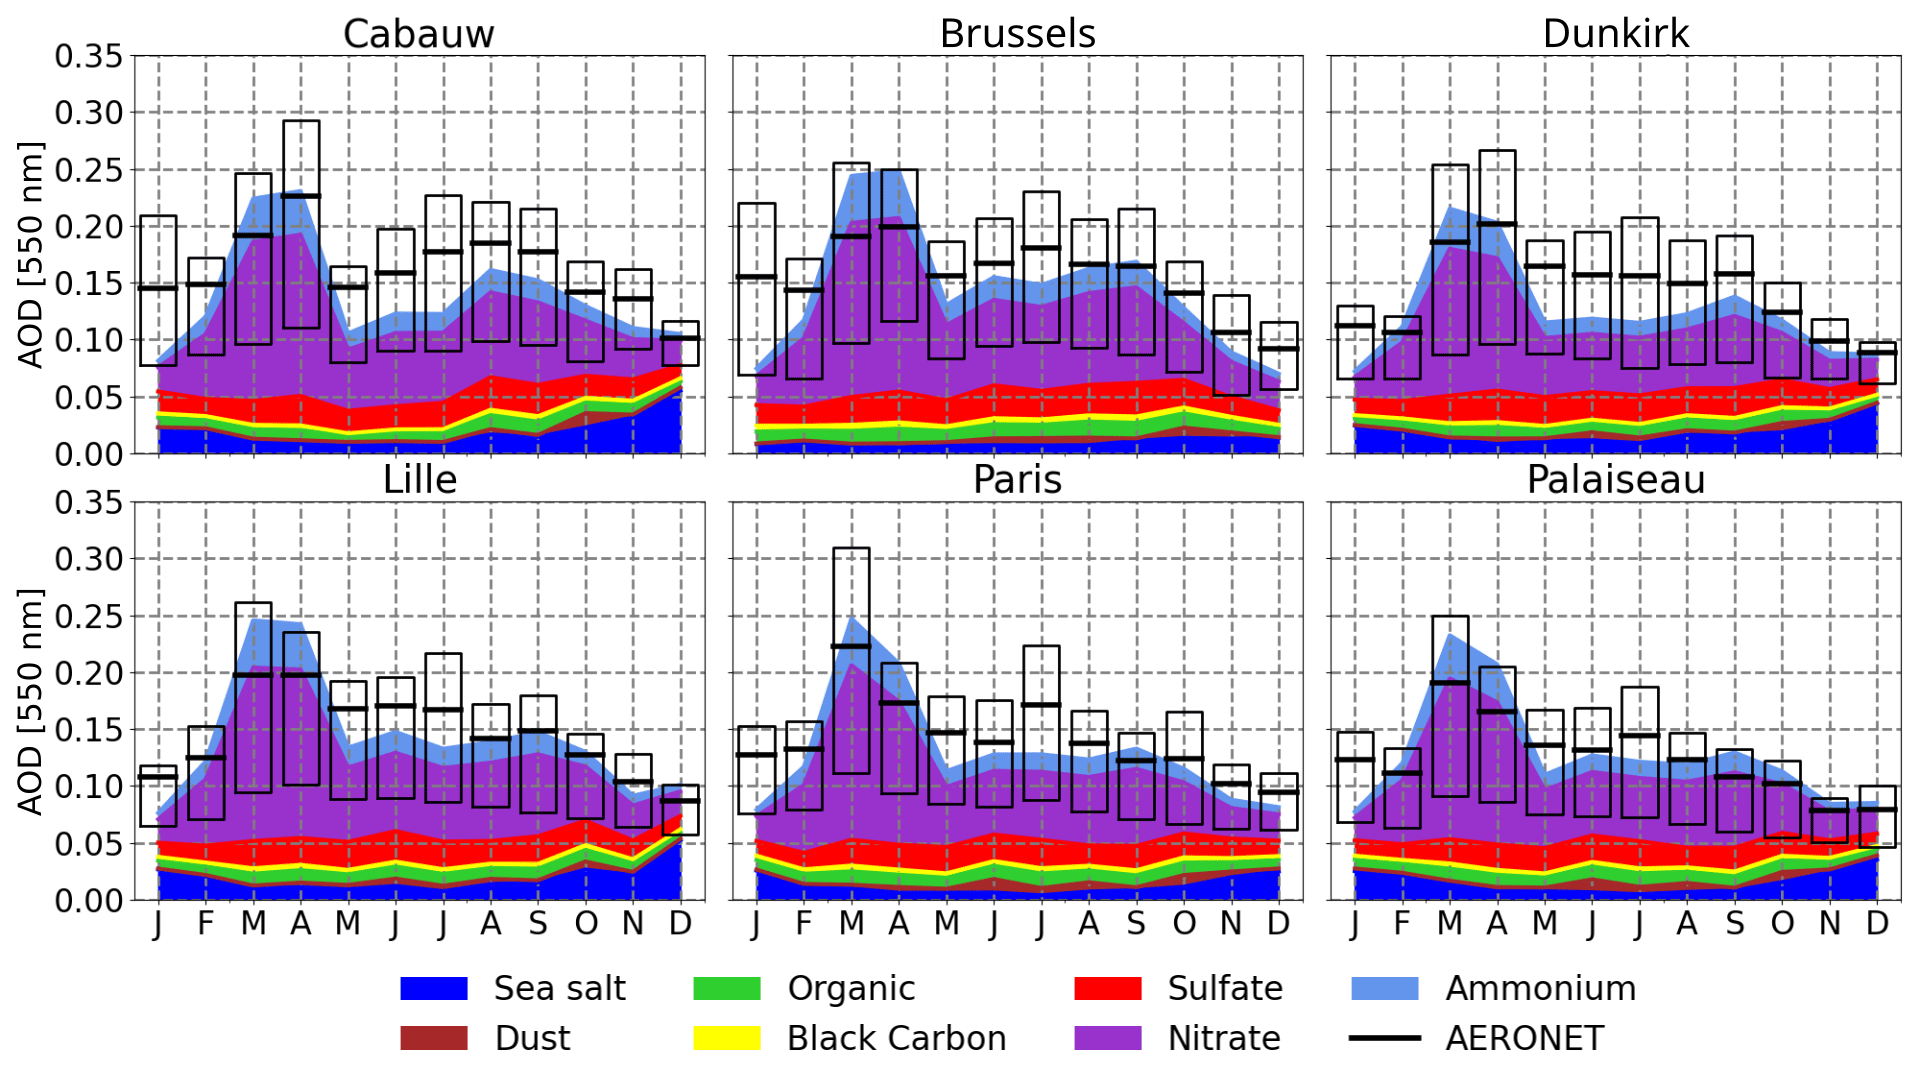
Figure 5Comparisons of the monthly means (2010–2020) of AOD at 550 nm simulated by ALADIN in hindcast mode (colored areas) with coincident photometric measurements (black boxes) for the six AERONET measurement sites located in the BNF region. The boundaries of the boxes correspond to the first and third quartiles (i.e., 25 % and 75 %), while the thick black lines inside of each box represent the associated monthly averages.
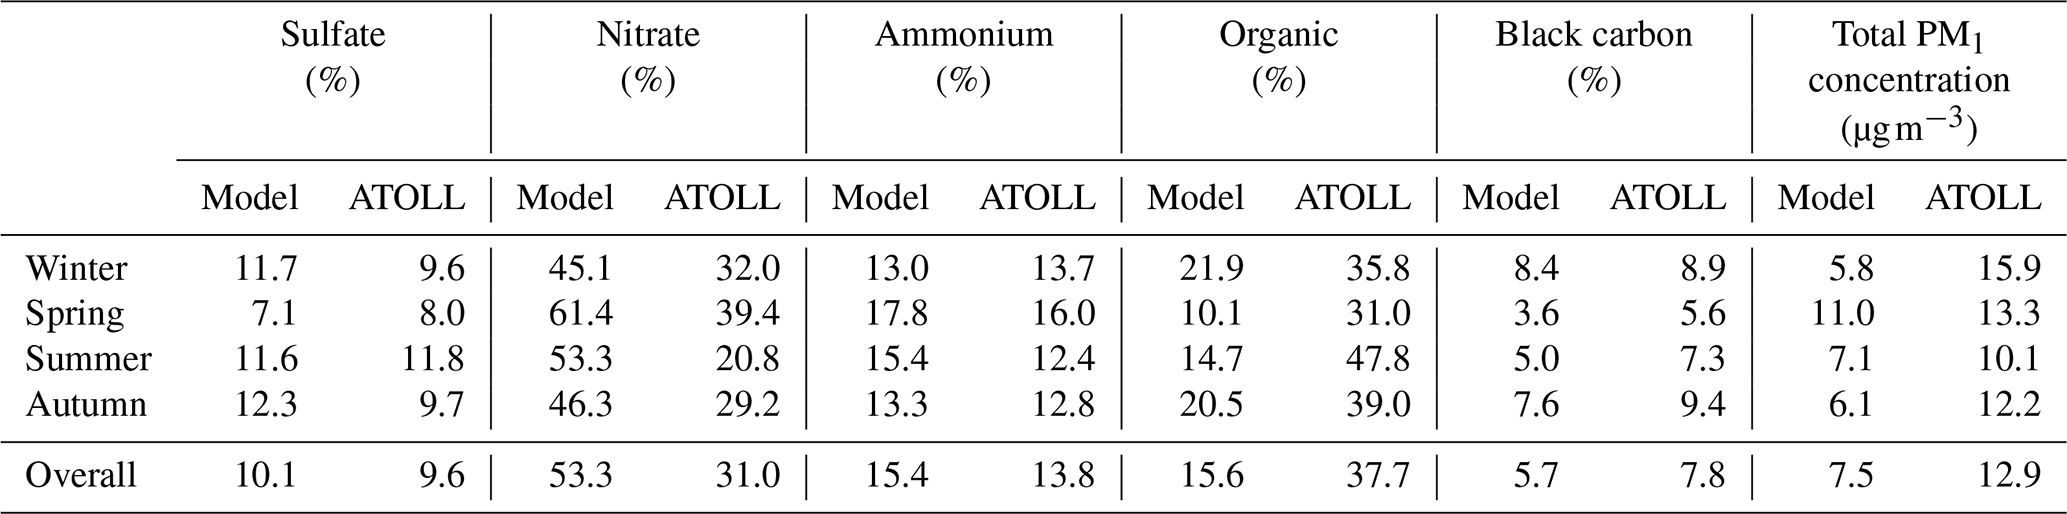
A more detailed analysis of the aerosol chemical composition was carried out through the comparison of the ALADIN simulations with measurements of surface concentrations of PM1 available in Lille over the period 2016–2020 (Velazquez-Garcia et al., 2023; Chebaicheb et al., 2023). Note that ALADIN PM1 concentrations for anthropogenic aerosols (i.e., sulfate, nitrate, ammonium, black carbon, and organic matter) are computed from the surface concentrations of the respective bins, following the methodology of Rémy et al. (2019). The results of the comparisons, shown in Fig. 6 and Tables 2 (mean seasonal contributions) and S1 in the Supplement (mean seasonal absolute surface concentrations), suggest that the mean seasonal levels of the total surface PM1 concentration (Fig. 6f) are correctly represented by the model in spring and summer, although they are significantly underestimated in winter and autumn (Tables 2 and S1). Simulations of surface concentrations of sulfate and ammonium aerosols show that ALADIN represents the variability of these species quite well in terms of both amplitude and monthly cycle (Fig. 6a and c), with average contributions of the order of 10 % and 15 %, respectively (Table 2). The overall underestimation of the simulated surface mass concentration of PM1 seems to be mostly linked to a systematic underestimation of organic aerosol concentrations throughout the year of the order of −3 to −4 µg m−3 (Fig. 6d and Table S1), i.e., a factor of approximately 2. Thus, the contribution of organic aerosols to surface concentrations represents only 16 % in ALADIN simulations, compared to 38 % in the ATOLL measurements (Table 2). Moreover, this evaluation shows that surface mass concentrations of black carbon aerosols are also underestimated by ALADIN throughout the year, with monthly differences of the order of −0.5 to −1 µg m−3 (Fig. 6e and Table S1), which could lead to an underestimation of the absorbing properties of aerosols in radiative transfer simulations. Nonetheless, as the total concentration of PM1 is underestimated, the overall contribution of black carbon aerosols simulated by ALADIN remains relatively similar to that of the measurements, with a contribution of the order of 6 % to 8 % on average (Table 2). The comparisons shown in Fig. 6b highlight that the underestimation of organic and black carbon aerosols is partially offset in spring and summer by a coincident overestimation of nitrate aerosol concentrations, despite the application of a 25 % correction factor on ammonia emissions, the main precursor of nitrate aerosols. This offset is especially significant in March and April, with differences in total concentrations of around +2 µg m−3 between the model and the measurements. As shown in Table 2, the mean annual contribution of nitrate aerosols to the total PM1 concentration is 53 % in ALADIN simulations, compared to a mean value of 31 % derived from the ground-based measurements. This suggests that the overestimation of the AOD observed in spring is mostly linked to an overly large contribution from nitrate aerosols simulated by ALADIN in this season, while, on the contrary, the underestimation of the AOD in summer and winter is likely linked to the underestimation of organic and black carbon aerosols. In their study, Drugé et al. (2019) suggest that the underestimation of the AOD in summer could be linked to the absence of anthropogenic secondary organic aerosols within ALADIN simulations. Note that the recent study of Chebaicheb et al. (2024), based on chemistry-transport simulations from CHIMERE (Menut et al., 2021), similarly highlights a systematic underestimation of organic aerosols across 13 French stations, including ATOLL. These results suggest insufficient understanding of organic aerosol sources or formation processes, especially at local scales.
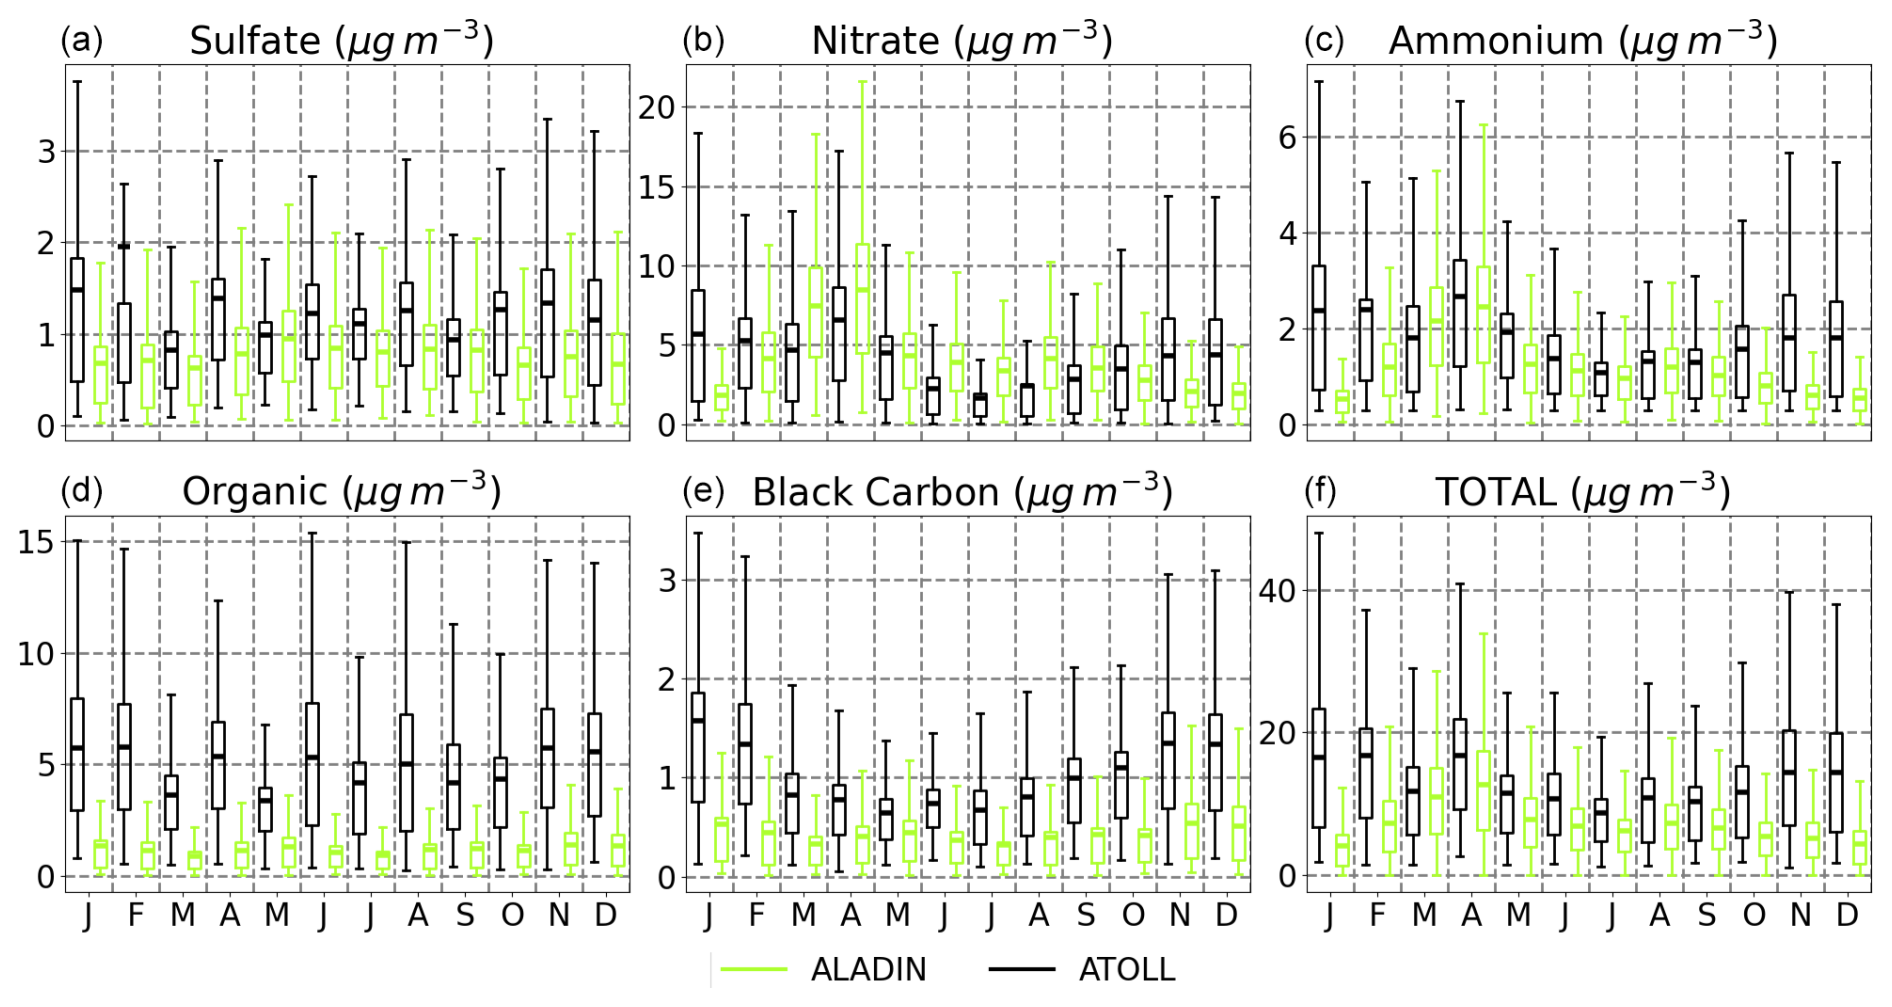
Figure 6Comparison in Lille over the period 2016–2020, under all-sky conditions, of simulated (in green) and measured (in black) monthly mean daytime surface concentrations of PM1 (in µg m−3) for five types of aerosols: (a) sulfate (SO4), (b) nitrate (NO3), (c) ammonium (NH4), (d) organic aerosols, and (e) black carbon. Panel (f) represents the total monthly PM1 concentrations. The colored line inside each box represents the monthly mean value, while the lower and upper ends of the box correspond, respectively, to the first and third quartiles (of height IQR), and the whiskers represent the maximum and minimum values obtained in the interval [median − 1.5 IQR; median + 1.5 IQR].
Table 2Mean contribution (in %), per season and on average over the period 2016–2020, of the different aerosol types to the daytime total surface concentration of PM1 simulated by ALADIN or measured by the ACSM and Aethalometer from the ATOLL platform in Lille.
3.4 Monthly time series over 2010–2020
Figure 7 compares the simulated and measured monthly time series of daytime (a) clear-sky frequency, (b) all-sky surface solar radiation, and (c) aerosol optical depth at 550 nm in Lille over the period 2010–2020. As this period is too brief to assess ALADIN's ability to represent observed trends, this section focuses on the analysis of monthly and seasonal anomalies observed during 2010–2020. Comparisons of aerosol surface concentrations are also excluded as PM1 ground measurements in Lille are only available from 2016 to 2020. For brevity, only comparisons in Lille are presented in this section. Corresponding figures for Cabauw and Palaiseau are reported in the Supplement (Figs. S4 and S5, respectively).
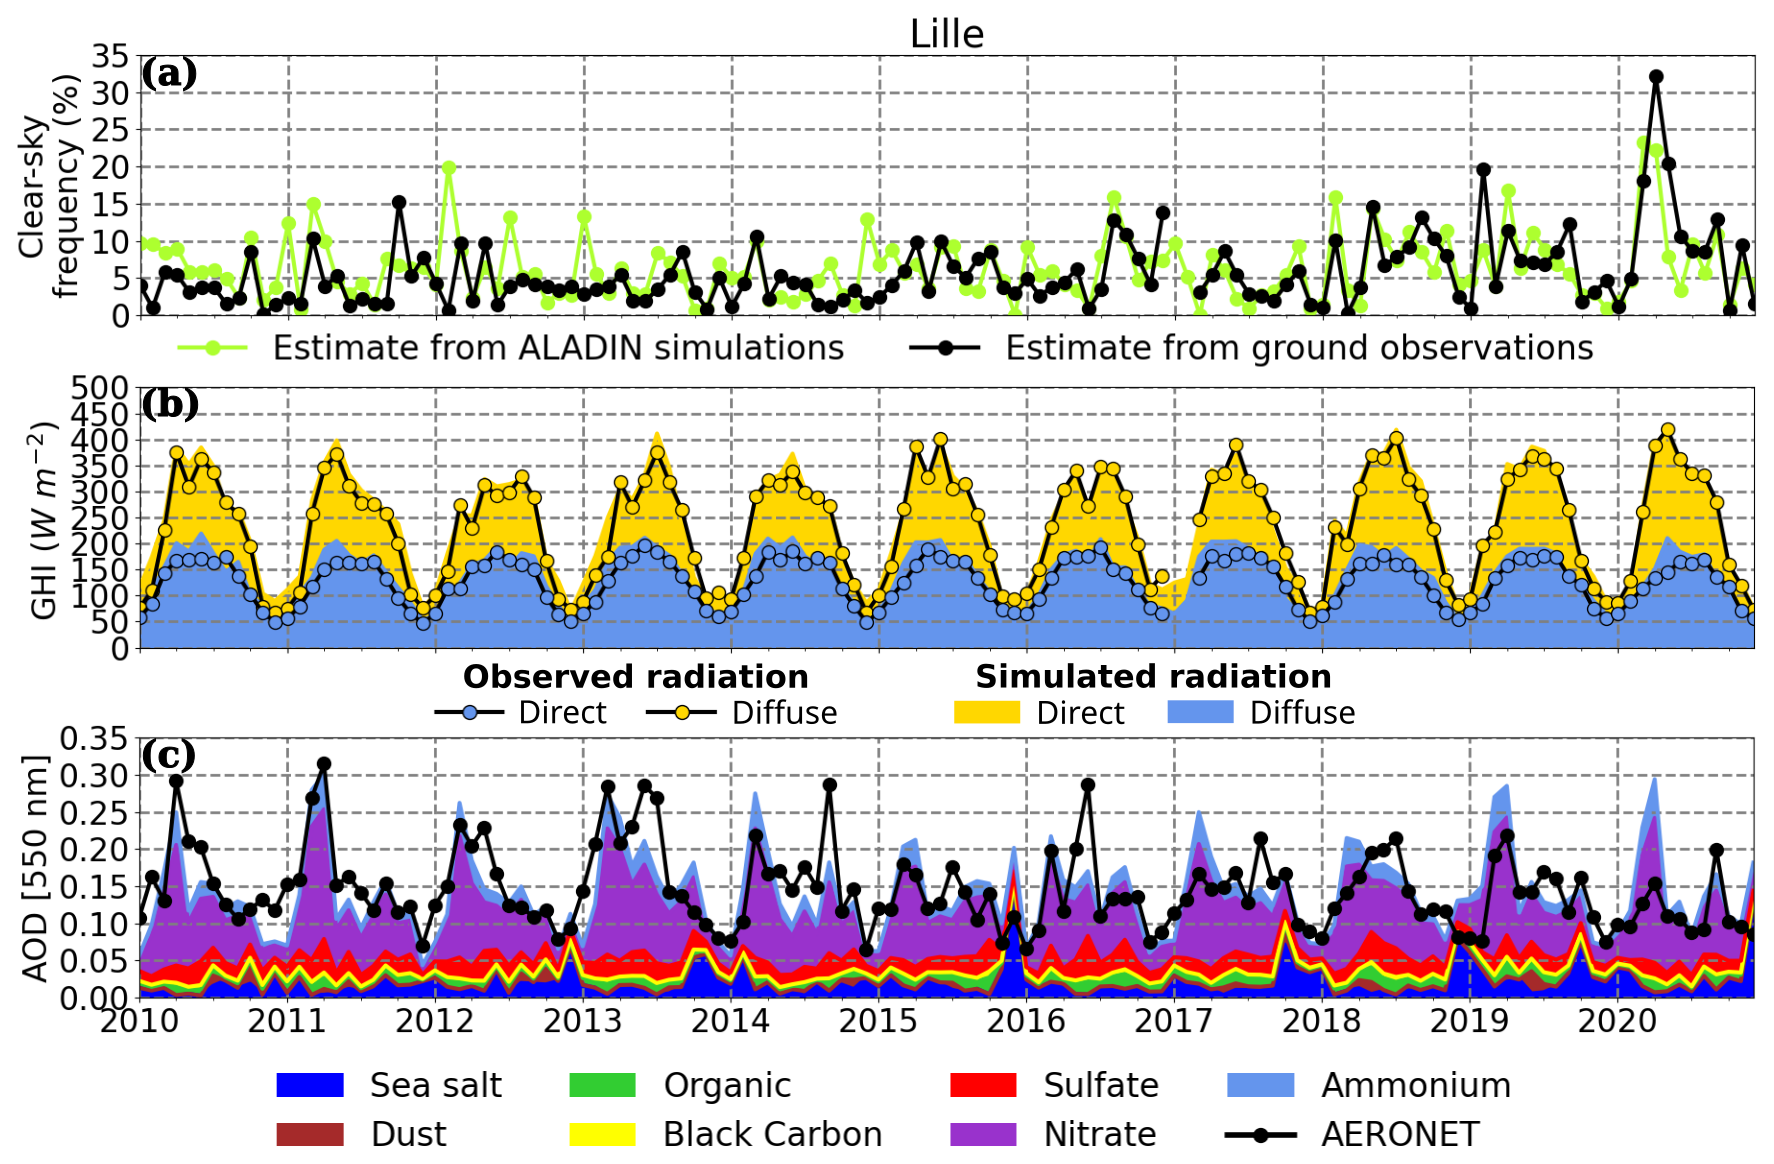
Figure 7Comparisons of the simulated and measured monthly time series of daytime-averaged (a) clear-sky frequencies, (b) all-sky irradiances, and (c) AOD at 550 nm in Lille over the period 2010–2020. In panel (a), the green lines correspond to estimates based on ALADIN hindcast simulations (CLT < 3.5 %), while the black lines represent estimates based on the cloud-screening algorithm of Long and Ackerman (2000) applied to the surface solar irradiance measurements. In panel (b), ALADIN hindcast simulations and ground-based measurements are represented as colored areas and lines, respectively. The total height of each area or line represents the monthly averaged global irradiance, which is the sum of the direct (in yellow) and diffuse (in blue) components. In panel (c), ALADIN hindcast simulations of the seven aerosol types are represented as colored areas, while AERONET photometric measurements are depicted by thick black lines. As photometric measurements are only reliable in the absence of clouds in the direction of the Sun, they may not be representative of all-sky conditions. Hence, for consistency, monthly mean values derived from ALADIN hourly AOD simulations are limited to simulations coincident with measured hourly (diurnal) averages.
Overall, despite specific seasonal biases highlighted in Sect. 3.1, 3.2, and 3.3 – such as the overestimation of clear-sky frequency in winter, the underestimation (overestimation) of direct (diffuse) all-sky SSR in March–April, and the overestimation (underestimation) of the AOD in spring (summer) – Fig. 7a–c show that ALADIN simulations correctly capture the inter-annual variability of the clear-sky frequency, SSR, and AOD. The timing of the anomalies is well represented, although the intensity of the extreme values may be slightly biased. For example, the model captures the anomaly in the extremely high frequency of clear-sky conditions recorded in spring 2020 (more than 20 % in Lille, Fig. 7a) and correspondingly high levels of surface radiation (around 400 W m−2, Fig. 7b), which have previously been documented in Lille (Chesnoiu et al., 2024c) and Cabauw (van Heerwaarden et al., 2021). Anomalies of AOD at 550 nm are also well simulated by ALADIN, especially the maximum of the spring of 2011, which is observed for the three measurement stations (Figs. 7c, S4c, and S5c). These monthly time series also suggest that ALADIN overestimations of the AOD in spring seem more frequent over recent years, especially in Lille (Fig. 7c) and Palaiseau (Fig. S5c).
4.1 Spatial variability over the period 2010–2020
In this section, we analyze the spatial variability of the SSR and associated atmospheric parameters within the BNF region over the period 2010–2020, based on ALADIN hindcast simulations for spring and summer. Figure 8a–e illustrate the spatial variability under all-sky conditions of the mean daytime (a) surface solar radiation (SSR), (b) ratio of diffuse irradiance (Rdiff), (c) cloud fraction (CLT), (d) aerosol optical depth (AOD), and (e) precipitable water (PRW) for spring (top row) and summer (bottom row).
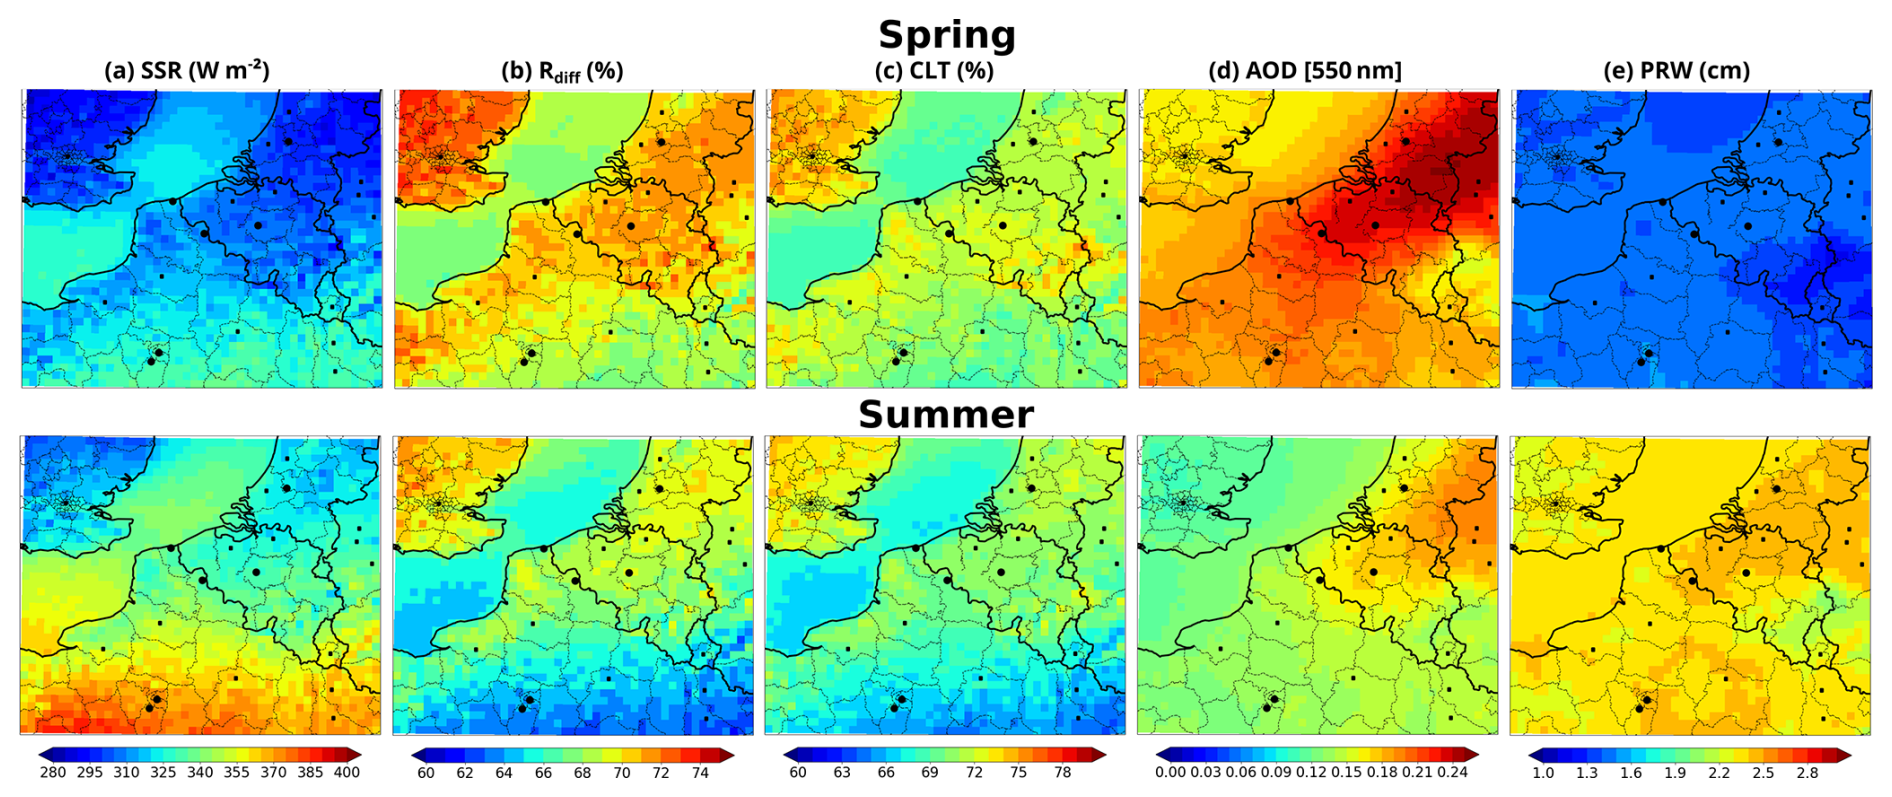
Figure 8Seasonal averages over the period 2010–2020 in spring (upper figures) and summer (lower figures) of ALADIN daytime hourly hindcast simulations under all-sky conditions of (a) the surface solar radiation, (b) the diffuse ratio , (c) the cloud fraction, (d) the AOD at 550 nm, and (e) precipitable water.
ALADIN simulations highlight a strong spatial variability of all-sky SSR over the BNF region, from around 300 up to 400 W m−2 in summer (350 W m−2 in spring). For both seasons, maximum values are simulated over the southern part of the region, primarily due to latitudinal effects on solar geometry, but also over sea surfaces that include the English Channel and North Sea. Minimum values of SSR are simulated over Benelux and the southwest of England. Note that clear-sky SSR simulated by ALADIN reported in Fig. S6b shows quite similar spatial patterns over the BNF region, with overall higher values, i.e., 450–580 W m−2 in summer and 400–520 W m−2 in spring. Diffuse fractions simulated by ALADIN over the BNF region vary in the range of 60 %–75 % in summer (65 %–75 % in spring), with maximum values generally associated with minima of SSR, as shown over the northern part and continental areas of the region, especially southwest of England and in Benelux (Fig. 8a–b). Interestingly, ALADIN simulations suggest that, despite relatively similar incident surface solar radiation levels (around 300–330 W m−2 depending on the season) and proportions of diffuse irradiance (68 %–74 %) over the southwestern England and Benelux regions, these areas are subject to somewhat different atmospheric influences. Indeed, further analysis of cloud fraction simulations (Fig. 8c) suggests that the southwest of England experiences higher levels of cloud fraction, with CLT values of around 73 %–75 % against 69 %–72 % for the Benelux region, which would imply lower SSR (higher Rdiff) values. Conversely, Fig. 8d shows that the Benelux region displays maximum AOD values, reaching 0.25 in spring (0.20 in summer), while the southwest of England exhibits minimum AOD values within the BNF region, with values consistently lower than 0.15 for both spring and summer seasons. Thus, relatively low values of all-sky SSR over Benelux may be more linked to high aerosol loads compared to those simulated over southwestern England, which seem to be reduced by the higher cloud cover. Note that the influence of the water vapor content on these radiation patterns is limited as PRW values are relatively homogeneous within the study area, with values ranging from around 1.5 cm in spring to 2.4–2.5 cm in summer (Fig. 8e). However, Fig. 8e suggests that ALADIN simulations of the water vapor content are fairly impacted by the orography and vegetation, as PRW values are lower (1.3 cm in spring and 2.1 cm in summer) over the Ardennes region (crossroad between Belgium, Germany, and Luxembourg). Interestingly, even at high latitudes, the English Channel and North Sea regions exhibit higher levels of SSR and lower proportions of diffuse irradiance than over parallel continental areas, with values close to those simulated over the southern parts of the BNF region (Fig. 8a and b). Over these oceanic areas, SSR (Rdiff) values range from around 320 W m−2 (67 %) in spring to about 350 W m−2 (64 %) in summer. Figures 8c and S6a suggest that this pattern is mostly linked to the spatial variability of the cloud cover, which is minimal over the English Channel, the North Sea, and the southern part of the study area, with CLT values of about 68 % in spring and 65 % in summer. These oceanic areas also exhibit higher frequencies of clear-sky conditions, mostly in the range of 8 % to 10 % in both spring and summer, in contrast to average values lower than 8 % over most of the Benelux and southwestern England regions (Fig. S6a).
Corresponding simulations of the spatial variability of SSR and associated atmospheric parameters for winter (i.e., December–January–February) and autumn (i.e., September–October–November) seasons are reported in the Supplement (Fig. S7). For these two seasons, the spatial patterns are similar to those observed in spring and summer (Fig. 8). However, as expected, AOD ranges are significantly reduced over most of the BNF region, while simulated average CLT levels increase from 72 % in spring and summer to more than 80 % in winter and autumn. Simulated SSR is also largely reduced, with mean values below 150 W m−2 in winter and 220 W m−2 in autumn. Thus, in order to evaluate the impacts of contrasted future anthropogenic aerosol emissions on the high-end range of SSR, we focus on spring and summer seasons.
4.2 Future evolution according to two CMIP6 scenarios
Figure 9 represents the future evolution in spring for the two CMIP6 scenarios considered in this study (SSP1-1.9 and SSP3-7.0) of the daytime (a) all-sky SSR, (b) diffuse ratio (Rdiff), and (c) cloud-free SSR (SSRcf; i.e., simulations without clouds at all timestamps and not only clear-sky situations) simulated by ALADIN compared to the historical climate simulations over the period 2005–2014 (left panels). Hatched areas indicate regions characterized by statistically non-significant changes relative to Student's t tests with a significance level of 10 %. In addition, Fig. 10 illustrates the parallel evolution of the atmospheric content simulated by ALADIN, focusing on the (a) cloud fraction, (b) aerosol optical depth, and (c) precipitable water. Note that Fig. S10 also depicts the long-term (2091–2100) future evolutions of SSRcf and PRW for SSP3-7.0 during both spring and summer, utilizing specific color maps to enhance the visualization of the projected changes.
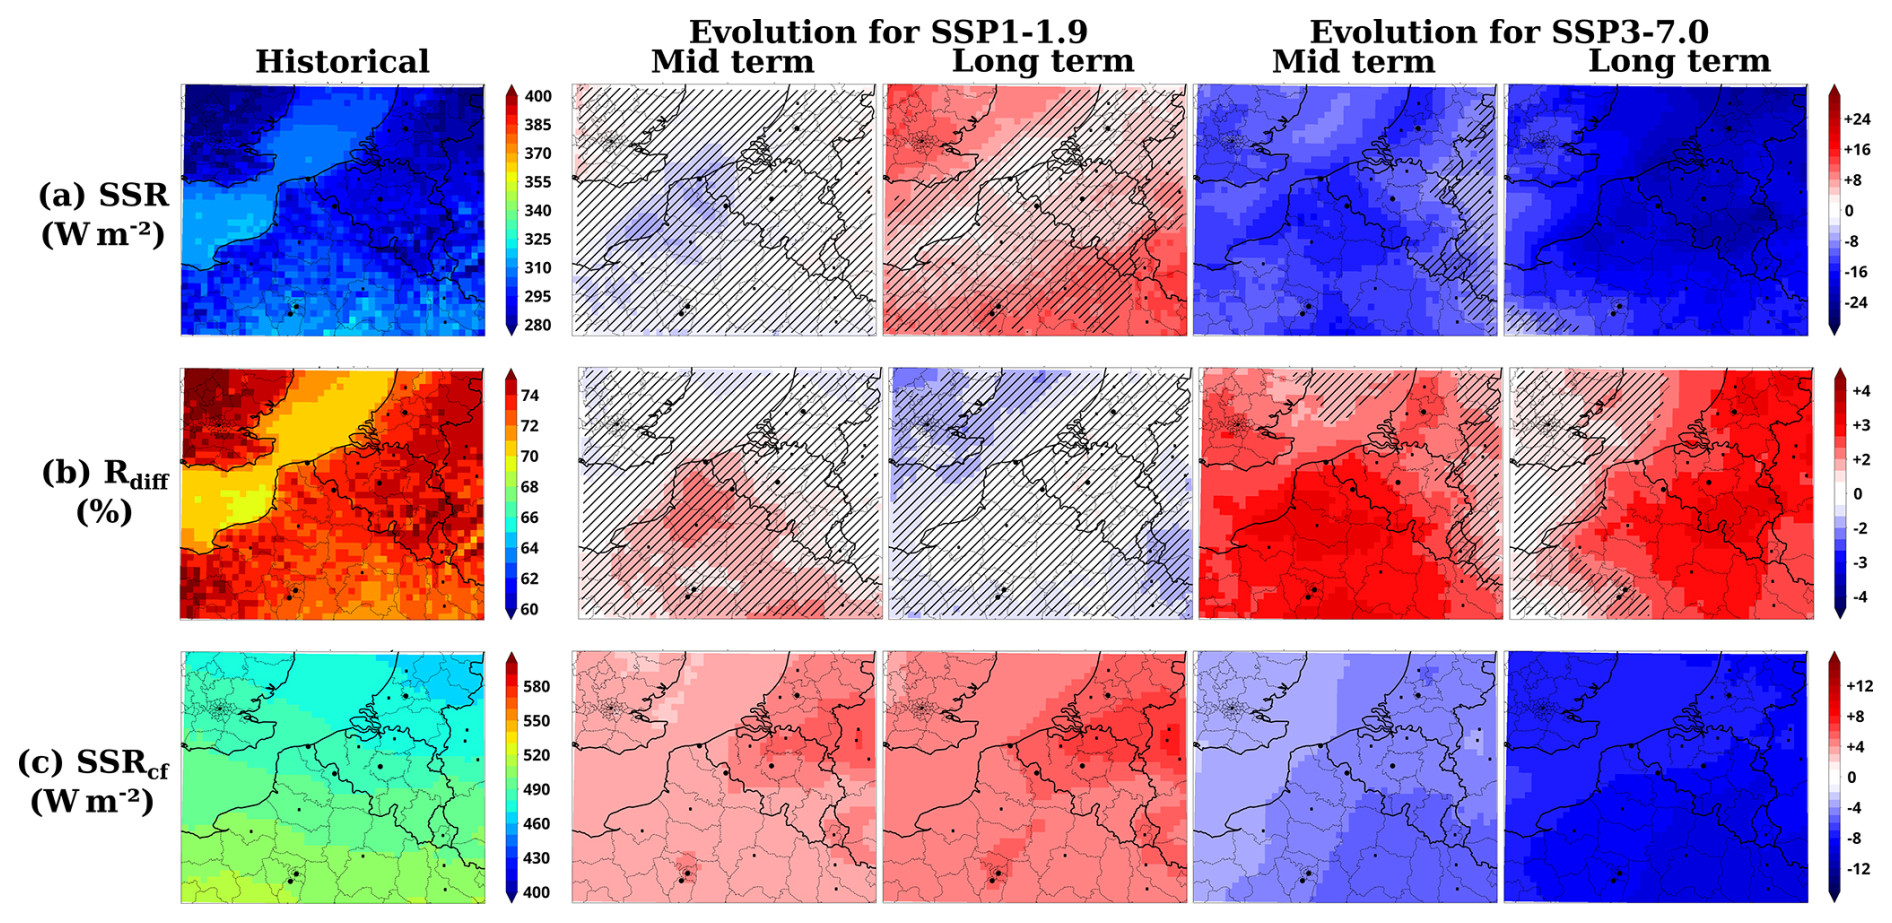
Figure 9Future evolutions in spring for CMIP6 scenarios SSP1-1.9 and SSP3-7.0 of the daytime (a) all-sky SSR, (b) all-sky diffuse ratio (Rdiff), and (c) cloud-free SSR (SSRcf) simulated by ALADIN compared to the reference climate simulations over the period 2005–2014 (left panels). The designation mid-term represents future changes projected under each scenario for the period 2045–2054, while long term refers to the period 2091–2100. Hatched areas correspond to areas characterized by non-significant changes relative to Student's t test with a significance level of 10 %.
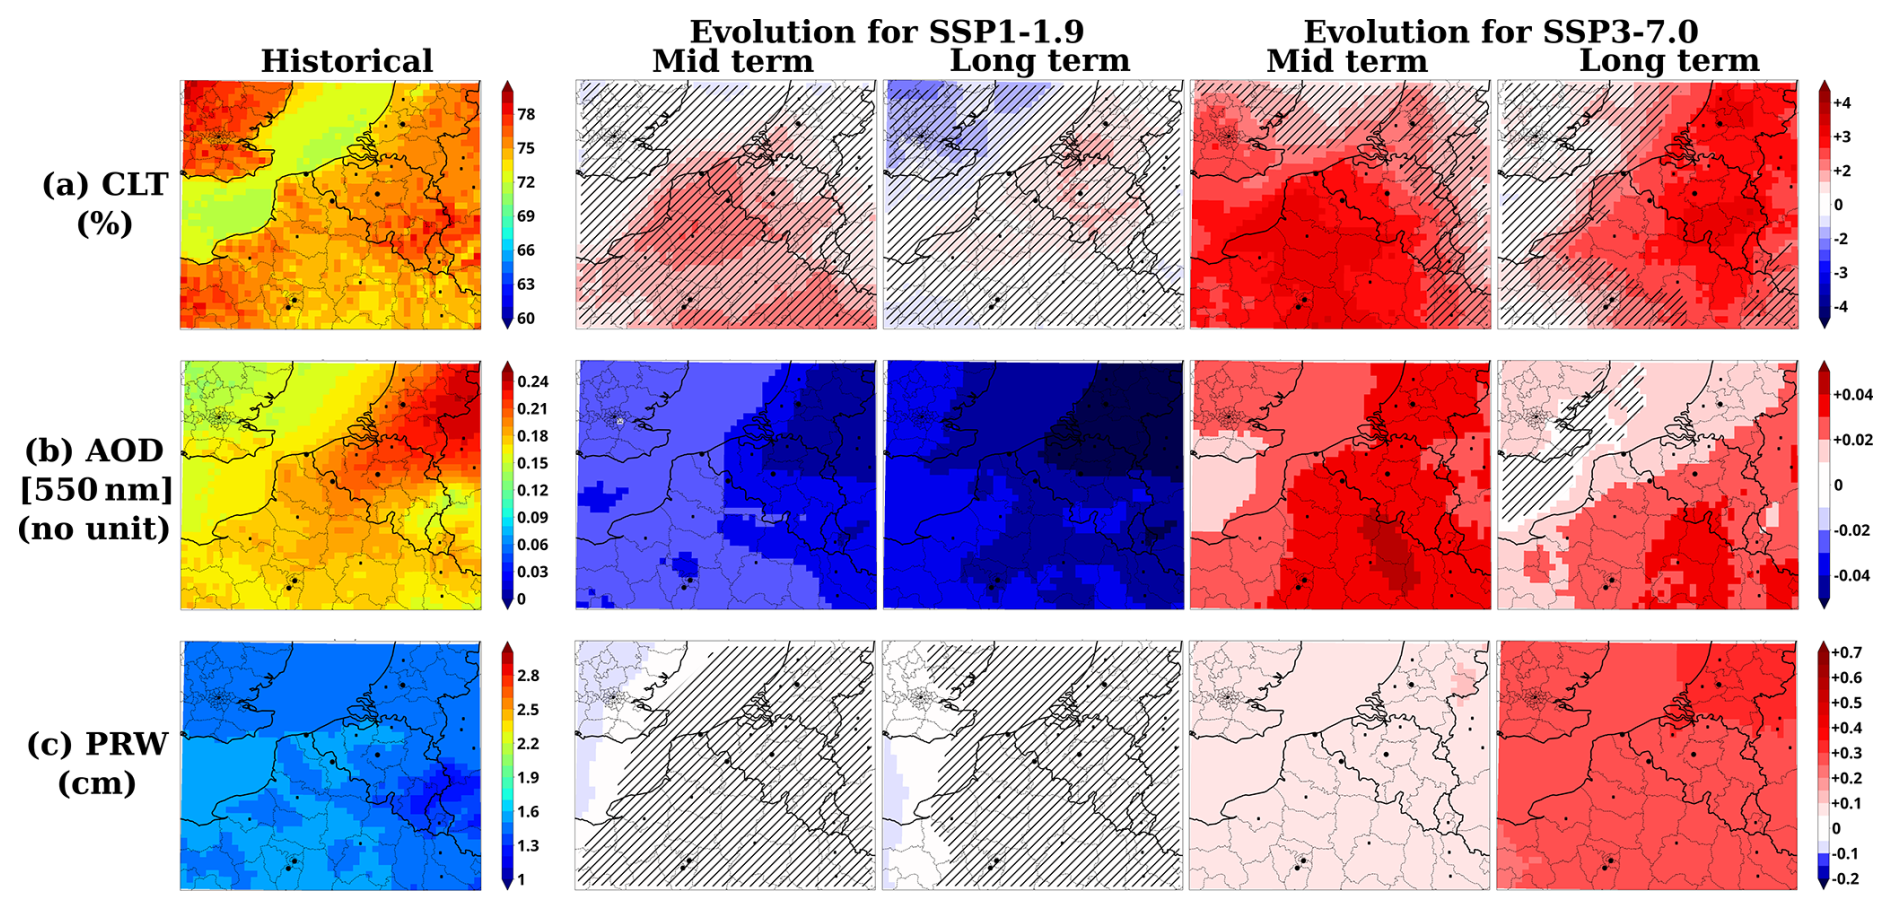
Figure 10Future evolutions in spring for CMIP6 scenarios SSP1-1.9 and SSP3-7.0 of the daytime all-sky (a) cloud fraction, (b) AOD at 550 nm, and (c) precipitable water vapor content simulated by ALADIN compared to the reference climate simulations over the period 2005–2014 (left panels). The designation mid-term represents future changes projected under each scenario for the period 2045–2054, while long term refers to the period 2091–2100. Hatched areas correspond to areas characterized by non-significant changes relative to Student's t test with a significance level of 10 %.
Considering the spring season, ALADIN simulations predict a rather weak future evolution of the all-sky SSR for the SSP1-1.9 scenario, which is only significant by the end of the century. For this scenario, ALADIN simulations project spatially limited increases of around +5 to +10 W m−2 over the southwest of England and southeastern parts of the BNF region (Fig. 9a). Conversely, for the SSP3-7.0 scenario, ALADIN predicts more pronounced and widespread decreases in all-sky SSR for this season (Fig. 9a), which are already statistically significant from the middle of the century over most of the BNF region (−10 to −15 W m−2). These large decreases in SSR reach maximum values at the end of the century, with a maximum diminution of around −25 W m−2 over the Benelux region, i.e., 8 % decrease, compared to the historical period 2005–2014 (leftmost panel of Fig. 9a). Further analysis of ALADIN simulations suggests that the projected springtime decrease in SSR for SSP3-7.0 may be linked to a significant increase in cloud fraction of about +2 % to +4 % over a large portion of the BNF region, with maximum values around the northern France and Benelux regions (Fig. 10a). Note that the increase in cloud fraction coincides with a decrease in the frequency of clear-sky situations of around −2 % to −3 % over the Hauts-de-France and Benelux regions (Fig. S8a).
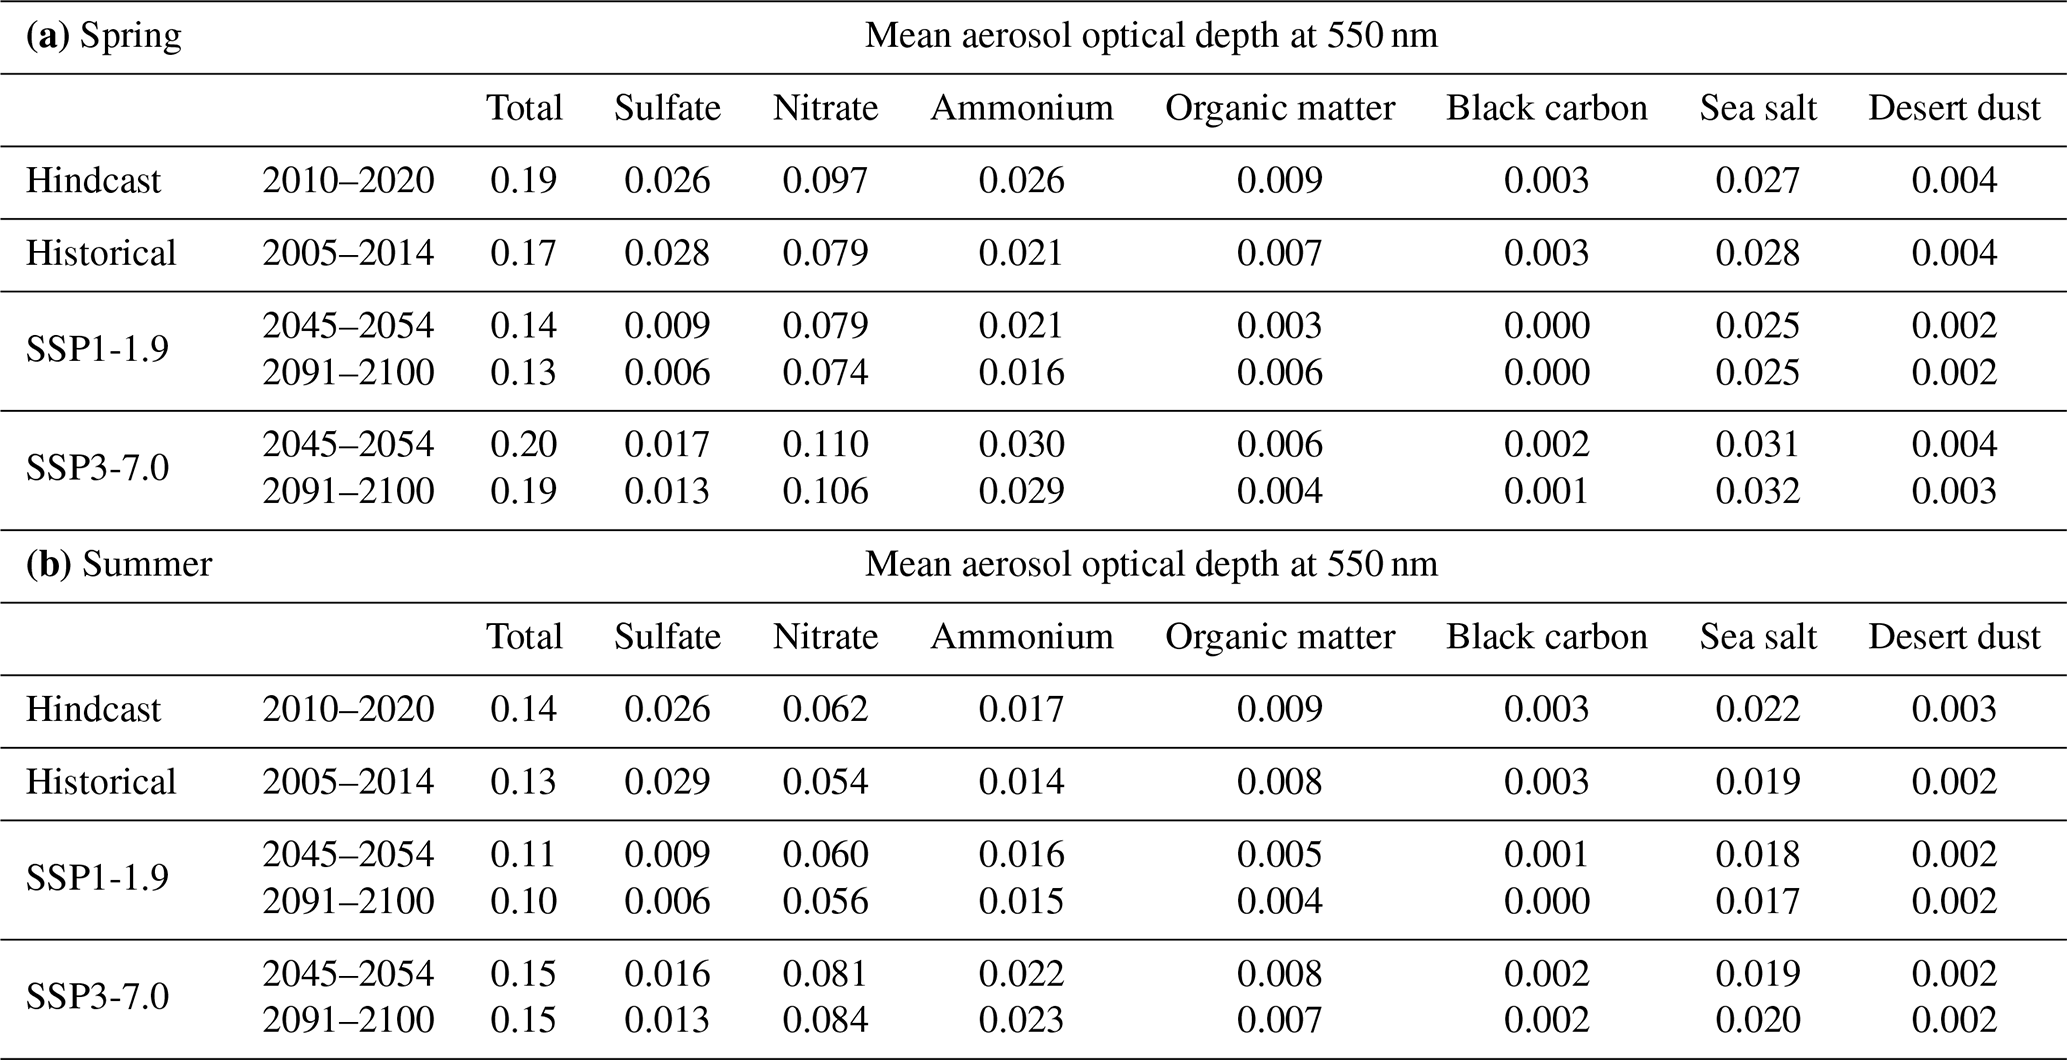
ALADIN simulations for SSP3-7.0 predict a significant increase in the AOD over the BNF region in spring, with values ranging from about +0.01 to +0.05, and maximum changes over the northern France and Benelux regions, for both 2050 and 2100 (Fig. 10b). This increase is mostly related to a rise in ammonium nitrate aerosols, which compensates for a decrease in sulfate and organic and black carbon aerosols (Table 3a). As shown in Table S2a, these evolutions cause a near-10 % increase in the contribution of nitrate aerosols to the total AOD under SSP3-7.0, rising from 46.5 % to 55 %–56 %. These results are consistent with the projected changes in aerosol and their precursor emissions in Europe for the SSP3-7.0 scenario, with a significant increase in ammonia emissions up to 2100 and a slow decrease in other species, notably SO2, BC, and OC (Fig. 2). The results of the sensitivity study of Chesnoiu et al. (2024c) reported in Table S3 allow for the quantification of the average impact of an increase in AOD on cloud-free SSR over the BNF region when multiplied by the future changes in AOD projected by ALADIN. This approach suggests that the increase of around +0.01 and +0.05 in AOD simulated by ALADIN in spring under SSP3-7.0 would induce a limited decrease in SSR (in the absence of clouds) of around −2 to −8 W m−2.
Table 3Mean overall AOD at 550 nm over the BNF region and corresponding AOD of the different aerosol types simulated by ALADIN for hindcast, HIST, SSP119, and SSP370 datasets in (a) spring and (b) summer.
ALADIN spring simulations for SSP3-7.0 also highlight a rather homogeneous increase in PRW of around +0.1 cm in 2050 and +0.3 cm in 2100 (Fig. 10c). These increases in PRW are related to coincident rises in simulated surface temperatures, especially at the end of the century (+1.5 to +2 °C, Fig. S9a). Following the approach described previously for the AOD based on the results of the sensitivity study of Chesnoiu et al. (2024c) reported in Table S3, we find that the range of future PRW evolution simulated by ALADIN would lead to an additional decrease in cloud-free SSR of about −2 to −5 W m−2.
Consistently, the overall decreases in SSRcf simulated by ALADIN for SSP3-7.0 in spring reach −3 to −7 W m−2 in 2050 and −8 to −12 W m−2 in 2100 (Fig. 9c), reflecting the combined effects of aerosols and water vapor. Interestingly, our springtime simulations for SSP3-7.0 show stronger decreases in all-sky SSR (compared to cloud-free SSR) due to the additional contribution of increasing cloud fraction over most of the BNF region (right panels of Figs. 9a and 10a). In addition, the increase in CLT and, to a lesser extent, AOD also results in a fairly significant increase in the proportion of diffuse irradiance, which can reach +2 % to +4 % over large areas covering the northern France and Benelux regions (Fig. 9a).
In contrast, ALADIN simulates, under SSP1-1.9, a pronounced and widespread decrease in springtime AOD in the range of −0.02 to −0.05, with a maximum in 2100 over the Benelux area (Fig. 10b). These decreases are consistent with the projected changes in aerosols and their precursor emissions over Europe under SSP1-1.9 (Fig. 2). Figure 10c also shows that the future evolution of PRW in spring is not significant for this scenario due to weaker changes in surface temperature for this scenario (Fig. S9a). Therefore, under SSP1-1.9, ALADIN simulates moderate increases in cloud-free SSR in spring, driven mainly by the decrease in AOD, with values ranging from +2 to +8 W m−2, reaching a maximum by the end of the century over the Benelux region (Fig. 9c). The future evolution of the cloud fraction simulated by ALADIN for SSP1-1.9 in spring is generally not significant (Fig. 10a). Hence, the future evolution of all-sky SSR is mostly not significant under SSP1-1.9 in spring, except for some specific areas, such as the southwest of England, characterized by a decrease in CLT (even if not significant) and AOD, which show a moderate increase in all-sky SSR by the end of the century (Fig. 9a).
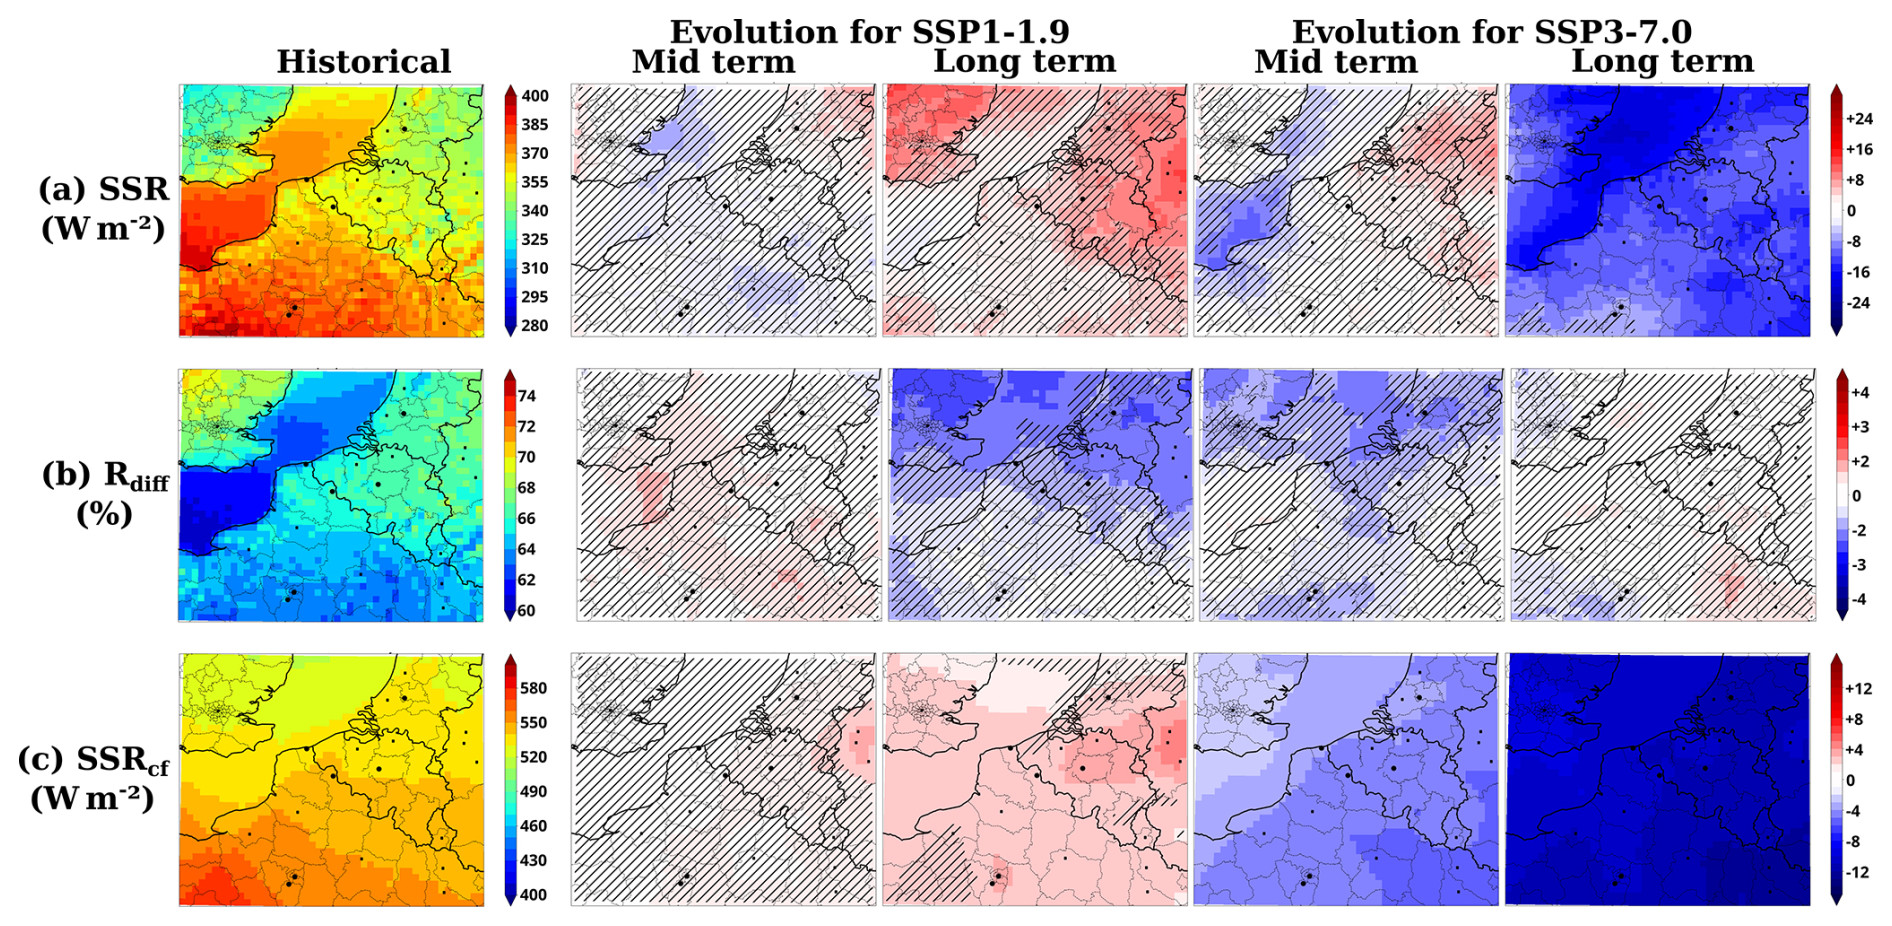
Figure 11Same as Fig. 9 but in summer.
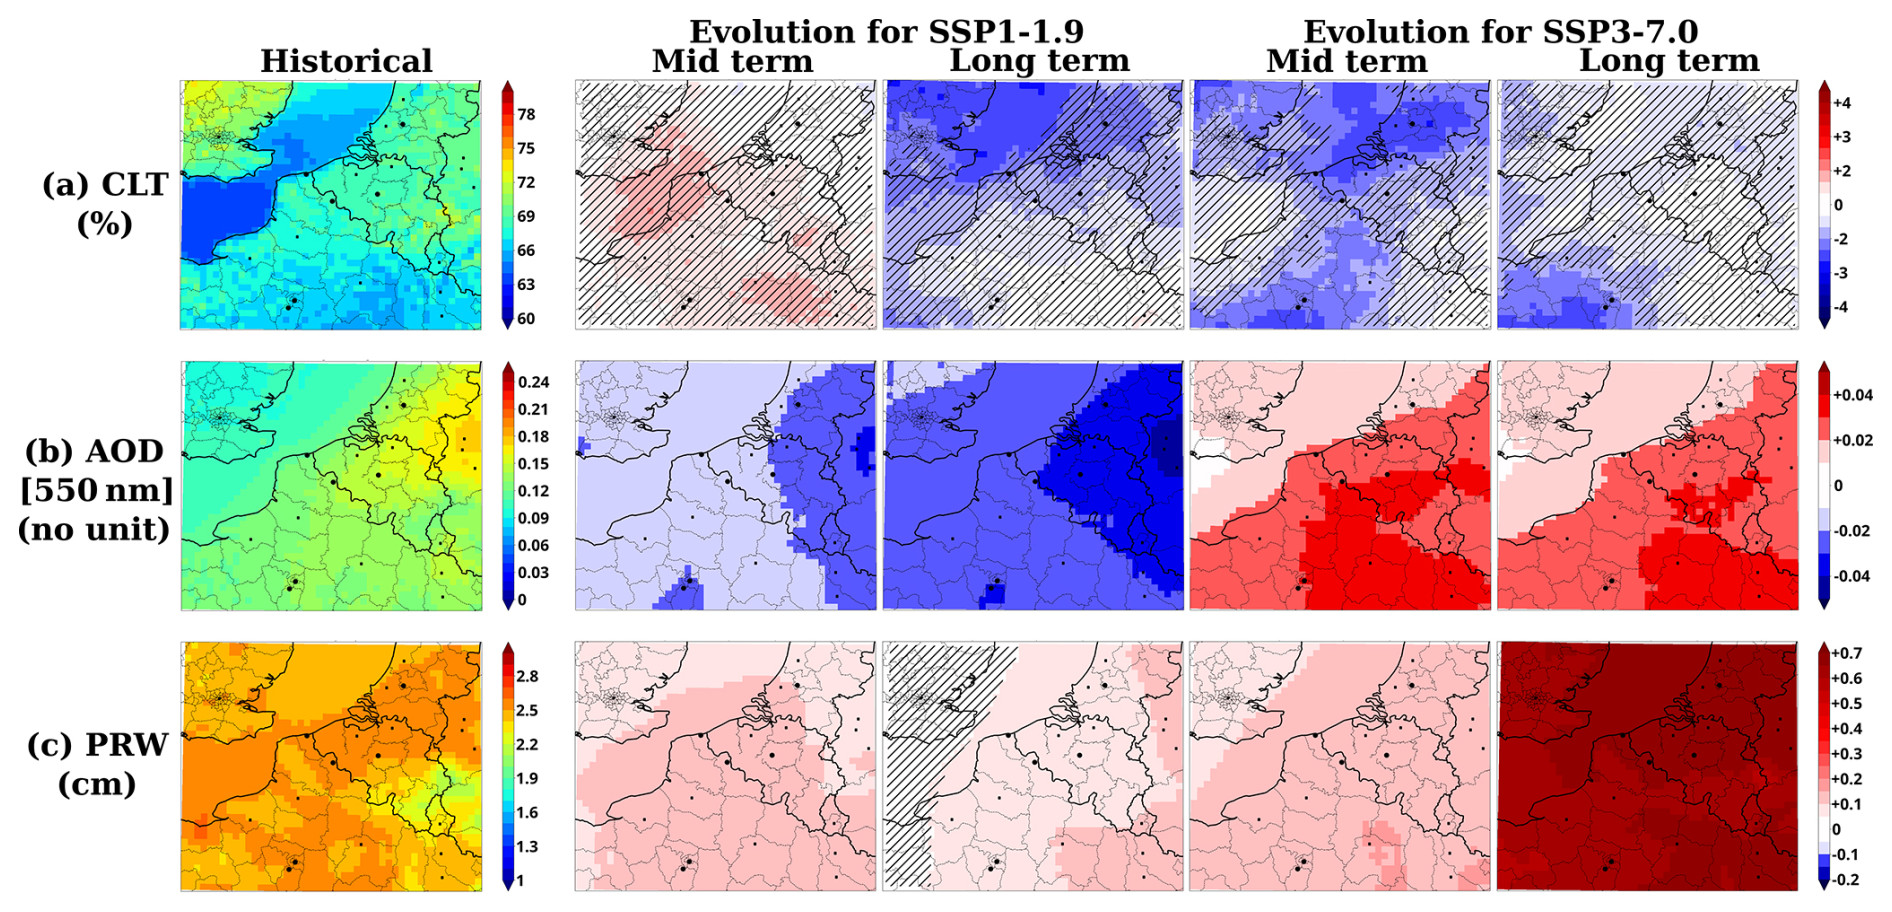
Figure 12Same as Fig. 10 but in summer.
Regarding the projections of ALADIN in summer, Figs. 11a–c and 12a–c represent the future evolution of the surface solar radiation and associated key atmospheric parameters during daytime (all-sky and cloud-free SSR, Rdiff, CLT, AOD, PRW) for the two CMIP6 scenarios considered in this study (SSP1-1.9 and SSP3-7.0). Overall, as in spring, the model projects an increase in AOD for SSP3-7.0 of around +0.01 to +0.04, with a maximum over the southeast of the region (Fig. 12b), mainly due to an increase in ammonium nitrate aerosols (Table 3b). Moreover, due to more pronounced changes in surface temperature (+2 to +3 °C, Fig. S9b), ALADIN simulates a greater increase in water vapor than in spring, reaching values of up to +0.7 cm by the end of the century over the whole BNF region (Fig. 12c). Consequently, for SSP3-7.0, the combined effects of increasing aerosols (−2 to −7 W m−2 derived from Table S3) and water vapor (−2 to −12 W m−2 from Table S3) result in an overall pronounced summertime decrease in cloud-free surface solar irradiance of around −3 to −13 W m−2, with a maximum over the southeast of the BNF region (Fig. 11c). Conversely, for the SSP1-1.9 scenario, ALADIN predicts a decrease in summertime AOD that is comparable, although slightly less intense, to that described in spring (Fig. 10b), with values ranging from −0.01 to −0.04 and a maximum centered over the eastern part of the BNF region (Fig. 12b). However, in contrast to the spring season, ALADIN simulations also project an increase of around +0.1 to +0.2 cm in summertime water vapor content (Fig. 12c). As shown in Table S3, such an increase in PRW is expected to at least partly attenuate the effect of decreasing aerosols (+2 to +7 W m−2 from Table S3) by around 2 to 3 W m−2, resulting in rather small changes in SSRcf, which are only significant in 2100 (+2 to +5 W m−2, Fig. 11c).
According to scenario SSP1-1.9 in 2100, ALADIN simulates greater and more statistically significant decreases in cloud fraction in summer (Fig. 12a) than in spring (Fig. 10a), especially over the southwest of England and the North Sea. Hence, this decrease in cloud cover combined with the reduced impact of decreasing aerosols leads to a future evolution of all-sky SSR that is fairly comparable to that described in spring. Indeed, Fig. 11a shows an increase of around +10 W m−2 for 2100, spatially limited over two areas, southwestern England and the eastern part of the BNF region, as well as a significant decrease in the proportion of diffuse SSR over the northern parts of the BNF region (−1 % to −2 %, Fig. 11b). Interestingly, according to the SSP3-7.0 scenario, ALADIN also projects a decrease in cloud fraction in summer of around −2 % to −3 % (opposite to the spring increase shown in Fig. 9a), which is mostly significant over the northern and/or southwestern parts of the BNF region (Fig. 12a). Such a decrease tends to mitigate the combined effects of increased aerosols and water vapor on all-sky SSR changes, leading to a lower decrease than in spring, especially in 2050. Some areas, like the southwestern part of the BNF region in 2100, even show relatively weak or not statistically significant decreases in summertime all-sky SSR (Fig. 11a), despite overall pronounced and expanded decreases in cloud-free SSR (Fig. 11c) that are much stronger than those predicted in spring for the same SSP3-7.0 scenario (Fig. 9c).
Overall, ALADIN simulations for SSP1-1.9 highlight spatially limited and moderate increases in the all-sky SSR for both spring and summer seasons, with significant changes only over the southwest of England and some eastern parts of the BNF region in the range from +5 to +10 W m−2. These increases appear at the end of the century, in line with decreases in AOD and cloud fraction, with the latter mainly significant in summer. These summer evolutions, although more moderate and spatially limited, are in agreement with those obtained by Hou et al. (2021) based on GCM simulations over Europe for SSP1-2.6. In particular, these authors evidenced a joint decrease in cloud cover and aerosol loads, which contributes to moderate increases in both clear-sky and all-sky SSR. In contrast, ALADIN simulations for SSP3-7.0 suggest large decreases in all-sky surface solar radiation for both spring and summer seasons with an earlier start (2050) and more pronounced changes in spring than in summer (2100). These decreases are driven by the combined effects of aerosols and water vapor increases for both seasons. They are enhanced in spring by an additional increase of +3 % to +4 % in cloud fraction over most of the BNF region, which induces maximum SSR decreases, reaching −25 W m−2 over Benelux in 2100. In contrast, in summer some northern and southern parts of the BNF region show cloud fraction decreases in 2050, which could largely counterbalance the effect of increased AOD and PRW. These results oppose the projections obtained from global climate models over Europe considering scenario SSP5-8.5 (Hou et al., 2021), which suggest a future increase in summer SSR over large parts of Europe by the end of the century.
Our analysis of current and future possible spatiotemporal evolutions of surface solar radiation together with the main associated atmospheric parameters relies on regional climate simulations at high resolution (1 h model output at 12.5 × 12.5 km) from the ALADIN model. The study is focused on the Benelux and northern France (BNF) region, a densely urbanized and industrialized part of northwestern Europe. This area is frequently under the influence of cloudy conditions and is also impacted by anthropogenic particulate pollution events, with large contributions of nitrate aerosols. We examine the variability of all-sky and clear-sky surface solar radiation (SSR), in line with that of cloudy conditions, aerosol loads, and precipitable water.
A first dataset of hindcast simulations, driven by the ERA5 reanalysis, allows for the evaluation of simulated clear-sky frequency and clear-sky and all-sky SSR, as well as aerosol loads and chemical composition, through comparison to coincident ground-based measurements available within the BNF region over the period 2010–2020. This regional evaluation shows reasonable agreement regarding the depiction of intra- and inter-annual variability for all variables investigated, despite some moderate overestimates of the aerosol optical depth (AOD) in spring due to an overestimation of nitrate aerosols, which are predominant within the study area. In spring in particular, their current mean contribution to the AOD is estimated to be around 50 %. Conversely, ALADIN tends to underestimate the AOD in summer and winter, most probably due to the absence of secondary anthropogenic organic aerosols within the TACTIC aerosol scheme. Further analysis of 2010–2020 hindcast simulations in spring and summer at the regional scale also shows a pronounced spatial variability in all-sky SSR over the BNF region. In addition to the expected north–south gradient related to the latitude (i.e., solar geometry), ALADIN simulations display higher SSR values (> 330 W m−2 in summer) over the English Channel and North Sea, together with lower cloud fractions and reduced aerosol loads. In contrast, the northernmost continental parts of the BNF region generally exhibit lower SSR values, influenced by either higher cloud cover such as over the southwest of England or elevated aerosol load such as over the Benelux region.
In addition, three datasets of regional climate simulations, driven by the global climate model CNRM-ESM2-1, allow us to assess the future evolution of SSR in spring and summer and the associated atmospheric parameters at mid-term (2045–2054) and long-term (2091–2100) horizons, compared to the recent historical period of 2005–2014, for two contrasted CMIP6 scenarios (SSP1-1.9 and SSP3-7.0). ALADIN projections for the optimistic SSP1-1.9 scenario show only some moderate increases in all-sky SSR in 2100, limited to specific areas, despite a generalized decline in European anthropogenic emissions of aerosols and precursors, which induces a decrease of up to −0.04 in AOD over the BNF region. Indeed, although this decrease in AOD leads to an overall significant increase in cloud-free SSR over most of the BNF region in 2100, the increase is somewhat attenuated and spatially limited when considering all-sky SSR. This may be explained in summer by the additional contribution of an increase in precipitable water, which partly counterbalances the AOD decrease. Nonetheless, for the SSP1-1.9 scenario, the summer decrease in the cloud fraction, mostly significant in 2100 over the northwestern parts of the BNF region, probably enhances the effects of aerosols, leading to a moderate increase in all-sky SSR over the southwest of England. For the more pessimistic SSP3-7.0 scenario, ALADIN simulations show large, significant decreases in all-sky SSR over most of the BNF region, visible from 2050 in spring and around 2100 in summer. These evolutions are associated with significant increases in both AOD, driven by ammonium and nitrate aerosols, and precipitable water in spring and summer, which contribute to a widespread decrease in cloud-free surface solar radiation over the BNF region. In spring, the effects of aerosol and water vapor increases are reinforced by a large increase in cloud fraction over most of the BNF region, leading to a maximum diminution of the all-sky SSR during this season, with values reaching up to −25 W m−2 in 2100. In contrast, ALADIN predicts a moderate decrease in the cloud fraction during the summer season over the northern and southwestern parts of the BNF region in 2050, which tends to mitigate the combined effects of aerosols and water vapor, resulting in overall smaller future changes in all-sky SSR than in spring.
Given the satisfactory performances of ALADIN simulations and the contrasted projected evolutions of surface solar radiation according to CMIP6 scenarios, the coupling of the model outputs with a solar photovoltaic power production model, as in Jerez et al. (2015) and Gutiérrez et al. (2020), represents a compelling perspective for future works. Such an approach should enable further progress in our understanding of the future potential of the BNF region in terms of solar photovoltaic energy production and its evolution according to future socioeconomic and climatic trajectories. In addition, considering that our results highlight the importance of cloud cover changes in modulating forthcoming aerosol influences on SSR, further investigations of cloud cover evolution and impacts on SSR variability would be highly recommended (Norris and Wild, 2007; Correa et al., 2024).
Model outputs and ground measurements used for the main figures are available at https://doi.org/10.5281/zenodo.10993193 (Chesnoiu et al., 2024a). Python codes used to analyze data and generate figures are available from the first author upon request. The AERONET datasets were downloaded from NASA's AERONET website (https://aeronet.gsfc.nasa.gov/new_web/draw_map_display_aod_v3.html, NASA, 2025). The irradiance measurements from the ATmospheric Observations in LiLLE (ATOLL; https://www.loa.univ-lille.fr/observations/plateformes.html?p=lille, Université de Lille, 2015) platform are available from an easy system data repository at https://doi.org/10.57932/ca9c74c0-83f4-43f1-86c8-7f3ce517b03c (Chesnoiu et al., 2024b), along with other parameters, notably including aerosol and gas column properties from AERONET. Irradiance datasets in Cabauw (Knap, 2022, https://doi.org/10.1594/PANGAEA.940531) and Palaiseau (Haeffelin, 2022, https://doi.org/10.1594/PANGAEA.946383) were downloaded from the BSRN website (https://bsrn.awi.de/, last access: 20 January 2025). Aethalometer measurements (Riffault and Brito, 2024, https://doi.org/10.48597/QHUR-8NUX) of equivalent black carbon surface concentrations, as well as in situ data of PM1 mass surface concentrations performed by the ACSM (Riffault, 2021, https://doi.org/10.48597/4VU2-MCJG), are available from the EBAS website (https://ebas-data.nilu.no, last access: 20 January 2025).
The supplement related to this article is available online at: https://doi.org/10.5194/acp-25-1307-2025-supplement.
GC: formal analysis and data handling. IC and NF: conceptualization, funding acquisition, and supervision. PN and MM: design and execution of the simulations. VR: operation and maintenance of in situ measurements in Lille. All authors provided input on data analysis. GC and IC prepared the paper with contributions from all co-authors.
The contact author has declared that none of the authors has any competing interests.
Publisher's note: Copernicus Publications remains neutral with regard to jurisdictional claims made in the text, published maps, institutional affiliations, or any other geographical representation in this paper. While Copernicus Publications makes every effort to include appropriate place names, the final responsibility lies with the authors.
The authors would like to thank all principal investigators of AERONET and BSRN and their staff for establishing and maintaining the different sites used in this study, with special thanks to the BSRN stations' scientists Wouter Knap (Cabauw, the Netherlands) and Jordi Badosa (Palaiseau, France). We also acknowledge Frederique Auriol, Diane Catalfamo, and Isabelle Jankowiak (LOA) for their contributions in maintaining surface solar irradiance measurements at ATOLL. We also thank Emmanuel Tison (IMT Nord Europe) for his technical support with in situ aerosol measurements at ATOLL. We also appreciate the comments of the two anonymous reviewers, which have helped us to improve the paper.
This study is issued from the work of Gabriel Chesnoiu during his PhD thesis financed by ADEME and the regional council of Hauts-de-France. Additional funds were granted under the Les Enveloppes Fluides et l'Environnement (LEFE)/Interactions Multiples dans l'Atmosphère, la Glace, et l'Océan (IMAGO) CNRS-INSU program over the period 2021–2023. IMT Nord Europe and LOA acknowledge financial support from the Labex CaPPA project, which is funded by the French National Research Agency (ANR) through the Programme d'Investissement d'Avenir (PIA) under contract ANR-11-LABX-0005-01, and the CLIMIBIO and ECRIN projects, both financed by the regional council of Hauts-de-France and the European Regional Development Fund (ERDF). The ATOLL site is part of ACTRIS ERIC as one of the French national facilities for in situ aerosol measurements. It contributes to the CARA program of the LCSQA funded by the French Ministry of Environment.
This paper was edited by Marco Gaetani and reviewed by two anonymous referees.
Ackerman, T. P. and Toon, O. B.: Absorption of visible radiation in atmosphere containing mixtures of absorbing and nonabsorbing particles, Appl. Optics, 20, 3661–3668, https://doi.org/10.1364/AO.20.003661, 1981. a
Al Asmar, L., Musson-Genon, L., Dupont, E., Dupont, J.-C., and Sartelet, K.: Improvement of solar irradiance modelling during cloudy-sky days using measurements, Sol. Energy, 230, 1175–1188, https://doi.org/10.1016/j.solener.2021.10.084, 2021. a
Bellouin, N., Rae, J., Jones, A., Johnson, C., Haywood, J., and Boucher, O.: Aerosol forcing in the Climate Model Intercomparison Project (CMIP5) simulations by HadGEM2-ES and the role of ammonium nitrate, J. Geophys. Res.-Atmos., 116, D20206, https://doi.org/10.1029/2011JD016074, 2011. a
Blanc, P., Espinar, B., Geuder, N., Gueymard, C., Meyer, R., Pitz-Paal, R., Reinhardt, B., Renné, D., Sengupta, M., Wald, L., and Wilbert, S.: Direct normal irradiance related definitions and applications: The circumsolar issue, Sol. Energy, 110, 561–577, https://doi.org/10.1016/j.solener.2014.10.001, 2014. a
Boers, R., Brandsma, T., and Siebesma, A. P.: Impact of aerosols and clouds on decadal trends in all-sky solar radiation over the Netherlands (1966–2015), Atmos. Chem. Phys., 17, 8081–8100, https://doi.org/10.5194/acp-17-8081-2017, 2017. a
Boé, J., Somot, S., Corre, L., and Nabat, P.: Large discrepancies in summer climate change over Europe as projected by global and regional climate models: causes and consequences, Clim. Dynam., 54, 2981–3002, https://doi.org/10.1007/s00382-020-05153-1, 2020. a
Chebaicheb, H., F. de Brito, J., Chen, G., Tison, E., Marchand, C., Prévôt, A. S., Favez, O., and Riffault, V.: Investigation of four-year chemical composition and organic aerosol sources of submicron particles at the ATOLL site in northern France, Environ. Pollut., 330, 121805, https://doi.org/10.1016/j.envpol.2023.121805, 2023. a, b, c, d
Chebaicheb, H., de Brito, J. F., Amodeo, T., Couvidat, F., Petit, J.-E., Tison, E., Abbou, G., Baudic, A., Chatain, M., Chazeau, B., Marchand, N., Falhun, R., Francony, F., Ratier, C., Grenier, D., Vidaud, R., Zhang, S., Gille, G., Meunier, L., Marchand, C., Riffault, V., and Favez, O.: Multiyear high-temporal-resolution measurements of submicron aerosols at 13 French urban sites: data processing and chemical composition, Earth Syst. Sci. Data, 16, 5089–5109, https://doi.org/10.5194/essd-16-5089-2024, 2024. a
Chesnoiu, G., Chiapello, I., Ferlay, N., Nabat, P., Mallet, M., and Riffault, V.: Datasets related to the study “Spatial variability and future evolution of surface solar radiation over Northern France and Benelux: a regional climate model approach”, Zenodo [data set], https://doi.org/10.5281/zenodo.10993193, 2024a. a
Chesnoiu, G., Ferlay, N., and Chiapello, I.: Ground measurements of surface solar irradiance, aerosol optical properties and sky conditions estimates in Lille (North of France) over the period 2010–2022, EaSy Data [data set], https://doi.org/10.57932/ca9c74c0-83f4-43f1-86c8-7f3ce517b03c, 2024b. a
Chesnoiu, G., Ferlay, N., Chiapello, I., Auriol, F., Catalfamo, D., Compiègne, M., Elias, T., and Jankowiak, I.: Influence of cloudy and clear-sky partitions, aerosols, and geometry on the recent variability in surface solar irradiance components in northern France, Atmos. Chem. Phys., 24, 12375–12407, https://doi.org/10.5194/acp-24-12375-2024, 2024c. a, b, c, d, e
Colette, A., Bessagnet, B., Vautard, R., Szopa, S., Rao, S., Schucht, S., Klimont, Z., Menut, L., Clain, G., Meleux, F., Curci, G., and Rouïl, L.: European atmosphere in 2050, a regional air quality and climate perspective under CMIP5 scenarios, Atmos. Chem. Phys., 13, 7451–7471, https://doi.org/10.5194/acp-13-7451-2013, 2013. a
Coppola, E., Nogherotto, R., Ciarlo', J. M., Giorgi, F., van Meijgaard, E., Kadygrov, N., Iles, C., Corre, L., Sandstad, M., Somot, S., Nabat, P., Vautard, R., Levavasseur, G., Schwingshackl, C., Sillmann, J., Kjellström, E., Nikulin, G., Aalbers, E., Lenderink, G., Christensen, O. B., Boberg, F., Sørland, S. L., Demory, M.-E., Bülow, K., Teichmann, C., Warrach-Sagi, K., and Wulfmeyer, V.: Assessment of the European Climate Projections as Simulated by the Large EURO-CORDEX Regional and Global Climate Model Ensemble, J. Geophys. Res.-Atmos., 126, e2019JD032356, https://doi.org/10.1029/2019JD032356, 2021. a, b
Correa, L. F., Folini, D., Chtirkova, B., and Wild, M.: From Internal Variability to Aerosol Effects: Physical Mechanisms Behind Observed Decadal Trends in Surface Solar Radiation in the Western Pacific Ocean, J. Geophys. Res.-Atmos., 129, e2024JD041014, https://doi.org/10.1029/2024JD041014, 2024. a
Crenn, V., Sciare, J., Croteau, P. L., Verlhac, S., Fröhlich, R., Belis, C. A., Aas, W., Äijälä, M., Alastuey, A., Artiñano, B., Baisnée, D., Bonnaire, N., Bressi, M., Canagaratna, M., Canonaco, F., Carbone, C., Cavalli, F., Coz, E., Cubison, M. J., Esser-Gietl, J. K., Green, D. C., Gros, V., Heikkinen, L., Herrmann, H., Lunder, C., Minguillón, M. C., Močnik, G., O'Dowd, C. D., Ovadnevaite, J., Petit, J.-E., Petralia, E., Poulain, L., Priestman, M., Riffault, V., Ripoll, A., Sarda-Estève, R., Slowik, J. G., Setyan, A., Wiedensohler, A., Baltensperger, U., Prévôt, A. S. H., Jayne, J. T., and Favez, O.: ACTRIS ACSM intercomparison – Part 1: Reproducibility of concentration and fragment results from 13 individual Quadrupole Aerosol Chemical Speciation Monitors (Q-ACSM) and consistency with co-located instruments, Atmos. Meas. Tech., 8, 5063–5087, https://doi.org/10.5194/amt-8-5063-2015, 2015. a
Dentener, F., Kinne, S., Bond, T., Boucher, O., Cofala, J., Generoso, S., Ginoux, P., Gong, S., Hoelzemann, J. J., Ito, A., Marelli, L., Penner, J. E., Putaud, J.-P., Textor, C., Schulz, M., van der Werf, G. R., and Wilson, J.: Emissions of primary aerosol and precursor gases in the years 2000 and 1750 prescribed data-sets for AeroCom, Atmos. Chem. Phys., 6, 4321–4344, https://doi.org/10.5194/acp-6-4321-2006, 2006. a
Derimian, Y., Léon, J.-F., Dubovik, O., Chiapello, I., Tanré, D., Sinyuk, A., Auriol, F., Podvin, T., Brogniez, G., and Holben, B. N.: Radiative properties of aerosol mixture observed during the dry season 2006 over M'Bour, Senegal (African Monsoon Multidisciplinary Analysis campaign), J. Geophys. Res., 113, D00C09, https://doi.org/10.1029/2008jd009904, 2008. a
Derimian, Y., Dubovik, O., Tanre, D., Goloub, P., Lapyonok, T., and Mortier, A.: Optical properties and radiative forcing of the Eyjafjallajökull volcanic ash layer observed over Lille, France, in 2010, J. Geophys. Res.-Atmos., 117, D00U25, https://doi.org/10.1029/2011JD016815, 2012. a
Dong, B., Sutton, R. T., and Wilcox, L. J.: Decadal trends in surface solar radiation and cloud cover over the North Atlantic sector during the last four decades: drivers and physical processes, Clim. Dynam., 60, 2533–2546, https://doi.org/10.1007/s00382-022-06438-3, 2022. a
Driemel, A., Augustine, J., Behrens, K., Colle, S., Cox, C., Cuevas-Agulló, E., Denn, F. M., Duprat, T., Fukuda, M., Grobe, H., Haeffelin, M., Hodges, G., Hyett, N., Ijima, O., Kallis, A., Knap, W., Kustov, V., Long, C. N., Longenecker, D., Lupi, A., Maturilli, M., Mimouni, M., Ntsangwane, L., Ogihara, H., Olano, X., Olefs, M., Omori, M., Passamani, L., Pereira, E. B., Schmithüsen, H., Schumacher, S., Sieger, R., Tamlyn, J., Vogt, R., Vuilleumier, L., Xia, X., Ohmura, A., and König-Langlo, G.: Baseline Surface Radiation Network (BSRN): structure and data description (1992–2017), Earth Syst. Sci. Data, 10, 1491–1501, https://doi.org/10.5194/essd-10-1491-2018, 2018. a
Drugé, T., Nabat, P., Mallet, M., and Somot, S.: Model simulation of ammonium and nitrate aerosols distribution in the Euro-Mediterranean region and their radiative and climatic effects over 1979–2016, Atmos. Chem. Phys., 19, 3707–3731, https://doi.org/10.5194/acp-19-3707-2019, 2019. a, b, c, d, e, f, g, h, i, j, k, l
Drugé, T., Nabat, P., Mallet, M., and Somot, S.: Future evolution of aerosols and implications for climate change in the Euro-Mediterranean region using the CNRM-ALADIN63 regional climate model, Atmos. Chem. Phys., 21, 7639–7669, https://doi.org/10.5194/acp-21-7639-2021, 2021. a, b, c, d, e, f, g
ECMWF: IFS Documentation CY43R1 – Part IV: Physical Processes, no. 4 in IFS Documentation, ECMWF, https://doi.org/10.21957/sqvo5yxja, 2016. a
Elias, T., Ferlay, N., Chesnoiu, G., Chiapello, I., and Moulana, M.: Regional validation of the solar irradiance tool SolaRes in clear-sky conditions, with a focus on the aerosol module, Atmos. Meas. Tech., 17, 4041–4063, https://doi.org/10.5194/amt-17-4041-2024, 2024. a
Favez, O., Weber, S., Petit, J.-E., Alleman, L. Y., Albinet, A., Riffault, V., Chazeau, B., Amodeo, T., Salameh, D., Zhang, Y., Srivastava, D., Samaké, A., Aujay-Plouzeau, R., Papin, A., Bonnaire, N., Boullanger, C., Chatain, M., Chevrier, F., Detournay, A., Dominik-Sègue, M., Falhun, R., Garbin, C., Ghersi, V., Grignion, G., Levigoureux, G., Pontet, S., Rangognio, J., Zhang, S., Besombes, J.-L., Conil, S., Uzu, G., Savarino, J., Marchand, N., Gros, V., Marchand, C., Jaffrezo, J.-L., and Leoz-Garziandia, E.: Overview of the French Operational Network for In Situ Observation of PM Chemical Composition and Sources in Urban Environments (CARA Program), Atmosphere, 12, 207, https://doi.org/10.3390/atmos12020207, 2021. a
Fouquart, Y. and Bonnel, B.: Computations of Solar Heating of the Earth’s Atmosphere: A New Parameterization, Beitrage zur Physik der Atmosphare, 53, 35–62, 1980. a
Gidden, M. J., Riahi, K., Smith, S. J., Fujimori, S., Luderer, G., Kriegler, E., van Vuuren, D. P., van den Berg, M., Feng, L., Klein, D., Calvin, K., Doelman, J. C., Frank, S., Fricko, O., Harmsen, M., Hasegawa, T., Havlik, P., Hilaire, J., Hoesly, R., Horing, J., Popp, A., Stehfest, E., and Takahashi, K.: Global emissions pathways under different socioeconomic scenarios for use in CMIP6: a dataset of harmonized emissions trajectories through the end of the century, Geosci. Model Dev., 12, 1443–1475, https://doi.org/10.5194/gmd-12-1443-2019, 2019. a, b
Giles, D. M., Sinyuk, A., Sorokin, M. G., Schafer, J. S., Smirnov, A., Slutsker, I., Eck, T. F., Holben, B. N., Lewis, J. R., Campbell, J. R., Welton, E. J., Korkin, S. V., and Lyapustin, A. I.: Advancements in the Aerosol Robotic Network (AERONET) Version 3 database – automated near-real-time quality control algorithm with improved cloud screening for Sun photometer aerosol optical depth (AOD) measurements, Atmos. Meas. Tech., 12, 169–209, https://doi.org/10.5194/amt-12-169-2019, 2019. a
Gueymard, C.: Parametrized transmittance model for direct beam and circumsolar spectral irradiance, Sol. Energy, 71, 325–346, https://doi.org/10.1016/S0038-092X(01)00054-8, 2001. a
Gueymard, C.: Spectral Circumsolar Radiation Contribution To CPV, AIP Conf. Proc., 1277, 316–319, https://doi.org/10.1063/1.3509220, 2010. a
Gueymard, C. A. and Yang, D.: Worldwide validation of CAMS and MERRA-2 reanalysis aerosol optical depth products using 15 years of AERONET observations, Atmos. Environ., 225, 117216, https://doi.org/10.1016/j.atmosenv.2019.117216, 2020. a
Gueymard, C. A., Bright, J. M., Lingfors, D., Habte, A., and Sengupta, M.: A posteriori clear-sky identification methods in solar irradiance time series: Review and preliminary validation using sky imagers, Renew. Sust. Energ. Rev., 109, 412–427, https://doi.org/10.1016/j.rser.2019.04.027, 2019. a, b
Gutiérrez, C., Somot, S., Nabat, P., Mallet, M., Corre, L., van Meijgaard, E., Perpiñán, O., and Gaertner, M. Á.: Future evolution of surface solar radiation and photovoltaic potential in Europe: investigating the role of aerosols, Environ. Res. Lett., 15, 034035, https://doi.org/10.1088/1748-9326/ab6666, 2020. a, b
Haeffelin, M.: Basic measurements of radiation at station Palaiseau (2003-06 et seq), PANGAEA [data set], https://doi.org/10.1594/PANGAEA.946383, 2022. a, b
Hauglustaine, D. A., Balkanski, Y., and Schulz, M.: A global model simulation of present and future nitrate aerosols and their direct radiative forcing of climate, Atmos. Chem. Phys., 14, 11031–11063, https://doi.org/10.5194/acp-14-11031-2014, 2014. a
Hoesly, R. M., Smith, S. J., Feng, L., Klimont, Z., Janssens-Maenhout, G., Pitkanen, T., Seibert, J. J., Vu, L., Andres, R. J., Bolt, R. M., Bond, T. C., Dawidowski, L., Kholod, N., Kurokawa, J.-I., Li, M., Liu, L., Lu, Z., Moura, M. C. P., O'Rourke, P. R., and Zhang, Q.: Historical (1750–2014) anthropogenic emissions of reactive gases and aerosols from the Community Emissions Data System (CEDS), Geosci. Model Dev., 11, 369–408, https://doi.org/10.5194/gmd-11-369-2018, 2018. a, b, c
Holben, B. N., Tanré, D., Smirnov, A., Eck, T. F., Slutsker, I., Abuhassan, N., Newcomb, W. W., Schafer, J. S., Chatenet, B., Lavenu, F., Kaufman, Y. J., Castle, J. V., Setzer, A., Markham, B., Clark, D., Frouin, R., Halthore, R., Karneli, A., O'Neill, N. T., Pietras, C., Pinker, R. T., Voss, K., and Zibordi, G.: An emerging ground-based aerosol climatology: Aerosol optical depth from AERONET, J. Geophys. Res.-Atmos., 106, 12067–12097, https://doi.org/10.1029/2001JD900014, 2001. a, b
Hou, X., Wild, M., Folini, D., Kazadzis, S., and Wohland, J.: Climate change impacts on solar power generation and its spatial variability in Europe based on CMIP6, Earth Syst. Dynam., 12, 1099–1113, https://doi.org/10.5194/esd-12-1099-2021, 2021. a, b, c, d
Inness, A., Ades, M., Agustí-Panareda, A., Barré, J., Benedictow, A., Blechschmidt, A.-M., Dominguez, J. J., Engelen, R., Eskes, H., Flemming, J., Huijnen, V., Jones, L., Kipling, Z., Massart, S., Parrington, M., Peuch, V.-H., Razinger, M., Remy, S., Schulz, M., and Suttie, M.: The CAMS reanalysis of atmospheric composition, Atmos. Chem. Phys., 19, 3515–3556, https://doi.org/10.5194/acp-19-3515-2019, 2019. a
IPCC: The Earth's Energy Budget, Climate Feedbacks and Climate Sensitivity, Cambridge University Press, 923–1054, https://doi.org/10.1017/9781009157896.009, 2023. a
Jerez, S., Tobin, I., Vautard, R., Montávez, J. P., López-Romero, J. M., Thais, F., Bartok, B., Christensen, O. B., Colette, A., Déqué, M., Nikulin, G., Kotlarski, S., van Meijgaard, E., Teichmann, C., and Wild, M.: The impact of climate change on photovoltaic power generation in Europe, Nat. Commun., 6, 10014, https://doi.org/10.1038/ncomms10014, 2015. a, b, c
Kirn, B., Brecl, K., and Topic, M.: A new PV module performance model based on separation of diffuse and direct light, Sol. Energy, 113, 212–220, https://doi.org/10.1016/j.solener.2014.12.029, 2015. a
Knap, W.: Basic and other measurements of radiation at station Cabauw (2005-02 et seq), PANGAEA [data set], https://doi.org/10.1594/PANGAEA.940531, 2022. a, b
Lamboll, R. D., Jones, C. D., Skeie, R. B., Fiedler, S., Samset, B. H., Gillett, N. P., Rogelj, J., and Forster, P. M.: Modifying emissions scenario projections to account for the effects of COVID-19: protocol for CovidMIP, Geosci. Model Dev., 14, 3683–3695, https://doi.org/10.5194/gmd-14-3683-2021, 2021. a
Liepert, B. G.: Observed reductions of surface solar radiation at sites in the United States and worldwide from 1961 to 1990, Geophys. Res. Lett., 29, 61-1–61-4, https://doi.org/10.1029/2002GL014910, 2002. a
Lindsay, N., Libois, Q., Badosa, J., Migan-Dubois, A., and Bourdin, V.: Errors in PV power modelling due to the lack of spectral and angular details of solar irradiance inputs, Sol. Energy, 197, 266–278, https://doi.org/10.1016/j.solener.2019.12.042, 2020. a
Long, C. N. and Ackerman, T. P.: Identification of clear skies from broadband pyranometer measurements and calculation of downwelling shortwave cloud effects, J. Geophys. Res.-Atmos., 105, 15609–15626, https://doi.org/10.1029/2000JD900077, 2000. a, b, c, d, e, f, g, h, i
Masson, V., Le Moigne, P., Martin, E., Faroux, S., Alias, A., Alkama, R., Belamari, S., Barbu, A., Boone, A., Bouyssel, F., Brousseau, P., Brun, E., Calvet, J.-C., Carrer, D., Decharme, B., Delire, C., Donier, S., Essaouini, K., Gibelin, A.-L., Giordani, H., Habets, F., Jidane, M., Kerdraon, G., Kourzeneva, E., Lafaysse, M., Lafont, S., Lebeaupin Brossier, C., Lemonsu, A., Mahfouf, J.-F., Marguinaud, P., Mokhtari, M., Morin, S., Pigeon, G., Salgado, R., Seity, Y., Taillefer, F., Tanguy, G., Tulet, P., Vincendon, B., Vionnet, V., and Voldoire, A.: The SURFEXv7.2 land and ocean surface platform for coupled or offline simulation of earth surface variables and fluxes, Geosci. Model Dev., 6, 929–960, https://doi.org/10.5194/gmd-6-929-2013, 2013. a
McArthur, L.: World Climate Research Programme – Baseline Surface Radiation Network (BSRN) – Operations Manual, Version 2.1, https://epic.awi.de/id/eprint/30644/1/McArthur_2005.pdf (last access: 20 January 2025), 2005. a
Menut, L., Bessagnet, B., Briant, R., Cholakian, A., Couvidat, F., Mailler, S., Pennel, R., Siour, G., Tuccella, P., Turquety, S., and Valari, M.: The CHIMERE v2020r1 online chemistry-transport model, Geosci. Model Dev., 14, 6781–6811, https://doi.org/10.5194/gmd-14-6781-2021, 2021. a
Mercado, L. M., Bellouin, N., Sitch, S., Boucher, O., Huntingford, C., Wild, M., and Cox, P. M.: Impact of changes in diffuse radiation on the global land carbon sink, Nature, 458, 1014–1017, https://doi.org/10.1038/nature07949, 2009. a
Mlawer, E. J., Taubman, S. J., Brown, P. D., Iacono, M. J., and Clough, S. A.: Radiative transfer for inhomogeneous atmospheres: RRTM, a validated correlated-k model for the longwave, J. Geophys. Res.-Atmos., 102, 16663–16682, https://doi.org/10.1029/97JD00237, 1997. a
Morcrette, J.-J., Barker, H. W., Cole, J. N. S., Iacono, M. J., and Pincus, R.: Impact of a New Radiation Package, McRad, in the ECMWF Integrated Forecasting System, Mon. Weather Rev., 136, 4773–4798, https://doi.org/10.1175/2008MWR2363.1, 2008. a
Morcrette, J.-J., Boucher, O., Jones, L., Salmond, D., Bechtold, P., Beljaars, A., Benedetti, A., Bonet, A., Kaiser, J. W., Razinger, M., Schulz, M., Serrar, S., Simmons, A. J., Sofiev, M., Suttie, M., Tompkins, A. M., and Untch, A.: Aerosol analysis and forecast in the European Centre for Medium-Range Weather Forecasts Integrated Forecast System: Forward modeling, J. Geophys. Res.-Atmos., 114, D06206, https://doi.org/10.1029/2008JD011235, 2009. a
Nabat, P., Somot, S., Mallet, M., Chiapello, I., Morcrette, J. J., Solmon, F., Szopa, S., Dulac, F., Collins, W., Ghan, S., Horowitz, L. W., Lamarque, J. F., Lee, Y. H., Naik, V., Nagashima, T., Shindell, D., and Skeie, R.: A 4-D climatology (1979–2009) of the monthly tropospheric aerosol optical depth distribution over the Mediterranean region from a comparative evaluation and blending of remote sensing and model products, Atmos. Meas. Tech., 6, 1287–1314, https://doi.org/10.5194/amt-6-1287-2013, 2013. a
Nabat, P., Somot, S., Mallet, M., Sanchez-Lorenzo, A., and Wild, M.: Contribution of anthropogenic sulfate aerosols to the changing Euro-Mediterranean climate since 1980, Geophys. Res. Lett., 41, 5605–5611, https://doi.org/10.1002/2014GL060798, 2014. a
Nabat, P., Somot, S., Mallet, M., Michou, M., Sevault, F., Driouech, F., Meloni, D., di Sarra, A., Di Biagio, C., Formenti, P., Sicard, M., Léon, J.-F., and Bouin, M.-N.: Dust aerosol radiative effects during summer 2012 simulated with a coupled regional aerosol–atmosphere–ocean model over the Mediterranean, Atmos. Chem. Phys., 15, 3303–3326, https://doi.org/10.5194/acp-15-3303-2015, 2015. a
Nabat, P., Somot, S., Cassou, C., Mallet, M., Michou, M., Bouniol, D., Decharme, B., Drugé, T., Roehrig, R., and Saint-Martin, D.: Modulation of radiative aerosols effects by atmospheric circulation over the Euro-Mediterranean region, Atmos. Chem. Phys., 20, 8315–8349, https://doi.org/10.5194/acp-20-8315-2020, 2020. a, b, c, d, e, f
NASA: Aeronet, Aerosol Robotic Network, https://aeronet.gsfc.nasa.gov/new_web/draw_map_display_aod_v3.html (last access: 20 January 2025), 2025. a
Ng, N. L., Herndon, S. C., Trimborn, A., Canagaratna, M. R., Croteau, P. L., Onasch, T. B., Sueper, D., Worsnop, D. R., Zhang, Q., Sun, Y. L., and Jayne, J. T.: An Aerosol Chemical Speciation Monitor (ACSM) for Routine Monitoring of the Composition and Mass Concentrations of Ambient Aerosol, Aerosol Sci. Tech., 45, 780–794, https://doi.org/10.1080/02786826.2011.560211, 2011. a
Niyogi, D., Chang, H.-I., Saxena, V. K., Holt, T., Alapaty, K., Booker, F., Chen, F., Davis, K. J., Holben, B., Matsui, T., Meyers, T., Oechel, W. C., Pielke Sr., R. A., Wells, R., Wilson, K., and Xue, Y.: Direct observations of the effects of aerosol loading on net ecosystem CO2 exchanges over different landscapes, Geophys. Res. Lett., 31, L20506, https://doi.org/10.1029/2004GL020915, 2004. a
Norris, J. R. and Wild, M.: Trends in aerosol radiative effects over Europe inferred from observed cloud cover, solar “dimming”, and solar “brightening”, J. Geophys. Res.-Atmos., 112, D08214, https://doi.org/10.1029/2006JD007794, 2007. a, b
Ohmura, A., Dutton, E. G., Frohloch, B., Gilgen, C., Hegner, H., Heimo, A., König-Langlo, G., McArthur, B., Muller, G., Philipona, R., Pinker, R., Whitlock, C. H., Dehne, K., and Wild, M.: Baseline Surface Radiation Network (BSRN/WCRP): New Precision Radiometry for Climate Research, B. Am. Meteorol. Soc., 79, 2115–2136, http://www.jstor.org/stable/26214877 (last access: 20 January 2025), 1998. a
O'Rourke, P., Smith, S., Mott, A., Ahsan, H., Mcduffie, E., Crippa, M., Klimont, Z., Mcdonald, B., Wang, S., Nicholson, M., Hoesly, R., and Feng, L.: CEDS v-2021-04-21 Gridded emissions data, DataHub [data set], https://doi.org/10.25584/PNNLDATAHUB/1779095, 2021. a, b
O'Neill, B. C., Kriegler, E., Ebi, K. L., Kemp-Benedict, E., Riahi, K., Rothman, D. S., van Ruijven, B. J., van Vuuren, D. P., Birkmann, J., Kok, K., Levy, M., and Solecki, W.: The roads ahead: Narratives for shared socioeconomic pathways describing world futures in the 21st century, Global Environ. Chang., 42, 169–180, https://doi.org/10.1016/j.gloenvcha.2015.01.004, 2017. a, b, c
Pérez‐Ramírez, D., Whiteman, D., Smirnov, A., Lyamani, H., Holben, B., Pinker, R., Andrade, M., and Arboledas, L.: Evaluation of AERONET precipitable water vapor versus microwave radiometry, GPS, and radiosondes at ARM sites, J. Geophys. Res.-Atmos., 119, 9596–9613, https://doi.org/10.1002/2014JD021730, 2014. a, b
Persad, G., Samset, B. H., Wilcox, L. J., Allen, R. J., Bollasina, M. A., Booth, B. B. B., Bonfils, C., Crocker, T., Joshi, M., Lund, M. T., Marvel, K., Merikanto, J., Nordling, K., Undorf, S., van Vuuren, D. P., Westervelt, D. M., and Zhao, A.: Rapidly evolving aerosol emissions are a dangerous omission from near-term climate risk assessments, Environmental Research: Climate, 2, 032001, https://doi.org/10.1088/2752-5295/acd6af, 2023. a
Pfeifroth, U., Sanchez-Lorenzo, A., Manara, V., Trentmann, J., and Hollmann, R.: Trends and Variability of Surface Solar Radiation in Europe Based On Surface- and Satellite-Based Data Records, J. Geophys. Res.-Atmos., 123, 1735–1754, https://doi.org/10.1002/2017JD027418, 2018. a
Potier, E., Waked, A., Bourin, A., Minvielle, F., Péré, J., Perdrix, E., Michoud, V., Riffault, V., Alleman, L., and Sauvage, S.: Characterizing the regional contribution to PM10 pollution over northern France using two complementary approaches: Chemistry transport and trajectory-based receptor models, Atmos. Res., 223, 1–14, https://doi.org/10.1016/j.atmosres.2019.03.002, 2019. a
Rémy, S., Kipling, Z., Flemming, J., Boucher, O., Nabat, P., Michou, M., Bozzo, A., Ades, M., Huijnen, V., Benedetti, A., Engelen, R., Peuch, V.-H., and Morcrette, J.-J.: Description and evaluation of the tropospheric aerosol scheme in the European Centre for Medium-Range Weather Forecasts (ECMWF) Integrated Forecasting System (IFS-AER, cycle 45R1), Geosci. Model Dev., 12, 4627–4659, https://doi.org/10.5194/gmd-12-4627-2019, 2019. a
Reno, M. J. and Hansen, C. W.: Identification of periods of clear sky irradiance in time series of GHI measurements, Renew. Energ., 90, 520–531, https://doi.org/10.1016/j.renene.2015.12.031, 2016. a
Riffault, V.: Mass concentration of non-refractory particulate organics and inorganics, within PM1 fraction, 2016–2021, NILU [data set], https://doi.org/10.48597/4VU2-MCJG, 2021. a
Riffault, V. and Brito, J.: Particle light absorption coefficient and equivalent black carbon concentration, within PM1 fraction, 2016–2020, NILU [data set], https://doi.org/10.48597/QHUR-8NUX, 2024. a
Roderick, M. L., Farquhar, G. D., Berry, S. L., and Noble, I. R.: On the direct effect of clouds and atmospheric particles on the productivity and structure of vegetation, Oecologia, 129, 21–30, https://doi.org/10.1007/s004420100760, 2001. a
Roig Rodelas, R., Perdrix, E., Herbin, B., and Riffault, V.: Characterization and variability of inorganic aerosols and their gaseous precursors at a suburban site in northern France over one year (2015–2016), Atmos. Environ., 200, 142–157, https://doi.org/10.1016/j.atmosenv.2018.11.041, 2019. a
Ruti, P. M., Somot, S., Giorgi, F., Dubois, C., Flaounas, E., Obermann, A., Dell'Aquila, A., Pisacane, G., Harzallah, A., Lombardi, E., Ahrens, B., Akhtar, N., Alias, A., Arsouze, T., Aznar, R., Bastin, S., Bartholy, J., Béranger, K., Beuvier, J., Bouffies-Cloché, S., Brauch, J., Cabos, W., Calmanti, S., Calvet, J.-C., Carillo, A., Conte, D., Coppola, E., Djurdjevic, V., Drobinski, P., Elizalde-Arellano, A., Gaertner, M., Galàn, P., Gallardo, C., Gualdi, S., Goncalves, M., Jorba, O., Jordà, G., L’Heveder, B., Lebeaupin-Brossier, C., Li, L., Liguori, G., Lionello, P., Maciàs, D., Nabat, P., Önol, B., Raikovic, B., Ramage, K., Sevault, F., Sannino, G., Struglia, M. V., Sanna, A., Torma, C., and Vervatis, V.: Med-CORDEX Initiative for Mediterranean Climate Studies, B. Am. Meteorol. Soc., 97, 1187–1208, https://doi.org/10.1175/BAMS-D-14-00176.1, 2016. a
Schumacher, D. L., Singh, J., Hauser, M., Fischer, E. M., Wild, M., and Seneviratne, S. I.: Exacerbated summer European warming not captured by climate models neglecting long-term aerosol changes, Communications Earth & Environment, 5, 182, https://doi.org/10.1038/s43247-024-01332-8, 2024. a
Schwarz, M., Folini, D., Yang, S., Allan, R. P., and Wild, M.: Changes in atmospheric shortwave absorption as important driver of dimming and brightening, Nat. Geosci., 13, 110–115, https://doi.org/10.1038/s41561-019-0528-y, 2020. a
Smirnov, A., Holben, B., Lyapustin, A., Slutsker, I., and Eck, T.: AERONET processing algorithms refinement, AERONET Workshop, https://scholar.google.com/scholar_lookup?hl=en& publication_year=2004&author=A.+Smirnov&title=AERONET +processing+algorithms+refinement (last access: 20 January 2025), 2004. a
Sutton, M. A., Reis, S., Riddick, S. N., Dragosits, U., Nemitz, E., Theobald, M. R., Tang, Y. S., Braban, C. F., Vieno, M., Dore, A. J., Mitchell, R. F., Wanless, S., Daunt, F., Fowler, D., Blackall, T. D., Milford, C., Flechard, C. R., Loubet, B., Massad, R., Cellier, P., Personne, E., Coheur, P. F., Clarisse, L., Van Damme, M., Ngadi, Y., Clerbaux, C., Skjøth, C. A., Geels, C., Hertel, O., Wichink Kruit, R. J., Pinder, R. W., Bash, J. O., Walker, J. T., Simpson, D., Horváth, L., Misselbrook, T. H., Bleeker, A., Dentener, F., and de Vries, W.: Towards a climate-dependent paradigm of ammonia emission and deposition, Philos. T. Roy. Soc. B, 368, 20130166, https://doi.org/10.1098/rstb.2013.0166, 2013. a
Séférian, R., Nabat, P., Michou, M., Saint-Martin, D., Voldoire, A., Colin, J., Decharme, B., Delire, C., Berthet, S., Chevallier, M., Sénési, S., Franchisteguy, L., Vial, J., Mallet, M., Joetzjer, E., Geoffroy, O., Guérémy, J.-F., Moine, M.-P., Msadek, R., Ribes, A., Rocher, M., Roehrig, R., Salas-y Mélia, D., Sanchez, E., Terray, L., Valcke, S., Waldman, R., Aumont, O., Bopp, L., Deshayes, J., Éthé, C., and Madec, G.: Evaluation of CNRM Earth System Model, CNRM-ESM2-1: Role of Earth System Processes in Present-Day and Future Climate, J. Adv. Model. Earth Sy., 11, 4182–4227, https://doi.org/10.1029/2019MS001791, 2019. a
Tobin, I., Greuell, W., Jerez, S., Ludwig, F., Vautard, R., van Vliet, M. T. H., and Bréon, F.-M.: Vulnerabilities and resilience of European power generation to 1.5 °C, 2 °C and 3 °C warming, Environ. Res. Lett., 13, 044024, https://doi.org/10.1088/1748-9326/aab211, 2018. a, b
Université de Lille: Plateformes d’Observation, Université de Lille [data set], https://www.loa.univ-lille.fr/observations/plateformes.html?p=lille (last access: 20 January 2025), 2015. a
Van Damme, M., Clarisse, L., Stavrakou, T., Wichink Kruit, R., Sellekaerts, L., Viatte, C., Clerbaux, C., and Coheur, P.-F.: On the weekly cycle of atmospheric ammonia over European agricultural hotspots, Scientific Reports, 12, 12327, https://doi.org/10.1038/s41598-022-15836-w, 2022. a
van Heerwaarden, C. C., Mol, W. B., Veerman, M. A., Benedict, I., Heusinkveld, B. G., Knap, W. H., Kazadzis, S., Kouremeti, N., and Fiedlerq, S.: Record high solar irradiance in Western Europe during first COVID-19 lockdown largely due to unusual weather, Communications Earth & Environment, 2, 37, https://doi.org/10.1038/s43247-021-00110-0, 2021. a
van Marle, M. J. E., Kloster, S., Magi, B. I., Marlon, J. R., Daniau, A.-L., Field, R. D., Arneth, A., Forrest, M., Hantson, S., Kehrwald, N. M., Knorr, W., Lasslop, G., Li, F., Mangeon, S., Yue, C., Kaiser, J. W., and van der Werf, G. R.: Historic global biomass burning emissions for CMIP6 (BB4CMIP) based on merging satellite observations with proxies and fire models (1750–2015), Geosci. Model Dev., 10, 3329–3357, https://doi.org/10.5194/gmd-10-3329-2017, 2017. a, b
Velazquez-Garcia, A., Crumeyrolle, S., F. de Brito, J., Tison, E., Bourrianne, E., Chiapello, I., and Riffault, V.: Deriving composition-dependent aerosol absorption, scattering and extinction mass efficiencies from multi-annual high time resolution observations in Northern France, Atmos. Environ., 298, 119613, https://doi.org/10.1016/j.atmosenv.2023.119613, 2023. a, b, c
Vuilleumier, L., Hauser, M., Félix, C., Vignola, F., Blanc, P., Kazantzidis, A., and Calpini, B.: Accuracy of ground surface broadband shortwave radiation monitoring, J. Geophys. Res.-Atmos., 119, 13838–13860, https://doi.org/10.1002/2014JD022335, 2014. a, b
Wild, M.: Global dimming and brightening: A review, J. Geophys. Res.-Atmos., 114, D00D16, https://doi.org/10.1029/2008JD011470, 2009. a
Wild, M., Gilgen, H., Roesch, A., Ohmura, A., Long, C. N., Dutton, E. G., Forgan, B., Kallis, A., Russak, V., and Tsvetkov, A.: From Dimming to Brightening: Decadal Changes in Solar Radiation at Earth's Surface, Science, 308, 847–850, https://doi.org/10.1126/science.1103215, 2005. a
Wild, M., Folini, D., Henschel, F., Fischer, N., and Müller, B.: Projections of long-term changes in solar radiation based on CMIP5 climate models and their influence on energy yields of photovoltaic systems, Sol. Energy, 116, 12–24, https://doi.org/10.1016/j.solener.2015.03.039, 2015. a
Wild, M., Wacker, S., Yang, S., and Sanchez-Lorenzo, A.: Evidence for Clear-Sky Dimming and Brightening in Central Europe, Geophys. Res. Lett., 48, e2020GL092216, https://doi.org/10.1029/2020GL092216, 2021. a
- Abstract
- Introduction
- Models and observations
- Regional evaluation of ALADIN hindcast simulations
- Present and future surface solar radiation variability
- Conclusions
- Code and data availability
- Author contributions
- Competing interests
- Disclaimer
- Acknowledgements
- Financial support
- Review statement
- References
- Supplement