the Creative Commons Attribution 4.0 License.
the Creative Commons Attribution 4.0 License.
 | 20 Oct 2025
MOSAiC studies of long-lasting mixed-phase cloud events and analysis of the liquid-phase properties of Arctic clouds
Albert Ansmann
Kevin Ohneiser
Hannes Griesche
Ronny Engelmann
Martin Radenz
Julian Hofer
Dietrich Althausen
Daniel A. Knopf
Sandro Dahlke
Johannes Bühl
Holger Baars
Patric Seifert
Ulla Wandinger
Vertically resolved observations of the temporal evolution of mixed-phase clouds (MPCs) were performed over the central Arctic during the MOSAiC (Multidisciplinary drifting Observatory for the Study of Arctic Climate) expedition, which lasted from October 2019 to September 2020. The research icebreaker Polarstern, drifting with the pack ice for more than 7 months, mostly at latitudes > 85° N, served as a platform for state-of-the-art remote sensing of aerosols and clouds. The use of the recently introduced dual field-of-view (FOV) polarization lidar technique in combination with the well-established lidar-radar retrieval technique provided, for the first time, a robust instrumental basis to monitor the evolution of the liquid and the ice phase of MPCs and the interplay between the two phases. Two long-lasting Arctic MPC events observed close to the North Pole in mid-winter (December 2019) and late summer (September 2020) are discussed to provide new insight into Arctic MPC evolution processes. In the second part of the article, cloud statistics, covering all seasons of a year, are presented. The focus is on the optical and microphysical properties of the liquid phase. These results are solely derived from the dual-FOV lidar observations. The key findings of the study can be summarized as follows: persistent activation of aerosol particles to form water droplets is of great importance for the longevity of MPCs. The observations confirm that ice formation occurs predominantly via immersion freezing. The field studies suggest that the free tropospheric reservoirs of cloud condensation nuclei (CCN) and of ice-nucleating particles (INPs) were always well filled, i.e., the clouds did not exhaust their supply of activatable and activated particles. The observation of long-lasting MPC events, low ice production rates, and a sufficiently large INP reservoir leads to the recommendation to use a time-dependent immersion freezing parameterization in MPC modeling efforts.
- Article
(13936 KB) - Full-text XML
- BibTeX
- EndNote


Stratiform mixed-phase clouds (MPCs) occur everywhere around the globe from the tropics to the poles, at all altitudes, and with temperatures from 0 down to −36 °C. Arctic MPCs exert a noticeable impact on the radiation field and temperature conditions, on the evolution of precipitation, and thus on the vertical exchange of water in the polar troposphere (Lohmann and Neubauer, 2018; Wendisch et al., 2019; Morrison et al., 2020). Therefore, a careful consideration of these MPCs in climate and weather prediction models is clearly needed. However, because these clouds show complex microphysical and thermodynamic properties and have lifetimes ranging from minutes to days, and because their evolution is influenced by many atmospheric (meteorological) processes and varying environmental (aerosol) conditions, they are difficult to model and to be appropriately parameterized in atmospheric simulation models (Savre and Ekman, 2015; Solomon et al., 2018; Fridlind and Ackerman, 2018).
More life cycle studies are needed to accelerate progress in this important field of atmospheric research. The life cycle of a stratiform MPC is controlled by two fundamental processes. The formation and maintenance of a droplet-dominated shallow cloud layer at the MPC top is of key importance. This steers all further processes that are required to explain the long MPC lifetimes often observed in the Arctic. Emission of infrared radiation by the water droplets causes strong cooling at cloud top that leads to negative buoyancy at the stable conditions and subsequently to the evolution of a complex field of upward and downward motions below and within the liquid-dominated cloud layer (Shupe et al., 2008; Roesler et al., 2017). In areas with updrafts, existing droplets can grow, and new droplets can form at water-supersaturation conditions. The steady resupply of water droplets allows the MPC supercooled liquid layer to persist despite the continuously forming ice. In the Arctic, lifetimes can be many hours or even days (Morrison et al., 2012).
The second fundamental process is heterogeneous ice nucleation in the liquid-dominated cloud layer, the subsequent growth of the ice particles, and the formation of extended ice virgae of falling ice crystals (Rauber and Tokay, 1991; Shupe et al., 2008; Ansmann et al., 2009; Morrison et al., 2012). The evolution of virgae with growing and sublimating ice crystals in different parts of the fall streaks influences cloud dynamics and lifetime (Korolev and Field, 2008; Morrison et al., 2011; Eirund et al., 2019). Immersion freezing, i.e., ice nucleation on an ice-nucleating particle (INP) inside a supercooled water droplet, is the main ice nucleation mode (Ansmann et al., 2008, 2009) and preferably starts in the coldest region of the liquid cloud layer, i.e., at cloud top (Hobbs and Rangno, 1985), and preferably during updraft periods (Shupe et al., 2008; Ansmann et al., 2009). We would like to emphasize here that the first clear hint of the dominance of immersion freezing (compared to other ice nucleation modes) in stratiform MPCs was reported for subtropical and tropical MPCs (Ansmann et al., 2009), based on lidar observations during the SAMUM (Saharan Mineral Dust Experiment) campaigns (Ansmann et al., 2011). Motivated by the subtropical and tropical studies, this finding was confirmed for mid-latitudinal MPCs (Westbrook and Illingworth, 2011) and Arctic stratiform clouds (de Boer et al., 2011). Rauber and Tokay (1991) and Shupe et al. (2008) already hypothesized that the liquid phase is obviously needed to trigger ice nucleation. Meanwhile, immersion freezing is well recognized as the main ice nucleation mode in mixed-phase clouds (Boucher et al., 2013; Vali and Snider, 2015; Savre and Ekman, 2015; Fridlind and Ackerman, 2018; Solomon et al., 2018; Khain et al., 2022; Knopf et al., 2023). Further evidence for the predominance of the immersion freezing mode will be given in this article.
An important aspect, presently in the discussion, is the parameterization of immersion freezing in atmospheric models. Two different approaches are available: the time-independent (diagnostic) approach and the time-dependent (prognostic) approach (Knopf et al., 2023). The time-dependent approach to immersion freezing follows the classical nucleation theory (CNT) (Knopf and Alpert, 2013; Alpert and Knopf, 2016; Knopf et al., 2020). The time-independent approach includes a time-independent particle-number-based and surface-area-based description of ice nucleation (DeMott et al., 2015; Ullrich et al., 2017). In the latter approach, INPs are unique among a population of the same aerosol particles, e.g., dust particles. Only a small fraction of the particles can serve as INPs, i.e., belong to the activatable particle fraction. In the time-dependent approach, all particles can be activated at a random base and belong to the reservoir of INPs within a given cloud layer. Thus, the choice of the parameterization defines the size of the INP reservoir. The CNT-based time-dependent description yields an orders of magnitude larger INP reservoir than the alternative, time-independent parameterization. A sufficiently large INP reservoir is required to explain the longevity of Arctic MPC systems (Knopf et al., 2023). We will further discuss this INP reservoir aspect in Sect. 4.1 and 4.2.
This study has two goals. In the first part, we discuss two long-lasting MPC events (one winter and one late-summer case) and provide new insight into the evolution of Arctic MPCs. The observations were performed in the framework of the MOSAiC (Multidisciplinary drifting Observatory for the Study of Arctic Climate) 2019–2020 expedition (Shupe et al., 2022). The German research icebreaker Polarstern, drifting with the pack ice for more than 7 months, from October 2019 until mid-May 2020, mostly at latitudes > 85° N, served as a platform for state-of-the-art remote sensing of aerosols and clouds. The use of the recently introduced dual field-of-view (FOV) polarization lidar technique (Jimenez et al., 2020a, b) in combination with the well-established lidar-radar retrieval technique provided, for the first time, a robust instrumental basis to monitor the evolution of the liquid and the ice phase of MPCs separately and the interplay between the two phases.
Liquid phase properties such as the droplet effective radius Re,liq, cloud light-extinction coefficient αliq, liquid water content (LWC), and cloud droplet number concentration (CDNC) were derived from the dual-FOV lidar measurements. This is an important new contribution to experimental Arctic cloud research. We implemented the new lidar technique in a state-of-the-art cloud–aerosol Raman lidar just 2 months before the start of the MOSAiC expedition. The corresponding microphysical properties of the ice crystals were obtained by combing the lidar backscatter observations at 532 nm wavelength and cloud radar reflectivity measurements at 8.5 mm wavelength, measured in the ice virgae just below the liquid-water-containing cloud layer (Bühl et al., 2019; Ansmann et al., 2019b, 2025a).
The MOSAiC observations allowed us to study the evolution of MPCs in an orographically undisturbed environment with homogeneous surface characteristics so that cloud evolution was a function of meteorological and aerosol conditions only. The cloud layers developed in Arctic haze during the winter half-year. In the few summer months, cloud evolution occurred in a complex mixture of aged anthropogenic hazes, soil and desert dust, and wildfire smoke, transported from remote continents (Ansmann et al., 2023). Local marine particles and particles of biogenic origin contributed to the aerosol composition in the lower troposphere as well.
In the second part of the article, the results of the statistical analysis of the liquid-phase microphysical properties of liquid-containing cloud layers, observed from October 2019 to September 2020, are presented and discussed. The corresponding statistics for the ice phase can unfortunately not be provided. The statistical analysis of the large MOSAiC remote sensing datasets requires automated versions of the retrieval procedures. Such an automated version was developed in the case of the dual-FOV lidar data analysis scheme but could not be realized until now in the case of the lidar-radar retrieval procedure. The lidar-radar data analysis is complex and time-consuming and includes a careful selection and setting of input parameters. As a consequence, this retrieval scheme could be applied to only a few case studies.
The article is organized as follows: after an introduction to the MOSAiC Polarstern route, employed instruments, and applied data analysis methods in Sect. 2, a brief overview about the aerosol conditions in the free troposphere is given in Sect. 3, followed by a discussion of the temporal evolution of two long-lasting MPC events in Sect. 4. The statistical results of Arctic MPC properties are presented in Sect. 5. Finally, in Sect. 6, we briefly provide some comments regarding the conceptual MPC life cycle model, which covers all key processes and aspects of an MPC life cycle and was introduced by Shupe et al. (2008) and Morrison et al. (2012). We provide some kind of an update gained from our MOSAiC observations. Concluding remarks are given in Sect. 7.
2.1 Remote sensing on board Polarstern
MOSAiC was the largest Arctic research initiative in history. The main measurement period lasted from the beginning of October 2019 until the end of September 2020. The goal of the MOSAiC expedition was to take the closest look ever at the Arctic as the epicenter of global warming and to gain fundamental insights that are key to better understanding global climate change. A detailed monitoring of the atmosphere, the ocean, the cryosphere, and the biosphere in the central Arctic was realized. Most of the MOSAiC observations were conducted at latitudes > 85° N (from the beginning of October 2019 to the beginning of April 2020 and from mid-August to the end of September 2020). Observations during the summer season (mid-May to mid-August) were performed at latitudes from 79 to 82° N, north and northwest of Svalbard, Norway.
Our role in the MOSAiC consortium was to provide a seasonally and height-resolved characterization of aerosols and clouds in the North Pole region from the surface up to 30 km height (Engelmann et al., 2021; Ohneiser et al., 2021a, 2023; Ansmann et al., 2023, 2024, 2025a, b; Griesche et al., 2024b). The German icebreaker Polarstern (Knust, 2017) served as the main MOSAiC platform for advanced remote sensing studies of the atmosphere (Shupe et al., 2022). Polarstern was trapped in the ice and drifted with the pack ice through the Arctic Ocean from 4 October 2019 to 16 May 2020. The entire cruise of the Polarstern is shown in Shupe et al. (2022). Our state-of-the-art combined aerosol–cloud Raman and dual-FOV polarization lidar (Engelmann et al., 2016; Jimenez et al., 2020b) on board Polarstern was operated side by side with the ARM (Atmospheric Radiation Measurement) mobile facility 1 (AMF-1), which conducted cloud radar observations. Several MPC studies using MOSAiC remote sensing data have meanwhile been published (Silber and Shupe, 2022; Saavedra Garfias et al., 2023; Barrientos-Velasco et al., 2025).
Ground-based active remote sensing with advanced lidars and cloud radars permits a detailed monitoring of the different stages of the life cycle of stratiform MPC systems with high vertical and temporal resolution over hours to days (Shupe, 2007; Shupe et al., 2008; Illingworth et al., 2007; de Boer et al., 2011; Bühl et al., 2016; Kalesse et al., 2016; Achtert et al., 2020; Griesche et al., 2020; Radenz et al., 2021b; Engelmann et al., 2021). Sophisticated retrieval methods (e.g., Delanoë and Hogan, 2008; Schmidt et al., 2013; Sourdeval et al., 2018; Bühl et al., 2019; Jimenez et al., 2020a; Mason et al., 2023) allow for a detailed derivation of cloud microphysical properties. Meanwhile, lidar-based aerosol retrieval methods have also been introduced to cover the aerosol part in cloud process studies (Mamouri and Ansmann, 2016; Marinou et al., 2019; Ansmann et al., 2019a, 2021; Choudhury and Tesche, 2022; Choudhury et al., 2022; He et al., 2023). The dual-FOV Raman lidar technique (Schmidt et al., 2013) and the new dual-FOV polarization lidar technique (Jimenez et al., 2020a) were developed for an improved monitoring of life cycles of stratiform clouds with a focus on the liquid phase and for an improved observation-based study of the impact of aerosols on the microphysical properties of stratiform, droplet-dominated cloud layers (Schmidt et al., 2014, 2015; Jimenez et al., 2020b).
In addition to the lidar observations, we made use of the MOSAiC ARM cloud radar measurements to derive profiles of ice crystal properties of the MPC systems by combining lidar and radar data. The 35 GHz Doppler cloud radar (Ka-band ARM Zenith Radar, KAZR) of the ARM mobile facility AMF-1 of the US Department of Energy (http://www.arm.gov, last access: 22 November 2024) measures profiles of radar reflectivity, mean Doppler velocity, and Doppler spectrum width (ARM, 2024).
We also used the retrievals of the liquid water path (LWP) with the HATPRO (Humidity and Temperature Profiler) microwave radiometer (Rose et al., 2005; Griesche et al., 2024b) mounted on the roof of our lidar container. Finally, we used the dense set of radiosonde temperature and relative humidity profiles (Maturilli et al., 2021) in our cloud studies. Vaisala radiosondes (type RS41) were launched regularly every 6 h on board Polarstern throughout the entire MOSAiC year.
2.2 Raman lidar products
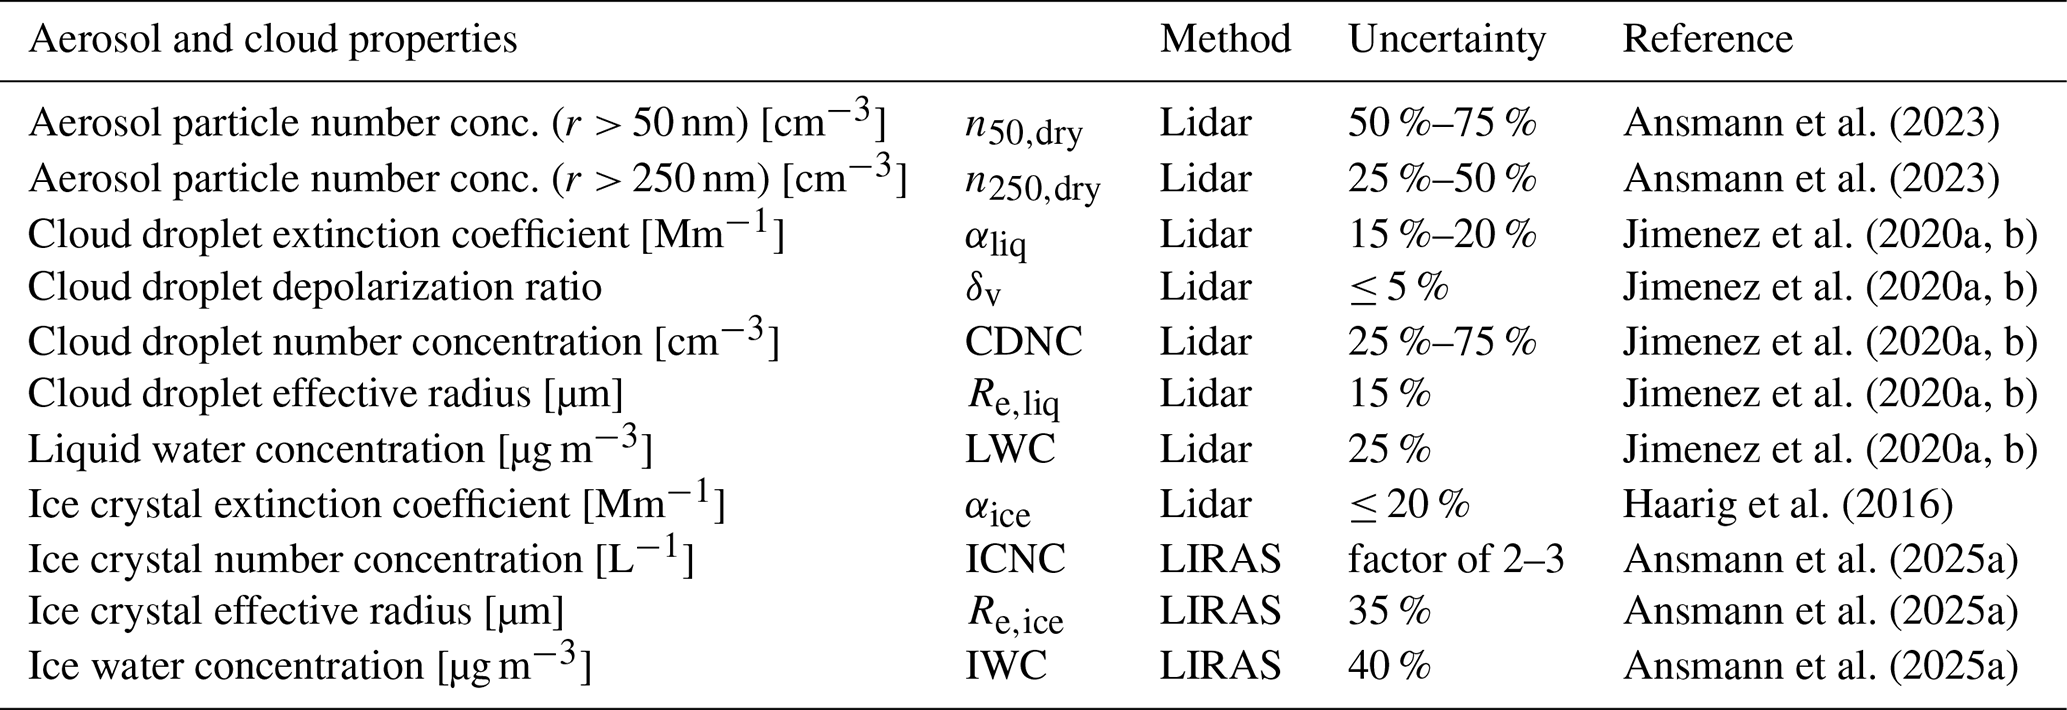
An overview of the aerosol and cloud products used in this study and obtained from the lidar and radar observations is presented in Table 1. The errors given in Table 1 can be regarded as typical uncertainties and were partly obtained from validation efforts (Ansmann et al., 2023). The basic lidar data analysis applied to obtain the geometrical (cloud base and top heights) and optical (backscatter, extinction, linear depolarization ratio) properties is outlined in Baars et al. (2016), Haarig et al. (2016), and Hofer et al. (2017). The main features of the MOSAiC-related aerosol data analysis (including signal correction, Rayleigh backscattering and extinction correction, temporal averaging, and vertical smoothing of the signal profiles) are described in Ohneiser et al. (2020, 2021a, 2022). Relative humidity fields, as shown in Engelmann et al. (2021), Seidel et al. (2025), and Sect. 4, are obtained from Raman lidar observations of the water-vapor-to-dry-air mixing-ratio profiles (Dai et al., 2018) and temperature profiles measured with the Polarstern radiosondes. In this computation, the temperature profiles are required with a resolution of 30 s and obtained by linear interpolation between the radiosonde data for each height bin, given for fixed times (06:00, 12:00, 18:00, and 24:00 UTC). Quality checks were based on comparisons of the Raman lidar with the respective MOSAiC radiosonde humidity profiles (Seidel et al., 2025).
Ansmann et al. (2023)Ansmann et al. (2023)Jimenez et al. (2020a, b)Jimenez et al. (2020a, b)Jimenez et al. (2020a, b)Jimenez et al. (2020a, b)Jimenez et al. (2020a, b)Haarig et al. (2016)Ansmann et al. (2025a)Ansmann et al. (2025a)Ansmann et al. (2025a)Table 1Aerosol and cloud products, obtained from lidar-only analysis (Lidar) or from the synergy of lidar and radar observations (LIRAS: lidar-radar synergy). r denotes the radius of the dry aerosol particles. Typical relative uncertainties in the retrieval products are given. The referenced articles provide detailed information about the retrievals and further literature.
2.3 POLIPHON: CCN and INP reservoirs
The retrieval of aerosol microphysical properties such as the number concentrations n50,dry and n250,dry of dry aerosol particles, listed in Table 1, is performed by means of the POLIPHON (Polarization Lidar Photometer Networking) approach (Mamouri and Ansmann, 2016, 2017; Ansmann et al., 2023). The particle number concentration n50,dry, considering all dry particles with radius > 50 nm, is used as a proxy for the reservoir of cloud condensation nuclei (CCN). The number concentration n250,dry considers the larger dry particles with radius > 250 nm. According to DeMott et al. (2015), dust particles with radius > 250 nm are the most favorable INPs in the free troposphere. Therefore, the estimated dust particle number concentration is used as a proxy for the INP reservoir in our study.
The required extinction-to-number-concentration conversion factors, needed to convert particle extinction coefficient profiles into n50,dry and n250,dry profiles, are derived from Arctic AERONET (Aerosol Robotic Network) sun photometer observations during the summer half-year (Ansmann et al., 2023). For the winter half-year, without sunlight, conversion factors for the dominating Arctic haze aerosol type are not available. Fortunately, an episode with a strong Arctic haze event could be measured with our AERONET (Aerosol Robotic Network) sun photometer over Leipzig, Germany, in April 2002 (Müller et al., 2004). The obtained Arctic haze conversion factors were rather close to the summer Arctic aerosol conversion factors given in Ansmann et al. (2023). This finding encouraged us to apply the Arctic summer conversion factors to the entire MOSAiC dataset to obtain year-round time series of n50,dry and n250,dry profiles. The multiplication of a given lidar-derived extinction coefficient (in Mm−1) with the conversion factor of 10 Mm cm−3 yields the n50,dry value. In a similar way, multiplication with the conversion factor of 0.13 Mm cm−3 leads to the n250,dry value (Ansmann et al., 2023). We obtain a realistic dust-related particle number concentration by applying the conversion factor of 0.13 Mm cm−3 and assuming a dust fraction of 1 %–10 %, i.e., from 0.01 to 0.1. The assumption of a dust fraction of 1 %–10 % in the free troposphere is supported by global airborne aerosol observations presented by Froyd et al. (2022).
2.4 Dual-FOV lidar: optical and microphysical properties of water droplets
In this article, the focus is on the 1-year MOSAiC observations of stratiform clouds in the lower and middle free troposphere at heights above 500 m. The Arctic boundary layer over Polarstern usually reached heights below 500 m (Peng et al., 2023). The dual-FOV polarization lidar method (Jimenez et al., 2020a, b), applied to gain the liquid droplet properties, is based on the measurement of the volume linear depolarization ratio δv at two different FOVs. The depolarization ratio is defined as the ratio of the cross-polarized to the co-polarized backscatter coefficient. “cross” and “co” indicate the plane of polarization orthogonal and parallel to the plane of linear polarization of the transmitted laser pulses. The volume depolarization ratio monotonically increases from 0 at cloud base to values > 0.2 within the liquid-dominated cloud layer due to multiple scatterings of laser light by the cloud droplets. By measuring the multiple scattering effect (via light depolarization) with two FOVs, we are able to unambiguously derive the single-scattering cloud extinction coefficient αliq and the effective radius Re,liq, i.e., the geometrical-cross-section-weighted mean radius of the droplets. The derived extinction coefficients can be cross-checked by the measured single-scattering droplet backscatter coefficients (multiplied by the water cloud lidar ratio of 18 sr) obtained from elastic backscatter signals. In the next step, we calculate the liquid water content, LWC, as a function of the cloud extinction coefficient and effective radius and, finally, the cloud droplet number concentration, CDNC, from LWC by assuming a gamma size distribution. The most accurate set of solutions is obtained at heights of 50–100 m above the base of the liquid-dominated cloud layer of the MPC (Jimenez et al., 2020b; Engelmann et al., 2021). In Fig. 1, the center height of 75 m above cloud base is highlighted by the thick, horizontal blue lines. To avoid a potentially sensitive bias in the retrieval products by the incomplete overlap between the laser beam and the different receiver FOVs of the lidar, we excluded the dual-FOV lidar observations in the near range (< 500 m height) from further analysis. The lidar overlap profiles can always slightly vary, e.g., with changing temperatures in the air-conditioned lidar container. The lidar signal profiles are stored with 30 s resolution and averaged over 7 min before the dual-FOV lidar data analysis is applied.
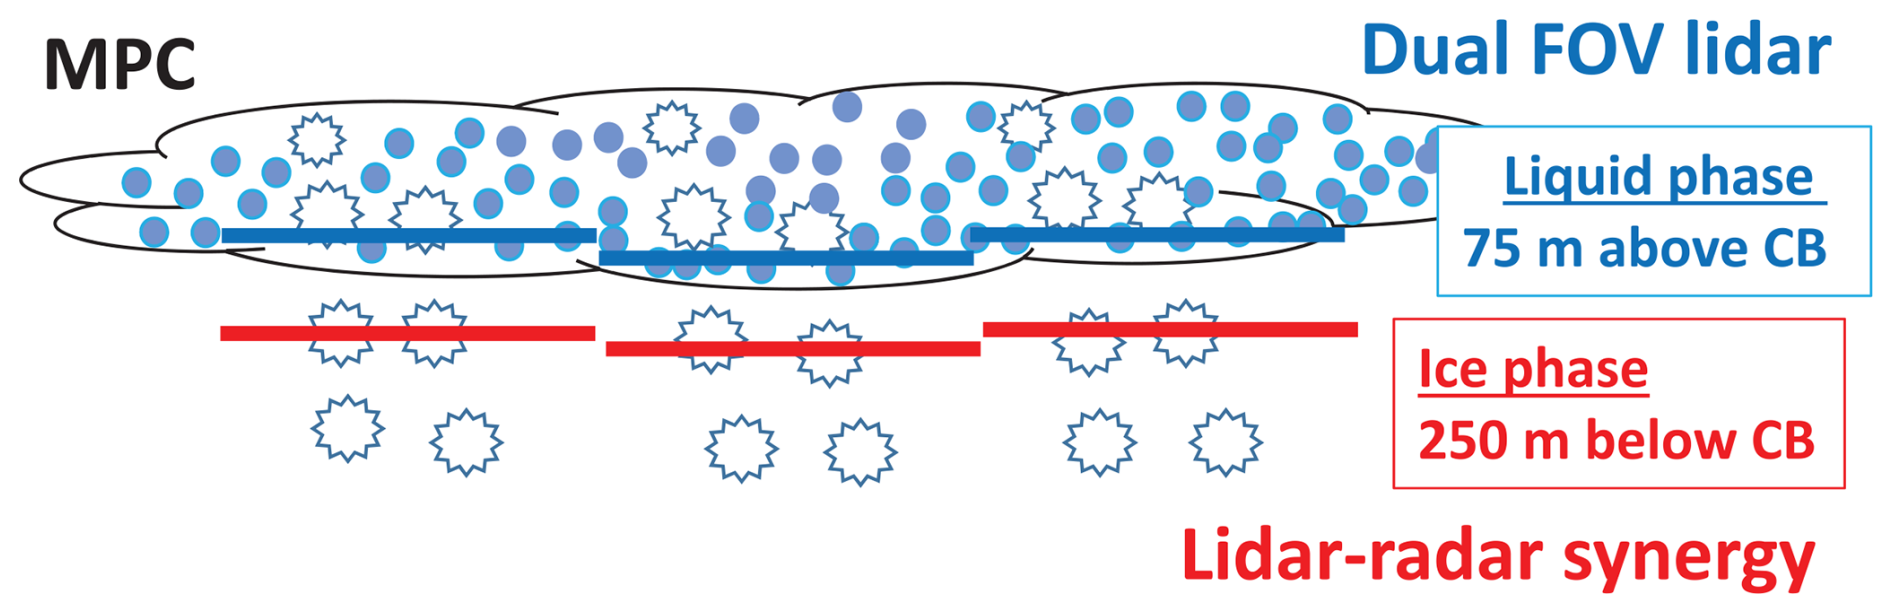
Figure 1Data analysis concept to obtain the liquid-phase and ice-phase properties of an MPC layer. Dual-FOV lidar observations from 50 to 100 m above the base of the liquid-dominated cloud layer are used to retrieve the liquid-phase properties of the MPC. Observations are averaged over 7 min. The results are assigned to 75 m above cloud base (CB), indicated by the thick, horizontal blue lines. Droplet-free conditions in the ice virga zone below CB are used to retrieve the ice-phase properties by combining lidar and radar measurements between 100 and 400 m below CB. The 7 min mean values of the retrieval products are assigned to 250 m below cloud base, indicated by the thick, horizontal red lines.
In situ observations (Mioche et al., 2017) indicate that such observations in the lower part of the liquid-dominated cloud layer well represent the liquid phase properties of the entire MPC up to cloud top. The uncertainty analysis shows that the lidar approach, originally developed for pure water clouds, can be applied even to MPCs as long as the contribution of backscattering by ice crystals to the total backscatter coefficient is clearly below 5 % in the liquid-bearing cloud layer (Engelmann et al., 2021). During MOSAiC, the ice backscatter fraction was always on the order of 1 %–2 % or less at 50–100 m above cloud base. It should be mentioned that lidars are able to correctly measure the cloud optical depth up to around 2.5. This means that useful backscatter signals of a liquid-dominated cloud layer are available up to 100 m above cloud base in the case of cloud extinction coefficients of 25 km−1.
Note that alternative, single-FOV lidar methods were developed to estimate droplet microphysical properties (Donovan et al., 2015; Snider et al., 2017). However, these techniques depend on critical assumptions such that only a rough estimation of the liquid-phase microphysical properties is possible (Kalesse et al., 2016; Zhang et al., 2019). This fact was the motivation for the development of the advanced dual-FOV lidar techniques (Schmidt et al., 2013, 2014; Jimenez et al., 2020a, b).
2.5 Lidar-radar synergy (LIRAS): microphysical properties of ice crystals
Information about ice crystal properties such as the ice crystal number concentration (ICNC) and ice water content (IWC) can be obtained from the combination of Ka-band ARM Zenith Radar (35 GHz cloud Doppler radar) and 532 nm backscatter lidar observations (Bühl et al., 2019; Ansmann et al., 2025a). Table 1 includes the MPC ice-phase properties. For a close comparison with the liquid-phase properties 75 m above cloud base, we used the ice-phase properties obtained from the lidar-radar retrievals just below the base of the liquid-dominated cloud layer (see Fig. 1). Within the virga zone, backscatter contributions by cloud droplets to the total backscattering of laser photons are negligible. In contrast to ice crystals, cloud droplets do not fall out of the main MPC cloud layer and thus do not perturb the pure-ice observations and lidar-radar data analysis below the liquid-bearing MPC layer. Even in the presence of a few droplets, reaching lower heights by turbulent motions, the impact of droplets on the lidar backscatter coefficients and the radar reflectivity values in the ice-dominated virga zone and thus on the LIRAS products is negligible.
According to the airborne in situ MPC observations of Mioche et al. (2017), the ice-phase retrieval products just below the main cloud deck well represent the ice properties in the lower half of the liquid-bearing cloud layer. In the upper half, the ice crystal properties change much with height as a function of varying ice nucleation rates and the especially strong changes in the sizes of the crystals by water vapor deposition shortly after the nucleation events.
The applied LIRAS-ice (LIdar RAdar Synergy – retrieval of ice microphysical properties) analysis scheme (Bühl et al., 2019; Ansmann et al., 2025a) was also used in Arctic cirrus formation studies (Ansmann et al., 2025a). LIRAS-ice makes use of the measured profiles of the radar reflectivity factor Z at 8.5 mm wavelength and of the ice crystal extinction coefficient αice at 532 nm wavelength. Accurate 532 nm ice single-scattering extinction coefficients are of fundamental importance to retrieve trustworthy products. Very accurate αice profiles are obtained by means of the Raman lidar method. In the first step, the height profile of the single-scattering ice crystal backscatter coefficient is determined by using a modified version (Baars et al., 2017; Jimenez, 2021) of the Raman lidar method (Ansmann et al., 1992). In the second step, the backscatter profile is multiplied with the well-known single-scattering 532 nm ice crystal lidar ratio (extinction-to-backscatter ratio) of around 32 sr to get the required profile of the single-scattering ice crystal extinction coefficient αice. For more details (including references for cirrus lidar ratio observations and retrievals), we refer to Ansmann et al. (2025a) and to the articles of Bühl et al. (2019) and Ansmann et al. (2019b).
Complementary to the dual-FOV lidar products for the liquid phase, the LIRAS products are the ice extinction coefficient αice, the effective radius Re,ice, IWC, and ICNC. The ice water path (IWP, vertically integrated IWC) is calculated from the IWC profile values in the ice virga plus the IWC values in the liquid-dominated cloud layer. Here, we use the virga IWC value at the top of the virga zone to be representative for the entire liquid-dominated cloud layer, i.e., we assume a height-constant IWC profile from cloud base to the top of the cloud layer. The contribution of ice crystals in the liquid-containing layer to the IWP may be overestimated by about 20 % when assuming a height-constant IWC profile from base to top of the liquid-bearing cloud layer (Mioche et al., 2017). Ice nucleation at cloud top and growth of the nucleated particles lead to a steady increase in IWC from cloud top (IWP = 0) to the center of the liquid-dominated layer, and only in the lower half and in the main virga zone is IWC roughly height-independent, according to the observations of Mioche et al. (2017).
2.6 Liquid-phase-related statistical analysis
In Sect. 5, we show statistical results of liquid-phase properties of Arctic liquid-bearing cloud layers, observed at heights > 500 m. The analysis is solely based on the dual-FOV polarization lidar observations from October 2019 to September 2020. In the first step, we removed all lidar observations that showed fog and low-level cloud signatures. These data cannot be analyzed properly because the laser light is quickly attenuated and the very strong backscatter signals partly overload the detectors. About 2630 h (31 %) of the MOSAiC measurement time period showed low clouds and fog. After applying several quality assurance procedures to the lidar observations, we selected around 360 h of observations of well-defined stratiform cloud events, obtained during fog and low-cloud-free conditions, for our studies. The quality assurance procedure includes checks of the inter-channel constants between all four channels used to determine the two volume depolarization ratios. Here, long datasets with clouds and cloud-free conditions were used to check the long-term stability of the counting efficiencies of the polarization sensitive channels. It was also confirmed that none of the lidar signal counts (in each channel) reached the saturation level of the detectors during cloud events.
In the next step, we calculated 7 min mean signal profiles. Based on 3070 individual cloud profiles (7 min averages), we computed the droplet-related optical and microphysical properties of the stratiform cloud layers. The data analysis covered the height range from 500 m to 7 km. Above 7 km height, all detected cloud layers were pure ice clouds.
We distinguish pure liquid-water clouds (PL clouds) and MPCs in Sect. 5. All clouds showing virga structures below the cloud top layer were defined as MPCs. Those clouds, which produced no detectable virgae, were classified as pure liquid-water clouds. Cloud base and top heights were obtained from the lidar backscatter and depolarization observation (base heights) and from the radar reflectivity measurements (top heights). The MOSAiC radiosonde temperature data and respective interpolated temperature fields were finally used to assign cloud top temperatures, i.e., the temperatures at which heterogeneous ice nucleation usually starts. In the case of multiple cloud layers, only the lowest layer was considered in the lidar data analysis to avoid undefined biases in the results for the upper layers introduced by the attenuation of laser light and multiple scattering effects in the lowest layer.
We also show statistics regarding the temporal length of the measured cloud fields. The temporal length is given by the time an individual cloud layer needs to cross the lidar site. We defined cloud layers as single, individual layers when they were detected at different heights. In the case of broken cloud fields (many cloud segments at the same height level), we counted a cloud field as one single cloud system if the detected cloud-free periods lasted for less than an hour. Shupe et al. (2006) counted individual cloud layers in the same way, i.e., cloud layers with gaps of < 1 h in duration were considered to be continuous. If a cloud-free period between subsequent cloud fields exceeded 60 min, the next cloud field, crossing Polarstern at that height level, was counted as a new cloud. We assume in this specific cloud length statistics that all cloud segments, separated even by 30–60 min, still developed at the same meteorological and aerosol conditions and, thus, should not be counted as individual, independent cloud layers.
We briefly illuminate the CCN and INP reservoirs in the lower and middle free troposphere over the Arctic during the MOSAiC year. Fig. 2 shows the aerosol particle number concentration n50,dry, interpreted as a proxy for the CCN reservoir, for different height levels up to the middle troposphere. The same values follow for the INP reservoir proxy, (per liter), in the case of a dust particle fraction of 7.5 %. As discussed in Sect. 1, the reservoirs contain all activatable particles to nucleate droplets (CCN reservoir) or ice crystals (INP reservoir).
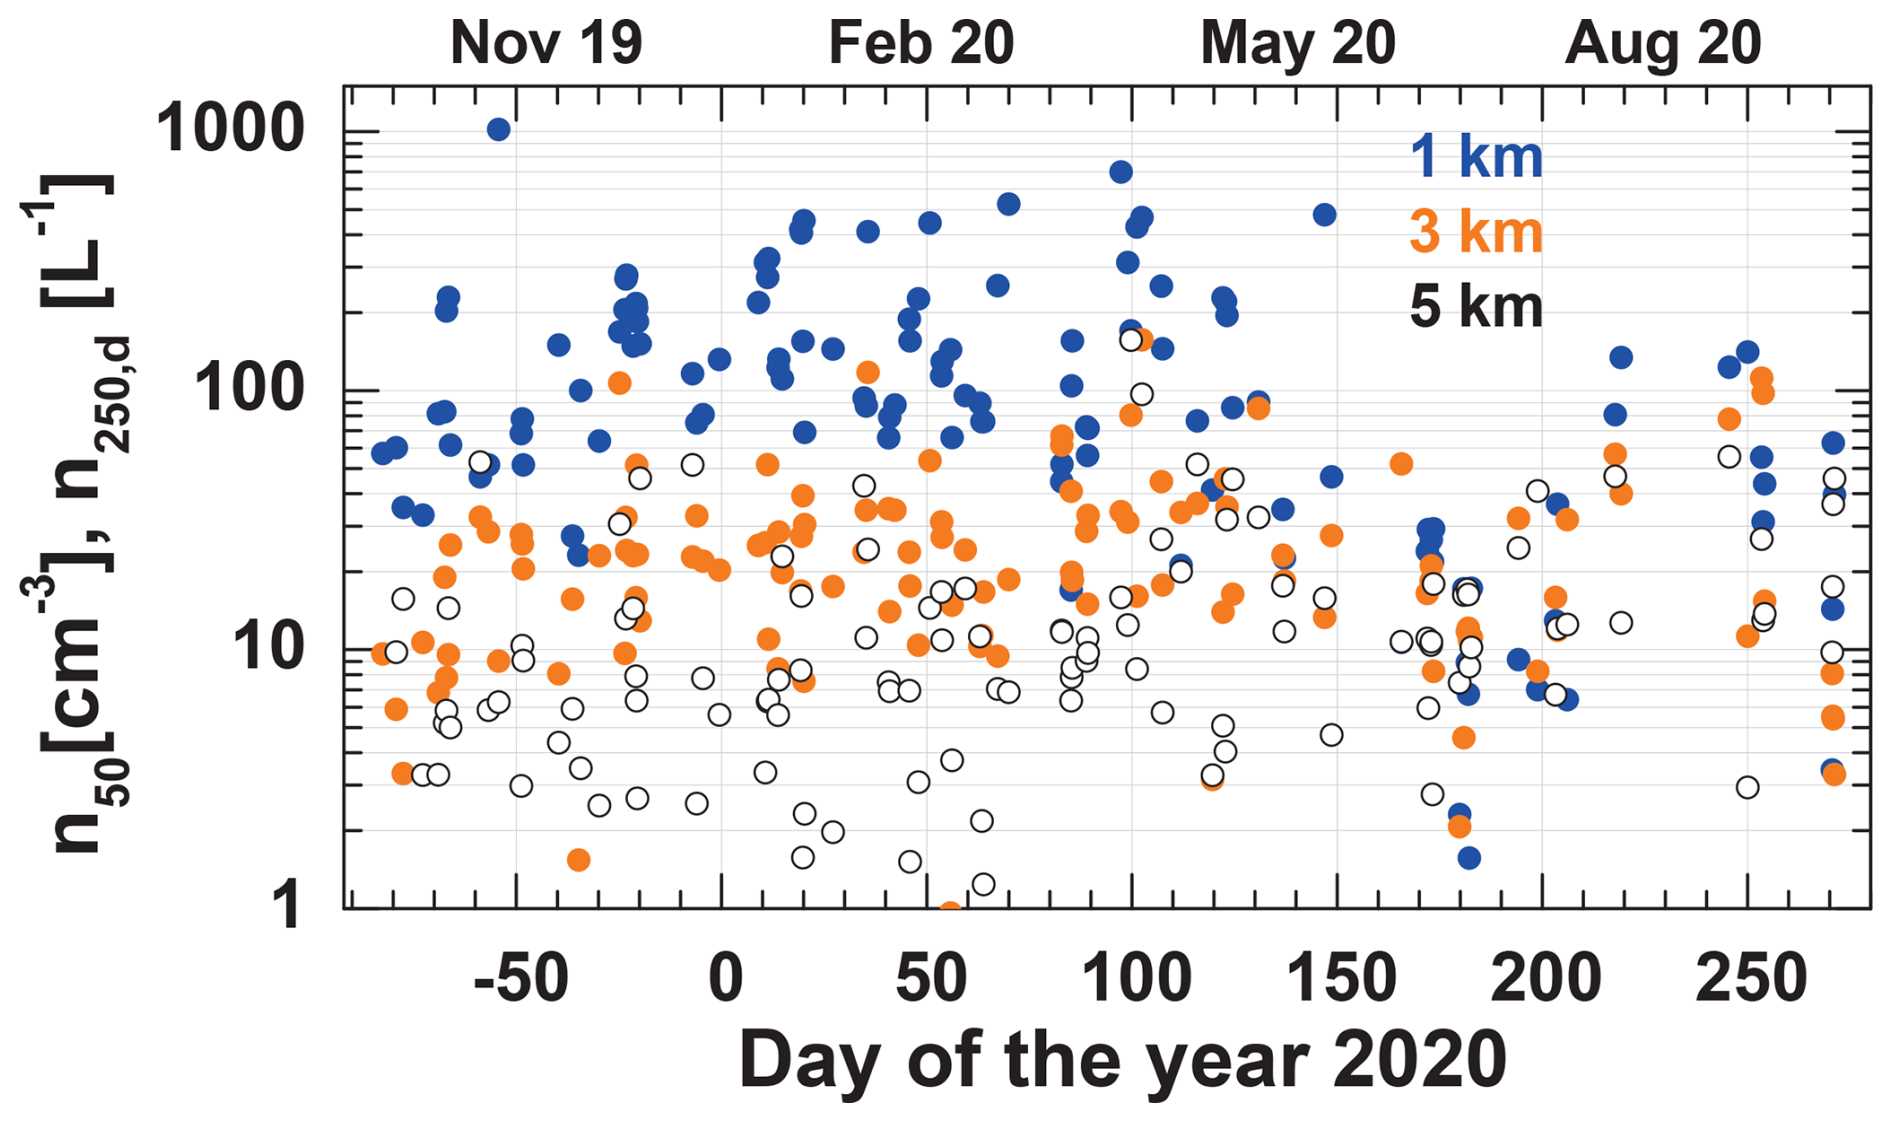
Figure 2Particle number concentration n50,dry obtained from lidar observations at cloud-free conditions for the height levels of 1 km (blue circles), 3 km (orange circles), and 5 km (white circles). Data gaps, especially during the summer months, indicate long phases with low clouds and fog. n50,dry can be regarded as a proxy for the reservoir of activatable CCN. The same values, shown in the figure for n50,dry, can be obtained for (dust fraction of n250,dry, now in number per liter) by applying the respective extinction-to-n250,dry conversion factor and by assuming a dust fraction of 7.5 %. may indicate the reservoir of most favorable INPs.
To provide an impression of the CCN- and INP-related aerosol conditions in the lower and middle troposphere, the MOSAiC time series of n50,dry and are shown for the height levels of 1, 3, and 5 km in Fig. 2. As mentioned, stratiform liquid-water-bearing cloud layers were observed up to 7 km height. The high variability at all three height levels in Fig. 2 reflects the frequency of occurrence of aerosol transport events towards the central Arctic. A clear annual cycle of the particle number concentrations is visible for the 1 km height level. The values for n50,dry at 1 km height mostly ranged from 50 to 500 cm−3 during the MOSAiC winter half-year and from 5 to 150 cm−3 during the short summer season from June to September 2020. During the long winter period, Arctic haze conditions dominated. As mentioned, in the summer, a mixture of anthropogenic pollution, wildfire smoke, marine particles, and mineral dust prevailed in the free troposphere over the central Arctic. In contrast to the 1 km height level, an annual cycle is absent in the time series of the particle number concentrations at the 3 and 5 km height levels. The estimates of n50,dry and (for a 7.5 % dust fraction) at 3 and 5 km are roughly a factor of 3–10 lower than the number concentrations at 1 km height.
The temporal evolution of two long-lasting MPC events is discussed in Sect. 4.1–4.2. We selected a cold, mid-winter case (29–31 December 2019) with a textbook-like MPC evolution at Arctic haze conditions over more than 27 h. The second case was measured in the late summer (21 September 2020). The MPC was observed over 15 h and developed in a wildfire-smoke- and anthropogenic-haze-polluted environment.
4.1 29–31 December 2019 MPC case study
4.1.1 Macrophysical properties and meteorological conditions
A very stable MPC deck was observed over Polarstern on 29–31 December 2019. The results are presented in Figs. 3 to 5. Polarstern was at 86.6° N and 116–118° E and drifted with the pack ice. The cloud system crossed Polarstern with a mainly westerly wind component. The radiosonde observations indicated horizontal wind velocities of 4–6 m s−1 in the height range from the surface up to 4 km. Satellite imaginary (NASA Worldview, 2024) showed a more than 500 km times 200 km large MPC field in the North Pole region on 30 December 2019. According to the aerosol source identification scheme of Radenz et al. (2021a), the air mass at 1–3 km height traveled mostly within the European and North American sector at latitudes > 60° N during the last 10 d before reaching the MOSAiC field site. Arctic haze pollution dominated the aerosol conditions in the lower free troposphere in the central Arctic to that time (Engelmann et al., 2021; Ansmann et al., 2023).
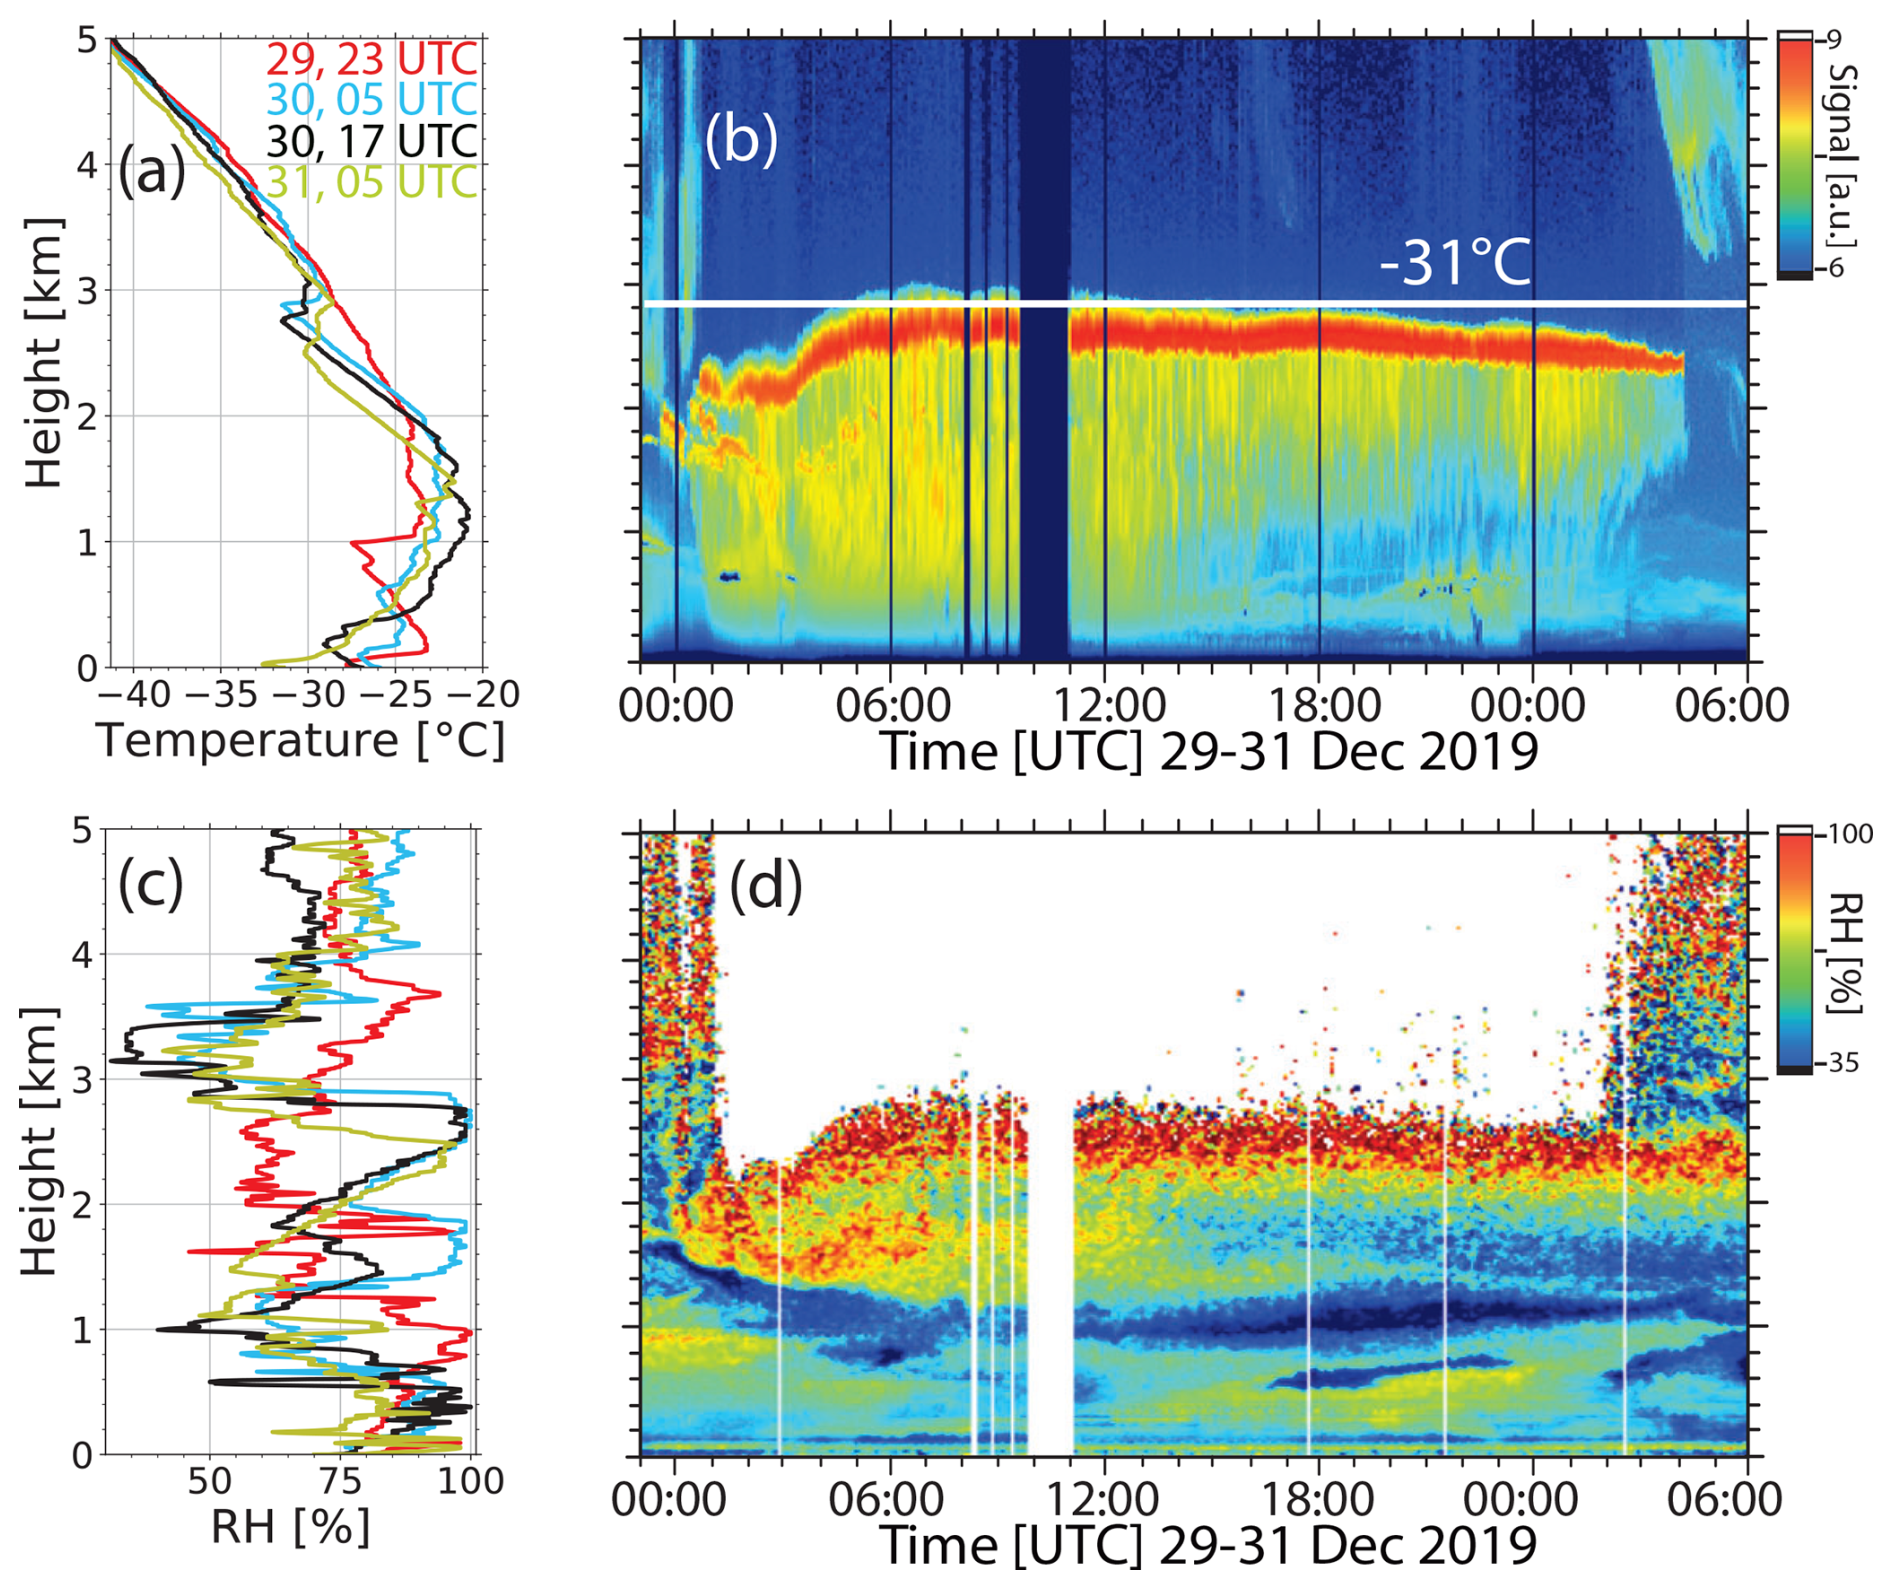
Figure 3Temporal evolution of a long-lasting MPC event observed with Raman lidar on board Polarstern at 86.6° N and 116–118° E on 29–31 December 2019 (b). The height–time display of the 1064 nm range-corrected signal in panel (b) shows the droplet-dominated cloud layer (in red) between 2 and 3 km height and virgae (in yellow) of falling ice crystals. Profiles of temperature (a) and relative humidity (over water) (c) were measured with MOSAiC radiosondes launched at 23:00 UTC (29 December), 05:00 and 17:00 UTC (30 December), and 05:00 UTC (31 December 2019). Thin black vertical lines in panel (b) indicate times of radiosonde observations. The cloud top temperature was between −28 and −32 °C. In panel (d), the relative humidity field derived from the water vapor Raman lidar measurements is shown. Several dark bars in panel (b) and white bars in panel (d) indicate times with non-useful lidar observations (partly caused by automated calibration and adjustment events). In panel (d), the large white area above the MPCs indicates missing lidar data. In panels (b) and (d), the lidar observations are biased in the near range (< 250 m).
An overview of the macrophysical cloud properties and meteorological conditions is given in Fig. 3. At midnight on 29–30 December 2019, a warm and moist air mass reached Polarstern at heights > 1 km according to Fig. 3d and the 24:00 UTC radiosonde temperature profile in Fig. 3a. The radiosonde was launched at 23:00 UTC on 29 December 2019. RHw peaks close to 100 % at 1.5–2 km height (see Fig. 3c) caused first cloud formation including ice nucleation and virga development at −24 °C, as can be seen in Fig. 3b.
A droplet-dominated cloud layer then developed in the moist air mass at heights between 2 and 3 km shortly after midnight. The vertical extent of the cloud layer (in red in Fig. 3b) was 300–400 m according to the 06:00 and 18:00 UTC radiosonde humidity profiles in Fig. 3c. The relative humidity over water RHw reached 100 % in the droplet-containing cloud layer. The yellow stream-like structures in Fig. 3b are produced by virgae of falling ice crystals. Almost no wind shear and low wind speeds allowed an undisturbed evolution of the ice virgae. The virgae got thinner with time, and the vertical extent decreased when the air mass became drier below 2 km height after 12:00 UTC on 30 December 2019 (see Fig. 3d). We assume that each virga is related to an individual updraft event during which CCN activation as well as ice nucleation preferably takes place (Shupe et al., 2008; Khain et al., 2022).
After the formation and establishment of an opaque liquid top layer, a strong drop in the temperature of the MPC top layer occurred, as the comparison of the 23:00 UTC radiosonde temperature profile with the 05:00 and 17:00 UTC radiosonde temperature profiles in Fig. 3a indicates. The strongest temperature decrease was found at cloud top. The temperature decreased from around −27 °C (radiosonde launch at 23:00 UTC) to −32 °C (radiosonde launched at 05:00 UTC) at 2.8–2.9 km height as a result of the strong emission of longwave radiation by the cloud top layer. The strong radiative cooling leads to decreased static stability in the cloud top layer and buoyant production of turbulence within and below the cloud top layer (Roesler et al., 2017) and to the evolution of the regular pattern of updraft and downdraft periods (Shupe et al., 2008). In the continuously occurring updrafts, CCN activation and condensational growth of droplets take place, as well as ice nucleation and crystal growth by water vapor deposition. The longevity of the MPC deck is, in our opinion, the result of the continuous nucleation of new liquid water droplets.
The humidity conditions on 29-31 December 2019 over Polarstern are shown in Fig. 3d. Blue and red colors indicate a low relative humidity of < 40 % and values of 100 %, respectively. The lidar measures the water-vapor mixing ratio with a vertical resolution of 7.5 m and a temporal resolution of 30 s. By using the MOSAiC radiosonde temperature profiles (available with a resolution of 6 h), the mixing ratio profiles were converted into relative humidity profiles (see Sect. 2.2 for more details).
Pronounced lofting of the air mass occurred until about 07:00 UTC on 30 December 2019. The liquid-dominated cloud layer (in red in Fig. 3b) formed at water supersaturation conditions. Strong ice nucleation and crystal growth started immediately in the droplet environment at favorable immersion freezing temperatures below −30 °C (and corresponding ice saturation ratio Si>1.34) at cloud top. With decreasing temperatures during further cooling of the MPC top, the ice nucleation efficiency of activatable INPs further increases (DeMott et al., 2015; Kanji et al., 2017; Wex et al., 2019). Intense and extended virgae of falling ice crystals developed and reached low heights. Sublimating ice crystals kept the relative humidity high between the cloud top layer and 1 km height until 14:00 UTC. Cooling of the air during the sublimation processes may contribute to a strong downward motion of ice-containing air layers. With time, the advected air mass became significantly drier. However, sublimation of crystals was able to keep the relative humidity high in a 300–400 m thick layer below the droplet-dominated top layer. The released water vapor, CCN, and INPs may have partly been transported back into the cloud top layer during updraft periods. Additional CCN and INPs may have entered the cloud from above, may have entered from below via blowing snow effects (Gong et al., 2023), or were advected within the moist air mass with the prevailing westerly wind flow.
The cloud top layer became thinner (optically and geometrically) such that water vapor observations were again possible (as in the beginning) up to 4–5 km height. The MPC dissolved at 04:00 UTC. The 06:00 UTC radiosonde (launched at 05:00 UTC) indicated water subsaturation at all heights and maximum values around 90 % at 2.5 km height.
4.1.2 Microphysical properties: ice phase vs liquid phase
The retrieval products for the liquid and the ice phase are presented in Fig. 4. The three height–time displays in Fig. 4a, b, and c show the basic lidar and radar observations. The cloud radar provides an overview of the temporal evolution of the MPC system in terms of the radar reflectivity Z (caused by ice crystals at 8.5 mm wavelength in Fig. 4a). The radar detects all ice crystals in the vertical tropospheric column. Even the ice virgae originating from upper tropospheric cirrus clouds above the MPC are detected. These crystals may have influenced the MPC evolution via the seeder-feeder effect (Rauber and Tokay, 1991; Ansmann et al., 2008, 2009; Ramelli et al., 2021) before 07:00 UTC on 30 December 2019. In seeder-feeder processes, ice crystal seeds enter a liquid cloud layer from above and grow fast at the expense of liquid water droplets, which evaporate during the ice growth process.
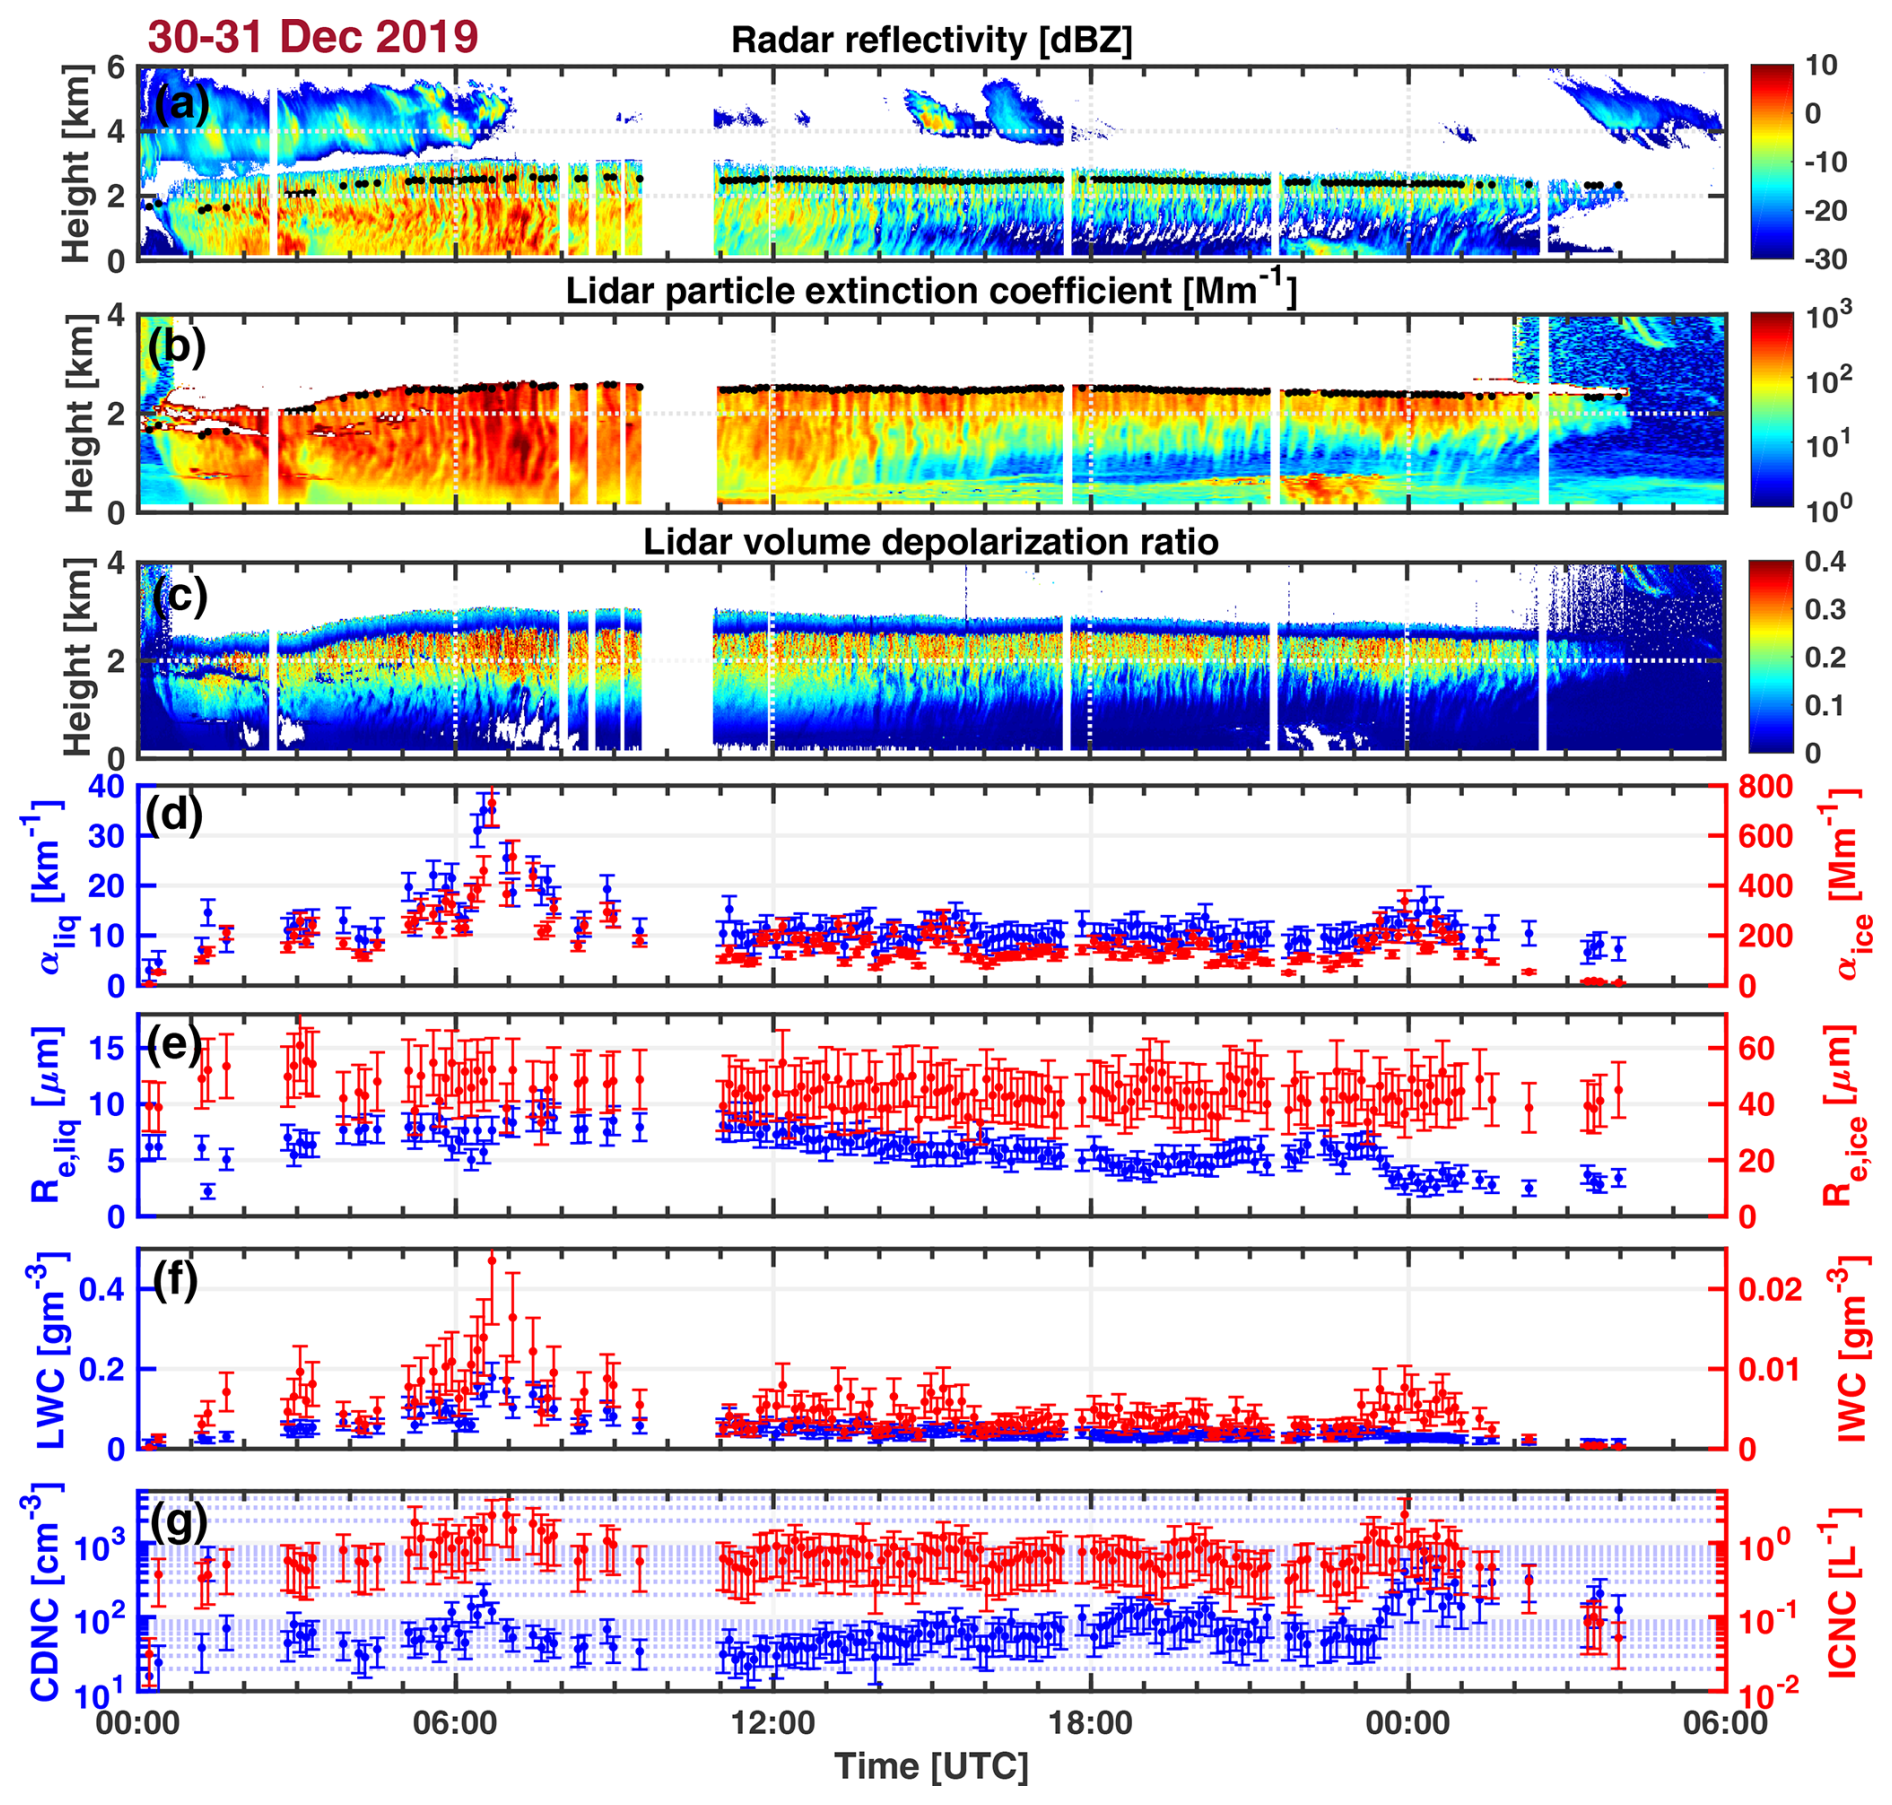
Figure 4Temporal evolution of the winter MPC as observed (a) with cloud radar (radar reflectivity Z) and (b, c) with lidar ((b) particle extinction coefficient αice, (c) volume depolarization ratio δv) on board Polarstern at 86.6° N on 30–31 December 2019. Black dots in panels (a) and (b) show the base of the liquid-bearing cloud layer as detected with lidar. Time series of (d) the droplet extinction coefficient (in blue) and the ice crystal extinction coefficient (in red), (e) the effective radii of droplets (blue) and ice crystals (red), (f) LWC (blue) and IWC (red), and (g) CDNC (blue) and ICNC (red) are retrieved by using the basic observations in panels (a), (b), and (c). The droplet properties (in blue) are computed for the height of 75 m above the base of the liquid-dominated cloud top layer. The ice properties (in red) are determined in the virga zone around 250 m below the base of the liquid-dominated cloud layer. SD bars indicate the uncertainty in the retrieval products. Gaps in the time series, associated with the white vertical columns in panels (a) to (c), indicate missing data.
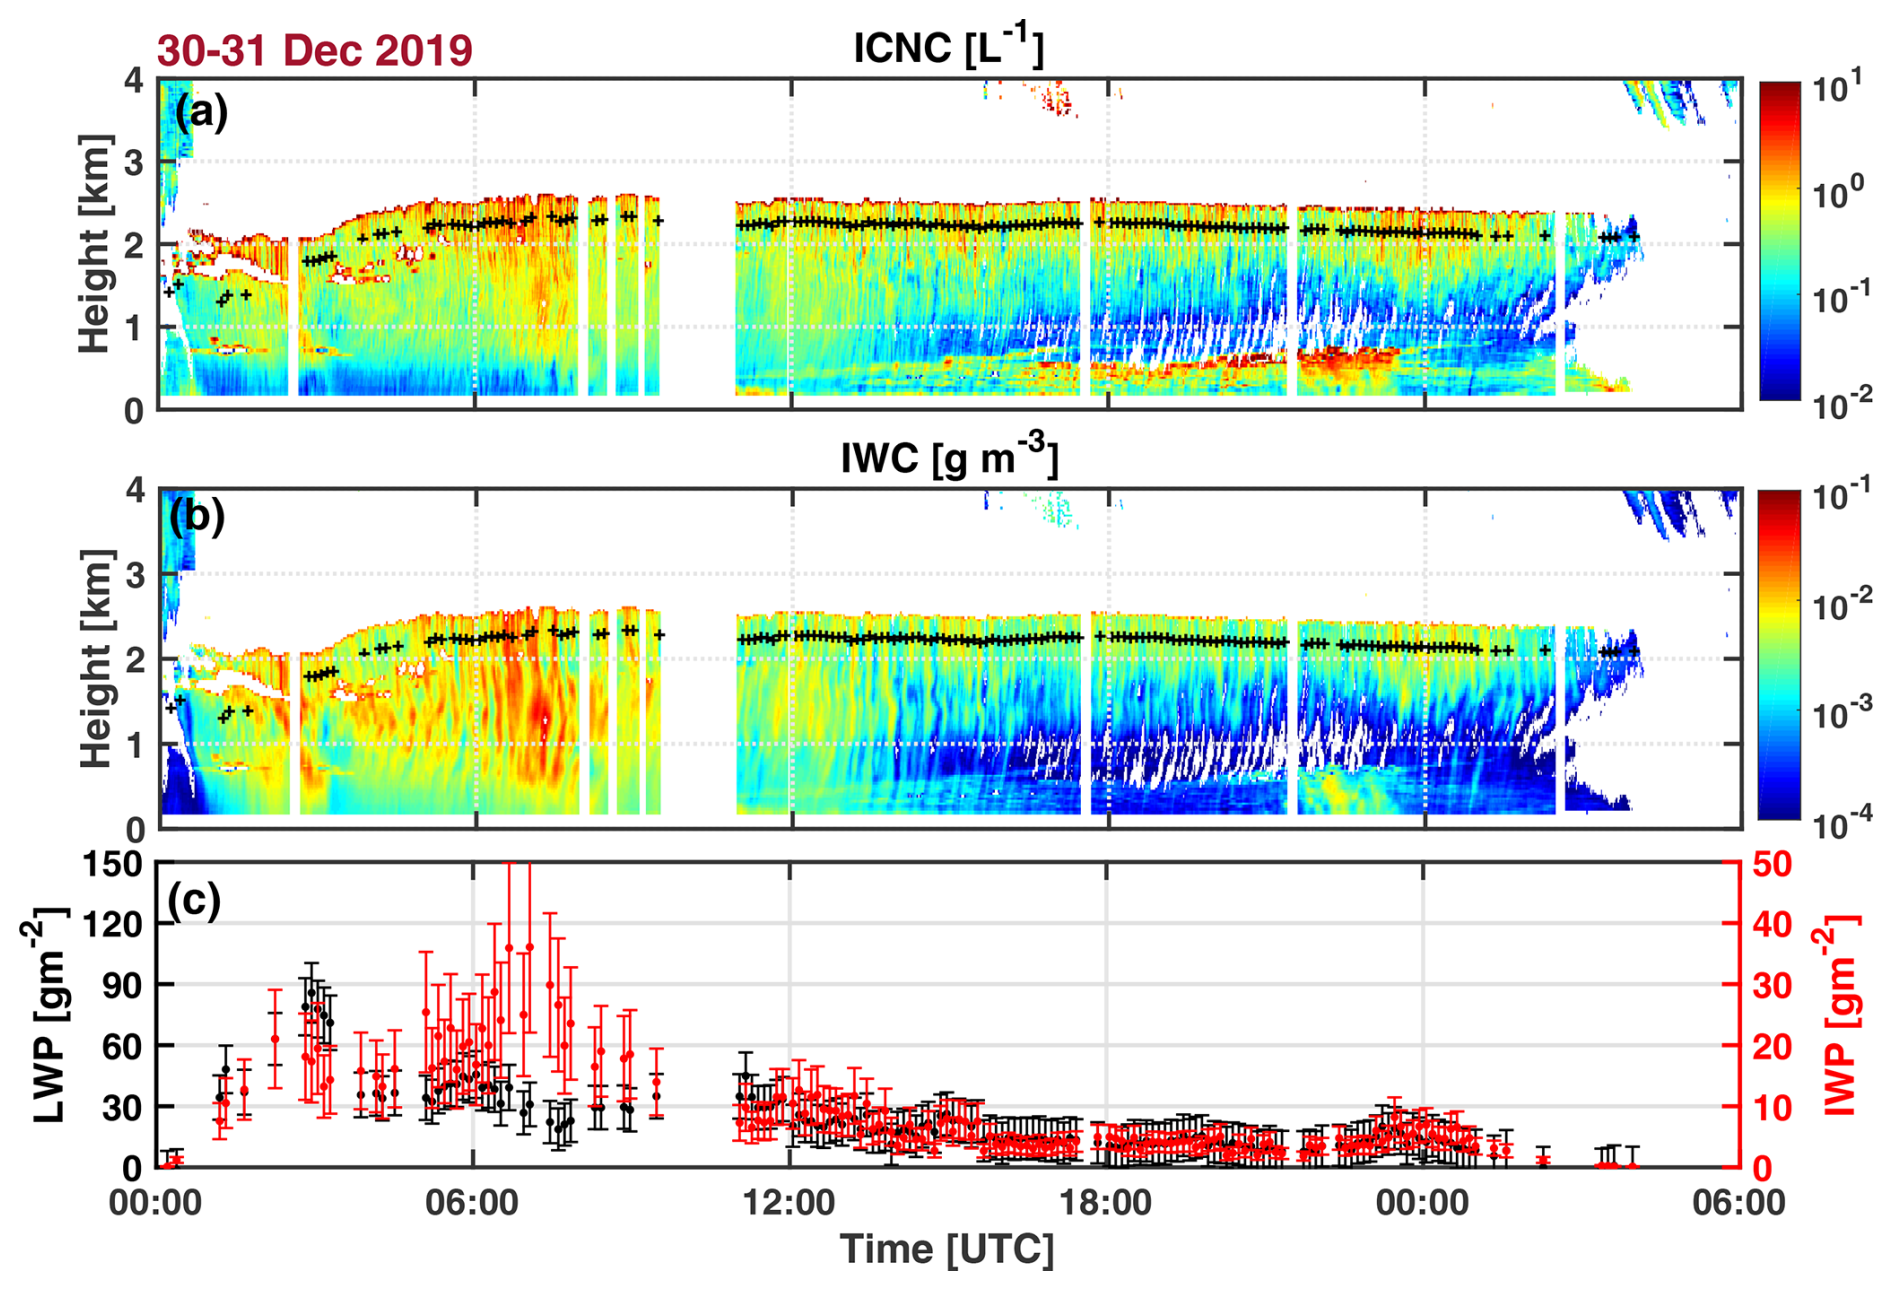
Figure 5Evolution of the MPC observed on 30–31 December 2019 in terms of (a) the ice crystal number concentration (ICNC), (b) the ice water content (IWC), and (c) the liquid water path LWP (blue) and ice water path IWP (red). Error bars show the uncertainty in the retrieved LWP and IWP values. White vertical columns indicate periods without lidar data. The uppermost red rim of the data field in panel (a) is a bias and occurs at the base (sharp edge) of the liquid-dominated cloud layer. The black crosses indicate the height of 250 m below cloud base for which the time series of the ice-phase microphysical properties in Fig. 4 are shown.
According to the radar observations, the top height of the MPC was at about 3 km height. The ice crystals, which were nucleated at the top of the liquid-bearing cloud layer, grew and fell out of the MPC layer and formed large virgae. Because the radar is most sensitive to the ice crystals, which are distributed over the entire MPC height range from cloud top to the virga base height, the base of the liquid-dominated cloud layer remains undetected in the radar reflectivity height–time display in Fig. 4a. The black dots shown in Fig. 4a indicate the base of the liquid-containing layer of the MPC. This information is taken from the lidar observations.
The lidar precisely detects the base of the liquid-dominated cloud layer, given also as black dots in Fig. 4b. However, the lidar is usually unable to detect the top of this cloud layer because of strong attenuation of laser light by droplet scattering processes. As mentioned in Sect. 2.4, cloud top heights can be detected as long as the cloud optical depth COD ≤ 2.5. However, in most cases, COD > 5. The ice extinction coefficient in the ice virgae (at 532 nm wavelength, below the black dots in Fig. 4b) is obtained by multiplying the highly resolved backscatter coefficients with a typical ice crystal lidar ratio of 32 sr (see discussion in Ansmann et al., 2025a, b).
Figure 4c shows the observations of the lidar volume depolarization ratio. The depolarization ratio permits a clear separation of the droplet-dominated cloud layer and the ice crystal virga zone. The volume depolarization ratio is usually close to 0 at cloud base and monotonically increases towards 0.2 with increasing penetration of the laser pulse into the liquid-dominated cloud layer. In contrast, the volume depolarization ratio is 0.4–0.6 for ice crystal backscattering. In the lowest parts of the virgae, where ice crystals sublimate, the impact of clear-air depolarization, causing depolarization ratios around 0.01, steadily increases such that the volume depolarization ratio decreases towards the respective clear-air value.
When zooming into the virga zone in Fig. 4a to c, singular, individual virgae show pronounced backscattering and depolarization features and thus can easily be identified. The regularly occurring virga structures are the result of enhanced ice production during the updraft periods (Shupe et al., 2008). During upwind phases, the conditions for both CCN activation and droplet growth as well as ice nucleation and crystal growth are most favorable, while during downdraft periods, only ice crystal growth (Wegener–Bergeron–Findeisen (WBF) mechanism) (Korolev, 2007) and sedimentation continue to occur (Khain et al., 2022). We counted 30–35 individual virga structures within 6 h intervals (12:00–18:00, 18:00–24:00 UTC on 30 December 2019), i.e., updrafts occurred every 10–12 min. These structures are also visible in the respective height–time display of the cloud radar mean Doppler velocity (not shown). Cycles of updrafts and downdrafts, superimposed on particle fall velocities, are well resolved in the Doppler radar observations. An example is shown in Sect. 4.2.
Taking the radiosonde observations of the horizontal wind speed of about 5 m s−1 up to 4 km height into consideration, the updraft phases were horizontally separated by about 3 to 3.5 km from each other. Similar horizontal scales of the updraft–downdraft periods were observed by Shupe et al. (2008). Note that during the late-summer MPC event, observed on 21 September 2020 and discussed in Sect. 4.2, 40–60 virgae occurred within 6 h and point to horizontal separations of updraft zones by only 1.8–2.2 km. Horizontal wind velocities were again around 5 m s−1. The difference between the winter and late-summer observations may be related to different meteorological and cloud optical properties that determine the strength of cloud top cooling and thus the updraft and downdraft characteristics. After formation of the MPC deck, the cloud top temperature decreased by 5 K on 30 December 2019 and by 2 K on 21 September 2020.
In Fig. 4d to g, the retrieval products for both the liquid and the ice phase are given. The liquid-phase values were obtained from the dual-FOV lidar observations around 75 m above cloud base (see the sketch in Fig. 1), and the ice extinction coefficient and the microphysical properties for the ice phase were retrieved from the combined lidar-radar observations around 250 m below the base of the droplet-dominated cloud layer. The results in Fig. 4 show that the main phases of the entire life cycle of the MPC system were well resolved. We are aware of the fact that caution has to be exercised in studies of cloud life cycles (Lagrangian perspective) by analyzing Eulerian measurements (measurements at a fixed location; Fridlind and Ackerman, 2018; Grabowski, 2020; Khain et al., 2022). Three phases of the MPC evolution can be distinguished. During the initial time period with large-scale lofting until 08:00 UTC on 30 December 2019, the optical and microphysical properties (except the effective radius) of the liquid phase and the ice phase are quite variable. This variability is probably partly related to the potential impact of seeder-feeder effects. The radar observations in Fig. 4a show a strong virga field above the MPC until 07:00 UTC; hence, ice crystals could, in principle, enter the MPC from above (as ice seeds). This additional ice production may have caused the intensification of ice virga backscattering during the initial phase of the MPC lifetime. However, the top of the liquid-bearing cloud layer increased until 07:00 UTC as well. The increase in the top height is associated with a further decrease in the cloud top temperature and corresponding increase in the ice nucleation efficiency of INPs, resulting in increasingly strong ice crystal nucleation and overall ice production and thus intensification of virga structures. The ice crystal extinction coefficient increased as long as the cloud top height increased. Afterwards, the ice extinction coefficient decreased quickly until 08:00–09:00 UTC and then remained almost constant until 23:00 UTC.
The main and second phase of the life cycle (from about 08:00 to 23:00 UTC) was characterized by a stable liquid-dominated cloud deck, which controls the further evolution of the MPC system. The third and final phase of the MPC life cycle occurred after 23:00 UTC on 30–31 December 2019. The water vapor content of the advected air mass decreased and caused the dissolution of the cloud deck, as already mentioned above and shown in Fig. 3.
During the stable period, the liquid-phase and ice-phase extinction coefficients showed values around 10 and 0.1–0.2 km−1, respectively. The effective droplet radius slowly decreased from 8 to 5 µm, and the ice crystal effective radius was around 40 µm. LWC and IWC values were, on average, 0.05 and 0.003 g m−3, respectively. For the number concentrations, i.e., CDNC and ICNC, we obtained values from 30 to 150 cm−3 and between 0.5 and 1 L−1, respectively. In terms of LWC and IWC, the ice-phase fraction IWC (IWC + LWC) (Korolev et al., 2017) was thus about 0.06. In terms of the optical properties αliq and αice, the ice-phase fraction was 0.01–0.02. When using CDNC and ICNC, we end up with an ice-phase fraction on the order of 10−5 to 10−6. That means only a very small fraction of the droplets was involved in immersion freezing processes. INPs may have been entrained continuously from above and from below or advected with the main air flow. A depletion of the INP reservoir is not visible.
By using the observations of n50,dry (CCN proxy) at 3 km height in Fig. 2 for the period from 25 December 2019 to 12 January 2020 (around day of the year = 0), the CCN reservoir indicates particle number concentrations of 20–50 cm−3. The CDNC values of 30–150 cm−3 suggest that even smaller particles with a radius < 50 nm were activated to form liquid droplets. When assuming that 1 % of the CCN reservoir consisted of dust particles and that these dust particles defined the INP reservoir for immersion freezing, this INP reservoir contained activatable INPs on the order of 200–500 L−1. The most favorable INPs are the larger dust particles. According to Fig. 2, we estimated values of 20–50 L−1 for assuming a dust fraction of 7.5 %. For a dust fraction of 1 %, we obtained an INP reservoir of most favorable INPs of about 2.5–6.5 L−1. Most of the time, the retrieved ICNC values were 0.5–1 L−1. We hypothesize that the CCN and the INP reservoirs were continuously refilled by vertical transport processes from below and above the MPC layer and thus were always well filled.
The most surprising observation is the steady increase in the CDNC from values around 30 cm−3 at 11:00–11:30 UTC to values above 100 cm−3 at 19:00 UTC and, at the same time, the decrease in the effective droplet radius from 8 to 5 µm. This is surprising because the continuously occurring processes of ice growth by water vapor deposition, associated with the shrinking and evaporation of droplets, should lead to a reduction of the droplet number concentration together with a decrease in the effective droplet radius. Droplet–droplet collision and coalescence processes may cause a less strong reduction of the effective radius but contribute to a reduction of CDNC. The potential impact of riming processes on the CDNC and effective droplet radius is not discussed here. These processes seem to be unimportant at temperatures °C (Waitz et al., 2022).
It cannot be excluded that the observed changes in the CDNC and Re,liq numbers may be simply related to changing aerosol conditions; however, in our opinion, the observation of an increasing CDNC and, simultaneously, a decreasing effective droplet radius Re,liq with time is a clear sign that CCN activation occurred and persistently refilled the small droplet fraction and stabilized in this way the broad droplet size distribution. Our hypothesis of a strong role of droplet nucleation in the lifetime of MPCs is in line with the model results of Khain et al. (2022). Based on simulations with their 2D Lagrangian–Eulerian mixed-phase cloud model, Khain et al. (2022) also found that ice particles at concentrations < 1 L−1 do not affect the LWC in the liquid-dominated cloud top layer significantly. Cloud glaciation (via the WBF mechanism) is possible when ICNC exceeds 10 L−1, i.e., only when ICNC > 10 L−1 does the WBF process have a strong impact on the conversion of cloud liquid water to ice water. As can be seen in Fig. 4g, ICNC was mostly in the range of 0.3–1 L−1. A comparably weak WBF process and a correspondingly weak reduction of the relative humidity caused by water vapor deposition on ice crystals contribute to favorable conditions for CCN activation.
An interesting observation was made between 22:00 and 23:00 UTC in the lowest troposphere at heights below 700 m. The radar and the lidar detected reflection and depolarization features that pointed to the presence of ice crystals. The RHw profile of the radiosonde launched at 23:00 UTC showed high humidity values close to 100 % and temperatures of −24 °C. The formation of rather thin water clouds and subsequent immersion freezing and growth of ice crystals as well as strong growth of ice crystals falling into this ice-supersaturated layer from above may have been responsible for the observed ice crystal backscattering features.
As mentioned in the introduction, the parameterization of ice nucleation, i.e., here immersion freezing, is presently an important aspect in the discussion on how to consider ice nucleation in atmospheric models. Long-lasting MPC events as observed on 29–31 December 2019 are favorable cases to demonstrate (by using a large-eddy-simulation-informed MPC aerosol–cloud model) that a time-dependent ice nucleation mechanism paired with a large INP reservoir can sustain continuous ice crystal production for several hours (Knopf et al., 2023). The longevity of such clouds, sustaining both liquid and ice crystal formation over a long time period, is poorly represented across global climate models when using a time-independent approach to characterize INP activation. As outlined in Sect. 1, the underlying freezing parameterization defines the number of ice-nucleating particles (INPs) available for ice formation, termed the INP reservoir. A time-dependent freezing description yields a substantially greater INP reservoir than time-independent approaches and therefore greater ice formation over long time periods. The observed low ICNC values, pointing to low ice nucleation rates, and the obviously sufficiently large INP reservoir lead to the recommendation to use a time-dependent immersion freezing parameterization in MPC simulations.
Figure 5 finally presents height–time displays of ICNC (Fig. 5a) and IWC (Fig. 5b) together with time series of the liquid water path (LWP) and the ice water path (IWP) in Fig. 5c. The retrieval of LWP and IWP was described in Sect. 2.1 and 2.5, respectively. ICNC and IWC decreased with decreasing height in the virga zone during the stable phase of the life cycle after 12:00 UTC. This height dependence is the result of the sublimation of crystals. As long as the virgae do not reach the ground, the released water vapor and particles are available to be transported back into the cloud top layer and to act again as CCN and INPs. The IWP ranges from 10 to 35 g m−2 during the initial phase of the MPC observation (before 11:00 UTC) and was very constant for the rest of the MPC lifetime, with values around 5 g m−2. The LWP was < 35 g m−2 most of the time and around 15 g m−2 during the second and third phase of the MPC lifetime. In terms of LWP and IWC, the ice-phase fraction (IWP (IWP + LWP)) was thus on the order of 0.25, or 0.2 when considering a potential overestimation of the IWP by 20 % as discussed in Sect. 2.5.
The observed properties for this mid-winter MPC event agree well with respective findings obtained from airborne in situ measurements conducted in the framework of several Arctic aircraft campaigns in the spring seasons of 2004, 2007, 2008, and 2010 north and around Longyearbyen (78° N, 15° E), Svalbard, Norway, and Kiruna (68° N, 20° E), Sweden (Mioche et al., 2017). The MOSAiC December MPC showed slightly lower values compared to the airborne in situ spring observations. Numerically speaking, the springtime Arctic MPCs showed droplet extinction coefficients of 20 ± 10 km−1, a droplet effective radius around 7.5 µm, and LWC and CDNC values of 0.2 ± 0.1 g m−3 and 120 ± 60 cm−3, respectively. For the ice phase, Mioche et al. (2017) found extinction coefficients of about 0.4 ± 0.3 km−1, an effective ice crystal radius of 50 ± 25 µm, an IWC of 0.03 ± 0.03 g m−3, and an ICNC of 3 ± 2 L−1.
The observations on 30–31 December 2019 also agree well with long-term lidar-radar observations over Leipzig from 2011 to 2015. Bühl et al. (2016) shows the LWP, IWC, and ice phase ratio (IWC LWC) as a function of the MPC top temperature. At −30 °C, IWC ranged from 10−6 to kg m−3, LWP was on the order of 0.01 kg m−2 for MPCs with cloud top temperatures of −30 °C, and the respective ice phase ratio IWC LWC showed values around 0.03–0.05. During the stable phase of the MPC life cycle, we observed LWP of 0.015 kg m−2 on 30 December 2019, IWC of kg m−3, and thus an IWC LWC ratio from 0.003 to 0.06.
4.2 21 September 2020 MPC case study
In this section, we discuss the temporal evolution of a long-lasting late-summer MPC event that was observed near the North Pole on 21 September 2020. Polarstern was drifting within an ice field at 88.5° N. The results for this case are given in Figs. 6–8. Similar to the air mass transport on 29–31 December 2020, the free tropospheric air mass, in which the MPC developed, crossed areas mainly north of 60° N (Northern Canada, Iceland region) during the last 10 d before arriving over Polarstern. In contrast to the December 2019 case study, the cloud top temperatures were around −22.5 to −23.5 °C (at 3.3–3.4 km height) according to the radiosondes launched at 11:00 and 17:00 UTC on 21 September 2020. The cloud layer was thus warmer by 8–10 K than the one in December 2019. A drop by 2 K at 3.3 km height from 05:00 UTC (cloudless conditions) to 11:00 UTC was observed due to radiative cooling of the liquid-dominated cloud top region. Anthropogenic pollution and wildfire smoke from Siberia and North America had advected into the central Arctic since mid-July 2020 (Boyer et al., 2023; Heutte et al., 2025; Ansmann et al., 2023). It is reasonable to assume that, in addition, soil dust and mineral dust, probably predominantly from nordic sources (e.g., from Iceland), and biological aerosol particles (locally produced or advected from the surrounding continents) contributed to the Arctic aerosol mixture. The observed CDNC values of > 100 cm−3 reflect the polluted conditions.
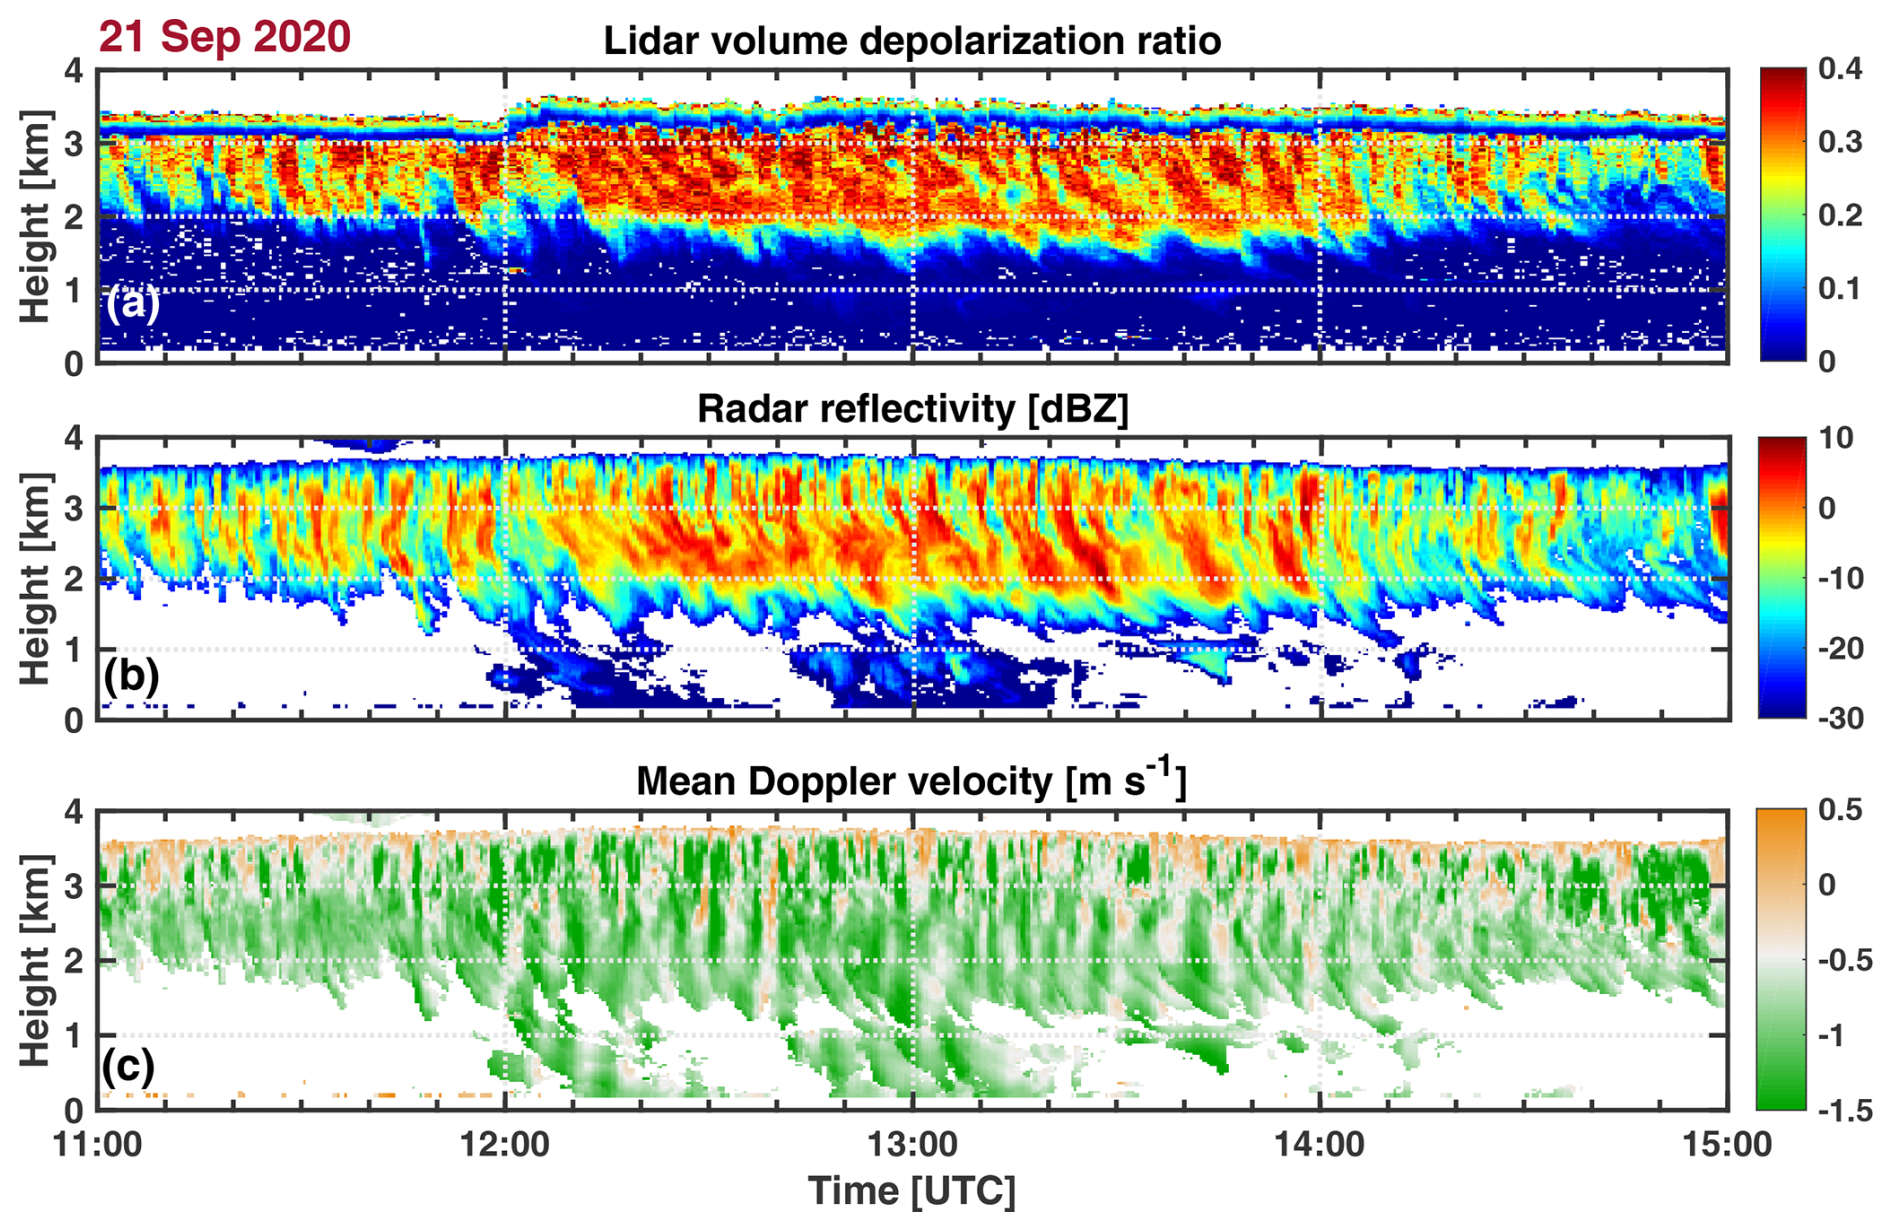
Figure 6Perturbations of the MPC development on 21 September 2020 at 12:00 UTC, visible in the lidar observations of the volume depolarization ratio in panel (a) at heights of 3–3.5 km. In panel (b), the cloud radar reflectivity Z is shown, and in panel (c), the mean Doppler velocity derived from the Doppler radar observations is presented. The gray to orange colors in panel (c) may indicate upwind areas when taking an average ice crystal sedimentation speed of 50 cm s−1 into account.
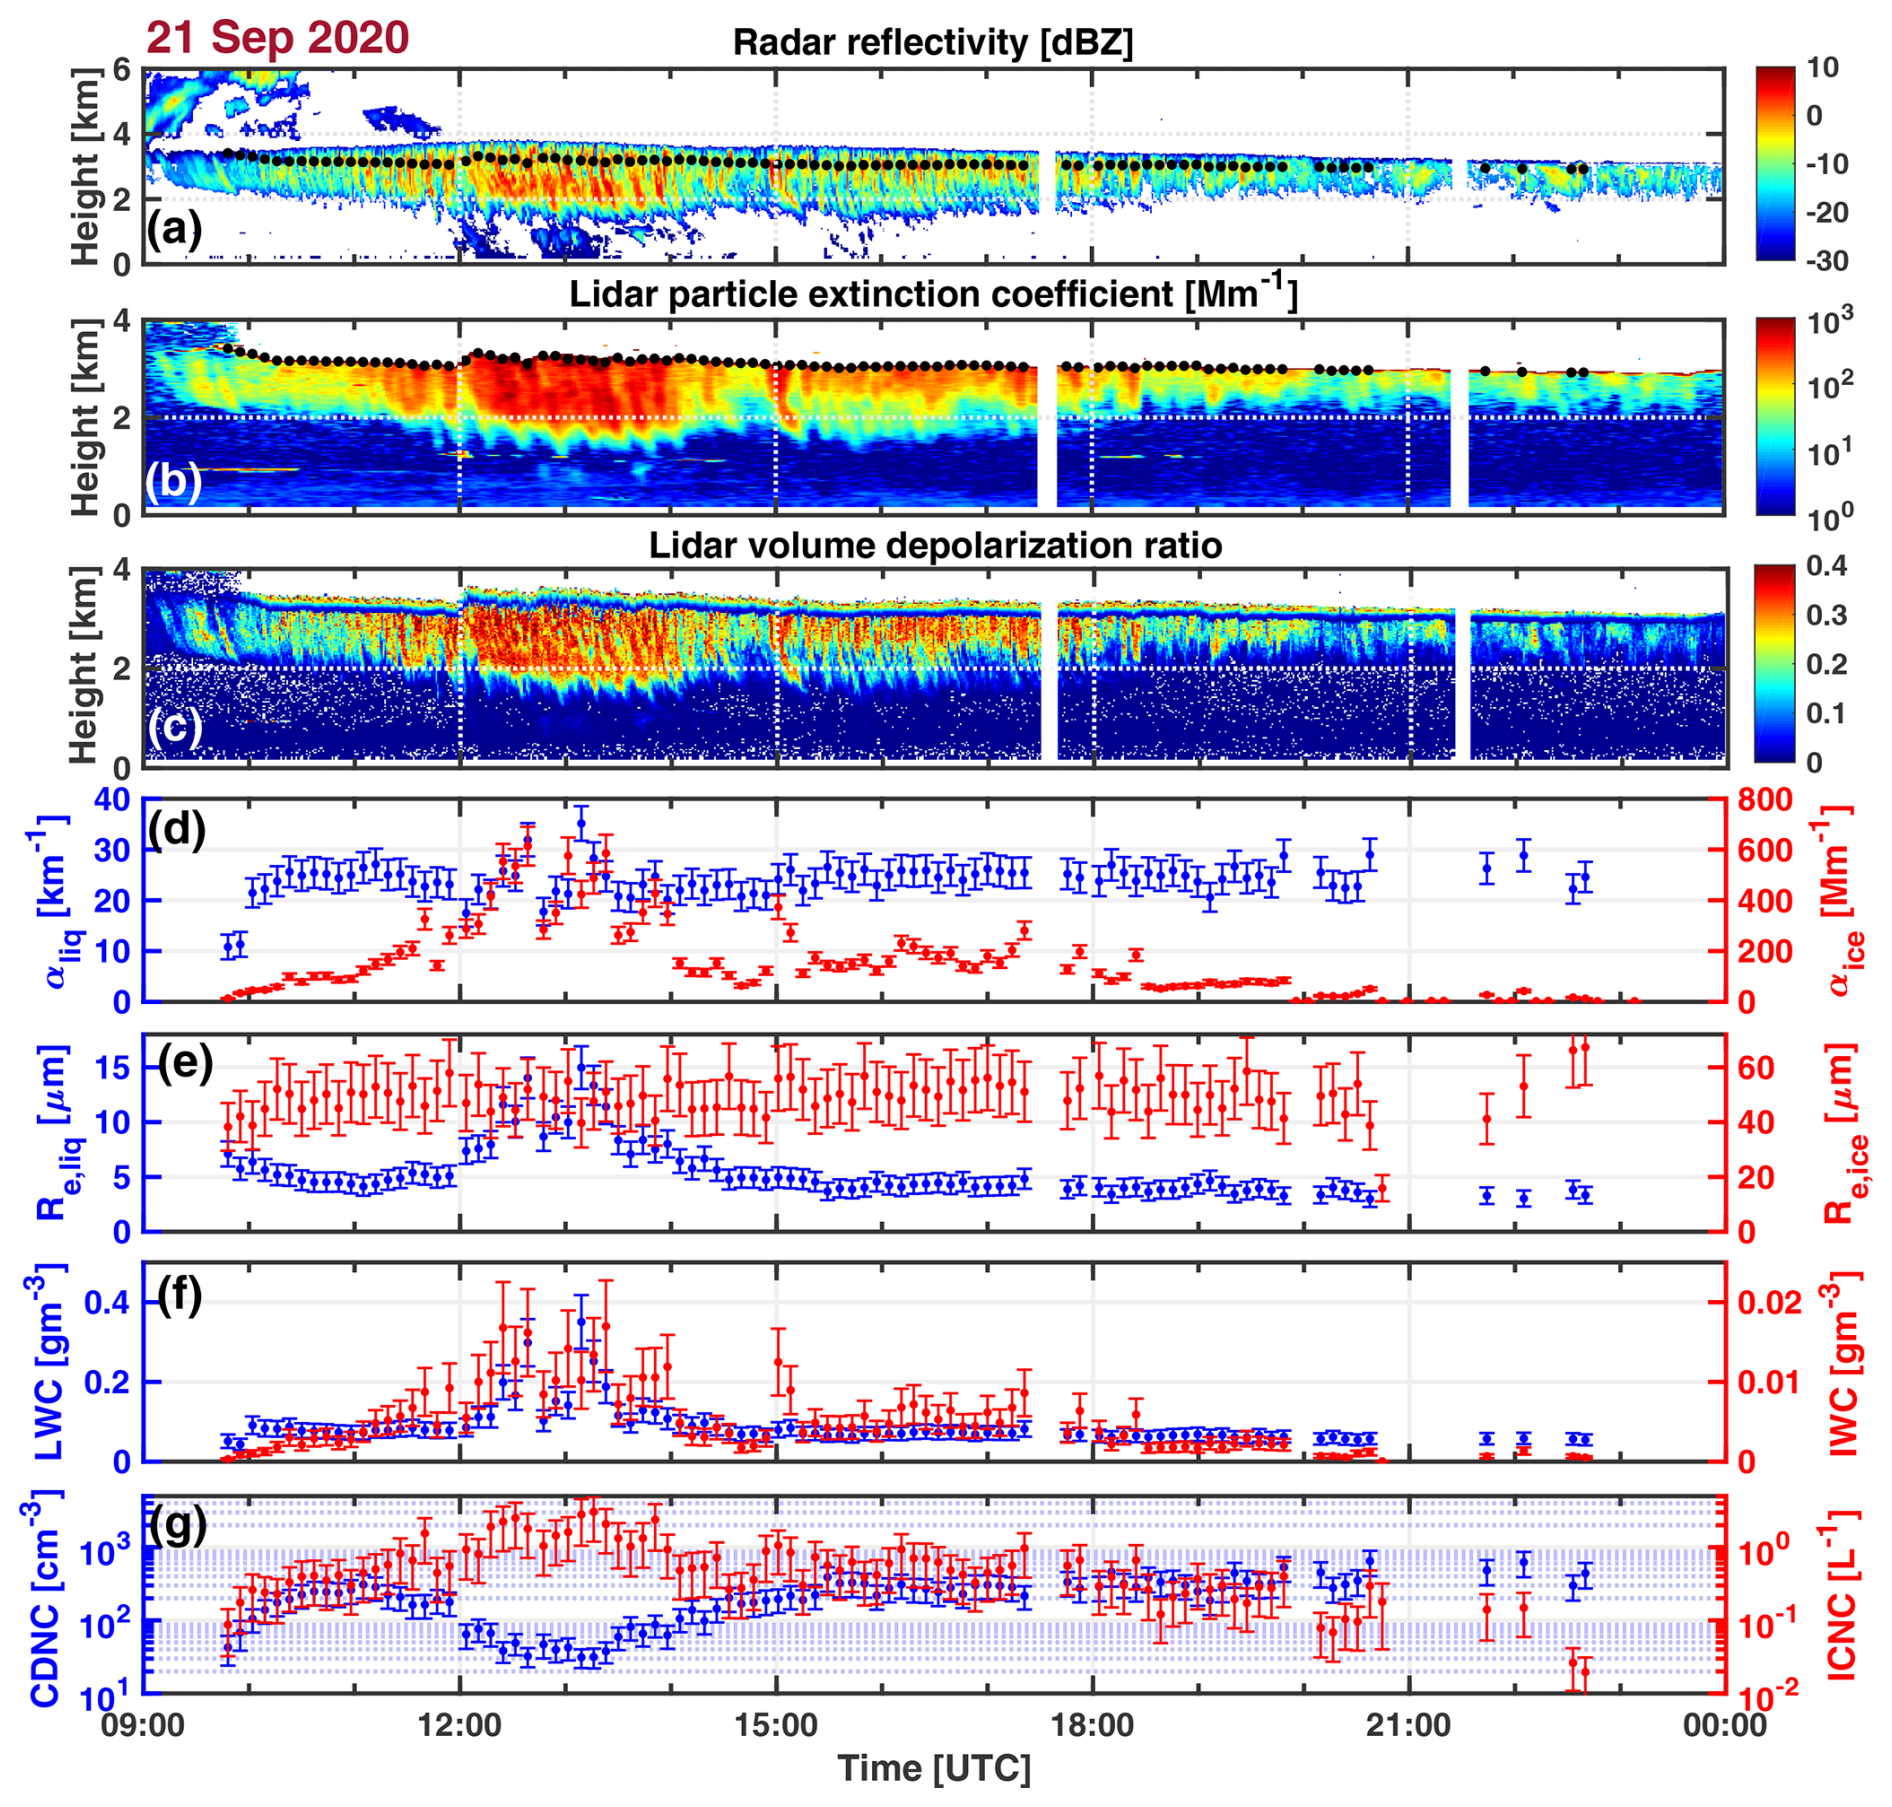
Figure 7Same as Fig. 4 but for a late-summer MPC event observed on 21 September 2020. Polarstern was at 88.5° N. Black dots in panels (a) and (b) show the base of the liquid-dominated cloud layer. A strong perturbation of the MPC evolution occurred at 12:00 UTC.
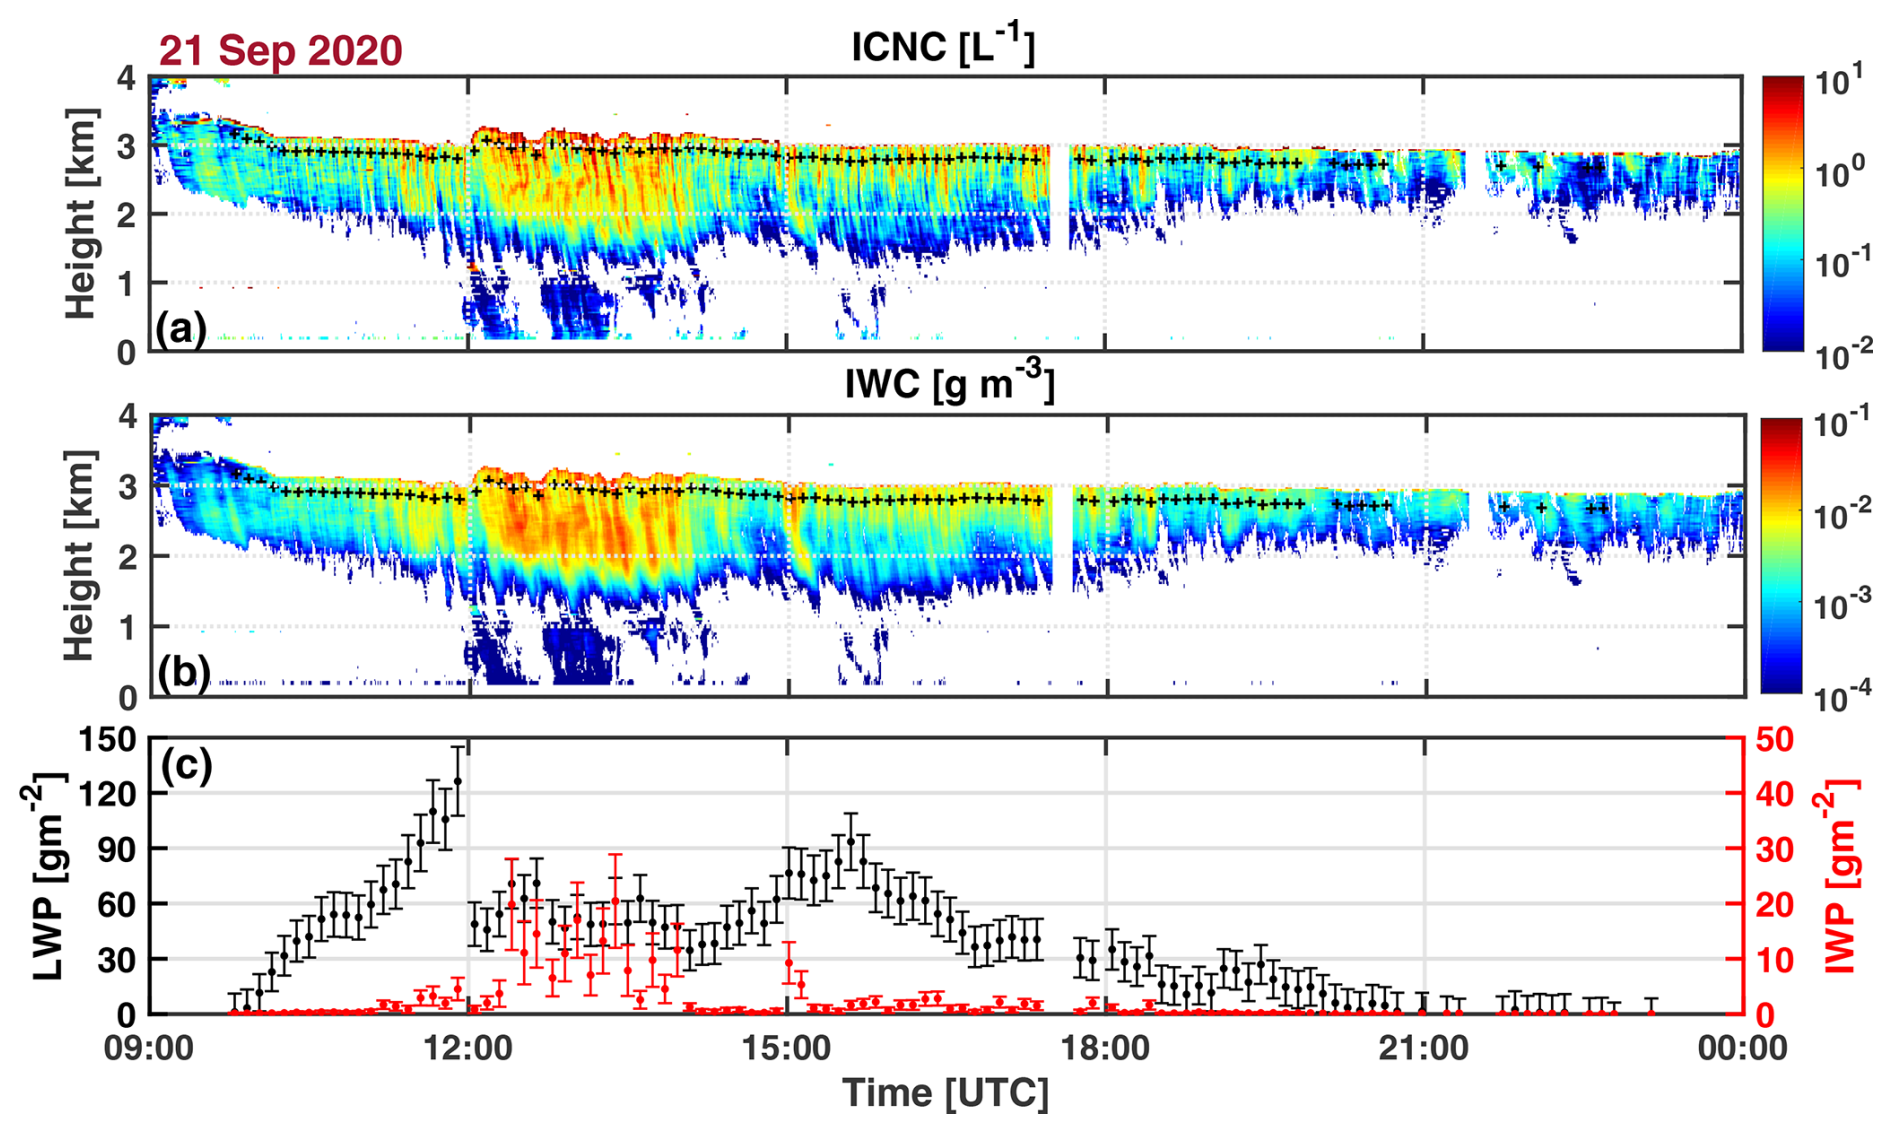
Figure 8Same as Fig. 5 but for 21 September 2020. After a continuous increase in the LWP from 10:00 to 12:00 UTC, a strong drop of the LWP occurred at 12:00 UTC (c), when the strong noontime cloud perturbation occurred.
A strong perturbation of the cloud evolution occurred at 12:00 UTC. This noon event is highlighted in Fig. 6. The reason for the perturbation, which influenced the further development of the MPC system for hours, is unknown and will not be discussed here. The base height of the liquid-bearing cloud layer was lofted by 150–200 m within a few minutes at 12:00 UTC, as can be seen in Fig. 6a. The 12:00 UTC perturbation obviously triggered an intensification of ice production and broadened the virga structures. A significantly stronger backscattering by ice crystals in the virga zone was detected after 12:10 UTC in the lidar data and after 12:20 UTC in the radar data. The virga activity became weaker again after 14:00 UTC.
The strong perturbation at 12:00 UTC is not directly visible in the cloud reflectivity and Doppler velocity height–time displays in Fig. 6b and c. The radar reflectivity Z increased in the virga zone below 3 km height after 12:20 UTC. The delay can be explained by ice crystal sedimentation with crystal falling speeds of 20–60 cm s−1. If ice nucleation occurs at the top of the approximately 300 m thick liquid-bearing cloud layer, it takes about 10–20 min before the nucleated and steadily growing ice crystals reach the cloud base and influence the virga structures below the main cloud deck, as seen by the radar.
In Fig. 6c, many updraft and downdraft phases are visible in the height–time display of the mean Doppler velocity. The high frequency of occurrence of virga structures in Fig. 6b between 12:20 and 14:10 UTC is well reflected in the frequency-of-occurrence of periods with Doppler velocities m s−1 in Fig. 6c. Strong downdraft motion together with crystal sedimentation often caused Doppler velocities m s−1. The color scale is adjusted such that Doppler velocities m s−1 may already indicate updraft periods, assuming a mean ice crystal fall speed of about 0.5 m s−1.
Figure 7 presents an overview of the entire 21 September MPC observation in terms of the liquid-phase and ice-phase products. The 12:00 UTC perturbation triggered strong ice nucleation in the liquid-dominated cloud layer. Cooling of the ascending air parcels obviously significantly increased the ice nucleating efficiency of the INPs. The freshly formed ice crystals grew fast and fell out of the liquid-containing cloud deck and caused the observed strong virga activity after 12:10 UTC. The ICNC in the virga zone at 250 m below the base of the liquid-bearing cloud layer increased from values of 0.5–1 L−1 before 12:00 UTC to 2–3 L−1 shortly after 12:00 UTC. The respective ice extinction coefficient increased from 200 to 500–600 Mm−1. Accordingly, the IWC also increased after the perturbation.
The CDNC dropped strongly from 180–200 cm−3 before the perturbation at 12:00 UTC to 60–80 cm−3 after 12:00 UTC within a few minutes. The CDNC further decreased to values of 30 cm−3 at 13:00 UTC and was thus almost an order of magnitude lower than the number concentration before 12:00 UTC. The most reasonable explanation for this strong reduction of the droplet number concentration is ice formation at the expense of the liquid water droplets via the WBF mechanism. It is less likely that enhanced turbulence caused by the perturbation initiated strong droplet collision and coagulation processes and thus a respectively strong reduction of the droplet population. However, besides ice production, an increase in the LWC was also observed. During the lofting event, condensational growth of the remaining droplets most likely occurred. This hypothesis is in line with the increase in the effective droplet radius from values close to 5 µm before 12:00 UTC to 7 µm after 12:00 UTC and even to values > 10 µm later on. The strong variability of the extinction coefficients, CDNC, ICNC, IWC, and LWC points to quite unstable conditions for more than 2 h after the perturbation at 12:00 UTC.
It is noteworthy to mention that the effective radius of the ice crystals was quite constant from 10:00 to 21:00 UTC, with values around 50 µm. We may conclude that the crystals grew by about 0.1 µm s−1 (in diameter) during the roughly 1000 s long sedimentation period from cloud top to 250 m below the base of the liquid-bearing cloud layer, assuming a crystal sedimentation speed around 0.5 m s−1 and the absence of significant collision and aggregation processes. This growth rate is in good agreement with the laboratory studies of Bailey and Hallett (2012).
An impressive observation is the recovery of the CDNC during the afternoon hours. The CDNC dropped from maximum values of 200–300 cm−3 at 11:00 UTC to values around 30 cm−3 at about 13:00 UTC and then recovered within 2.5 h, indicated by values of 200–400 cm−3 after 15:30 UTC. For the effective droplet radius, we found values of 5 µm at 11:00 UTC, maximum values close to 15 µm at about 13:00 UTC, and then values again around or just below 5 µm at 16:00 UTC. These strong and coherent changes in the CDNC and Re,liq from 13:00 to 16:00 UTC can only consistently be explained when taking strong CCN activation into consideration.
After 16:00 UTC, i.e., after the complete disappearance of all perturbation effects and the establishment of a new, stable equilibrium, the ice extinction coefficients showed values around 0.1–0.15 km−1, and the ice crystal effective radius was around 50 µm. The LWC and IWC values were about 0.08–0.1 and 0.003–0.005 g m−3, respectively. For the number concentrations, i.e., CDNC and ICNC, the values ranged mostly from 200 to 300 cm−3 and between 0.1 and 1 L−1, respectively. In terms of LWC and IWC, the ice-phase fraction was thus about 0.04–0.05. By using the optical properties αliq and αice, the ice-phase fraction was 0.006. With CDNC and ICNC, we end up with an ice-phase fraction on the order of .
Compared to the December 2019 MPC case with CDNC values of 30–150 cm−3, the CDNC values of 200–400 cm−3 on 21 September indicate roughly a factor of 3–5 larger reservoirs of CCN and INPs. The dissipation of the cloud deck close to 24:00 UTC was caused by a steady decrease in the relative humidity at heights around 3 km, as indicated by the MOSAiC radiosondes.
Figure 8 shows time series of LWP and IWP (in Fig. 8c), together with height–time displays of ICNC (Fig. 8a) and IWC (Fig. 8b). The LWP time series is widely a function of the MPC evolution above 3 km height. However, the monotonic increase in LWP from 60 to 120 g m−2 between 11:00 and 12:00 UTC was caused by another thin liquid cloud layer that developed between 850 and 1150 m according to the 12:00 UTC radiosonde observation, launched at 11:00 UTC. This lower cloud layer obviously disappeared when the 12:00 UTC perturbation occurred, and ice crystals at lower heights were detected (see Fig. 8a and b) after 12:00 UTC. Seeder-feeder effects at low heights and rapid liquid-to-ice conversion may have led to the removal of the lower liquid-containing cloud layer and therefore to the abrupt change in LWP from 120 g m−2 back to values around 60 g m−2 within a few minutes after 12:00 UTC.
After the phase with strong virga activity, i.e., after 14:00 UTC, the LWP increased again. The reason may be the reduced conversion of liquid water to ice. The last strong ice formation event, indicated by a pronounced virga, occurred around 15:00 UTC. After 16:00 UTC, the LWP started to monotonically decrease. The air mass became drier, and the MPC deck began to dissolve slowly but steadily.
LWP decreased from values as high as 90 g m−2 at 16:00 UTC to values around 30 g m−2 at 18:00 UTC. IWC, on the other hand, was already mostly < 10 g m−2 after the perturbation period ending at 14:00 UTC and remained low for the rest of the MPC lifetime. Accordingly, the ice-phase fraction was about 0.05 (at 16:00 UTC) and 0.15 (at 18:00 UTC) in terms of LWP and IWP. The precipitation signatures at heights below 1 km on 21 September show low ICNC values close to 0.01 L−1 and IWC values close to 0.0001 g m−3. This is the reason why these features remained undetected in the lidar observations shown in Fig. 6a.
Silber and Shupe (2022) analyzed 1362 RH profiles measured with MOSAiC radiosondes between 4 October 2019 and 19 September 2020. The authors found that 997 RH profiles (73 %) contained signatures of liquid-bearing cloud layers, and in 50 % of these profiles (37 % out of all radiosonde profiles), multi-layer cloud structures were found, i.e., liquid-bearing cloud layers from the surface up to the middle free troposphere.
Our continuous lidar observations on board Polarstern provide complementary information. In about 2630 h (31 %) out of the 8450 MOSAiC measurement hours from 4 October 2019 to 21 September 2020, near-surface low-level clouds and fog were observed. In the winter half-year (until 1 April 2020), 17 % out of all observations contained low-level cloud and fog features. During the summer half-year, the fraction increased to 46 %. Such a high low-cloud and fog occurrence frequency (at heights < 500 m) is typical for the Arctic in summer (Achtert et al., 2020; Griesche et al., 2024a). According to Achtert et al. (2020), the cloud occurrence frequency drops from values close to 50 % to 20 %–25 % for liquid-bearing clouds at heights > 500 m.
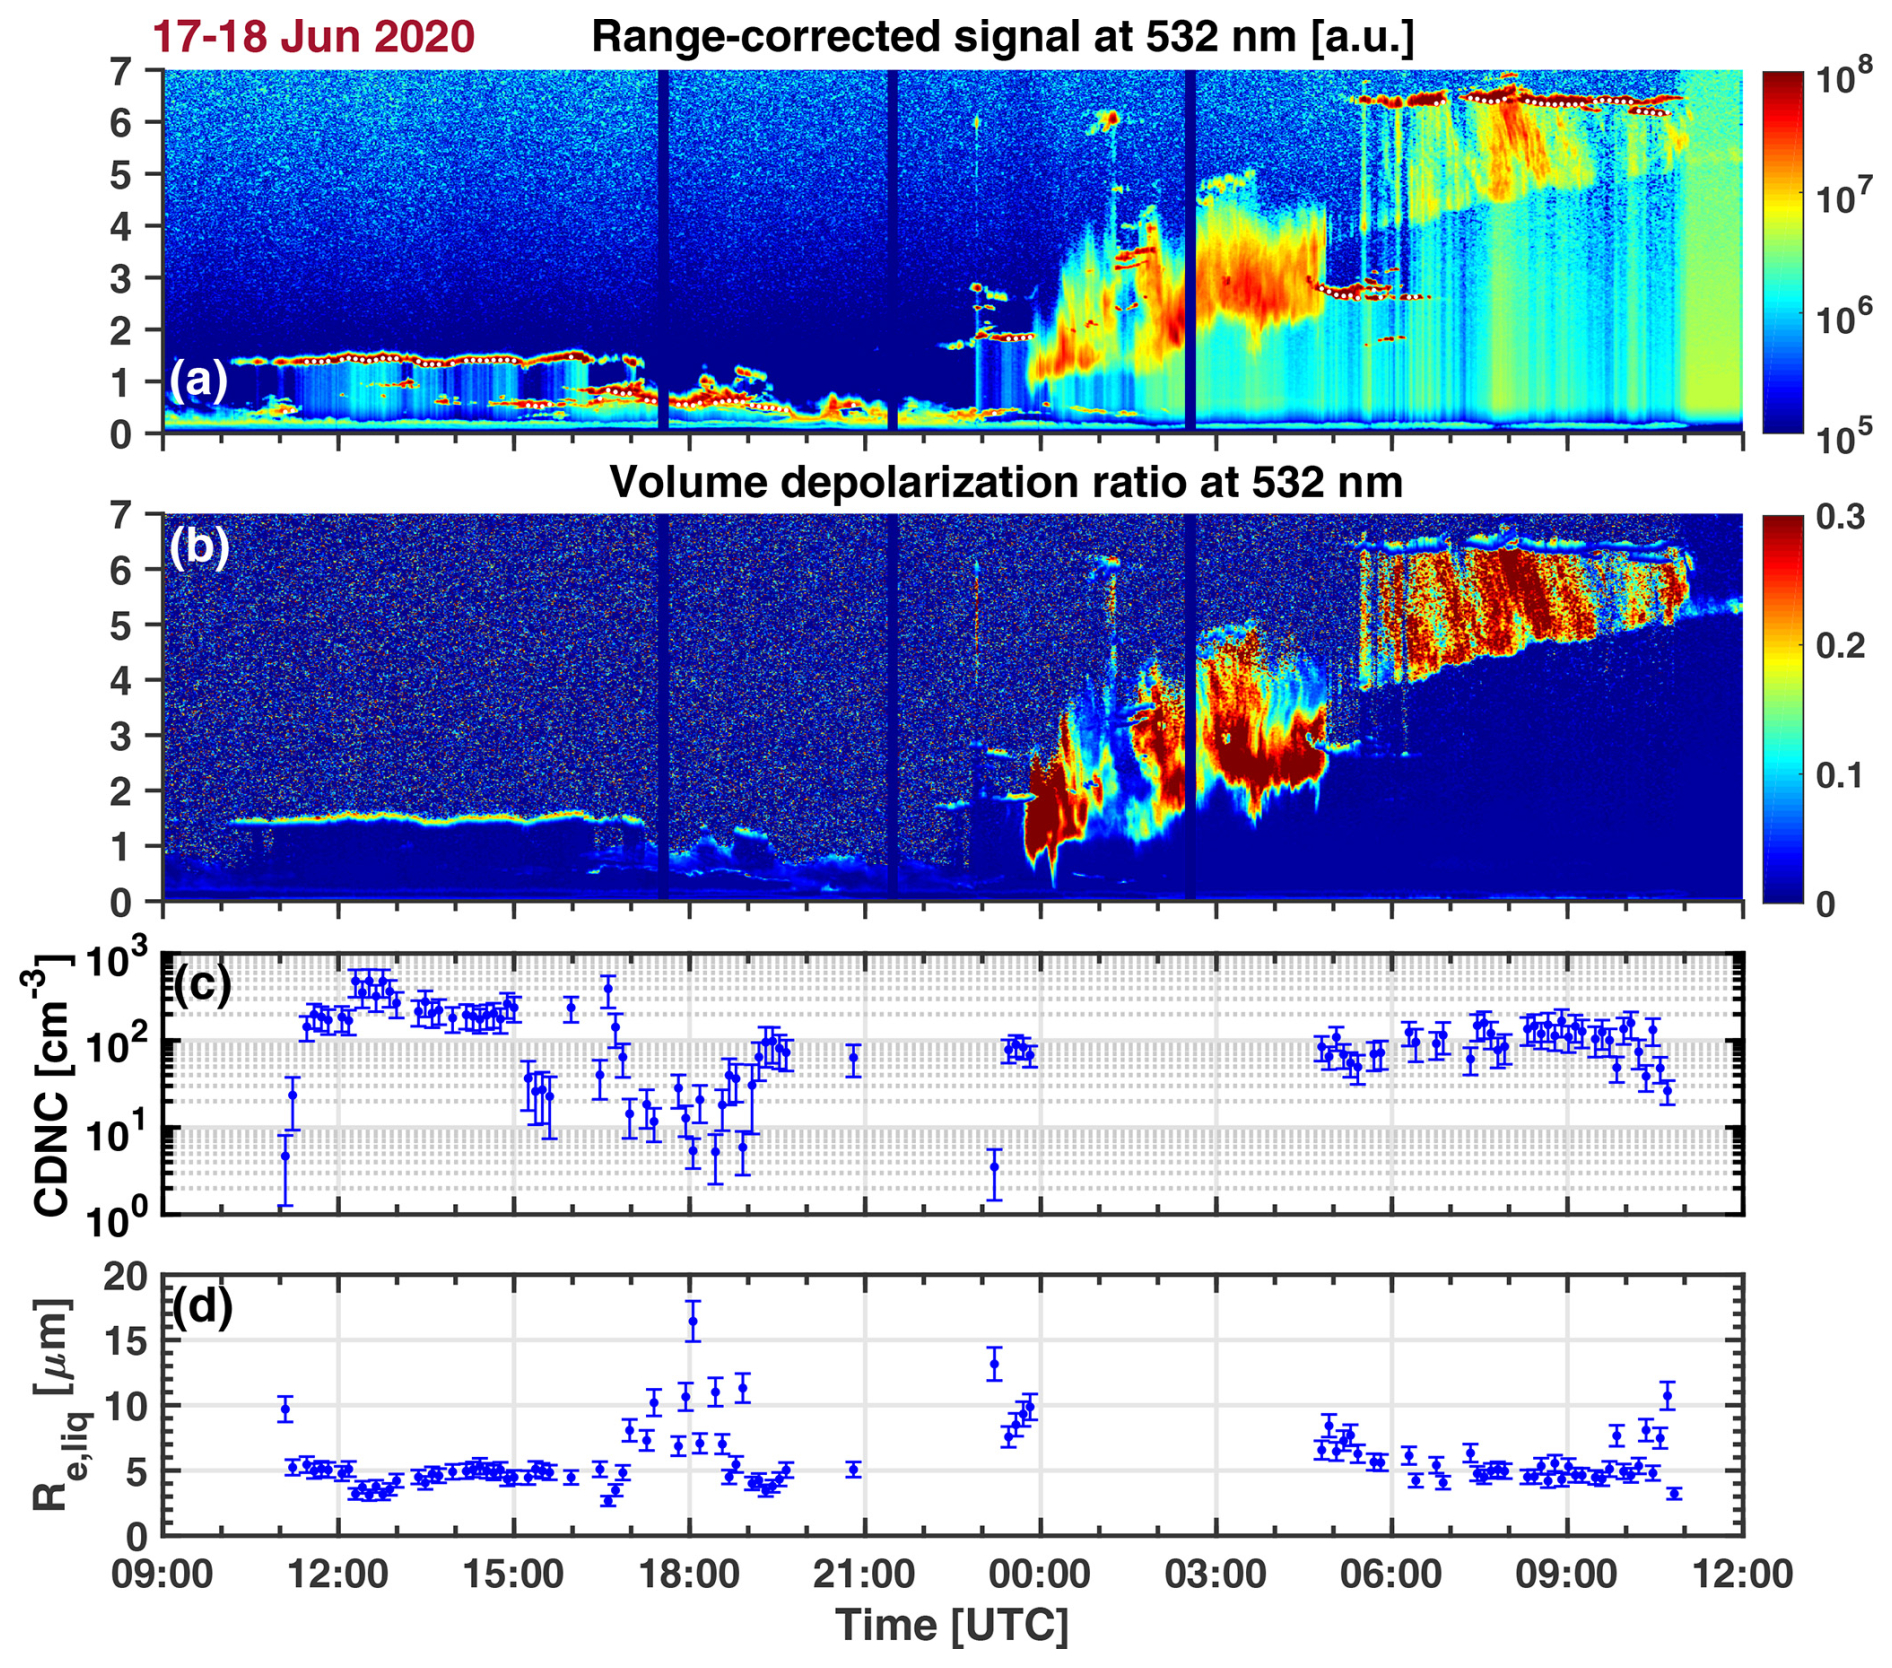
Figure 9Lidar observations of liquid water clouds (before 23:30 UTC of 17 June 2020) and MPCs with strong virga evolution on 18 June until 11:00 UTC. Range-corrected 532 nm backscatter signals and the volume depolarization ratio are shown in panels (a) and (b), respectively. White dots in panel (a) indicate the cloud base height of cloud segments for which the cloud droplet number concentration (CDNC) (c) and the effective droplet radius Re,liq (d) are derived from the dual-FOV polarization lidar observations. Error bars indicate the uncertainty in these products.
The cloud statistics presented here are based on lidar observations during the 5820 h without fog and low clouds. We analyzed 360 h of stratiform pure liquid and mixed-phase cloud observations. The observations during these 360 h fulfilled all signal quality criteria stated in Sect. 2.6. A measurement example with complex cloud formation between 500 m and 6.5 km height is shown in Fig. 9. Polarstern was at 82° N. Layered pure liquid (PL) clouds were detected at heights < 2 km, almost until midnight on 17 June 2020. In contrast, most of the clouds observed on 18 June 2020 were MPCs and developed at heights above 2 km. Strong and extended virga fields formed, as can be seen in Fig. 9b. All volume depolarization ratios on 18 June showed values around 0 at the base of the layered, liquid-bearing cloud decks and thus indicate that ice nucleation occurred in droplets via immersion freezing. The cloud systems were partly short-lived, with observation periods of less than an hour, but several cloud layers were present above Polarstern for many hours, e.g., on 17 June from 10:00–17:00 UTC at heights around 1.5 km with a cloud top temperature of −4 °C and on 18 June from 05:00 to 11:00 UTC at heights around 6.5 km with cloud top temperatures of about −32 °C. The 17–18 June observations were analyzed with the automated version of the dual-FOV lidar retrieval method. Results for the CDNC and droplet effective radius are shown in Fig. 9c and d, respectively. The long-lasting cloud layer on 17 June contained 200–400 droplets cm−3, whereas the cloud layers on 18 June at heights above 2 km showed a CDNC of 50–150 cm−3 only. The droplet effective radii accumulated around 5 µm.
About 190 h out of the 360 h of cloud observations were conducted during the pack ice drift from October 2019 to mid-May 2020 (pure liquid clouds, PL: 70 h, MPCs: 120 h), and 170 h of cloud observations were performed from mid-May to September 2020 (main summer season, PL clouds: 131 h, MPCs: 39 h). Figure 10 provides an overview of the temporal lengths of the 147 analyzed cloud events, i.e., of the time periods the individual clouds fields needed to cross Polarstern. The 147 cloud systems covered about 500 h, of which 360 h showed cloud signatures and 140 h covered the cloud-free gaps of < 1 h in the analyzed cloud fields. In about 50 % out of the 147 cloud events, we observed cloud layers (from the beginning to the end of the Polarstern crossing time) with temporal lengths of < 2 h. In about 30 % and 13 % of all analyzed cases, the cloud observation length was 2–5 and 5–10 h, respectively. Observations that lasted for more than 10 h corresponded to 7 % of the total 147 selected MOSAiC cloud events. Shupe et al. (2006) analyzed a 1-year cloud dataset of 284 identified Arctic liquid-bearing clouds measured between October 1997 and September 1998. They found cloud duration lengths of < 2, 2–5, and 5–10 h in 25 %, 20 %, and 20 %, respectively, of all cases.
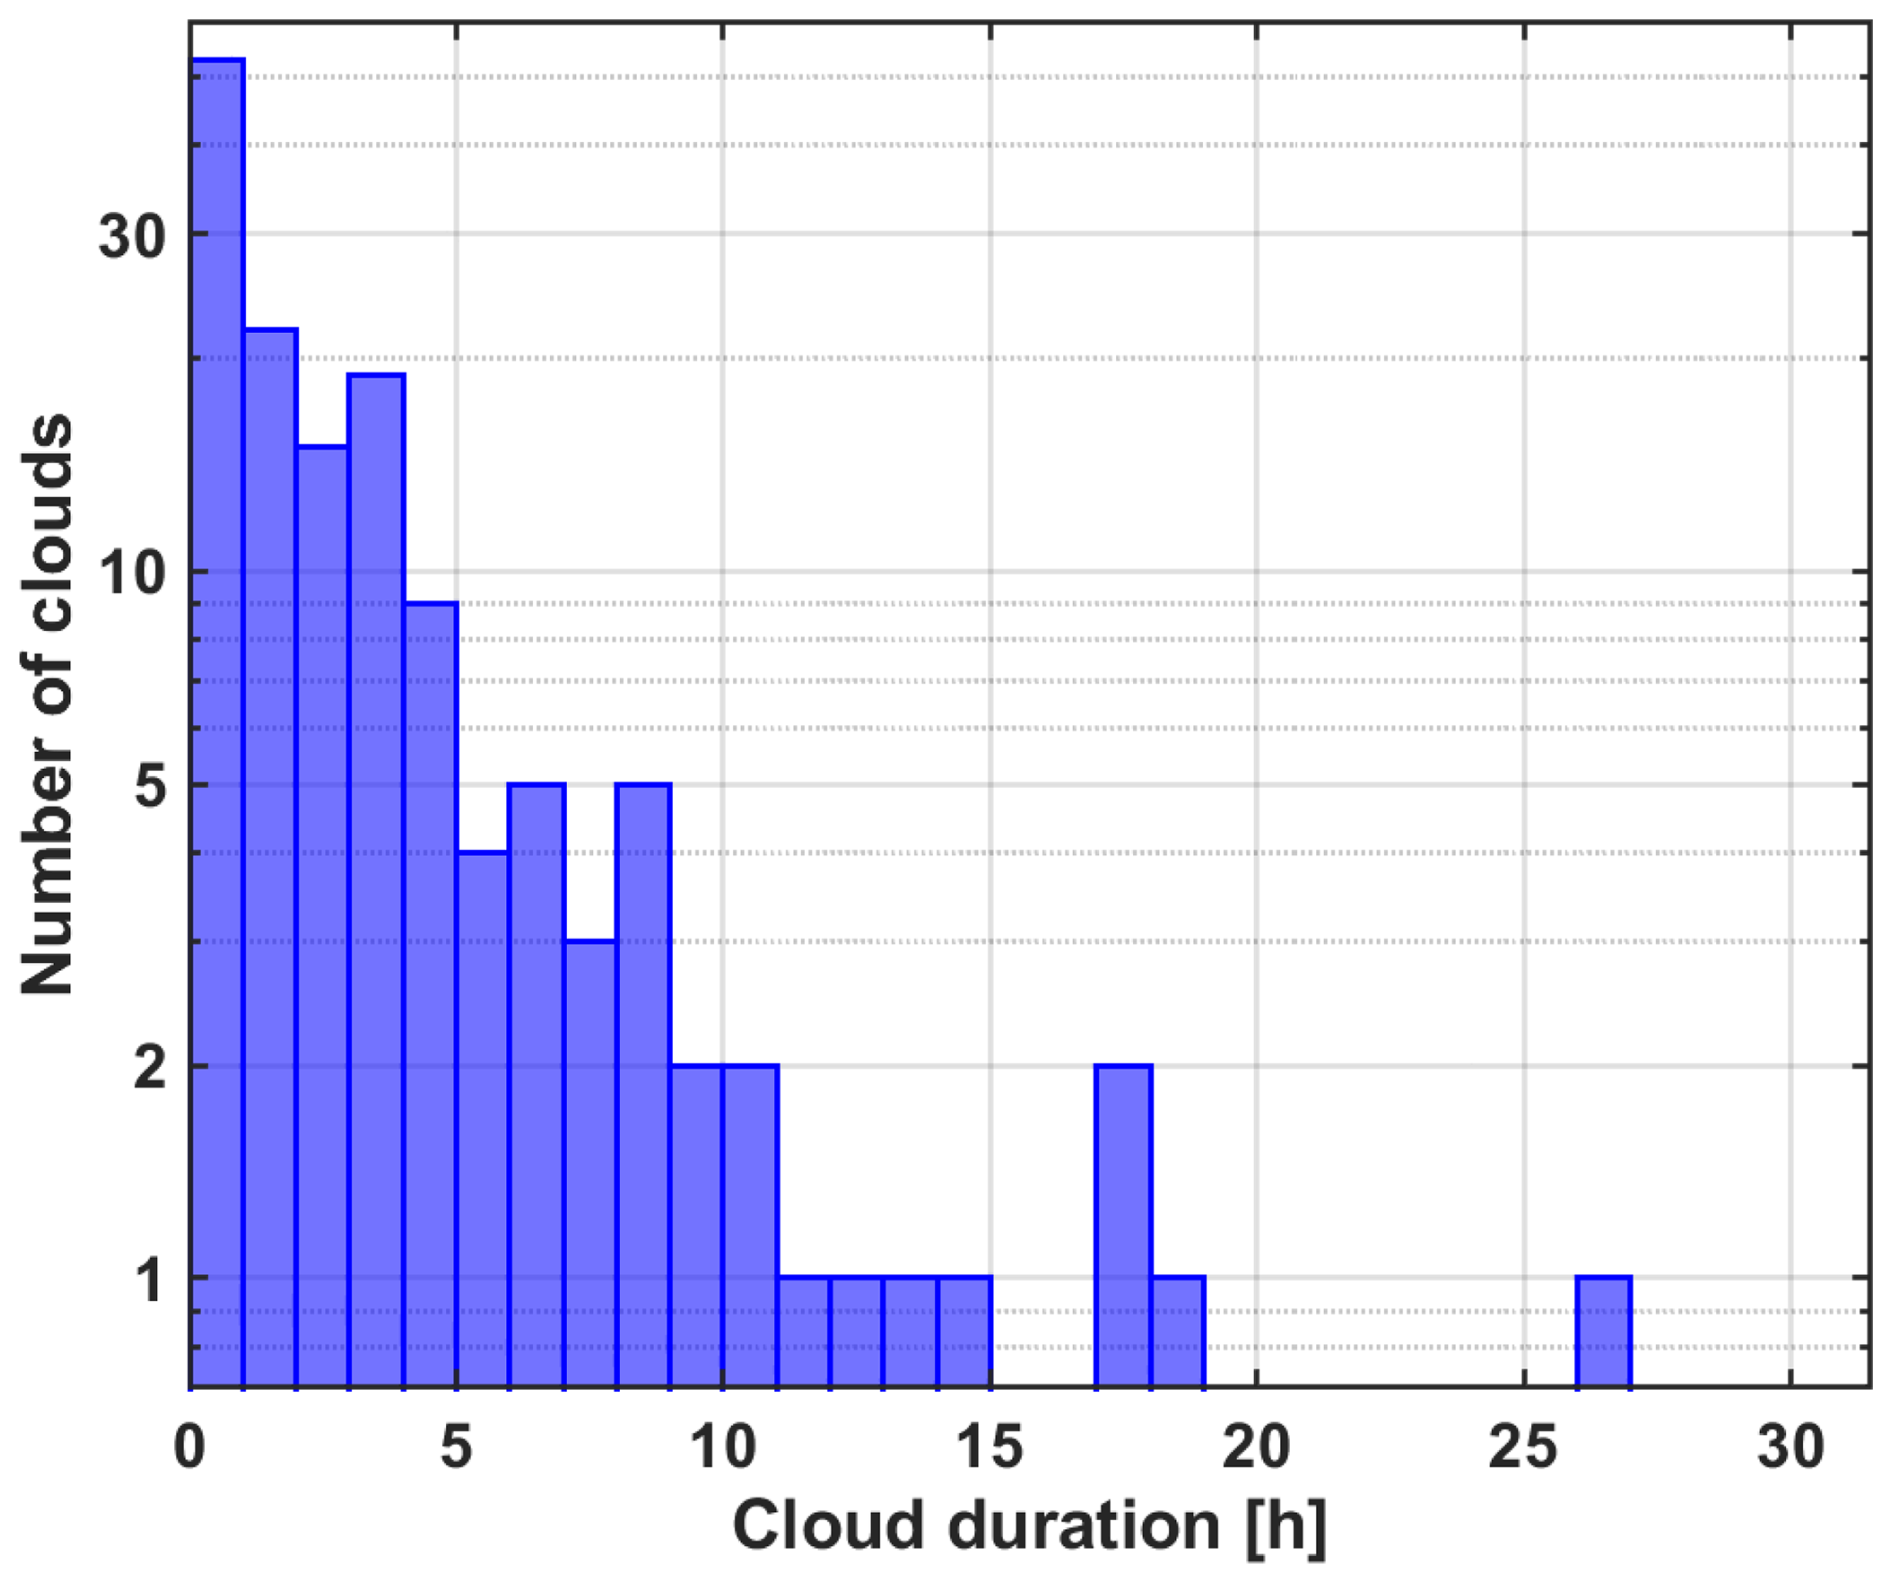
Figure 10Frequency distribution of individual, coherently observed cloud layers as a function of the time period needed by the cloud field to cross the Polarstern vessel. We analyzed 147 individual cloud fields, measured during the MOSAiC year from October 2019 to September 2020.
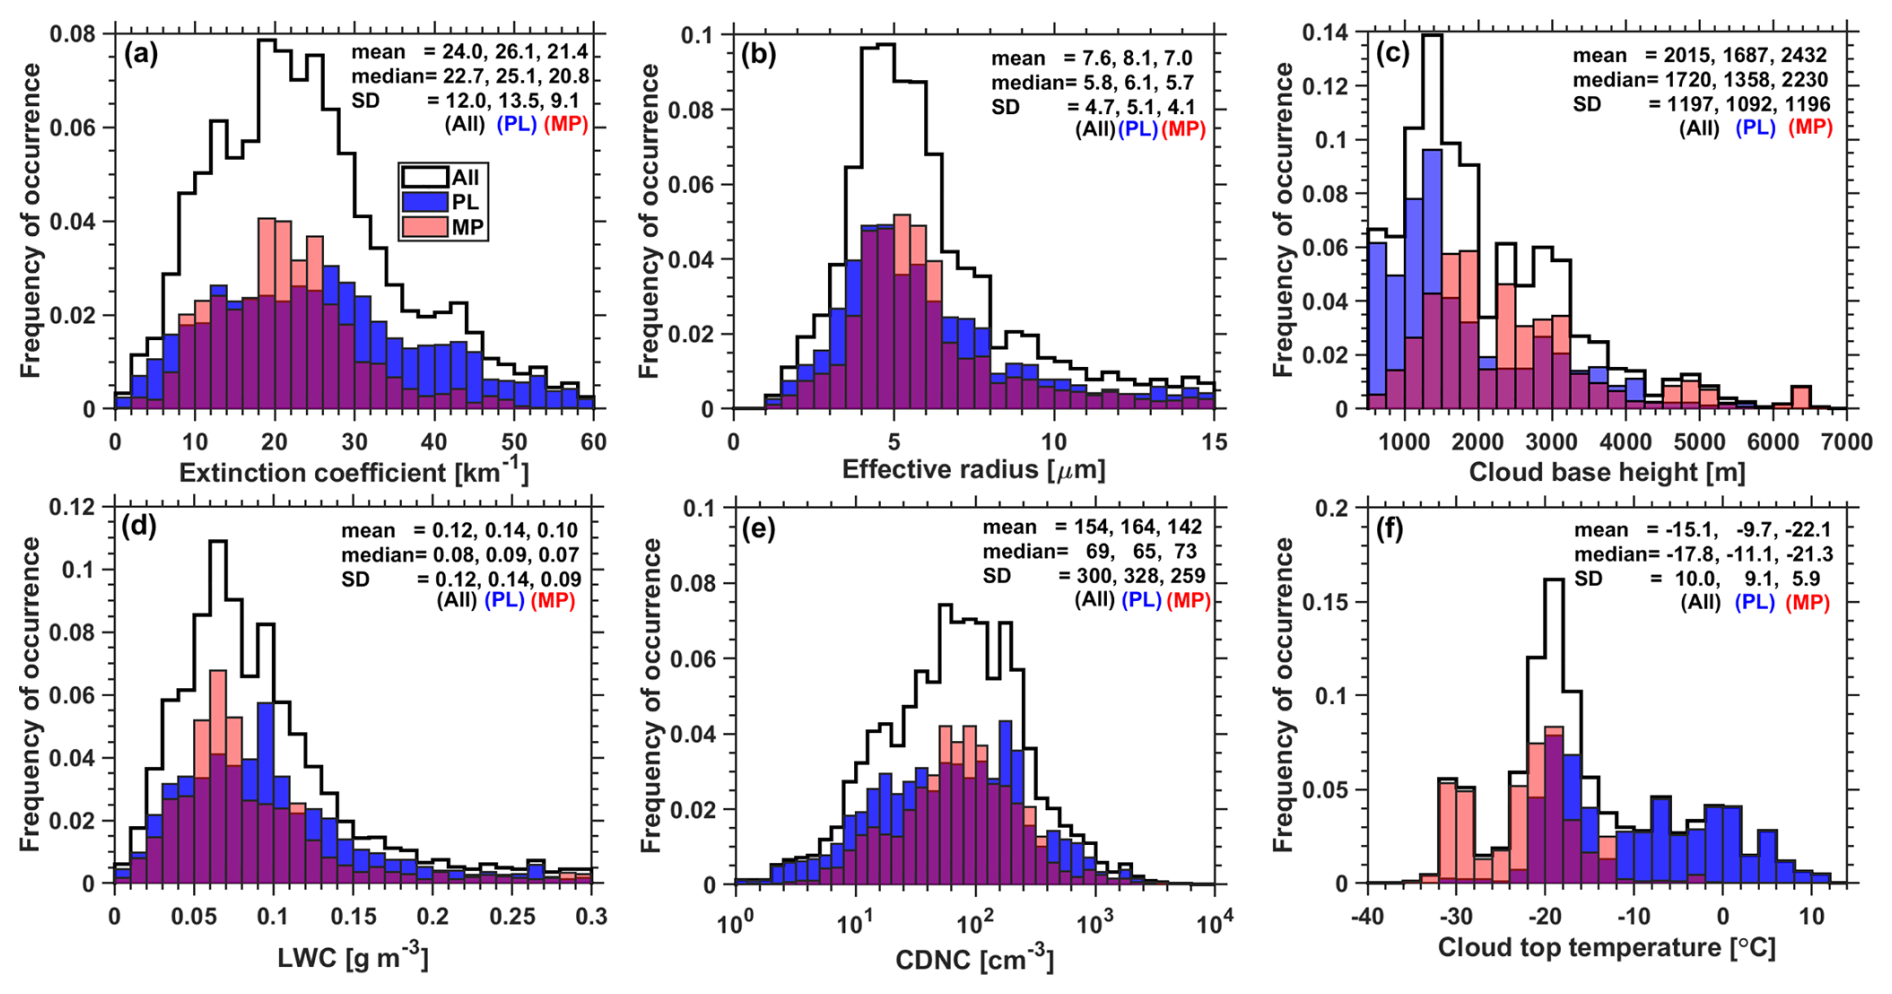
Figure 11MOSAiC pure liquid (PL, blue) and mixed-phase (MP, red) cloud statistics. The statistics cover the liquid phase of clouds with base height > 500 m in terms of (a) the droplet extinction coefficient, (b) effective droplet radius, (c) base height of the droplet-dominated cloud layer, (d) LWC, (e) CDNC, and (f) cloud top temperature. The normalization (to 1.0) is applied to all clouds (PL + MP, in black). Median, mean, and SD values are given as numbers. The thick black histogram lines are based on 3070 cloud datasets, the blue histograms (PL clouds) on 1721 datasets, and the red histograms (MP clouds) on 1349 datasets.
In Fig. 11a, b, d, and e, the statistical results for the liquid-phase-related optical and microphysical cloud properties are shown. The 3070 analyzed cloud profiles (based on 7 min signal averages) served as the basis of the analysis. In Fig. 11c and f, the statistical distributions of cloud base heights and estimated cloud top temperatures are shown. We distinguish between cloud events with ice virgae (MP, red histograms) and without ice virgae (PL, blue histograms). The black histogram lines consider all 3070 cloud profiles. The PL cloud fraction includes all cloud layers with top temperatures > 0 °C, at which ice nucleation is impossible, and clouds with top temperatures < 0 °C but no virga evolution. The microphysical properties of the PL clouds, such as LWC and the droplet extinction coefficient, are strong functions of cloud temperature, which determines the amount of water vapor that can be converted into cloud liquid water. The cloud extinction coefficient also depends on the availability of CCN. The red histograms show the characteristics of the liquid phase of mixed-phase clouds when all relevant ice-formation-related processes (ice nucleation, ice crystal growth, droplet evaporation, etc.), as described in the foregoing sections, also influence the cloud properties.
The histograms of the PL cloud properties in Fig. 11a, b, d, and e are all at least slightly broader, and some considerably broader than the respective frequency-of-occurrence distributions for MPCs. This is related to the broader temperature distribution for PL clouds (see Fig. 11f) compared to the respective temperature histogram for MPCs and the shift of the PL-related temperature histogram towards higher temperatures. Note that the temperature at cloud base, where CCN activation starts, is roughly 2–3 K higher than the temperature at cloud top (in Fig. 11f), where ice nucleation typically begins.
In Fig. 11a and b, the basic liquid-phase products, retrievable from the dual-FOV lidar observations, are shown. The black curve, considering all clouds, shows a broad maximum of the extinction coefficient histogram, with values from about 5 to about 45 km−1. The PL extinction distribution is much broader than the respective MPC extinction distribution. In the case of ice-containing clouds, the number of clouds with high droplet extinction coefficients > 35 km−1 is significantly lower than the respective numbers in the PL extinction histogram. The droplet extinction coefficients accumulated in the relatively narrow range from about 10 to 30 km−1, probably the result of the WBF process, causing the evaporation of droplets, in combination with CCN activation and new droplet formation.
The PL- and MPC-related histograms are not very different in the case of the droplet effective radius. According to the black (PL + MP) histogram in Fig. 11b, a pronounced maximum from 3 to 7 µm is found. Most PL clouds and MPCs have LWC values between 0.03 and 0.13 g m−3 (Fig. 11d). However, there is a pronounced right wing in the distribution in the case of PL clouds and even a shift of the MPC-related LWC distribution, compared to the PL-related distribution, towards smaller values. This distribution shift and the broad shape of the histogram reflect the impact of the cloud temperatures (see the distributions in Fig. 11f). A broad cloud temperature distribution is obtained with values from −22 to +12 °C in the case of PL cloud tops, whereas most cloud top temperatures are found between −16 and −32 °C in the case of MPCs. In the overlap region, the total number (PL + MP) of clouds shows a clear maximum around −20 °C.
The CDNC histograms in Fig. 11e reflect the broad spectrum of CCN concentrations, i.e., aerosol conditions from very clean to heavily polluted Arctic haze and wildfire smoke situations. The CDNC histogram for pure liquid clouds spans over more than 2 orders of magnitude, from < 10 to about 1000 cm−3. Again, the CDNC distribution is more narrow when ice crystal nucleation and the WBF process (ice crystal growth) come into play. The overall (PL + MP) CDNC distribution shows a pronounced maximum from 10 to 500 cm−3.
Zhang et al. (2019) presented year-round lidar observations in Alaska (Utqiagvik, October 2013 to January 2017) and in Antarctica (McMurdo, December 2015 to January 2017). Their lidar-derived CDNC values were highest in winter (values accumulated in the range from 30 to 150 cm−3) and lowest in the summer, with most values between 15 and 40 cm−3 for the Arctic station. Zhang et al. (2019) also presented lidar estimates for the effective radius Re,liq in Arctic and Antarctic cloud layers. Most Arctic values were between 10 and 16 µm in summer and 4 and 9 µm in winter.
Figure 11c provides information about the heights at which the analyzed shallow cloud layers were typically observed. Most PL cloud layers are found below about 1800 to 2000 m height (with base heights below 1500 m). PL clouds with base heights above 1500 up to 4200 m are less frequently observed. In contrast, most free tropospheric MPCs were detected at heights above 1000 up to 3200 m. The highest clouds showing a liquid phase were observed above Polarstern at about 6.5 km height (as shown in Fig. 9). Silber and Shupe (2022) provide the results of a backward trajectory cluster analysis and air mass origin studies for all MOSAiC liquid-bearing cloud layers. Most of the air masses originated from the North Atlantic, Europe, and Asia, mostly from latitudes > 50° N.
According to Griesche et al. (2021), our cloud statistics cover the so-called surface-decoupled fraction of Arctic stratiform clouds. These clouds develop in lofted aged aerosol layers reaching the Arctic after long-range transport from the surrounding continents and are not or only weakly influenced by local surface emissions. The main INP type in these lofted layers of complex aerosol mixtures is mineral dust (Carlsen and David, 2022). Biological particles and particles carrying biogenic or biological material also contribute to ice nucleation in the free troposphere during the short Arctic summer season from May to August (Carlsen and David, 2022). In the lowermost 500–600 m of the atmosphere (e.g., in the surface-coupled height regime), local particles with biogenic substances may dominate ice nucleation processes in the low-level clouds during the few summer months (Griesche et al., 2021; Creamean et al., 2022). The mineral dust fraction of Arctic haze controls heterogeneous ice nucleation even in the lowest part of the troposphere during the rest of the year (Creamean et al., 2022).
The cloud top temperature histograms in Fig. 11f indicate that a large fraction of the stratiform clouds (PL + MP clouds) showed top temperatures from −18 to −22 °C. A broad distribution with cloud top temperatures from +12 down to −24 °C was observed in the case of PL clouds. The MPC cloud top temperatures covered the range from −12 to −34 °C, with only a few exceptions towards higher temperatures.
The observations in Fig. 11c and f are in good agreement with respect to vertically resolved cloud height and cloud top temperature distributions, derived from multi-year spaceborne lidar and radar observations over the Arctic and presented by Carlsen and David (2022). A strong difference between winter (December to February) and summer (June to August) conditions regarding heterogeneous ice nucleation was found. While in summer, significant ice nucleation started at −10 to −13 °C, winter cloud top temperatures had to drop below about −17 to −24 °C before ice nucleation sets in. As mentioned, during the long winter season, mineral dust particles prevail as INPs, whereas during the short summer period, biological particles and particles carrying biogenic substances also contribute to ice nucleation.
The integration of the new dual-FOV polarization technique into a state-of-the-art lidar-radar supersite enabled us to obtain a deeper insight into the evolution of Arctic MPCs. The improved monitoring of the ice phase together with the liquid phase, simultaneously and independently of each other, and the high temporal resolution allowed us to study the different stages of the life cycle of MPCs in large detail. This motivated us to update the conceptual model presented by Morrison et al. (2012).
Briefly summarized, according to the conceptual model, a freshly formed opaque, shallow liquid-water cloud layer leads to strong longwave radiative cooling that initiates the formation of cluster-like updraft and downdraft fields of several kilometers (1–8 km). These larger-scale turbulent structures develop even below the opaque cloud layer and influence the air motion down to the surface and thus can transport water vapor, CCN, and INPs, after sublimation of the ice crystals in the virgae, back into the cloud top layer. During updraft periods, liquid and ice production preferably takes place (and respective heat release) and keeps the full MPC system alive as long as the synoptic-scale humidity conditions allow for liquid water production. Similarly, droplet evaporation and ice crystal sublimation processes (and related cooling of the air) may strengthen the downdraft parts of the circulation pattern.
Based on our MOSAiC lidar and radar observations, we can add the following points to the conceptual model:
-
CCN activation seems to play an important role throughout the lifetime of an MPC by continuously refilling the small-droplet fraction and stabilizing the droplet size distribution as a whole in this way. This could be concluded from the new dual-FOV lidar observations. The CCN reservoir can be estimated from lidar observations whenever cloud-free conditions are given. As in the case of the INP reservoir, the CCN reservoir contains the activated particles and the residual activatable CCN. The year-round MOSAiC observations suggest that the CCN reservoir in the free troposphere over the central Arctic was always well filled.
-
The MOSAiC lidar observations confirm former studies (Ansmann et al., 2009; de Boer et al., 2011; Westbrook and Illingworth, 2011) stating that immersion freezing is the most relevant ice nucleation process in stratiform mixed-phase clouds. A time-dependent ice nucleation mechanism paired with a large INP reservoir can sustain the frequently observed continuous ice crystal production over many hours (Knopf et al., 2023). Persistent ice nucleation over 2–5 and 5–10 h was observed in 30 % and 13 % of all 147 analyzed MPC layers, respectively. The MOSAiC observations corroborate the hypothesis of a large free tropospheric INP reservoir that was always well filled, i.e., never empty.
-
Recycling and entrainment of water vapor, CCN, and INPs from below and entrainment of CCN and INP from above seem to be responsible for refilling of the two reservoirs of CCN and of INPs. Precipitation can be regarded as the main sink of water vapor, CCN, and INPs. Very clean conditions, as frequently observed at Arctic surface stations during the summer half-year, when Arctic haze is absent, seem to be possible only in the boundary layer, i.e., in the lowermost 250 m of the troposphere where wet removal by fog and precipitation plays an important role, as discussed in detail in Ansmann et al. (2023).
-
Only in a few cases, ice nucleation was found at temperatures °C in the free troposphere in the absence of any seeder-feeder impact. This may indicate the dominance of dust particles in ice nucleation processes in the free troposphere. Dust particles are well activatable at temperatures around −20 °C and lower. However, our lidar observations, presented in this article, do not cover the lowermost 500 m of the troposphere, where a direct impact of local aerosols (nordic soil dust, biological material, biogenic substances) on cloud evolution is possible. Low clouds and fog in the Arctic boundary layer with typical depths of less than 250 m occur approximately 50 % of the time.
-
As a contribution to the discussion on whether Arctic MPCs dissipate due to insufficient aerosol or insufficient water vapor supply (Loewe et al., 2017; Sterzinger et al., 2022), the MOSAiC lidar-based aerosol and water-vapor observations, in combination with the dense MOSAiC radiosonde humidity profiling, suggest that the dissipation of the cloud layers in the free troposphere during MOSAiC was related to a decrease in available water vapor.
-
The case with the strong, distinct perturbation of the cloud evolution over several hours, observed on 21 September 2020, gives an impression regarding to what extent, e.g., orographically induced perturbations of the main airflow by hills and mountains may be able to temporally or even entirely influence the evolution of stratiform layered clouds.
We presented the results of the 1-year MOSAiC observations of Arctic liquid-containing clouds with continuously running lidar and radar instrumentation on board Polarstern, which drifted with pack ice close to the North Pole over many months. For the first time, the full winter half-year from October to March was covered with aerosol and cloud observations in the North Pole region. We introduced the new dual-FOV polarization lidar technique, which allowed, for the first time, a robust and trustworthy monitoring of the liquid phase of stratiform MPC layers. In combination with the lidar-radar retrieval method, a detailed study of the life cycle of mixed-phase clouds in terms of the liquid and ice phase microphysical properties was possible.
We discussed two case studies of the temporal evolution of long-lived free tropospheric MPCs. The observations provided new insight into the interplay between the liquid and ice phases of Arctic MPCs. These observations demonstrate that CCN activation is an important process to ensure the longevity of an MPC system. In modeling approaches, it is recommended to implement a time-dependent INP parameterization scheme to properly simulate the evolution of long-lasting MPC cloud events. For the first time, we presented statistical results for the liquid phase of liquid-bearing Arctic cloud layers in terms of microphysical properties for an entire year, covering all four seasons of the year.
As an outlook, we will continue with our MPC studies (temporal evolution studies; statistics as a function of aerosol pollution) by means of the new dual-FOV technique implemented in lidar-radar supersites. Meanwhile, we have long datasets from contrasting observations in Dushanbe, Tajikistan, Limassol, Cyprus, Punta Arenas in southern Chile (Radenz et al., 2021b), and Antarctica (Radenz et al., 2024). We plan long-term observations (2025–2026) in southern New Zealand. A first MPC lidar study was performed by Hofer et al. (2024). These authors analyzed a long-term dataset of MPC cloud layers, measured with lidar over New Zealand, and found a higher ice formation efficiency for clouds that were influenced by continental (Australian) aerosol and a significantly lower ice formation efficiency for clouds that were more influenced by Antarctic/marine aerosols arriving from the Southern Ocean. Our overall goal is to characterize MPCs in a variety of different climate zones and at different environmental conditions to learn more about the aerosol impact to support MPC and climate-change modeling efforts.
Polly lidar observations (level 0 data, measured signals) are in the PollyNet database (http://polly.tropos.de/; Polly, 2024). All the analysis products are available at TROPOS upon request (polly@tropos.de) and at https://doi.org/10.1594/PANGAEA.935539 (Ohneiser et al., 2021b, a). Cloud radar data are downloaded from the Cloudnet database at https://doi.org/10.60656/00945b67503743f0 (Engelmann et al., 2023). MOSAiC radiosonde data are available at https://doi.org/10.1594/PANGAEA.928656 (Maturilli et al., 2021). Backward trajectory analysis has been performed by air mass transport computation with the NOAA (National Oceanic and Atmospheric Administration) HYSPLIT (HYbrid Single-Particle Lagrangian Integrated Trajectory) model (http://ready.arl.noaa.gov/HYSPLIT_traj.php; HYSPLIT, 2024). LIRAS-ice products are available from the corresponding author upon request.
The paper was written and designed by CJ and AA. The data analysis was performed by CJ, KO, MR, HB, JB, and HG. DAK, PS, and UW were involved in the interpretation of the findings. RE, HG, MR, JH, and DA took care of the lidar observations on board Polarstern during MOSAiC. SD was responsible for high-quality MOSAiC Polarstern radiosonde launches. All coauthors were actively involved in the extended discussions and the elaboration of the final design of the paper.
At least one of the (co-)authors is a member of the editorial board of Atmospheric Chemistry and Physics. The peer-review process was guided by an independent editor, and the authors also have no other competing interests to declare.
Publisher's note: Copernicus Publications remains neutral with regard to jurisdictional claims made in the text, published maps, institutional affiliations, or any other geographical representation in this paper. While Copernicus Publications makes every effort to include appropriate place names, the final responsibility lies with the authors.
Data used in this article were produced as part of the international Multidisciplinary drifting Observatory for the Study of the Arctic Climate (MOSAiC) with the tag MOSAiC20192020 and the Project_ID: AWI_PS122_00. We would like to thank everyone who contributed to the measurements used here (Nixdorf et al., 2021). Radiosonde data were obtained through a partnership between the leading Alfred Wegener Institute, the Atmospheric Radiation Measurement user facility, a US Department of Energy facility managed by the Biological and Environmental Research Program, and the German Weather Service (DWD). We would like to thank the RV Polarstern crew for their perfect logistical support during the 1-year MOSAiC expedition.
The Multidisciplinary drifting Observatory for the Study of the Arctic Climate (MOSAiC) program was funded by the German Federal Ministry for Education and Research (BMBF) through financing of the Alfred Wegener Institut Helmholtz Zentrum für Polar und Meeresforschung (AWI) and the Polarstern expedition PS122 under grant N-2014-H-060_Dethloff. The lidar analysis on smoke–cirrus interaction was further supported by BMBF funding of the SCiAMO project (MOSAIC-FKZ 03F0915A). The radiosonde program was funded by AWI awards AFMOSAiC-1_00 and AWI_PS122_00, the US Department of Energy Atmospheric Radiation Measurement Program, and the German Weather Service. This project has also received funding from the European Union's Horizon 2020 research and innovation program ACTRIS-2 Integrating Activities (H2020-INFRAIA-2014 – 2015, grant agreement no. 654109) and from the European Union's Horizon Europe Programme under Grant Agreement No. 101137639 (CleanCloud). We gratefully acknowledge the funding by the Deutsche Forschungsgemeinschaft (DFG, German Research Foundation) – project no. 268020496 – TRR 172, within the Transregional Collaborative Research Center “ArctiC Amplification: Climate Relevant Atmospheric and SurfaCe Processes, and Feedback Mechanisms (AC)3”. DAK acknowledges support by the US Department of Energy's (DOE) Atmospheric System Research (ASR) program, Office of Biological and Environmental Research (OBER) (grant no. DE-SC0021034).
This paper was edited by Hailong Wang and reviewed by two anonymous referees.
Achtert, P., O'Connor, E. J., Brooks, I. M., Sotiropoulou, G., Shupe, M. D., Pospichal, B., Brooks, B. J., and Tjernström, M.: Properties of Arctic liquid and mixed-phase clouds from shipborne Cloudnet observations during ACSE 2014, Atmos. Chem. Phys., 20, 14983–15002, https://doi.org/10.5194/acp-20-14983-2020, 2020. a, b, c
Alpert, P. A. and Knopf, D. A.: Analysis of isothermal and cooling-rate-dependent immersion freezing by a unifying stochastic ice nucleation model, Atmos. Chem. Phys., 16, 2083–2107, https://doi.org/10.5194/acp-16-2083-2016, 2016. a
Ansmann, A., Wandinger, U., Riebesell, M. A., Weitkamp, C., and Michaelis, W.: Independent measurement of extinction and backscatter profiles in cirrus clouds by using a combined Raman elastic-backscatter lidar, Appl. Opt., 31, 7113–7131, https://doi.org/10.1364/AO.31.007113, 1992. a
Ansmann, A., Tesche, M., Althausen, D., Müller, D., Seifert, P., Freudenthaler, V., Heese, B., Wiegner, M., Pisani, G., Knippertz, P., and Dubovik, O.: Influence of Saharan dust on cloud glaciation in southern Morocco during the Saharan Mineral Dust Experiment, J. Geophys. Res.-Atmos., 113, https://doi.org/10.1029/2007JD008785, 2008. a, b
Ansmann, A., Tesche, M., Seifert, P., Althausen, D., Engelmann, R., Fruntke, J., Wandinger, U., Mattis, I., and Müller, D.: Evolution of the ice phase in tropical altocumulus: SAMUM lidar observations over Cape Verde, J. Geophys. Res.-Atmos., 114, https://doi.org/10.1029/2008JD011659, 2009. a, b, c, d, e, f
Ansmann, A., Petzold, A., Kandler, K., Tegen, I., Wendisch, M., Müller, D., Weinzierl, B., Müller, T., and Heintzenberg, J.: Saharan Mineral Dust Experiments SAMUM-1 and SAMUM-2: what have we learned?, Tellus B, https://doi.org/10.1111/j.1600-0889.2011.00555.x, 2011. a
Ansmann, A., Mamouri, R.-E., Hofer, J., Baars, H., Althausen, D., and Abdullaev, S. F.: Dust mass, cloud condensation nuclei, and ice-nucleating particle profiling with polarization lidar: updated POLIPHON conversion factors from global AERONET analysis, Atmos. Meas. Tech., 12, 4849–4865, https://doi.org/10.5194/amt-12-4849-2019, 2019a. a
Ansmann, A., Mamouri, R.-E., Bühl, J., Seifert, P., Engelmann, R., Hofer, J., Nisantzi, A., Atkinson, J. D., Kanji, Z. A., Sierau, B., Vrekoussis, M., and Sciare, J.: Ice-nucleating particle versus ice crystal number concentrationin altocumulus and cirrus layers embedded in Saharan dust:a closure study, Atmos. Chem. Phys., 19, 15087–15115, https://doi.org/10.5194/acp-19-15087-2019, 2019b. a, b
Ansmann, A., Ohneiser, K., Mamouri, R.-E., Knopf, D. A., Veselovskii, I., Baars, H., Engelmann, R., Foth, A., Jimenez, C., Seifert, P., and Barja, B.: Tropospheric and stratospheric wildfire smoke profiling with lidar: mass, surface area, CCN, and INP retrieval, Atmos. Chem. Phys., 21, 9779–9807, https://doi.org/10.5194/acp-21-9779-2021, 2021. a
Ansmann, A., Ohneiser, K., Engelmann, R., Radenz, M., Griesche, H., Hofer, J., Althausen, D., Creamean, J. M., Boyer, M. C., Knopf, D. A., Dahlke, S., Maturilli, M., Gebauer, H., Bühl, J., Jimenez, C., Seifert, P., and Wandinger, U.: Annual cycle of aerosol properties over the central Arctic during MOSAiC 2019–2020 – light-extinction, CCN, and INP levels from the boundary layer to the tropopause, Atmos. Chem. Phys., 23, 12821–12849, https://doi.org/10.5194/acp-23-12821-2023, 2023. a, b, c, d, e, f, g, h, i, j, k, l
Ansmann, A., Veselovskii, I., Ohneiser, K., and Chudnovsky, A.: Comment on “Stratospheric Aerosol Composition Observed by the Atmospheric Chemistry Experiment Following the 2019 Raikoke Eruption” by Boone et al., J. Geophys. Res.-Atmos., 129, e2022JD038080, https://doi.org/10.1029/2022JD038080, 2024. a
Ansmann, A., Jimenez, C., Roschke, J., Bühl, J., Ohneiser, K., Engelmann, R., Radenz, M., Griesche, H., Hofer, J., Althausen, D., Knopf, D. A., Dahlke, S., Gaudek, T., Seifert, P., and Wandinger, U.: Impact of wildfire smoke on Arctic cirrus formation – Part 1: Analysis of MOSAiC 2019–2020 observations, Atmos. Chem. Phys., 25, 4847–4866, https://doi.org/10.5194/acp-25-4847-2025, 2025a. a, b, c, d, e, f, g, h, i, j
Ansmann, A., Jimenez, C., Knopf, D. A., Roschke, J., Bühl, J., Ohneiser, K., and Engelmann, R.: Impact of wildfire smoke on Arctic cirrus formation – Part 2: Simulation of MOSAiC 2019–2020 cases, Atmos. Chem. Phys., 25, 4867–4884, https://doi.org/10.5194/acp-25-4867-2025, 2025b. a, b
ARM: Atmospheric Radiation Measurement mobile facility homepage, https://www.arm.gov/data, last access: 29 November 2024. a
Baars, H., Kanitz, T., Engelmann, R., Althausen, D., Heese, B., Komppula, M., Preißler, J., Tesche, M., Ansmann, A., Wandinger, U., Lim, J.-H., Ahn, J. Y., Stachlewska, I. S., Amiridis, V., Marinou, E., Seifert, P., Hofer, J., Skupin, A., Schneider, F., Bohlmann, S., Foth, A., Bley, S., Pfüller, A., Giannakaki, E., Lihavainen, H., Viisanen, Y., Hooda, R. K., Pereira, S. N., Bortoli, D., Wagner, F., Mattis, I., Janicka, L., Markowicz, K. M., Achtert, P., Artaxo, P., Pauliquevis, T., Souza, R. A. F., Sharma, V. P., van Zyl, P. G., Beukes, J. P., Sun, J., Rohwer, E. G., Deng, R., Mamouri, R.-E., and Zamorano, F.: An overview of the first decade of PollyNET: an emerging network of automated Raman-polarization lidars for continuous aerosol profiling, Atmos. Chem. Phys., 16, 5111–5137, https://doi.org/10.5194/acp-16-5111-2016, 2016. a
Baars, H., Seifert, P., Engelmann, R., and Wandinger, U.: Target categorization of aerosol and clouds by continuous multiwavelength-polarization lidar measurements, Atmos. Meas. Tech., 10, 3175–3201, https://doi.org/10.5194/amt-10-3175-2017, 2017. a
Bailey, M. and Hallett, J.: Ice Crystal Linear Growth Rates from −20° to −70 °C: Confirmation from Wave Cloud Studies, J. Atmos. Sci., 69, 390–402, https://doi.org/10.1175/JAS-D-11-035.1, 2012. a
Barrientos-Velasco, C., Cox, C. J., Deneke, H., Dodson, J. B., Hünerbein, A., Shupe, M. D., Taylor, P. C., and Macke, A.: Estimation of the radiation budget during MOSAiC based on ground-based and satellite remote sensing observations, Atmos. Chem. Phys., 25, 3929–3960, https://doi.org/10.5194/acp-25-3929-2025, 2025. a
Boucher, O., Randall, D., Artaxo, P., Bretherton, C., Feingold, G., Forster, P., Kerminen, V.-M., Kondo, Y., Liao, H., Lohmann, U., Rasch, P., Satheesh, S. K., S. S., Stevens, B., and Zhang, X. Y.: Clouds and aerosols, in Climate Change 2013: The Physical Science Basis. Contribution of Working Group I to the Fifth Assessment Report of the Intergovernmental Panel on Climate Change, edited by: Stocker, T. F., Qin, D., Plattner, G.-K., Tignor, M., Allen, S. K., Boschung, J., Nauels, A., Xia, Y., Bex, V., and Midgley, P. M., Cambridge University Press, Cambridge, United Kingdom and New York, NY, USA, 571–657, https://www.ipcc.ch/site/assets/uploads/2018/02/WG1AR5_Chapter07_FINAL-1.pdf (last access: 10 December 2024), 2013. a
Boyer, M., Aliaga, D., Pernov, J. B., Angot, H., Quéléver, L. L. J., Dada, L., Heutte, B., Dall'Osto, M., Beddows, D. C. S., Brasseur, Z., Beck, I., Bucci, S., Duetsch, M., Stohl, A., Laurila, T., Asmi, E., Massling, A., Thomas, D. C., Nøjgaard, J. K., Chan, T., Sharma, S., Tunved, P., Krejci, R., Hansson, H. C., Bianchi, F., Lehtipalo, K., Wiedensohler, A., Weinhold, K., Kulmala, M., Petäjä, T., Sipilä, M., Schmale, J., and Jokinen, T.: A full year of aerosol size distribution data from the central Arctic under an extreme positive Arctic Oscillation: insights from the Multidisciplinary drifting Observatory for the Study of Arctic Climate (MOSAiC) expedition, Atmos. Chem. Phys., 23, 389–415, https://doi.org/10.5194/acp-23-389-2023, 2023. a
Bühl, J., Seifert, P., Myagkov, A., and Ansmann, A.: Measuring ice- and liquid-water properties in mixed-phase cloud layers at the Leipzig Cloudnet station, Atmos. Chem. Phys., 16, 10609–10620, https://doi.org/10.5194/acp-16-10609-2016, 2016. a, b
Bühl, J., Seifert, P., Radenz, M., Baars, H., and Ansmann, A.: Ice crystal number concentration from lidar, cloud radar and radar wind profiler measurements, Atmos. Meas. Tech., 12, 6601–6617, https://doi.org/10.5194/amt-12-6601-2019, 2019. a, b, c, d, e
Carlsen, T. and David, R. O.: Spaceborne Evidence That Ice-Nucleating Particles Influence High-Latitude Cloud Phase, Geophys. Res. Lett., 49, e2022GL098041, https://doi.org/10.1029/2022GL098041, 2022. a, b, c
Choudhury, G. and Tesche, M.: Estimating cloud condensation nuclei concentrations from CALIPSO lidar measurements, Atmos. Meas. Tech., 15, 639–654, https://doi.org/10.5194/amt-15-639-2022, 2022. a
Choudhury, G., Ansmann, A., and Tesche, M.: Evaluation of aerosol number concentrations from CALIPSO with ATom airborne in situ measurements, Atmos. Chem. Phys., 22, 7143–7161, https://doi.org/10.5194/acp-22-7143-2022, 2022. a
Creamean, J., Barry, K., Hill, T., Hume, C., DeMott, P. J., Shupe, M. D., Dahlke, S., Willmes, S., Schmale, J., Beck, I., Hoppe, C. J. . M., Fong, A., Chamberlain, E., Bowman, J., Scharien, R., and Persson, O.: Annual cycle observations of aerosols capable of ice formation in central Arctic clouds, Nat. Commun., 13, https://doi.org/10.1038/s41467-022-31182-x, 2022. a, b
Dai, G., Althausen, D., Hofer, J., Engelmann, R., Seifert, P., Bühl, J., Mamouri, R.-E., Wu, S., and Ansmann, A.: Calibration of Raman lidar water vapor profiles by means of AERONET photometer observations and GDAS meteorological data, Atmos. Meas. Tech., 11, 2735–2748, https://doi.org/10.5194/amt-11-2735-2018, 2018. a
de Boer, G., Morrison, H., Shupe, M. D., and Hildner, R.: Evidence of liquid dependent ice nucleation in high-latitude stratiform clouds from surface remote sensors, Geophys. Res. Lett., 38, https://doi.org/10.1029/2010GL046016, 2011. a, b, c
Delanoë, J. and Hogan, R. J.: A variational scheme for retrieving ice cloud properties from combined radar, lidar, and infrared radiometer, J. Geophys. Res.-Atmos., 113, https://doi.org/10.1029/2007JD009000, 2008. a
DeMott, P. J., Prenni, A. J., McMeeking, G. R., Sullivan, R. C., Petters, M. D., Tobo, Y., Niemand, M., Möhler, O., Snider, J. R., Wang, Z., and Kreidenweis, S. M.: Integrating laboratory and field data to quantify the immersion freezing ice nucleation activity of mineral dust particles, Atmos. Chem. Phys., 15, 393–409, https://doi.org/10.5194/acp-15-393-2015, 2015. a, b, c
Donovan, D. P., Klein Baltink, H., Henzing, J. S., de Roode, S. R., and Siebesma, A. P.: A depolarisation lidar-based method for the determination of liquid-cloud microphysical properties, Atmos. Meas. Tech., 8, 237–266, https://doi.org/10.5194/amt-8-237-2015, 2015. a
Eirund, G. K., Possner, A., and Lohmann, U.: Response of Arctic mixed-phase clouds to aerosol perturbations under different surface forcings, Atmos. Chem. Phys., 19, 9847–9864, https://doi.org/10.5194/acp-19-9847-2019, 2019. a
Engelmann, R., Kanitz, T., Baars, H., Heese, B., Althausen, D., Skupin, A., Wandinger, U., Komppula, M., Stachlewska, I. S., Amiridis, V., Marinou, E., Mattis, I., Linné, H., and Ansmann, A.: The automated multiwavelength Raman polarization and water-vapor lidar PollyXT: the neXT generation, Atmos. Meas. Tech., 9, 1767–1784, https://doi.org/10.5194/amt-9-1767-2016, 2016. a
Engelmann, R., Ansmann, A., Ohneiser, K., Griesche, H., Radenz, M., Hofer, J., Althausen, D., Dahlke, S., Maturilli, M., Veselovskii, I., Jimenez, C., Wiesen, R., Baars, H., Bühl, J., Gebauer, H., Haarig, M., Seifert, P., Wandinger, U., and Macke, A.: Wildfire smoke, Arctic haze, and aerosol effects on mixed-phase and cirrus clouds over the North Pole region during MOSAiC: an introduction, Atmos. Chem. Phys., 21, 13397–13423, https://doi.org/10.5194/acp-21-13397-2021, 2021. a, b, c, d, e, f
Engelmann, R., Althausen, D., Baars, H., Griesche, H., Hofer, J., Radenz, M., and Seifert, P.: Custom collection of categorize data from RV Polarstern between 11 Oct 2019 and 30 Sep 2020, ACTRIS Cloud remote sensing data centre unit (CLU) [data set], https://doi.org/10.60656/00945b67503743f0, 2023. a
Fridlind, A. M. and Ackerman, A. S.: Chapter 7 – Simulations of Arctic mixed-phase boundary layer clouds: Advances in understanding and outstanding questions, in: Mixed-phase clouds, edited by: Andronache, C., Elsevier, 153–183, https://doi.org/10.1016/B978-0-12-810549-8.00007-6, 2018. a, b, c
Froyd, K. D., Yu, P., Schill, G. P., Brock, C. A., Kupc, A., Williamson, C. J., Jensen, E. J., Ray, E., Rosenlof, K. H., Bian, H., Darmenov, A. S., Colarco, P. R., Diskin, G. S., Bui, T., and Murphy, D. M.: Dominant role of mineral dust in cirrus cloud formation revealed by global-scale measurements, Nat. Geosci., 15, 177–183, https://doi.org/10.1038/s41561-022-00901-w, 2022. a
Gong, X., Zhang, J., Croft, B., Yang, X., Frey, M. M., Bergner, N., Chang, R. Y.-W., Creamean, J. M., Kuang, C., Martin, R. V., Ranjithkumar, A., Sedlacek, A. J., Uin, J., Willmes, S., Zawadowicz, M. A., Pierce, J. R., Shupe, M. D., Schmale, J., and Wang, J.: Arctic warming by abundant fine sea salt aerosols from blowing snow, Nat. Geosci., 16, 768–774, https://doi.org/10.1038/s41561-023-01254-8, 2023. a
Grabowski, W. W.: Comparison of Eulerian Bin and Lagrangian Particle-Based Microphysics in Simulations of Nonprecipitating Cumulus, J. Atmos. Sci., 77, 3951–3970, https://doi.org/10.1175/JAS-D-20-0100.1, 2020. a
Griesche, H. J., Seifert, P., Ansmann, A., Baars, H., Barrientos Velasco, C., Bühl, J., Engelmann, R., Radenz, M., Zhenping, Y., and Macke, A.: Application of the shipborne remote sensing supersite OCEANET for profiling of Arctic aerosols and clouds during Polarstern cruise PS106, Atmos. Meas. Tech., 13, 5335–5358, https://doi.org/10.5194/amt-13-5335-2020, 2020. a
Griesche, H. J., Ohneiser, K., Seifert, P., Radenz, M., Engelmann, R., and Ansmann, A.: Contrasting ice formation in Arctic clouds: surface-coupled vs. surface-decoupled clouds, Atmos. Chem. Phys., 21, 10357–10374, https://doi.org/10.5194/acp-21-10357-2021, 2021. a, b
Griesche, H. J., Barrientos-Velasco, C., Deneke, H., Hünerbein, A., Seifert, P., and Macke, A.: Low-level Arctic clouds: a blind zone in our knowledge of the radiation budget, Atmos. Chem. Phys., 24, 597–612, https://doi.org/10.5194/acp-24-597-2024, 2024a. a
Griesche, H. J., Seifert, P., Engelmann, R., Radenz, M., Hofer, J., Althausen, D., Walbröl, A., Barrientos-Velasco, C., Baars, H., Dahlke, S., Tukiainen, S., and Macke, A.: Cloud micro- and macrophysical properties from ground-based remote sensing during the MOSAiC drift experiment, Sci. Data, 11, https://doi.org/10.1038/s41597-024-03325-w, 2024b. a, b
Haarig, M., Engelmann, R., Ansmann, A., Veselovskii, I., Whiteman, D. N., and Althausen, D.: 1064 nm rotational Raman lidar for particle extinction and lidar-ratio profiling: cirrus case study, Atmos. Meas. Tech., 9, 4269–4278, https://doi.org/10.5194/amt-9-4269-2016, 2016. a, b
He, Y., Yin, Z., Ansmann, A., Liu, F., Wang, L., Jing, D., and Shen, H.: POLIPHON conversion factors for retrieving dust-related cloud condensation nuclei and ice-nucleating particle concentration profiles at oceanic sites, Atmos. Meas. Tech., 16, 1951–1970, https://doi.org/10.5194/amt-16-1951-2023, 2023. a
Heutte, B., Bergner, N., Angot, H., Pernov, J. B., Dada, L., Mirrielees, J. A., Beck, I., Baccarini, A., Boyer, M., Creamean, J. M., Daellenbach, K. R., El Haddad, I., Frey, M. M., Henning, S., Laurila, T., Moschos, V., Petäjä, T., Pratt, K. A., Quéléver, L. L. J., Shupe, M. D., Zieger, P., Jokinen, T., and Schmale, J.: Observations of high-time-resolution and size-resolved aerosol chemical composition and microphysics in the central Arctic: implications for climate-relevant particle properties, Atmos. Chem. Phys., 25, 2207–2241, https://doi.org/10.5194/acp-25-2207-2025, 2025. a
Hobbs, P. V. and Rangno, A. L.: Ice Particle Concentrations in Clouds, J. Atmos. Sci., 42, 2523–2549, https://doi.org/10.1175/1520-0469(1985)042<2523:IPCIC>2.0.CO;2, 1985. a
Hofer, J., Althausen, D., Abdullaev, S. F., Makhmudov, A. N., Nazarov, B. I., Schettler, G., Engelmann, R., Baars, H., Fomba, K. W., Müller, K., Heinold, B., Kandler, K., and Ansmann, A.: Long-term profiling of mineral dust and pollution aerosol with multiwavelength polarization Raman lidar at the Central Asian site of Dushanbe, Tajikistan: case studies, Atmos. Chem. Phys., 17, 14559–14577, https://doi.org/10.5194/acp-17-14559-2017, 2017. a
Hofer, J., Seifert, P., Liley, J. B., Radenz, M., Uchino, O., Morino, I., Sakai, T., Nagai, T., and Ansmann, A.: Aerosol-related effects on the occurrence of heterogeneous ice formation over Lauder, New Zealand ∕ Aotearoa, Atmos. Chem. Phys., 24, 1265–1280, https://doi.org/10.5194/acp-24-1265-2024, 2024. a
HYSPLIT: HYbrid Single-Particle Lagrangian Integrated Trajectory model, backward trajectory calculation tool, http://ready.arl.noaa.gov/HYSPLIT_traj.php, last access: 20 November 2024. a
Illingworth, A. J., Hogan, R. J., O'Connor, E., Bouniol, D., Brooks, M. E., Delanoé, J., Donovan, D. P., Eastment, J. D., Gaussiat, N., Goddard, J. W. F., Haeffelin, M., Baltink, H. K., Krasnov, O. A., Pelon, J., Piriou, J.-M., Protat, A., Russchenberg, H. W. J., Seifert, A., Tompkins, A. M., van Zadelhoff, G.-J., Vinit, F., Willén, U., Wilson, D. R., and Wrench, C. L.: Cloudnet: Continuous Evaluation of Cloud Profiles in Seven Operational Models Using Ground-Based Observations, B. Am. Meteorol. Soc., 88, 883–898, https://doi.org/10.1175/BAMS-88-6-883, 2007. a
Jimenez, C.: Observations of aerosol and liquid-water clouds with Dual-Field-of-View Polarization Lidar – A ground-based view on aerosol-cloud interactions, University of Leipzig, Germany, 182 pp., https://nbn-resolving.org/urn:nbn:de:bsz:15-qucosa2-769056 (last access: 10 December 2024), 2021. a
Jimenez, C., Ansmann, A., Engelmann, R., Donovan, D., Malinka, A., Schmidt, J., Seifert, P., and Wandinger, U.: The dual-field-of-view polarization lidar technique: a new concept in monitoring aerosol effects in liquid-water clouds – theoretical framework, Atmos. Chem. Phys., 20, 15247–15263, https://doi.org/10.5194/acp-20-15247-2020, 2020a. a, b, c, d, e, f, g, h, i, j
Jimenez, C., Ansmann, A., Engelmann, R., Donovan, D., Malinka, A., Seifert, P., Wiesen, R., Radenz, M., Yin, Z., Bühl, J., Schmidt, J., Barja, B., and Wandinger, U.: The dual-field-of-view polarization lidar technique: a new concept in monitoring aerosol effects in liquid-water clouds – case studies, Atmos. Chem. Phys., 20, 15265–15284, https://doi.org/10.5194/acp-20-15265-2020, 2020b. a, b, c, d, e, f, g, h, i, j, k
Kalesse, H., de Boer, G., Solomon, A., Oue, M., Ahlgrimm, M., Zhang, D., Shupe, M. D., Luke, E., and Protat, A.: Understanding Rapid Changes in Phase Partitioning between Cloud Liquid and Ice in Stratiform Mixed-Phase Clouds: An Arctic Case Study, Mon. Weather Rev., 144, 4805–4826, https://doi.org/10.1175/MWR-D-16-0155.1, 2016. a, b
Kanji, Z. A., Ladino, L. A., Wex, H., Boose, Y., Burkert-Kohn, M., Cziczo, D. J., and Krämer, M.: Overview of ice nucleating particles, Meteor. Mon., 58, 1–33, https://doi.org/10.1175/AMSMONOGRAPHS-D-16-0006.1, 2017. a
Khain, A., Pinsky, M., and Korolev, A.: Combined Effect of the Wegener–Bergeron–Findeisen Mechanism and Large Eddies on Microphysics of Mixed-Phase Stratiform Clouds, J. Atmos. Sci., 79, 383–407, https://doi.org/10.1175/JAS-D-20-0269.1, 2022. a, b, c, d, e, f
Knopf, D. A. and Alpert, P. A.: A water activity based model of heterogeneous ice nucleation kinetics for freezing of water and aqueous solution droplets, Farad. Discuss., 165, 513–534, https://doi.org/10.1039/c3fd00035d, 2013. a
Knopf, D. A., Alpert, P. A., Zipori, A., Reicher, N., and Rudich, Y.: Stochastic nucleation processes and substrate abundance explain time-dependent freezing in supercooled droplets, npj Clim. Atmos. Sci., 3, https://doi.org/10.1038/s41612-020-0106-4, 2020. a
Knopf, D. A., Silber, I., Riemer, N., Fridlind, A. M., and Ackerman, A. S.: A 1D Model for Nucleation of Ice From Aerosol Particles: An Application to a Mixed-Phase Arctic Stratus Cloud Layer, J. Adv. Model. Earth Sy., 15, e2023MS003663, https://doi.org/10.1029/2023MS003663, 2023. a, b, c, d
Knust, R.: Polar Research and Supply Vessel POLARSTERN operated by the Alfred‐Wegener‐Institute, Journal of large‐scale research facilities, 3, A119, https://doi.org/10.17815/jlsrf-3-163, 2017. a
Korolev, A.: Limitations of the Wegener–Bergeron–Findeisen Mechanism in the Evolution of Mixed-Phase Clouds, J. Atmos. Sci., 64, 3372–3375, https://doi.org/10.1175/JAS4035.1, 2007. a
Korolev, A. and Field, P. R.: The Effect of Dynamics on Mixed-Phase Clouds: Theoretical Considerations, J. Atmos. Sci., 65, 66–86, https://doi.org/10.1175/2007JAS2355.1, 2008. a
Korolev, A., McFarquhar, G., Field, P. R., Franklin, C., Lawson, P., Wang, Z., Williams, E., Abel, S. J., Axisa, D., Borrmann, S., Crosier, J., Fugal, J., Krämer, M., Lohmann, U., Schlenczek, O., Schnaiter, M., and Wendisch, M.: Mixed-Phase Clouds: Progress and Challenges, Meteorol. Mon., 58, 5.1–5.50, https://doi.org/10.1175/AMSMONOGRAPHS-D-17-0001.1, 2017. a
Loewe, K., Ekman, A. M. L., Paukert, M., Sedlar, J., Tjernström, M., and Hoose, C.: Modelling micro- and macrophysical contributors to the dissipation of an Arctic mixed-phase cloud during the Arctic Summer Cloud Ocean Study (ASCOS), Atmos. Chem. Phys., 17, 6693–6704, https://doi.org/10.5194/acp-17-6693-2017, 2017. a
Lohmann, U. and Neubauer, D.: The importance of mixed-phase and ice clouds for climate sensitivity in the global aerosol–climate model ECHAM6-HAM2, Atmos. Chem. Phys., 18, 8807–8828, https://doi.org/10.5194/acp-18-8807-2018, 2018. a
Mamouri, R.-E. and Ansmann, A.: Potential of polarization lidar to provide profiles of CCN- and INP-relevant aerosol parameters, Atmos. Chem. Phys., 16, 5905–5931, https://doi.org/10.5194/acp-16-5905-2016, 2016. a, b
Mamouri, R.-E. and Ansmann, A.: Potential of polarization/Raman lidar to separate fine dust, coarse dust, maritime, and anthropogenic aerosol profiles, Atmos. Meas. Tech., 10, 3403–3427, https://doi.org/10.5194/amt-10-3403-2017, 2017. a
Marinou, E., Tesche, M., Nenes, A., Ansmann, A., Schrod, J., Mamali, D., Tsekeri, A., Pikridas, M., Baars, H., Engelmann, R., Voudouri, K.-A., Solomos, S., Sciare, J., Groß, S., Ewald, F., and Amiridis, V.: Retrieval of ice-nucleating particle concentrations from lidar observations and comparison with UAV in situ measurements, Atmos. Chem. Phys., 19, 11315–11342, https://doi.org/10.5194/acp-19-11315-2019, 2019. a
Mason, S. L., Hogan, R. J., Bozzo, A., and Pounder, N. L.: A unified synergistic retrieval of clouds, aerosols, and precipitation from EarthCARE: the ACM-CAP product, Atmos. Meas. Tech., 16, 3459–3486, https://doi.org/10.5194/amt-16-3459-2023, 2023. a
Maturilli, M., Holdridge, D. J., Dahlke, S., Graeser, J., Sommerfeld, A., Jaiser, R., Deckelmann, H., and Schulz, A.: Initial radiosonde data from 2019-10 to 2020-09 during project MOSAiC, Alfred Wegener Institute, Helmholtz Centre for Polar and Marine Research, Bremerhaven, PANGAEA [data set], https://doi.org/10.1594/PANGAEA.928656, 2021. a, b
Mioche, G., Jourdan, O., Delanoë, J., Gourbeyre, C., Febvre, G., Dupuy, R., Monier, M., Szczap, F., Schwarzenboeck, A., and Gayet, J.-F.: Vertical distribution of microphysical properties of Arctic springtime low-level mixed-phase clouds over the Greenland and Norwegian seas, Atmos. Chem. Phys., 17, 12845–12869, https://doi.org/10.5194/acp-17-12845-2017, 2017. a, b, c, d, e, f
Morrison, H., Zuidema, P., Ackerman, A. S., Avramov, A., de Boer, G., Fan, J., Fridlind, A. M., Hashino, T., Harrington, J. Y., Luo, Y., Ovchinnikov, M., and Shipway, B.: Intercomparison of cloud model simulations of Arctic mixed-phase boundary layer clouds observed during SHEBA/FIRE-ACE, J. Adv. Model. Earth Sy., 3, M06003, https://doi.org/10.1029/2011MS000066, 2011. a
Morrison, H., De Boer, G., Feingold, G., Harrington, J., Shupe, M. D., and Sulia, K.: Resilience of persistent Arctic mixed-phase clouds, Nat. Geosci., 5, 11–17, https://doi.org/10.1038/ngeo1332, 2012. a, b, c, d
Morrison, H., van Lier-Walqui, M., Fridlind, A. M., Grabowski, W. W., Harrington, J. Y., Hoose, C., Korolev, A., Kumjian, M. R., Milbrandt, J. A., Pawlowska, H., Posselt, D. J., Prat, O. P., Reimel, K. J., Shima, S.-I., van Diedenhoven, B., and Xue, L.: Confronting the Challenge of Modeling Cloud and Precipitation Microphysics, J. Adv. Model. Earth Sy., 12, e2019MS001689, https://doi.org/10.1029/2019MS001689, 2020. a
Müller, D., Mattis, I., Ansmann, A., Wehner, B., Althausen, D., Wandinger, U., and Dubovik, O.: Closure study on optical and microphysical properties of a mixed urban and Arctic haze air mass observed with Raman lidar and Sun photometer, J. Geophys. Res.-Atmos., 109, https://doi.org/10.1029/2003JD004200, 2004. a
NASA Worldview: Satellite images, Worldview-earthdata-nasa-2024, https://worldview.earthdata.nasa.gov/?v=-735094.46733622,-135866.03606716794,670935.2615954294,740494.9593628328&p=arctic&l=Reference_Labels_15m(hidden),Reference_Features_15m(hidden),Coastlines_15m,VIIRS_NOAA20_Brightness_Temp_BandI5_Night(hidden),VIIRS_SNPP_Brightness_Temp_BandI5_Night(min=218.9,max=259.6,squash=true),VIIRS_NOAA21_CorrectedReflectance_TrueColor(hidden),VIIRS_NOAA20_CorrectedReflectance_TrueColor(hidden),VIIRS_SNPP_CorrectedReflectance_TrueColor,MODIS_Aqua_CorrectedReflectance_TrueColor(hidden),MODIS_Terra_CorrectedReflectance_TrueColor(hidden)&lg=true&s=116.1592,86.6208&t=2019-12-30-T08%3A58%3A25Z, last access: 10 December 2024. a
Nixdorf, U., Dethloff, K., Rex, M., Shupe, M., Sommerfeld, A., Perovich, D., Nicolaus, M., Heuzé, C., Rabe, B., Loose, B., Damm, E., Gradinger, R., Fong., A, Maslowski, W., Rinke, A., Kwok, R., Spreen, G., Wendisch, M., Herber, A., Hirsekorn, M., Mohaupt, V., Frickenhaus, S., Immerz, A., Weiss-Tuider, K., König, B., Mengedoht, D., Regnery, J., Gerchow, P., Ransby, D., Krumpen, T., Morgenstern, A., Haas, C., Kanzow, T., Rack, F. R., Saitzev, V., Sokolov, V., Makarov, A., Schwarze, S., Wunderlich, T., Wurr, K., and Boetius, A.: MOSAiC extended acknowledgement, Zenodo, https://doi.org/10.5281/zenodo.5179738, 2021. a
Ohneiser, K., Ansmann, A., Baars, H., Seifert, P., Barja, B., Jimenez, C., Radenz, M., Teisseire, A., Floutsi, A., Haarig, M., Foth, A., Chudnovsky, A., Engelmann, R., Zamorano, F., Bühl, J., and Wandinger, U.: Smoke of extreme Australian bushfires observed in the stratosphere over Punta Arenas, Chile, in January 2020: optical thickness, lidar ratios, and depolarization ratios at 355 and 532 nm, Atmos. Chem. Phys., 20, 8003–8015, https://doi.org/10.5194/acp-20-8003-2020, 2020. a
Ohneiser, K., Ansmann, A., Chudnovsky, A., Engelmann, R., Ritter, C., Veselovskii, I., Baars, H., Gebauer, H., Griesche, H., Radenz, M., Hofer, J., Althausen, D., Dahlke, S., and Maturilli, M.: The unexpected smoke layer in the High Arctic winter stratosphere during MOSAiC 2019–2020 , Atmos. Chem. Phys., 21, 15783–15808, https://doi.org/10.5194/acp-21-15783-2021, 2021a. a, b, c
Ohneiser, K., Ansmann, A., Engelmann, R., Griesche, H., Radenz, M., Hofer, J., and Althausen, D.: Optical aerosol profiles from the Raman Lidar Polly-XT during MOSAiC, PANGAEA [data set], https://doi.org/10.1594/PANGAEA.935539, 2021b. a
Ohneiser, K., Ansmann, A., Kaifler, B., Chudnovsky, A., Barja, B., Knopf, D. A., Kaifler, N., Baars, H., Seifert, P., Villanueva, D., Jimenez, C., Radenz, M., Engelmann, R., Veselovskii, I., and Zamorano, F.: Australian wildfire smoke in the stratosphere: the decay phase in 2020/2021 and impact on ozone depletion, Atmos. Chem. Phys., 22, 7417–7442, https://doi.org/10.5194/acp-22-7417-2022, 2022. a
Ohneiser, K., Ansmann, A., Witthuhn, J., Deneke, H., Chudnovsky, A., Walter, G., and Senf, F.: Self-lofting of wildfire smoke in the troposphere and stratosphere: simulations and space lidar observations, Atmos. Chem. Phys., 23, 2901–2925, https://doi.org/10.5194/acp-23-2901-2023, 2023. a
Peng, S., Yang, Q., Shupe, M. D., Xi, X., Han, B., Chen, D., Dahlke, S., and Liu, C.: The characteristics of atmospheric boundary layer height over the Arctic Ocean during MOSAiC, Atmos. Chem. Phys., 23, 8683–8703, https://doi.org/10.5194/acp-23-8683-2023, 2023. a
Polly: PollyNET lidar data base, http://polly.tropos.de/, last access: 10 December 2024. a
Radenz, M., Seifert, P., Baars, H., Floutsi, A. A., Yin, Z., and Bühl, J.: Automated time–height-resolved air mass source attribution for profiling remote sensing applications, Atmos. Chem. Phys., 21, 3015–3033, https://doi.org/10.5194/acp-21-3015-2021, 2021a. a
Radenz, M., Bühl, J., Seifert, P., Baars, H., Engelmann, R., Barja González, B., Mamouri, R.-E., Zamorano, F., and Ansmann, A.: Hemispheric contrasts in ice formation in stratiform mixed-phase clouds: disentangling the role of aerosol and dynamics with ground-based remote sensing, Atmos. Chem. Phys., 21, 17969–17994, https://doi.org/10.5194/acp-21-17969-2021, 2021b. a, b
Radenz, M., Engelmann, R., Henning, S., Schmithüsen, H., Baars, H., Frey, M. M., Weller, R., Bühl, J., Jimenez, C., Roschke, J., Muser, L. O., Wullenweber, N., Zeppenfeld, S., Griesche, H., Wandinger, U., and Seifert, P.: Ground-Based Remote Sensing of Aerosol, Clouds, Dynamics, and Precipitation in Antarctica: First Results from the 1-Year COALA Campaign at Neumayer Station III in 2023, B. Am. Meteorol. Soc., 105, E1438–E1457, https://doi.org/10.1175/BAMS-D-22-0285.1, 2024. a
Ramelli, F., Henneberger, J., David, R. O., Bühl, J., Radenz, M., Seifert, P., Wieder, J., Lauber, A., Pasquier, J. T., Engelmann, R., Mignani, C., Hervo, M., and Lohmann, U.: Microphysical investigation of the seeder and feeder region of an Alpine mixed-phase cloud, Atmos. Chem. Phys., 21, 6681–6706, https://doi.org/10.5194/acp-21-6681-2021, 2021. a
Rauber, R. M. and Tokay, A.: An Explanation for the Existence of Supercooled Water at the Top of Cold Clouds, J. Atmos. Sci., 48, 1005–1023, https://doi.org/10.1175/1520-0469(1991)048<1005:AEFTEO>2.0.CO;2, 1991. a, b, c
Roesler, E. L., Posselt, D. J., and Rood, R. B.: Using large eddy simulations to reveal the size, strength, and phase of updraft and downdraft cores of an Arctic mixed-phase stratocumulus cloud, J. Geophys. Res.-Atmos., 122, 4378–4400, https://doi.org/10.1002/2016JD026055, 2017. a, b
Rose, T., Crewell, S., Löhnert, U., and Simmer, C.: A network suitable microwave radiometer for operational monitoring of the cloudy atmosphere, Atmos. Res., 75, 183–200, https://doi.org/10.1016/j.atmosres.2004.12.005, 2005. a
Saavedra Garfias, P., Kalesse-Los, H., von Albedyll, L., Griesche, H., and Spreen, G.: Asymmetries in cloud microphysical properties ascribed to sea ice leads via water vapour transport in the central Arctic, Atmos. Chem. Phys., 23, 14521–14546, https://doi.org/10.5194/acp-23-14521-2023, 2023. a
Savre, J. and Ekman, A. M. L.: Large-eddy simulation of three mixed-phase cloud events during ISDAC: Conditions for persistent heterogeneous ice formation, J. Geophys. Res.-Atmos., 120, 7699–7725, https://doi.org/10.1002/2014JD023006, 2015. a, b
Schmidt, J., Wandinger, U., and Malinka, A.: Dual-field-of-view Raman lidar measurements for the retrieval of cloud microphysical properties, Appl. Opt., 52, 2235–2247, https://doi.org/10.1364/AO.52.002235, 2013. a, b, c
Schmidt, J., Ansmann, A., Bühl, J., Baars, H., Wandinger, U., Müller, D., and Malinka, A. V.: Dual-FOV Raman and Doppler lidar studies of aerosol-cloud interactions: Simultaneous profiling of aerosols, warm-cloud properties, and vertical wind, J. Geophys. Res.-Atmos., 119, 5512–5527, https://doi.org/10.1002/2013JD020424, 2014. a, b
Schmidt, J., Ansmann, A., Bühl, J., and Wandinger, U.: Strong aerosol–cloud interaction in altocumulus during updraft periods: lidar observations over central Europe, Atmos. Chem. Phys., 15, 10687–10700, https://doi.org/10.5194/acp-15-10687-2015, 2015. a
Seidel, C., Althausen, D., Ansmann, A., Wendisch, M., Griesche, H. J., Radenz, M., Hofer, J., Dahlke, S., Maturilli, M., Wahlbrol, A., Baars, H., and Engelmann, R.: Close correlation between vertically integrated tropospheric water vapor and the downward, broadband thermal-infrared irradiance at the ground: Observations in the Central Arctic during MOSAiC, Journal of Geophys. Res.-Atmos., https://doi.org/10.1029/2024JD042378, 2025. a, b
Shupe, M. D.: A ground-based multisensor cloud phase classifier, Geophys. Res. Lett., 34, https://doi.org/10.1029/2007GL031008, 2007. a
Shupe, M. D., Matrosov, S. Y., and Uttal, T.: Arctic Mixed-Phase Cloud Properties Derived from Surface-Based Sensors at SHEBA, J. Atmos. Sci., 63, 697–711, https://doi.org/10.1175/JAS3659.1, 2006. a, b
Shupe, M. D., Kollias, P., Persson, P. O. G., and McFarquhar, G. M.: Vertical Motions in Arctic Mixed-Phase Stratiform Clouds, J. Atmos. Sci., 65, 1304–1322, https://doi.org/10.1175/2007JAS2479.1, 2008. a, b, c, d, e, f, g, h, i, j
Shupe, M. D., Rex, M., Blomquist, B., Ola, P., Persson, G., Schmale, J., Uttal, T., Althausen, D., Angot, H., Archer, S., Bariteau, L., Beck, I., Bilberry, J., Bucci, S., Buck, C., Boyer, M., Brasseur, Z., Brooks, I. M., Calmer, R., Cassano, J., Castro, V., Chu, D., Costa, D., Cox, C. J., Creamean, J., Crewell, S., Dahlke, S., Damm, E., de Boer, G., Deckelmann, H., Dethloff, K., Dütsch, M., Ebell, K., Ehrlich, A., Ellis, J., Engelmann, R., Fong, A. A., Frey, M. M., Gallagher, M. R., Ganzeveld, L., Gradinger, R., Graeser, J., Greenamyer, V., Griesche, H., Griffiths, S., Hamilton, J., Heinemann, G., Helmig, D., Herber, A., Heuzé, C., Hofer, J., Houchens, T., Howard, D., Inoue, J., Jacobi, H.-W., Jaiser, R., Jokinen, T., Jourdan, O., Jozef, G., King, W., Kirchgaessner, A., Klingebiel, M., Krassovski, M., Krumpen, T., Lampert, A., Landing, W., Laurila, T., Lawrence, D., Lonardi, M., Loose, B., Lüpkes, C., Maahn, M., Macke, A., Maslowski, W., Marsay, C., Maturilli, M., Mech, M., Morris, S., Moser, M., Nicolaus, M., Ortega, P., Osborn, J., Pätzold, F., Perovich, D. K., Petäjä, T., Pilz, C., Pirazzini, R., Posman, K., Powers, H., Pratt, K. A., Preußer, A., Quéléver, L., Radenz, M., Rabe, B., Rinke, A., Sachs, T., Schulz, A., Siebert, H., Silva, T., Solomon, A., Sommerfeld, A., Spreen, G., Stephens, M., Stohl, A., Svensson, G., Uin, J., Viegas, J., Voigt, C., von der Gathen, P., Wehner, B., Welker, J. M., Wendisch, M., Werner, M., Xie, Z., and Yue, F.: Overview of the MOSAiC expedition: Atmosphere, Elem. Sci. Anth., 10, https://doi.org/10.1525/elementa.2021.00060, 2022. a, b, c
Silber, I. and Shupe, M. D.: Insights on sources and formation mechanisms of liquid-bearing clouds over MOSAiC examined from a Lagrangian framework, Elem. Sci. Anth., 10, 000071, https://doi.org/10.1525/elementa.2021.000071, 2022. a, b, c
Snider, J. R., Leon, D., and Wang, Z.: Droplet Concentration and Spectral Broadening in Southeast Pacific Stratocumulus Clouds, J. Atmos. Sci., 74, 719–749, https://doi.org/10.1175/JAS-D-16-0043.1, 2017. a
Solomon, A., de Boer, G., Creamean, J. M., McComiskey, A., Shupe, M. D., Maahn, M., and Cox, C.: The relative impact of cloud condensation nuclei and ice nucleating particle concentrations on phase partitioning in Arctic mixed-phase stratocumulus clouds, Atmos. Chem. Phys., 18, 17047–17059, https://doi.org/10.5194/acp-18-17047-2018, 2018. a, b
Sourdeval, O., Gryspeerdt, E., Krämer, M., Goren, T., Delanoë, J., Afchine, A., Hemmer, F., and Quaas, J.: Ice crystal number concentration estimates from lidar–radar satellite remote sensing – Part 1: Method and evaluation, Atmos. Chem. Phys., 18, 14327–14350, https://doi.org/10.5194/acp-18-14327-2018, 2018. a
Sterzinger, L. J., Sedlar, J., Guy, H., Neely III, R. R., and Igel, A. L.: Do Arctic mixed-phase clouds sometimes dissipate due to insufficient aerosol? Evidence from comparisons between observations and idealized simulations, Atmos. Chem. Phys., 22, 8973–8988, https://doi.org/10.5194/acp-22-8973-2022, 2022. a
Ullrich, R., Hoose, C., Möhler, O., Niemand, M., Wagner, R., Höhler, K., Hiranuma, N., Saathoff, H., and Leisner, T.: A New Ice Nucleation Active Site Parameterization for Desert Dust and Soot, J. Atmos. Sci., 74, 699–717, https://doi.org/10.1175/JAS-D-16-0074.1, 2017. a
Vali, G. and Snider, J. R.: Time-dependent freezing rate parcel model, Atmos. Chem. Phys., 15, 2071–2079, https://doi.org/10.5194/acp-15-2071-2015, 2015. a
Waitz, F., Schnaiter, M., Leisner, T., and Järvinen, E.: In situ observation of riming in mixed-phase clouds using the PHIPS probe, Atmos. Chem. Phys., 22, 7087–7103, https://doi.org/10.5194/acp-22-7087-2022, 2022. a
Wendisch, M., Macke, A., Ehrlich, A., Lüpkes, C., Mech, M., Chechin, D., Dethloff, K., Velasco, C. B., Bozem, H., Brückner, M., Clemen, H.-C., Crewell, S., Donth, T., Dupuy, R., Ebell, K., Egerer, U., Engelmann, R., Engler, C., Eppers, O., Gehrmann, M., Gong, X., Gottschalk, M., Gourbeyre, C., Griesche, H., Hartmann, J., Hartmann, M., Heinold, B., Herber, A., Herrmann, H., Heygster, G., Hoor, P., Jafariserajehlou, S., Jäkel, E., Järvinen, E., Jourdan, O., Kästner, U., Kecorius, S., Knudsen, E. M., Köllner, F., Kretzschmar, J., Lelli, L., Leroy, D., Maturilli, M., Mei, L., Mertes, S., Mioche, G., Neuber, R., Nicolaus, M., Nomokonova, T., Notholt, J., Palm, M., van Pinxteren, M., Quaas, J., Richter, P., Ruiz-Donoso, E., Schäfer, M., Schmieder, K., Schnaiter, M., Schneider, J., Schwarzenböck, A., Seifert, P., Shupe, M. D., Siebert, H., Spreen, G., Stapf, J., Stratmann, F., Vogl, T., Welti, A., Wex, H., Wiedensohler, A., Zanatta, M., and Zeppenfeld, S.: The Arctic Cloud Puzzle: Using ACLOUD/PASCAL Multiplatform Observations to Unravel the Role of Clouds and Aerosol Particles in Arctic Amplification, B. Am. Meteorol. Soc., 100, 841–871, https://doi.org/10.1175/BAMS-D-18-0072.1, 2019. a
Westbrook, C. D. and Illingworth, A. J.: Evidence that ice forms primarily in supercooled liquid clouds at temperatures > −27 °C, Geophys. Res. Lett., 38, https://doi.org/10.1029/2011GL048021, 2011. a, b
Wex, H., Huang, L., Zhang, W., Hung, H., Traversi, R., Becagli, S., Sheesley, R. J., Moffett, C. E., Barrett, T. E., Bossi, R., Skov, H., Hünerbein, A., Lubitz, J., Löffler, M., Linke, O., Hartmann, M., Herenz, P., and Stratmann, F.: Annual variability of ice-nucleating particle concentrations at different Arctic locations, Atmos. Chem. Phys., 19, 5293–5311, https://doi.org/10.5194/acp-19-5293-2019, 2019. a
Zhang, D., Vogelmann, A., Kollias, P., Luke, E., Yang, F., Lubin, D., and Wang, Z.: Comparison of Antarctic and Arctic Single-Layer Stratiform Mixed-Phase Cloud Properties Using Ground-Based Remote Sensing Measurements, J. Geophys. Res.-Atmos., 124, 10186–10204, https://doi.org/10.1029/2019JD030673, 2019. a, b, c
- Abstract
- Introduction
- MOSAiC instrumentation and observational products
- MOSAiC free tropospheric aerosol conditions
- MOSAiC MPC case studies
- MOSAiC statistics of liquid-phase properties of Arctic clouds
- MPC conceptual model: an update
- Conclusion/outlook
- Data availability
- Author contributions
- Competing interests
- Disclaimer
- Acknowledgements
- Financial support
- Review statement
- References