the Creative Commons Attribution 4.0 License.
the Creative Commons Attribution 4.0 License.
 | 10 Oct 2025
Altitude-dependent formation of polar mesospheric clouds: charged nucleation and in situ ice growth on zonal and daily scales
Liang Zhang
Zhongfang Liu
Brian Tinsley
Polar mesospheric clouds (PMCs), composed of ice particles, play a crucial role in mesospheric H2O redistribution, yet their formation mechanism remains incompletely understood. Using the Aeronomy of Ice in the Mesosphere (AIM) satellite observations, we reveal a previously unreported hemispheric asymmetry: southern hemisphere PMCs show a significant latitudinal decrease in column ice particle concentration, while their northern hemisphere counterparts exhibit zero trend. Our further analysis demonstrates that the column-averaged ice particle concentration (Nc) and radius (rc) are primarily governed by PMC height (h), rather than environmental temperature (Tenv). To explain these observations, we propose the charged meteoric smoke particle (MSP) nucleation (CMN) scheme, an altitude-dependent framework based on two key postulates: (1) charged-MSPs serve as ubiquitous ice nuclei throughout the PMC layer, and (2) ice particles grow predominantly in situ with negligible sedimentation. The CMN scheme naturally accounts for the observed vertical gradients in ice particle concentration (increasing with altitude due to charged-MSPs distribution) and size (decreasing with altitude due to H2O competition among ice particles). By eliminating sedimentation, the CMN scheme introduces a novel bottom-up H2O redistribution mechanism we term the cold-trap effect. This mechanism is driven by summer polar upwelling dynamics: upward H2O transport induces hydration, while simultaneous ice particle formation (facilitated by upwelling-induced cooling) blocks further H2O transport, ultimately causing dehydration above PMCs. While the traditional growth-sedimentation (GS) scheme and freeze-drying effect are well-validated, our CMN scheme and cold-trap effect provide an alternative paradigm particularly for understanding zonal and daily-scale PMC variability and associated H2O redistribution processes.
- Article
(14493 KB) - Full-text XML
- BibTeX
- EndNote


Polar mesospheric clouds (PMCs), the highest ice clouds in the Earth's atmosphere, form in summer high latitudes above 80 km where temperatures typically fall below 150 K, serving as important tracers of mesospheric physics and dynamics (Plane et al., 2023; Rapp and Thomas, 2006). Their formation and variability are influenced by complex atmospheric dynamics including gravity waves (Chandran et al., 2012; Gao et al., 2018), planetary waves (France et al., 2018; Liu et al., 2015), tides (Fiedler and Baumgarten, 2018; Liu et al., 2016), and inter-hemispheric coupling (Gumbel and Karlsson, 2011; Karlsson et al., 2009). Solar ultraviolet (UV) radiation additionally modulates PMCs through radiative heating and H2O photolysis (Beig et al., 2008; Shapiro et al., 2012). However, the 27 d solar cycle signature is ambiguous (Dalin et al., 2018; Robert et al., 2010; Thurairajah et al., 2017), and the previously observed 11-year solar cycle influence has notably diminished over recent two decades (Hervig et al., 2019; Vellalassery et al., 2023). The climate sensitivity of PMCs has generated considerable scientific interest. Climate models predict PMC enhancement due to mesospheric cooling from increasing CO2 emission and elevated H2O from CH4 oxidation (Lübken et al., 2018). DeLand and Thomas (2019) reported significant increasing PMC trend in the northern hemisphere (NH). However, the trend in the southern hemisphere (SH) is significant during 1978–1997 but become insignificant during 1998–2018, highlighting interhemispheric differences and complexities in long-term PMC response to climate change.
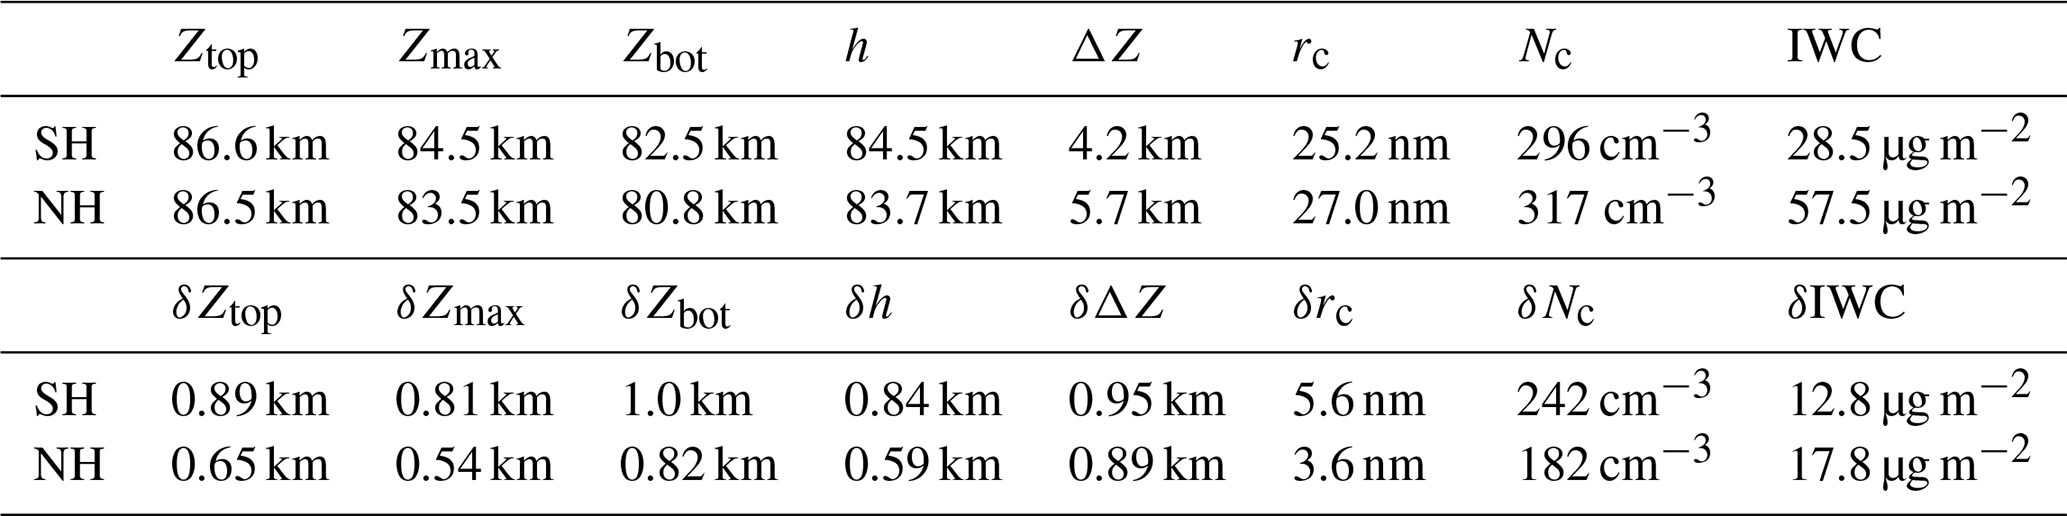
Table 1Mean values and variability of PMC properties observed by SOFIE/AIM at ∼ 70° N/S during PMC seasons (2007–2014). Column-averaged ice particle radius (rc) and concentration (Nc) were averaged between daily mean Zbot and Ztop. Standard deviations (δ) represent the seasonal variability after removing 35 d running means. All data correspond to the core PMC season (−10 to +50 d relative to solstice).
The prevailing growth-sedimentation (GS) framework describes PMC formation and evolution through a sequence of microphysical processes: ice nucleation at cloud top with meteoric smoke particles (MSPs) > 1 nm (critical radius) acting as ice nuclei (Duft et al., 2019), ice particles growth via water vapor deposition, sedimentation under gravity, and eventual sublimation below the supersaturated zone (Hultgren and Gumbel, 2014; Rapp and Thomas, 2006). Implemented in leading PMC models like WACCM-CARMA and LIMA-MIMAS, the GS scheme successfully explains many aspects of observed PMC variability (Bardeen et al., 2010; Kuilman et al., 2017; Lübken et al., 2018).
However, critical uncertainties remain regarding ice nuclei availability. MSPs form through meteor ablation and recondensation, their size distribution follows a power law resulting in abundant small particles but scarce large particles (Plane, 2012; Scales and Mahmoudian, 2016). However, meridional circulation transports larger MSPs to winter hemisphere, potentially causing an ice nuclei deficit (Megner et al., 2008a, b). To address this limitation, charged MSPs have been proposed as alternative ice nuclei, which are abundant in the mesosphere and the charges reduce their critical radius by electric forces (Gumbel and Megner, 2009; Megner and Gumbel, 2009). Supporting evidence includes observed correlations between ice particle size and solar wind magnetic field (Zhang et al., 2022). Nevertheless, fundamental questions remain regarding MSP charging process and their spatiotemporal distribution. (Antonsen et al., 2017; Dawkins et al., 2023; Hervig et al., 2022; Knappmiller et al., 2011).
PMCs are suggested to affect upper mesospheric ozone chemistry and climate through H2O modulation (Siskind et al., 2008; Siskind et al., 2018). The widely recognized freeze-drying effect derived from GS scheme describes a top-down H2O redistribution process: ice particle sedimentation dehydrates air above PMCs, while subsequent sublimation hydrates regions below (Hervig et al., 2015; Lübken et al., 2009; Vellalassery et al., 2023). Although conceptually robust, models implementing freeze-drying effect tend to overestimate dehydration/hydration magnitudes (Bardeen et al., 2010; Lübken et al., 2009), indicating incomplete physical understanding.
This study presents new insights into PMC formation through analysis of AIM satellite observations. Section 2 describes the dataset and methods. Section 3 examines the PMC variability with latitude, altitude, temperatures. Section 4 introduces an innovative altitude-dependent PMC formation scheme and proposes a novel bottom-up H2O redistribution mechanism. Section 5 presents our concluding remarks and implications.
The PMC data used in this study were observed by the Solar Occultation for Ice Experiment (SOFIE) and Cloud Imaging and Particle Size (CIPS) instruments aboard the Aeronomy of Ice in the Mesosphere (AIM) satellite. Launched on 25 April 2007, the AIM satellite operates in a sun-synchronous polar orbit, providing approximately 15 daily observations of the PMC region (Russell III et al., 2009). The contact with AIM was lost due to battery fail in 2023, and the satellite re-entered the Earth's atmosphere in 2024.
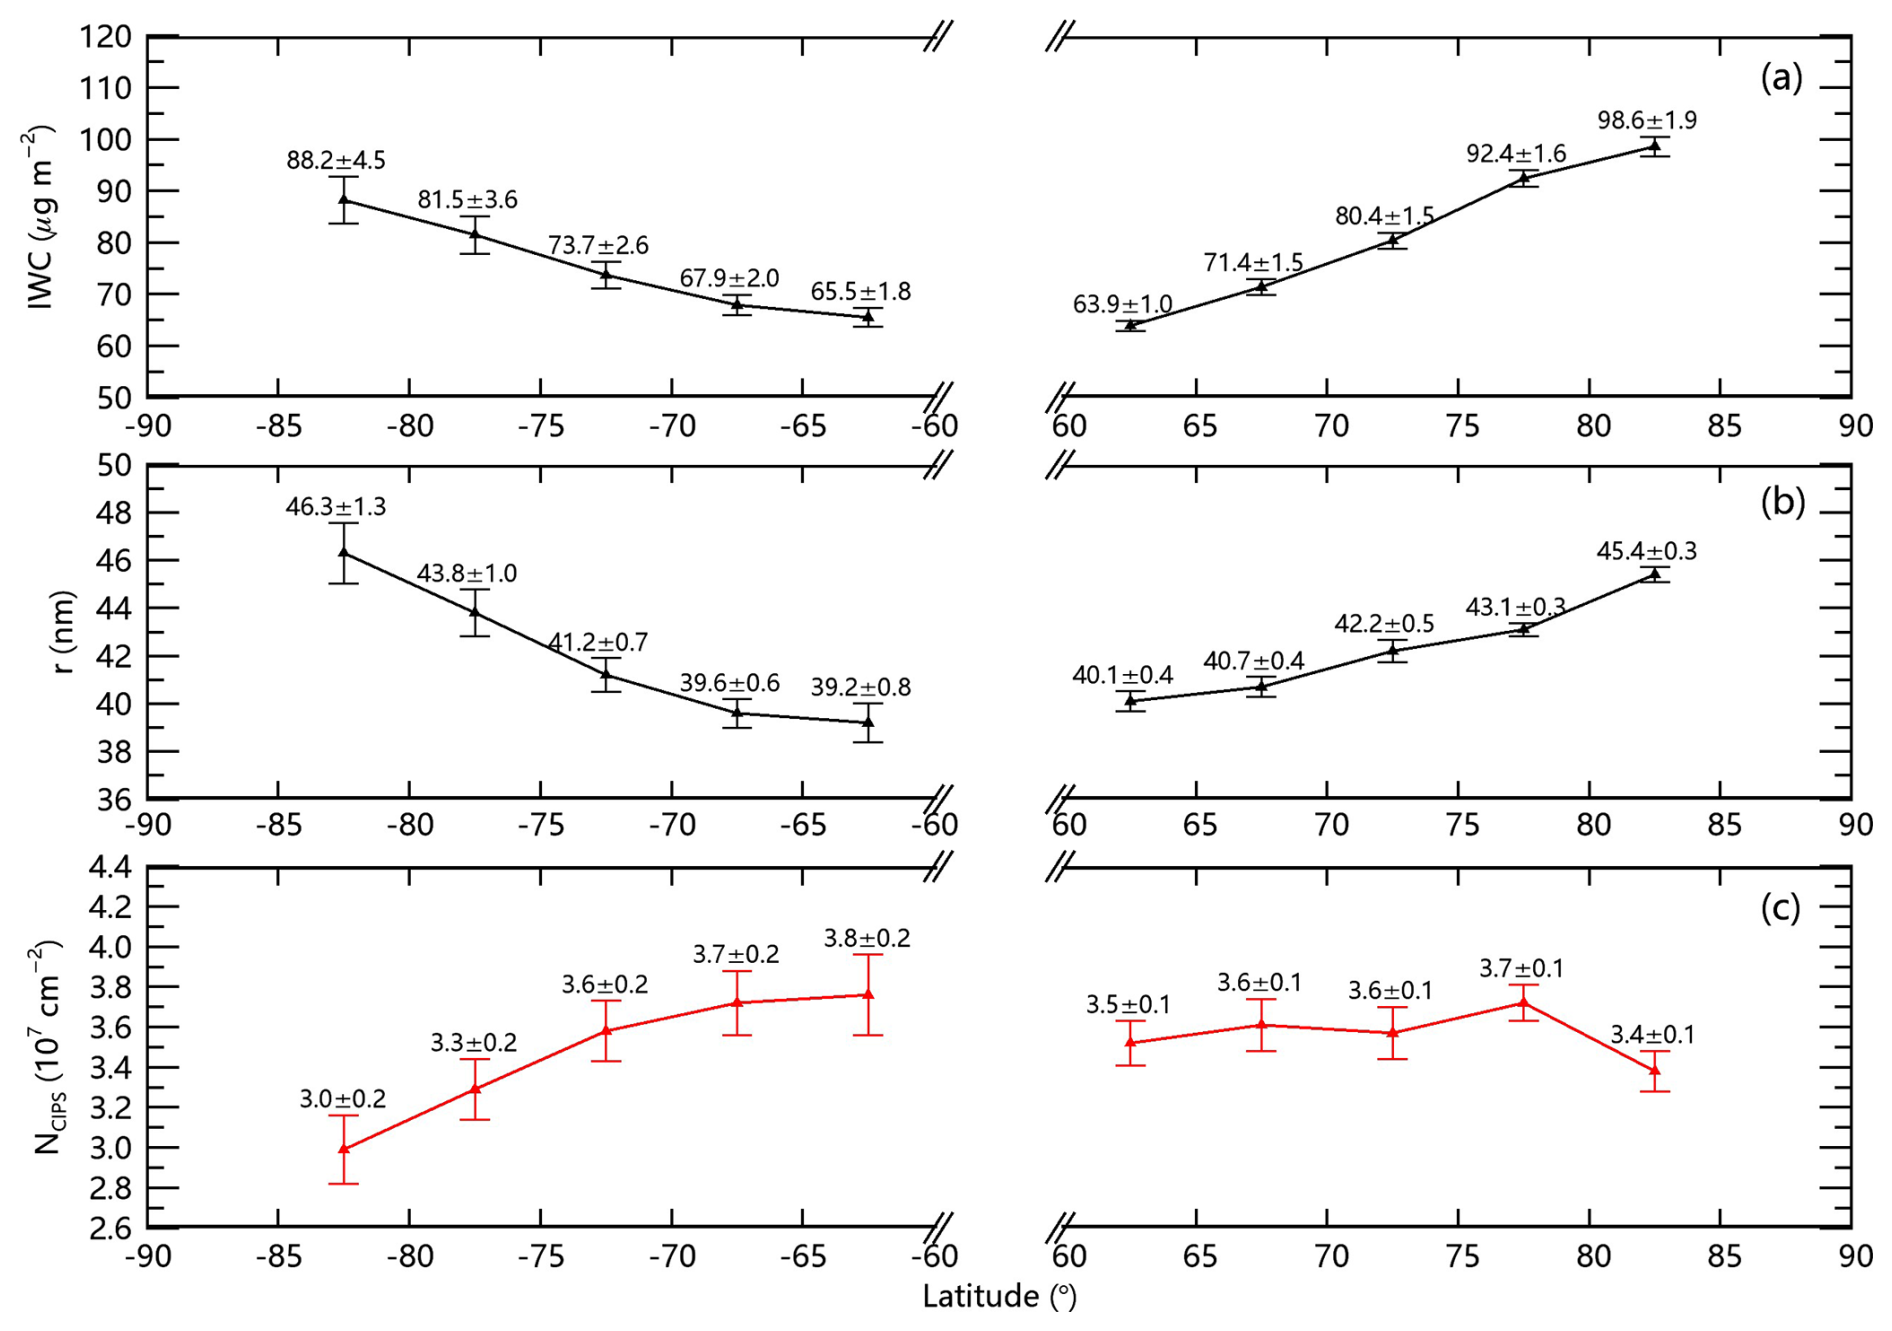
Figure 1Latitudinal variations of (a) ice water content (IWC), (b) ice particle column radius (r), and (c) ice particle column concentration (NCIPS) in both hemispheres (60–85° latitude). Data from CIPS/AIM observations during 10 PMC seasons (2007–2017), with the PMC season defined as −10 to 50 d after solstice. Error bars represent ±1σ (standard deviation of the mean) interannual variability.
The SOFIE instrument employs solar occultation techniques to measure vertical profiles of PMC properties (ice particle concentration and radius), atmospheric temperature, and H2O mixing ratio (Gordley et al., 2009; Hervig et al., 2009a). The latitude coverage of SOFIE/AIM shifts from approximately 65° toward 74° during the core PMC season (from −10 to +50 d relative to solstice), with a mean observational latitude near 70° in both hemispheres. The latitude coverage of SOFIE shifts equatorward each season and moved to mid-latitudes (∼ 55° N/S) by 2015, where PMC occurrence frequency is very low (Hervig et al., 2016). Consequently, SOFIE collected usable data for 8 PMC seasons (2007–2014) in the NH and 7 PMC seasons (2007/2008–2013/2014) in the SH. The CIPS instrument is a UV nadir imager that captures PMC characteristics including ice particle radius, albedo, and ice water content (IWC) with a high spatial resolution of 5 × 5 km across 40–85° latitude (Carstens et al., 2013; Lumpe et al., 2013), with data available for 10 PMC seasons in both hemispheres (NH: 2007–2016; SH: 2007/2008-2016/2017). Ice particle column concentration NCIPS was derived from the relationship , where Mice represents the mass of ice particles calculated asMice= 4πr3ρice/3, with an assumed ice density ρice ≈ 0.92 g cm−3.
SOFIE/AIM provides measurements for altitude of the top (Ztop), maximum (Zmax) and bottom (Zbot) of PMC layers. The daily mean PMC heighth (approximately equal to Zmax) was calculated as (Ztop+ Zbot)/2, serving as a forcing variable in this paper, and the daily mean PMC thickness (ΔZ) was defined as Ztop−Zbot. Column-averaged ice particle radius (rc) and concentration (Nc) were obtained by averaging values between daily mean Zbot and Ztop for each profile. As summarized in Table 1, the SH exhibits a ∼ 1 km higher mean PMC height (84.5 km) compared to the NH (83.7 km), consistent with simulations and ground observations (Chu et al., 2006; Lübken and Berger, 2007). Notably, all measured parameters show greater seasonal variability (quantified by standard deviations) in the SH than that in the NH, likely reflecting stronger dynamical influences in southern polar regions compared to their northern counterparts.
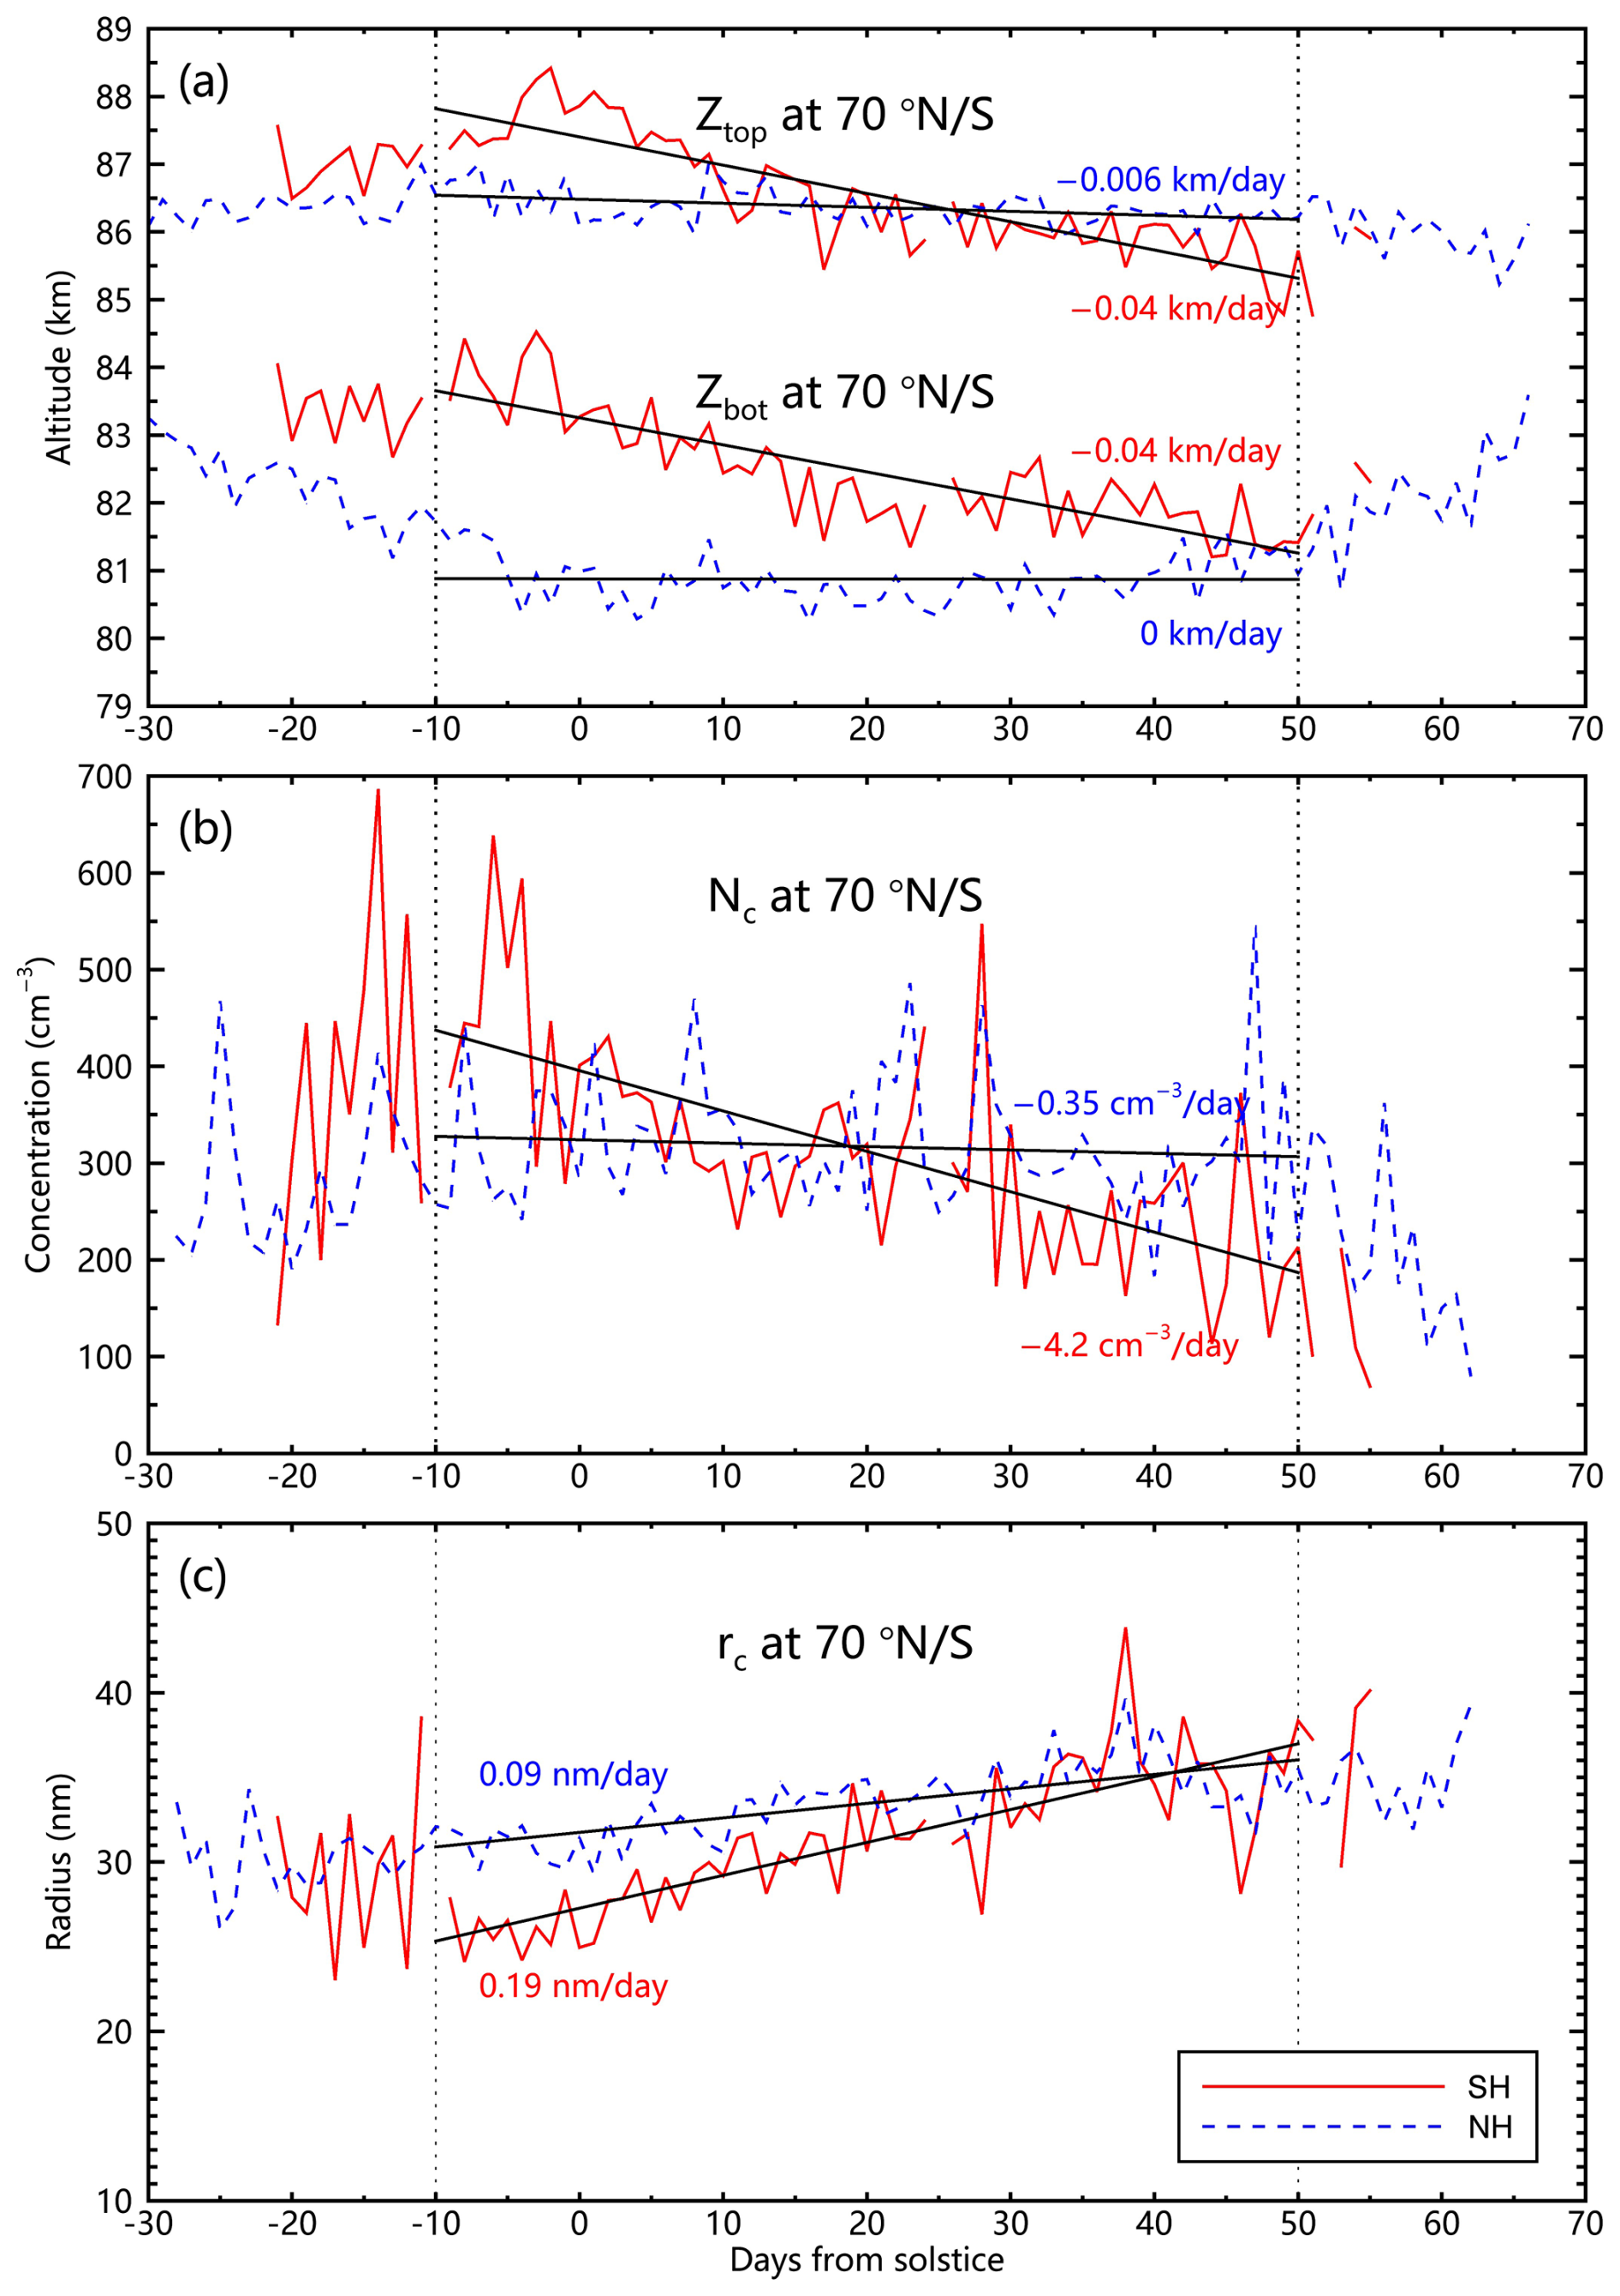
Figure 2Hemispheric differences in seasonal trends of PMC properties at ∼ 70° latitude: (a) Temporal evolution of cloud-top (Ztop) and cloud-base (Zbot) altitudes, (b) column-averaged ice particle concentration (Nc, averaged between the daily Zbot and Ztop), and (c) column-averaged ice particle radius (rc). Solid red and dashed blue lines denote SH and NH trends, respectively, based on SOFIE/AIM data (2007–2014) during core PMC season (−10 to +50 d relative to solstice).
3.1 Latitude variability of PMC properties
Analysis of CIPS/AIM observations reveals distinct latitudinal gradients in PMC properties from 60 to 85° in both hemispheres (Fig. 1). Consistent with theoretical expectations, IWC and ice particle radius exhibit positive latitudinal gradients in both hemispheres (Fig. 1a–b), reflecting enhanced cloud formation under the colder temperatures and elevated H2O mixing ratios at higher latitudes. However, the SH displays a surprising negative gradient in column ice particle concentration (NCIPS), directly contradicting predictions from the conventional GS framework (Fig. 1c). While the GS mechanism predicts increasing NCIPS with latitude due to extended particle residence times in thicker cloud layers, the observed SH trend challenges this paradigm and suggests limitations in current microphysical understanding. Notably, this anomalous pattern exhibits strong hemispheric asymmetry, as NH NCIPS values remain essentially latitude-independent.
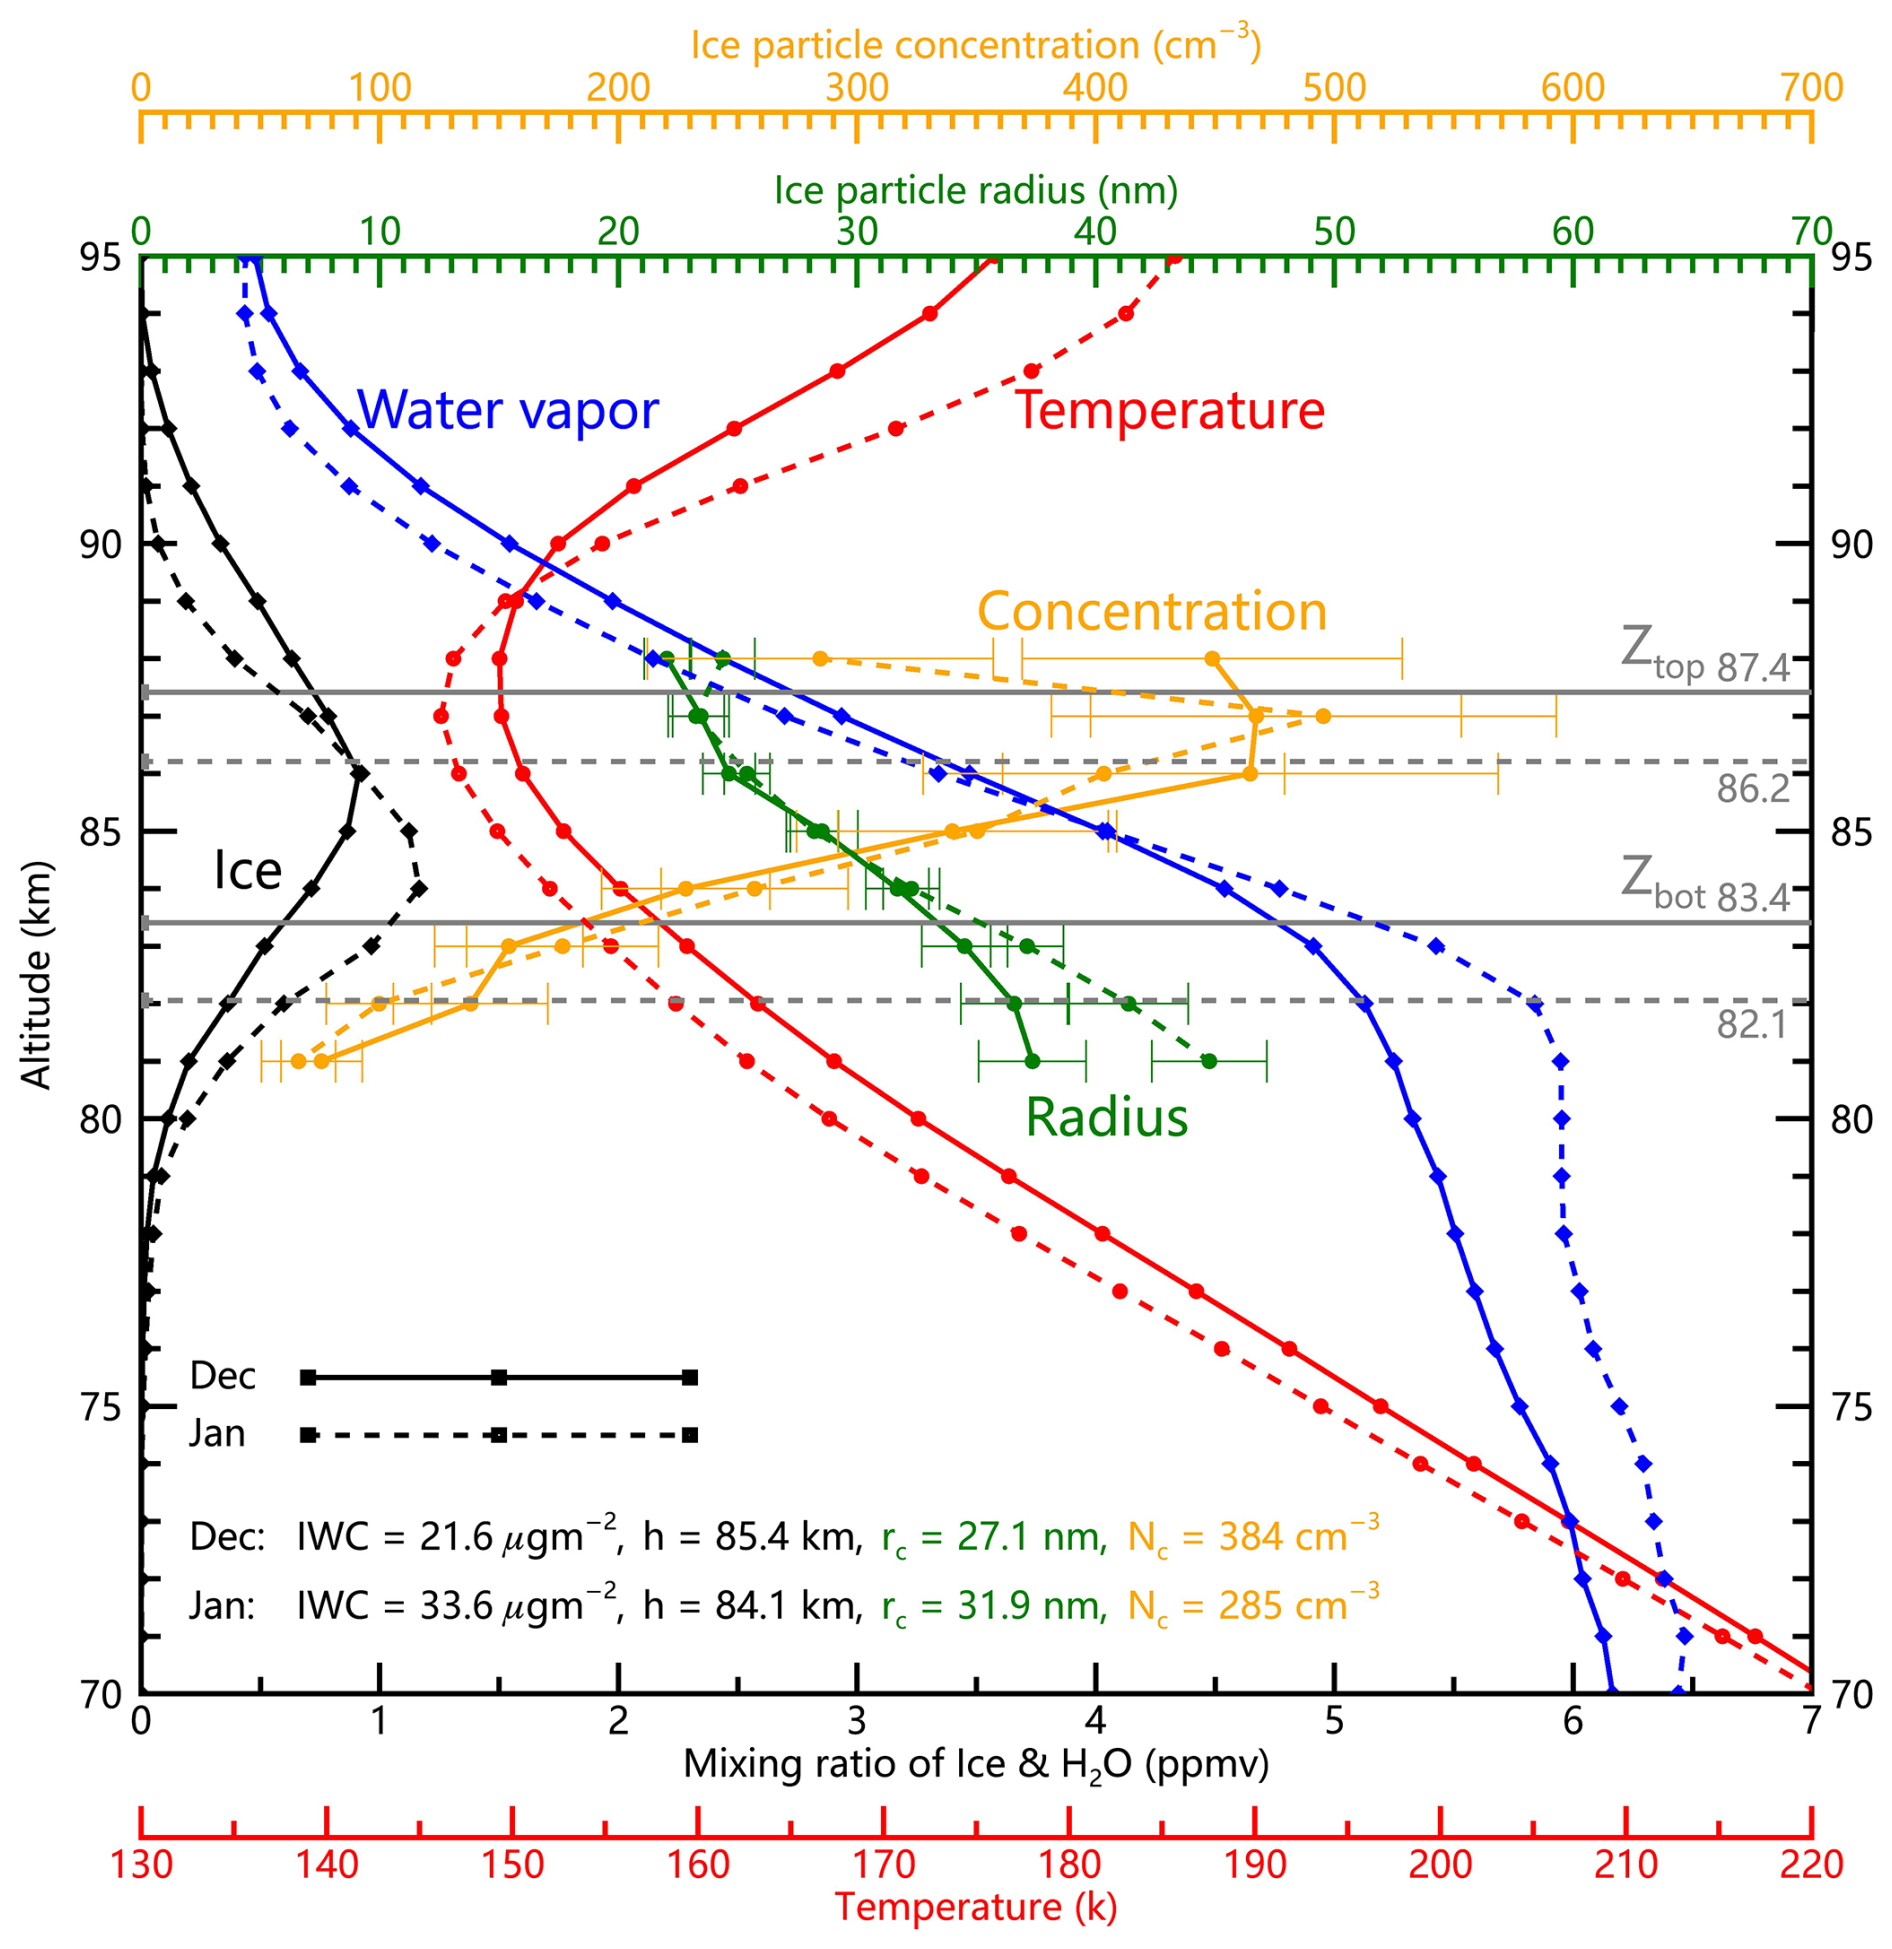
Figure 3Comparative vertical profiles of temperatures, H2O (water vapor) mixing ratio, ice (in unit of ppmv), ice particle concentration, and ice particle radius between December (solid lines) and January (dashed lines). The PMC height h is the mean of Ztop and Zbot. The column-averaged ice particle concentration Nc and radius rc are averaged between Zbot and Ztop. The data are observed by SOFIE/AIM at ∼ 70° S from 2007 to 2014.
Figure 4NH counterpart to Fig. 3, showing vertical profiles of the same parameters between June and July at ∼ 70° N.
3.2 Hemispheric differences in seasonal trends
SOFIE observations at ∼ 70° N/S reveal pronounced interhemispheric contrasts in PMC seasonal evolution (Fig. 2). The SH exhibits a coherent ∼ 0.04 km d−1 descent in both cloud top (Ztop) and bottom (Zbot), while NH heights remain stable – a pattern corroborated by ground-based lidar observations in the NH (Lübken et al., 2008) and SH (Chu et al., 2006). The limb satellite measurements of both the SNOE and OMPS LP data also confirm the decreasing PMC altitudes in the SH during core PMC season (Bailey et al., 2005; DeLand and Gorkavyi, 2021). More strikingly, column-averaged ice particle concentration (Nc) decreases substantially in the SH (4.2 cm−3 d−1) while remaining nearly constant in the NH, whereas column-averaged ice particle radius (rc) increases in both hemispheres (SH: 0.19 nm d−1; NH: 0.09 nm d−1). The tight coupling between Nc and h variations strongly suggests that PMC height h actively governs microphysical processes rather than simply reflecting geometric cloud properties.
Figure 5Relationship between PMC height h and column-averaged ice particle radius rc in the NH applying SOFIE/AIM at ∼ 70° N (2007–2014): left panels display the rc (averaged between Zbot and Ztop) and h (the mean of Zbot and Ztop) after removing 35 d running means; right panels show corresponding correlation coefficients for the core PMC season (−10 to +50 d relative to solstice).
Figure 7Intercomparison of correlation coefficients between PMC microphysical parameters (Nc, rc) and cloud structural characteristics (h, ΔZ) for both hemispheres. The correlation coefficients between h andrc are shown in Figs. 5–6. All values derived from SOFIE/AIM data at ∼ 70° N/S during core PMC season (−10 to +50 d relative to solstice), with the 35 d running mean removed. The error bars represent the standard deviation of the mean across PMC seasons (2007–2014), and the dashed lines mark the 0.95 significant level.
3.3 Vertical profiles between December (June) and January (July)
Comparative analysis of December-January profiles (Fig. 3) demonstrates significant monthly variations in SH PMC characteristics fundamentally controlled by upwelling. Enhanced summer polar upwelling in January drives more pronounced adiabatic cooling (reducing by ∼ 4 K near 80 km) and stronger vertical H2O transport (increasing by 0.5 ppmv near 80 km), creating more favorable conditions for ice growth that yield higher IWC values compared to December (33.6 vs. 21.6 µg m−2). Remarkably, despite these environmental changes, vertical profiles of ice particle concentration and radius remain stable between the two months, suggesting nucleation processes are largely decoupled from local temperature and H2O variations. The observed 1.3 km depression in PMC height h during January (Ztop: 86.2 km vs. December's 87.4 km; Zbot: 82.1 km vs. 83.4 km) coincides with a 26 % reduction in column-averaged ice particle concentration Nc (285 cm−3 vs. 384 cm−3) but a 4.8 nm increase in ice particle radius (31.9 nm vs 27.1 nm), consistent with our height-dependent nucleation hypothesis. More detailed discussion for results in Fig. 3 will be provided later in Sect. 4.4.
Parallel analysis of NH profiles (Fig. 4) between June and July reveals similar h−Nc relationships, with stable PMC altitudes (July: 83.5 km vs. June: 83.9 km) and nearly constant column-averaged ice particle concentrations (313 cm−3 vs. 334 cm−3). The observed 4 nm radius increase (34.7 nm vs. 30.7 nm) appears driven primarily by enhanced H2O availability rather than height or concentration variations. These intermonth comparisons collectively demonstrate that PMC altitude predominantly regulates ice particle concentration, while particle size responds to both PMC height (via concentration) and H2O abundance.
In addition, the differences in the monthly-mean sampling latitude of SOFIE between compared months are small (e.g., December vs. January in the SH: 3.1°; June vs. July in the NH: 2.0°). The pronounced contrasts in temperature, H2O, and PMC properties between these months, as shown in Figs. 3–4, are therefore attributable to intra-seasonal atmospheric dynamics rather than to minor latitudinal differences.

Figure 8Correlations between PMC characteristics and environmental temperatures (Tenv). PMC properties include column-averaged ice particle radius (rc), concentration (Nc), PMC height (h), and thickness (ΔZ). Tenv is the mean temperature between 80 and 88 km. Similar to Fig. 7, the SOFIE/AIM data at ∼ 70° N/S from 2007 to 2014 during core PMC season (−10 to +50 d relative to solstice) were applied, with the 35 d running mean removed. The error bars represent the standard deviation of the mean across PMC seasons (2007–2014), and the dashed lines mark the 0.95 significant level.
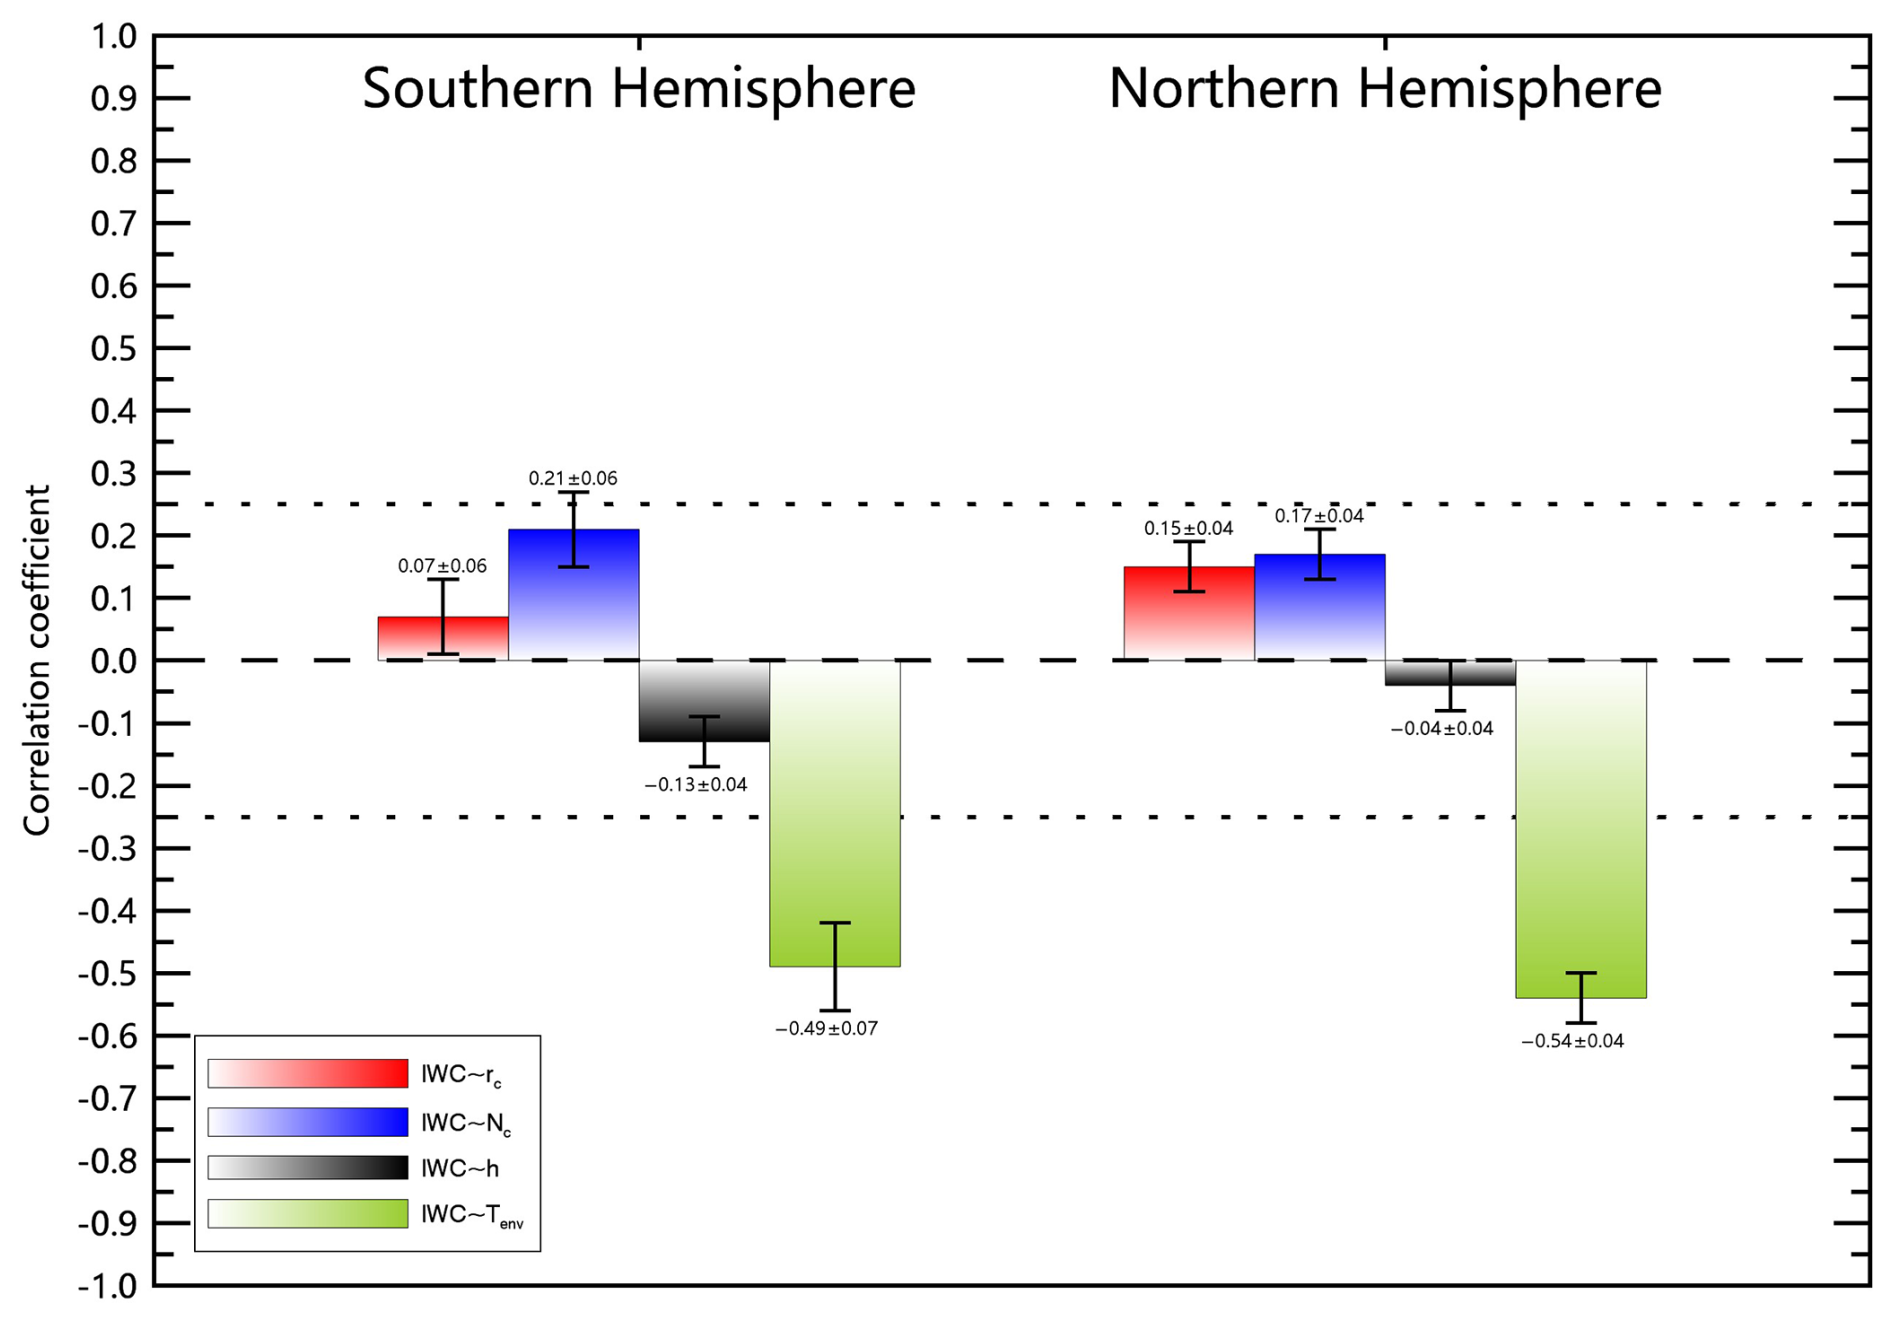
Figure 9Correlation coefficients between IWC and variables including the column-averaged ice particle radius (rc), concentration (Nc), PMC height (h), and the mean environmental temperature (Tenv). The dataset are similar to Fig. 8.
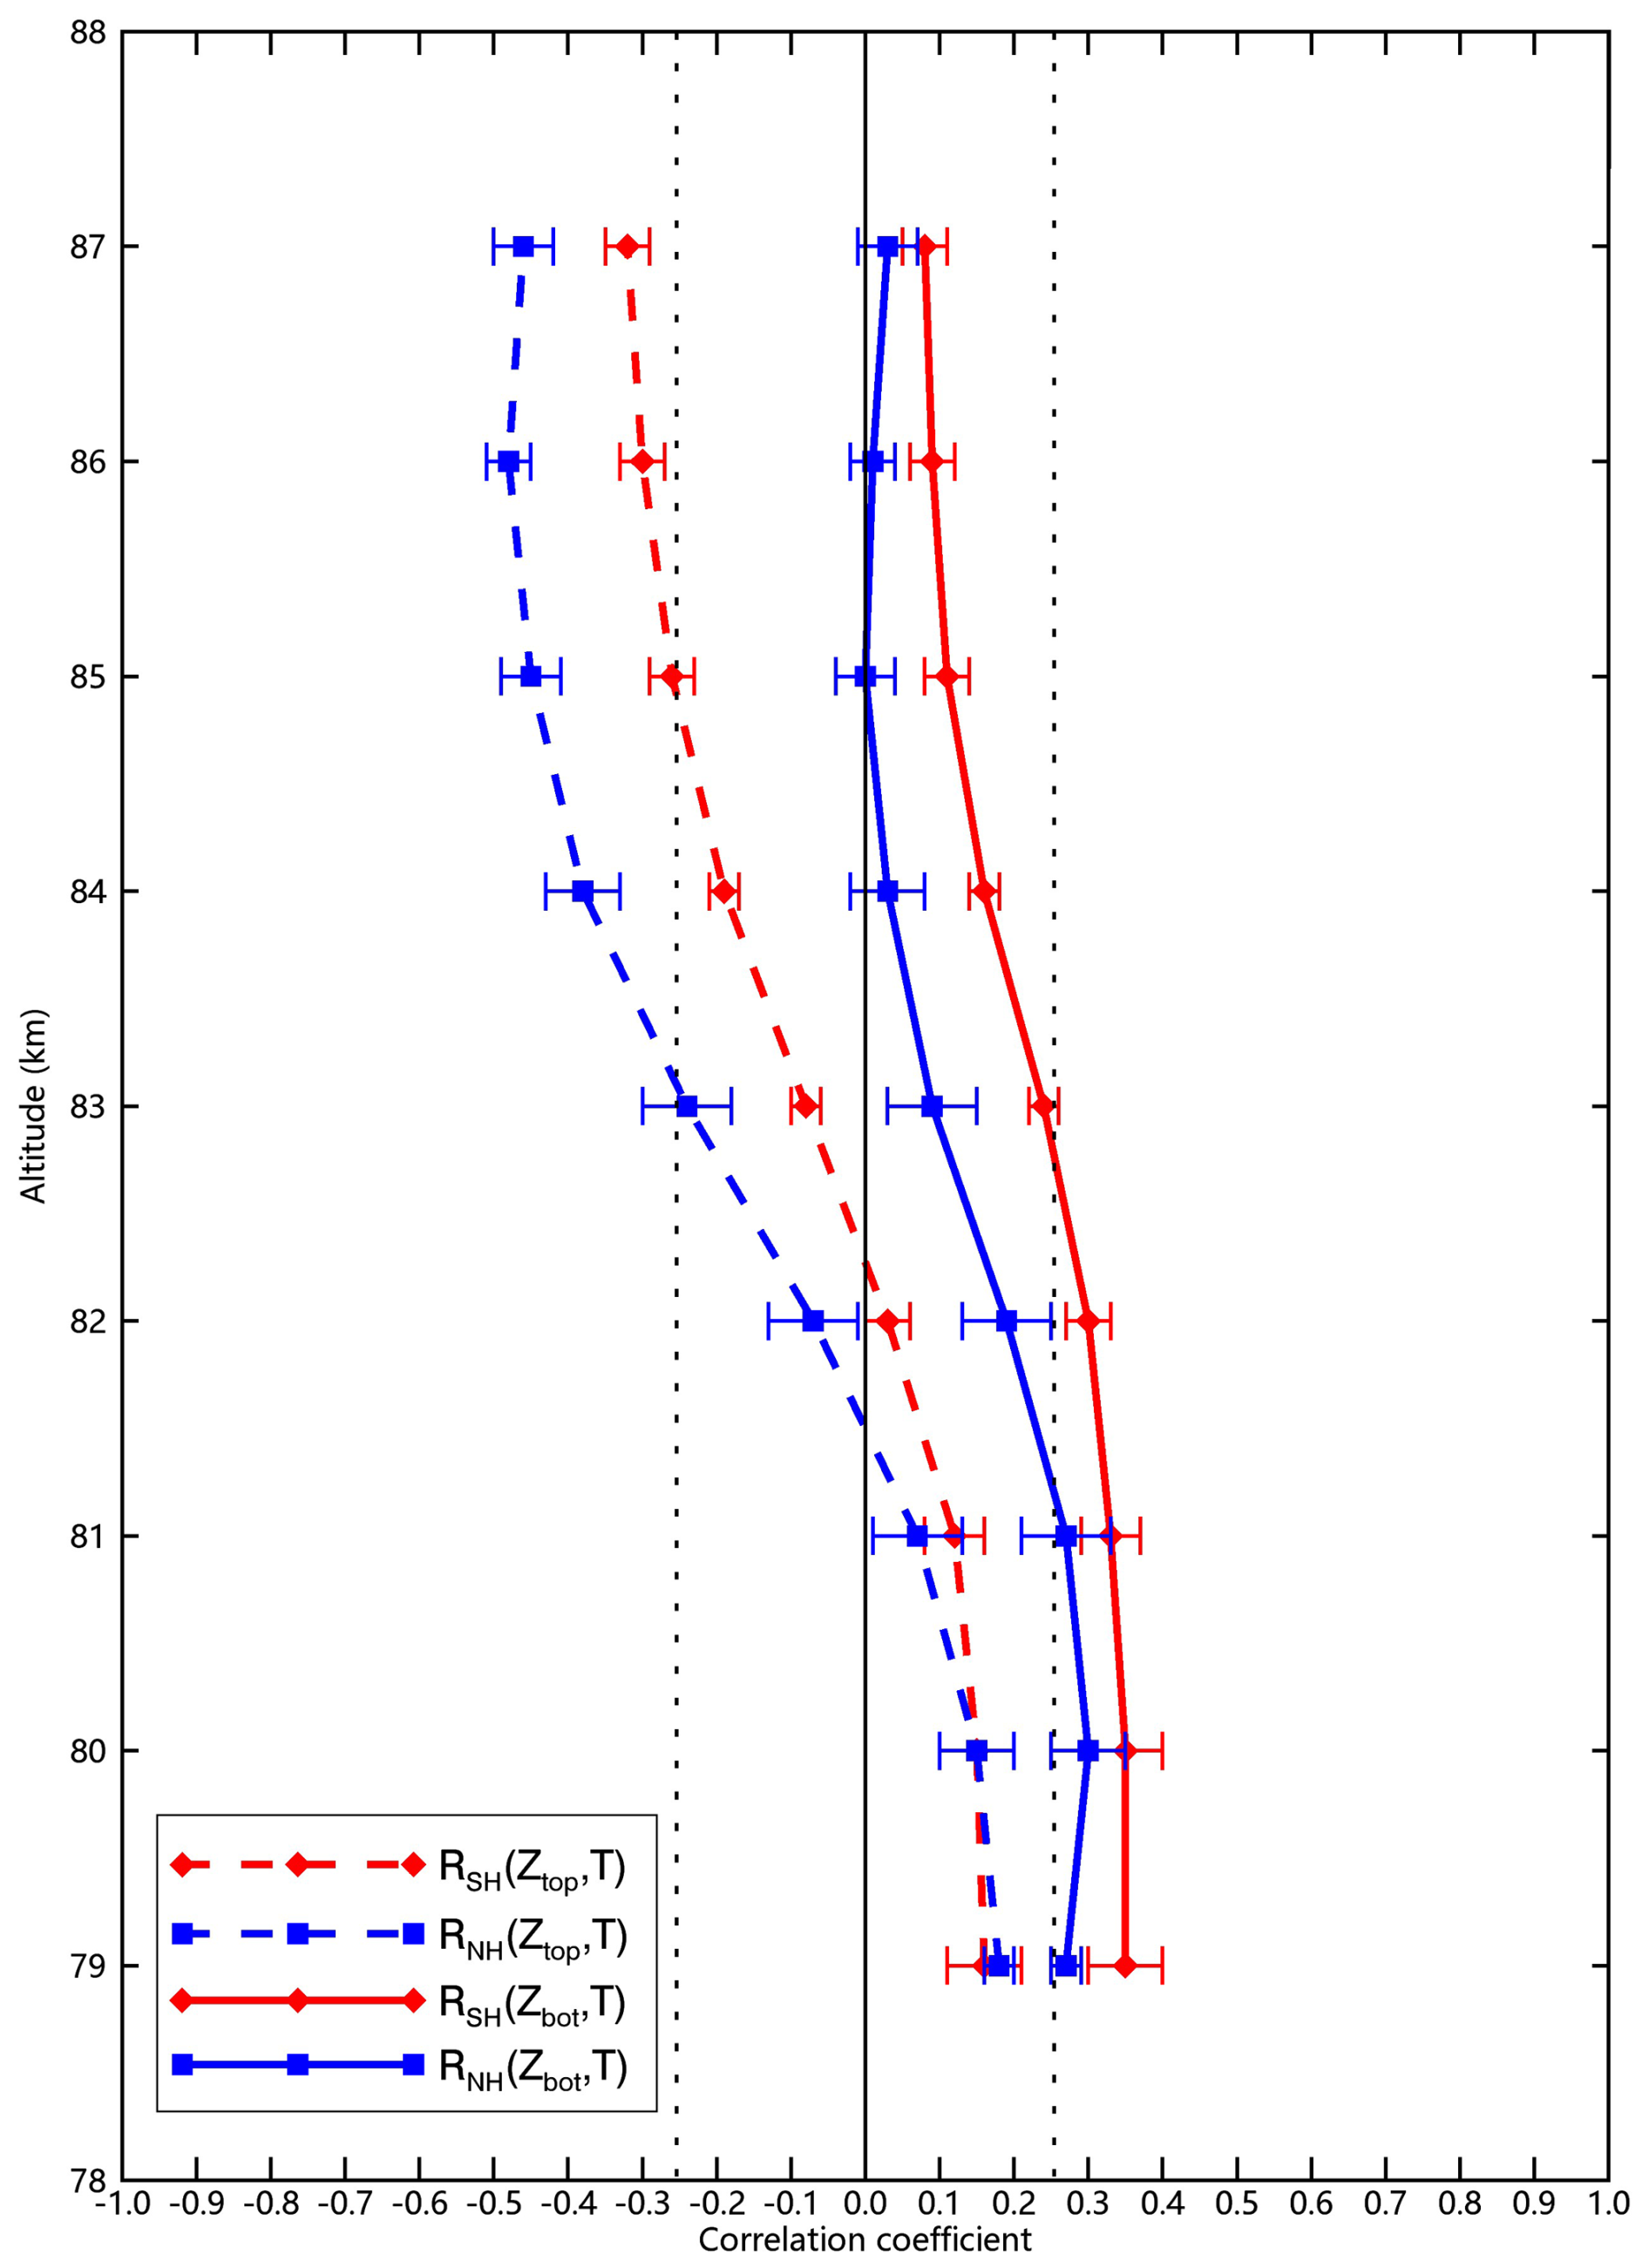
Figure 10Cloud-top (Ztop) and cloud-bottom (Zbot) temperature sensitivity profiles for both hemispheres (SH: red; NH: blue). Zbot (solid lines) is positively correlated with temperatures below PMCs, and Ztop (dashed lines) is negatively correlated to temperatures above PMCs, possibly due to changes in supersaturated zone. The SOFIE/AIM data at ∼ 70° N/S from 2007 to 2014 during core PMC seasons (−10 to +50 d relative to solstice) were applied, with the 35 d running means removed. The error bars represent the standard deviation of the mean across PMC seasons (2007–2014), and the dashed lines mark the 0.95 significant level.
3.4 Height-dependent control of PMC microphysics
Our analysis of PMC height (h) relationships with ice particle characteristics reveals fundamental patterns that challenge conventional understanding (Figs. 5–7). A robust anti-phase relationship emerges between h and column-averaged ice particle radius (rc), with consistent negative correlations across all PMC seasons (0.46 in SH, −0.51 in NH) in both hemispheres (Figs. 5–6). Complementary positive correlations exist between h and column-averaged ice particle concentration (Nc) (R = 0.27 in SH, 0.26 in NH) in both hemispheres (the real-time relationships are not shown). Notably, PMC thickness (ΔZ) shows no significant correlation with either microphysical parameter (Fig. 7), directly contradicting GS framework predictions. The GS scheme anticipates that thicker PMC layers (larger ΔZ) should promote particle growth through extended residence times, while it considers cloud height (h) merely as a passive indicator of environmental conditions rather than an active control parameter. Our findings reveal the opposite, with h exerting dominant control over both Nc and rc, while ΔZ showing negligible influence.
It is noteworthy that the latitude coverage of SOFIE/AIM drifts by ∼ 9° over the core PMC season (from −10 to 50 d relative to solstice). To assess the potential influence of this drift, we conducted a sensitivity test using narrower PMC season definition (from −10 to 30 d relative to solstice), within which the latitudinal shift is reduced to ∼ 4°. The key relationships in Figs. 5–7 remain consistent under this reduced window (not shown), confirming that the reported correlations are robust and unaffected by latitudinal drift. Moreover, the 35 d running mean applied to all data in Figs. 5–7 effectively removes longer-term trends, including those related to orbital drift, thereby further minimizing potential influence from gradual latitudinal changes on the daily anomalies under study.
3.5 Decoupled environmental temperature and microphysics relationships
Temperature plays an important role in the formation of ice particles, and controls the PMC seasonal onset and termination (Lee et al., 2024; Rong et al., 2012). Figures 8–9 reveal that the environmental temperature (Tenv, averaged between 80–88 km) shows expected control over PMC macroscopic properties, by driving both increased cloud thickness (ΔZ) and ice water content (IWC). However, the influence of Tenv on microphysical parameters is contrary to traditional GS scheme predictions, with PMC height (h), ice particle concentration (Nc), and radius (rc) all exhibiting statistically insignificant correlations with Tenv and IWC (Figs. 8–9). This decoupling stems from compensatory vertical shifts in cloud boundary adjustments: colder Tenv simultaneously elevates Ztop and lowers Zbot via the expansion of supersaturated zone, maintaining stable mean heights (Fig. 10). Results in Figs. 7–9 identifies two distinct parameter clusters of microphysical group (h, Nc, rc) and thermodynamic group (Tenv, ΔZ, IWC), which are internally correlated but mutually independent. Nevertheless, in the GS scenario, lower environmental temperatures should enhance nucleation and growth, leading to larger column-averaged ice particle concentration and radius, thus the observed absence of correlation between Tenv and contradicts this expectation, suggesting that the GS scheme does not fully capture the microphysical processes governing PMC formation.
4.1 The charged-MSPs nucleation scheme for PMC formation
Building upon the demonstrated control of PMC height h over ice particle microphysics, we propose a novel altitude-dependent framework for PMC formation, termed as the charged-MSPs nucleation scheme. In contrast to the well-established GS scheme, which has been validated for individual PMC, the charged-MSP nucleation (CMN) scheme is a statistical model designed to explain zonal and daily-mean scale PMC properties. The CMN scheme rests on two foundational premises illustrated in Fig. 11: (1) Ubiquitous ice nucleation by charged-MSPs throughout the supersaturated zone. The charged-MSPs, though small, are abundant in upper mesosphere, whose concentration increases rapidly with altitude due to the distribution of electrons produced by solar UV ionization. Their electric charges enhance water molecule attraction, effectively lowering the energy barrier for ice nucleation (Gumbel and Megner, 2009; Megner and Gumbel, 2009). It is important to note that although charged-MSPs are proposed as the most plausible ice nuclei in this study, the CMN framework can be generalized to other potential candidates – such as neutral MSPs or ion clusters – provided that their concentrations are abundant and increase sharply with altitude. (2) Dominantly in situ ice growth with negligible sedimentation effects. Ice particles grow continuously within their formation layer until the environment transitions from supersaturated to unsaturated, at which point the PMC reaches equilibrium with the surrounding environment (Christensen et al., 2016; Hervig et al., 2009b). The cloud dissipation is not driven by particle fallout but by a rapid large-scale thermodynamic disruption, which raises local temperatures above the saturation threshold and leads to instantaneous sublimation throughout the cloud layer.
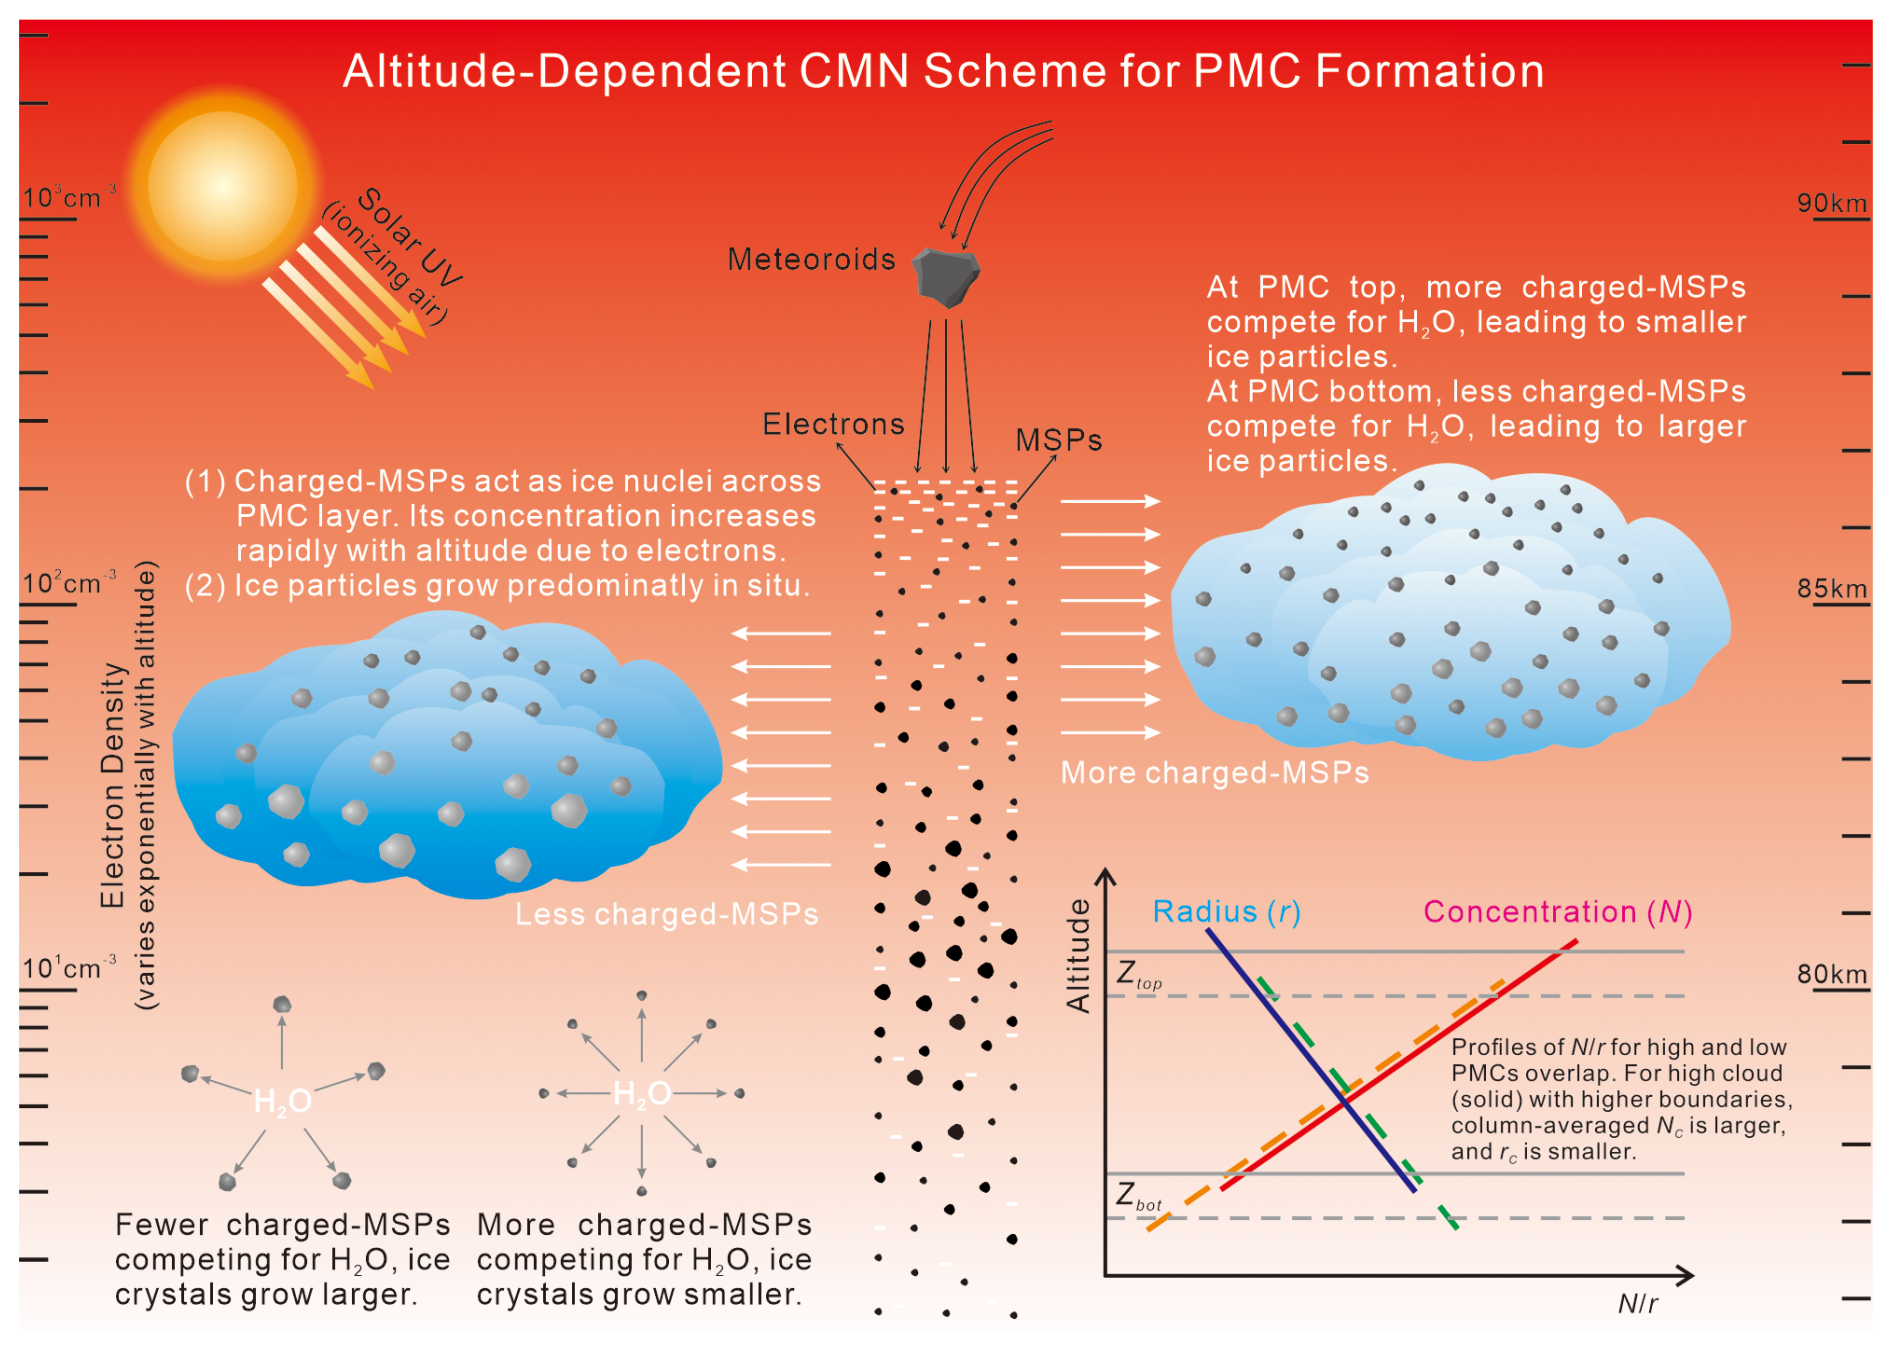
In the CMN scenario, the vertical profile of ice particle concentration (increasing with altitude due to the vertical distribution of charged-MSPs) and radius (decreasing with altitude due to the competition for H2O among ice particles) inside the PMC emerge naturally, in which sedimentation is unnecessary. The profiles of ice particle concentration between high PMC and low PMC are overlapped, and the column-averaged ice particle concentration (Nc) is larger for high PMC simply because its higher boundary, as previously illustrated in Fig. 3.
The competition for limited H2O results in a negative relationship between ice particle radius and ice particle concentration. At the top of PMCs, there are more charged-MSPs but less H2O, resulting in smaller ice particles; Similarly, ice particles at the bottom of PMCs are larger due to the fewer charged-MSPs but abundant H2O. Figure 12 illustrates intense competition for H2O throughout the saturation zone via the negative correlation between ice particle radius and concentration at each altitude, demonstrating that there is an excess of ice nuclei throughout the PMC altitude range. Considering the scarcity of large MSPs (Megner et al., 2008a, b), Fig. 12 in turn supports the small but abundant charged-MSPs to act as ice nuclei.
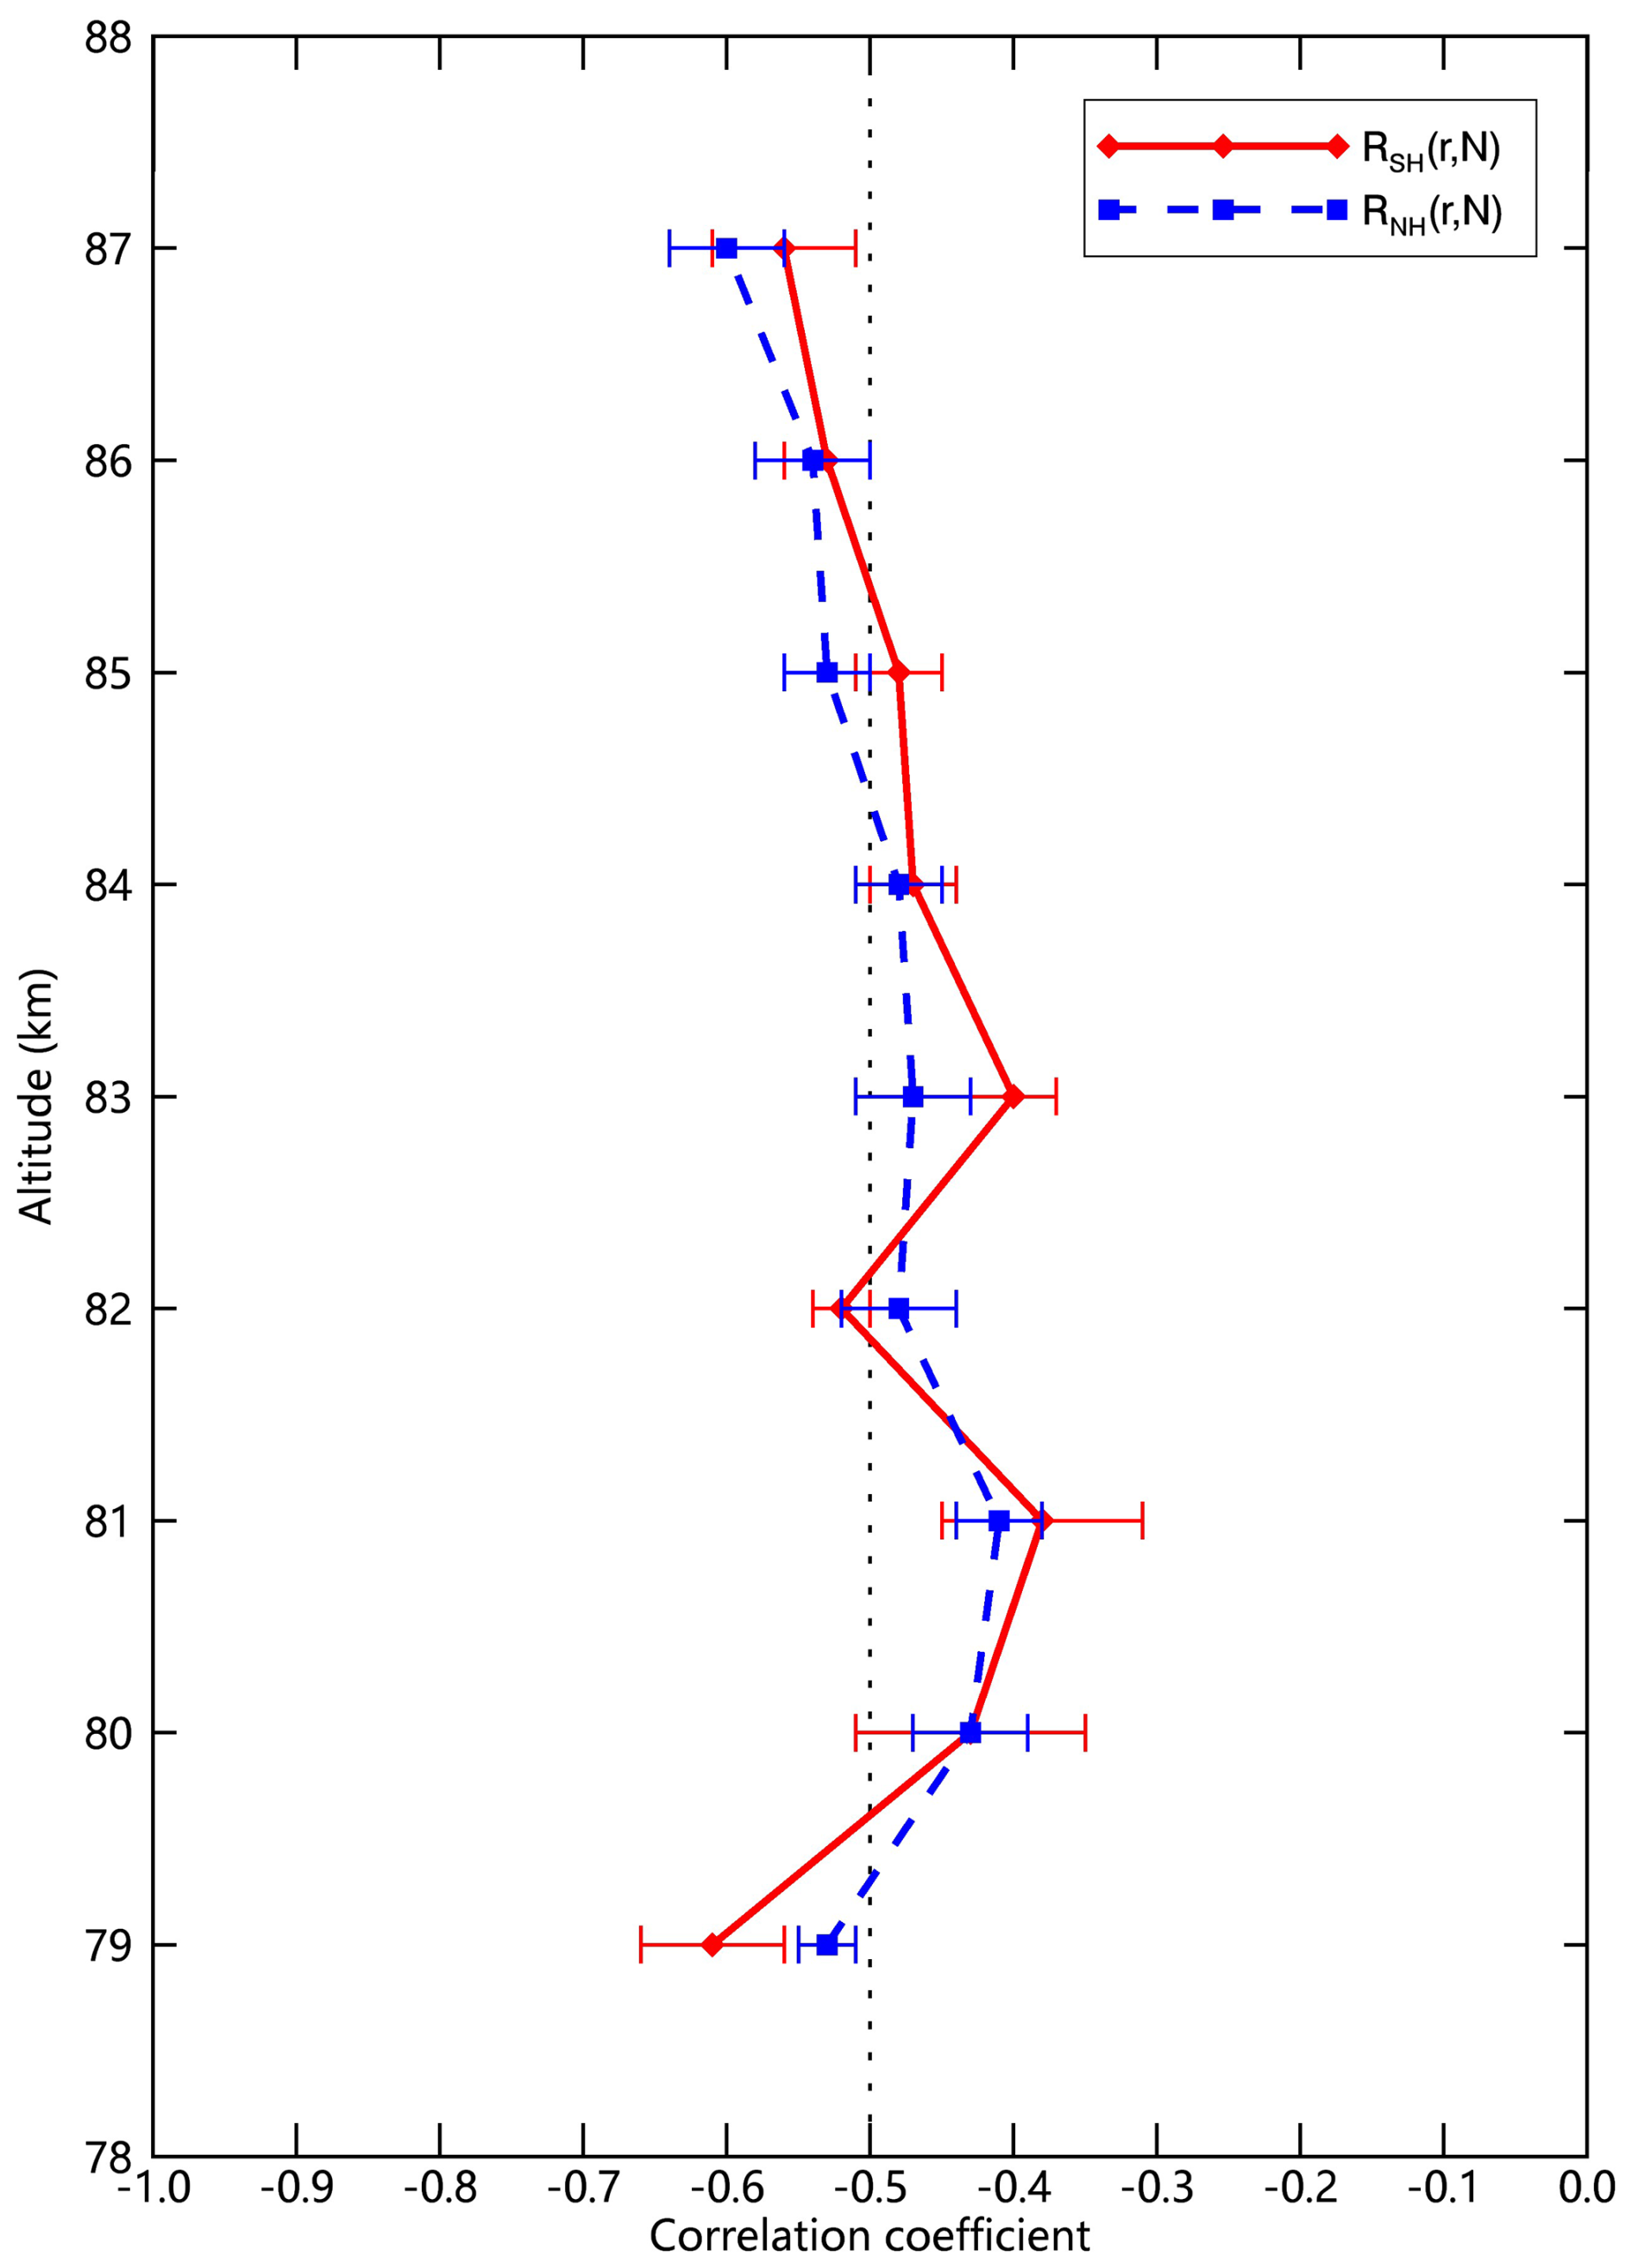
Figure 12Altitude-resolved anti-correlation between daily mean ice particle radius (r) and concentration (N) derived from SOFIE/AIM data at ∼ 70° N/S (2007–2014). The negative relationships across all altitude during core PMC season (−10 to +50 d relative to solstice) presumably support the CMN scheme's assumption of growth competition for limited H2O throughout PMC range. The error bars represent the standard deviation of the mean across PMC seasons (2007–2014), and the 35 d running means have been removed.
4.2 Key observations explained by CMN framework
4.2.1 Decoupling between ice particle concentration and IWC
Figures 7–9 demonstrate two statistically independent clusters (h, Nc, rc) and (Tenv, ΔZ, IWC), in the zonal and daily-mean scale observations. Section 4.1 has discussed that in the CMN scenario the microphysical group (h, Nc, rc) are governed by charged-MSP distribution and H2O competition. On the other hand, the near equilibrium between PMCs and environment (derived from the in-situ growth assumption) in CMN scheme builds a direct link between IWC and Tenv, with colder conditions expand the supersaturated zone (increasing ΔZ) and enhance the available H2O. In other words, the macrophysical group (Tenv, ΔZ, IWC) are controlled by thermal conditions and saturation dynamics. Meanwhile, the mean PMC height h is independent with Tenv and IWC through compensating boundary adjustments, with Ztop ascent and Zbot descent for expanding supersaturated zone under colder conditions. In conclusion, the CMN scheme provides a compelling framework to interpret the observed decoupling between (h, Nc, rc) and (Tenv, ΔZ, IWC) shown in Figs. 7–9.
Previous observations have shown that IWC is surprisingly insensitive to ice particle concentration (Megner, 2011; Megner, 2019), but simulations based on the GS scheme identified a sensitivity and attributed it to diffusion or vertical wind transport (Wilms et al., 2016, 2019). The CMN scheme provides an alternative explanation for this observed insensitivity: the two groups of (h, Nc, rc) and (Tenv, ΔZ, IWC) are decoupled on zonal and daily scales.
4.2.2 Latitude dependence of PMC microphysics
Figure 1c demonstrates a hemispheric asymmetry in ice particle column concentration (NCIPS) observed by CIPS/AIM, which unexpectedly decreases with latitude in the SH while remaining stable in the NH. One possible explanation is the horizontal transport of ice nuclei by meridional winds (Berger and von Zahn, 2007), which could theoretically enhance concentrations at lower latitudes. However, meridional circulations are stronger in the NH, and this mechanism fails to explain the NH's stable NCIPS in Fig. 1c.
The CMN scheme explains results in Fig. 1c via PMC height: the SH's distinct NCIPS reduction results from decreasing h with latitude that limits access to charged-MSPs, while NH's stableNCIPS stems from minimal h variation with latitude. NH's stable h with latitude is supported by ground observations (Lübken et al., 2008). The assumed SH's decreasing trend of h with latitude can preliminary be explained by the inverse relationship between upwelling intensity and h in the SH, as demonstrated in Figs. 2–3. Moreover, Thurairajah et al. (2017) showed that PMC height is positively correlated with environmental temperatures in the SH but insensitive in the NH (Fig. 13 therein). A more complete interpretation of PMC height variability in the CMN framework will be presented in Sect. 4.4.
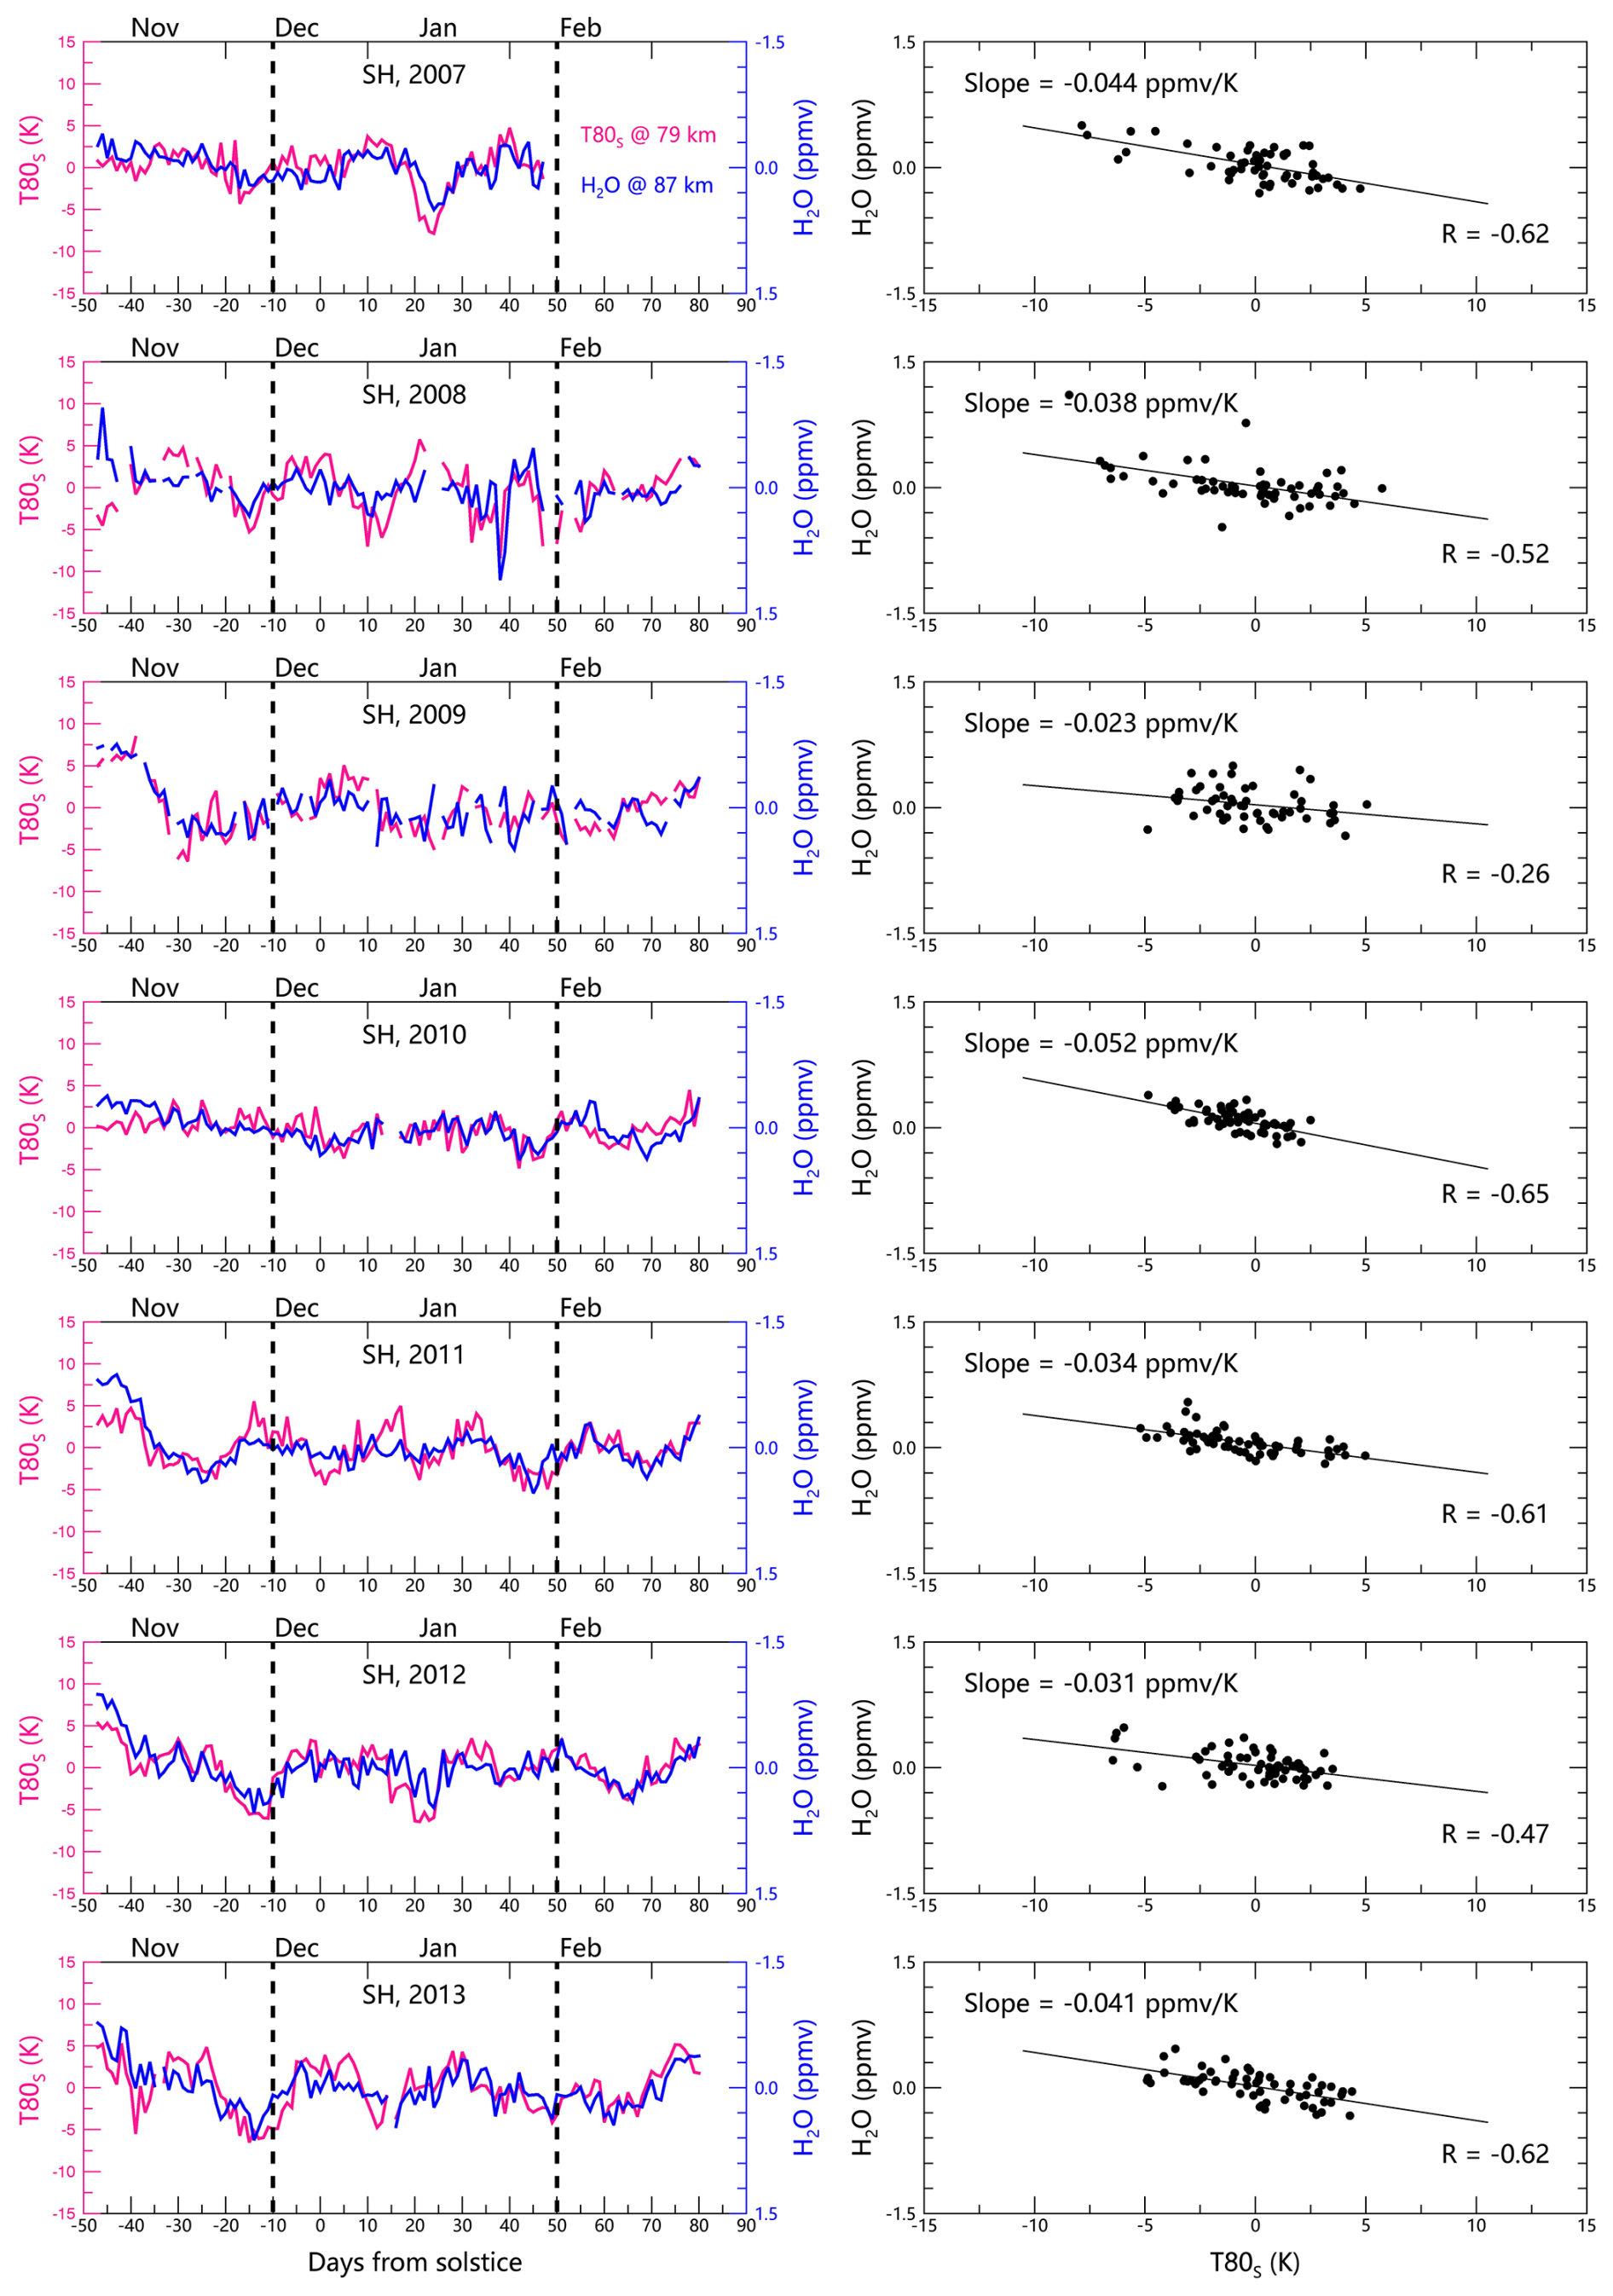
Figure 13Hydration at 80 km driven by upwelling. (Left) Negative correlation between temperatures at 79 km (T80S, proxy for summer polar upwelling) and H2O at 80 km in the SH from 2007/2008 to 2013/2014. (Right) Corresponding correlation coefficients for the core PMC seasons (time span of −10 to +50 d relative to solstice). SOFIE/AIM data at ∼ 70° S with 35 d running mean removed. Notably, the negative correlations in left panels persist even outside core PMC seasons, demonstrating that hydration is fundamentally driven by upwelling rather than PMCs.
4.3 Bottom-up process for H2O redistribution
The GS scheme explains H2O redistribution through a top-down freeze-drying effect, where ice particle sedimentation dehydrates air above PMCs while hydrates regions below through sublimation. In contrast, our CMN scheme introduces a bottom-up cold-trap effect, where in site ice growth (with negligible sedimentation) couples H2O transport to upwelling dynamics. This novel mechanism operates through two interconnected processes: Firstly, summer polar upwelling directly elevates H2O, hydrating the upper mesosphere near 80 km. The hydrated air can be further transported towards winter hemisphere by meridional circulation. Secondly, concurrent adiabatic cooling from this upwelling enhances ice particle growth, creating a barrier that impedes further upward H2O transport and ultimately causes dehydration above PMCs. Key distinctions between the two effects are summarized as follows.
-
Direction and driver. While freeze-drying effect is sedimentation-driven and operates top-down, cold-trap effect is upwelling-controlled and operates bottom-up. We quantify upwelling intensity using temperatures near 80 km at summer polar region (T80S), where lower T80S indicate stronger upwelling due to enhanced adiabatic cooling. Figures 13 and 14 demonstrate the cold-trap effect through opposing H2O responses at different altitudes: negative T80S–H2O correlations at 80 km (Fig. 13) reveal upwelling-driven hydration, while positive correlations at 87 km (Fig. 14) show ice-mediated dehydration as growing particles block upward H2O flux. The correlations between H2O at 87 km and temperatures at 87 km are insignificant (not shown), and results in the NH are similar to that in Figs. 13–14 (not shown). In addition, Hervig et al. (2015) showed that the temperature near 80 km (rather than above 84 km) controls strong hydration and dehydration events (Fig. 3 therein), and their results can be naturally explained by the cold-trap effect with the CMN framework through viewing temperature near 80 km as an indicator of upwelling.
-
Temporal characteristics. The freeze-drying effect in the GS scenario requires dehydration to precede hydration due to the ice particle lifecycle. The cold-trap effect in the CMN scenario, however, allows either simultaneous or reversed sequences. Notably, hydration can occur in the absence of dehydration when PMCs are very weak, as hydration is driven by upwelling rather than PMCs. For example, while significant negative T80S–H2O correlations at 80 km (indicating hydration) persist in November when PMCs are weak (left panels in Fig. 13), the corresponding positive correlations at 87 km (reflecting dehydration) vanish in November (Fig. 14), demonstrating the decoupling between hydration and dehydration.
-
Spatial and temporal scales. Freeze-drying effect has been well-validated for individual PMCs by observations simulations. The individual PMCs are stronger, in which the sedimentation may be significant. In contrast, cold-trap effect primarily governs zonal and daily-mean scale H2O redistribution, where the averaged PMCs are weaker and sedimentation effects become negligible. Rather than contradicting the well-established freeze-drying paradigm, our cold-trap framework provides a complementary explanation for larger-scale phenomena. In addition, this distinction is further explored in our companion study (Zhang et al., 2025), which investigates the cold-trap effect on global and interannual scales.
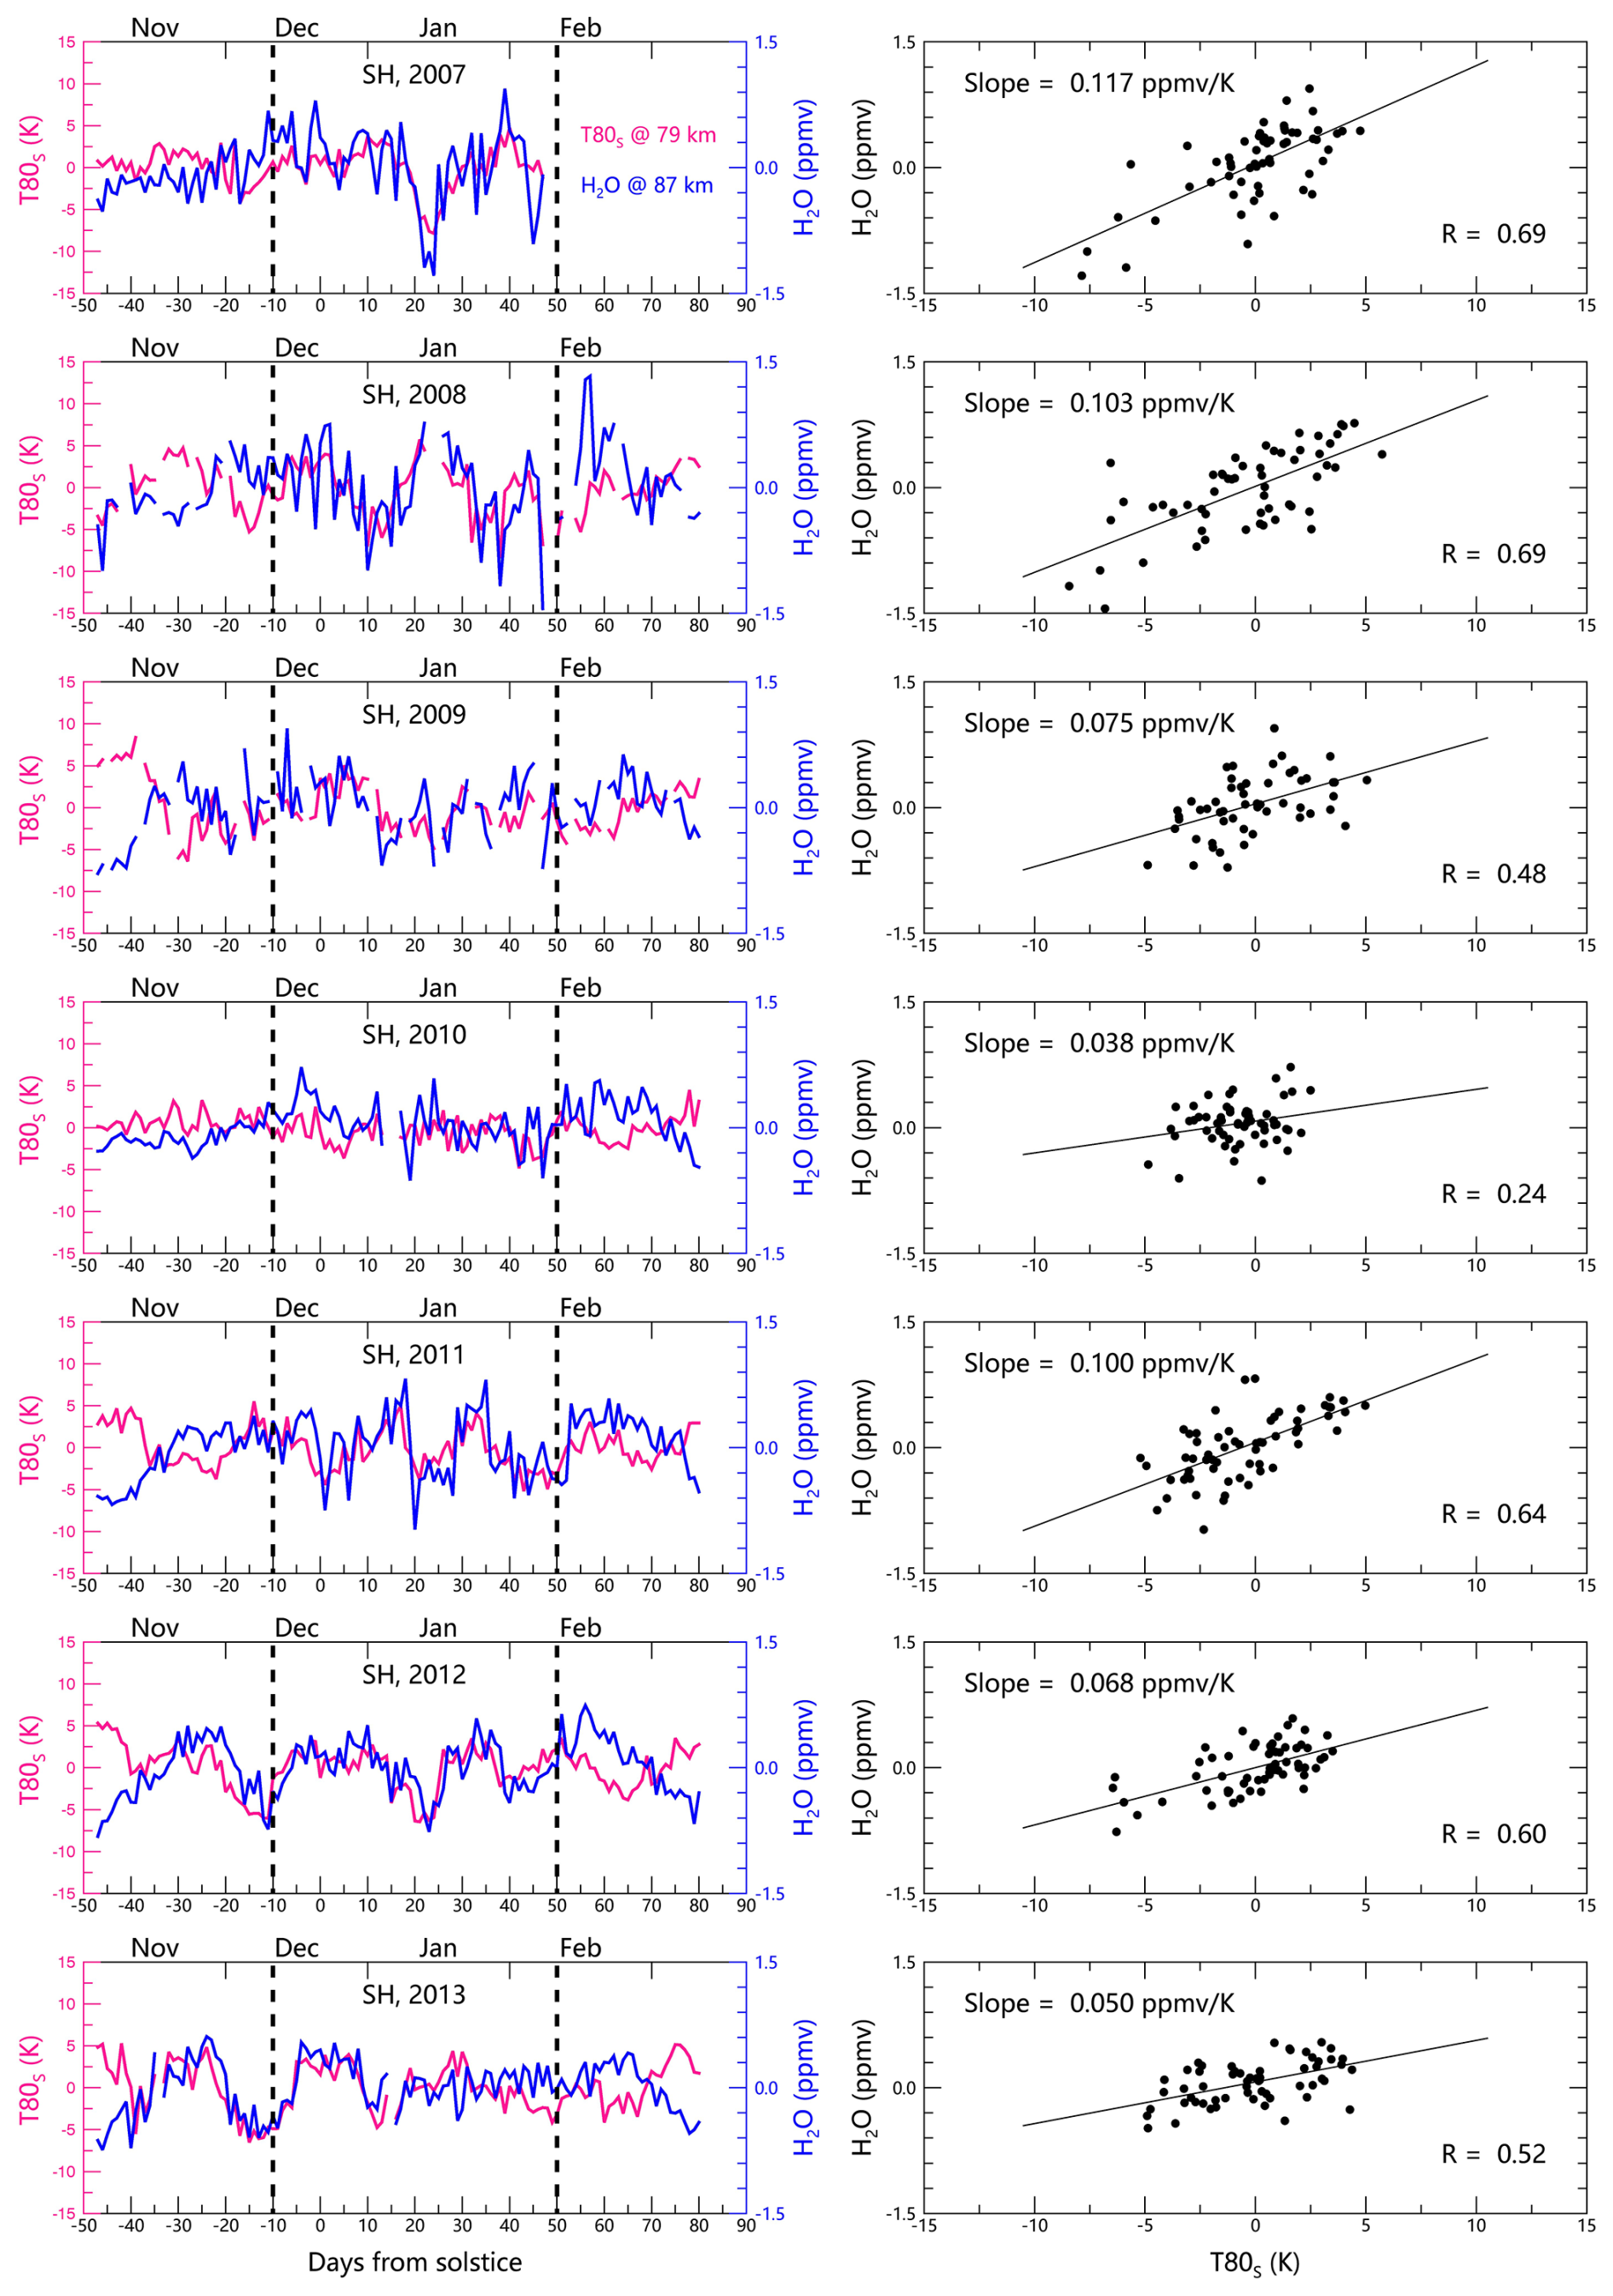
Figure 14Dehydration at 87 km induced by ice-mediated H2O blocking. (Left) Positive correlation between T80S at 79 km (proxy of summer polar upwelling) and H2O at 87 km in the SH from 2007/2008 to 2013/2014. (Right) Corresponding correlation coefficients for the time span of −10 to +50 d relative to solstice. SOFIE/AIM data at ∼ 70° S with 35 d running mean removed. Note the inverted y axis ranges for H2O concentration between Figs. 13 and 14.
4.4 Variability of PMC height
As a key forcing variable in the CMN scheme, PMC height variability requires careful examination. Previous studies have identified multiple controlling factors, including mesopause altitude and temperature (Li et al., 2024; Russell III et al., 2010), the 145 K isotherm position (Lübken et al., 2008), the freeze-drying effect (Lübken et al., 2009), solar activity .(Köhnke et al., 2018; Thurairajah et al., 2017), and CO2-induced atmospheric contraction (Lübken et al., 2018).
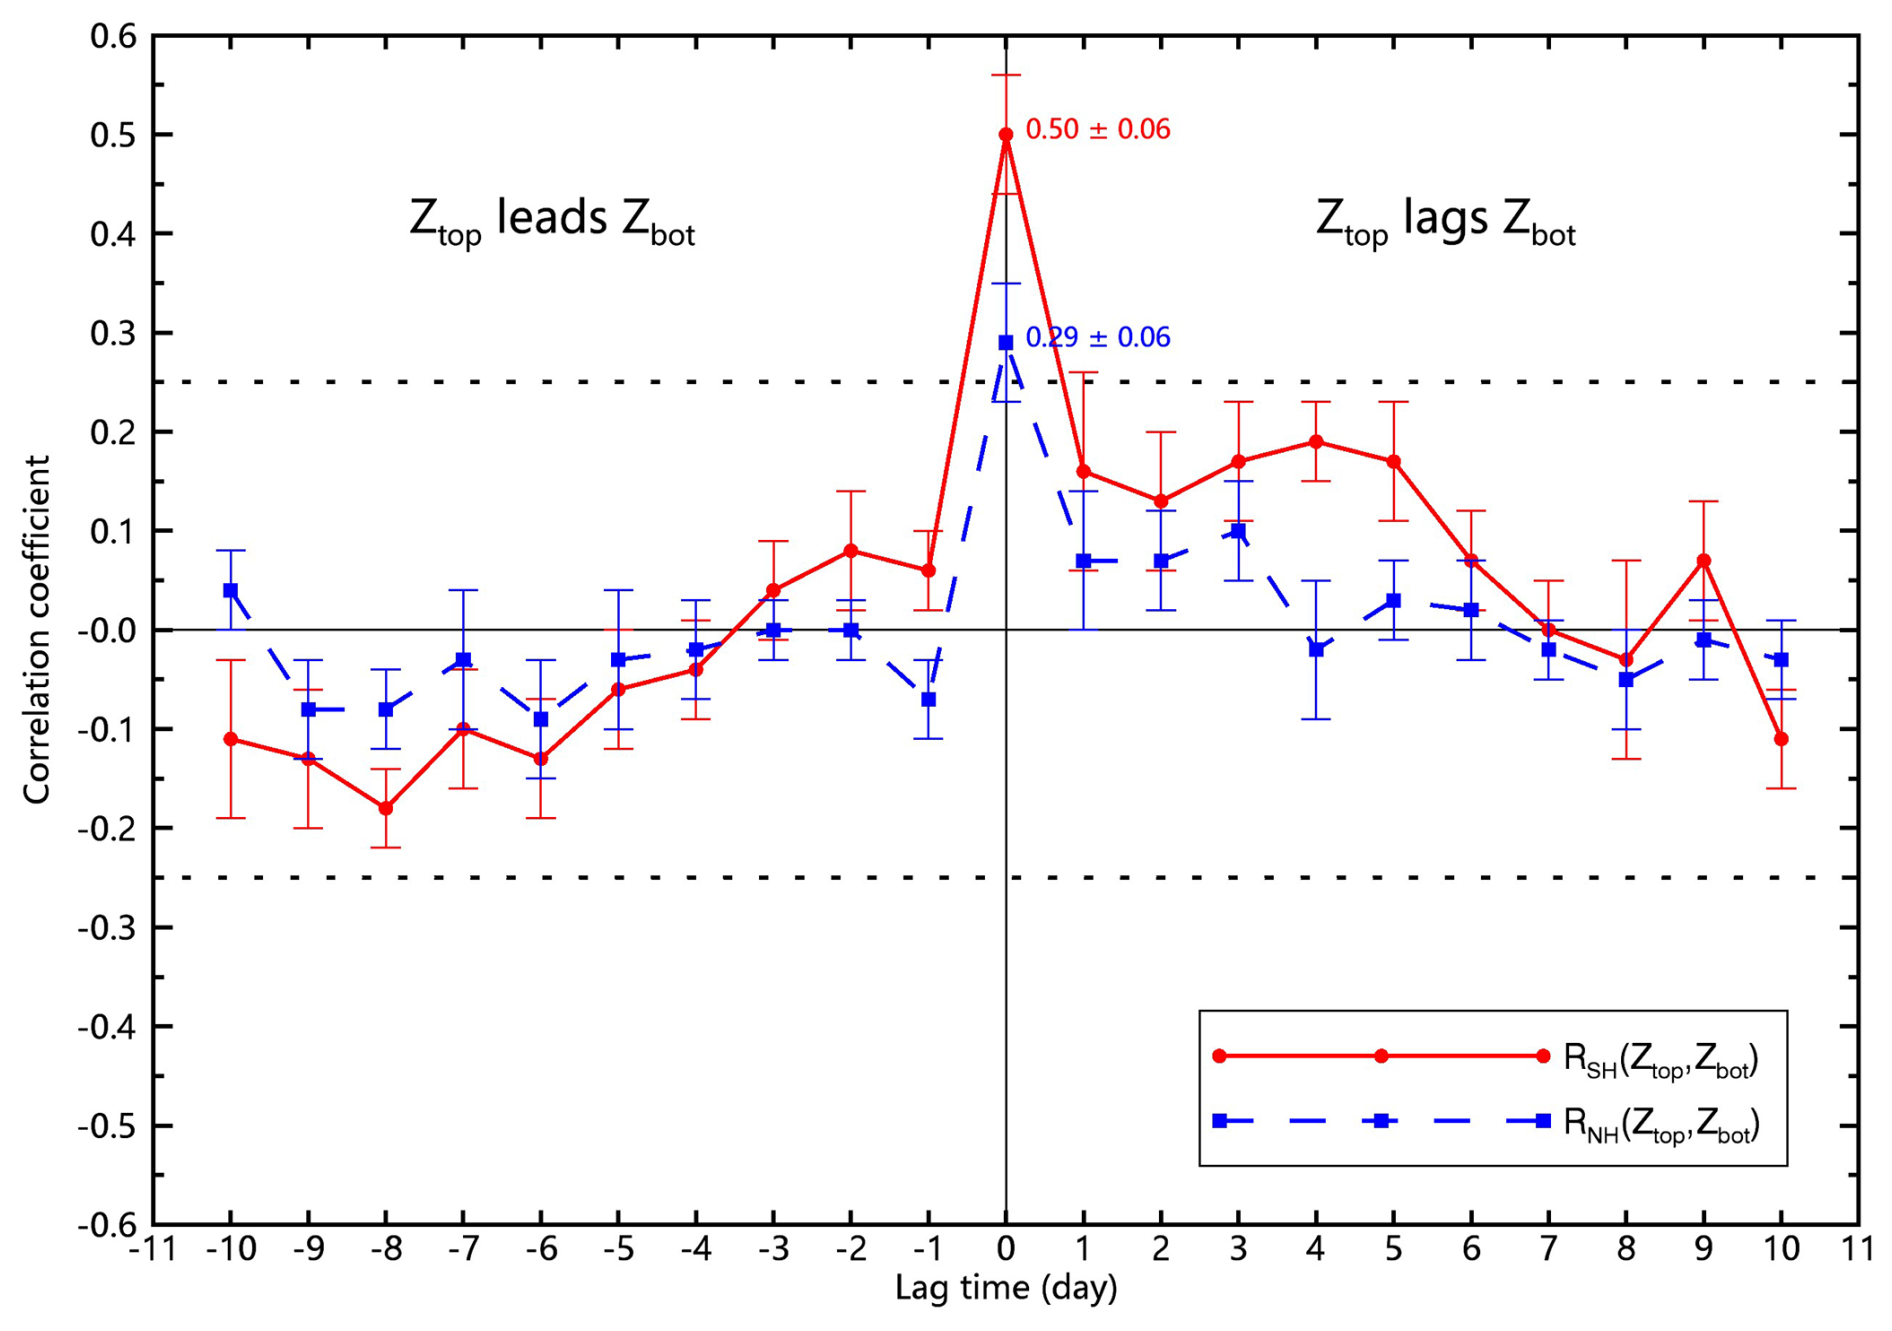
Figure 15Lagged correlation between the PMC top (Ztop) and base (Zbot) altitudes in the SH and NH. The SOFIE/AIM data at ∼ 70° N/S from 2007 to 2014 during core PMC seasons (−10 to +50 d relative to solstice) were applied, with the 35 d running means removed. The error bars represent the standard deviation of the mean across PMC seasons (2007–2014), and the dashed lines mark the 0.95 significant level.
The controlling mechanisms of PMC height variability exhibit a strong dependence on the timescale of analysis. On seasonal timescales (as shown in Fig. 2), the cold-trap effect driven by persistent upwelling dominates, resulting in a coherent descent of both Zbot and Ztop and a significant reduction in h. In contrast, on daily timescales (after removing the 35 d running mean in Figs. 8–10), PMC height becomes uncorrelated with environment temperatures. This decoupling occurs because daily-scale temperature fluctuations can arise from different vertical structures: cooling near 80 km lowers Zbot, while cooling near 86 km raises Ztop. The mean PMC height remains stable due to these compensating vertical adjustments.
Our CMN framework introduces an additional upwelling-driven mechanism through the cold-trap effect, which explains the PMC height variability in the SH: (1) Enhanced upwelling simultaneously lowers temperatures and increases H2O availability near 80 km, expanding the saturated zone and depressing cloud base (Zbot); (2) Intensified ice growth under these conditions blocks upward H2O transport, dehydrating upper layers and thereby lowering cloud top (Ztop). As shown in Fig. 3, the stronger upwelling in January reduces the PMC height h by ∼ 1.3 km compared to December through this cold-trap effect.
The cold-trap effect operates differently in the NH, as shown in Fig. 4. In July, smaller temperature decreases are coupled with greater H2O increases near 80 km, preventing effective ice-mediated blocking of upward H2O transport. This suggests that NH upwelling (possibly characterized by weaker adiabatic cooling but stronger H2O flux) can transport H2O to higher altitudes, resulting in stable Ztop values and consequently minimal height changes between June and July.
This bottom-up explanation via cold-trap effect leads to coherent variations in Zbot and Ztop. Figure 15 further illustrates the hemispheric asymmetry for the positive correlations betweenZbot (modulated by hydration) and Ztop (modulated by dehydration). The weaker correlations in the NH reflect less efficient dehydration in the cold-trap effect.
The freeze-drying effect of the GS scheme can also reduce both cloud top and base altitudes through sedimentation-driven H2O transport, potentially producing similar positive Zbot−Ztop correlations. However, the entire life cycle of ice particles in the freeze-drying effect, including nucleation, growth, sedimentation, and sublimation, takes up to ∼ 2 d (Rapp and Thomas, 2006; Rusch et al., 2017; Wilms et al., 2016). Consequently, Zbot would be expected to lag Ztop by ∼ 2 d, contradicting the instantaneous Zbot−Ztop coupling observed in Fig. 15. In contrast, the CMN scheme enable rapids ice nucleation at all altitudes and predominantly in-situ growth, supporting simultaneous hydration and dehydration responses that maintain phase coherence (zero-day lag) between cloud boundaries.
Our study reveals new insights into PMC microphysics through analysis of CIPS/AIM and SOFIE/AIM. We identify a previously undocumented hemispheric asymmetry characterized by a distinct latitudinal decrease in ice particle column concentration NCIPS in the SH, while the NH maintains a stable pattern. Further analysis demonstrates that column-averaged ice particles concentration Nc and radius rc at ∼ 70° N/S exhibit strong dependence on PMC height h rather than environmental temperatures Tenv. These findings are explained by a novel charged-MSPs nucleation scheme, which proposes an altitude-dependent formation mechanism where (1) charged-MSPs act as ubiquitous ice nuclei throughout the supersaturated zone and (2) ice particles grow predominantly in situ. This framework naturally accounts for the observed vertical profiles, with ice particle concentration increasing with altitude (due to charged-MSPs distribution) while ice particle radius decreasing (due to H2O competition among ice particles). Moreover, the CMN scheme reveals two decoupled parameter groups: microphysical properties (h, Nc, rc) controlled by nucleation processes and macrophysical variables (Tenv, ΔZ, IWC) governed by thermal conditions.
By minimizing sedimentation effects, the CMN scheme enables a bottom-up cold-trap effect for H2O redistribution. The cold-trap effect is fundamentally driven by upwelling, which simultaneously produces hydration near 80 km (via vertical transport) and dehydration (via ice-mediated blocking). Hemispheric differences in the efficacy of the cold-trap effect are clear: SH upwelling simultaneously produces hydration (lowering Zbot) and dehydration (lowering Ztop), collectively reducing PMC height. In contrast, NH upwelling generates substantial hydration but only minimal dehydration, resulting in stable PMC heights and consistent column-averaged ice particle concentrations.
Rather than contradicting the conventional GS scheme and freeze-drying effect which well explain individual PMC evolution, the CMN scheme and cold-trap effect are built to elucidate PMC variability on zonal and daily scales. Key uncertainties remain regarding charged-MSPs characteristics and interhemispheric differences. Future work should focus on developing comprehensive CMN-based PMC models to quantify ice nucleation and growth processes, and investigate the interactions between PMCs and mesospheric H2O.
The PMC data from SOFIE/AIM are available from the SOFIE website http://sofie.gats-inc.com/getdata (last access: 8 October 2025) (SOFIE, 2023) and the PMC data from CIPS/AIM are available from the Laboratory for Atmospheric and Space Physics website http://lasp.colorado.edu/aim/download/pmc/l2 (last access: 8 October 2025) (CIPS, 2023).
LZ, ZL, and BT conceived the idea together. LZ analyzed the data and drafted the manuscript. ZL and BT revised the paper.
The contact author has declared that none of the authors has any competing interests.
Publisher’s note: Copernicus Publications remains neutral with regard to jurisdictional claims made in the text, published maps, institutional affiliations, or any other geographical representation in this paper. While Copernicus Publications makes every effort to include appropriate place names, the final responsibility lies with the authors. Also, please note that this paper has not received English language copy-editing. Views expressed in the text are those of the authors and do not necessarily reflect the views of the publisher.
We are especially grateful to the entire AIM program for providing us the continuous SOFIE and CIPS data.
This research has been supported by the National Natural Science Foundation of China (grant nos. 42025602 and 41905059).
This paper was edited by John Plane and reviewed by two anonymous referees.
Antonsen, T., Havnes, O., and Mann, I.: Estimates of the Size Distribution of Meteoric Smoke Particles From Rocket-Borne Impact Probes, J. Geophys. Res.-Atmos., 122, 12353–12365, https://doi.org/10.1002/2017JD027220, 2017.
Bailey, S. M., Merkel, A. W., Thomas, G. E., and Carstens, J. N.: Observations of polar mesospheric clouds by the Student Nitric Oxide Explorer, J. Geophys. Res.-Atmos., 110, https://doi.org/10.1029/2004JD005422, 2005.
Bardeen, C. G., Toon, O. B., Jensen, E. J., Hervig, M. E., Randall, C. E., Benze, S., Marsh, D. R., and Merkel, A.: Numerical simulations of the three-dimensional distribution of polar mesospheric clouds and comparisons with Cloud Imaging and Particle Size (CIPS) experiment and the Solar Occultation For Ice Experiment (SOFIE) observations, J. Geophys. Res.-Atmos., 115, https://doi.org/10.1029/2009JD012451, 2010.
Beig, G., Scheer, J., Mlynczak, M. G., and Keckhut, P.: Overview of the temperature response in the mesosphere and lower thermosphere to solar activity, Rev. Geophys., 46, https://doi.org/10.1029/2007RG000236, 2008.
Berger, U. and von Zahn, U.: Three-dimensional modeling of the trajectories of visible noctilucent cloud particles: An indication of particle nucleation well below the mesopause, J. Geophys. Res.-Atmos., 112, https://doi.org/10.1029/2006JD008106, 2007.
Carstens, J. N., Bailey, S. M., Lumpe, J. D., and Randall, C. E.: Understanding uncertainties in the retrieval of polar mesospheric clouds from the cloud imaging and particle size experiment in the presence of a bright Rayleigh background, J. Atmos. Sol.-Terr. Phy., 104, 197–212, https://doi.org/10.1016/j.jastp.2013.08.006, 2013.
Chandran, A., Rusch, D. W., Thomas, G. E., Palo, S. E., Baumgarten, G., Jensen, E. J., and Merkel, A. W.: Atmospheric gravity wave effects on polar mesospheric clouds: A comparison of numerical simulations from CARMA 2D with AIM observations, J. Geophys. Res.-Atmos., 117, https://doi.org/10.1029/2012JD017794, 2012.
Christensen, O. M., Benze, S., Eriksson, P., Gumbel, J., Megner, L., and Murtagh, D. P.: The relationship between polar mesospheric clouds and their background atmosphere as observed by Odin-SMR and Odin-OSIRIS, Atmos. Chem. Phys., 16, 12587–12600, https://doi.org/10.5194/acp-16-12587-2016, 2016.
Chu, X., Espy, P. J., Nott, G. J., Diettrich, J. C., and Gardner, C. S.: Polar mesospheric clouds observed by an iron Boltzmann lidar at Rothera (67.5° S, 68.0° W), Antarctica from 2002 to 2005: Properties and implications, J. Geophys. Res.-Atmos., 111, https://doi.org/10.1029/2006JD007086, 2006.
CIPS: The Cloud Imaging and Particle Size data (level 2, version 5.2, revision 05), CIPS [data set], http://lasp.colorado.edu/aim/download/pmc/l2 (last access: 8 October 2025), 2023.
Dalin, P., Pertsev, N., Perminov, V., Dubietis, A., Zadorozhny, A., Zalcik, M., McEachran, I., McEwan, T., Černis, K., Grønne, J., Taustrup, T., Hansen, O., Andersen, H., Melnikov, D., Manevich, A., Romejko, V., and Lifatova, D.: Response of noctilucent cloud brightness to daily solar variations, J. Atmos. Sol.-Terr. Phy., 169, 83–90, https://doi.org/10.1016/j.jastp.2018.01.025, 2018.
Dawkins, E. C. M., Stober, G., Janches, D., Carrillo-Sánchez, J. D., Lieberman, R. S., Jacobi, C., Moffat-Griffin, T., Mitchell, N. J., Cobbett, N., Batista, P. P., Andrioli, V. F., Buriti, R. A., Murphy, D. J., Kero, J., Gulbrandsen, N., Tsutsumi, M., Kozlovsky, A., Kim, J. H., Lee, C., and Lester, M.: Solar Cycle and Long-Term Trends in the Observed Peak of the Meteor Altitude Distributions by Meteor Radars, Geophys. Res. Lett., 50, e2022GL101953, https://doi.org/10.1029/2022GL101953, 2023.
DeLand, M. T. and Gorkavyi, N.: PMC observations from the OMPS Limb Profiler, J. Atmos. Sol.-Terr. Phy., 213, 105505, https://doi.org/10.1016/j.jastp.2020.105505, 2021.
DeLand, M. T. and Thomas, G. E.: Extending the SBUV polar mesospheric cloud data record with the OMPS NP, Atmos. Chem. Phys., 19, 7913–7925, https://doi.org/10.5194/acp-19-7913-2019, 2019.
Duft, D., Nachbar, M., and Leisner, T.: Unravelling the microphysics of polar mesospheric cloud formation, Atmos. Chem. Phys., 19, 2871–2879, https://doi.org/10.5194/acp-19-2871-2019, 2019.
Fiedler, J. and Baumgarten, G.: Solar and lunar tides in noctilucent clouds as determined by ground-based lidar, Atmos. Chem. Phys., 18, 16051–16061, https://doi.org/10.5194/acp-18-16051-2018, 2018.
France, J. A., Randall, C. E., Lieberman, R. S., Harvey, V. L., Eckermann, S. D., Siskind, D. E., Lumpe, J. D., Bailey, S. M., Carstens, J. N., and Russell III, J. M.: Local and Remote Planetary Wave Effects on Polar Mesospheric Clouds in the Northern Hemisphere in 2014, J. Geophys. Res.-Atmos., 123, 5149–5162, https://doi.org/10.1029/2017JD028224, 2018.
Gao, H., Li, L., Bu, L., Zhang, Q., Tang, Y., and Wang, Z.: Effect of Small-Scale Gravity Waves on Polar Mesospheric Clouds Observed From CIPS/AIM, J. Geophys. Res.-Space, 123, 4026–4045, https://doi.org/10.1029/2017JA024855, 2018.
Gordley, L. L., Hervig, M. E., Fish, C., Russell III, J. M., Bailey, S., Cook, J., Hansen, S., Shumway, A., Paxton, G., Deaver, L., Marshall, T., Burton, J., Magill, B., Brown, C., Thompson, E., and Kemp, J.: The solar occultation for ice experiment, J. Atmos. Sol.-Terr. Phy., 71, 300–315, https://doi.org/10.1016/j.jastp.2008.07.012, 2009.
Gumbel, J. and Karlsson, B.: Intra- and inter-hemispheric coupling effects on the polar summer mesosphere, Geophys. Res. Lett., 38, https://doi.org/10.1029/2011GL047968, 2011.
Gumbel, J. and Megner, L.: Charged meteoric smoke as ice nuclei in the mesosphere: Part 1 – A review of basic concepts, J. Atmos. Sol.-Terr. Phy., 71, 1225–1235, https://doi.org/10.1016/j.jastp.2009.04.012, 2009.
Hervig, M. E., Gordley, L. L., Stevens, M. H., Russell III, J. M., Bailey, S. M., and Baumgarten, G.: Interpretation of SOFIE PMC measurements: Cloud identification and derivation of mass density, particle shape, and particle size, J. Atmos. Sol.-Terr. Phy., 71, 316–330, https://doi.org/10.1016/j.jastp.2008.07.009, 2009a.
Hervig, M. E., Stevens, M. H., Gordley, L. L., Deaver, L. E., Russell III, J. M., and Bailey, S. M.: Relationships between polar mesospheric clouds, temperature, and water vapor from Solar Occultation for Ice Experiment (SOFIE) observations, J. Geophys. Res.-Atmos., 114, https://doi.org/10.1029/2009JD012302, 2009b.
Hervig, M. E., Siskind, D. E., Bailey, S. M., and Russell III, J. M.: The influence of PMCs on water vapor and drivers behind PMC variability from SOFIE observations, J. Atmos. Sol.-Terr. Phy., 132, 124–134, https://doi.org/10.1016/j.jastp.2015.07.010, 2015.
Hervig, M. E., Gerding, M., Stevens, M. H., Stockwell, R., Bailey, S. M., Russell III, J. M., and Stober, G.: Mid-latitude mesospheric clouds and their environment from SOFIE observations, J. Atmos. Sol.-Terr. Phy., 149, 1–14, https://doi.org/10.1016/j.jastp.2016.09.004, 2016.
Hervig, M. E., Siskind, D. E., Bailey, S. M., Merkel, A. W., DeLand, M. T., and Russell III, J. M.: The Missing Solar Cycle Response of the Polar Summer Mesosphere, Geophys. Res. Lett., 46, 10132–10139, https://doi.org/10.1029/2019GL083485, 2019.
Hervig, M. E., Malaspina, D., Sterken, V., Wilson III, L. B., Hunziker, S., and Bailey, S. M.: Decadal and Annual Variations in Meteoric Flux From Ulysses, Wind, and SOFIE Observations, J. Geophys. Res.-Space, 127, e2022JA030749, https://doi.org/10.1029/2022JA030749, 2022.
Hultgren, K. and Gumbel, J.: Tomographic and spectral views on the lifecycle of polar mesospheric clouds from Odin/OSIRIS, J. Geophys. Res.-Atmos., 119, 14129–14143, https://doi.org/10.1002/2014JD022435, 2014.
Karlsson, B., Randall, C. E., Benze, S., Mills, M., Harvey, V. L., Bailey, S. M., and Russell III, J. M.: Intra-seasonal variability of polar mesospheric clouds due to inter-hemispheric coupling, Geophys. Res. Lett., 36, https://doi.org/10.1029/2009GL040348, 2009.
Knappmiller, S., Rapp, M., Robertson, S., and Gumbel, J.: Charging of meteoric smoke and ice particles in the mesosphere including photoemission and photodetachment rates, J. Atmos. Sol.-Terr. Phy., 73, 2212–2220, https://doi.org/10.1016/j.jastp.2011.01.008, 2011.
Köhnke, M. C., von Savigny, C., and Robert, C. E.: Observation of a 27-day solar signature in noctilucent cloud altitude, Adv. Space Res., 61, 2531–2539, https://doi.org/10.1016/j.asr.2018.02.035, 2018.
Kuilman, M., Karlsson, B., Benze, S., and Megner, L.: Exploring noctilucent cloud variability using the nudged and extended version of the Canadian Middle Atmosphere Model, J. Atmos. Sol.-Terr. Phy., 164, 276–288, https://doi.org/10.1016/j.jastp.2017.08.019, 2017.
Lee, J. N., Wu, D. L., Thurairajah, B., Hozumi, Y., and Tsuda, T.: The Sensitivity of Polar Mesospheric Clouds to Mesospheric Temperature and Water Vapor, Remote Sensing, 16, https://doi.org/10.3390/rs16091563, 2024.
Li, Y., Gao, H., Sun, S., and Li, X.: Correlation between Peak Height of Polar Mesospheric Clouds and Mesopause Temperature, Atmosphere, 15, https://doi.org/10.3390/atmos15101149, 2024.
Liu, X., Yue, J., Xu, J., Yuan, W., Russell III, J. M., and Hervig, M. E.: Five-day waves in polar stratosphere and mesosphere temperature and mesospheric ice water measured by SOFIE/AIM, J. Geophys. Res.-Atmos., 120, 3872–3887, https://doi.org/10.1002/2015JD023119, 2015.
Liu, X., Yue, J., Xu, J., Yuan, W., Russell III, J. M., Hervig, M. E., and Nakamura, T.: Persistent longitudinal variations in 8 years of CIPS/AIM polar mesospheric clouds, J. Geophys. Res.-Atmos., 121, 8390–8409, https://doi.org/10.1002/2015JD024624, 2016.
Lübken, F. J. and Berger, U.: Interhemispheric comparison of mesospheric ice layers from the LIMA model, J. Atmos. Sol.-Terr. Phy., 69, 2292–2308, https://doi.org/10.1016/j.jastp.2007.07.006, 2007.
Lübken, F. J., Baumgarten, G., Fiedler, J., Gerding, M., Höffner, J., and Berger, U.: Seasonal and latitudinal variation of noctilucent cloud altitudes, Geophys. Res. Lett., 35, https://doi.org/10.1029/2007GL032281, 2008.
Lübken, F. J., Berger, U., and Baumgarten, G.: Stratospheric and solar cycle effects on long-term variability of mesospheric ice clouds, J. Geophys. Res.-Atmos., 114, https://doi.org/10.1029/2009JD012377, 2009.
Lübken, F.-J., Berger, U., and Baumgarten, G.: On the Anthropogenic Impact on Long-Term Evolution of Noctilucent Clouds, Geophys. Res. Lett., 45, 6681–6689, https://doi.org/10.1029/2018GL077719, 2018.
Lumpe, J. D., Bailey, S. M., Carstens, J. N., Randall, C. E., Rusch, D. W., Thomas, G. E., Nielsen, K., Jeppesen, C., McClintock, W. E., Merkel, A. W., Riesberg, L., Templeman, B., Baumgarten, G., and Russell III, J. M.: Retrieval of polar mesospheric cloud properties from CIPS: Algorithm description, error analysis and cloud detection sensitivity, J. Atmos. Sol.-Terr. Phy., 104, 167–196, https://doi.org/10.1016/j.jastp.2013.06.007, 2013.
Megner, L.: Minimal impact of condensation nuclei characteristics on observable Mesospheric ice properties, J. Atmos. Sol.-Terr. Phy., 73, 2184–2191, https://doi.org/10.1016/j.jastp.2010.08.006, 2011.
Megner, L.: Comment on “Nucleation of Mesospheric Cloud Particles: Sensitivities and Limits” by L. Megner, J. Geophys. Res.-Space, 124, 3162–3166, https://doi.org/10.1029/2018JA025646, 2019.
Megner, L. and Gumbel, J.: Charged meteoric particles as ice nuclei in the mesosphere: Part 2: A feasibility study, J. Atmos. Sol.-Terr. Phy., 71, 1236–1244, https://doi.org/10.1016/j.jastp.2009.05.002, 2009.
Megner, L., Gumbel, J., Rapp, M., and Siskind, D. E.: Reduced meteoric smoke particle density at the summer pole – Implications for mesospheric ice particle nucleation, Adv. Space Res., 41, 41–49, https://doi.org/10.1016/j.asr.2007.09.006, 2008a.
Megner, L., Siskind, D. E., Rapp, M., and Gumbel, J.: Global and temporal distribution of meteoric smoke: A two-dimensional simulation study, J. Geophys. Res.-Atmos., 113, https://doi.org/10.1029/2007JD009054, 2008b.
Plane, J. M. C.: Cosmic dust in the earth's atmosphere, Chem. Soc. Rev., 41, 6507–6518, https://doi.org/10.1039/C2CS35132C, 2012.
Plane, J. M. C., Gumbel, J., Kalogerakis, K. S., Marsh, D. R., and von Savigny, C.: Opinion: Recent developments and future directions in studying the mesosphere and lower thermosphere, Atmos. Chem. Phys., 23, 13255–13282, https://doi.org/10.5194/acp-23-13255-2023, 2023.
Rapp, M. and Thomas, G. E.: Modeling the microphysics of mesospheric ice particles: Assessment of current capabilities and basic sensitivities, J. Atmos. Sol.-Terr. Phy., 68, 715–744, https://doi.org/10.1016/j.jastp.2005.10.015, 2006.
Robert, C. E., von Savigny, C., Rahpoe, N., Bovensmann, H., Burrows, J. P., DeLand, M. T., and Schwartz, M. J.: First evidence of a 27 day solar signature in noctilucent cloud occurrence frequency, J. Geophys. Res.-Atmos., 115, https://doi.org/10.1029/2009JD012359, 2010.
Rong, P. P., Russell III, J. M., Hervig, M. E., and Bailey, S. M.: The roles of temperature and water vapor at different stages of the polar mesospheric cloud season, J. Geophys. Res.-Atmos., 117, https://doi.org/10.1029/2011JD016464, 2012.
Rusch, D., Thomas, G., Merkel, A., Olivero, J., Chandran, A., Lumpe, J., Carstans, J., Randall, C., Bailey, S., and Russell III, J.: Large ice particles associated with small ice water content observed by AIM CIPS imagery of polar mesospheric clouds: Evidence for microphysical coupling with small-scale dynamics, J. Atmos. Sol.-Terr. Phy., 162, 97–105, https://doi.org/10.1016/j.jastp.2016.04.018, 2017.
Russell III, J. M., Bailey, S. M., Gordley, L. L., Rusch, D. W., Horányi, M., Hervig, M. E., Thomas, G. E., Randall, C. E., Siskind, D. E., Stevens, M. H., Summers, M. E., Taylor, M. J., Englert, C. R., Espy, P. J., McClintock, W. E., and Merkel, A. W.: The Aeronomy of Ice in the Mesosphere (AIM) mission: Overview and early science results, J. Atmos. Sol.-Terr. Phy., 71, 289–299, https://doi.org/10.1016/j.jastp.2008.08.011, 2009.
Russell III, J. M., Rong, P., Bailey, S. M., Hervig, M. E., and Petelina, S. V.: Relationship between the summer mesopause and polar mesospheric cloud heights, J. Geophys. Res.-Atmos., 115, https://doi.org/10.1029/2010JD013852, 2010.
Scales, W. A. and Mahmoudian, A.: Charged dust phenomena in the near-Earth space environment, Rep. Prog. Phys., 79, 106802, https://doi.org/10.1088/0034-4885/79/10/106802, 2016.
Shapiro, A. V., Rozanov, E., Shapiro, A. I., Wang, S., Egorova, T., Schmutz, W., and Peter, Th.: Signature of the 27-day solar rotation cycle in mesospheric OH and H2O observed by the Aura Microwave Limb Sounder, Atmos. Chem. Phys., 12, 3181–3188, https://doi.org/10.5194/acp-12-3181-2012, 2012.
Siskind, D. E., Marsh, D. R., Mlynczak, M. G., Martin-Torres, F. J., and Russell III, J. M.: Decreases in atomic hydrogen over the summer pole: Evidence for dehydration from polar mesospheric clouds?, Geophys. Res. Lett., 35, https://doi.org/10.1029/2008GL033742, 2008.
Siskind, D. E., Merkel, A., Marsh, D., Randall, C., Hervig, M., Mlynczak, M., and Russell III, J. J. J. o. G. R. A.: Understanding the effects of polar mesospheric clouds on the environment of the upper mesosphere and lower thermosphere, J. Geophys. Res.-Atmos., 123, 11705–11719, https://doi.org/10.1029/2018JD028830, 2018.
SOFIE: The Solar Occultation for Ice Experiment data (level 2), SOFIE [data set], http://sofie.gats-inc.com/getdata (last access: 8 October 2025), 2023.
Thurairajah, B., Thomas, G. E., von Savigny, C., Snow, M., Hervig, M. E., Bailey, S. M., and Randall, C. E.: Solar-induced 27-day variations of polar mesospheric clouds from the AIM SOFIE and CIPS experiments, J. Atmos. Sol.-Terr. Phy., 162, 122–135, https://doi.org/10.1016/j.jastp.2016.09.008, 2017.
Vellalassery, A., Baumgarten, G., Grygalashvyly, M., and Lübken, F.-J.: Greenhouse gas effects on the solar cycle response of water vapour and noctilucent clouds, Ann. Geophys., 41, 289–300, https://doi.org/10.5194/angeo-41-289-2023, 2023.
Wilms, H., Rapp, M., and Kirsch, A.: Nucleation of mesospheric cloud particles: Sensitivities and limits, J. Geophys. Res.-Space, 121, 2621–2644, https://doi.org/10.1002/2015JA021764, 2016.
Wilms, H., Rapp, M., and Kirsch, A.: Reply to Comment on “Nucleation of Mesospheric Cloud Particles: Sensitivities and Limits”, J. Geophys. Res.-Space, 124, 3167–3172, https://doi.org/10.1029/2018JA025876, 2019.
Zhang, L., Tinsley, B., and Zhou, L.: Responses of CIPS/AIM noctilucent clouds to the interplanetary magnetic field, Atmos. Chem. Phys., 22, 13355–13370, https://doi.org/10.5194/acp-22-13355-2022, 2022.
Zhang, L., Liu, Z., and Tinsley, B.: Interhemispheric Anti-Phase Variability in Mesospheric Climate Driven by Summer Polar Upwelling During Solstice Months, EGUsphere [preprint], https://doi.org/10.5194/egusphere-2025-2047, 2025.