the Creative Commons Attribution 4.0 License.
the Creative Commons Attribution 4.0 License.
 | 06 Oct 2025
Anthropogenic and natural causes for the interannual variation of PM2.5 in East Asia during summer monsoon periods from 2008 to 2018
Danyang Ma
Huan He
Tijian Wang
Mengzhu Xi
Lingyun Feng
Shuxian Zhang
Shitong Chen
There was a significant difference in near-surface PM2.5 across China after the implementation of the Clean Air Action Plan in 2013. This study used the regional climate-chemistry-ecosystem coupled model RegCM-Chem-YIBs to investigate interannual variations in PM2.5 across East Asia from 2008 to 2018. The drivers of PM2.5 variability were examined from anthropogenic and natural perspectives. Compared to 2008, PM2.5 showed little variation during the pre-governance (PreG) period (2009–2013). However, during the post-governance (PostG) period (2014–2018), a substantial decline in PM2.5 was simulated, particularly in the North China Plain (−36.76 µg m−3) and the Sichuan Basin (−33.96 µg m−3). Anthropogenic pollutant emissions were the primary drivers of PM2.5 reductions, contributing −10.39 to −3.82 µg m−3 in the PreG period and −33.86 to −8.45 µg m−3 in the PostG period. The influence of meteorological conditions on PM2.5 during the PreG period (−6.31 to 2.32 µg m−3) was comparable to that of anthropogenic pollutant emissions. Additionally, in the vegetation-rich region, the impact of CO2 emission changes on PM2.5 was comparable to that of anthropogenic pollutant emissions. Our study comprehensively examined the drivers of PM2.5 concentration changes from 2008 to 2018. We highlight a significant intensification in the contribution of anthropogenic pollutant emissions and reveal that, in regions characterized by dense vegetation, changes in CO2 concentrations exert a pronounced impact on PM2.5 variations.
- Article
(9816 KB) - Full-text XML
-
Supplement
(2223 KB) - BibTeX
- EndNote


PM2.5 refers to fine particulate matter with an aerodynamic diameter less than or equal to 2.5 µm (Chen et al., 2018). Its sources include industrial emissions, vehicular exhaust, biomass burning, and secondary formation from atmospheric gases (Wu et al., 2020). Major chemical components of PM2.5 include sulfates, nitrates, ammonium salts, organic carbon, elemental carbon, and heavy metals (van Donkelaar et al., 2019; Li et al., 2017a). PM2.5 is one of the primary atmospheric pollutants in China (Fontes et al., 2017), posing significant risks to human respiratory health (Feng et al., 2016; Xing et al., 2016). Long-term exposure to PM2.5 can lead to respiratory diseases such as chronic bronchitis, emphysema, and asthma (Kim et al., 2015; Pui et al., 2014; Xing et al., 2016). Additionally, PM2.5 is critical as a short-lived species influencing atmospheric radiation processes (Hu et al., 2017). It affects the radiative energy balance of the Earth–atmosphere system by scattering or reflecting solar radiation (direct effect) (Wu et al., 2021) and altering cloud microphysical properties (indirect effect) (Wang et al., 2018a; Wu et al., 2021).
With China's rapid economic development, widespread PM2.5 pollution became prevalent across the country in the early 21st century (Ma et al., 2016). In the most severely polluted urban areas, the annual average PM2.5 concentration exceeded 100 µg m−3 (van Donkelaar et al., 2010). From 2000 to 2008, the national average PM2.5 concentration in China was 49.4±14.2 µg m−3. In eastern China, the average concentration was 55.4±16.1 µg m−3, while the Beijing–Tianjin–Hebei region experienced average levels as high as 62.1±22.5 µg m−3. The Yangtze River Delta (YRD) saw an average concentration of 63.0±11.1 µg m−3, the Pearl River Delta (PRD) recorded an average of 52.4±5.8 µg m−3, and the Sichuan Basin averaged 61.6±13.4 µg m−3 (Wei et al., 2021). To mitigate the severe PM2.5 pollution, China implemented the Clean Air Action Plan in 2013 (Li et al., 2019). This policy led to a significant nationwide decrease in PM2.5 concentrations (Zhang et al., 2019), and there has been a notable improvement in air quality since that date (Vu et al., 2019; Li et al., 2018).
The variation in PM2.5 concentrations is influenced by three key factors: anthropogenic pollutant emissions, meteorological conditions (Xiao et al., 2021), and carbon dioxide (CO2) changes. Anthropogenic pollutant emissions encompass industrial production, transportation, and energy consumption (An et al., 2019), which release amounts of primary PM2.5, as well as the precursors of secondary PM2.5 such as volatile organic compounds (Kurokawa and Ohara, 2020) and nitrogen oxides (Wu et al., 2020; Zheng et al., 2021b; Kurokawa and Ohara, 2020). Consequently, reducing these emissions is essential for mitigating PM2.5 concentrations, as they directly contribute to both the formation and persistence of particulate pollution (Zheng et al., 2018; Zhang et al., 2019).
Meteorological conditions play a significant role in influencing near-surface PM2.5 concentrations (Chen et al., 2020b; Xiao et al., 2021). Elevated temperatures can accelerate atmospheric chemical reactions (Mousavinezhad et al., 2021), including oxidation and photochemical processes, thereby promoting the formation of PM2.5 (Zhong et al., 2018). In addition, moderate increases in temperature can significantly enhance the emissions of biogenic volatile organic compounds (BVOCs) by stimulating the activity of the synthase enzyme. However, when temperatures exceed the physiological tolerance threshold of plants, decreased enzyme activity or metabolic disruption may suppress emissions (Lindwall et al., 2016; Kleist et al., 2012). Therefore, temperature changes can influence atmospheric PM2.5 concentrations by modulating the emissions of BVOCs. Precipitation aids in removing particulate matter from the atmosphere through wet deposition (Zhang et al., 2013), effectively reducing PM2.5 pollution levels (Wu et al., 2018). Additionally, wind speed and direction are crucial factors in the transport and dispersion of particulate matter (Li et al., 2017b). Higher wind speeds facilitate the dispersion of particulate matter over a wider area, reducing its local accumulation and mitigating air pollution in specific regions (Li et al., 2017b; Zhang et al., 2018). The increase in planetary boundary layer height (PBLH) strengthens atmospheric upward motion (Ait-Chaalal et al., 2016), thereby reducing near-surface PM2.5 concentrations (Pan et al., 2019).
Changes in CO2 concentrations can influence PM2.5 pollution levels through several mechanisms. Elevated CO2 concentrations impact the atmospheric radiation balance, altering the distribution and intensity of precipitation (Cao et al., 2012), which directly affects PM2.5 concentrations by influencing wet deposition rates (Zhang et al., 2022). Additionally, changes in CO2 concentrations can affect vegetation photosynthesis and growth, which alter the emissions of BVOCs that can participate in atmospheric chemical reactions to form secondary organic aerosols and thereby impact atmospheric PM2.5 concentrations (Sun et al., 2013, 2012). It is worth noting that elevated CO2 concentrations may also directly inhibit BVOC emissions by reducing the activity of BVOC synthase enzymes (Heald et al., 2009; Pegoraro et al., 2004). Therefore, the impact of increased CO2 on vegetation BVOC emissions can be either positive or negative, depending primarily on the relative strength of the inhibitory effect from enzyme suppression versus the stimulatory effect from enhanced photosynthesis (Sun et al., 2012). Isoprene is the most abundant species among BVOCs, so changes in CO2 concentrations can indirectly affect near-surface PM2.5 concentrations by influencing isoprene emissions from vegetation (Sun et al., 2013; Lin et al., 2013; Kramer et al., 2016).
Numerous studies have used statistical models and numerical simulations to investigate the impacts of meteorological conditions and anthropogenic pollutant emissions on PM2.5 concentration changes in China. The results consistently indicate that changes in anthropogenic pollutant emissions are the primary driver of PM2.5 variation. Zhang et al. (2019), using the WRF-CMAQ model at the national scale, found that meteorological conditions accounted for only 9 % of the total decline in PM2.5 concentrations during 2013–2017 in China, suggesting that emission reductions were the dominant factor. Similarly, based on a multiple linear regression model, Chen et al. (2020a) reported that anthropogenic pollutant emission reductions contributed 73 %, 87 %, and 84 % to the PM2.5 decline in the North China Plain, Yangtze River Delta, and PRD, respectively, while the contribution of meteorological conditions ranged from 10 % to 26 %. Cheng et al. (2019), also employing the WRF-CMAQ model, found that the decrease in PM2.5 concentrations in Beijing over the same period was mainly attributable to local (65.4 %) and regional (22.5 %) emission reductions, with meteorological conditions accounting for only 12.1 %.
Current research primarily emphasizes the impact of anthropogenic pollutant emissions (Zheng et al., 2018) and meteorological changes on PM2.5 concentrations (Zhang et al., 2019; Zhai et al., 2019), while the potential influence of CO2 concentration changes on PM2.5 pollution levels remains largely underexplored. Additionally, following the implementation of the Clean Air Action Plan in 2013, significant decreases in PM2.5 concentrations were observed in China. Concurrently, CO2 levels continued to rise (Xu et al., 2022), with the influence of CO2 on PM2.5 strengthening annually. Therefore, it is essential to analyze the evolution of PM2.5 concentrations from 2008 to 2018 in detail, and attribute changes in PM2.5 levels to every factor, such as anthropogenic pollutant emissions, meteorological conditions, and CO2 variations.
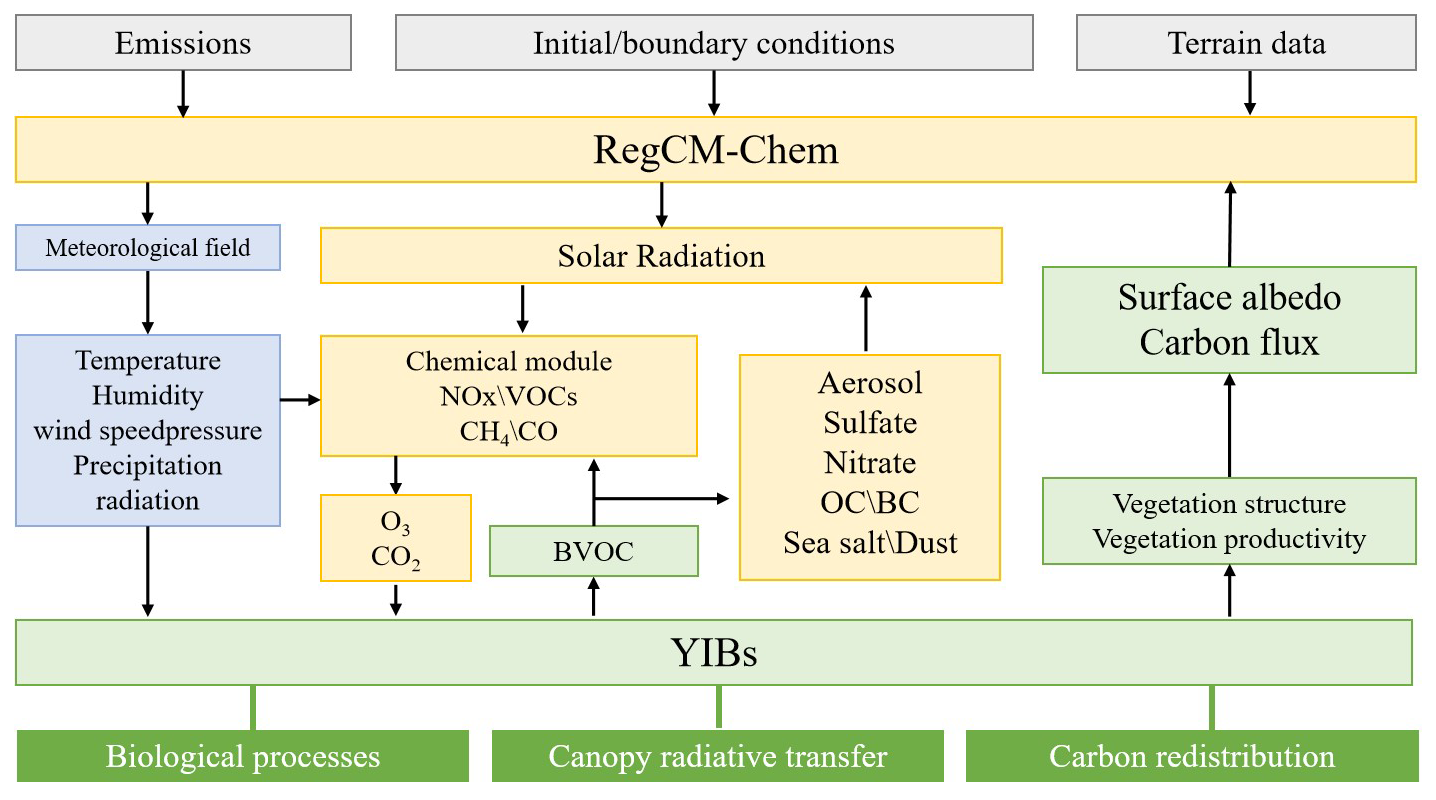
2.1 Model description
In this study, we employed the coupled regional climate-chemistry-ecology model RegCM-Chem-YIBs (Xie et al., 2019, 2024). The RegCM-Chem component simulates key meteorological variables, including temperature, humidity, precipitation, and radiation, along with atmospheric pollutants including ozone and particulate matter (Shalaby et al., 2012). The YIBs (Yale Interactive terrestrial Biosphere) model focuses on simulating vegetation physiological processes, such as ozone-induced damage, photosynthesis, and respiration (Lei et al., 2020). Additionally, it computes important land surface parameters, including CO2 flux, BVOC emissions, and stomatal conductance (Yue and Unger, 2015). The YIBs model employs a leaf-level BVOC emission scheme based on vegetation photosynthesis. Unlike the traditional MEGAN (Model of Emissions of Gases and Aerosols from Nature) model, this approach incorporates the influence of plant photosynthesis on BVOC emissions, making it more representative of actual plant physiological processes. In this scheme, leaf-level BVOC emission rates depend on the photosynthetic rate, leaf surface temperature, and intracellular CO2 concentration (Yue and Unger, 2015; Lei et al., 2020; Yue et al., 2015).
The RegCM-Chem and YIBs models exchange variables every 6 min, facilitating dynamic coupling between regional climate, atmospheric chemistry, and ecosystem processes. The RegCM-Chem-YIBs model simulated both primary and secondary PM2.5 emissions, including dust, black carbon, organic carbon, sulfates, nitrates, and ammonium. The structure of the model is shown in Fig. 1.
In the RegCM-Chem-YIBs model, changes in CO2 concentrations affect PM2.5 primarily via two mechanisms: first, CO2-induced radiative forcing alters the atmospheric radiation balance, leading to shifts in temperature, precipitation, and boundary-layer structure that modulate PM2.5 formation, transport, and removal (Li and Mölders, 2008; Matthews, 2007); and second, through the YIBs module, changes in CO2 concentration modulate photosynthetic activity and stomatal behavior, altering BVOCs emissions that undergo atmospheric photochemical oxidation to form secondary organic aerosols, a significant fraction of PM2.5 (Kergoat et al., 2002; Kellomaki and Wang, 1998).
2.2 Model configurations
The study area covers the entire East Asian region, with a horizontal grid resolution of 60 km, centered at 36° N and 107° E. A terrain-following coordinate system was used vertically (Bleck and Benjamin, 1993), dividing the atmosphere into 18 layers from the surface to 50 hPa.
Anthropogenic pollutant emissions data were obtained from the Multi-resolution Emission Inventory for China (MEIC v1.4) developed by Tsinghua University (Geng et al., 2024). Surface CO2 flux data were sourced from the National Oceanic and Atmospheric Administration (NOAA) CarbonTracker CT2019 dataset, which includes contributions from fossil fuel combustion, biomass burning, and ocean–atmosphere CO2 exchange (Peters et al., 2007). Meteorological fields were derived from ERA-Interim reanalysis (Balsamo et al., 2015), while sea surface temperature data were taken from NOAA's weekly mean dataset (Huang et al., 2021). The model employed the Grell cumulus parameterization scheme, the CCM3 radiation scheme, the Holtslag PBL scheme for boundary layers, the CBM-Z mechanism for meteorology and chemistry, and the TUV photochemistry scheme.
2.3 Experiment settings
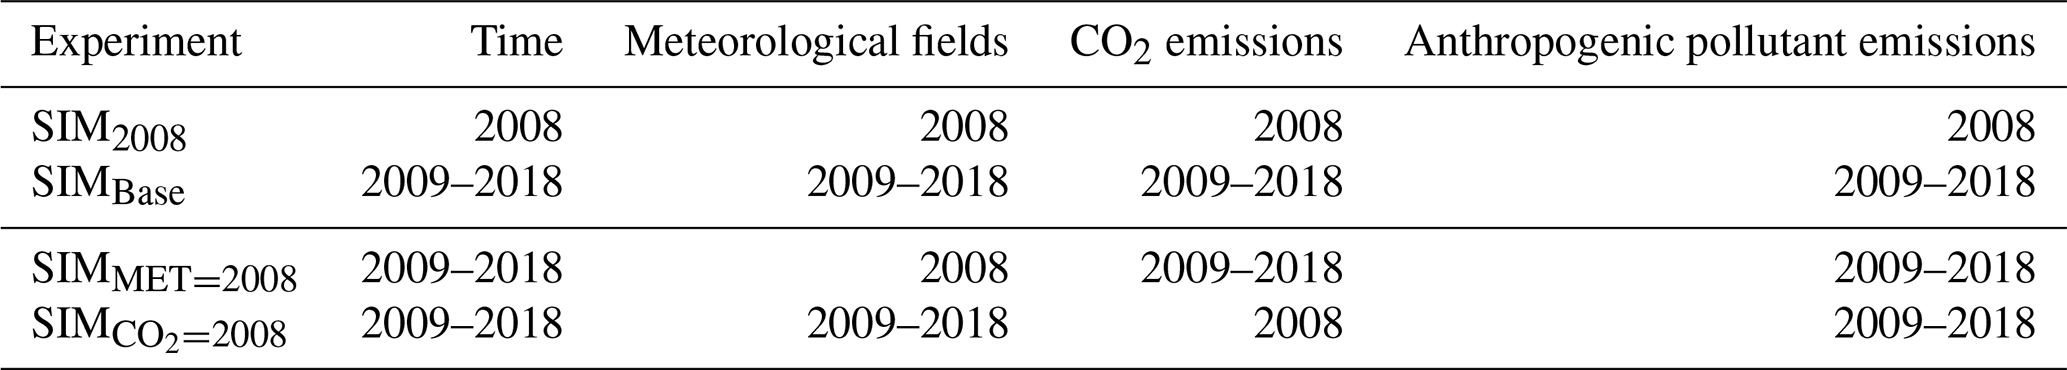
The numerical experiments are presented in Table 1. The SIM2008 experiment represents the baseline conditions for the year 2008. In the SIMBase experiment, interannual variations in meteorological fields, CO2 emissions, and anthropogenic pollutant emissions (excluding CO2 emissions) were considered for simulations spanning the period 2009–2018, representing the baseline conditions for those years. Additionally, the SIMMET=2008 and SIM experiments were designed, where meteorological fields and CO2 emissions were fixed at their 2008 levels, while simulations were conducted for the 2009–2018 period. The simulation period spans from April to August each year. From this, the results from May to August, corresponding to the East Asian Summer Monsoon (EASM) period, were selected for analysis.
Changes in PM2.5 concentrations were attributed to three main factors: anthropogenic pollutant emissions, meteorological conditions, and CO2 variations. By comparing the simulation results from different years in the SIMBase experiment to SIM2008 (SIMBase−SIM2008), we quantified changes in PM2.5 concentrations relative to 2008 for the period 2009–2018. To evaluate the impact of meteorological conditions on PM2.5 concentrations, we compared the results of the SIMBase experiment with those of the SIMMET=2008 experiment for the same year (SIM). Similarly, the contribution of CO2 emission changes to PM2.5 variations was assessed by comparing the SIMBase experiment with the SIM experiment (SIM) in the same year. The contribution of anthropogenic pollutant emissions was then determined by subtracting the effects of meteorological and CO2 emission changes from the total PM2.5 variation.
It is noteworthy that, as a principal greenhouse gas, CO2 modifies meteorological parameters – such as radiation, temperature, and precipitation – which in turn influence PM2.5 levels. In the comparison between experiments SIMBase and SIM (SIM), all meteorological changes derive solely from variations in CO2 emissions, a mechanism fundamentally different from the meteorological influences identified in experiments SIMBase and SIMMET=2008 (SIM).
2.4 Model evaluations
Observed PM2.5 data were obtained from the China National Environmental Monitoring Center. This study used hourly PM2.5 concentrations during the summer monsoon period (1 May to 31 August) from 2015 to 2018. A total of 366 monitoring stations across Chinese cities, selected based on data completeness and representativeness, were used for model validation. The locations of these stations are shown in Fig. S5. CO2 observations were sourced from the World Data Centre for Greenhouse Gases, including all seven sites in East Asia: Waliguan, Korea Tae-ahn Peninsula, Ulaanbaatar in Mongolia, Lulin, Yonagunijima, Cape D'Aguilar (Hong Kong), and King's Park. Detailed station locations are shown in Fig. S6. Reanalysis data for temperature, wind fields, and relative humidity were obtained from the ERA-Interim dataset.
As shown in Table 2 and Figs. S1–S6, the SIMBase experiments reproduce 2015–2018 PM2.5 and CO2 concentrations with high correlations and low biases relative to observations, while their simulated meteorological fields closely match reanalysis data. Overall, the RegCM-Chem-YIBs model effectively captures the fundamental characteristics and temporal trends of meteorological factors, PM2.5, and CO2 concentrations in East Asia (Ma et al., 2023a, b).
Table 2Evaluations of the near-surface CO2 and PM2.5 in East Asia.
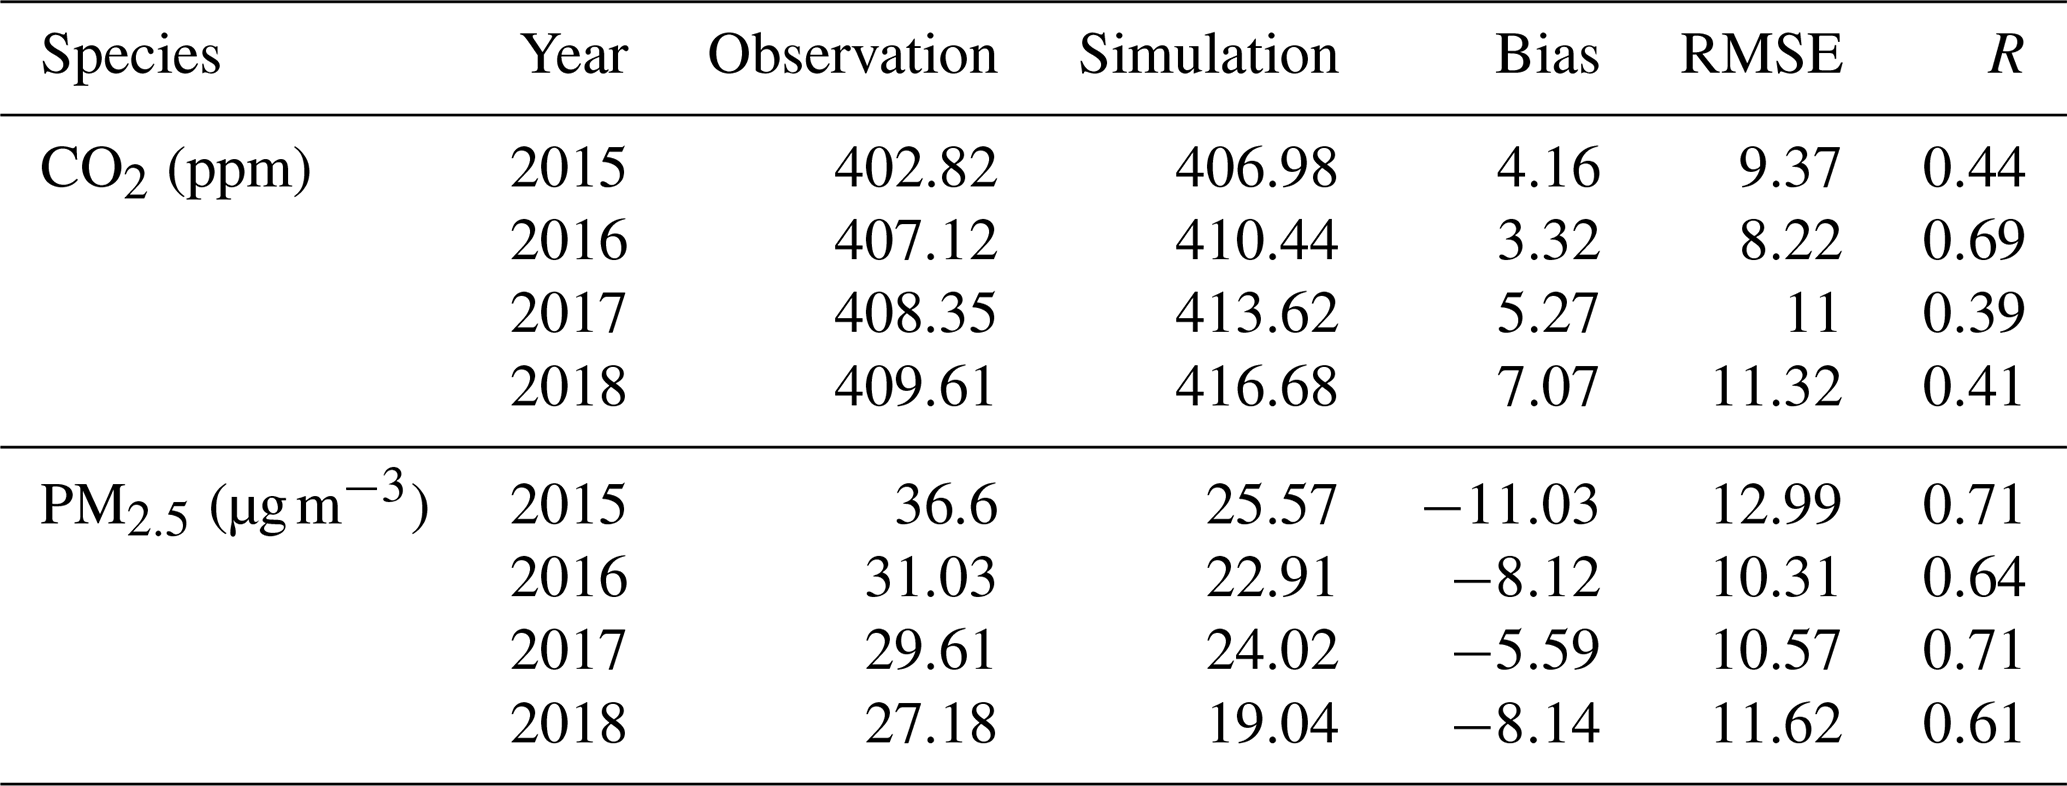
RMSE: root mean square error; R: correlation coefficient.
3.1 PM2.5 variation
Changes in PM2.5 concentrations from 2009 to 2018 relative to 2008 were quantified by comparing simulation results from each year in the SIMBase experiment with SIM2008 (SIMBase−SIM2008). Figure 2 illustrates the changes in near-surface PM2.5 concentrations across East Asia from 2009 to 2018. PM2.5 concentrations are notably higher in the North China Plain, northeastern China, and eastern China (Shanghai, Jiangsu, Zhejiang), largely driven by industrial emissions, vehicle exhaust, coal combustion, and dust from human activities (Wang et al., 2017). In contrast, regions in western China (Yunnan, Gansu, Xinjiang) exhibit lower PM2.5 levels due to limited industrial activity, lower population density, and more favorable meteorological conditions (low water vapor content, lower temperatures, and weak solar radiation are unfavorable for the formation of secondary aerosols such as sulfates, nitrates, and organic aerosols) (Wei et al., 2021; Xue et al., 2020). Developed cities and industrial centers like the PRD and Fuzhou (Fujian Province) continue to encounter challenges related to PM2.5 pollution. Moreover, the Sichuan region, characterized by its enclosed basin geography and high population density, also experiences high PM2.5 pollution levels (Wang et al., 2018b). From 2009 to 2013, PM2.5 concentrations in China remained relatively stable, with levels averaging around 90 µg m−3 in the North China Plain and the Sichuan Basin (SCB). However, following the implementation of the Clean Air Action Plan in 2013, PM2.5 levels significantly declined nationwide. By 2018, concentrations had dropped to below 50 µg m−3 across much of the country.
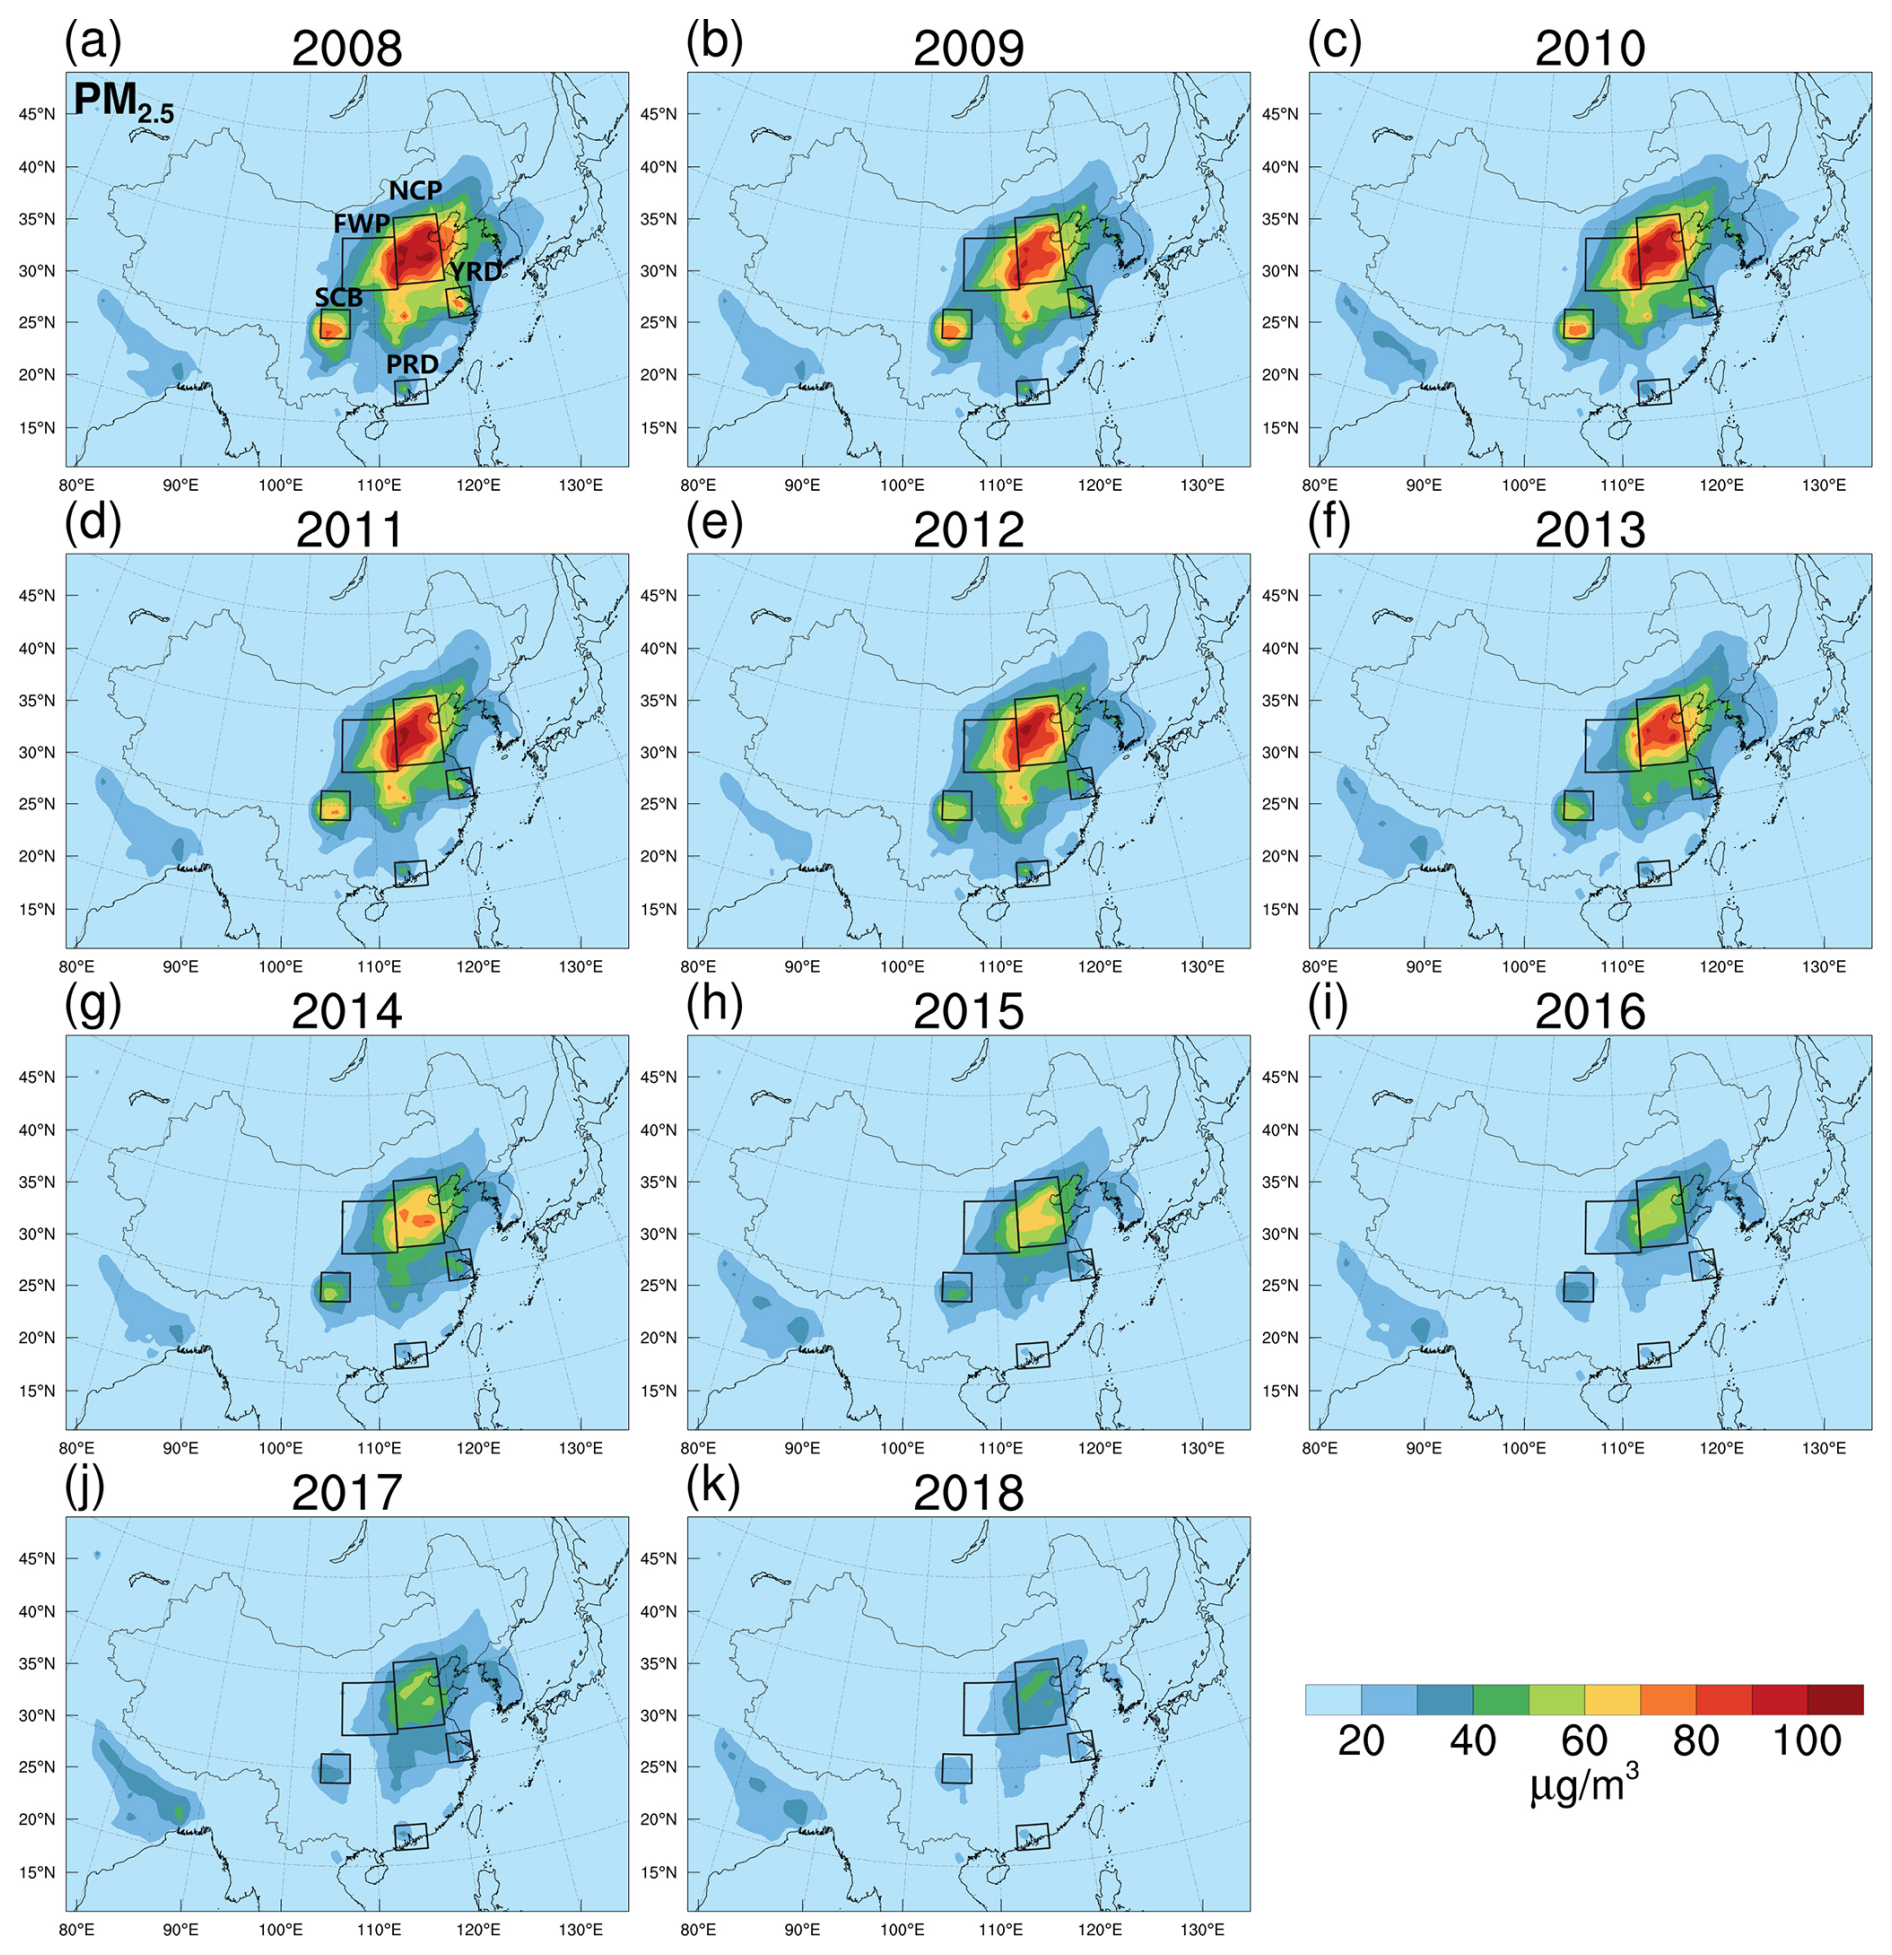
Figure 2Near-surface PM2.5 concentrations (µg m−3) over East Asia during the EASM period from 2009 (a) to 2018 (k) (SIM2008). Key regions are highlighted by black boxes, including the North China Plain (NCP), Fenwei Plain (FWP), Yangtze River Delta (YRD), Pearl River Delta (PRD), and Sichuan Basin (SCB).
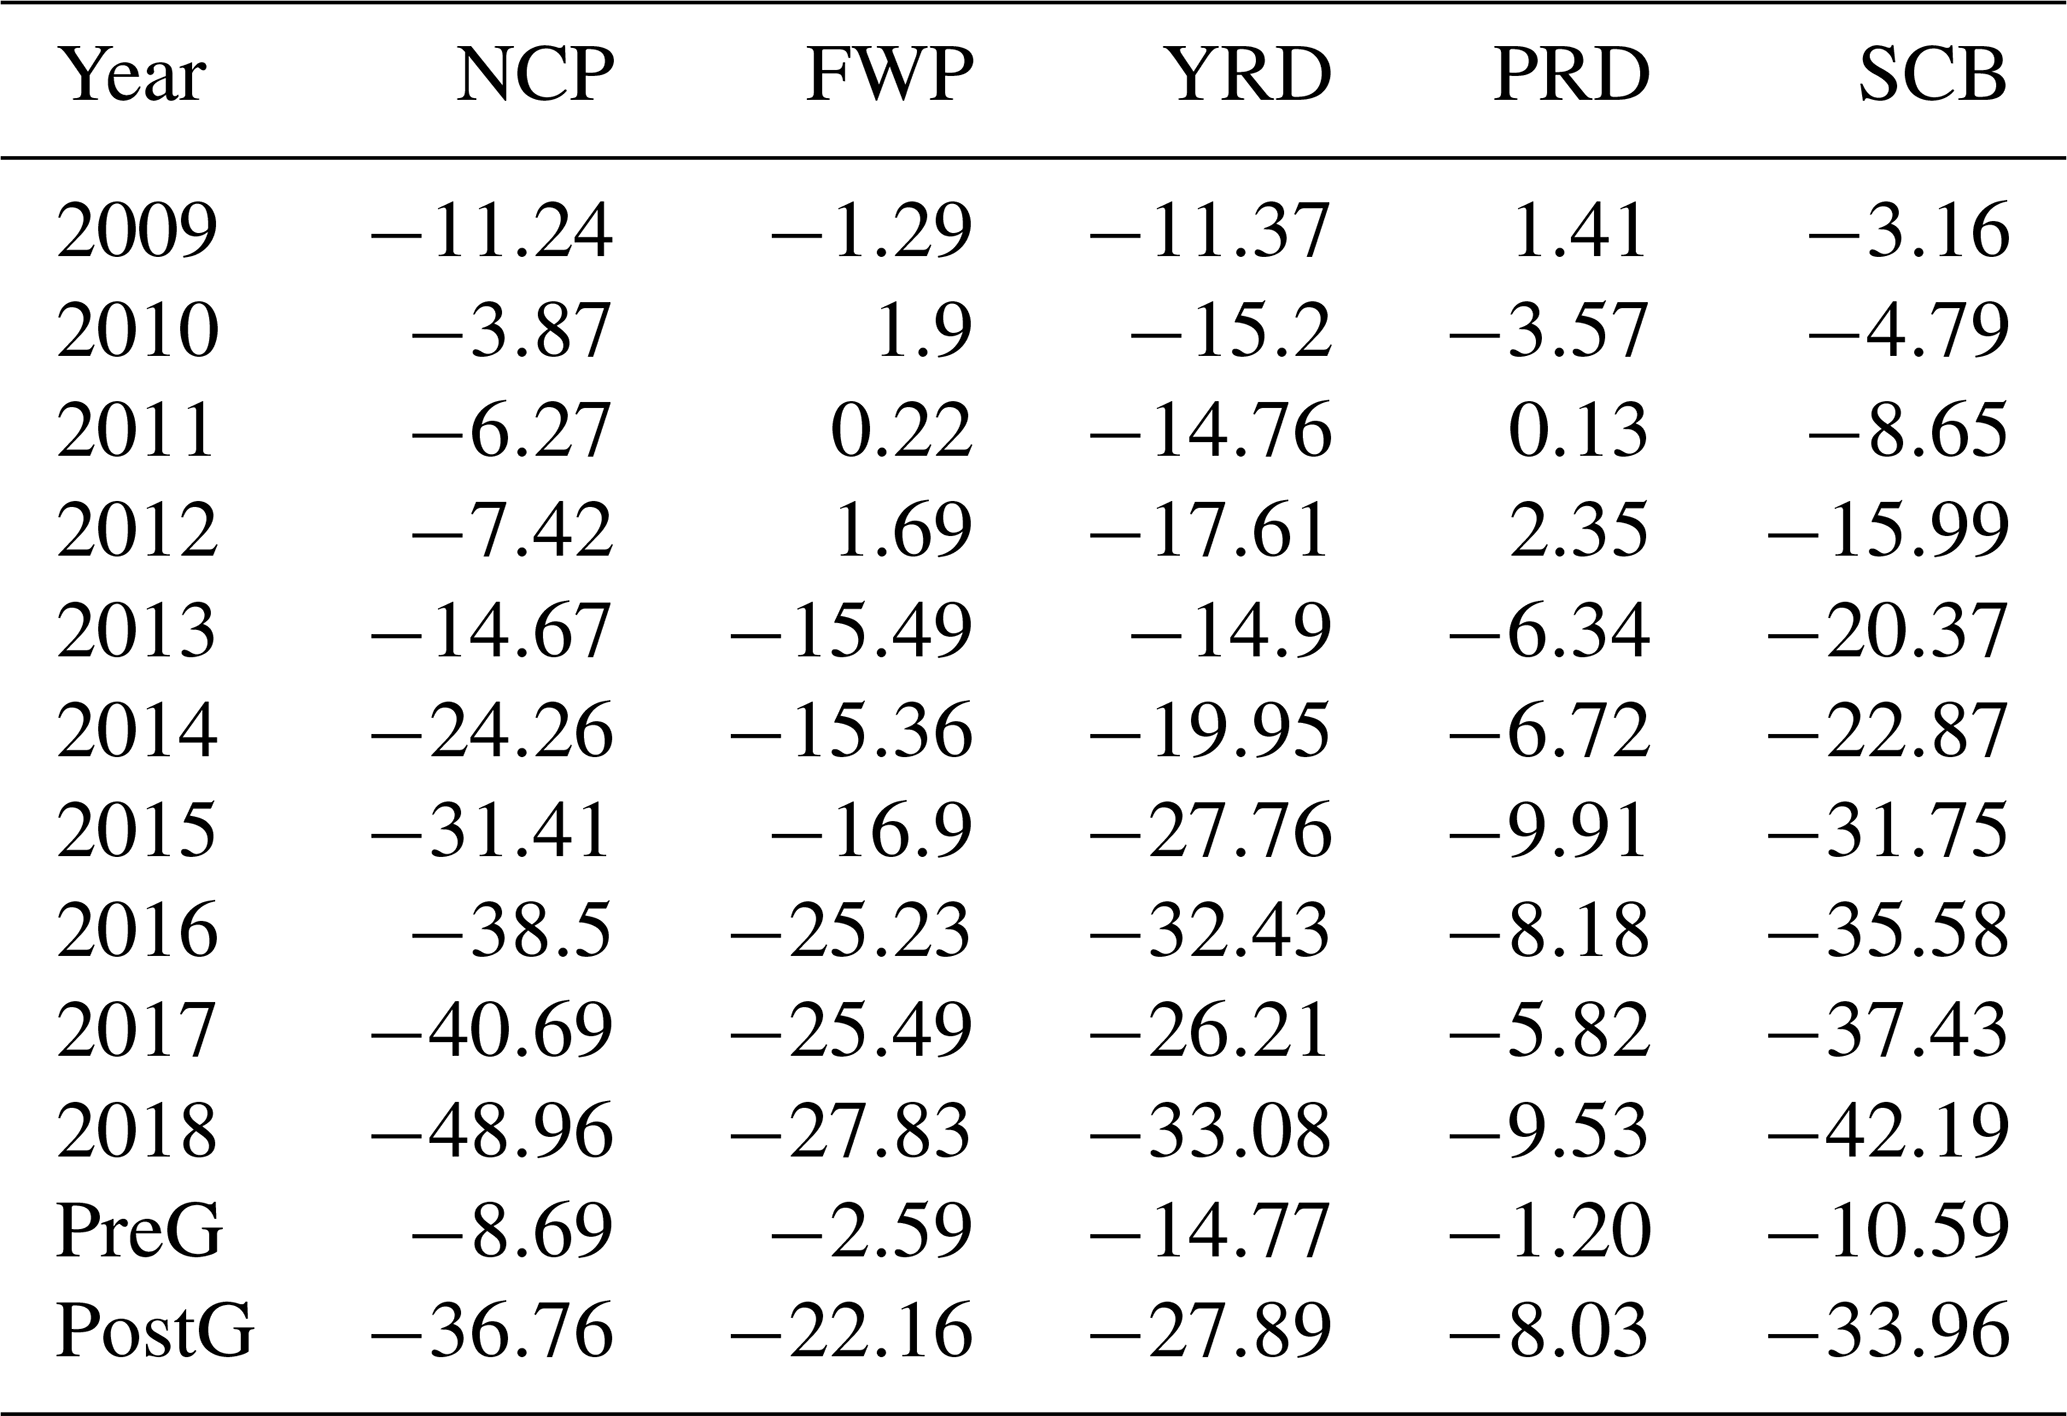
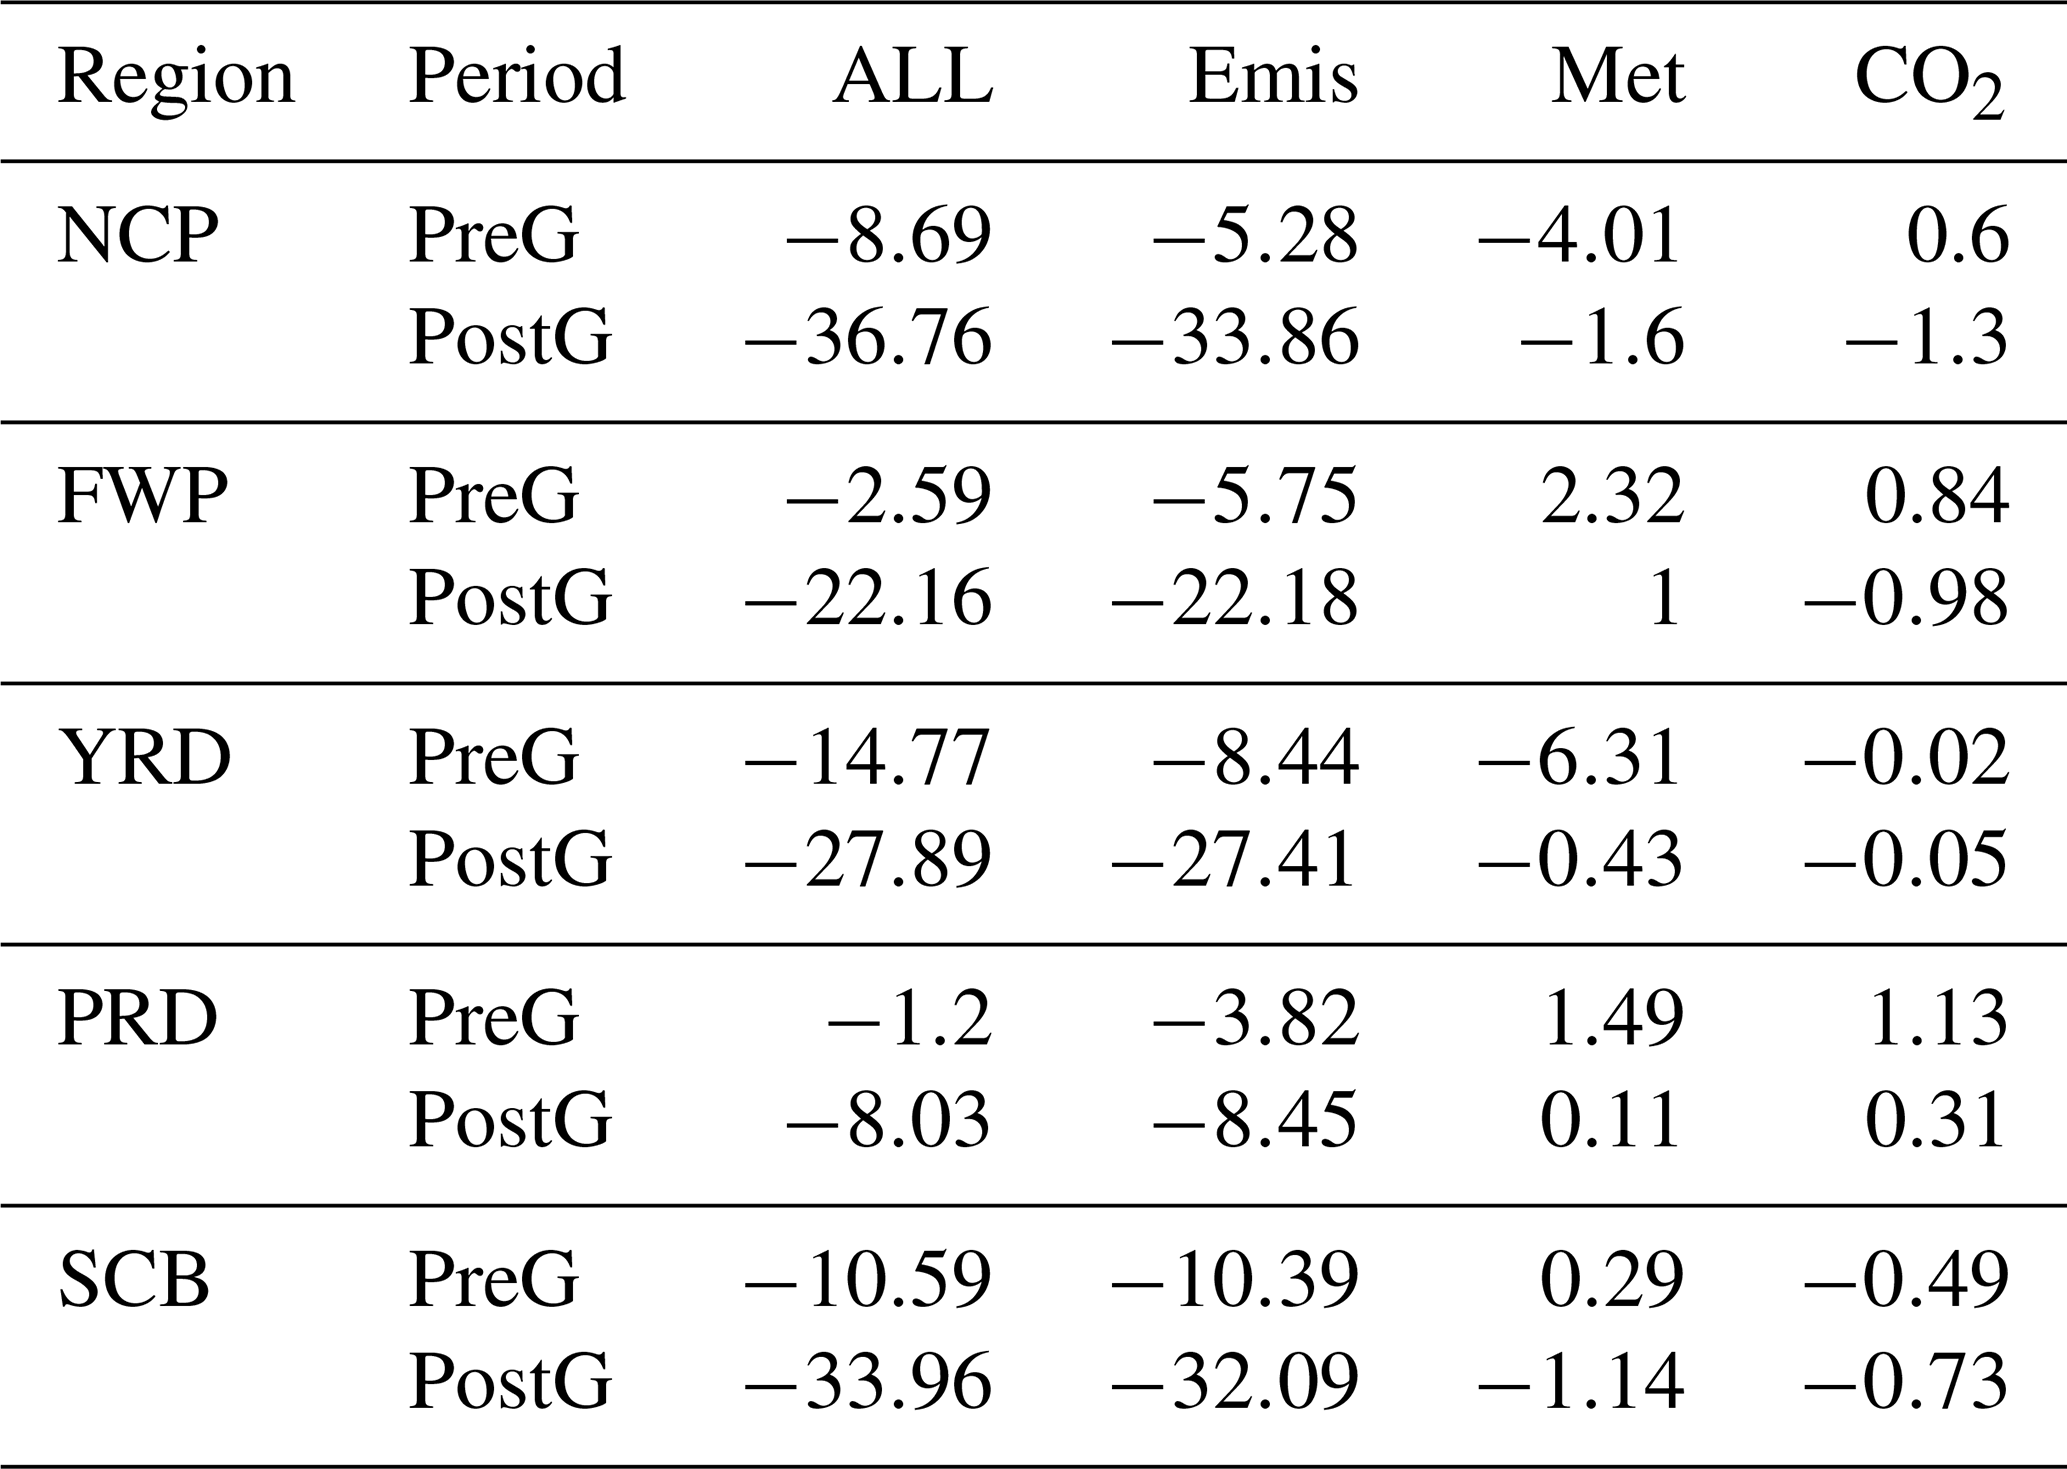
Figure 3 and Table 3 present the changes in PM2.5 concentrations relative to 2008 across East Asia from 2009 to 2018. Since 2008, most regions in China have seen varying degrees of PM2.5 reduction. During the pre-governance (PreG) period (2009–2013), the largest decrease occurred in the YRD, with a reduction of 14.77 µg m−3, followed by the SCB and PRD, where concentrations dropped by 10.59 and 8.69 µg m−3, respectively. In contrast, the Fenwei Plain (FWP) and PRD experienced smaller changes, with reductions of less than 3 µg m−3. PM2.5 concentrations across China significantly decreased after the implementation of the Clean Air Action Plan in 2013. The most notable reductions were simulated in the North China Plain and SCB, where PM2.5 concentrations dropped by 36.76 and 33.96 µg m−3, respectively. In the FWP and YRD, PM2.5 concentrations decreased by 22.16 to 27.89 µg m−3. In contrast, the PRD saw a smaller reduction, with levels decreasing by just 8.03 µg m−3. This may be attributed to the region's significant influence from the summer monsoon and relatively lower impact from anthropogenic pollutant emissions. Further analysis of these factors will be conducted in subsequent sections.
Table S1 shows that the mean PM2.5 trend over China during the PreG (2009–2013) and post-governance (PostG; 2014–2018) periods was −1.84 and −2.90 , respectively. These values are consistent with the findings of Silver et al. (2025), who reported a PM2.5 trend of −2.47 for 2014–2017 in China based on ground-based observations. Similarly, Lin et al. (2018) reported PM2.5 trends of −0.65 and −2.30 for 2006–2010 and 2011–2015 in China, respectively. Using satellite remote sensing data, Ma et al. (2019) found declines of 1.03 and 4.27 for 2010–2013 and 2013–2017 in China, respectively. The high-resolution Chinese air quality reanalysis developed by Kong et al. (2021) using data assimilation techniques indicated a more pronounced decline of −5.80 for PM2.5 from 2013 to 2018 in China. In addition, Silver et al. (2018), based on multi-source data, reported a trend of −3.40 for 2015–2017 in China. Therefore, our simulation accurately captures the observed PM2.5 trends over China from 2008 to 2018, providing a robust foundation for subsequent attribution analyses.
Overall, before 2013, near-surface PM2.5 concentrations across China showed little variation. However, after 2013, a significant reduction in PM2.5 pollution levels was simulated nationwide. Changes in PM2.5 concentrations were attributed to three main factors: anthropogenic pollutant emissions, meteorological conditions, and CO2 variations. The following sections analyze each factor's contribution to the changes in PM2.5 concentrations from 2008 to 2018.
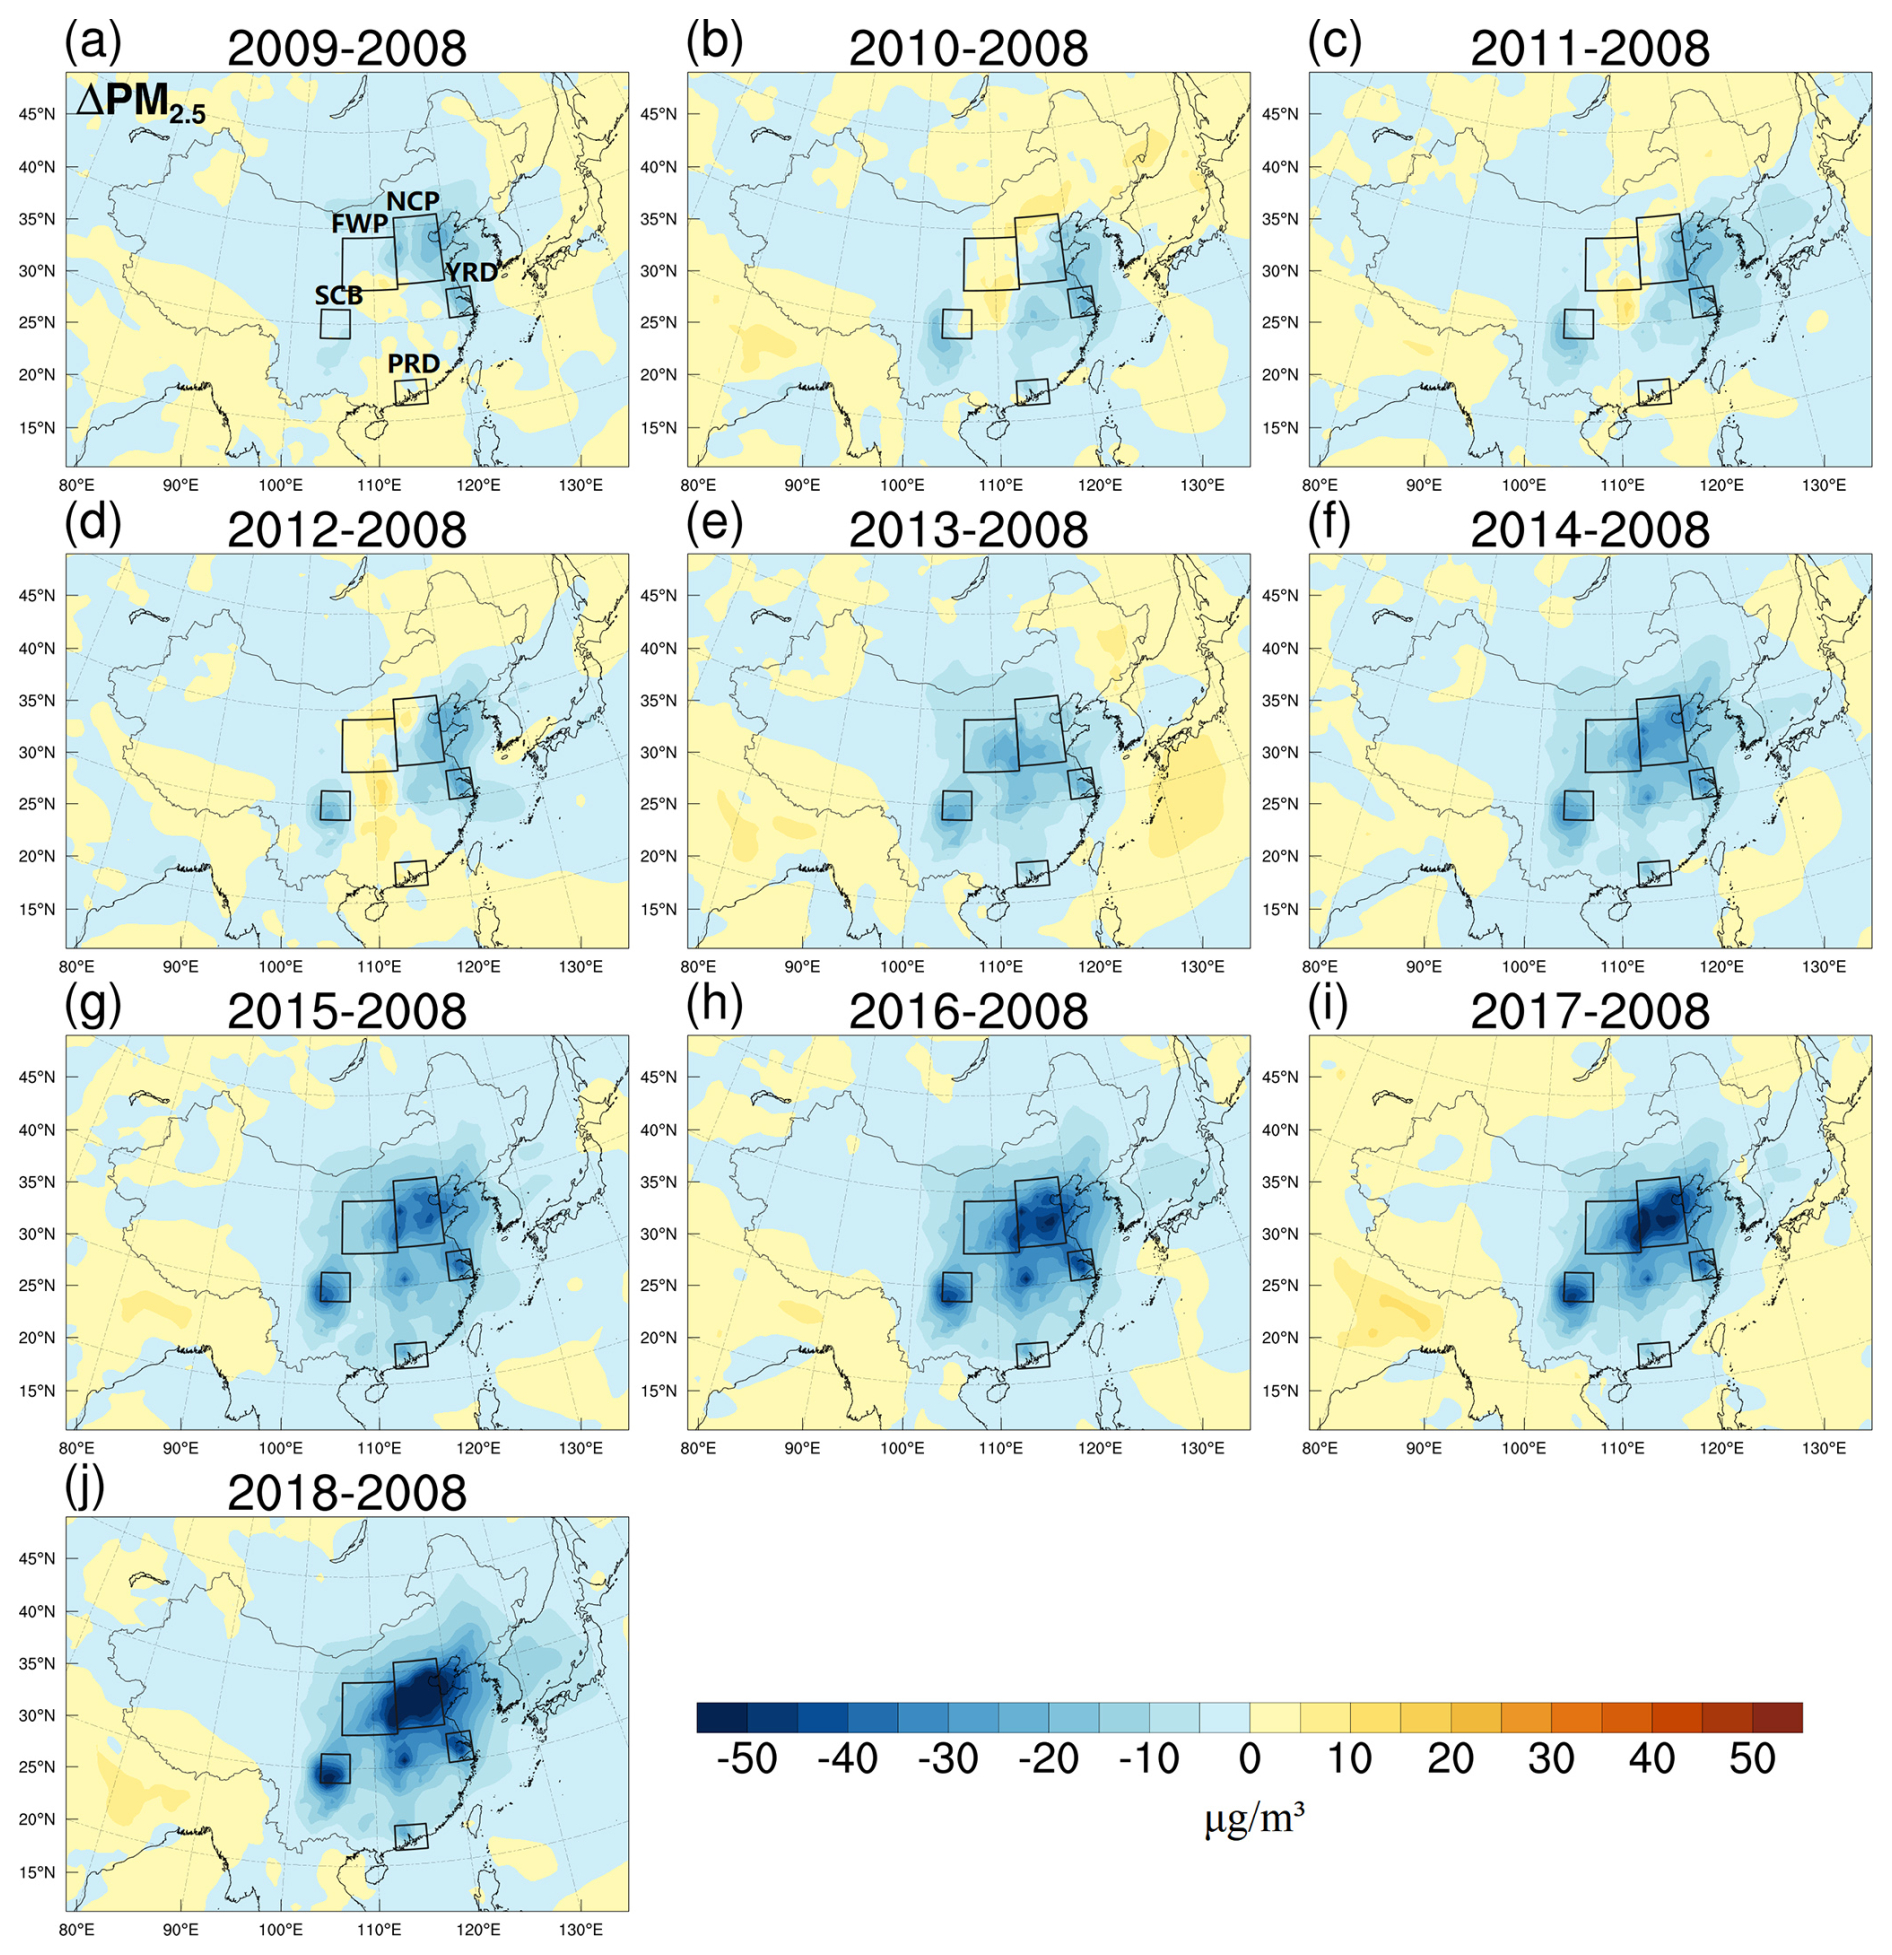
Figure 3Changes in near-surface PM2.5 concentrations (µg m−3) during the EASM period from 2009 (a) to 2018 (j) relative to 2008 in East Asia (SIMBase−SIM2008).
Table 3Changes in near-surface PM2.5 concentrations (µg m−3) during the EASM period from 2009 to 2018 relative to 2008 in the North China Plain (NCP), Fenwei Plain (FWP), Yangtze River Delta (YRD), Pearl River Delta (PRD), and Sichuan Basin (SCB) (SIMBase−SIM2008).
3.2 Contribution of meteorological conditions
The impact of meteorological conditions variations on PM2.5 concentrations were assessed by comparing SIMBase results with those from SIMMET=2008 for the same year (SIM). As shown in Fig. 4, during the PreG period, precipitation increased by 2–4 mm d−1 in China's eastern coastal and western inland regions, while it decreased by approximately 2 mm d−1 in central China. This increase in precipitation facilitates the reduction of near-surface PM2.5 concentrations through wet deposition. Consequently, trends in PM2.5 concentrations are inversely related to precipitation: concentrations decreased by 2–16 µg m−3 in the eastern coastal and western inland regions, while they increased by 4–8 µg m−3 around 110° E in central China. Additionally, in northeastern and southwestern China, wind speeds increased by 1 to 2 m s−1, contributing to the reduction of PM2.5 concentrations. In contrast, decreased wind speeds in southeastern and central China facilitated the accumulation of PM2.5. During the PostG period, the significant increase in temperature (Fig. 4l) promoted the formation of PM2.5, leading to an expansion of the areas where PM2.5 concentrations increased. Overall, PM2.5 concentrations have decreased in the eastern coastal and western inland regions but increased in the central area of China.
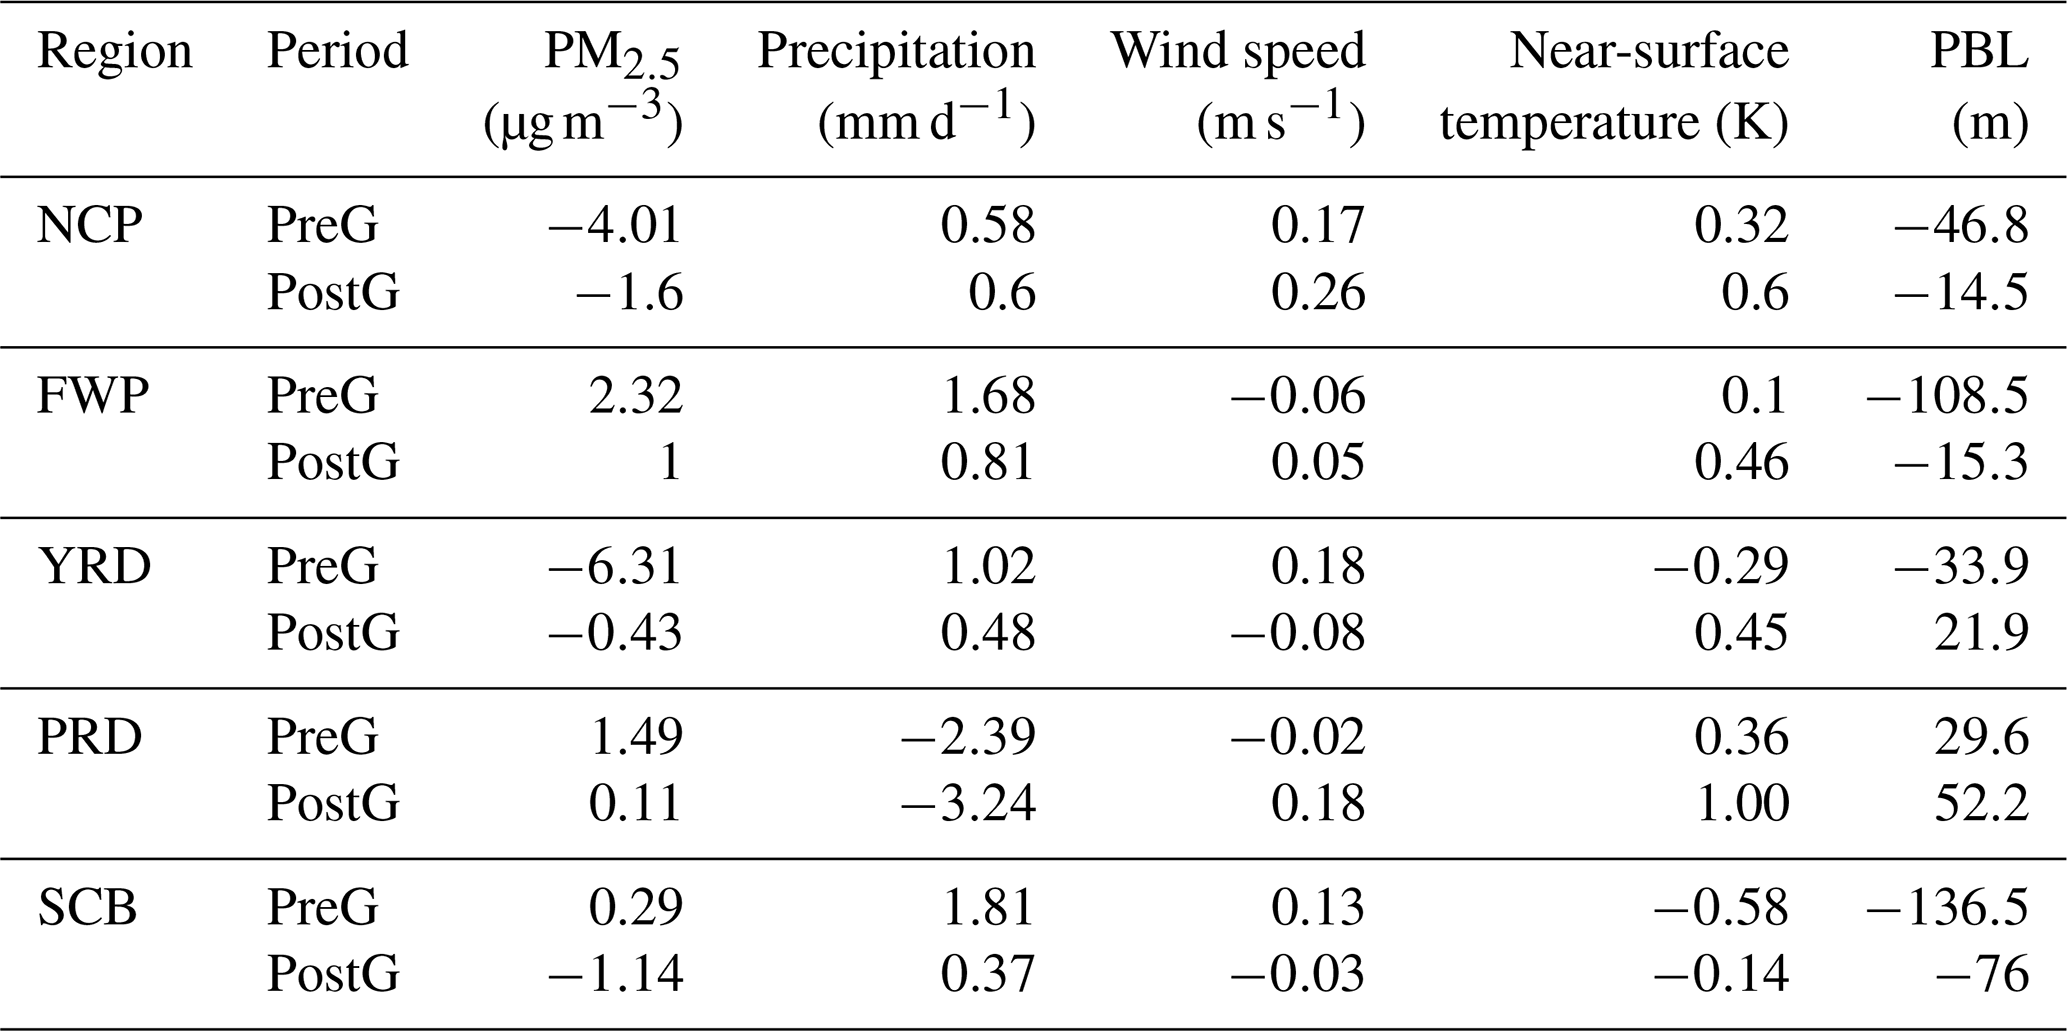
Table 4 indicates that in the North China Plain (NCP) region precipitation increased by 0.58 to 0.6 mm d−1 and wind speed rose by 0.17 to 0.26 m s−1 during the PreG and PostG periods, resulting in a decrease in near-surface PM2.5 concentrations of 1.6 to 4.01 µg m−3. In the FWP region, PM2.5 concentrations increased by 1 to 2.31 µg m−3, which was associated with a rise in temperature of 0.1 to 0.46 K and a significant decrease in PBLH of 108.5 to 15.3 m. In the YRD region, the increase in wind speed of 0.48 to 1.02 m s−1 facilitated a reduction in PM2.5 concentrations by 0.43 to 0.61 µg m−3. Conversely, in the PRD region, reduced precipitation combined with increased temperature contributed to an increase in PM2.5 concentrations, ranging from 0.11 to 1.49 µg m−3. In the SCB region, PM2.5 concentrations rose by 0.29 µg m−3 during the PreG period, which can be linked to a significant decrease in PBLH of 136.5 m. In the PostG period, PM2.5 concentrations decreased by 1.14 µg m−3, which can be attributed to an increase in precipitation (0.37 mm d−1) and a decrease in temperature (0.14 K).
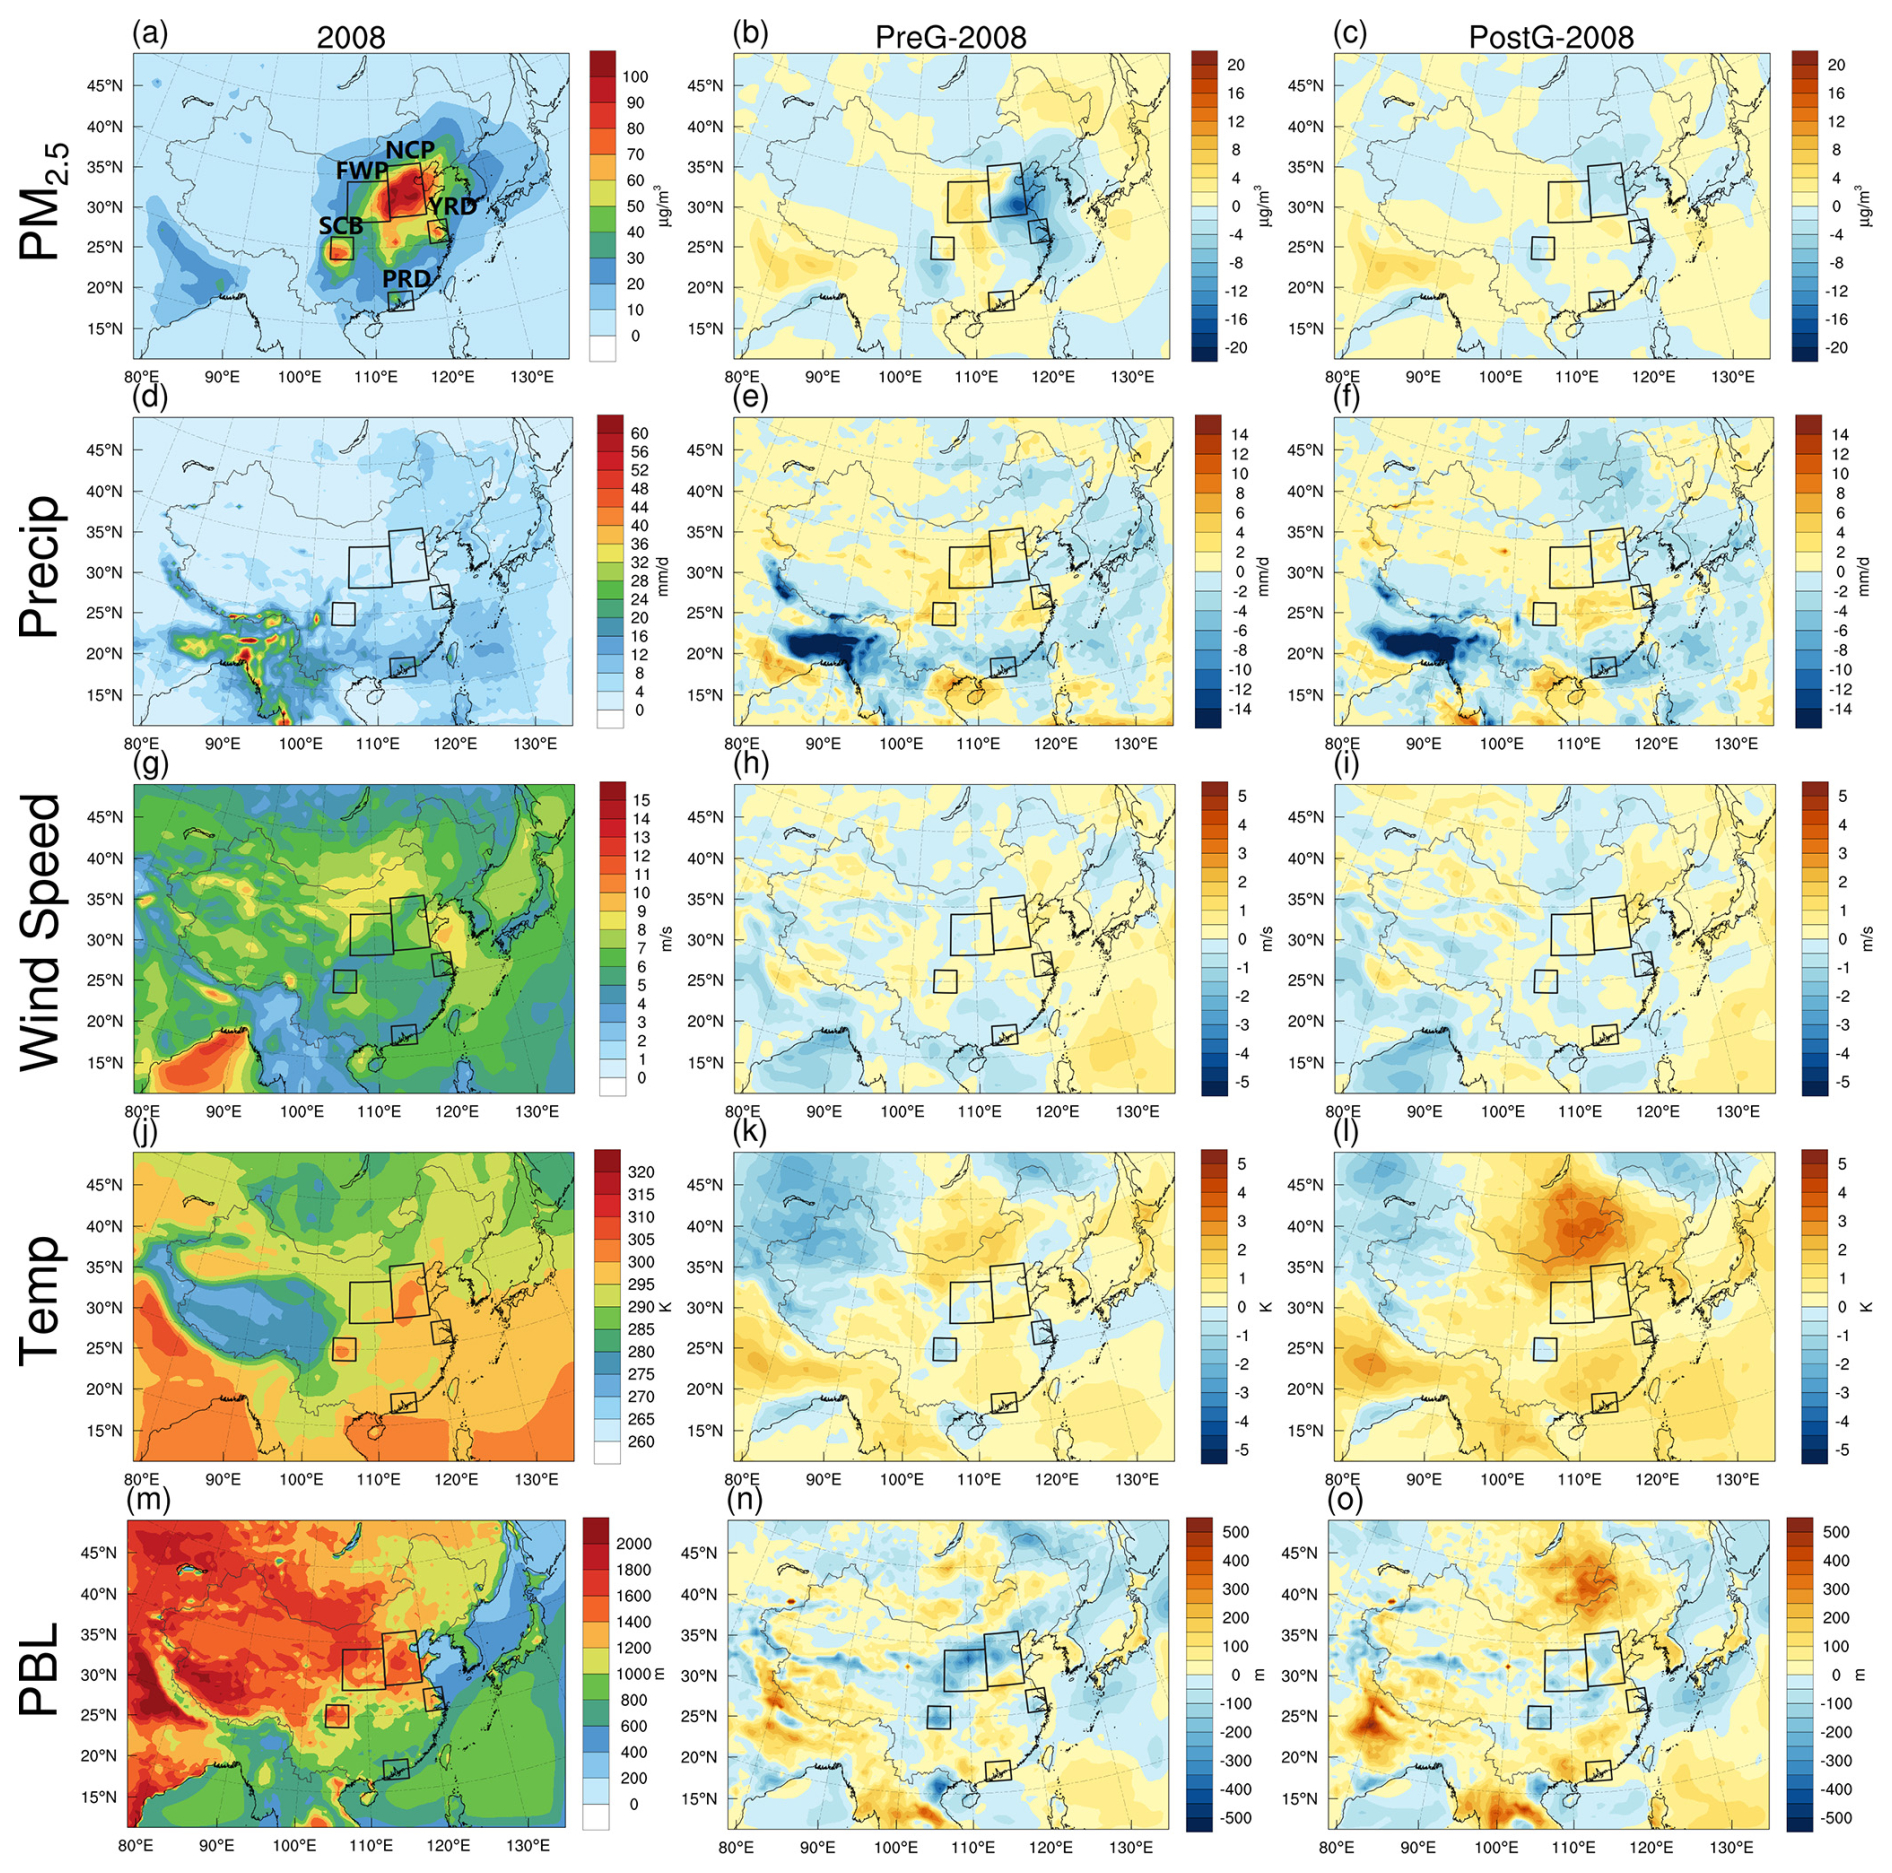
Figure 4The PM2.5 (a–c, µg m−3), precipitation (d–f, mm d−1), wind speed (g–i, m s−1), temperature (j–l, K), and planetary boundary layer (PBL) height (m–o, m) during the EASM period in 2008 (left), and their mean changes due to meteorological variations in the PreG (2009–2013, center) and PostG (2014–2018, right) periods relative to 2008. PreG-2008 and PostG-2008 represent the average annual differences between experiments SIMBase and SIMMET=2008 (SIM) for the periods 2009–2013 and 2014–2018, respectively.
Table 4Impact of meteorological condition changes on PM2.5 (µg m−3), precipitation (mm d−1), wind speed (m s−1), near-surface temperature (K), and planetary boundary layer (PBL) height (m) during the EASM period in the PreG (2009–2013) and PostG (2014–2018) periods relative to 2008. PreG and PostG represent the average annual differences between experiments SIMBase and SIMMET=2008 (SIM) for the periods 2009–2013 and 2014–2018, respectively.
3.3 Contribution of CO2
The contribution of CO2 emission changes to PM2.5 variability was quantified by comparing the SIMBase experiment with the SIM experiment (SIM) within the same year. As shown in Fig. 5, following the ongoing urbanization and industrialization, CO2 concentrations across East Asia rose by 2–10 ppm during both the PreG and PostG periods, with a sharper increase in the PostG period. CO2 influences atmospheric PM2.5 concentrations both through its radiative effects on precipitation and by altering BVOC emissions from vegetation. Overall, CO2 changes contributed to PM2.5 variations across East Asia from 2008 to 2018, ranging from −4 to 6 µg m−3. PM2.5 pollution levels generally increased in the PreG period, while reductions were more common in the PostG period.
Table 5 presents a detailed analysis of the five target regions. In northern China, particularly the NCP and FWP regions, limited vegetation coverage means CO2 impacts surface PM2.5 concentrations mainly through precipitation changes. In the PostG period, precipitation increased by 0.06–0.13 mm d−1, lowering PM2.5 concentrations by 0.98–1.3 µg m−3. Similarly, in the SCB, precipitation rose by 0.21–0.64 mm d−1, reducing PM2.5 concentrations by 0.49–0.73 µg m−3 in the PreG and PostG periods. However, in the YRD and PRD regions, where vegetation coverage is higher, CO2 primarily impacts PM2.5 concentrations by modulating BVOC emissions. The impact can be either positive or negative (Possell et al., 2005) depending primarily on the balance between the inhibitory effects on synthase activity and the stimulatory effects of enhanced photosynthesis (Wilkinson et al., 2009). In the YRD region, isoprene fell by 0.32–0.58 µg m−3 during both periods, while precipitation rose by 0.09–0.13 mm d−1, collectively reducing PM2.5 by 0.02–0.05 µg m−3. In the PRD region, isoprene concentrations increased significantly by 0.31–0.92 µg m−3, while precipitation decreased by 0.33–1.02 mm d−1. Consequently, PM2.5 concentrations rose by 0.31–1.13 µg m−3 during both the PreG and PostG periods.
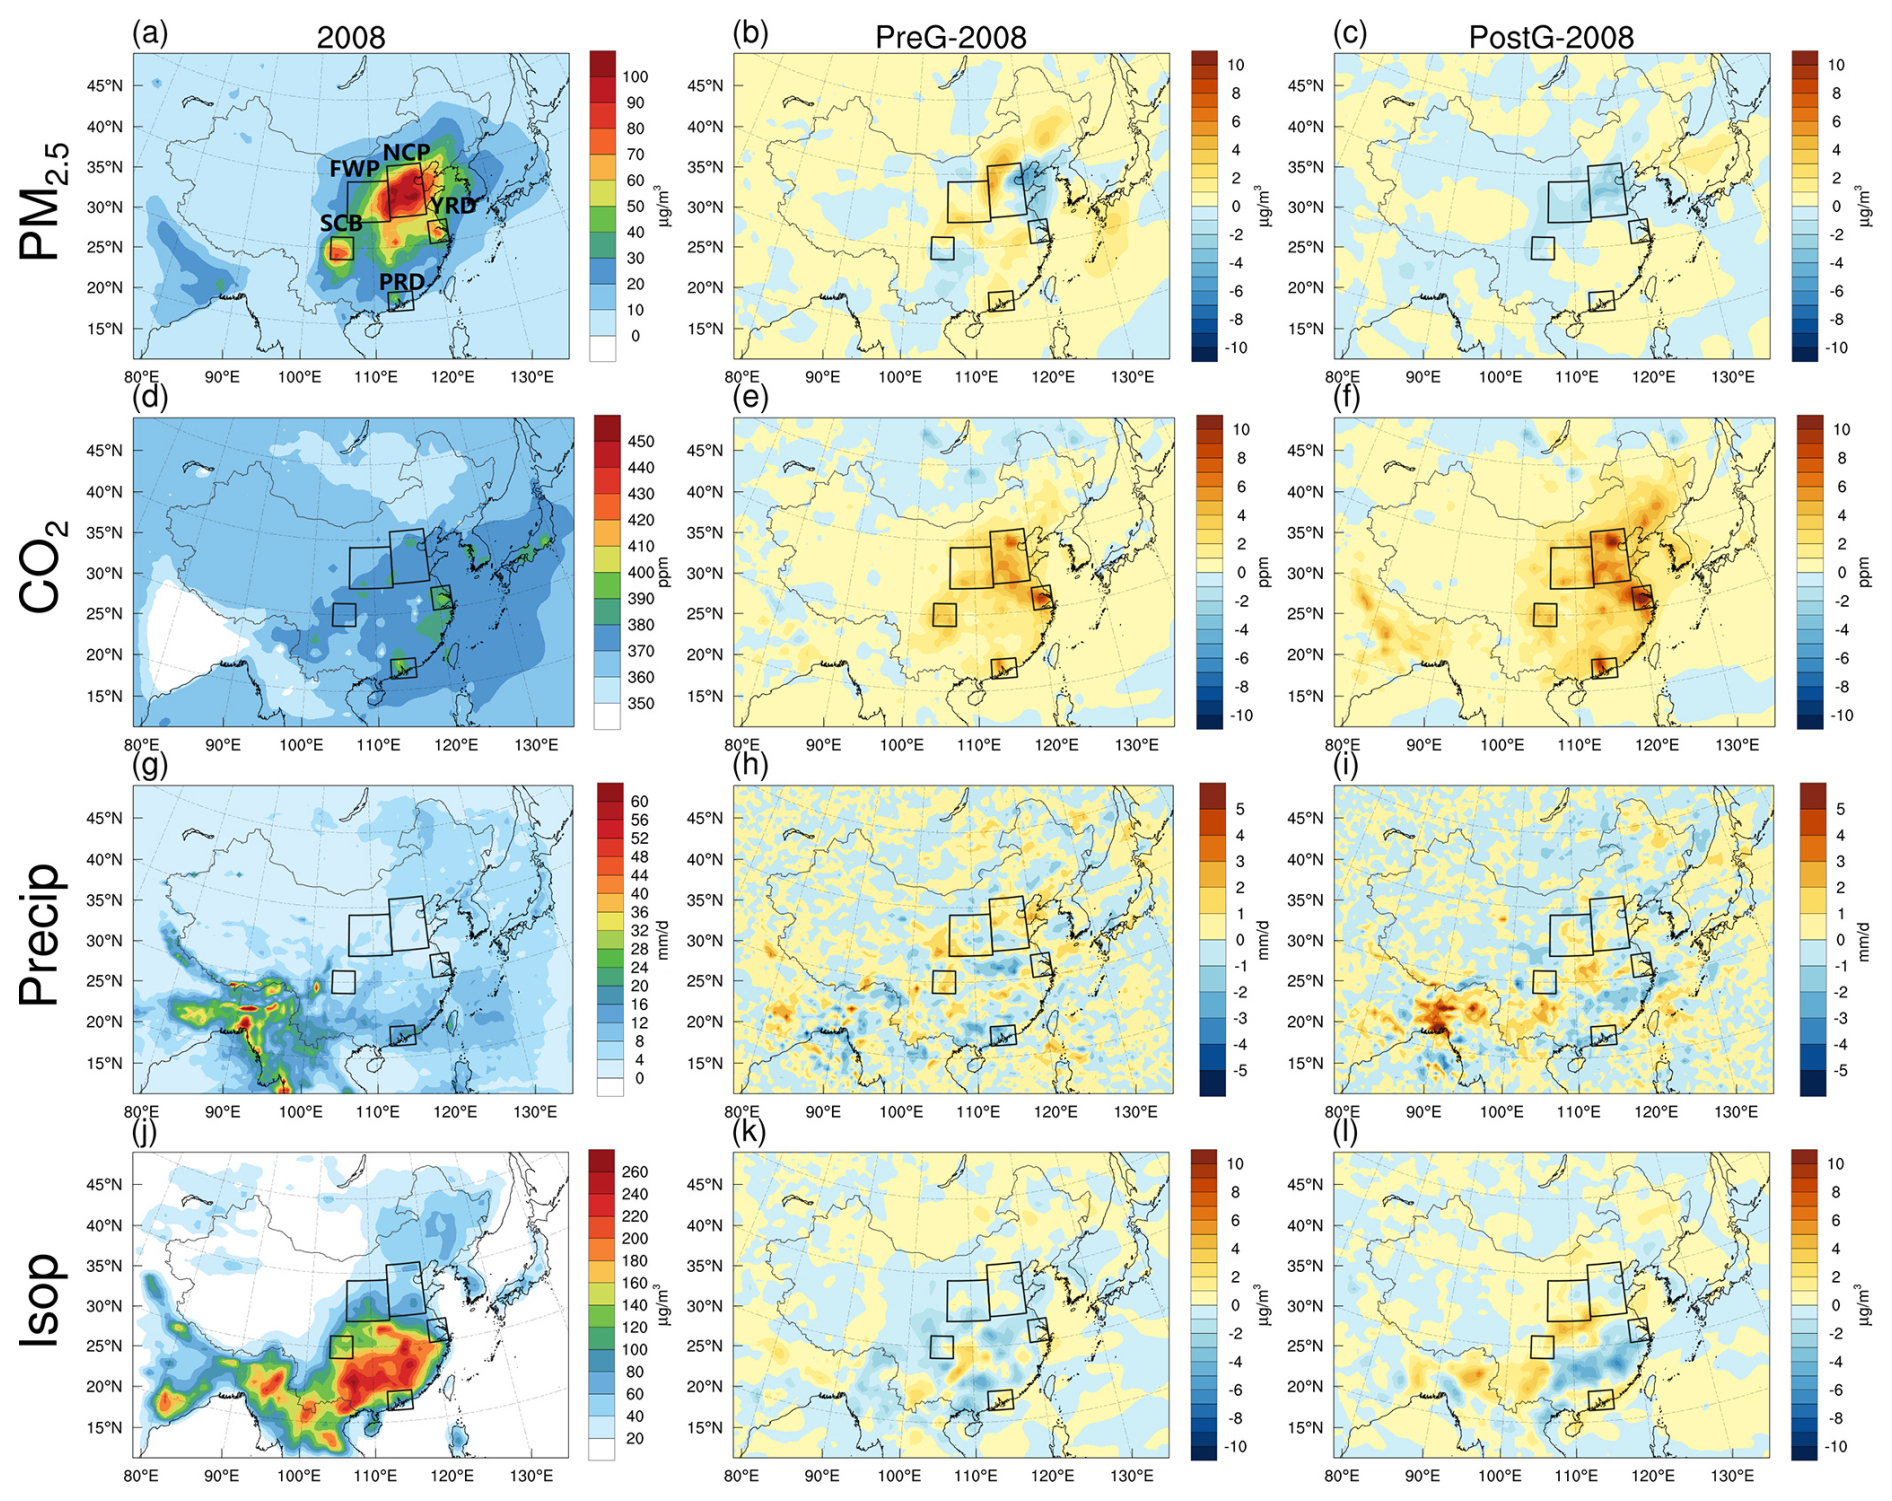
Figure 5The PM2.5 (a–c, µg m−3), CO2 (d–f, ppm), precipitation (g–i, mm d−1), and isoprene (j–l, µg m−3) during the EASM period in 2008 (left) and their mean changes due to CO2 emission variations in the PreG (2009–2013, center) and PostG (2014–2018, right) periods relative to 2008. PreG-2008 and PostG-2008 represent the average annual differences between experiments SIMBase and SIM (SIM) for the periods 2009–2013 and 2014–2018, respectively.
Table 5Impact of CO2 emission changes on PM2.5 (µg m−3), CO2 (ppm), precipitation (mm d−1), and isoprene (µg m−3) during the EASM period in the PreG (2009–2013) and PostG (2014–2018) periods relative to 2008. PreG and PostG represent the average annual differences between experiments SIMBase and SIM (SIM) for the periods 2009–2013 and 2014–2018, respectively.
3.4 Contribution of anthropogenic pollutant emissions
The contribution of changed anthropogenic pollutant emissions to PM2.5 variation was determined by removing the effects of meteorological and CO2 emission changes from the total variation. Figure 6 illustrates a significant downward trend in PM2.5 concentrations across East Asia since 2008. During the PreG period, PM2.5 levels decreased by an average of 5 to 10 µg m−3 over East Asia. Following the implementation of the Clean Air Action Plan in 2013, a marked reduction in PM2.5 concentrations was simulated. The most substantial decreases, of approximately 60 µg m−3, occurred in the NCP and SCB regions. Anthropogenic pollutant emissions emerged as the primary drivers of this decline, with their spatial distribution and magnitude of impact closely corresponding to the overall changes in PM2.5 concentrations. In contrast, the effects of changing meteorological conditions and CO2 emissions on PM2.5 levels in East Asia were relatively minor, ranging between −5 and 5 µg m−3. Meteorological conditions have reduced PM2.5 concentrations in the eastern coastal and western regions of China, while increasing them in the central region. In the PostG period, the extent of PM2.5 concentration increases has expanded. The impact of CO2 emission changes on PM2.5 levels shows different trends in the PreG and PostG periods. In the PreG period, changes in CO2 emissions primarily led to an increase in PM2.5 concentrations. However, in the PostG period, the rise in CO2 concentrations began to have a negative impact, leading to a reduction in PM2.5 concentrations.
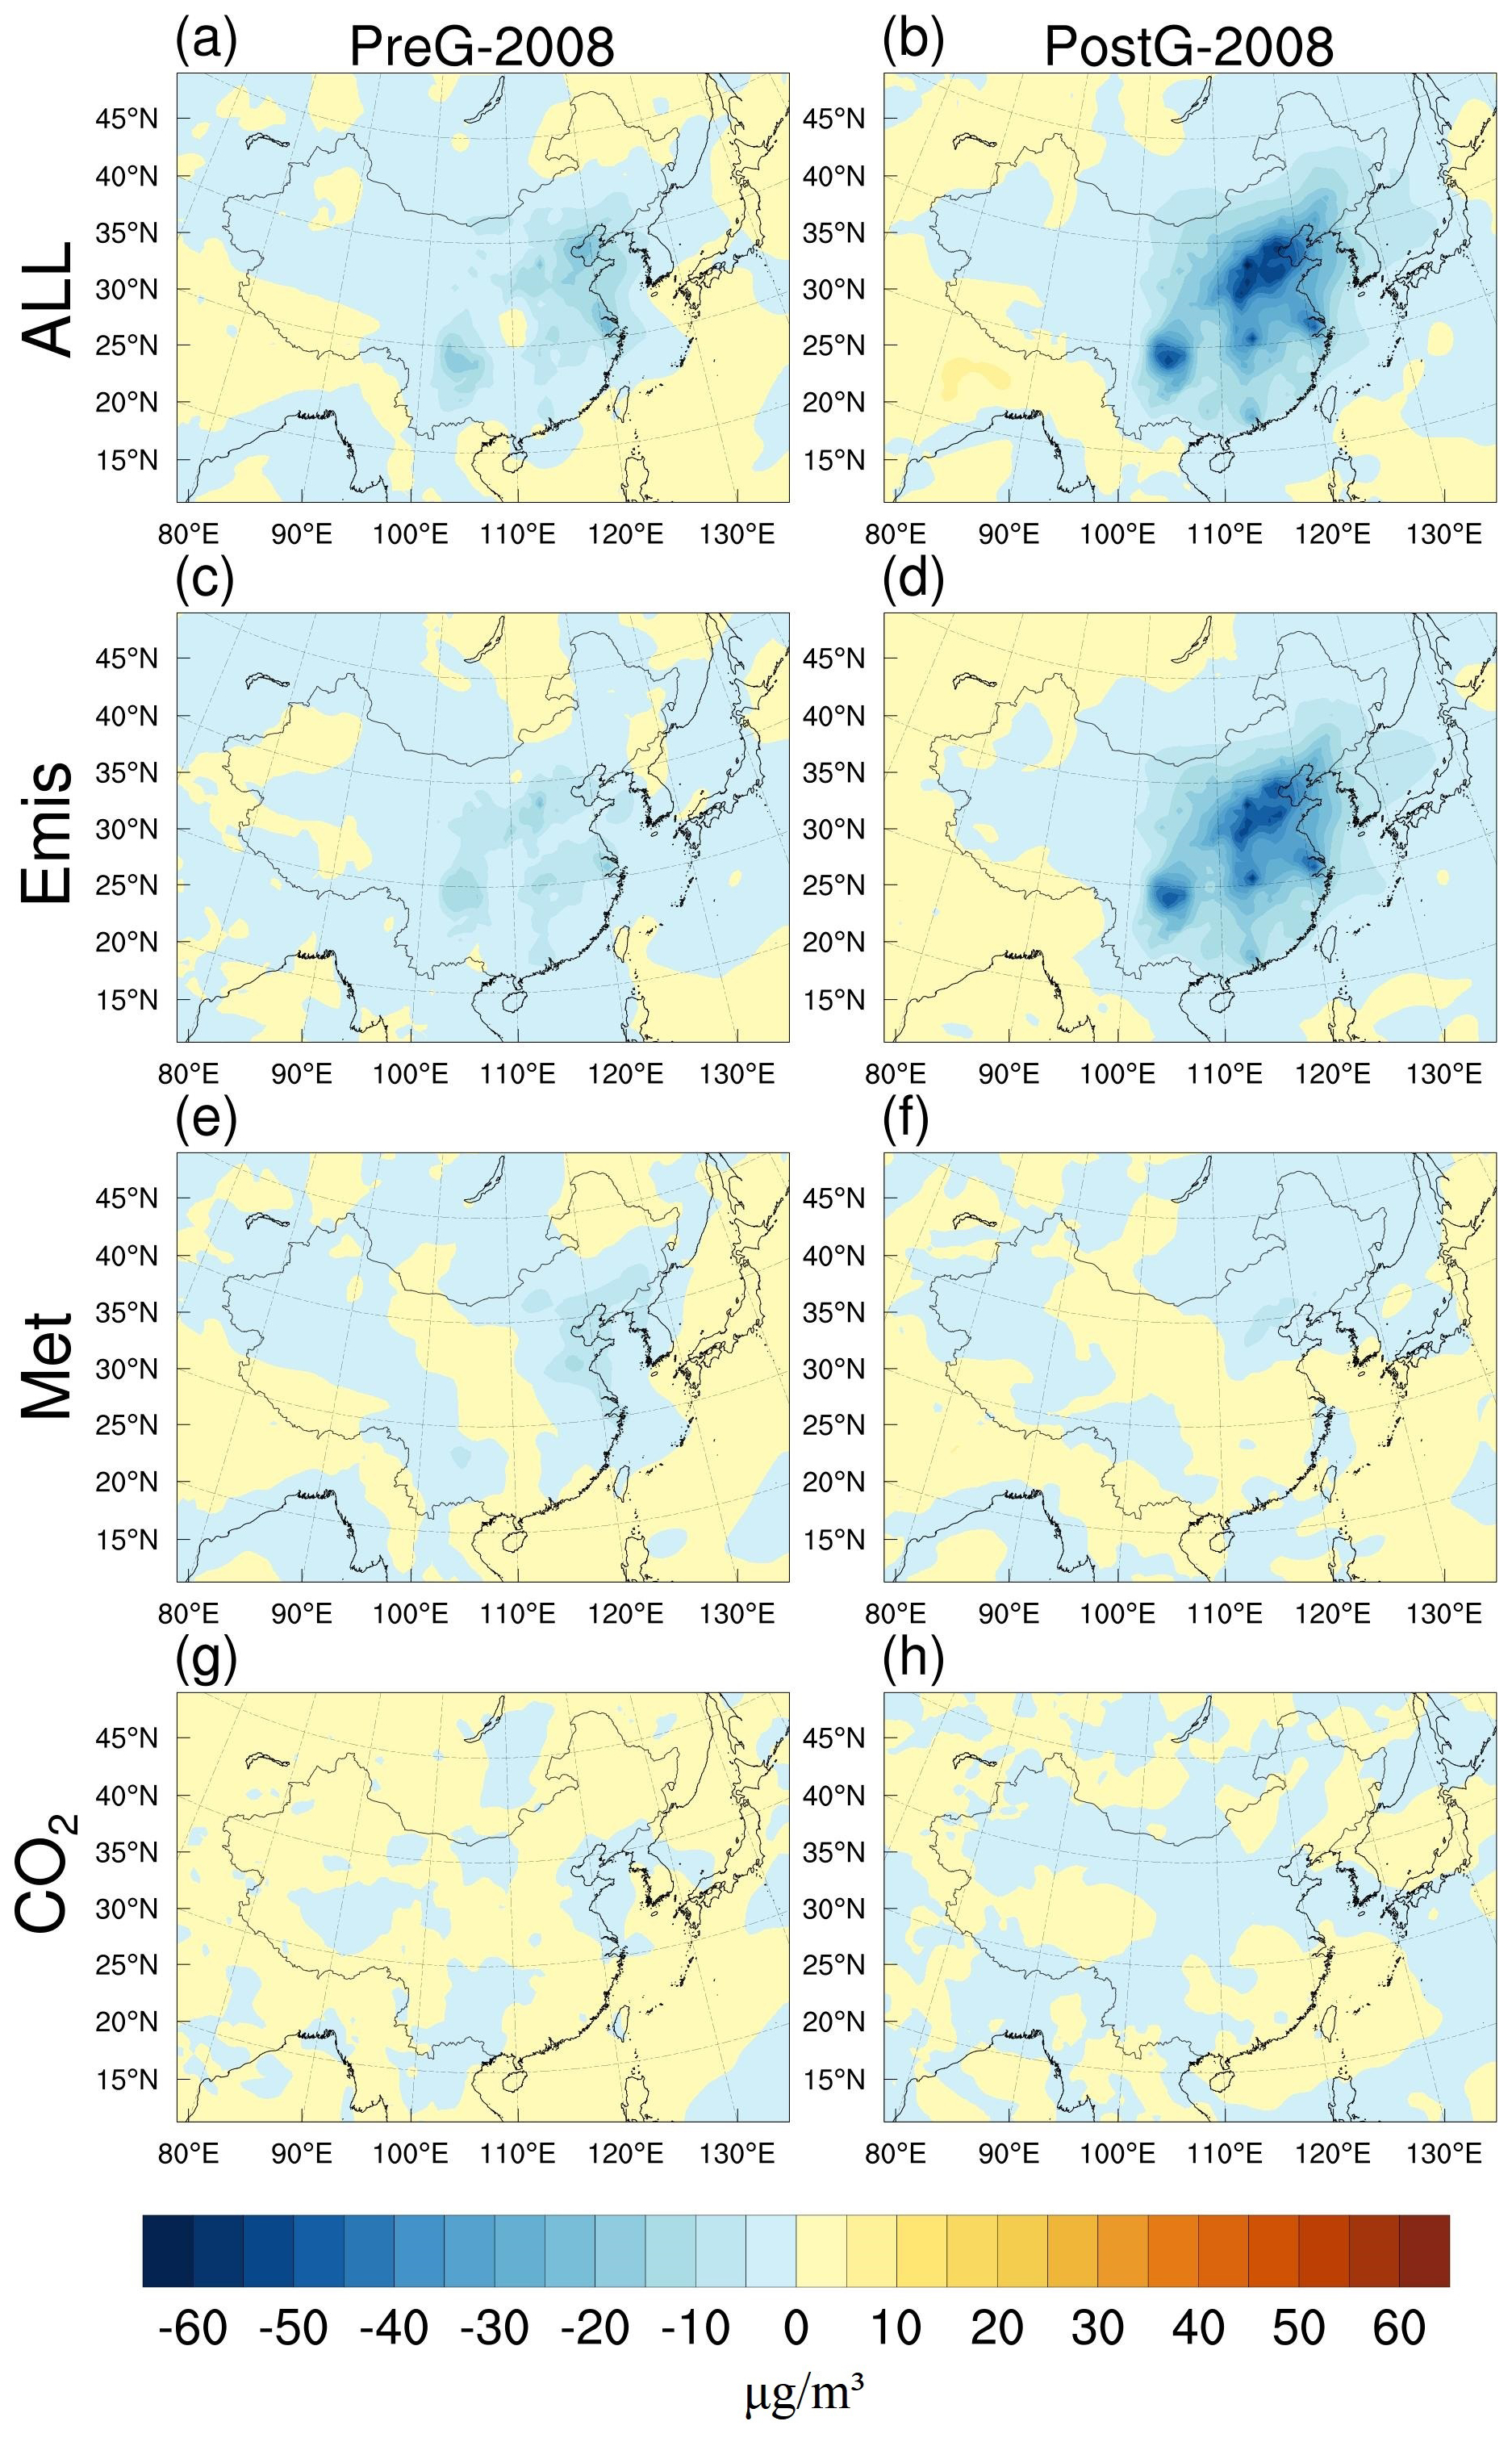
Figure 6The total changes in PM2.5 concentrations (All, SIMBase−SIM2008), and the changes in PM2.5 attributed to variations of anthropogenic pollutant emissions (Emis, All-Met-CO2), meteorological conditions (Met, SIM), and CO2 emissions (CO2, SIM) during the EASM period in the PreG (2009–2013, left) and PostG (2014–2018, right) periods relative to 2008.
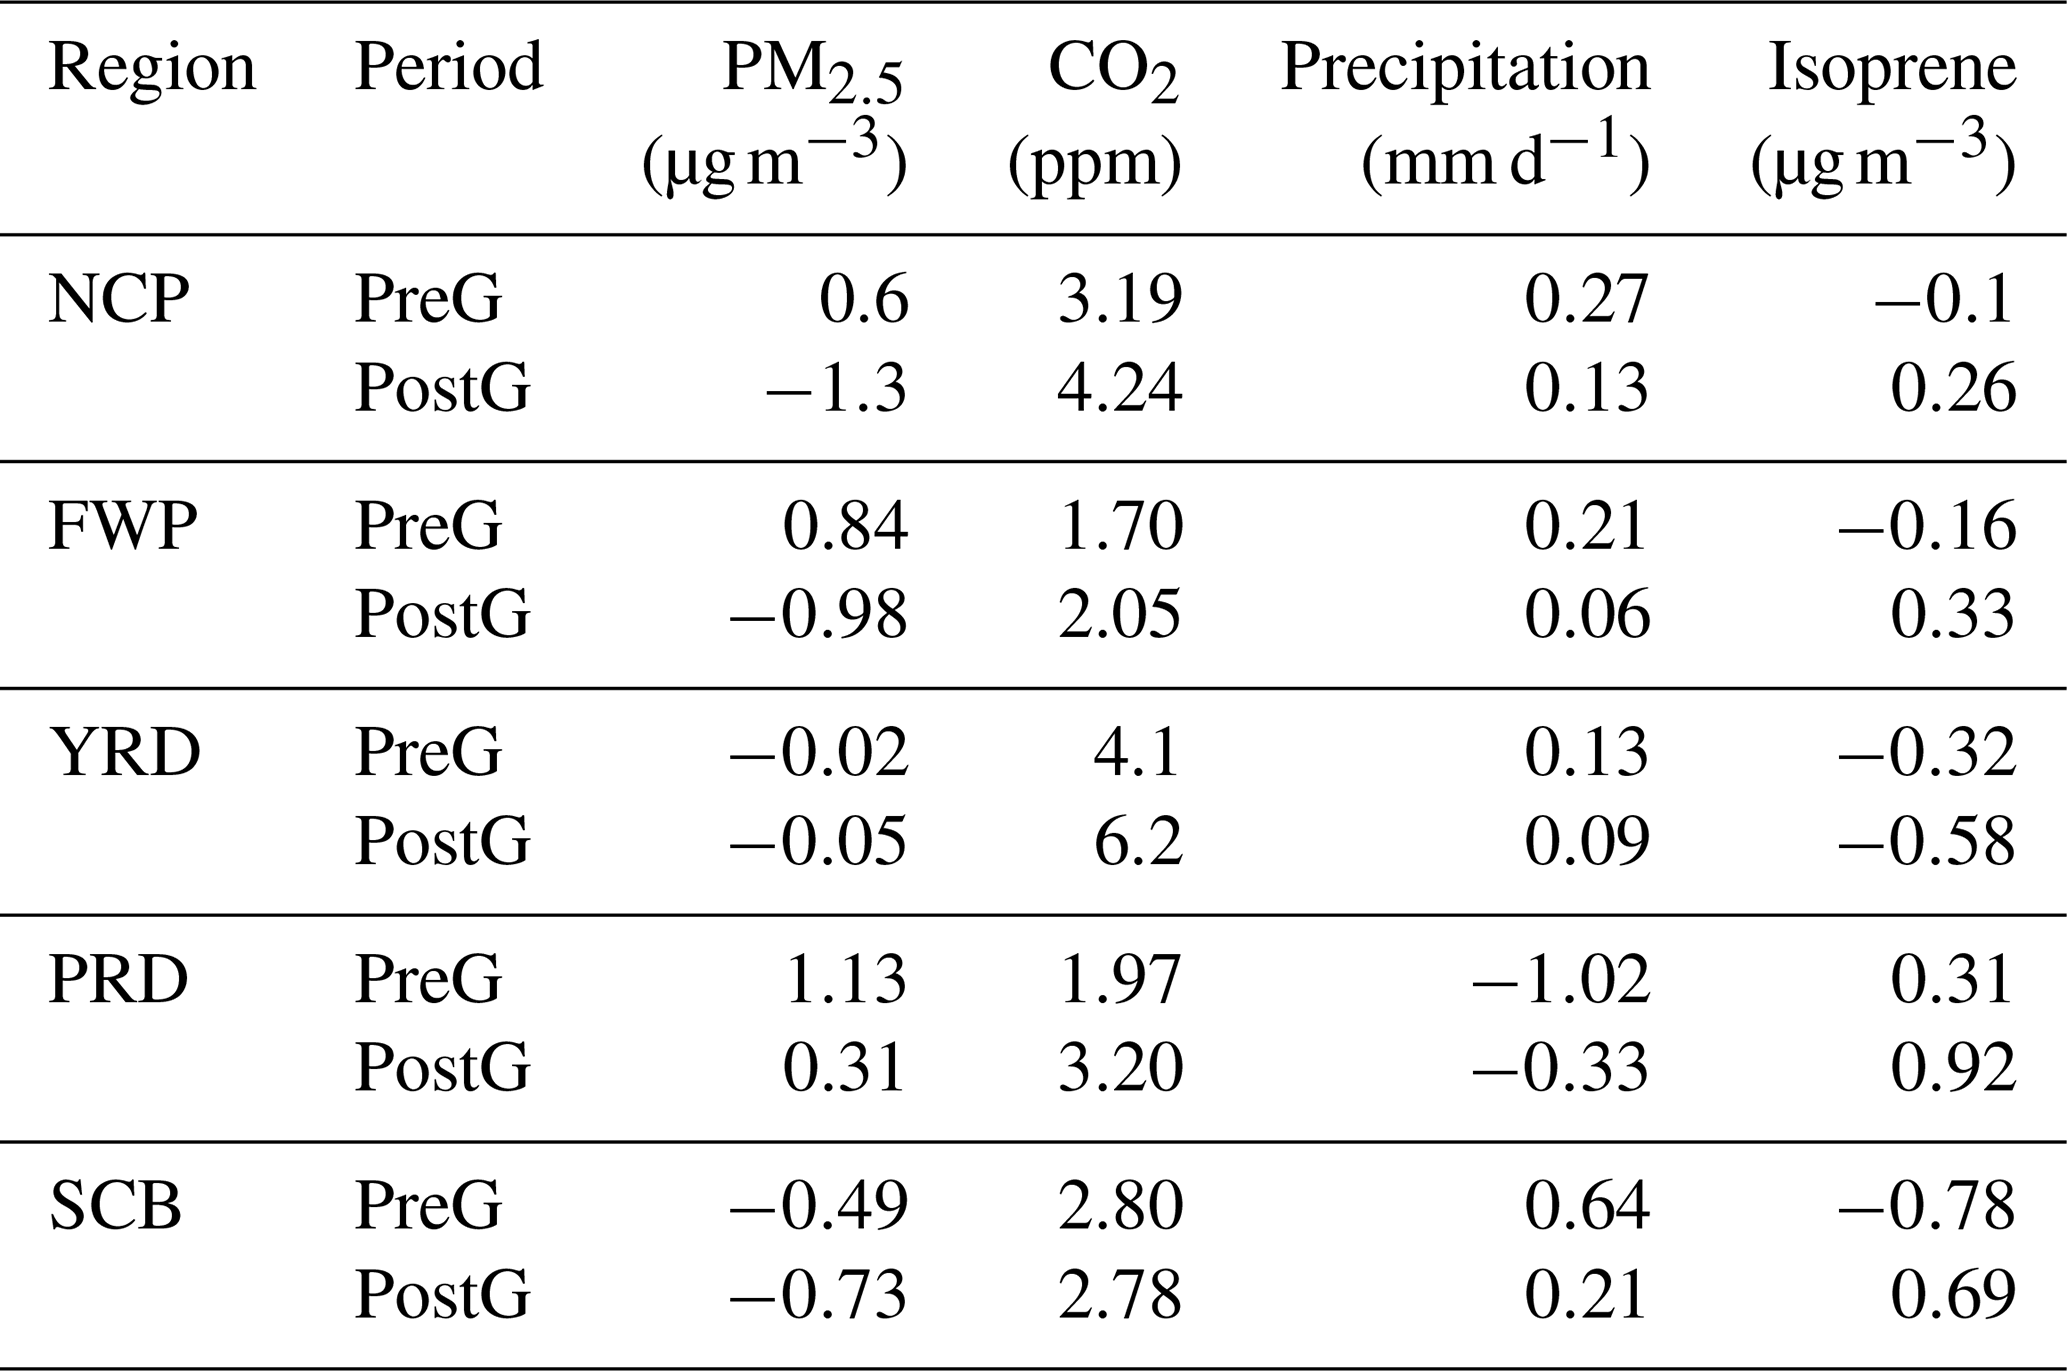
Based on Fig. 7 and Table 6, PM2.5 concentrations in the NCP region decreased by 5.28 µg m−3 during the PreG period and by 33.86 µg m−3 in the PostG period. Anthropogenic pollutant emissions were the primary driver of these changes. During the PreG period, the influence of meteorological conditions on PM2.5 was comparable to that of anthropogenic pollutant emissions, with changes in meteorology contributing −4.01 µg m−3 and emissions contributing −5.28 µg m−3. However, in the PostG period, the impact of meteorological factors diminished to −1.6 µg m−3, indicating that anthropogenic pollutant emissions became the predominant factor in the reduction of PM2.5 concentrations. In contrast, the effect of changes in CO2 emissions on PM2.5 levels was relatively minor, ranging from −1.3 to 0.6 µg m−3.
The situation in the FWP region is similar to that of the NCP region, with anthropogenic pollutant emissions as the primary driver of reduced PM2.5 concentrations. During the PreG and PostG periods, the contributions of anthropogenic pollutant emissions to PM2.5 levels were −5.75 and −22.18 µg m−3, respectively. In contrast, meteorological conditions contributed to an increase in PM2.5 concentrations, with a contribution of 2.32 µg m−3 in the PreG period, comparable to the impact of anthropogenic pollutant emissions. Meanwhile, the influence of CO2 emissions on PM2.5 levels was relatively minor.
In the YRD region, anthropogenic pollutant emissions are the primary driver of reduced PM2.5 concentrations. Due to its location in eastern China, the YRD region is more affected by the EASM, resulting in more pronounced effects of changing meteorological conditions on PM2.5 levels compared to the NCP and FWP regions. During the PreG period, the impact of meteorological conditions on PM2.5 concentrations reached as high as −6.31 µg m−3.
In the PRD region, changes in anthropogenic pollutant emissions have contributed to a reduction in PM2.5 concentrations, ranging from −8.45 to −3.82 µg m−3. However, changes in meteorological conditions and CO2 emissions have led to increases in PM2.5 levels, ranging from 0.11 to 1.49 µg m−3. Similar to the YRD region, the effects of changing meteorological conditions on PM2.5 concentrations are significant, peaking at 1.49 µg m−3 during the PreG period. Located in southeastern coastal China, the PRD's rich vegetation cover enhances the impact of CO2 emission changes on PM2.5 concentrations. During the PreG period, the influence of CO2 emission changes on PM2.5 levels reached 1.13 µg m−3, comparable to the effect of anthropogenic pollutant emissions (−3.82 µg m−3). In the PostG period, the impact of CO2 emission changes (0.31 µg m−3) surpassed that of meteorological conditions (0.11 µg m−3).
In the SCB region, the basin topography results in relatively minor effects of meteorological conditions and CO2 emission changes on PM2.5 levels, with contributions ranging from −1.14 to 0.29 µg m−3 during both the PreG and PostG periods. In contrast, anthropogenic pollutant emissions are the primary drivers of reduced PM2.5 concentrations, exerting an impact of −32.09 µg m−3 during the PostG period.
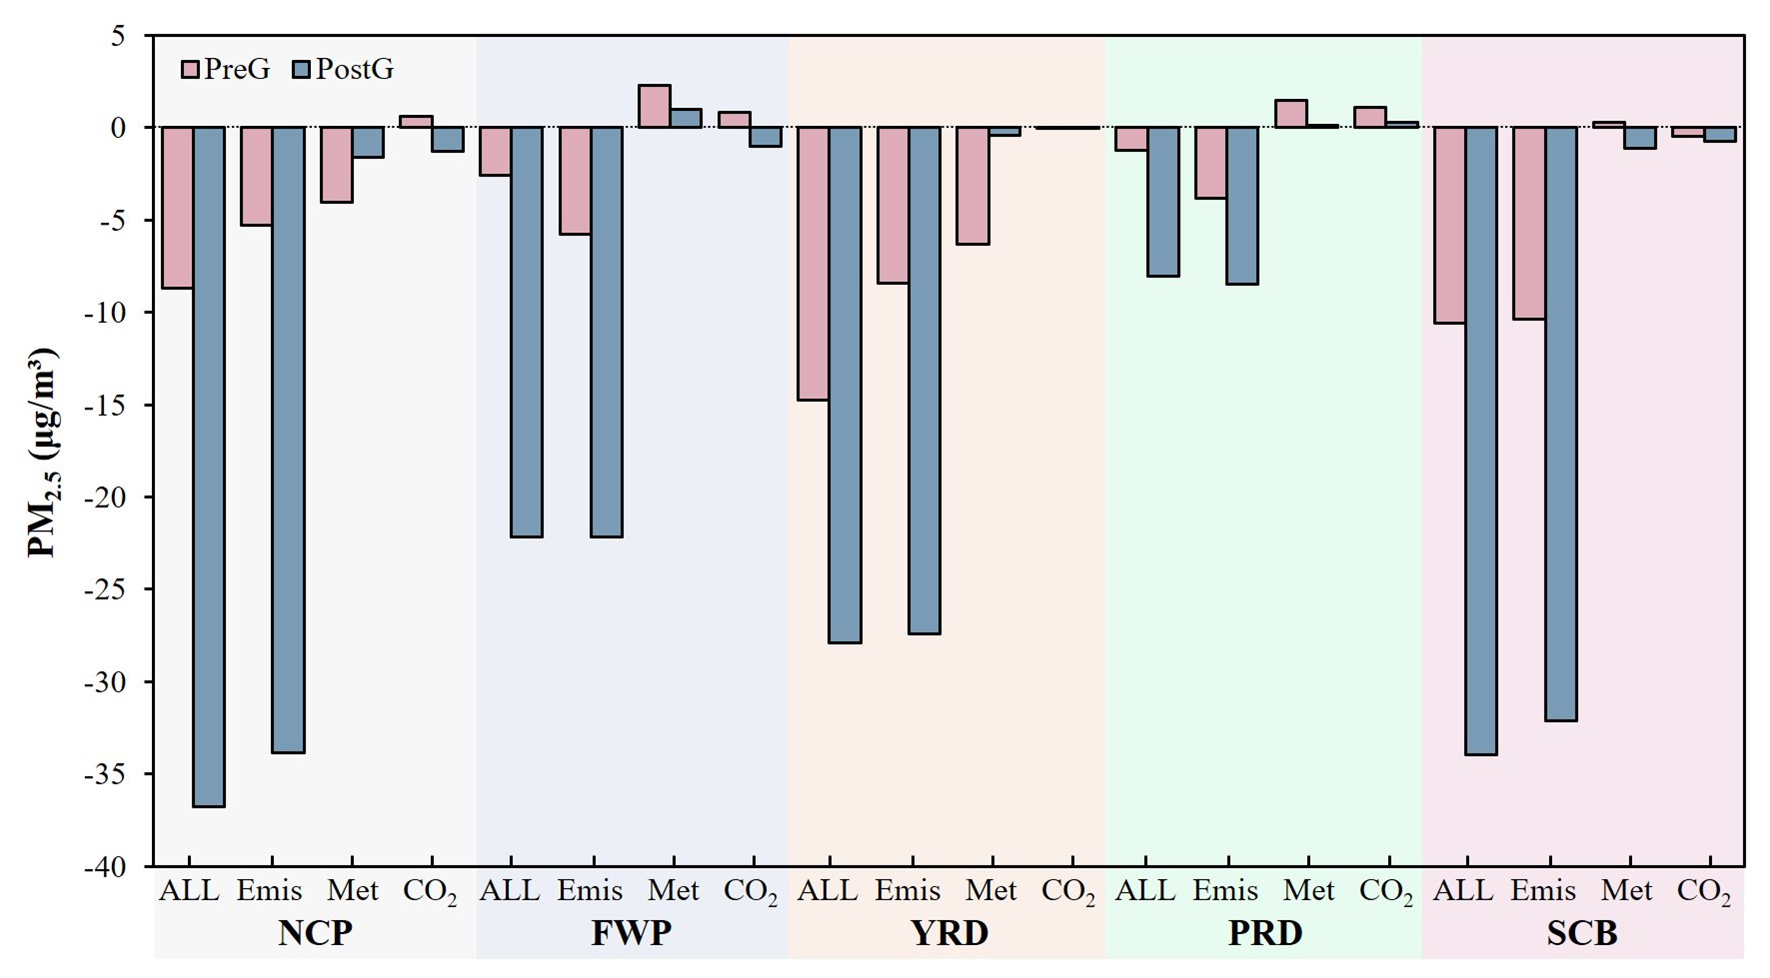
Figure 7The total changes in PM2.5 concentrations (All, SIMBase−SIM2008) for the North China Plain (NCP), Fenwei Plain (FWP), Yangtze River Delta (YRD), Pearl River Delta (PRD), and Sichuan Basin (SCB) during the EASM period in the PreG (2009–2013) and PostG (2014–2018) periods relative to 2008, along with the variations in PM2.5 due to anthropogenic pollutant emissions (Emis, All-Met-CO2), meteorological conditions (Met, SIM), and CO2 emission (CO2, SIM) changes.
Table 6Changes in total PM2.5 concentrations (ALL, SIMBase−SIM2008) and the impacts of anthropogenic pollutant emissions (Emis, All-Met-CO2), meteorological conditions (Met, SIM), and CO2 emission (CO2, SIM) variations on PM2.5 concentrations (µg m−3) during the EASM period in the PreG (2009–2013) and PostG (2014–2018) periods relative to 2008.
3.5 Attribution of changes in PM2.5
Figure 8 illustrates that PM2.5 concentrations remained relatively stable across the five regions during the PreG period. However, in the PostG period, following the implementation of the Clean Air Action Plan, significant reductions in PM2.5 concentrations were simulated in the NCP, FWP, YRD, and SCB regions, while the PRD region showed the smallest decrease.
Anthropogenic pollutant emissions are the primary factor driving PM2.5 concentration reductions across the five regions, with their impact increasing linearly over time. In the PreG period, meteorological conditions had a relatively stronger influence on PM2.5 levels, occasionally surpassing the effects of anthropogenic pollutant emissions. For example, in 2013, the meteorological and emission impacts on PM2.5 in the NCP region were −17.35 and 4.49 µg m−3, respectively. Similarly, in the FWP region from 2013 to 2015, meteorological impacts ranged from −16.9 to −15.36 µg m−3, while emissions affected PM2.5 concentrations between −15.8 and −2.27 µg m−3. The influence of meteorology also exceeded that of emissions in the YRD region during 2011–2012 and in the PRD region in 2010. Even in the SCB region, where meteorological impacts on PM2.5 were relatively minor, meteorological effects in 2010 (8.59 µg m−3) were comparable to emissions (−14.67 µg m−3).
The influence of CO2 emission changes on PM2.5 levels was generally minor, but in the densely vegetated PRD region could be comparable to the effects of emissions and meteorology. The influences of CO2 emissions, anthropogenic pollutant emissions, and meteorology on PM2.5 are −0.25 to 3.11, −6.19 to −1.47, and −0.5 to 3.11 µg m−3, respectively from 2009 to 2013.
Our attribution analysis of PM2.5 concentration changes is mainly consistent with previous studies, which have indicated that variations in anthropogenic pollutant emissions were the primary driver of PM2.5 changes in China during the period 2013–2017, with meteorological conditions contributing approximately 9 %–26 % (Zhang et al., 2019; Chen et al., 2020a; Cheng et al., 2019). In our study, relative to 2008, the average contribution of anthropogenic pollutant emissions during the PreG period was 89.08 %, while meteorological conditions contributed 16.45 %. In the PostG period, following the implementation of the Clean Air Action Plan, the influence of anthropogenic pollutant emissions further increased to 96.26 %, whereas the contribution of meteorological conditions declined to 1.60 %. This finding underscores that the impact of changes in anthropogenic pollutant emissions on PM2.5 concentrations was markedly enhanced after 2013. Notably, changes in CO2 emissions had a significant impact on PM2.5 levels, contributing −5.46 % during the PreG period and 2.14 % during the PostG period, with the latter effect surpassing that of meteorological conditions.
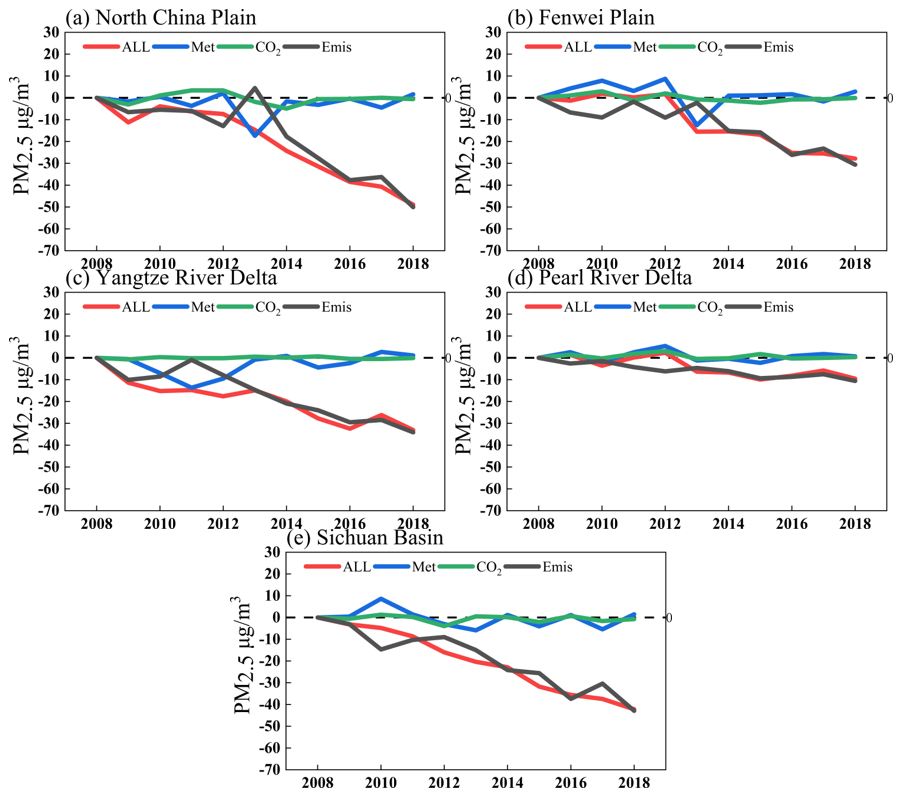
Figure 8Changes in total PM2.5 concentrations from 2008 to 2018 (ALL, red line) and the contributions of anthropogenic pollutant emissions (Emis, black line), meteorological conditions (Met, blue line), and CO2 emission changes (CO2, green line) to PM2.5 concentrations (Units: µg m−3).
3.6 Uncertainties
The uncertainties in the MEIC emission inventory primarily arise from activity data, emission factors, spatial and temporal allocation methods, and the implementation status of pollution control measures (Hong et al., 2017; Zheng et al., 2021a), all of which may affect the accuracy of simulation results. Future improvements can be achieved by employing more refined and accurate emission inventories.
In addition, the use of a 60 km low-resolution grid limits the ability to represent local topography and physical processes, thereby introducing simulation errors (Harris et al., 2016; Ringler et al., 2013). Given that this study employs a fully coupled regional climate–chemistry–ecology model with extended simulation periods (three sets of 10-year simulations) and a broad regional scope (covering the entire East Asia region), computational resource constraints necessitated the use of 60 km grids. Numerous studies have employed the RegCM-Chem-YIBs model at a 60 km grid resolution to systematically analyze PM2.5, O3, CO2, and the regional climate over East Asia (Ma et al., 2023a, b; Xu et al., 2023; Gao et al., 2021). These demonstrate its robustness and reliability in simulating East Asian atmospheric and climatic conditions. Future studies could enhance simulation accuracy by increasing computational resources and employing higher-resolution grids.
This study employed numerical experiments with the RegCM-Chem-YIBs model to analyze the interannual variability of near-surface PM2.5 concentrations in East Asia from 2008 to 2018. The analysis examines the drivers of annual PM2.5 changes in detail, focusing on three key factors: anthropogenic pollutant emissions, meteorological conditions, and CO2 concentration changes.
Compared to 2008, PM2.5 concentrations in East Asia exhibited minimal change during the PreG period, with most areas showing variations between −10 and 5 µg m−3. In contrast, following the implementation of the Clean Air Action Plan, PM2.5 concentrations decreased significantly (the PostG period). This reduction was especially notable in the NCP and the SCB regions, with declines of 36.76 and 33.96 µg m−3, respectively.
Anthropogenic pollutant emissions are the primary driver of the decline in PM2.5 concentrations in East Asia, with their impact on PM2.5 levels increasing linearly over time. During the PreG and PostG periods, the contributions of anthropogenic pollutant emissions to PM2.5 concentrations in the NCP, FWP, YRD, PRD, and SCB regions ranged from −10.39 to −3.82 and −33.86 to −8.45 µg m−3, respectively.
Changes in meteorological conditions have led to decreased PM2.5 concentrations along China's eastern coastal and western inland regions, while increasing PM2.5 levels in central areas. During the PreG period, the influence of these meteorological changes on PM2.5 concentrations was comparable to that of anthropogenic pollutant emissions, ranging from −6.31 to 2.32 µg m−3.
CO2 indirectly influences PM2.5 concentrations by affecting precipitation and isoprene emissions from vegetation. In the sparsely vegetated NCP and FWP regions, CO2 impacts near-surface PM2.5 primarily through changes in precipitation. Conversely, in the vegetation-rich PRD region, CO2 affects PM2.5 concentrations mainly by altering isoprene emissions, with an impact comparable to that of anthropogenic pollutant emissions. From 2009 to 2013, the effects of anthropogenic pollutant emissions and CO2 changes on PM2.5 ranges are −0.25 to 3.11 and −6.19 to −1.47 µg m−3, respectively.
In summary, PM2.5 concentrations in East Asia have significantly declined since 2013, primarily driven by changes in anthropogenic pollutant emissions. During several years of the PreG period, variations in meteorological conditions affected PM2.5 levels to a degree comparable to that of anthropogenic pollutant emissions. However, following the implementation of the Clean Air Action Plan in 2013, the influence of anthropogenic pollutant emissions increased significantly, while the impact of meteorological factors diminished considerably. This simulation underscores the critical importance of stringent air pollution control measures in mitigating PM2.5 concentrations. Moreover, we highlight that in regions with dense vegetation cover, changes in CO2 emissions play a noteworthy role in regulating PM2.5 levels, with the average effect during the PostG period even surpassing that of meteorological conditions. Given the sustained rise in CO2 levels in recent years, it is imperative to integrate the modulatory effects of CO2 into PM2.5 simulating models and control strategies.
ERA-Interim data are available at https://cds.climate.copernicus.eu/datasets/reanalysis-era-interim?tab=d_download (last access: 1 May 2024; https://doi.org/10.24381/cds.f2f5241d; Balsamo et al., 2015). MEIC data are available at http://meicmodel.org/?page_id=560 (last access: 20 April 2024; Zheng et al., 2018). CarbonTracker data are available at https://gml.noaa.gov/aftp/products/carbontracker/co2/CT2019/ (last access: 25 April 2024; Buchwitz et al., 2021). World Data Centre for Greenhouse Gases CO2 data are available at https://gaw.kishou.go.jp/search/gas_species/co2/latest/ (last access: 22 April 2023; Diao et al., 2017). Data from the China National Environmental Monitoring Center are available at http://openaq.org/ and https://www.cnemc.cn/en/ (Kong et al., 2021).
The supplement related to this article is available online at https://doi.org/10.5194/acp-25-12069-2025-supplement.
MX, TW, and DM: designed the research, and DM: carried it out. MX, and LF: provided technical support on the RegCM-Chem-YIBs mode. SZ and SC: improved the paper. HH: improved and edited the paper.
The contact author has declared that none of the authors has any competing interests.
Publisher's note: Copernicus Publications remains neutral with regard to jurisdictional claims made in the text, published maps, institutional affiliations, or any other geographical representation in this paper. While Copernicus Publications makes every effort to include appropriate place names, the final responsibility lies with the authors.
We hereby acknowledge the provision of anthropogenic emissions inventory support by Tsinghua University, as well as the observed datasets provided by the China National Environmental Monitoring Center. We also extend our sincere gratitude to a broad range of other institutional partners.
This work was supported by the National Nature Science Foundation of China (grant no. 42275102), the research start-up fund for the introduction of talents from Nanjing Normal University (grant no. 184080H201B57), the National Natural Science Foundation of China – Youth Science Fund Category C (grant no. 42505177), and the Special Science and Technology Innovation Program for Carbon Peak and Carbon Neutralization of Jiangsu Province (grant no. BE2022612).
This paper was edited by Stefania Gilardoni and reviewed by three anonymous referees.
Ait-Chaalal, F., Schneider, T., Meyer, B., and Marston, J. B.: Cumulant expansions for atmospheric flows, New J. Phys., 18, 025019, https://doi.org/10.1088/1367-2630/18/2/025019, 2016.
An, Z. S., Huang, R. J., Zhang, R. Y., Tie, X. X., Li, G. H., Cao, J. J., Zhou, W. J., Shi, Z. G., Han, Y. M., Gu, Z. L., and Ji, Y. M.: Severe haze in northern China: A synergy of anthropogenic emissions and atmospheric processes, P. Natl. Acad. Sci. USA, 116, 8657–8666, https://doi.org/10.1073/pnas.1900125116, 2019.
Balsamo, G., Albergel, C., Beljaars, A., Boussetta, S., Brun, E., Cloke, H., Dee, D., Dutra, E., Muñoz-Sabater, J., Pappenberger, F., de Rosnay, P., Stockdale, T., and Vitart, F.: ERA-Interim/Land: a global land surface reanalysis data set, Hydrol. Earth Syst. Sci., 19, 389–407, https://doi.org/10.5194/hess-19-389-2015, 2015.
Bleck, R. and Benjamin, S. G.: Regional Weather Prediction with a Model Combining Terrain-following and Isentropic Coordinates. Part I: Model Description, Mon. Weather Rev., 121, 1770–1785, https://doi.org/10.1175/1520-0493(1993)121<1770:Rwpwam>2.0.Co;2, 1993.
Buchwitz, M., Reuter, M., Noël, S., Bramstedt, K., Schneising, O., Hilker, M., Fuentes Andrade, B., Bovensmann, H., Burrows, J. P., Di Noia, A., Boesch, H., Wu, L., Landgraf, J., Aben, I., Retscher, C., O'Dell, C. W., and Crisp, D.: Can a regional-scale reduction of atmospheric CO2 during the COVID-19 pandemic be detected from space? A case study for East China using satellite XCO2 retrievals, Atmos. Meas. Tech., 14, 2141–2166, https://doi.org/10.5194/amt-14-2141-2021, 2021.
Cao, L., Bala, G., and Caldeira, K.: Climate response to changes in atmospheric carbon dioxide and solar irradiance on the time scale of days to weeks, Environ. Res. Lett., 7, 034015, https://doi.org/10.1088/1748-9326/7/3/034015, 2012.
Chen, G. B., Li, S. S., Knibbs, L. D., Hamm, N. A. S., Cao, W., Li, T. T., Guo, J. P., Ren, H. Y., Abramson, M. J., and Guo, Y. M.: A machine learning method to estimate PM2.5 concentrations across China with remote sensing, meteorological and land use information, Sci. Total Environ., 636, 52–60, https://doi.org/10.1016/j.scitotenv.2018.04.251, 2018.
Chen, L., Zhu, J., Liao, H., Yang, Y., and Yue, X.: Meteorological influences on PM2.5 and O3 trends and associated health burden since China's clean air actions, Sci. Total Environ., 744, 140837, https://doi.org/10.1016/j.scitotenv.2020.140837, 2020a.
Chen, Z. Y., Chen, D. L., Zhao, C. F., Kwan, M. P., Cai, J., Zhuang, Y., Zhao, B., Wang, X. Y., Chen, B., Yang, J., Li, R. Y., He, B., Gao, B. B., Wang, K. C., and Xu, B.: Influence of meteorological conditions on PM2.5 concentrations across China: A review of methodology and mechanism, Environ. Int., 139, 105558, https://doi.org/10.1016/j.envint.2020.105558, 2020b.
Cheng, J., Su, J., Cui, T., Li, X., Dong, X., Sun, F., Yang, Y., Tong, D., Zheng, Y., Li, Y., Li, J., Zhang, Q., and He, K.: Dominant role of emission reduction in PM2.5 air quality improvement in Beijing during 2013–2017: a model-based decomposition analysis, Atmos. Chem. Phys., 19, 6125–6146, https://doi.org/10.5194/acp-19-6125-2019, 2019.
Diao, A. Y., Shu, J., Song, C., and Gao, W.: Global consistency check of AIRS and IASI total CO2 column concentrations using WDCGG ground-based measurements, Frontiers of Earth Science,11,1–10, https://doi.org/10.1007/s11707-016-0573-4, 2017.
Feng, S. L., Gao, D., Liao, F., Zhou, F. R., and Wang, X. M.: The health effects of ambient PM2.5 and potential mechanisms, Ecotox. Environ. Safe., 128, 67–74, https://doi.org/10.1016/j.ecoenv.2016.01.030, 2016.
Fontes, T., Li, P. L., Barros, N., and Zhao, P. J.: Trends of PM2.5 concentrations in China: A long term approach, J. Environ. Manage., 196, 719–732, https://doi.org/10.1016/j.jenvman.2017.03.074, 2017.
Gao, L. B., Wang, T. J., Ren, X. J., Ma, D. Y., Zhuang, B. L., Li, S., Xie, M., Li, M. M., and Yang, X. Q.: Subseasonal characteristics and meteorological causes of surface O3 in different East Asian summer monsoon periods over the North China Plain during 2014–2019, Atmos. Environ., 264, 118704, https://doi.org/10.1016/j.atmosenv.2021.118704, 2021.
Geng, G. N., Liu, Y. X., Liu, Y., Liu, S. G., Cheng, J., Yan, L., Wu, N. N., Hu, H. W., Tong, D., Zheng, B., Yin, Z. C., He, K. B., and Zhang, Q.: Efficacy of China's clean air actions to tackle PM2.5 pollution between 2013 and 2020, Nat. Geosci., 17, 987–994, https://doi.org/10.1038/s41561-024-01540-z, 2024.
Harris, L. M., Lin, S. J., and Tu, C. Y.: High-Resolution Climate Simulations Using GFDL HiRAM with a Stretched Global Grid, J. Climate, 29, 4293–4314, https://doi.org/10.1175/jcli-d-15-0389.1, 2016.
Heald, C. L., Wilkinson, M. J., Monson, R. K., Alo, C. A., Wang, G. L., and Guenther, A.: Response of isoprene emission to ambient CO2 changes and implications for global budgets, Global Change Biol., 15, 1127–1140, https://doi.org/10.1111/j.1365-2486.2008.01802.x, 2009.
Hong, C., Zhang, Q., He, K., Guan, D., Li, M., Liu, F., and Zheng, B.: Variations of China's emission estimates: response to uncertainties in energy statistics, Atmos. Chem. Phys., 17, 1227–1239, https://doi.org/10.5194/acp-17-1227-2017, 2017.
Hu, B., Zhao, X. J., Liu, H., Liu, Z. R., Song, T., Wang, Y. S., Tang, L. Q., Xia, X. G., Tang, G. Q., Ji, D. S., Wen, T. X., Wang, L. L., Sun, Y., and Xin, J. Y.: Quantification of the impact of aerosol on broadband solar radiation in North China, Sci. Rep.-UK, 7, 44851, https://doi.org/10.1038/srep44851, 2017.
Huang, B. Y., Liu, C. Y., Banzon, V., Freeman, E., Graham, G., Hankins, B., Smith, T., and Zhang, H. M.: Improvements of the Daily Optimum Interpolation Sea Surface Temperature (DOISST) Version 2.1, J. Climate, 34, 2923–2939, https://doi.org/10.1175/jcli-d-20-0166.1, 2021.
Kellomaki, S. and Wang, K. Y.: Growth, respiration and nitrogen content in needles of Scots pine exposed to elevated ozone and carbon dioxide in the field, Environ. Pollut., 101, 263–274, https://doi.org/10.1016/s0269-7491(98)00036-0, 1998.
Kergoat, L., Lafont, S., Douville, H., Berthelot, B., Dedieu, G., Planton, S., and Royer, J. F.: Impact of doubled CO2 on global-scale leaf area index and evapotranspiration: Conflicting stomatal conductance and LAI responses: art. no. 4808, J. Geophys. Res.-Atmos., 107, ACL 30-1–ACL 30-16, https://doi.org/10.1029/2001jd001245, 2002.
Kim, K. H., Kabir, E., and Kabir, S.: A review on the human health impact of airborne particulate matter, Environ. Int., 74, 136–143, https://doi.org/10.1016/j.envint.2014.10.005, 2015.
Kleist, E., Mentel, T. F., Andres, S., Bohne, A., Folkers, A., Kiendler-Scharr, A., Rudich, Y., Springer, M., Tillmann, R., and Wildt, J.: Irreversible impacts of heat on the emissions of monoterpenes, sesquiterpenes, phenolic BVOC and green leaf volatiles from several tree species, Biogeosciences, 9, 5111–5123, https://doi.org/10.5194/bg-9-5111-2012, 2012.
Kong, L., Tang, X., Zhu, J., Wang, Z., Li, J., Wu, H., Wu, Q., Chen, H., Zhu, L., Wang, W., Liu, B., Wang, Q., Chen, D., Pan, Y., Song, T., Li, F., Zheng, H., Jia, G., Lu, M., Wu, L., and Carmichael, G. R.: A 6-year-long (2013–2018) high-resolution air quality reanalysis dataset in China based on the assimilation of surface observations from CNEMC, Earth Syst. Sci. Data, 13, 529–570, https://doi.org/10.5194/essd-13-529-2021, 2021.
Kramer, A. J., Rattanavaraha, W., Zhang, Z. F., Gold, A., Surratt, J. D., and Lin, Y. H.: Assessing the oxidative potential of isoprene-derived epoxides and secondary organic aerosol, Atmos. Environ., 130, 211–218, https://doi.org/10.1016/j.atmosenv.2015.10.018, 2016.
Kurokawa, J. and Ohara, T.: Long-term historical trends in air pollutant emissions in Asia: Regional Emission inventory in ASia (REAS) version 3, Atmos. Chem. Phys., 20, 12761–12793, https://doi.org/10.5194/acp-20-12761-2020, 2020.
Lei, Y., Yue, X., Liao, H., Gong, C., and Zhang, L.: Implementation of Yale Interactive terrestrial Biosphere model v1.0 into GEOS-Chem v12.0.0: a tool for biosphere–chemistry interactions, Geosci. Model Dev., 13, 1137–1153, https://doi.org/10.5194/gmd-13-1137-2020, 2020.
Li, G., Bei, N., Cao, J., Huang, R., Wu, J., Feng, T., Wang, Y., Liu, S., Zhang, Q., Tie, X., and Molina, L. T.: A possible pathway for rapid growth of sulfate during haze days in China, Atmos. Chem. Phys., 17, 3301–3316, https://doi.org/10.5194/acp-17-3301-2017, 2017a.
Li, J., Chen, X. S., Wang, Z. F., Du, H. Y., Yang, W. Y., Sun, Y. L., Hu, B., Li, J. J., Wang, W., Wang, T., Fu, P. Q., and Huang, H. L.: Radiative and heterogeneous chemical effects of aerosols on ozone and inorganic aerosols over East Asia, Sci. Total Environ., 622, 1327–1342, https://doi.org/10.1016/j.scitotenv.2017.12.041, 2018.
Li, K., Jacob, D. J., Liao, H., Zhu, J., Shah, V., Shen, L., Bates, K. H., Zhang, Q., and Zhai, S. X.: A two-pollutant strategy for improving ozone and particulate air quality in China, Nat. Geosci., 12, 906, https://doi.org/10.1038/s41561-019-0464-x, 2019.
Li, X., Feng, Y. J., Liang, H. Y., and Iop: The Impact of Meteorological Factors on PM2.5 Variations in Hong Kong, 8th International Conference on Environmental Science and Technology (ICEST), 12–14 June 2017, Technical University Of Madrid, Computer Science School, Madrid, Spain, WOS:000440342600003, https://doi.org/10.1088/1755-1315/78/1/012003, 2017b.
Li, Z. and Mölders, N.: Interaction of impacts of doubling CO2 and changing regional land-cover on evaporation, precipitation, and runoff at global and regional scales, Int. J. Climatol., 28, 1653–1679, https://doi.org/10.1002/joc.1666, 2008.
Lin, C. Q., Liu, G., Lau, A. K. H., Li, Y., Li, C. C., Fung, J. C. H., and Lao, X. Q.: High-resolution satellite remote sensing of provincial PM2.5 trends in China from 2001 to 2015, Atmos. Environ., 180, 110–116, https://doi.org/10.1016/j.atmosenv.2018.02.045, 2018.
Lin, Y.-H., Knipping, E. M., Edgerton, E. S., Shaw, S. L., and Surratt, J. D.: Investigating the influences of SO2 and NH3 levels on isoprene-derived secondary organic aerosol formation using conditional sampling approaches, Atmos. Chem. Phys., 13, 8457–8470, https://doi.org/10.5194/acp-13-8457-2013, 2013.
Lindwall, F., Schollert, M., Michelsen, A., Blok, D., and Rinnan, R.: Fourfold higher tundra volatile emissions due to arctic summer warming, J. Geophys. Res.-Biogeo., 121, 895–902, https://doi.org/10.1002/2015jg003295, 2016.
Ma, D., Wang, T., Wu, H., Qu, Y., Liu, J., Liu, J., Li, S., Zhuang, B., Li, M., and Xie, M.: The effect of anthropogenic emission, meteorological factors, and carbon dioxide on the surface ozone increase in China from 2008 to 2018 during the East Asia summer monsoon season, Atmos. Chem. Phys., 23, 6525–6544, https://doi.org/10.5194/acp-23-6525-2023, 2023a.
Ma, D. Y., Wang, T. J., Xu, B. Y., Song, R., Gao, L. B., Chen, H. M., Ren, X. J., Li, S., Zhuang, B. L., Li, M. M., Xie, M., and Saikawa, E.: The mutual interactions among ozone, fine particulate matter, and carbon dioxide on summer monsoon climate in East Asia, Atmos. Environ., 299, 119668, https://doi.org/10.1016/j.atmosenv.2023.119668, 2023b.
Ma, Z., Liu, R., Liu, Y., and Bi, J.: Effects of air pollution control policies on PM2.5 pollution improvement in China from 2005 to 2017: a satellite-based perspective, Atmos. Chem. Phys., 19, 6861–6877, https://doi.org/10.5194/acp-19-6861-2019, 2019.
Ma, Z. W., Hu, X. F., Sayer, A. M., Levy, R., Zhang, Q., Xue, Y. G., Tong, S. L., Bi, J., Huang, L., and Liu, Y.: Satellite-Based Spatiotemporal Trends in PM2.5 Concentrations: China, 2004–2013, Environ. Health Persp., 124, 184–192, https://doi.org/10.1289/ehp.1409481, 2016.
Matthews, H. D.: Implications of CO2 fertilization for future climate change in a coupled climate-carbon model, Global Change Biol., 13, 1068–1078, https://doi.org/10.1111/j.1365-2486.2007.01343.x, 2007.
Mousavinezhad, S., Choi, Y., Pouyaei, A., Ghahremanloo, M., and Nelson, D. L.: A comprehensive investigation of surface ozone pollution in China, 2015–2019: Separating the contributions from meteorology and precursor emissions, Atmos. Res., 257, 105599, https://doi.org/10.1016/j.atmosres.2021.105599, 2021.
Pan, L., Xu, J. M., Tie, X. X., Mao, X. Q., Gao, W., and Chang, L. Y.: Long-term measurements of planetary boundary layer height and interactions with PM2.5 in Shanghai, China, Atmos. Pollut. Res., 10, 989–996, https://doi.org/10.1016/j.apr.2019.01.007, 2019.
Pegoraro, E., Rey, A., Bobich, E. G., Barron-Gafford, G., Grieve, K. A., Malhi, Y., and Murthy, R.: Effect of elevated CO2 concentration and vapour pressure deficit on isoprene emission from leaves of Populus deltoides during drought, Funct. Plant Biol., 31, 1137–1147, https://doi.org/10.1071/fp04142, 2004.
Peters, W., Jacobson, A. R., Sweeney, C., Andrews, A. E., Conway, T. J., Masarie, K., Miller, J. B., Bruhwiler, L. M. P., Petron, G., Hirsch, A. I., Worthy, D. E. J., van der Werf, G. R., Randerson, J. T., Wennberg, P. O., Krol, M. C., and Tans, P. P.: An atmospheric perspective on North American carbon dioxide exchange: CarbonTracker, P. Natl. Acad. Sci. USA, 104, 18925–18930, https://doi.org/10.1073/pnas.0708986104, 2007.
Possell, M., Hewitt, C. N., and Beerling, D. J.: The effects of glacial atmospheric CO2 concentrations and climate on isoprene emissions by vascular plants, Global Change Biol., 11, 60–69, https://doi.org/10.1111/j.1365-2486.2004.00889.x, 2005.
Pui, D. Y. H., Chen, S. C., and Zuo, Z. L.: PM2.5 in China: Measurements, sources, visibility and health effects, and mitigation, Particuology, 13, 1–26, https://doi.org/10.1016/j.partic.2013.11.001, 2014.
Ringler, T., Petersen, M., Higdon, R. L., Jacobsen, D., Jones, P. W., and Maltrud, M.: A multi-resolution approach to global ocean modeling, Ocean Model., 69, 211–232, https://doi.org/10.1016/j.ocemod.2013.04.010, 2013.
Shalaby, A., Zakey, A. S., Tawfik, A. B., Solmon, F., Giorgi, F., Stordal, F., Sillman, S., Zaveri, R. A., and Steiner, A. L.: Implementation and evaluation of online gas-phase chemistry within a regional climate model (RegCM-CHEM4), Geosci. Model Dev., 5, 741–760, https://doi.org/10.5194/gmd-5-741-2012, 2012.
Silver, B., Reddington, C. L., Arnold, S. R., and Spracklen, D. V.: Substantial changes in air pollution across China during 2015–2017, Environ. Res. Lett., 13, 114012, https://doi.org/10.1088/1748-9326/aae718, 2018.
Silver, B., Reddington, C. L., Chen, Y., and Arnold, S. R.: A decade of China's air quality monitoring data suggests health impacts are no longer declining, Environ. Int., 197, 109318, https://doi.org/10.1016/j.envint.2025.109318, 2025.
Sun, Z. H., Niinemets, Ü., Hüve, K., Noe, S. M., Rasulov, B., Copolovici, L., and Vislap, V.: Enhanced isoprene emission capacity and altered light responsiveness in aspen grown under elevated atmospheric CO2 concentration, Global Change Biol., 18, 3423–3440, https://doi.org/10.1111/j.1365-2486.2012.02789.x, 2012.
Sun, Z. H., Hve, K., Vislap, V., and Niinemets, U.: Elevated CO2 magnifies isoprene emissions under heat and improves thermal resistance in hybrid aspen, J. Exp. Bot., 64, 5509–5523, https://doi.org/10.1093/jxb/ert318, 2013.
van Donkelaar, A., Martin, R. V., Brauer, M., Kahn, R., Levy, R., Verduzco, C., and Villeneuve, P. J.: Global Estimates of Ambient Fine Particulate Matter Concentrations from Satellite-Based Aerosol Optical Depth: Development and Application, Environ. Health Persp., 118, 847–855, https://doi.org/10.1289/ehp.0901623, 2010.
van Donkelaar, A., Martin, R. V., Li, C., and Burnett, R. T.: Regional Estimates of Chemical Composition of Fine Particulate Matter Using a Combined Geoscience-Statistical Method with Information from Satellites, Models, and Monitors, Environ. Sci. Technol., 53, 2595–2611, https://doi.org/10.1021/acs.est.8b06392, 2019.
Vu, T. V., Shi, Z., Cheng, J., Zhang, Q., He, K., Wang, S., and Harrison, R. M.: Assessing the impact of clean air action on air quality trends in Beijing using a machine learning technique, Atmos. Chem. Phys., 19, 11303–11314, https://doi.org/10.5194/acp-19-11303-2019, 2019.
Wang, H., Peng, Y., Zhang, X., Liu, H., Zhang, M., Che, H., Cheng, Y., and Zheng, Y.: Contributions to the explosive growth of PM2.5 mass due to aerosol–radiation feedback and decrease in turbulent diffusion during a red alert heavy haze in Beijing–Tianjin–Hebei, China, Atmos. Chem. Phys., 18, 17717–17733, https://doi.org/10.5194/acp-18-17717-2018, 2018a.
Wang, H., Tian, M., Chen, Y., Shi, G., Liu, Y., Yang, F., Zhang, L., Deng, L., Yu, J., Peng, C., and Cao, X.: Seasonal characteristics, formation mechanisms and source origins of PM2.5 in two megacities in Sichuan Basin, China, Atmos. Chem. Phys., 18, 865–881, https://doi.org/10.5194/acp-18-865-2018, 2018b.
Wang, J. D., Zhao, B., Wang, S. X., Yang, F. M., Xing, J., Morawska, L., Ding, A. J., Kulmala, M., Kerminen, V. M., Kujansuu, J., Wang, Z. F., Ding, D. A., Zhang, X. Y., Wang, H. B., Tian, M., Petaja, T., Jiang, J. K., and Hao, J. M.: Particulate matter pollution over China and the effects of control policies, Sci. Total Environ., 584, 426–447, https://doi.org/10.1016/j.scitotenv.2017.01.027, 2017.
Wei, J., Li, Z. Q., Lyapustin, A., Sun, L., Peng, Y. R., Xue, W. H., Su, T. N., and Cribb, M.: Reconstructing 1-km-resolution high-quality PM2.5 data records from 2000 to 2018 in China: spatiotemporal variations and policy implications, Remote Sens. Environ., 252, 112136, 10.1016/j.rse.2020.112136, 2021.
Wilkinson, M. J., Monson, R. K., Trahan, N., Lee, S., Brown, E., Jackson, R. B., Polley, H. W., Fay, P. A., and Fall, R.: Leaf isoprene emission rate as a function of atmospheric CO2 concentration, Global Change Biol., 15, 1189–1200, https://doi.org/10.1111/j.1365-2486.2008.01803.x, 2009.
Wu, H., Wang, T. J., Wang, Q., Cao, Y., Qu, Y. W., and Nie, D. Y.: Radiative effects and chemical compositions of fine particles modulating urban heat island in Nanjing, China, Atmos. Environ., 247, 118201, https://doi.org/10.1016/j.atmosenv.2021.118201, 2021.
Wu, K., Yang, X. Y., Chen, D., Gu, S., Lu, Y. Q., Jiang, Q., Wang, K., Ou, Y. H., Qian, Y., Shao, P., and Lu, S. H.: Estimation of biogenic VOC emissions and their corresponding impact on ozone and secondary organic aerosol formation in China, Atmos. Res., 231, 104656, https://doi.org/10.1016/j.atmosres.2019.104656, 2020.
Wu, Y. N., Liu, J. K., Zhai, J. X., Cong, L., Wang, Y., Ma, W. M., Zhang, Z. M., and Li, C. Y.: Comparison of dry and wet deposition of particulate matter in near-surface waters during summer, Plos One, 13, e0199241, https://doi.org/10.1371/journal.pone.0199241, 2018.
Xiao, Q., Zheng, Y., Geng, G., Chen, C., Huang, X., Che, H., Zhang, X., He, K., and Zhang, Q.: Separating emission and meteorological contributions to long-term PM2.5 trends over eastern China during 2000–2018, Atmos. Chem. Phys., 21, 9475–9496, https://doi.org/10.5194/acp-21-9475-2021, 2021.
Xie, N., Wang, T., Xie, X., Yue, X., Giorgi, F., Zhang, Q., Ma, D., Song, R., Xu, B., Li, S., Zhuang, B., Li, M., Xie, M., Andreeva Kilifarska, N., Gadzhev, G., and Dimitrova, R.: The regional climate–chemistry–ecology coupling model RegCM-Chem (v4.6)–YIBs (v1.0): development and application, Geosci. Model Dev., 17, 3259–3277, https://doi.org/10.5194/gmd-17-3259-2024, 2024.
Xie, X., Wang, T., Yue, X., Li, S., Zhuang, B., Wang, M., and Yang, X.: Numerical modeling of ozone damage to plants and its effects on atmospheric CO2 in China, Atmos. Environ., 217, 116970, https://doi.org/10.1016/j.atmosenv.2019.116970, 2019.
Xing, Y. F., Xu, Y. H., Shi, M. H., and Lian, Y. X.: The impact of PM2.5 on the human respiratory system, J. Thorac. Dis., 8, E69–E74, https://doi.org/10.3978/j.issn.2072-1439.2016.01.19, 2016.
Xu, B. Y., Wang, T. J., Ma, D. Y., Song, R., Zhang, M., Gao, L. B., Li, S., Zhuang, B. L., Li, M. M., and Xie, M.: Impacts of regional emission reduction and global climate change on air quality and temperature to attain carbon neutrality in China, Atmos. Res., 279, 106384, https://doi.org/10.1016/j.atmosres.2022.106384, 2022.
Xu, B. Y., Wang, T. J., Gao, L. B., Ma, D. Y., Song, R., Zhao, J., Yang, X. G., Li, S., Zhuang, B. L., Li, M. M., and Xie, M.: Impacts of meteorological factors and ozone variation on crop yields in China concerning carbon neutrality objectives in 2060, Environ. Pollut., 317, 120715, https://doi.org/10.1016/j.envpol.2022.120715, 2023.
Xue, W. H., Zhang, J., Zhong, C., Ji, D. Y., and Huang, W.: Satellite-derived spatiotemporal PM2.5 concentrations and variations from 2006 to 2017 in China, Sci. Total Environ., 712, 134577, https://doi.org/10.1016/j.scitotenv.2019.134577, 2020.
Yue, X. and Unger, N.: The Yale Interactive terrestrial Biosphere model version 1.0: description, evaluation and implementation into NASA GISS ModelE2, Geosci. Model Dev., 8, 2399–2417, https://doi.org/10.5194/gmd-8-2399-2015, 2015.
Yue, X., Unger, N., and Zheng, Y.: Distinguishing the drivers of trends in land carbon fluxes and plant volatile emissions over the past 3 decades, Atmos. Chem. Phys., 15, 11931–11948, https://doi.org/10.5194/acp-15-11931-2015, 2015.
Zhai, S., Jacob, D. J., Wang, X., Shen, L., Li, K., Zhang, Y., Gui, K., Zhao, T., and Liao, H.: Fine particulate matter (PM2.5) trends in China, 2013–2018: separating contributions from anthropogenic emissions and meteorology, Atmos. Chem. Phys., 19, 11031–11041, https://doi.org/10.5194/acp-19-11031-2019, 2019.
Zhang, B. E., Jiao, L. M., Xu, G., Zhao, S. L., Tang, X., Zhou, Y., and Gong, C.: Influences of wind and precipitation on different-sized particulate matter concentrations (PM2.5, PM10, PM2.5−10), Meteorol. Atmos. Phys., 130, 383–392, https://doi.org/10.1007/s00703-017-0526-9, 2018.
Zhang, Q., Zheng, Y. X., Tong, D., Shao, M., Wang, S. X., Zhang, Y. H., Xu, X. D., Wang, J. N., He, H., Liu, W. Q., Ding, Y. H., Lei, Y., Li, J. H., Wang, Z. F., Zhang, X. Y., Wang, Y. S., Cheng, J., Liu, Y., Shi, Q. R., Yan, L., Geng, G. N., Hong, C. P., Li, M., Liu, F., Zheng, B., Cao, J. J., Ding, A. J., Gao, J., Fu, Q. Y., Huo, J. T., Liu, B. X., Liu, Z. R., Yang, F. M., He, K. B., and Hao, J. M.: Drivers of improved PM2.5 air quality in China from 2013 to 2017, P. Natl. Acad. Sci. USA, 116, 24463–24469, https://doi.org/10.1073/pnas.1907956116, 2019.
Zhang, Y., Olsen, K. M., and Wang, K.: Fine Scale Modeling of Agricultural Air Quality over the Southeastern United States Using Two Air Quality Models. Part I. Application and Evaluation, Aerosol Air Qual. Res., 13, 1231–1252, https://doi.org/10.4209/aaqr.2012.12.0346, 2013.
Zhang, Y., Gentine, P., Luo, X. Z., Lian, X., Liu, Y. L., Zhou, S., Michalak, A. M., Sun, W., Fisher, J. B., Piao, S. L., and Keenan, T. F.: Increasing sensitivity of dryland vegetation greenness to precipitation due to rising atmospheric CO2, Nat. Commun., 13, 4875, https://doi.org/10.1038/s41467-022-32631-3, 2022.
Zheng, B., Tong, D., Li, M., Liu, F., Hong, C., Geng, G., Li, H., Li, X., Peng, L., Qi, J., Yan, L., Zhang, Y., Zhao, H., Zheng, Y., He, K., and Zhang, Q.: Trends in China's anthropogenic emissions since 2010 as the consequence of clean air actions, Atmos. Chem. Phys., 18, 14095–14111, https://doi.org/10.5194/acp-18-14095-2018, 2018.
Zheng, B., Cheng, J., Geng, G. N., Wang, X., Li, M., Shi, Q. R., Qi, J., Lei, Y., Zhang, Q., and He, K. B.: Mapping anthropogenic emissions in China at 1 km spatial resolution and its application in air quality modeling, Sci. Bull., 66, 612–620, https://doi.org/10.1016/j.scib.2020.12.008, 2021a.
Zheng, B., Zhang, Q., Geng, G., Chen, C., Shi, Q., Cui, M., Lei, Y., and He, K.: Changes in China's anthropogenic emissions and air quality during the COVID-19 pandemic in 2020, Earth Syst. Sci. Data, 13, 2895–2907, https://doi.org/10.5194/essd-13-2895-2021, 2021b.
Zhong, J., Zhang, X., Dong, Y., Wang, Y., Liu, C., Wang, J., Zhang, Y., and Che, H.: Feedback effects of boundary-layer meteorological factors on cumulative explosive growth of PM2.5 during winter heavy pollution episodes in Beijing from 2013 to 2016, Atmos. Chem. Phys., 18, 247–258, https://doi.org/10.5194/acp-18-247-2018, 2018.