the Creative Commons Attribution 4.0 License.
the Creative Commons Attribution 4.0 License.
 | 02 Oct 2025
Evolution of aerosol optical depth over China in 2010–2024: increasing importance of meteorological influences
Cheng Fan
Jiantao Dong
Hanqing Kang
Chengwei Fang
Zhengqiang Li
Ying Zhang
Time series of Collection 6.1 of the MODerate resolution Imaging Spectroradiometer Multi-Angle Implementation of Atmospheric Correction (MODIS/MAIAC C6.1) aerosol optical depth (AOD) and model-simulated AOD were used to determine the contributions of meteorological and anthropogenic effects to spatiotemporal AOD variations over five representative areas in China during the period from January 2010 to September 2024. The time series confirm the effective reduction in AOD between 2010 and 2018, with an additional but smaller reduction thereafter. The overall AOD reduction is mainly attributable to emission reduction policies, although with substantial meteorological effects. The respective total reduction and meteorological contributions during the whole study period and the meteorological contributions before and after 2018 over the five regions were as follows (all in %): 68, 12, 16, and 52 for the North China Plain (NCP); 62, 17, 28, and 14 for the Yangtze River Delta (YRD); 70, 33, 31, and 43 for the Pearl River Delta (PRD); 55, 16, 25, and 21 for Hunan and Hubei (HNB); and 57, 10, 14, and 38 for the Sichuan Basin (SCB). Meteorological effects for each of these periods and each region are discussed in detail. As an example, the above data show that the meteorological effects over the YRD and HNB after 2018 are smaller than before 2018; this can be explained by the occurrence of strong effects in the earlier period and the choice of the period over which effects were calculated. Monthly mean AOD patterns were distinctly different before and after 2016, suggesting that aerosol properties changed in response to the emission reduction policies. In summary, this study highlights the complex interplay between meteorological and anthropogenic factors in shaping AOD variations across China and demonstrates the increasing significance of meteorological conditions in modulating China's AOD.
- Article
(6392 KB) - Full-text XML
- BibTeX
- EndNote


Satellite observations of aerosol optical depth (AOD) provide information on the spatiotemporal variation in aerosols in the atmosphere on local, regional, and global scales with daily global coverage. Satellite data have been used to retrieve AOD for over 50 years, and long time series are available from individual sensors, such as the MODerate resolution Imaging Spectroradiometer (MODIS), and from combinations of sensors (Sogacheva et al., 2020). The use of satellites to monitor the evolution of AOD over China has been demonstrated by studies such as Xu et al. (2015), Kang et al. (2016), Zhang et al. (2017a), Zhao et al. (2017), Proestakis et al. (2018), de Leeuw et al. (2018, 2022, 2023), and Sogacheva et al. (2018a, b). Time series of aerosols provide information on the evolution of their atmospheric concentrations, which are influenced by anthropogenic and natural emissions, transformations in the atmosphere, and removal processes. Anthropogenic emissions include those due to, e.g., industrialization, urbanization, traffic, domestic activities and associated increases in energy production, transportation, agricultural activities, and land use. Emissions, and thus concentrations, are reduced via the implementation of policies aimed at the reduction of air pollution and its adverse effects. Effects of changes in meteorological parameters on AOD and the associated effects on AOD time series were explained in de Leeuw et al. (2023; their Sect. 3.6). Meteorological effects on AOD can be determined using model simulations, which in turn can be used together with observations to determine anthropogenic effects (Kang et al., 2019; de Leeuw et al., 2023). These methods, explained in more detail in Sects. 2 and 3, are used in the current study on the analysis of AOD time series over China.
Early in the 21st century, as a consequence of economic development and urbanization, aerosol concentrations over China were among the highest in the world. To abate air pollution, a number of plans to reduce emissions of aerosols and trace gases have been implemented in China. As a result, aerosol concentrations have been reduced to below those in 2000, as evidenced by time series of satellite-derived AOD (de Leeuw et al., 2023). Both ground-based (Zheng et al., 2017; Zhang et al., 2019b; Xiao et al., 2020; Geng et al., 2024; Zhong et al., 2021; Zhang et al., 2019c) and satellite measurements show that accelerated efforts resulted in an initially fast reduction in aerosol concentrations between 2011 and 2018.
As mentioned above, the concentrations of aerosols are influenced by both meteorological and anthropogenic effects, including emission reduction policies, as shown by work such as Kang et al. (2019). Using methods similar to those of Kang et al. (2019), de Leeuw et al. (2023) showed that meteorological effects were responsible for as much as one-quarter of the total reduction in AOD over the Yangtze River Delta (YRD) between July 2011 and February 2020. The total reduction amounted to 31.4 %, due to contributions from meteorological and anthropogenic effects, resulting in an AOD smaller than that in 2000. Over the North China Plain (NCP) the total reduction was 27.2 %, with 6 % attributed to meteorological effects, while the total reduction values were 22.2 %, 35.9 %, and 40.3 % over the Pearl River Delta (PRD), Hunan and Hubei (HNB), and the Sichuan Basin (SCB), respectively, with 22 %, 10 %, and 17 % of the total corresponding reduction attributed to meteorological effects.
These results clearly confirm the importance of meteorological effects on the variation in aerosol concentrations which need to be taken into account for the evaluation of the effects of emission reduction. Meteorological effects can enhance AOD and, thus, counteract the effects of emission reduction on the concentrations (unfavorable meteorological effects), but they can also reduce AOD and, thus, reinforce emission reduction effects on the aerosol concentrations (favorable).
The current study extends the work presented in de Leeuw et al. (2023) for the time period from 2010 to 2021 by almost 3 years by adding Multi-Angle Implementation of Atmospheric Correction (MAIAC) AOD data from the end of 2021 to September 2024, over all five regions (NCP, YRD, PRD, HNB, and SCB), but with some major differences. First, the MODIS/MAIAC Collection 6 (C6) AOD data were not extended beyond 2022; therefore, in the current study, the C6 time series for 2010–2021 used by de Leeuw et al. (2023) was replaced with the recently released (6 July 2022) MODIS/MAIAC Collection 6.1 (C6.1) data and extended with C6.1 data until September 2024. Comparison between MODIS/MAIAC C6.1 AOD and MODIS/MAIAC C6 AOD shows small differences across China in both space and time (Huang et al., 2024). Because of these differences, especially the adjustments around 30° N (Sect. 2.2), the results mentioned above from de Leeuw et al. (2023) are somewhat different from those produced in the current study (will be published elsewhere). Second, the KZ(12,3) filter (defined as three applications of a moving average of the values in a window with a length of 12 months) was replaced with the centered moving average over 12 months (CMA12)1, filtering variations with a period of up to 12 months instead of 21 months. The CMA12 time series reveals tendencies and variations that were further investigated using monthly mean data. One motivation to extend the work by de Leeuw et al. (2023) was to investigate the suggested flattening of AOD during 2018–2021. Thus, AOD time series are presented for the period from January 2010 to September 2024, primarily as monthly averages of satellite observations. Following Kang et al. (2019) and de Leeuw et al. (2023), meteorological effects on AOD were simulated using the Community Earth System Model (CESM) with emissions fixed in 2010 but with varying meteorological data nudged to the MERRA-2 reanalysis data. Comparison of model and satellite monthly mean AOD time series shows similarities and, thus, meteorological effects on the observed AOD. Differences between modeled and observed AOD are attributed to anthropogenic effects. In addition to these monthly variations, AOD tendencies and contributions from meteorological and anthropogenic effects are discussed based on normalized2 CMA12 time series of satellite and model data. CMA12 not only effectively removes monthly and seasonal variations but also smooths the variations and introduces uncertainty in the times when events occur.
The results presented below clearly confirm that accelerated efforts resulted in an initially fast reduction in aerosol concentrations between 2011 and 2018, as presented in the literature for both PM2.5 (Zhang et al., 2019b; Liu et al., 2024a) and AOD (de Leeuw et al., 2023, 2018; Sogacheva et al., 2018a, b; Zhao et al., 2017; Zhang et al., 2017a). The reduction in the aerosol concentrations is generally attributed to China's emission reduction policies, but anomalies are observed for both PM2.5 (Du et al., 2022) and AOD (de Leeuw et al., 2024) which, at least in part, can be attributed to meteorological effects. With the reduction in the aerosol concentrations, the meteorologically induced anomalies become relatively more important and may be of a similar or larger magnitude compared to anthropogenic effects, resulting in a net-zero change in AOD, as shown in this paper.
The objectives of the current study are (1) to investigate the reasons for the flattening of the AOD reduction during 2017–2021, as observed by de Leeuw et al. (2023); (2) to investigate what caused the anomalous AOD in the winter of 2014 over the YRD, HNB, and PRD but not over the NCP and SCB (de Leeuw et al., 2023) (their Fig. 7); (3) to use monthly mean AOD data to accurately identify the start and end of anomalous events, which are hidden in the low-pass-filtered data used in de Leeuw et al. (2023); (4) to connect the occurrences of anomalous AOD to specific meteorological conditions and/or anthropogenic interferences; and (5) to investigate whether changes in aerosol physicochemical characteristics, in response to emission reduction and climate change, results in different AOD patterns.
Obviously, not all of these questions can be fully addressed in a single study. Therefore, in the current paper, we report and describe the observational data and provide comparisons with the CESM model data (with emissions fixed in 2010). Meteorological and anthropogenic effects on the AOD variations are discussed, and possible influences of large-scale meteorological effects (El Niño, La Niña, and heat waves) and anthropogenic effects (policy measures and economic effects) are indicated. These effects will be discussed in more detail in a follow-up paper. In Sect. 2, we briefly describe the study area (with five selected regions), the MODIS/MAIAC C6.1 dataset, and the CESM model used in this study. Time series of the MODIS/MAIAC C6.1 monthly mean AOD and the simulated AOD are presented and discussed in Sect. 3, together with time series of centered moving averages, normalized in July 2010, of both the MODIS/MAIAC AOD and the CESM-simulated AOD. Meteorological and anthropogenic effects on AOD temporal variations, derived from the normalized CMA12 time series, are presented for each region. The results are discussed in Sect. 4, with a focus on features common to the five regions. Conclusions are summarized in Sect. 5.
2.1 Study area
The coarse resolution of the CESM model (Sect. 2.3) used in this study requires relatively large study areas. The study areas selected are the North China Plain (NCP), the Yangtze River Delta (YRD), the Pearl River Delta (PRD), Hunan and Hubei (HNB), and the Sichuan Basin (SCB). Their locations are indicated in Fig. 1, overlaid over the spatial distribution of the annual mean AOD in 2014, with their coordinates presented in Table 1. These five study areas were selected because of their high population density and industrial activity. They are situated in different climate zones with different geography, different meteorological conditions and influences from large-scale circulation, and different aerosol conditions and influences from long-range transport. The AOD spatial distributions over the different regions show some sharp transitions, such as over the NCP where mountains to the north and west block the transport of atmospheric constituents, resulting in a large spatial gradient. Likewise, the SCB is a basin surrounded by high mountains that prevent ventilation; thus, atmospheric constituents in the basin are trapped. The AOD map also shows the large AOD differences between the five regions, with high AOD over most of the southwestern region of the NCP and a north–south gradient leading into the highest AOD in the north of Henan. Over the YRD, a large north–south gradient is observed but with the highest AOD in the north (Jiangsu and Anhui) and substantially lower AOD in Zhejiang. In contrast, AOD in the PRD is mainly centered around the urban area of Guangzhou, which is situated in the central and southern part of Guangdong Province in the north of the PRD. The prevailing northerly wind in the winter facilitates the transport of air pollution, whereas the southerly wind in the summer brings clean air from the South China Sea (Liu et al., 2020b).
Table 1Five study areas were selected in China, as shown in Fig. 1. Each area is defined by the latitude and longitude of the lower left-hand and upper right-hand corners.
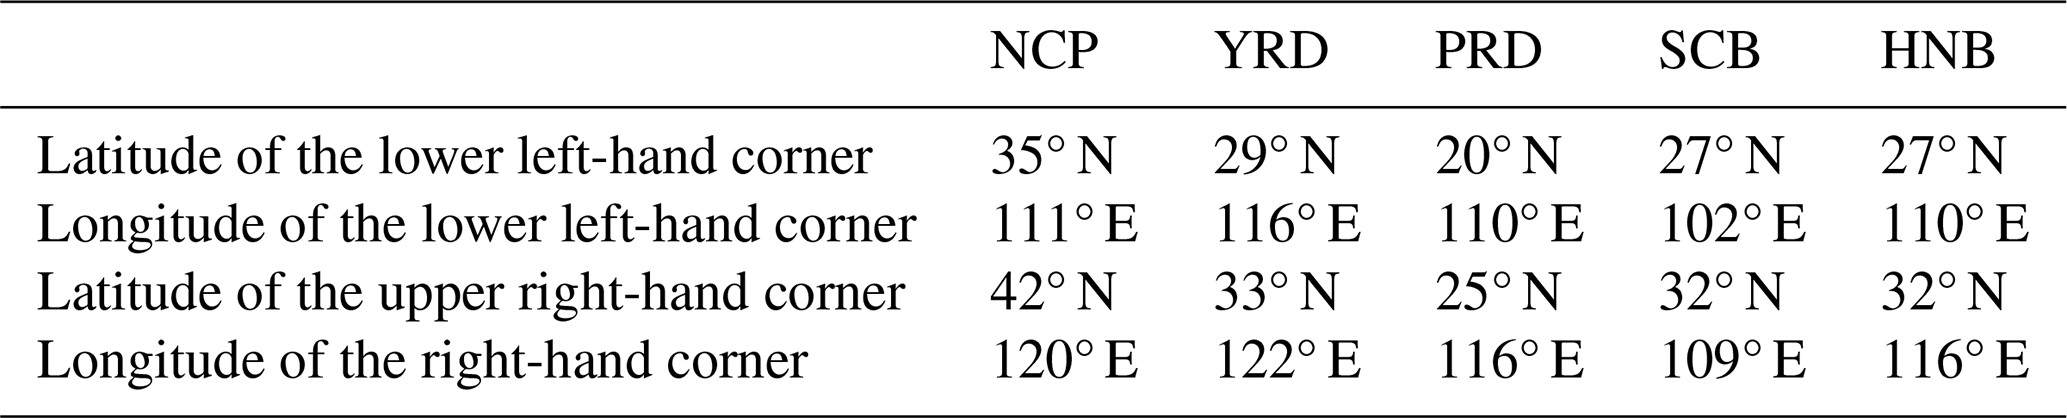
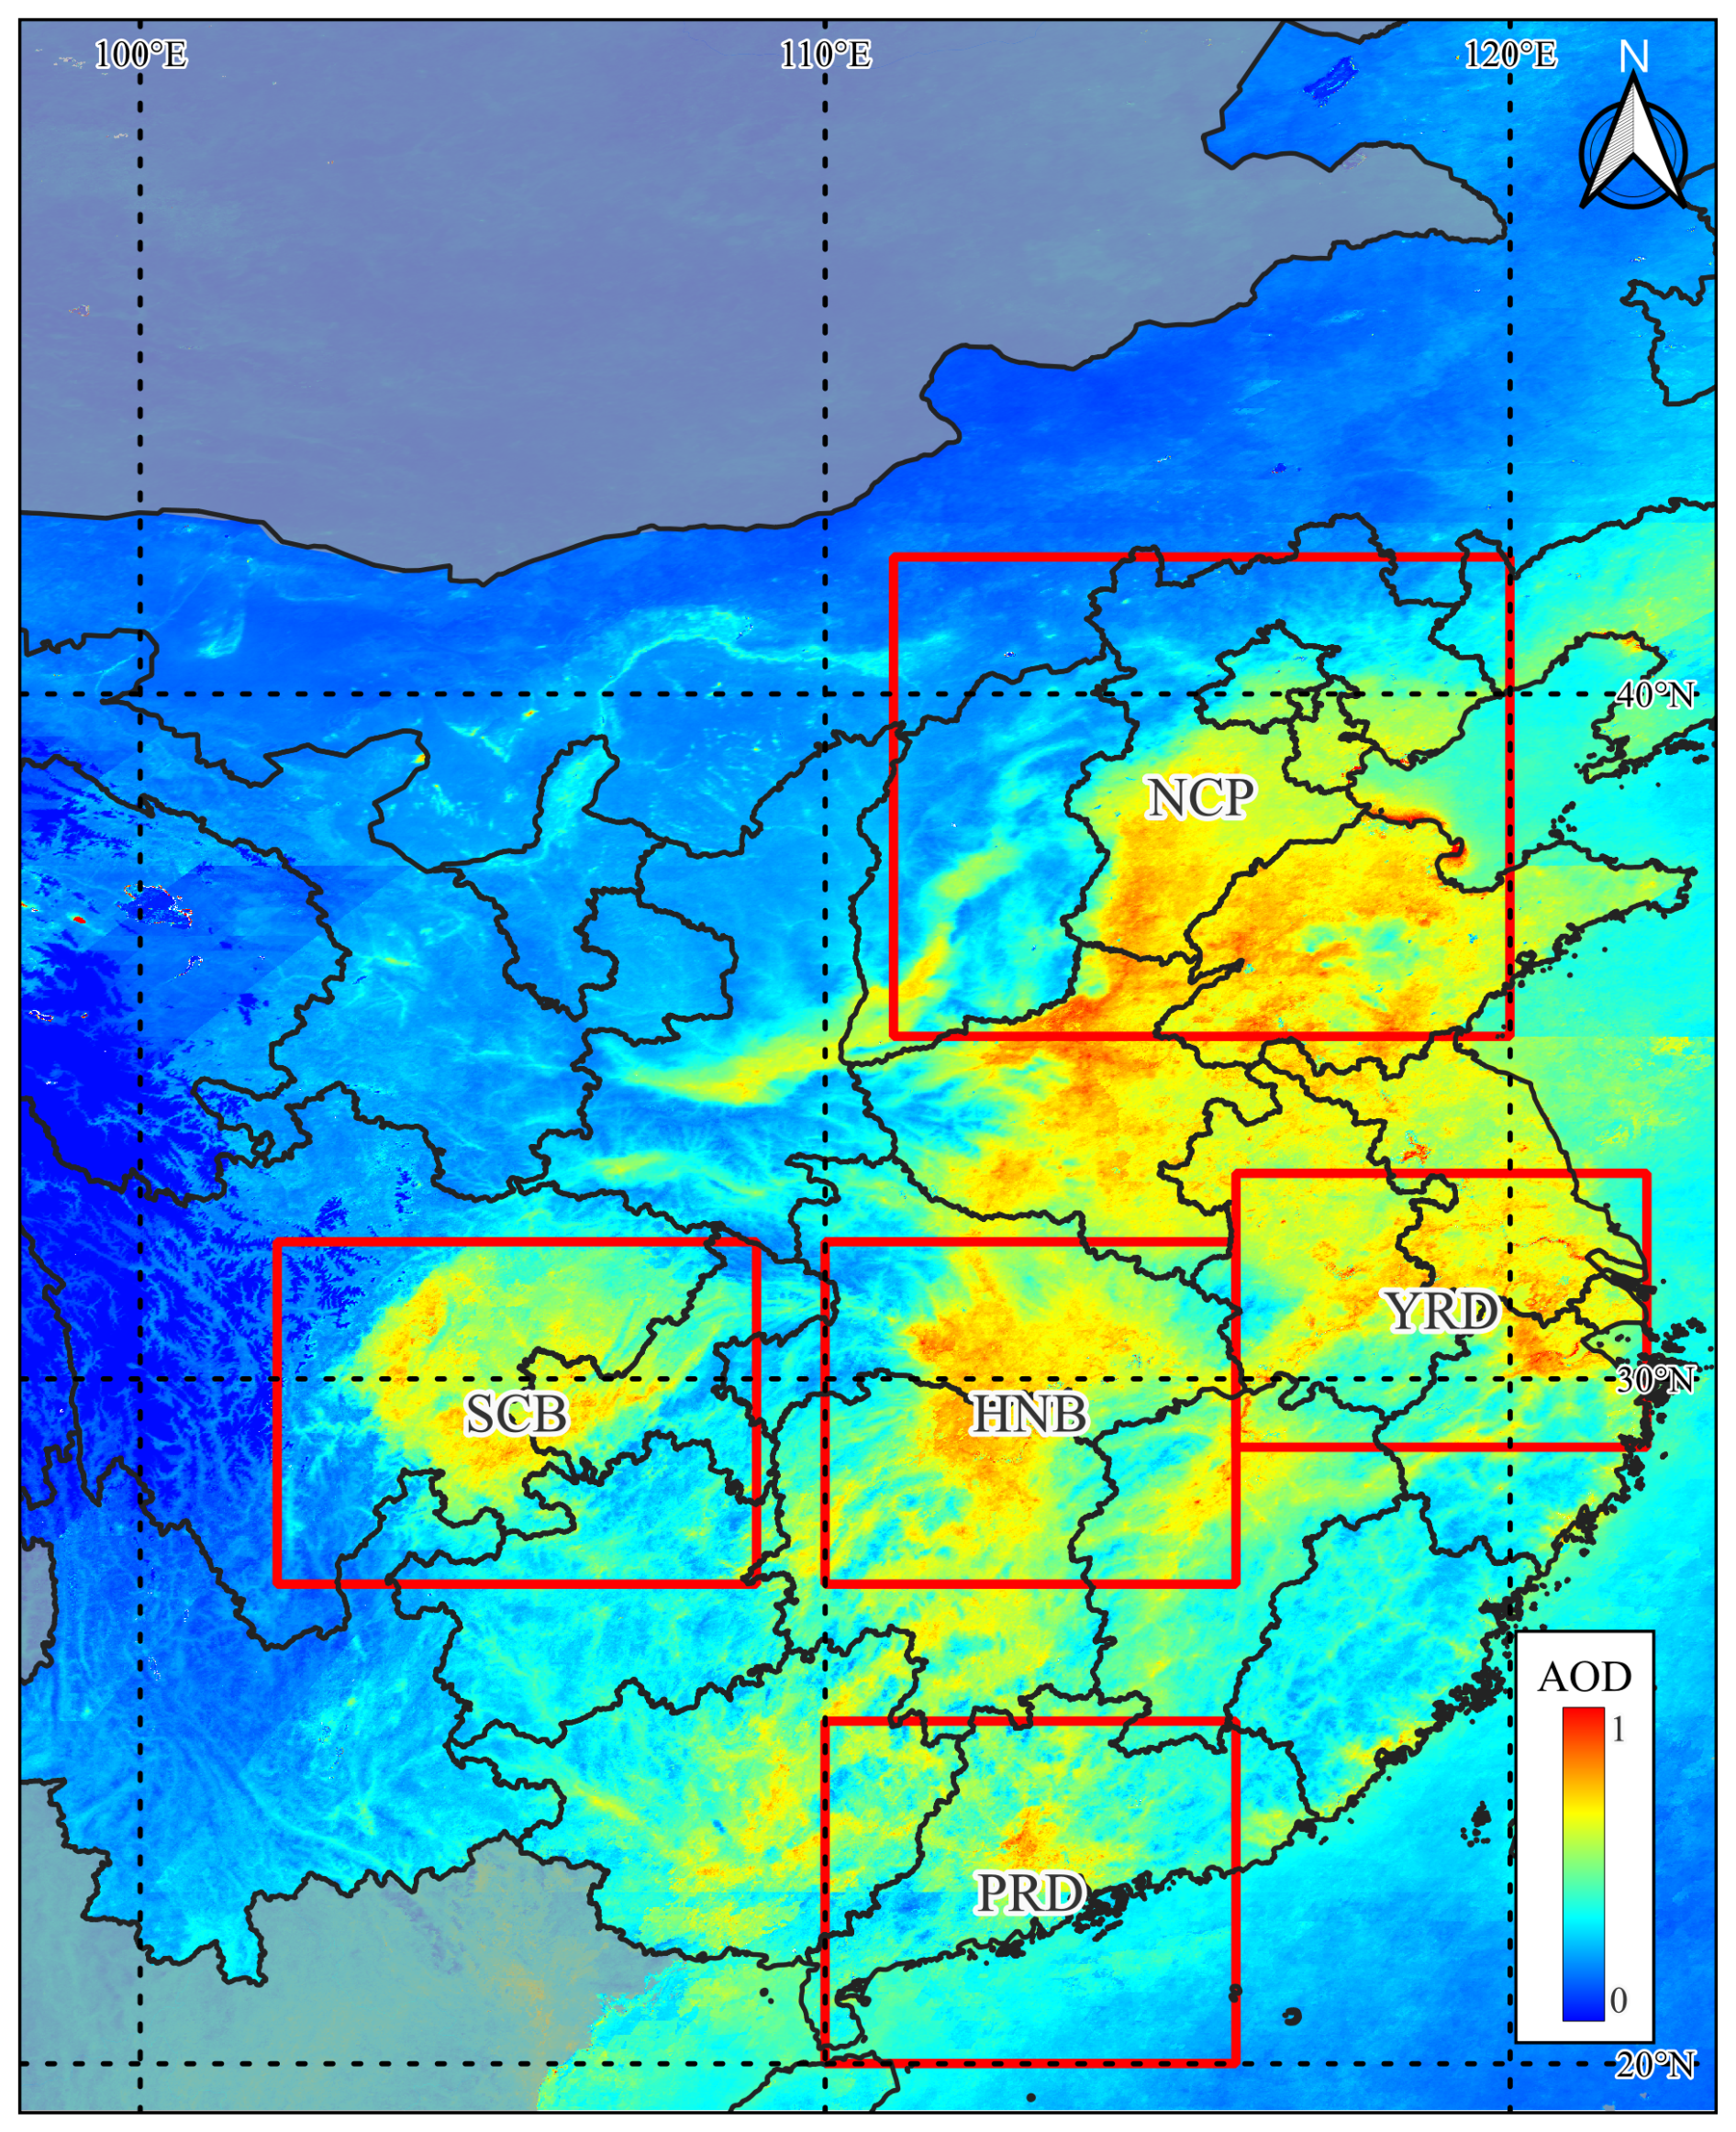
Figure 1Map showing the study area in Southeast Asia, overlaid on the annual mean AOD in 2014 (see legend for color scale). The five selected study areas are indicated by the rectangles, and their coordinates are given in Table 1.
2.2 MODIS/MAIAC
MODIS spectrometers were launched aboard the Terra satellite in December 1999 and aboard the Aqua satellite in May 2002. Terra flies in a near-polar Sun-synchronous orbit in a descending mode with a daytime Equator-crossing time of 10:30 local time (LT), whereas Aqua flies in an ascending mode with an Equator-crossing time of 13:30 LT. MODIS is a single-view instrument with a swath width of 2330 km across track and a nominal pixel resolution at nadir of 250 m (2 bands), 500 m (5 bands), and 1000 m (29 bands). The 36 wavebands cover wavelengths between 405 nm and 14.28 µm. MODIS has been designed for the retrieval of aerosol and cloud properties, and several algorithms have been developed for this purpose, of which the Dark Target (DT) (Levy et al., 2013), the Deep Blue (DB) (Sayer et al., 2014, 2015, 2019; Hsu et al., 2013, 2019), the merged Dark Target/Deep Blue (DTDB) (Sayer et al., 2014), and the Multi-Angle Implementation of Atmospheric Correction (MAIAC) algorithm (Lyapustin et al., 2018) products are most widely used. Aerosol products from these algorithms are publicly available from the Land Processes Distributed Active Archive Center (LPDAAC) website (LPDAAC, 2024) within the NASA Earth Observing System Data and Information System (EOSDIS).
In this study, AOD at 550 nm (hereafter referred to as AOD) is used, based on the daily L2 MAIAC C6.1 AOD retrieval products downloaded from the LPDAAC website. Monthly mean AOD was calculated using the Google Earth Engine (GEE) cloud computing platform (Gorelick et al., 2017).
The MAIAC algorithm (Lyapustin et al., 2018) produces a combined MODIS/Terra and MODIS/Aqua gridded L2 daily AOD product at a 1 km resolution on a sinusoidal grid. The MAIAC algorithm retrieves AOD using MODIS L1B data gridded on a fixed 1 km grid accumulated over 16 d with a sliding-window technique. The algorithm effectively separates surface and atmospheric contributions to the top-of-atmosphere (TOA) reflectance using observations of the same grid at different times and at different angles from different orbits (Lyapustin et al., 2018). The MAIAC MCD19A2.061 (C6.1, further referred to as MAIAC C6.1 or simply MAIAC) product was released on 6 July 2022. MAIAC C6.1 and differences from previous versions are described by Lyapustin and Wang (2022), LPDAAC (2024), and Huang et al. (2024). In C6.1, the AOD discontinuity around 30° N (de Leeuw et al., 2022) has been addressed by implementing a gradual transition between aerosol models over a buffer area of 300 km. MAIAC C6.1 does not attempt retrieval over snow-covered surfaces and the ice mask is unreliable (Lyapustin and Wang, 2022).
MAIAC C6.1 has been validated over China by Ji et al. (2024) and Huang et al. (2024). Both studies report that the overall accuracy of the MAIAC AOD products over China is good. The validation by Ji et al. (2024) over bright surfaces, using publicly available reference data from AERONET and CARSNET until 2014, shows a significant underestimation and negative bias of the MAIAC C6.1 product, although MAIAC C6.1 performs slightly better than DB and C6. The comparison with co-located AERONET AOD data, for the period from 2001 to 2021, by Huang et al. (2024) shows good consistency, with correlation coefficients (R) of 0.933 and 0.939, root-mean-square error (RMSE) of 0.152 and 0.146, bias of 0.005 and 0.015, mean absolute error (MAE) of 0.094 and 0.092, relative mean bias (RMB) of 1.221 and 1.301, and percentage of data points within expected error (EE) of 71.02 and 68.36 at the overpass times of the Aqua (13:30 LT) and Terra (10:30 LT) satellites, respectively (Huang et al., 2024) (Fig. 2). The comparison shows a slight overestimation of C6.1 at low AOD (< 0.5) and a small underestimation at higher AOD.
2.3 CESM model
Meteorologically induced AOD variations were determined using the Community Earth System Model (CESM) version 1.0.4 (NCAR, 2012; Hurrell et al., 2013) with the Community Atmospheric Model version 5 (CAM5) (Neale et al., 2012). CESM has a spatial resolution of 1.9° × 2.5° (latitude × longitude) and 56 vertical levels from the surface to 4 hPa. Concentrations of aerosol components, including sulfate, ammonium nitrate, black carbon, primary and secondary organic aerosol, dust, and sea salt, are calculated based on the MOZART-4 (Model for Ozone and Related chemical Tracers version 4) chemical mechanism (Emmons et al., 2010). Model performance on aerosol has been widely evaluated (Lamarque et al., 2012; Fang et al., 2020; Emmons et al., 2010).
To isolate the effects of meteorology on AOD, anthropogenic emissions were fixed using the monthly values from 2010, which were repeatedly applied to the corresponding months of each subsequent year. Meteorological input fields, including horizontal winds, air temperature, surface pressure, land surface temperature, heat fluxes, and wind stresses, were nudged to the MERRA-2 (Modern Era Retrospective analysis for Research and Applications, Version 2) reanalysis dataset (Gelaro et al., 2017; Rienecker et al., 2011; NCAR/UCAR, 2018) (see also https://rda.ucar.edu/datasets/d313003/, last access: 4 March 2024), which provides data at a 3 h temporal resolution. In this study, we used the MERRA-2 product available at a 1.9° × 2.5° horizontal resolution, which matches the CESM model grid and avoids the need for spatial interpolation. Linear interpolation in time was applied between input steps to ensure continuity and avoid artificial jumps (Lamarque et al., 2012). CAM5 employs a sub-stepping algorithm (Lauritzen et al., 2011; Lamarque et al., 2012) and an atmospheric mass fixer (Rotman et al., 2004) to maintain consistency between nudged and prognostic fields. The importance of nudging has been discussed in publications such as Menut et al. (2024), Zhang et al. (2014), and He et al. (2015).
Natural emissions of dust and sea salt were calculated online in the model using the actual MERRA-2 meteorological conditions. Biomass-burning emissions from the Global Fire Emissions Database version 2 (GFEDv2) (Randerson et al., 2006) were treated as anthropogenic (Yan et al., 2006; Wu et al., 2020) and fixed at the 2010 level. As a result, all variations in the simulated AOD can be attributed to changes in meteorological parameters and their influence on natural aerosol processes. This approach is commonly used with different types of models (Xiao et al., 2021; Qi et al., 2022; Ji et al., 2020; Zhao et al., 2021), including CESM/CAMS (Banks et al., 2022; Kang et al., 2019; de Leeuw et al., 2023). Model resolution has been addressed in work such as Bacmeister et al. (2014), Huang et al. (2016), and Glotfelty et al. (2017).
AOD was calculated from the concentrations of the aerosol species at each grid point and for each time step with the model developed by Zhang et al. (2017b). The spatial distribution of the thus calculated AOD is similar to that of the MAIAC-retrieved AOD. However, the CESM estimates for desert dust are too high (Wu et al., 2019); therefore, contributions from desert dust were not included in the AOD calculations. Differences between simulated and MAIAC-retrieved monthly mean AOD over each region will be discussed in Sect. 3.3.
The model simulations were made for the period from January 2009 to July 2023 (14 years and 7 months), with the first year used as spin-up time. The end date of July 2023 was determined by the availability of the reanalysis meteorological data used in the simulation at the time of this study (August 2024).
3.1 Data overview
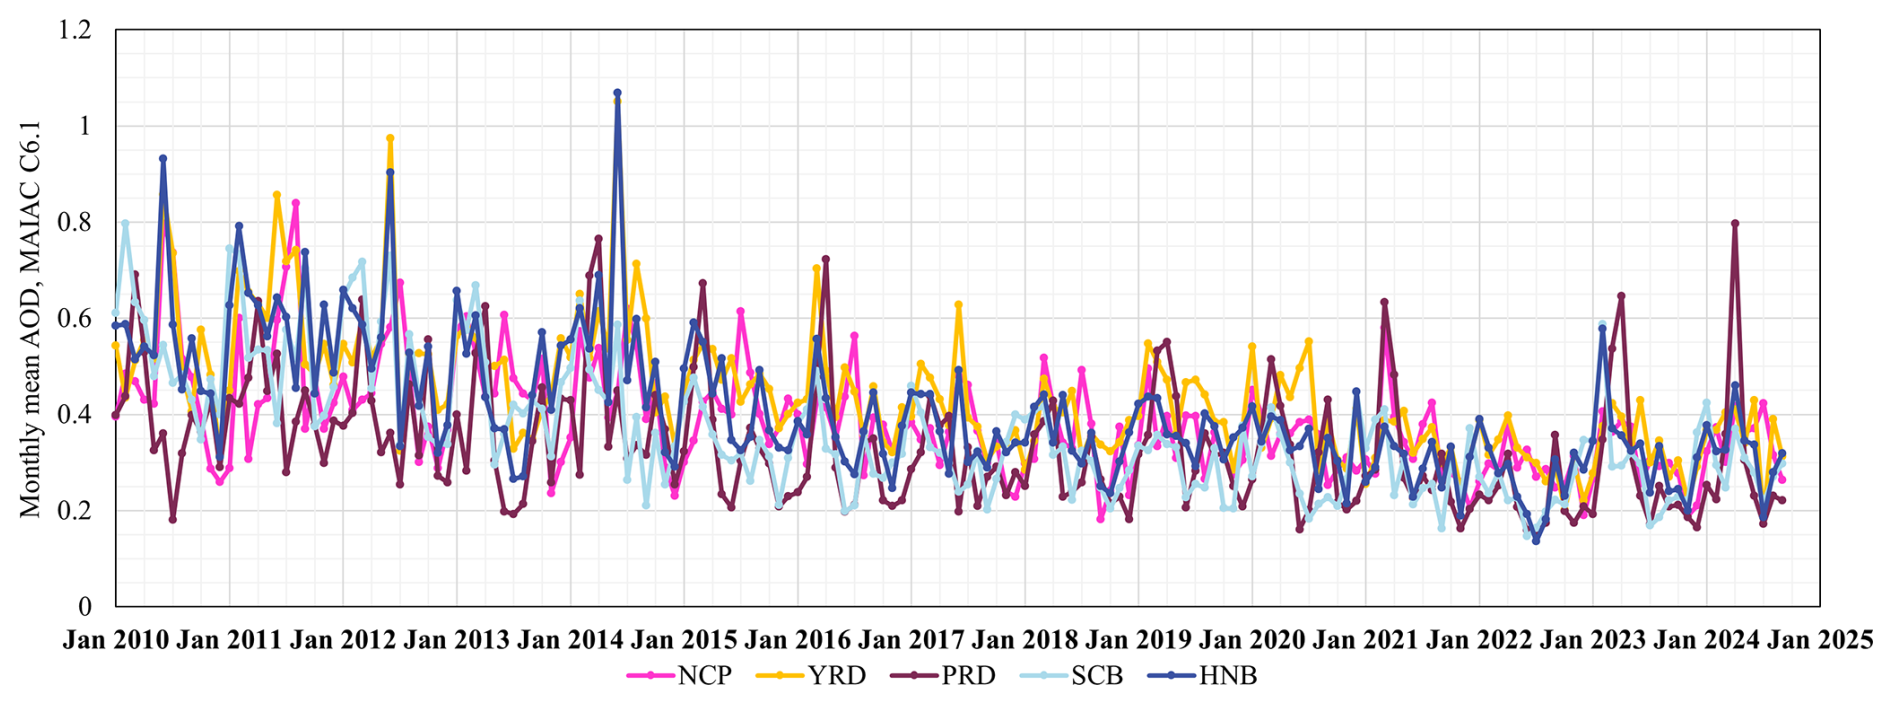
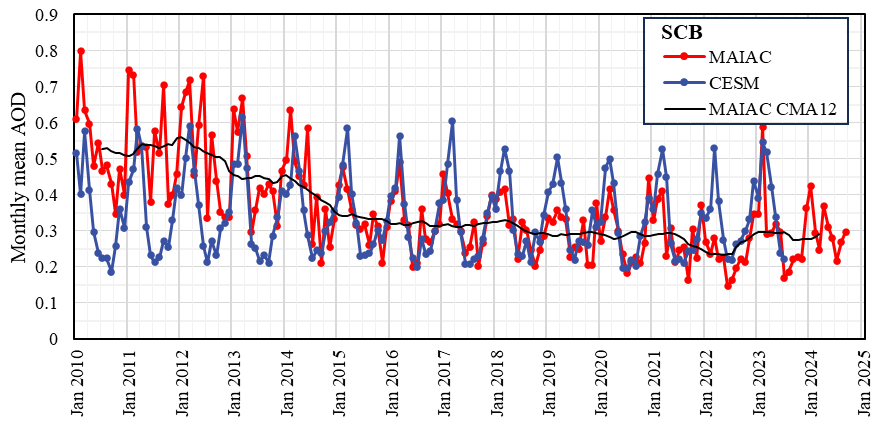
The MAIAC C6.1 monthly mean AOD time series over the five regions are presented in Fig. 2. The data in Fig. 2 show very high AOD peaks in June 2014 over HNB (1.07) and the YRD (1.05), in June 2012 over the YRD (0.97) and over HNB (0.90), and in June 2010 over HNB (0.93). Other high peaks with an AOD of 0.8 are observed in February 2010 over the SCB and in June 2010 over the NCP; in February 2011 over HNB (0.80), in June 2011 over the YRD (0.86), and in August 2011 over the NCP (0.84); and in April 2024 over the PRD (0.80). The AOD time series over each region will be discussed in detail in Sect. 3.3.
3.2 Common features and tendencies
The overall AOD variations between 2010 and 2024 are clearly observed in the centered moving average of the monthly mean observational data, CMA12, which acts as a low-pass filter and removes short-term variations with cycles of up to 12 months, while retaining long-term variations. The CMA12-filtered monthly mean AOD data for the five regions in Fig. 3 clearly show the differences between the five regions that are difficult to see in the monthly mean data in Fig. 2. For instance, the high AOD during the first 5 years appears to cover two periods with substantially enhanced AOD, over the YRD, HNB, and PRD, separated by a short period with very low values in 2013. In contrast, AOD over the NCP decreased monotonously between 2012 and 2018, with a small enhancement in 2014 which coincided with elevated AOD in other regions. Over the SCB, AOD decreased in 2012 at a rate similar to that over the YRD and HNB, while it increased at a faster rate in 2014, with a shoulder in 2013.
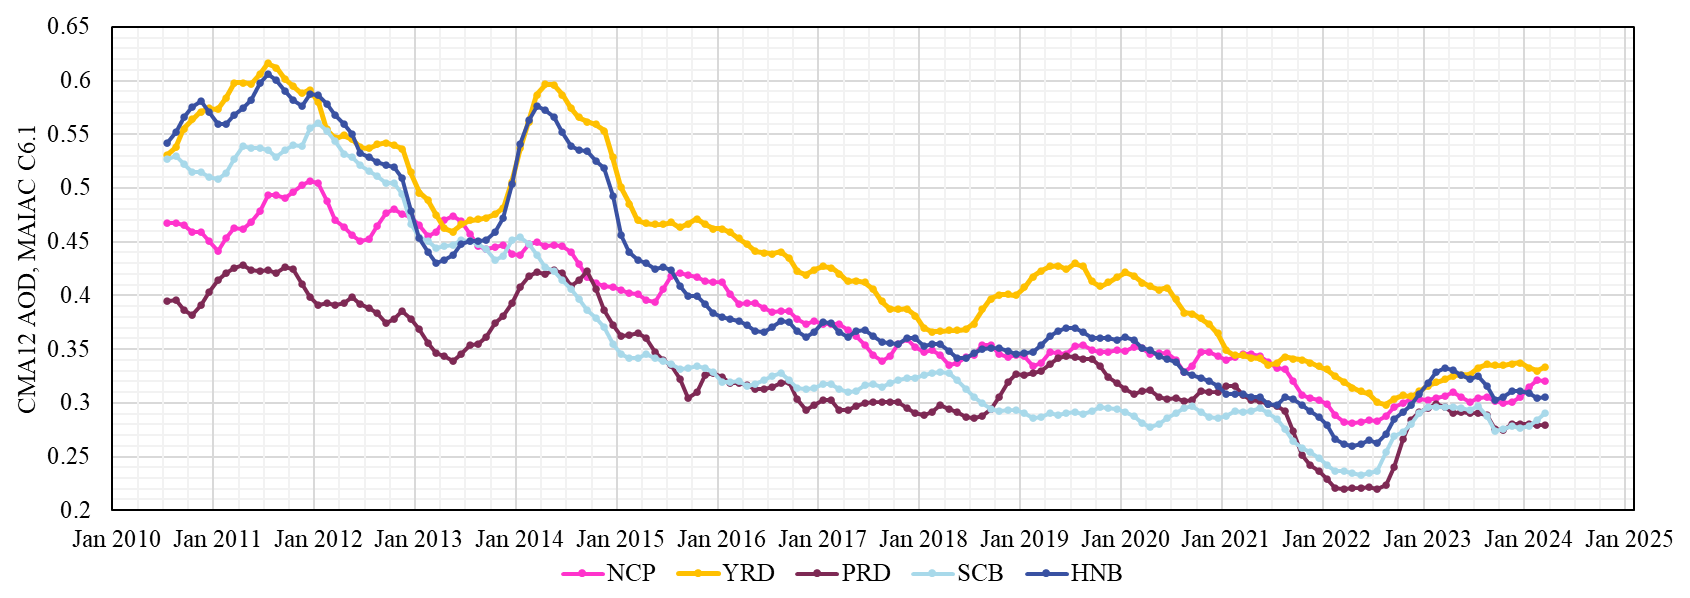
Figure 3Time series of CMA12-filtered monthly mean AOD for the five regions (see legend) from July 2010 until March 2024.
In 2014, very high AOD occurred over both the YRD and HNB, peaking in April/May (0.60; referring to CMA12) and March (0.58), respectively, with a gradual decrease toward the end of the year when the filtered AOD dropped substantially during the next 3–4 months. A broad maximum also occurred over the PRD, with high AOD between February and September, although it was less extreme (0.42). Obviously, the CMA12 AOD over HNB and the YRD in 2014 was influenced by the extremely high monthly mean AOD peaks in June (Fig. 2), but these peaks did not have a large effect on the variation in the CMA12 AOD in 2014 (Fig. 3). Replacement of the monthly mean peak values in June (1.07 and 1.05, respectively) with the local mean value of 0.5 resulted in lower CMA12 values but did not substantially change the shapes of the CMA12 time series during the 12 months affected. The data in Fig. 2 show that the AOD was also high during preceding months, and the CMA12 data in Fig. 3 show the gradual increase from the minimum in the spring of 2013 to the maximum in 2014. This has been attributed to anomalous meteorological situations during 2014 (de Leeuw et al., 2024).
A third period (2015–2018) shows the accelerated AOD decrease, attributed to the effective implementation of the 2013–2017 Clean Air Action Plan. The data show the differences and similarities in the tendencies and rates of the AOD reduction in the five regions, as well as fluctuations which may be due to meteorological influences (as discussed in the following sections). It is noted that the largest reduction over the SCB was achieved during the period from 2013 to 2015 (see Sect. 3.3.5).
A fourth period (between the summer of 2018 and the end of 2020) shows the strong enhancement of AOD, peaking in 2019, over the YRD, HNB, and PRD, while the AOD increase over the NCP was smaller and there was no increase over the SCB. This period was followed by a strong reduction over all five regions, with a minimum in 2022, and a recovery in 2023, when AOD reached a maximum early in the year, higher than in 2021, over HNB and the SCB. Over these regions and also over the PRD, AOD decreased in the second half of 2023, and AOD remained high over all five regions until March 2024 (the end of the CMA12 of the MAIAC C6.1 AOD time series in this study).
Detailed comparisons between the monthly mean AOD from MAIAC, the CESM model simulations, and the CMA12-filtered data are presented in the following sections, for each of the five regions separately. CMA12 time series are used to visualize tendencies. However, as discussed in Kang et al. (2019), the CESM results are not representative of actual situations because AOD was simulated using fixed emissions to identify meteorological effects on AOD. The CMA12-filtered observational and simulated AOD data were normalized for quantitative comparison and to determine anthropogenic and meteorological influences, as explained in de Leeuw et al. (2023). The anthropogenic effect (Ai) on AOD has been deduced from the normalized observations (Oi) and model simulations (Mi) following the method presented in Kang et al. (2019), using the following:
At the start of the normalized time series, i=1, Ai=0, Oi=1, and Mi=1. Normalized model-simulated AOD larger than 1, i.e., enhanced AOD, results from unfavorable meteorological effects. Unfavorable meteorological effects offset the effects of emission reductions aimed at decreasing aerosol concentrations and thus AOD. In contrast, favorable meteorological effects reduce AOD and, thus, reinforce emission reduction policies. Normalized anthropogenic effects larger than 0 result from unfavorable anthropogenic effects (such as increased emissions), and effective emission reduction renders favorable anthropogenic effects (Ai < 0).
3.3 AOD time series over individual regions
In the following sections, MAIAC monthly mean AOD time series are presented for January 2010–September 2024 and simulated monthly mean AOD time series for January 2010–July 2023, together with CMA12-filtered monthly mean MAIAC AOD time series from July 2010 to March 2024, for each of the five regions separately. In addition, normalized (to July 2010) CMA12-filtered time series of MAIAC and simulated data, showing meteorological contributions to AOD, are presented for July 2010–January 2023, together with anthropogenic contributions calculated using Eq. (1).
3.3.1 AOD time series over the NCP
Time series of the monthly mean MAIAC and CESM AOD over the NCP in Fig. 4 show that, overall, the observed AOD variations are qualitatively reasonably well reproduced by the CESM model, although not in a quantitative sense. A discrepancy was expected because the emissions in the model simulations were fixed to those in 2010. During the first years, the simulated AOD is substantially lower than the observations, except in November/December 2010 and 2012–2015 when simulated and observed AOD values are in good agreement. The discrepancies during the spring and summer are attributed to the omission of the effect of desert dust in the AOD calculations (Sect. 2.3), while anomalous meteorological conditions may also have influenced the aerosol properties in the NCP (Fang et al., 2020). Desert dust strongly contributes to AOD over the NCP (Proestakis et al., 2018; de Leeuw et al., 2018). The better agreement between the simulated and observed AOD during the 2015–2020 period is attributed to the reduction in the observed aerosol concentrations in response to the 2013–2017 Clean Air Action Plan (which initially did not result in a reduction in AOD, possibly because of unfavorable meteorological effects, as discussed below), while the contribution from dust is not influenced by these measures. Further reduction in anthropogenic emissions after 2020 resulted in increased differences between the observations and the CESM model simulations.
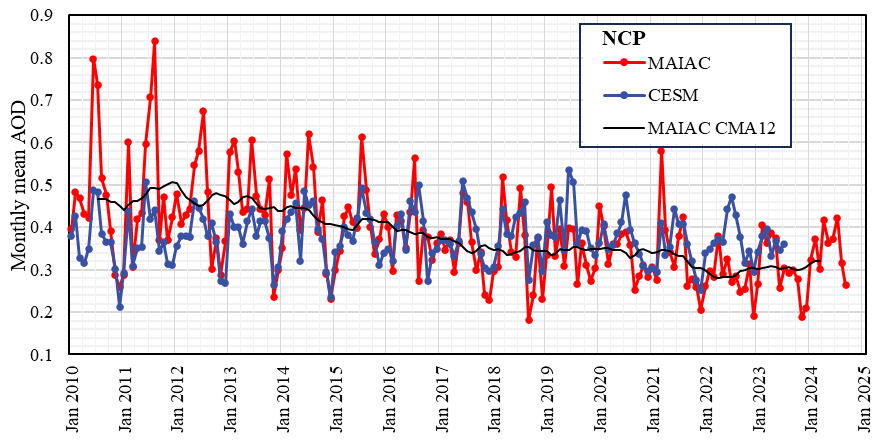
Figure 4Time series of monthly mean observed (MAIAC) and simulated (CESM) AOD, from January 2010 to September 2024 and July 2023, respectively, over the NCP, together with the MAIAC CMA12-filtered data.
The model-simulated AOD over the NCP varies seasonally: maxima mostly occur in June and minima in December, often followed by a strong increase into January. Deviations from this pattern are observed, such as during 2013 and the first half of 2014, when strong fluctuations occurred with overall higher AOD, followed by a deep minimum in December 2014 (AOD of 0.23 compared with overall minima on the order of 0.26–0.31). Moreover, in 2011 and 2018/2019, the patterns were more variable than in other years.
The MAIAC observations initially followed a similar pattern, with high AOD peaks during the summer (June/July) and deep minima during the winter that may have lasted a few months. Anomalously high peaks in June 2010 and August 2011 were followed by a steep descent into September; during the next 6 months, AOD remained relatively high (0.42) and variations were small. During 2013 and 2014, the variation in the monthly mean satellite data was qualitatively similar to that of the model simulations, i.e., fluctuations occurred with overall somewhat higher AOD than in previous years, followed by a deep minimum in December 2014 and a maximum of 0.61 in July 2015. Thereafter, the peak values decreased; the minimum values decreased too but were higher than before 2015. The pattern changed dramatically from 2018. In 2018, the monthly mean AOD varied from month to month; thereafter, AOD peaked in winter (January–March) instead of summer. Winter peaks were also observed in 2011, 2013, and 2014, but these were overshadowed by the high maxima in the summer.
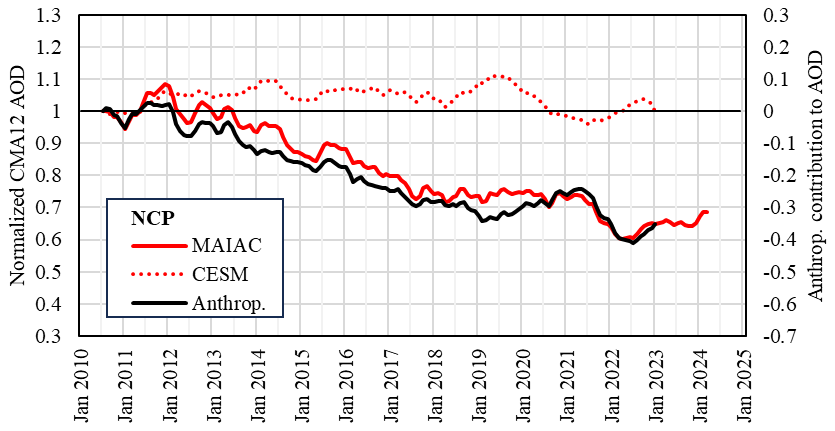
Figure 5Time series of CMA12-filtered MAIAC and CESM-simulated monthly mean AOD over the NCP from July 2010 to March 2024 and January 2023, respectively, normalized in July 2010. The black line shows the anthropogenic contribution to AOD (secondary vertical axis). The thin black line has been drawn to guide the eye.
Figure 5 shows normalized time series of CMA12-filtered MAIAC monthly mean AOD and CESM-simulated monthly mean AOD over the NCP. The model data show an overall unfavorable meteorological influence (except in 2021), offsetting anthropogenic effects such as those due to emission reduction policies. The latter resulted in an effective reduction in the normalized AOD between 2010 and 2013, which varied around 1, as the CMA12-filtered MAIAC observations show. These data also show that AOD decreased monotonously by about 30 %, with some fluctuations, from the maximum value at the end of 2012 until a steady value was reached in the summer of 2018. This decrease is attributed to the successful implementation of the 2013–2017 Clean Air Action Plan. The different behavior of the model simulations and the satellite data implies that emissions were reduced by anthropogenic effects. However, the AOD reduction was offset due to unfavorable meteorological influences, as indicated by the model simulations. Anthropogenic and meteorological effects were of similar magnitude in 2012 and early 2013; thus, the net effect was close to zero. Fluctuations such as those in 2014, 2015/2016, and 2017 coincide with variations in the simulated data and are attributed to meteorological effects.
Between 2018 and 2021, AOD changed very little, due to unfavorable meteorological effects. The anthropogenic data in Fig. 5 show that emission reduction was effective until February 2019, but the effect on AOD was very small due to the offset by unfavorable meteorological effects. From February 2019, the unfavorable meteorological effects continued to increase until June; they then decreased while the anthropogenic effects became less favorable. As a result, the observed AOD increased somewhat until August and remained relatively constant until May 2021, when anthropogenic and meteorological effects were in balance. These observations explain the apparent flattening reported in de Leeuw et al. (2023). After May 2021, AOD started to decrease to a minimum in the summer of 2022, followed by a rebound in 2023 (Fig. 5). More precisely, the monthly mean data in Fig. 4 show a strong decrease after a maximum in August 2021 (to a low minimum in December 2021), followed by a period in 2022 when AOD was lower than in 2021 and a further decrease between May and December in 2023.
The minimum in 2022 is attributed to anthropogenic conditions, as meteorological effects were small and turned slightly unfavorable. The monthly mean AOD (Fig. 4) was much smaller than the simulated AOD, which peaked in July. The anthropogenic influences leading to the strong minimum in 2022 are thought to be a consequence of several COVID lockdown periods and the resulting economic slowdown in 2022 (Worldbank, 2022). Liu et al. (2024b) reported that Shanghai's lockdown in 2022 resulted in a stagnating economy in parts of China.
3.3.2 AOD time series over the YRD
Time series of the monthly mean MAIAC and CESM-simulated AOD over the YRD are presented in Fig. 6. The simulated AOD time series show a regular pattern with peak values in March and minima in October/November of most years. The peak AOD values were around 0.65 and varied little during the first 6 years. In 2016 and 2017, the peak values decreased to 0.61 and 0.53, whereafter they gradually increased to 0.63 in 2021. Over the next 2 years, they decreased to 0.53 in 2023. The simulated data show smaller secondary peaks between August and October, with varying intensities. Furthermore, the minimum values vary from year to year, with the lowest value in 2017 and the highest value in 2014. The interannual variations in the simulated AOD show the clear influence of meteorological conditions, illustrated by the variation in their effects on AOD in Fig. 7. The meteorological effects were generally unfavorable, except in 2016 and 2017. Clear unfavorable conditions occurred in 2011 (up to 9 %), 2014 (8 %), and 2020 (8 %).
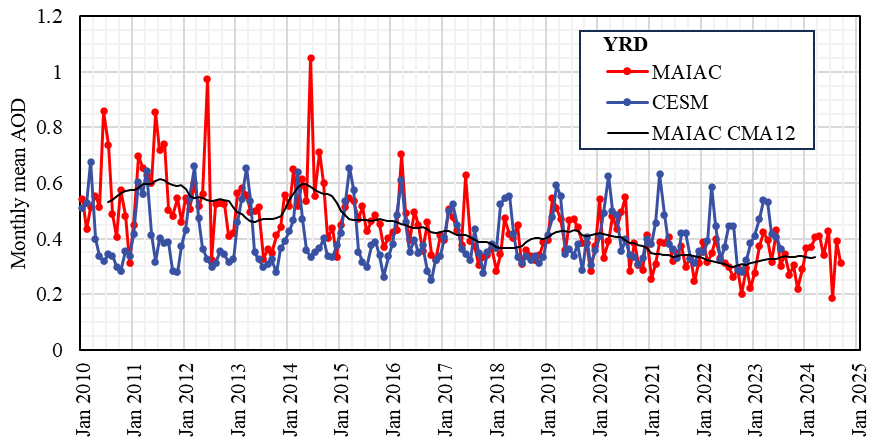
The regular AOD pattern with maxima in March is also visible in the MAIAC data but with strong deviations in the first 5 years. In particular, anomalously high peaks occurred in June in 2012 (AOD 0.97) and in 2014 (1.05) as well as in 2010 and 2011 (both 0.86). In each of these 4 years, no clear peak was observed in March (as in the model simulations), and AOD was high overall, although relatively low minima occurred in December 2010 (0.31) and in July in 2012 and 2013 (both 0.32). During the first half of 2014, AOD was higher overall than in other years; however, after the anomalously high peak in June, AOD decreased during the second half of the year. From 2015, the observational data and the model simulations followed a similar pattern, with maxima in March and often with another peak in June/July, and the observational peak AOD clearly decreased until 2018. The CMA12 time series shows that this decrease lasted until spring 2018, followed by a substantial increase during about 1 year. From summer 2019, the AOD declined until August 2022, to a minimum AOD of 0.30 (CMA12 value). The monthly mean AOD confirms the strong decline in 2021/2022, to a minimum of 0.20 in October, followed by a rebound in 2023 with peaks in March and June with higher AOD than in 2021. The overall decrease in AOD over the YRD between 2019 and 2022 is attributed to anthropogenic effects, with fluctuations due to meteorological effects. The lowest AOD was observed in 2022, decreasing between April and October. In contrast, the simulated AOD was substantially higher and peaked in August.
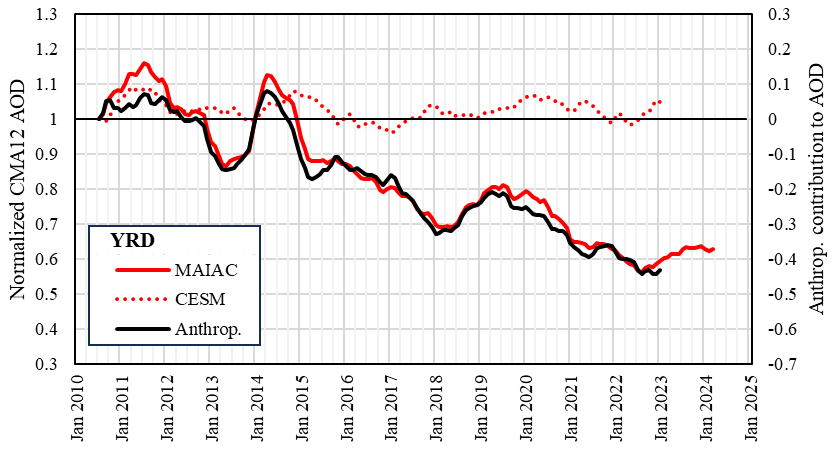
The normalized CMA12 time series in Fig. 7 show an initial 15 % increase in the MAIAC AOD between mid-2010 and mid-2011, with similar contributions from unfavorable meteorological and anthropogenic effects. In 2012, AOD was close to the July 2010 value; it then decreased by about 13 % in 2013 before increasing to a maximum in April 2014. The maximum AOD was 12 % larger than the July 2010 value, mainly due to anthropogenic effects, reinforced by a contribution from unfavorable meteorological conditions. The AOD remained high throughout 2014 but declined substantially by 17 %, between October 2014 and April 2015, in spite of unfavorable meteorological conditions of about 7 %. The AOD changed little during 2015 as a result of opposite anthropogenic and meteorological contributions. During the following years, 2016–2018, the meteorological contributions were very small, while anthropogenic effects caused an increased reduction in AOD, attributed to the 2013–2017 Clean Air Action Plan, resulting in a net decrease of 31 % between July 2010 and early 2018.
This decrease was followed by an initial increase until mid-2019 (by ∼ 12 %, referenced to July 2010), whereafter AOD steadily decreased further until mid-2022, which is mainly attributed to emission control policies as part of the 2018–2020 “Three-Year Action Plan for Winning the Blue Sky Defense Battle” and the “14th Five-Year Plan (2021-2025)”, with some variations of up to 6 % due to unfavorable meteorological conditions in 2020. However, in the second half of 2021, the anthropogenic effects decreased, but the increase in AOD was offset by meteorological effects which became less unfavorable. This resulted in a relatively constant AOD during the last months of 2021, followed by a strong decrease until mid-2022. The monthly mean AOD data in Fig. 6 show the contrasting behavior between AOD in 2022 and both earlier and later years, in spite of the offset by meteorological effects (as shown in both Figs. 6 and 7). Overall, a substantial AOD reduction was achieved between 2010 and 2022, to 57 % of the 2010 value. The rebound in the second half of 2022 is suggested to be due to meteorological effects (Fig. 7). Lacking model data, the increase during 2023 cannot be further analyzed, but it is anticipated to be due to the rebound of the economy and associated activities after the Shanghai lockdown (Liu et al., 2024b).
3.3.3 AOD time series over the PRD
Time series of the monthly mean MAIAC AOD and CESM-simulated AOD over the PRD are presented in Fig. 8. The time series of the simulated monthly mean AOD show a very regular pattern with peak values in March/April and minima in July of most years. The simulated monthly mean AOD peak values increased substantially between 2011 and 2016 and between 2018 and 2021, with much lower values in 2017, 2018, and 2022. Overall, the peak AOD was higher during 2013–2016 than after 2016. The similar behavior of observed and simulated data indicates the influence of meteorological effects.
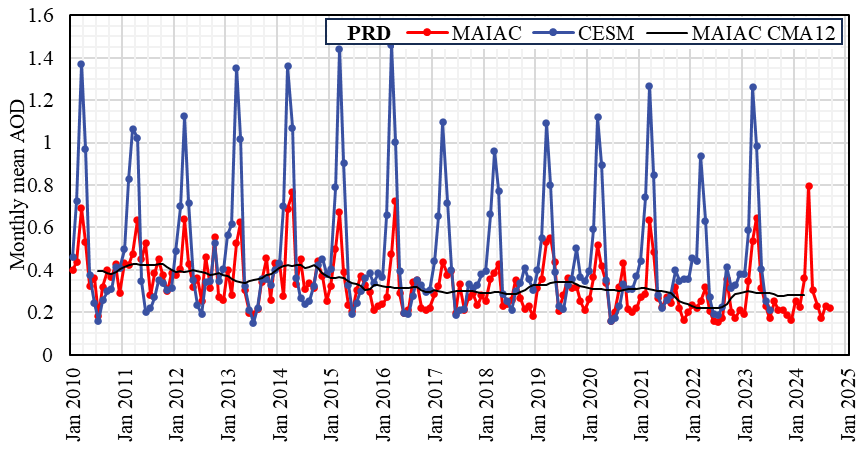
The peak values in the observed and simulated AOD data occur in about the same months, but the simulated maxima are much higher than those of the observations. A reason for this discrepancy may be the large influence of smoke on aerosols in the PRD (Zhang et al., 2010; Liu et al., 2021), which is treated as anthropogenic emissions in the CESM model and, thus, fixed at the 2010 level (Sect. 2.3). The data in Fig. 8 show that the simulated AOD in March 2010 was substantially higher than the observed AOD, suggesting that the initial anthropogenic emission estimates were high.
Between the peaks, the simulations traced the observations reasonably well. In particular, the summer minima are well reproduced, whereas the patterns during the autumn are similar but the simulated AOD is higher. However, during the period from June 2021 to February 2023, the simulated values show a clearly increasing tendency, whereas the satellite-derived AOD was substantially smaller overall and, in particular, the maxima were much smaller than in other years. This clearly indicates that the emissions during this period were strongly reduced with respect to other years.
Secondary peaks are often observed in October, except in 2010 and 2011, and are shifted to September in later years and to August in 2019 and 2020. These peaks also occur in both datasets, but they are relatively larger in the observations than in the simulations.
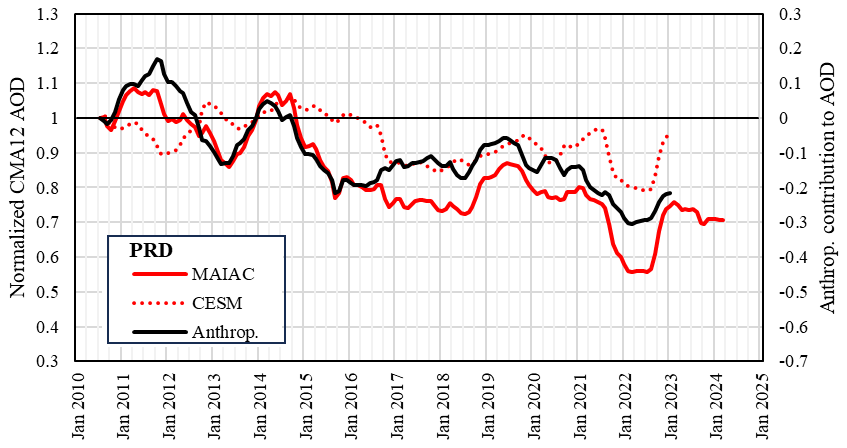
Time series of the normalized CMA12 of simulated and observational AOD data over the PRD are presented in Fig. 9, together with the anthropogenic contributions to AOD. The model time series show that the meteorological effects on AOD were initially favorable but that anthropogenic effects were large and unfavorable, which led to an increase in AOD by up to about 8 % throughout 2011. In the first half of 2012, opposing meteorological and anthropogenic effects resulted in a net-zero effect on AOD. Anthropogenic effects changed to favorable, which resulted in a minimum AOD in May 2013 (Fig. 9; the monthly mean data in Fig. 8 show a minimum in both the observed and simulated data in July). After May 2013, the anthropogenic effects gradually changed to unfavorable, resulting in the high AOD observed throughout 2014. From September 2014, the anthropogenic effects changed to favorable, AOD decreased (during 1 year) to a minimum in September 2015, and the anthropogenic effects then gradually became less favorable. Between May 2013 and mid-2016, the meteorological effects were small and fluctuated between favorable and unfavorable, thus modifying the AOD. However, from 2016, the meteorological effects were favorable, with a reduction in AOD of up to 14 % in the winter of 2018. Favorable meteorological and anthropogenic effects of similar magnitude resulted in a gradual decrease in AOD between the end of 2015 and mid-2018. Between July 2018 and July 2019, AOD increased substantially due to both meteorological and anthropogenic effects changing to less favorable. From August 2019, AOD decreased due to anthropogenic effects, and a strong AOD minimum was observed in 2021/2022 that is attributed to meteorological effects, as indicated by both the monthly mean and filtered time series for the simulated AOD, reinforced by anthropogenic effects. The monthly mean observational data in Fig. 8 show that AOD in the second half of 2021 and throughout 2022 was substantially lower than in 2020 and 2023; likewise, the simulated AOD shows that both the peak value in March 2022 and the summer minimum AOD in 2022 were lower than in other years. In conclusion, the large AOD minimum in 2021/2022 was caused by contributions from both meteorological and anthropogenic effects between September 2021 and October 2022.
The CMA12 of the MAIAC observational AOD data shows a broad maximum in 2014 which, compared to the situation over the YRD, could not be caused by an anomalous peak in 2014 (see Fig. 8 and Fig. 6). Rather, the monthly mean AOD was high overall in the second half of 2013 and in 2014, with month-to-month variations. The comparison with the centered moving average of the simulated AOD, normalized to 2010 (Fig. 9), shows that AOD in 2011/2012 would have been substantially higher if it would not have been reduced by up to 10 % due to favorable meteorological conditions.
3.3.4 AOD time series over HNB
The time series of the monthly mean model-simulated AOD over HNB in Fig. 10 show a regular pattern with distinct peaks in March and minima in the summer centered around July. The simulated monthly mean AOD peak values vary by more than 15 %: an increase between 2011 and 2013, a decrease between 2015 and 2018 when the simulated peak value is lowest, and an increase between 2018 and 2020. Furthermore, in 2014, the minimum AOD was substantially higher than in other years and lasted longer, from May to December. Likewise, minima in 2018 and 2019 were higher and lasted longer than in other years. These variations in the simulated AOD show the large influence of the meteorological conditions on AOD.
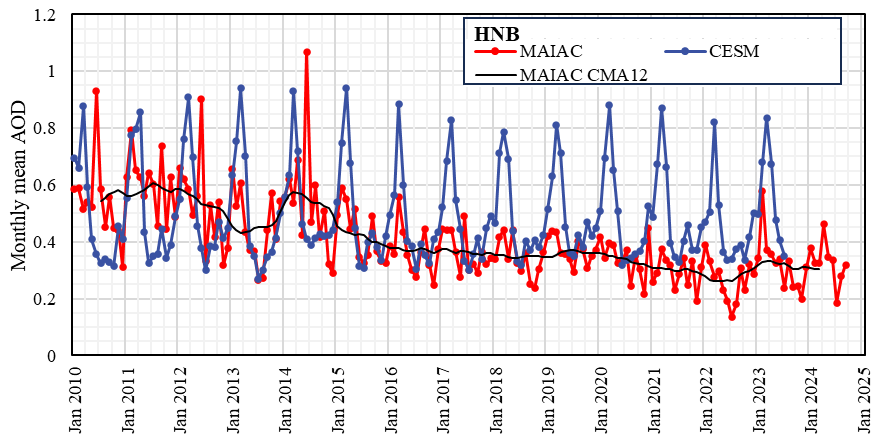
In contrast to the model simulations, there is no regular pattern in the observed monthly mean MAIAC AOD data. Three strong and distinct peaks were observed, all in June instead of March, in 2010 (0.93), in 2012 (0.90), and in 2014 (1.07). AOD maxima in March occur during the 2015–2019 period; however, overall, the variations in the observational data are not regular (as in the simulated data). The CMA12 was high (∼ 0.60) until February 2012 and again in early 2014, with a minimum in April 2013. This minimum reflects the clear decrease in the monthly mean AOD data from the secondary peak in March (0.61); to the lowest value in the first 5 years in July (0.27); and, finally, to a maximum in October (0.57). The October maximum was the start of a period with high AOD leading into the 2014 peak in June, whereafter AOD stayed relatively high until November. The 2013 minimum is quite well reproduced by the model simulations, except for the October peak. Furthermore, apart from the June peak values in the observed data in 2010, 2012, and 2014, the simulated AOD peak values are higher than those observed, which makes it hard to reach quantitative conclusions about the relative contributions from meteorological and anthropogenic factors from the comparison of monthly mean data.
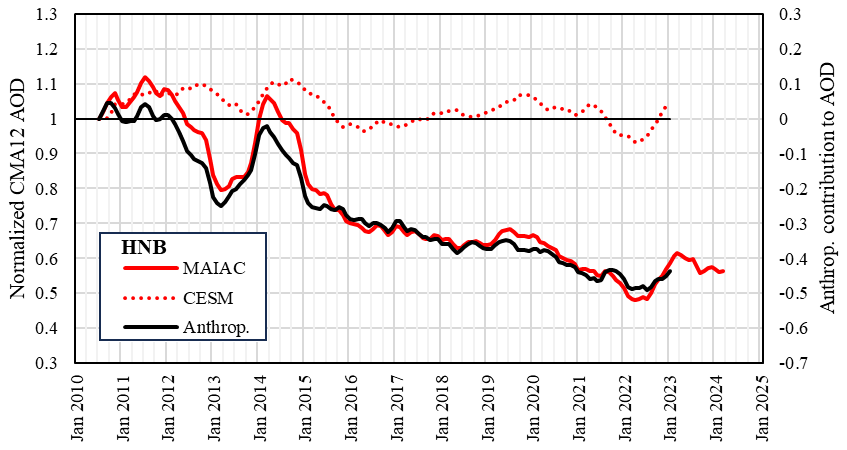
The normalized CMA12 time series of the model data in Fig. 11 show that the meteorological effects on AOD were unfavorable during the first 6 years (up to 10 %) and much smaller thereafter, fluctuating between favorable and unfavorable. The initially unfavorable meteorological contributions resulted in an AOD increase in 2011, with only a small anthropogenic contribution. In the second half of 2014, unfavorable meteorological effects were of a similar magnitude to the favorable anthropogenic effects, which resulted in a net-zero effect on AOD.
The AOD decreased overall from 2015 until the end of 2018, which was mostly attributable to anthropogenic influences, the effect of which was modified by slowly changing meteorological effects from slightly unfavorable to slightly favorable (Fig. 11). During 2019, the meteorological effects changed to more unfavorable (up to about 7 %), offsetting anthropogenic effects and, thus, causing a small increase in the observed AOD. A relatively fast AOD decrease occurred between July 2019 and the summer of 2021. During the second half of 2021, the anthropogenic effect became less favorable, but the meteorological effect changed faster to more favorable, which effectively resulted in a small AOD decrease. In early 2022, this was followed by a period when the monthly mean AOD (Fig. 10) decreased from 0.39 in January to a minimum of 0.14 in July before increasing to a peak value of 0.58 in February 2023, the highest value since 2015. The low AOD in 2022 was, in part, due to the favorable meteorological conditions, while, as Fig. 11 shows, anthropogenic effects contributed to the decrease in the first half of 2022. The anthropogenic and meteorological contributions were similar during this period of low AOD. From August 2022, both effects were less favorable, leading to an increase in AOD.
3.3.5 AOD time series over the SCB
Time series of the monthly mean MAIAC AOD and CESM-simulated AOD over the SCB are presented in Fig. 12. The time series of the model-simulated AOD shows a regular pattern with distinct peaks in March and a minimum in July and (in most years) a second minimum in September. The simulated monthly mean AOD peak values are similar between 2010 and 2017, with some variation, whereas they are 10 %–16 % lower from 2018. The simulated monthly mean AOD values are initially smaller than the observed monthly mean MAIAC AOD values. In 2015 and 2016, the simulated and observed peak values match well; they also match well in 2020, 2021, and 2023, with smaller observed values in the years between 2016 and 2020 and in 2022. The MAIAC AOD pattern was less regular than that of the simulations, with distinct peaks visible not only in any of the winter months (December–March) but also in June and September, especially during the 2010–2014 period when AOD was high. Between 2018 and 2022, the MAIAC AOD was lower, and it peaked during the whole winter period.
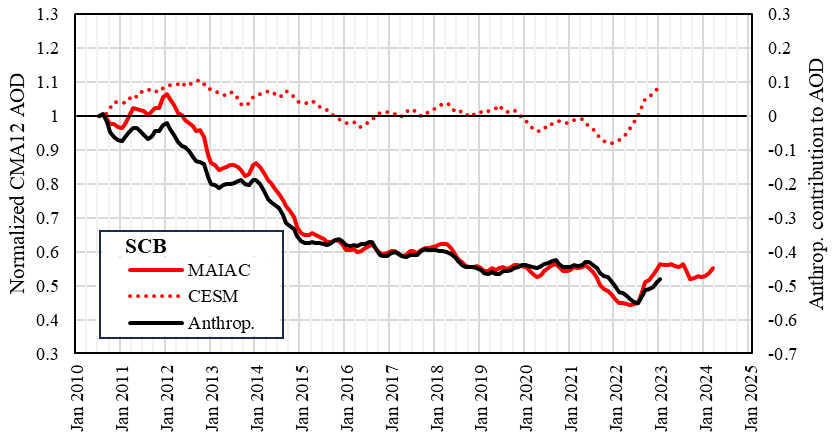
Normalized CMA12 time series of the observed and simulated AOD over the SCB are presented in Fig. 13. The model time series show that the meteorological effect on AOD was up to 10 %: unfavorable during 2010–2015, small and mostly unfavorable between 2016 and 2020, favorable after 2020 (up to 9 %), and again unfavorable from July 2022. The unfavorable meteorological effects offset the favorable anthropogenic effects during 2010 and 2011, which resulted in small net changes in AOD and a maximum by the end of 2011. Accelerated emission reduction resulted in a fast decrease in AOD during the period from 2012 to 2014, reinforced by the decrease in unfavorable meteorological effects.
Between 2015 and 2019, a smaller reduction was achieved due to anthropogenic effects, with some modifications attributed to meteorological influences, such as the small increase in early 2018 and the decrease later that year. In contrast, during 2021 and 2022, AOD decreased substantially to a minimum in the summer of 2022. The monthly mean AOD data in Fig. 12 show the lower AOD between May 2021 and the autumn of 2022, with a very low value in June 2022 (0.15). This decrease was initially reinforced by favorable meteorological effects that were most effective in the first half of 2022, as Fig. 13 shows. The rebound in the second half of 2022 was reinforced by unfavorable meteorological effects.
In Sect. 3.3, the AOD time series are discussed for each of the five regions separately. Below, results common to two or more regions are discussed, for different periods of time with distinct features. Meteorological events influencing AOD variations are indicated, but a detailed analysis is outside the scope of the current study and will be presented in a separate publication. In this study, both monthly mean and low-pass-filtered monthly mean (CMA12) AOD data have been used. Monthly mean time series show more detail than the CMA12 time series with respect to the start and end times of events affecting the evolution of AOD. The monthly data points in CMA12 time series represent the average over 12 months around that data point and smoothed short-term features. CMA12 time series clearly show tendencies that are difficult to determine in monthly mean time series due to the monthly and seasonal variations.
4.1 Overall effects of the emission reduction policies on aerosol properties
Satellite measurements of AOD over China show that emission reduction policies were successful with respect to reducing the aerosol concentrations between 2010 and 2018, with an additional but smaller reduction toward the end of the study period, in 2024. Over the NCP, AOD in 2024 had been reduced to 68 % of its value in 2010; over the YRD, AOD had been reduced to 62 %; over the PRD AOD had been reduced to 70 %; over HNB, AOD had been reduced to 55 %; and over the SCB, AOD had been reduced to 57 % (CMA12 values). These reductions are larger than those reported by de Leeuw et al. (2023) for the period from July 2011 to February 2020. The current study covers a longer period, with larger reductions indicating that AOD was further reduced after February 2020. However, it should be kept in mind that a new dataset and different methods were used in the current study, which may have influenced the results.
Table 2Anthropogenic (Anthrop.) and meteorological (Meteor.) contributions to AOD variation over each of the five study areas for the whole study period and the periods before and after 2018.
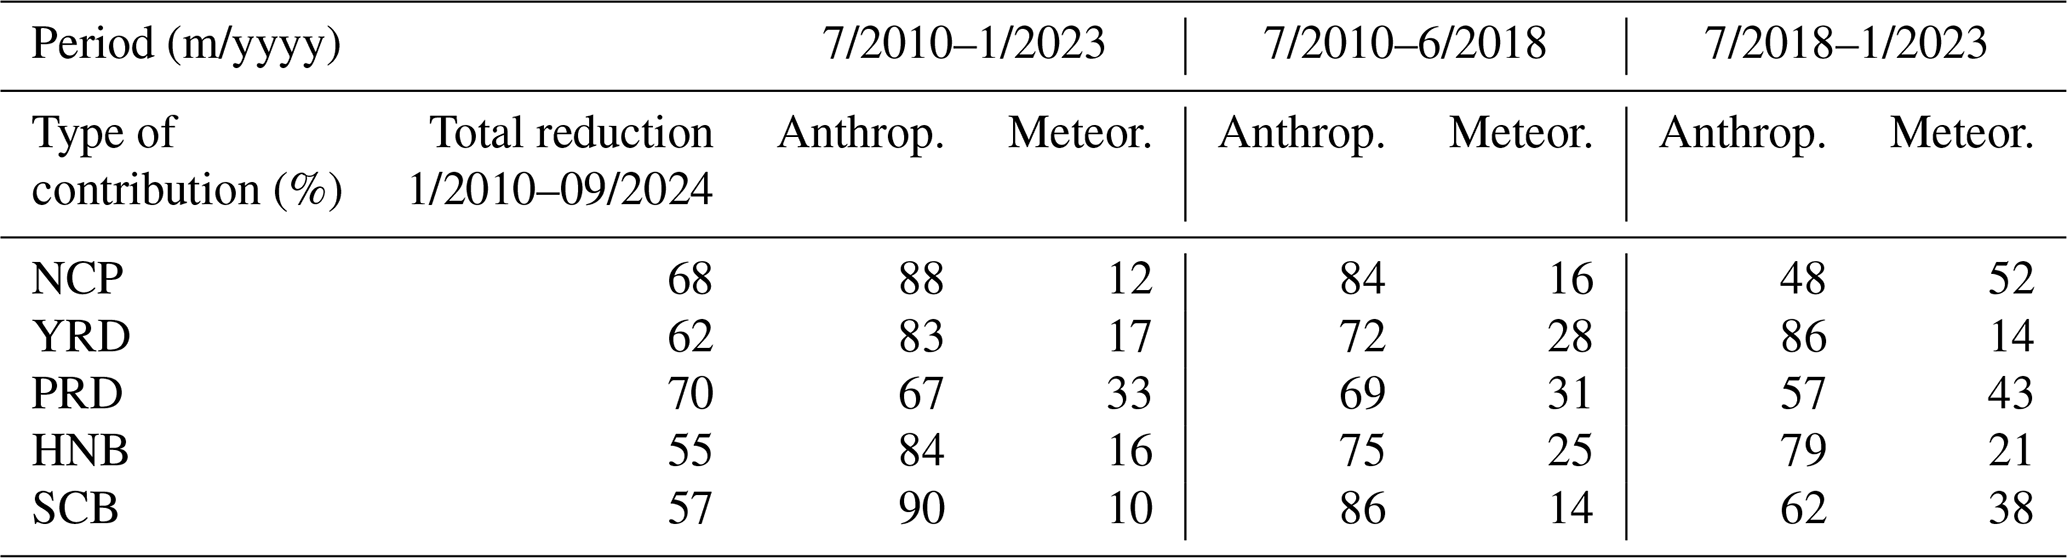
The data further show that AOD differences between the five regions have become smaller. In 2010, AOD over the five regions ranged from 0.40 (PRD) to 0.53 (YRD and HNB), whereas in 2024, AOD over the five regions ranged from 0.29 to 0.33 (see Fig. 3). However, a closer look shows that AOD did not vary in a monotonous manner and that substantial variations occurred, as revealed after low-pass filtering (CMA12). The AOD not only varied between the five different regions, but AOD variations within each region also occurred at different times (as illustrated in Fig. 3). Clearly, not only did emission reduction policies and other anthropogenic factors (economic development, urbanization, etc.) influence AOD, but meteorological factors also played a role. This is further illustrated by the analysis of anthropogenic and meteorological contributions to AOD (see de Leeuw et al., 2023; Sect. 2.4.2) applied to the C6.1 dataset. Because CESM data (available until July 2023) are used, the analysis was made for the period from January 2010 to July 2023, as well as the periods before and after 2018. Due to the CMA12 filtering, the period was reduced to July 2010 to January 2023. The results in Table 2 show that meteorological contributions vary between 12 % (NCP) and 33 % (PRD) over the whole period, whereas they are larger overall over shorter periods, between 14 % (SCB) and 31 % (PRD) for the period until 2018 (Period 1) and 14 % (YRD) to 52 % (NCP) for the period after 2018 (Period 2). The data further show that the meteorological contributions during Period 2 were substantially larger than during Period 1 over the NCP (52 % vs. 16 %), the PRD (43 % vs. 31 %), and the SCB (38 % vs. 14 %), whereas they were smaller over the YRD (14 % vs. 28 %) and HNB (21 % vs. 25 %). In view of the large AOD increase between mid-2018 and January 2021 over the YRD and HNB (Fig. 3), the smaller meteorological contributions in Period 2 compared with Period 1 may be surprising; however, the data in Fig. 3 also show the much higher AOD over these areas during extended periods in 2011 and 2014, with clear meteorological influences for the YRD (as shown in Fig. 7) and for HNB (Fig. 11), which may have resulted in relatively large meteorological contributions during Period 1. When we isolate the period mid-2018 to January 2021, we find that the meteorological contributions were 33 % over the YRD and 32 % over HNB.
The data in Table 2 show that the overall AOD reduction during the study period is mainly due to anthropogenic effects, most likely emission reduction policies. However, meteorological effects are substantial, and their importance seems to increase as AOD becomes smaller. Their magnitude depends on the period analyzed and is connected with certain meteorological conditions. This will be further discussed in Sect. 4.2 (before 2018) and Sect. 4.3 (after 2018).
In addition to the differences between the periods before and after 2018, the monthly mean MAIAC and model AOD values (Figs. 4, 6, 8, 10, and 12) show that, at the beginning of the study period (2010–2016), when AOD was high, the patterns within a region were different from those at the end (2016–2024), when AOD had substantially decreased. Before 2016, AOD peaks were observed over different areas and in different months than after 2016.
The high AOD peaks observed over northern, eastern, and central China (Sect. 3.1) occurred mostly during the beginning of the study period, and those in June are attributable to emissions from agricultural straw burning (see Liu et al., 2020a, for a map of straw burning locations). The intensive implementation of the ban on open crop straw burning between 2013 and 2018 resulted in a declining trend in PM2.5 emissions in eastern and central China (Huang et al., 2021), which may explain why such high AOD maxima are not observed in June during later years. During these later years, elevated AOD peaks are observed over the PRD in the spring and are attributed to the transport of biomass-burning plumes from Indochina due to specific weather patterns (Xue et al., 2025).
The aerosol reduction, together with the occurrence of anomalous meteorological situations (Wang and He, 2015; Yin et al., 2024; Yin et al., 2017), may have resulted in changes in aerosol properties across different regions, such as those observed in Shanghai (Wang et al., 2024) and Beijing (Li et al., 2021). In particular, variations in emissions of trace gases such as SO2, NO2, and organic vapors, which are aerosol precursor gases, influence aerosol composition (Zhang et al., 2015; Geng et al., 2017, 2019; Li et al., 2021). These aforementioned authors show that the aerosol composition changed during the periods that they studied. In particular, Jing et al. (2025) discuss the evolution of tropospheric aerosols over Wuhan during a period similar to that used in the current study (2010–2024). Using a comprehensive suite of data, Jing et al. (2025) indicate aerosol chemistry as a key factor for the evolution of aerosol properties and illustrate this using examples and case studies.
Aerosol chemistry influences the optical and physical properties of aerosols and, thus, may be a major factor leading to the different AOD patterns observed during the beginning and the end of the study period. The model simulations were made with fixed emissions and, therefore, cannot reproduce this situation. In future studies, changes in aerosol properties in response to reduced emissions of precursor gases and associated chemical processes need to be taken into account.
4.2 AOD reduction over different regions between 2010 and 2018 and the influences of anomalous meteorological situations
The AOD reduction in 2015–2018 can be attributed to the implementation of the 2013–2017 Clean Air Action Plan (Feng et al., 2019; Zhang et al., 2019b), although with variations due to meteorological effects and different tendencies between the five regions. The AOD reduction achieved between 2015 and 2018 was smaller than that in earlier years, i.e., between the summers of 2011 and 2013, except over the NCP where AOD decreased monotonously between December 2011 and May 2018. Over the SCB, most of the AOD reduction was achieved during two episodes between January 2012 and February 2015, in spite of unfavorable meteorological conditions and a year (2013) in which the anthropogenic reduction was discontinued. The accelerated decline over the SCB is attributed to the implementation of stricter emission standards for thermal power plants in 2012 that required all coal power plants to reduce effluent NOx (counted as NO2) emissions to 100 mg m−3 or lower, except for some special unusual cases. This resulted in the quick installation of flue-gas denitration facilities, such as selective catalytic reduction equipment at coal-fired power plants (MEE and General Administration of Quality Supervision Inspection and Quarantine, 2011; Yan et al., 2023).
The interruption of the AOD decrease from the summer of 2013 until early 2015 is clearly visible in the monthly mean AOD data (Fig. 2), showing elevated AOD between July 2013 and December 2014, over the YRD, HNB, and PRD, with a much smaller AOD enhancement over the NCP. The interruption of the AOD reduction over the SCB in 2013 seems to be a combination of relatively high AOD in the summer/autumn of 2013 and the peak in January 2014, which resulted in a flat AOD curve in 2013 in the CMA12 time series. The high AOD over the YRD, HNB, and PRD resulted from elevated AOD, with respect to other years, in the second half of 2013 and most of 2014 (as discussed in Sect. 3.3.2). This anomalously high AOD may be attributable to a combination of anomalous meteorological situations, such as winter haze in the NCP (Yin et al., 2017) and summer drought (Wang and He, 2015). By the end of this situation, in early 2015, AOD was at a similar level to that in the summer of 2013.
Yin et al. (2017) ascribed the occurrence of severe winter haze events in the NCP in 2014 to a weakened East Asian winter monsoon (EAWM) and anticyclonic circulation. Wang and He (2015) ascribed the North China/Northeast Asia severe summer drought in 2014 to a weakened East Asian summer monsoon (EASM). A weak EASM results in increased aerosol concentrations over northern China (Feng et al., 2016). The effects of the El Niño–Southern Oscillation (ENSO) on air quality in southern China (i.e., south of the Yangtze River) were described by Wang et al. (2021): an anticyclonic circulation during El Niño events weakens the EASM, resulting in low AOD. In contrast, cyclonic circulation during La Niña events strengthens the EASM, resulting in high AOD. This may explain the stronger enhancement of AOD in the PRD, YRD, and HNB than in the NCP.
A similar situation to that in 2014 may have occurred in 2011, when anomalous weather was reported during winter/spring (Sun and Yang, 2012; Jin et al., 2013). The monthly mean AOD data show that AOD was high and meteorological effects were unfavorable. The CMA12 time series show that the AOD decreased between the summer of 2011 (YRD, HNB, and PRD) or January 2012 (NCP and SCB) and 2013. The fast decrease in AOD between the summers of 2011 and 2013 may, thus, have been due to a combination of meteorological effects and emission reduction in response to the implementation of environmental regulations. The AOD over the NCP and YRD was high in 2011, and both the meteorological and anthropogenic effects were unfavorable, but the latter changed to favorable in 2013.
4.3 AOD variations after 2018 over different regions: the increasing importance of meteorological influences
The AOD observations and, in particular, the CMA12 time series show that AOD declined until 2018 over all regions, except over the SCB. However, from the summer of 2018, AOD increased substantially during 1 year over the YRD, PRD, and HNB but not over the NCP or the SCB. The meteorological effects increased to less favorable over the PRD and to more unfavorable over the NCP, YRD, and HNB. Thus, part of the AOD increase may be attributable to meteorological effects. However, over the NCP, YRD, and PRD, the anthropogenic effects also changed to less favorable during this period, while a slight decrease was observed over HNB and the SCB, where the AOD enhancements were small (HNB) or did not occur (SCB). It is further noticed that the increase in the meteorological effects to more unfavorable was substantially larger over the NCP than over other regions, but the anthropogenic effect continued to change to more favorable in 2018, while it had already changed to less favorable over the YRD and PRD. Hence, the change in the timing of the events and the magnitudes of the respective changes resulted in substantially different AOD variations. In particular, there was no AOD maximum over the NCP in 2019 due to the balance between anthropogenic and meteorological effects. Over the PRD, both types of effects changed to more unfavorable, thus reinforcing each other. Over the YRD, the very small meteorological effect caused minor AOD variations on top of strong anthropogenic effects. The interplay between variations in anthropogenic and meteorological effects influenced the effectiveness of the 2018–2020 Three-Year Action Plan for Winning the Blue Sky Defense Battle.
In Sect. 4.1, the change in aerosol properties after 2016 is attributed to a changing atmospheric composition in response to emission reductions, indicating aerosol chemistry as a key factor, together with the occurrence of anomalous meteorological situations. Information on the latter is provided by the model simulations. As discussed in Sect. 3.3, the simulated monthly mean AOD time series show distinct patterns with a single maximum in a specific month, often accompanied by a secondary peak with lower AOD and a minimum covering a longer period. The patterns and peak months varied between regions, and the maximum and minimum AOD values in each region varied from year to year. Distinct changes are observed in the variation in the peak values over the YRD and HNB in 2016, over the PRD in 2017, and over the SCB in 2018. These years mark the start of the period when peak AOD values were lower than in earlier years. The normalized CMA12 of simulated AOD time series in Sect. 3.3 show that, over the YRD, HNB, and PRD, these years coincide with changes in meteorological effects, from favorable to neutral over the YRD and HNB and from neutral to favorable over the PRD. In each case, these new situations persisted for several years. It is noted that an El Niño event occurred during 2015/2016, followed by La Niña events during 2016/2017 and 2017–2018 (Zhang et al., 2019a). The effects of El Niño and La Niña events on AOD are indicated in Sect. 4.2.
The above discussion shows the occurrence of substantial differences between the meteorological effects over the YRD, PRD, HNB, and SCB. Over the NCP, the meteorological effects were generally unfavorable, resulting in a smaller AOD decrease between 2012 and 2019, with episodical increases in 2011, 2014, and 2015/2016, while AOD did not change as a result of the cancellation of opposing effects of similar magnitude during 2018–2020. These cases illustrate the increasing importance of meteorological effects as AOD becomes smaller: in 2014 and 2019, the meteorological effects were similar, but they were relatively more important in 2019.
Over the YRD, the meteorological effects were more variable than over the NCP, with stronger unfavorable influences in 2011 and 2014/2015, when they reinforced unfavorable anthropogenic effects, and during 2019–2022, when they reinforced strong anthropogenic effects, resulting in a strong increase in AOD. Over the PRD, the meteorological effects were mostly favorable, resulting in a substantially lower AOD than due to anthropogenic effects alone. In particular, the strong 2022 minimum benefitted from reinforcement by favorable meteorological effects. Over HNB and the SCB, the meteorological effects were unfavorable during the first years of the study period, when they reduced the effect of anthropogenic efforts, and small and variable thereafter. However, they did have a favorable effect on AOD during the 2022 minimum.
4.4 Contribution of the economic slowdown to the strong AOD decrease in 2022
In contrast to the enhanced AOD events in 2011, 2014, and 2019 discussed above, a strong reduction occurred in 2022, which was preceded by a small anomaly in 2021 over the YRD and HNB. As described in Sect. 3.3, the strong reduction in 2022 was clearly observed in the monthly mean data and was mainly attributed to anthropogenic effects with a small contribution from meteorological effects. The year 2022 was anomalously warm, with heat waves and drought, with a specific meteorological situation (Xu et al., 2024), including an extended La Niña event that persisted from 2020 to 2023 (Iwakiri et al., 2023), which may have influenced the aerosol properties in a variety of ways. Changes in large-scale circulation may affect transport pathways, the evolution of the atmospheric boundary layer influences local and regional transport as well as ventilation, changes in relative humidity influence aerosol optical properties, and air temperature influences the formation of new aerosol particles. Moreover, the occurrence of La Niña may have caused an increase in aerosol concentrations, whereas AOD is reduced during heat wave events, with downstream regions experiencing increased AOD (Tseng et al., 2024). However, the 2022 minimum is mainly attributable to anthropogenic influences, i.e., the economic slowdown (Liu et al., 2024b) resulting in reduced production and transport across a large part of China when sea harbors were closed and export stagnated (Wang and Su, 2025). As discussed in Sect. 3.3, favorable meteorological effects contributed to reinforce this minimum in the SCB, HNB, and (especially) the PRD.
Satellite-derived monthly mean time series of AOD over five representative regions in China were presented for the period from January 2010 to September 2024. AOD variations, both temporal variations within a region and differences between the five regions, were discussed, and contributions from anthropogenic and meteorological factors were analyzed based on comparison with model simulations.
The time series confirm the effective reduction in AOD over China, which is attributed to the implementation of a series of policy measures aimed at the reduction in emissions of aerosols and trace gases to improve air quality. However, meteorological effects have a large influence on the aerosol load over China, and their importance increases as AOD decreases. In particular, in recent years, the important role of meteorological factors has become evident, for instance, from the large increase in AOD over the YRD and, to a smaller extent, over HNB and the PRD between 2018 and 2021. During this period, the potential decrease in AOD over the NCP was effectively canceled due to unfavorable meteorological effects. The results presented lead to the following conclusions:
-
Emission reduction policies have resulted in an effective decrease in AOD over China, in particular between 2015 and 2018 in response to the 2013–2017 Clean Air Action Plan. However, the 2018–2020 Three-Year Action Plan for Winning the Blue Sky Defense Battle and the 14th Five-Year Plan (2021-2025) have been less effective – the overall reduction in AOD between 2018 and 2024 was substantially smaller than in the previous period.
-
The effectiveness of the anthropogenic effects initially decreased during different periods of 1–2 years between 2018 and 2024, over the NCP, YRD, and PRD, followed by a stronger AOD reduction until mid-2022 and an increase in January 2023 to a level that was similar to that by the end of 2021. This resulted in an AOD in January 2023 that was reduced with respect to that in 2018, due to only anthropogenic effects. This reduction is attributed to an emission reduction which, however, was smaller than in 2013–2017. The strong AOD decrease in 2022 is shown as an anthropogenic effect, but it did not happen in response to emission reduction policies. Rather, this is a short-term effect that is mainly attributed to Shanghai's lockdown (Liu et al., 2024b), which resulted in stagnation of the economy in large parts of China and associated activities such as transport and energy production. The accelerated decrease in AOD over the SCB before 2015 is attributed to the implementation of strict emission standards for thermal power plants in 2012.
-
Meteorological effects have a substantial influence on AOD, which increased as AOD decreased. Unfavorable meteorological effects have been shown to reduce the effects of emission reduction on AOD, whereas favorable meteorological effects can reinforce the emission reduction effects. Meteorological effects contributed to the AOD increase over several regions in 2018 and 2019 and affected the decrease in 2022, thus counteracting emission reduction measures implemented as part of the 2018–2020 Three-Year Action Plan for Winning the Blue Sky Defense Battle and the 14th Five-Year Plan (2021-2025) during the 2018–2024 period.
-
Very high AOD was observed in 2011 and 2014 that may, in part, be caused by anomalous meteorological situations. The high AOD in 2014 has been suggested to be due to anomalous circulation associated with the effects of El Niño/La Niña and the strength of the East Asian summer and winter monsoon. These effects have become increasingly important in recent years and are a major reason for the slowdown of the AOD reduction since 2018.
-
AOD variations show distinctly different patterns during the periods before and after 2016, likely due to changes in aerosol composition and optical and physical properties in response to the reduction in aerosol precursor gases.
The results were obtained using new experimental data, i.e., the new MAIAC C6.1 AOD data that replace and improve upon MAIAC C6 and extend the time series beyond 2021. The extended time series reveal new phenomena and new insights, as explained in detail in Sect. 3. The discussion in Sect. 4 focuses on features common to the five areas, as well as differences across them. These new phenomena include the substantial increase around 2019 over the YRD, the PRD, and (to a lesser extent) over HNB; a clear minimum in 2022 over all areas with a strong recovery in 2023; decreasingly favorable anthropogenic contributions over the NCP in 2019–2021 and over the YRD in 2018–2019; and the stagnation of the AOD decrease over the PRD due to the declining favorable contributions between 2016 and 2019. Furthermore, the comparison between the AOD time series between 2010 and 2016 and in later years shows different patterns between these periods, both in the observations and the simulations. In view of the length of the current paper, a detailed analysis and discussion of these new phenomena will be presented in a separate publication.
The objectives stated in Sect. 1 have been addressed throughout this paper. Data presented and discussed show that the flattening of the AOD reduction between 2017 and 2021 suggested by de Leeuw et al. (2023) was a consequence of the offset of AOD reduction by unfavorable meteorological effects (Sects. 3.3.1 and 4.3) (Objective 1), as also observed during earlier periods. The anomalous AOD in the winter of 2014 over the YRD, HNB, and PRD has been explained by large-scale meteorological effects influencing AOD, in particular by ENSO and East Asian winter and summer monsoon (Sect. 4.2) (Objective 2). Relations between anomalous AOD and meteorological situations have been discussed in Sect. 4.2, 4.3, and 4.4 (Objective 4). Changing AOD patterns have been reported and suggested to be due to changing atmospheric composition in response to selective emission reduction policies (Sect. 4.1) and the occurrence of anomalous meteorological situations (Sect. 4.3) (Objective 5). Monthly mean AOD data were used throughout the paper to identify the occurrence of specific events (Objective 3).
In summary, emission reduction policies have been effective with respect to reducing AOD, although with many deviations due to meteorological effects. Phenomena such as ENSO, the East Asian winter and summer monsoon, and heat waves have been reported to influence AOD and PM2.5 via their effects on large-scale circulation, regional transport, and local meteorology. AOD and PM2.5 are different measures for aerosol concentrations but are not comparable. Qi et al. (2022) report that the influences of meteorology changes on AOD trends are larger than those on surface PM2.5. Hence, findings of meteorological effects on AOD reported in the current study may be significantly different from findings from studies on meteorological effects on PM2.5. The importance of the current study is the use of AOD in climate studies on interaction with solar radiation, for instance, for meteorological purposes, such as effects on heat waves (Wu et al., 2021) and local meteorology (Zhang et al., 2018), or application in solar energy (Lin et al., 2023).
The data can be accessed by contacting the corresponding authors. MAIAC data are freely available from the NASA's Land Processes Distributed Active Archive Center (https://lpdaac.usgs.gov/data/, last access: 24 February 2025).
All authors contributed to the study's conception and design. All authors read, reviewed, and approved the final manuscript. The study was designed and discussed by GdL, CFan, XY, and HK. CFan and JD collected data. HK and CFang contributed to the modeling. CFan, JD, GdL, and XY wrote the first paper draft, which was finalized by contributions from ZL, YZ, HK, and CFang.
The contact author has declared that none of the authors has any competing interests.
Publisher's note: Copernicus Publications remains neutral with regard to jurisdictional claims made in the text, published maps, institutional affiliations, or any other geographical representation in this paper. While Copernicus Publications makes every effort to include appropriate place names, the final responsibility lies with the authors.
The study contributes to the ESA/MOST cooperation project Dragon 6 “Air Quality Monitoring and Analysis in Populous areas in China” (AQMAP).
This research has been supported by the National Natural Science Foundation of China (grant no. 42305151), the National Key R&D Program of China (grant no. 2023YFB3907405), and the Chinese Academy of Sciences President's International Fellowship Initiative (grant no. 2025PVA0014).
This paper was edited by Stelios Kazadzis and reviewed by four anonymous referees.
Bacmeister, J. T., Wehner, M. F., Neale, R. B., Gettelman, A., Hannay, C., Lauritzen, P. H., Caron, J. M., and Truesdale, J. E.: Exploratory High-Resolution Climate Simulations using the Community Atmosphere Model (CAM), J. Climate, 27, 3073–3099, https://doi.org/10.1175/JCLI-D-13-00387.1, 2014.
Banks, A., Kooperman, G. J., and Xu, Y.: Meteorological Influences on Anthropogenic PM2.5 in Future Climates: Species Level Analysis in the Community Earth System Model v2, Earths Future, 10, e2021EF002298, https://doi.org/10.1029/2021EF002298, 2022.
de Leeuw, G., Sogacheva, L., Rodriguez, E., Kourtidis, K., Georgoulias, A. K., Alexandri, G., Amiridis, V., Proestakis, E., Marinou, E., Xue, Y., and van der A, R.: Two decades of satellite observations of AOD over mainland China using ATSR-2, AATSR and MODIS/Terra: data set evaluation and large-scale patterns, Atmos. Chem. Phys., 18, 1573–1592, https://doi.org/10.5194/acp-18-1573-2018, 2018.
de Leeuw, G., Fan, C., Li, Z., Dong, J., Li, Y., Ou, Y., and Zhu, S.: Spatiotemporal variation and provincial scale differences of the AOD across China during 2000–2021, Atmos. Pollut. Res., 13, 101359, https://doi.org/10.1016/j.apr.2022.101359, 2022.
de Leeuw, G., Kang, H., Fan, C., Li, Z., Fang, C., and Zhang, Y.: Meteorological and anthropogenic contributions to changes in the Aerosol Optical Depth (AOD) over China during the last decade, Atmos. Environ., 301, 119676, https://doi.org/10.1016/j.atmosenv.2023.119676, 2023.
de Leeuw, G., van der A, R., Bai, J., den Hoed, M., Ding, J., Guo, J., Li, Z., Zhang, Y., Fan, C., Qin, K., Sinnathamby, S., Safieddine, S., Varotsos, C., Xue, Y., Yin, Y., Zhang, Q., Zhang, X., Zhang, X., and Zhang, X.: Remote sensing of air pollutants in China to study the effects of emission reduction policies on air quality, J. Atmos. Sol.-Terr. Phy., 265, 106392, https://doi.org/10.1016/j.jastp.2024.106392, 2024.
Du, H., Li, J., Wang, Z., Chen, X., Yang, W., Sun, Y., Xin, J., Pan, X., Wang, W., Ye, Q., and Dao, X.: Assessment of the effect of meteorological and emission variations on winter PM2.5 over the North China Plain in the three-year action plan against air pollution in 2018–2020, Atmos. Res., 280, 106395, https://doi.org/10.1016/j.atmosres.2022.106395, 2022.
Emmons, L. K., Walters, S., Hess, P. G., Lamarque, J.-F., Pfister, G. G., Fillmore, D., Granier, C., Guenther, A., Kinnison, D., Laepple, T., Orlando, J., Tie, X., Tyndall, G., Wiedinmyer, C., Baughcum, S. L., and Kloster, S.: Description and evaluation of the Model for Ozone and Related chemical Tracers, version 4 (MOZART-4), Geosci. Model Dev., 3, 43–67, https://doi.org/10.5194/gmd-3-43-2010, 2010.
Fang, C., Zhu, B., Pan, C., Yun, X., Ding, D., and Tao, S.: Regional and Sectoral Sources for Black Carbon Over South China in Spring and Their Sensitivity to East Asian Summer Monsoon Onset, J. Geophys. Res.-Atmos., 125, e2020JD033219, https://doi.org/10.1029/2020JD033219, 2020.
Feng, J., Zhu, J., and Li, Y.: Influences of El Niño on aerosol concentrations over eastern China, Atmos. Sci. Lett., 17, 422–430, https://doi.org/10.1002/asl.674, 2016.
Feng, Y., Ning, M., Lei, Y., Sun, Y., Liu, W., and Wang, J.: Defending blue sky in China: Effectiveness of the “Air Pollution Prevention and Control Action Plan” on air quality improvements from 2013 to 2017, J. Environ. Manage., 252, 109603, https://doi.org/10.1016/j.jenvman.2019.109603, 2019.
Gelaro, R., McCarty, W., Suarez, M. J., Todling, R., Molod, A., Takacs, L., Randles, C. A., Darmenov, A., Bosilovich, M. G., Reichle, R., Wargan, K., Coy, L., Cullather, R., Draper, C., Akella, S., Buchard, V., Conaty, A., da Silva, A. M., Gu, W., Kim, G. K., Koster, R., Lucchesi, R., Merkova, D., Nielsen, J. E., Partyka, G., Pawson, S., Putman, W., Rienecker, M., Schubert, S. D., Sienkiewicz, M., and Zhao, B.: The Modern-Era Retrospective Analysis for Research and Applications, Version 2 (MERRA-2), J. Climate, 30, 5419–5454, https://doi.org/10.1175/jcli-d-16-0758.1, 2017.
Geng, G., Zhang, Q., Tong, D., Li, M., Zheng, Y., Wang, S., and He, K.: Chemical composition of ambient PM2.5 over China and relationship to precursor emissions during 2005–2012, Atmos. Chem. Phys., 17, 9187–9203, https://doi.org/10.5194/acp-17-9187-2017, 2017.
Geng, G., Xiao, Q., Zheng, Y., Tong, D., Zhang, Y., Zhang, X., Zhang, Q., He, K., and Liu, Y.: Impact of China's Air Pollution Prevention and Control Action Plan on PM2.5 chemical composition over eastern China, Sci. China Earth Sci., 62, 1872–1884, https://doi.org/10.1007/s11430-018-9353-x, 2019.
Geng, G., Liu, Y., Liu, Y., Liu, S., Cheng, J., Yan, L., Wu, N., Hu, H., Tong, D., Zheng, B., Yin, Z., He, K., and Zhang, Q.: Efficacy of China's clean air actions to tackle PM2.5 pollution between 2013 and 2020, Nat. Geosci., 17, 987–994, https://doi.org/10.1038/s41561-024-01540-z, 2024.
Glotfelty, T., He, J., and Zhang, Y.: Impact of future climate policy scenarios on air quality and aerosol-cloud interactions using an advanced version of CESM/CAM5: Part I. model evaluation for the current decadal simulations, Atmos. Environ., 152, 222–239, https://doi.org/10.1016/j.atmosenv.2016.12.035, 2017.
Gorelick, N., Hancher, M., Dixon, M., Ilyushchenko, S., Thau, D., and Moore, R.: Google Earth Engine: Planetary-scale geospatial analysis for everyone, Remote Sensing of Environment, 202, 18–27, https://doi.org/10.1016/j.rse.2017.06.031, 2017.
He, J., Zhang, Y., Glotfelty, T., He, R., Bennartz, R., Rausch, J., and Sartelet, K.: Decadal simulation and comprehensive evaluation of CESM/CAM5.1 with advanced chemistry, aerosol microphysics, and aerosol-cloud interactions, J. Adv. Model. Earth Sy., 7, 110–141, https://doi.org/10.1002/2014MS000360, 2015.
Hsu, N. C., Jeong, M.-J., Bettenhausen, C., Sayer, A. M., Hansell, R., Seftor, C. S., Huang, J., and Tsay, S.-C.: Enhanced Deep Blue aerosol retrieval algorithm: The second generation, J. Geophys. Res.-Atmos., 118, 9296–9315, https://doi.org/10.1002/jgrd.50712, 2013.
Hsu, N. C., Lee, J., Sayer, A. M., Kim, W., Bettenhausen, C., and Tsay, S.-C.: VIIRS Deep Blue Aerosol Products Over Land: Extending the EOS Long-Term Aerosol Data Records, J. Geophys. Res.-Atmos., 124, 4026–4053, https://doi.org/10.1029/2018JD029688, 2019.
Huang, G., Su, X., Wang, L., Wang, Y., Cao, M., Wang, L., Ma, X., Zhao, Y., and Yang, L.: Evaluation and analysis of long-term MODIS MAIAC aerosol products in China, Sci. Total Environ., 948, 174983, https://doi.org/10.1016/j.scitotenv.2024.174983, 2024.
Huang, L., Zhu, Y., Wang, Q., Zhu, A., Liu, Z., Wang, Y., Allen, D. T., and Li, L.: Assessment of the effects of straw burning bans in China: Emissions, air quality, and health impacts, Sci. Total Environ., 789, 147935, https://doi.org/10.1016/j.scitotenv.2021.147935, 2021.
Huang, X., Rhoades, A. M., Ullrich, P. A., and Zarzycki, C. M.: An evaluation of the variable-resolution CESM for modeling California's climate, J. Adv. Model. Earth Sy., 8, 345–369, https://doi.org/10.1002/2015MS000559, 2016.
Hurrell, J. W., Holland, M. M., Gent, P. R., Ghan, S., Kay, J. E., Kushner, P. J., Lamarque, J.-F., Large, W. G., Lawrence, D., Lindsay, K., Lipscomb, W. H., Long, M. C., Mahowald, N., Marsh, D. R., Neale, R. B., Rasch, P., Vavrus, S., Vertenstein, M., Bader, D., Collins, W. D., Hack, J. J., Kiehl, J., and Marshall, S.: The Community Earth System Model: A Framework for Collaborative Research, B. Am. Meteorol. Soc., 94, 1339–1360, https://doi.org/10.1175/BAMS-D-12-00121.1, 2013.
Iwakiri, T., Imada, Y., Takaya, Y., Kataoka, T., Tatebe, H., and Watanabe, M.: Triple-Dip La Niña in 2020–23: North Pacific Atmosphere Drives 2nd Year La Niña, Geophys. Res. Lett., 50, e2023GL105763, https://doi.org/10.1029/2023GL105763, 2023.
Ji, H., Shao, M., and Wang, Q. g.: Contribution of Meteorological Conditions to Inter-annual Variations in Air Quality during the Past Decade in Eastern China, Aerosol Air Qual. Res., 20, 2249–2259, https://doi.org/10.4209/aaqr.2019.12.0624, 2020.
Ji, W., Yang, L., Tian, X., Bilal, M., Pei, X., Zheng, Y., Lu, X., and Cheng, X.: Long-term validation and error analysis of DB and MAIAC aerosol products over bright surface of China, Atmos. Res., 297, 107106, https://doi.org/10.1016/j.atmosres.2023.107106, 2024.
Jin, D., Guan, Z., and Tang, W.: The Extreme Drought Event during Winter–Spring of 2011 in East China: Combined Influences of Teleconnection in Midhigh Latitudes and Thermal Forcing in Maritime Continent Region, J. Climate, 26, 8210–8222, https://doi.org/10.1175/JCLI-D-12-00652.1, 2013.
Jing, D., He, Y., Yin, Z., Huang, K., Liu, F., and Yi, F.: Evolution of tropospheric aerosols over central China during 2010–2024 as observed by lidar, EGUsphere [preprint], https://doi.org/10.5194/egusphere-2025-56, 2025.
Kang, H., Zhu, B., van der A, R. J., Zhu, C., de Leeuw, G., Hou, X., and Gao, J.: Natural and anthropogenic contributions to long-term variations of SO2, NO2, CO, and AOD over East China, Atmos. Res., 215, 284–293, https://doi.org/10.1016/j.atmosres.2018.09.012, 2019.
Kang, N., Kanike, R., Hu, K., Yu, X., and Yin, Y.: Long-term (2002–2014) evolution and trend in Collection 5 Level-2 aerosol products derived from the MODIS and MISR sensors over the Chinese Yangtze River Delta, Atmos. Res., 181, https://doi.org/10.1016/j.atmosres.2016.06.008, 2016.
Lamarque, J.-F., Emmons, L. K., Hess, P. G., Kinnison, D. E., Tilmes, S., Vitt, F., Heald, C. L., Holland, E. A., Lauritzen, P. H., Neu, J., Orlando, J. J., Rasch, P. J., and Tyndall, G. K.: CAM-chem: description and evaluation of interactive atmospheric chemistry in the Community Earth System Model, Geosci. Model Dev., 5, 369–411, https://doi.org/10.5194/gmd-5-369-2012, 2012.
Lauritzen, P. H., Ullrich, P. A., and Nair, R. D.: Atmospheric Transport Schemes: Desirable Properties and a Semi-Lagrangian View on Finite-Volume Discretizations, in: Numerical Techniques for Global Atmospheric Models, edited by: Lauritzen, P., Jablonowski, C., Taylor, M., and Nair, R., Springer Berlin Heidelberg, Berlin, Heidelberg, 185–250, https://doi.org/10.1007/978-3-642-11640-7_8, 2011.
Levy, R. C., Mattoo, S., Munchak, L. A., Remer, L. A., Sayer, A. M., Patadia, F., and Hsu, N. C.: The Collection 6 MODIS aerosol products over land and ocean, Atmos. Meas. Tech., 6, 2989–3034, https://doi.org/10.5194/amt-6-2989-2013, 2013.
Li, J., Gao, W., Cao, L., Xiao, Y., Zhang, Y., Zhao, S., Liu, Z., Liu, Z., Tang, G., Ji, D., Hu, B., Song, T., He, L., Hu, M., and Wang, Y.: Significant changes in autumn and winter aerosol composition and sources in Beijing from 2012 to 2018: Effects of clean air actions, Environ. Pollut., 268, 115855, https://doi.org/10.1016/j.envpol.2020.115855, 2021.
Lin, C.-A., Zhang, Y., Heath, G., Henze, D. K., Sengupta, M., and Lu, C.-H.: Improvement of aerosol optical depth data for localized solar resource assessment, Sol. Energy, 249, 457–466, https://doi.org/10.1016/j.solener.2022.11.047, 2023.
Liu, B., Wang, L., Zhang, L., Bai, K., Chen, X., Zhao, G., Yin, H., Chen, N., Li, R., Xin, J., Wang, Y., Sun, Y., and Hu, B.: Evaluating urban and nonurban PM2.5 variability under clean air actions in China during 2010–2022 based on a new high-quality dataset, Int. J. Digit. Earth, 17, 2310734, https://doi.org/10.1080/17538947.2024.2310734, 2024a.
Liu, T., He, G., and Lau, A. K. H.: Statistical evidence on the impact of agricultural straw burning on urban air quality in China, Sci. Total Environ., 711, 134633, https://doi.org/10.1016/j.scitotenv.2019.134633, 2020a.
Liu, Y., He, J., Lai, X., Zhang, C., Zhang, L., Gong, S., and Che, H.: Influence of Atmospheric Circulation on Aerosol and its Optical Characteristics in the Pearl River Delta Region, Atmos.-Basel, 11, 288, https://doi.org/10.3390/atmos11030288, 2020b.
Liu, Y., Lin, T., Hong, J., Wang, Y., Shi, L., Huang, Y., Wu, X., Zhou, H., Zhang, J., and de Leeuw, G.: Multi-dimensional satellite observations of aerosol properties and aerosol types over three major urban clusters in eastern China, Atmos. Chem. Phys., 21, 12331–12358, https://doi.org/10.5194/acp-21-12331-2021, 2021.
Liu, Z., Wang, Y., Huang, X., Zhang, Z., Lai, Q., and Li, M.: Assessment of national economic repercussions from Shanghai's COVID-19 lockdown, Humanities and Social Sciences Communications, 11, 1579, https://doi.org/10.1057/s41599-024-04100-3, 2024b.
LPDAAC: LPDAAC Releases MODIS Version 6.1 MAIAC Data Products, https://lpdaac.usgs.gov/news/lp-daac-releases-modis-version-61-maiac-data-products/ (last access: 24 February 2025), 2024.
Lyapustin, A. and Wang, Y. J.: MODIS/Terra+Aqua Land Aerosol Optical Depth Daily L2G Global 1km SIN Grid V061, NASA EOSDIS Land Processes DAAC [data set], https://doi.org/10.5067/MODIS/MCD19A2.061, 2022.
Lyapustin, A., Wang, Y., Korkin, S., and Huang, D.: MODIS Collection 6 MAIAC algorithm, Atmos. Meas. Tech., 11, 5741–5765, https://doi.org/10.5194/amt-11-5741-2018, 2018.
MEE and General Administration of Quality Supervision Inspection and Quarantine: Emission standards of air pollutants for thermal power plants, GB13223-2011, 2011.
Menut, L., Bessagnet, B., Cholakian, A., Siour, G., Mailler, S., and Pennel, R.: What is the relative impact of nudging and online coupling on meteorological variables, pollutant concentrations and aerosol optical properties?, Geosci. Model Dev., 17, 3645–3665, https://doi.org/10.5194/gmd-17-3645-2024, 2024.
NCAR: Community Earth System Model, National Center for Atmospheric Research [code], https://www.cesm.ucar.edu/models/releases (last access: May 2015), 2012.
NCAR/UCAR: MERRA2 Global Atmosphere Forcing Data, Atmospheric Chemistry Observations & Modeling/National Center for Atmospheric Research/University Corporation for Atmospheric Research, and Climate and Global Dynamics Division/National Center for Atmospheric Research/University Corporation for Atmospheric Research, Research Data Archive at the National Center for Atmospheric Research, Computational and Information Systems Laboratory [data set], https://doi.org/10.5065/XVAQ-2X07, 2018.
Neale, R. B., Gettelman, A., Park, S., Chen, C.-C., Lauritzen, P. H., Williamson, D. L., Conley, A. J., Kinnison, D., Marsh, D., Smith, A. K., Vitt, F. M., Garcia, R., Lamarque, J.-F., Mills, M. J., Tilmes, S., Morrison, H., Cameron-Smith, P., Collins, W. D., Iacono, M. J., Easter, R. C., Liu, X., Ghan, S. .J., Rasch, P. J., and Taylor, M. A.: Description of the NCAR Community Atmosphere Model (CAM 5.0) (No. NCAR/TN-486+STR), National Center for Atmospheric Research, Boulder, Colorado, USA, ISSN 2153-2397 (Print), ISSN 2153-2400 (Electronic), https://doi.org/10.5065/wgtk-4g06, 2012.
Proestakis, E., Amiridis, V., Marinou, E., Georgoulias, A. K., Solomos, S., Kazadzis, S., Chimot, J., Che, H., Alexandri, G., Binietoglou, I., Daskalopoulou, V., Kourtidis, K. A., de Leeuw, G., and van der A, R. J.: Nine-year spatial and temporal evolution of desert dust aerosols over South and East Asia as revealed by CALIOP, Atmos. Chem. Phys., 18, 1337–1362, https://doi.org/10.5194/acp-18-1337-2018, 2018.
Qi, L., Zheng, H., Ding, D., Ye, D., and Wang, S.: Effects of Meteorology Changes on Inter-Annual Variations of Aerosol Optical Depth and Surface PM2.5 in China – Implications for PM2.5 Remote Sensing, Remote Sens., 14, 2762, https://doi.org/10.3390/rs14122762, 2022.
Randerson, J. T., Van Der Werf, G. R., Giglio, L., Collatz, G. J., and Kasibhatla, P. S.: Global Fire Emissions Database, Version 2 (GFEDv2), ORNL DAAC, Oak Ridge, Tennessee, USA, https://doi.org/10.3334/ORNLDAAC/834, 2006.
Rienecker, M. M., Suarez, M. J., Gelaro, R., Todling, R., Bacmeister, J., Liu, E., Bosilovich, M. G., Schubert, S. D., Takacs, L., Kim, G.-K., Bloom, S., Chen, J., Collins, D., Conaty, A., da Silva, A., Gu, W., Joiner, J., Koster, R. D., Lucchesi, R., Molod, A., Owens, T., Pawson, S., Pegion, P., Redder, C. R., Reichle, R., Robertson, F. R., Ruddick, A. G., Sienkiewicz, M., and Woollen, J.: MERRA: NASA's Modern-Era Retrospective Analysis for Research and Applications, J. Climate, 24, 3624–3648, https://doi.org/10.1175/JCLI-D-11-00015.1, 2011.
Rotman, D. A., Atherton, C. S., Bergmann, D. J., Cameron-Smith, P. J., Chuang, C. C., Connell, P. S., Dignon, J. E., Franz, A., Grant, K. E., Kinnison, D. E., Molenkamp, C. R., Proctor, D. D., and Tannahill, J. R.: IMPACT, the LLNL 3-D global atmospheric chemical transport model for the combined troposphere and stratosphere: Model description and analysis of ozone and other trace gases, J. Geophys. Res.-Atmos., 109, https://doi.org/10.1029/2002JD003155, 2004.
Sayer, A. M., Munchak, L. A., Hsu, N. C., Levy, R. C., Bettenhausen, C., and Jeong, M.-J.: MODIS Collection 6 aerosol products: Comparison between Aqua's e-Deep Blue, Dark Target, and “merged” data sets, and usage recommendations, J. Geophys. Res.-Atmos., 119, 13965–13989, https://doi.org/10.1002/2014JD022453, 2014.
Sayer, A. M., Hsu, N. C., Bettenhausen, C., Jeong, M. J., and Meister, G.: Effect of MODIS Terra radiometric calibration improvements on Collection 6 Deep Blue aerosol products: Validation and Terra/Aqua consistency, J. Geophys. Res.-Atmos., 120, https://doi.org/10.1002/2015jd023878, 2015.
Sayer, A. M., Hsu, N. C., Lee, J., Kim, W. V., and Dutcher, S. T.: Validation, Stability, and Consistency of MODIS Collection 6.1 and VIIRS Version 1 Deep Blue Aerosol Data Over Land, J. Geophys. Res.-Atmos., 124, 4658–4688, https://doi.org/10.1029/2018JD029598, 2019.
Sogacheva, L., Rodriguez, E., Kolmonen, P., Virtanen, T. H., Saponaro, G., de Leeuw, G., Georgoulias, A. K., Alexandri, G., Kourtidis, K., and van der A, R. J.: Spatial and seasonal variations of aerosols over China from two decades of multi-satellite observations – Part 2: AOD time series for 1995–2017 combined from ATSR ADV and MODIS C6.1 and AOD tendency estimations, Atmos. Chem. Phys., 18, 16631–16652, https://doi.org/10.5194/acp-18-16631-2018, 2018a.
Sogacheva, L., de Leeuw, G., Rodriguez, E., Kolmonen, P., Georgoulias, A. K., Alexandri, G., Kourtidis, K., Proestakis, E., Marinou, E., Amiridis, V., Xue, Y., and van der A, R. J.: Spatial and seasonal variations of aerosols over China from two decades of multi-satellite observations – Part 1: ATSR (1995–2011) and MODIS C6.1 (2000–2017), Atmos. Chem. Phys., 18, 11389–11407, https://doi.org/10.5194/acp-18-11389-2018, 2018b.
Sogacheva, L., Popp, T., Sayer, A. M., Dubovik, O., Garay, M. J., Heckel, A., Hsu, N. C., Jethva, H., Kahn, R. A., Kolmonen, P., Kosmale, M., de Leeuw, G., Levy, R. C., Litvinov, P., Lyapustin, A., North, P., Torres, O., and Arola, A.: Merging regional and global aerosol optical depth records from major available satellite products, Atmos. Chem. Phys., 20, 2031–2056, https://doi.org/10.5194/acp-20-2031-2020, 2020.
Sun, C. and Yang, S.: Persistent severe drought in southern China during winter–spring 2011: Large-scale circulation patterns and possible impacting factors, J. Geophys. Res.-Atmos., 117, https://doi.org/10.1029/2012JD017500, 2012.
Tseng, W.-L., Chen, Y.-C., Wang, Y.-C., Tseng, H.-Y., and Hsu, H.-H.: Compound spatial extremes of heatwaves and downstream air pollution events in East Asia, Atmos. Res., 312, 107772, https://doi.org/10.1016/j.atmosres.2024.107772, 2024.
Wang, H. and He, S.: The North China/Northeastern Asia Severe Summer Drought in 2014, J. Climate, 28, 150522112645005, https://doi.org/10.1175/JCLI-D-15-0202.1, 2015.
Wang, L. and Su, C.: Port congestion and resilience in Shanghai during the Citywide lockdown, Ocean Coast. Manage., 261, 107501, https://doi.org/10.1016/j.ocecoaman.2024.107501, 2025.
Wang, R., Ye, X., Huang, W., Lv, Z., Yao, Y., Yang, F., Liu, Y., Huo, J., and Duan, Y.: Long-term Trends of PM2.5 Composition during Cold Seasons in Shanghai after Releasing Clean Air Action Plan, Aerosol Air Qual. Res., 24, 240085, https://doi.org/10.4209/aaqr.240085, 2024.
Wang, S., Li, S., Xing, J., Yang, J., Dong, J., Qin, Y., and Sahu, S. K.: Evaluation of the influence of El Niño-Southern Oscillation on air quality in southern China from long-term historical observations, Front. Env. Sci. Eng., 16, 26, https://doi.org/10.1007/s11783-021-1460-0, 2021.
Worldbank: China Economic Update – June 2022, Worldbank, https://www.worldbank.org/en/country/china/publication/china-economic-update-june-2022, last access: 15 January 2022.
Wu, J., Kong, S., Wu, F., Cheng, Y., Zheng, S., Qin, S., Liu, X., Yan, Q., Zheng, H., Zheng, M., Yan, Y., Liu, D., Ding, S., Zhao, D., Shen, G., Zhao, T., and Qi, S.: The moving of high emission for biomass burning in China: View from multi-year emission estimation and human-driven forces, Environ. Int., 142, 105812, https://doi.org/10.1016/j.envint.2020.105812, 2020.
Wu, M., Liu, X., Yang, K., Luo, T., Wang, Z., Wu, C., Zhang, K., Yu, H., and Darmenov, A.: Modeling Dust in East Asia by CESM and Sources of Biases, J. Geophys. Res.-Atmos., 124, 8043–8064, https://doi.org/10.1029/2019JD030799, 2019.
Wu, X., Wang, L., Yao, R., Luo, M., and Li, X.: Identifying the dominant driving factors of heat waves in the North China Plain, Atmos. Res., 252, 105458, https://doi.org/10.1016/j.atmosres.2021.105458, 2021.
Xiao, Q., Geng, G., Liang, F., Wang, X., Lv, Z., Lei, Y., Huang, X., Zhang, Q., Liu, Y., and He, K.: Changes in spatial patterns of PM2.5 pollution in China 2000–2018: Impact of clean air policies, Environ. Int., 141, 105776, https://doi.org/10.1016/j.envint.2020.105776, 2020.
Xiao, Q., Zheng, Y., Geng, G., Chen, C., Huang, X., Che, H., Zhang, X., He, K., and Zhang, Q.: Separating emission and meteorological contributions to long-term PM2.5 trends over eastern China during 2000–2018, Atmos. Chem. Phys., 21, 9475–9496, https://doi.org/10.5194/acp-21-9475-2021, 2021.
Xu, W., Yuan, W., Wu, D., Zhang, Y., Shen, R., Xia, X., Ciais, P., and Liu, J.: Impacts of record-breaking compound heatwave and drought events in 2022 China on vegetation growth, Agr. Forest Meteorol., 344, 109799, https://doi.org/10.1016/j.agrformet.2023.109799, 2024.
Xu, X., Qiu, J., Xia, X., Sun, L., and Min, M.: Characteristics of atmospheric aerosol optical depth variation in China during 1993–2012, Atmos. Environ., 119, 82–94, https://doi.org/10.1016/j.atmosenv.2015.08.042, 2015.
Xue, L., Ding, K., Huang, X., Zhu, A., Lou, S., Wang, Z., Xie, Y., and Ding, A.: Biomass Burning Plumes From Indochina Toward Southern China: Predominant Synoptic Weather Processes and Interactions, J. Geophys. Res.-Atmos., 130, e2024JD041813, https://doi.org/10.1029/2024JD041813, 2025.
Yan, X., Ohara, T., and Akimoto, H.: Bottom-up estimate of biomass burning in mainland China, Atmos. Environ., 40, 5262–5273, https://doi.org/10.1016/j.atmosenv.2006.04.040, 2006.
Yan, X., Xu, Y., and Pan, G.: Evolution of China's NOx emission control strategy during 2005–2020 over coal-fired power plants: A satellite-based assessment, J. Environ. Manage., 348, 119243, https://doi.org/10.1016/j.jenvman.2023.119243, 2023.
Yin, Y., Ke, H., Tu, Y., Wang, X., Chen, Y., and Jiao, S.: Changes of summer meteorological drought and their relationship with the dry and wet circulation patterns in the Huai River basin, China, Journal of Hydrology: Regional Studies, 52, 101710, https://doi.org/10.1016/j.ejrh.2024.101710, 2024.
Yin, Z., Wang, H., and Chen, H.: Understanding severe winter haze events in the North China Plain in 2014: roles of climate anomalies, Atmos. Chem. Phys., 17, 1641–1651, https://doi.org/10.5194/acp-17-1641-2017, 2017.
Zhang, C., Luo, J.-J., and Li, S.: Impacts of Tropical Indian and Atlantic Ocean Warming on the Occurrence of the 2017/2018 La Niña, Geophys. Res. Lett., 46, 3435–3445, https://doi.org/10.1029/2019GL082280, 2019a.
Zhang, J., Reid, J. S., Alfaro-Contreras, R., and Xian, P.: Has China been exporting less particulate air pollution over the past decade?, Geophys. Res. Lett., 44, 2941–2948, https://doi.org/10.1002/2017GL072617, 2017a.
Zhang, K., Wan, H., Liu, X., Ghan, S. J., Kooperman, G. J., Ma, P.-L., Rasch, P. J., Neubauer, D., and Lohmann, U.: Technical Note: On the use of nudging for aerosol–climate model intercomparison studies, Atmos. Chem. Phys., 14, 8631–8645, https://doi.org/10.5194/acp-14-8631-2014, 2014.
Zhang, Q., Zheng, Y., Tong, D., Shao, M., Wang, S., Zhang, Y., Xu, X., Wang, J., He, H., Liu, W., Ding, Y., Lei, Y., Li, J., Wang, Z., Zhang, X., Wang, Y., Cheng, J., Liu, Y., Shi, Q., Yan, L., Geng, G., Hong, C., Li, M., Liu, F., Zheng, B., Cao, J., Ding, A., Gao, J., Fu, Q., Huo, J., Liu, B., Liu, Z., Yang, F., He, K., and Hao, J.: Drivers of improved PM2.5 air quality in China from 2013 to 2017, P. Natl. Acad. Sci. USA, 116, 24463–24469, https://doi.org/10.1073/pnas.1907956116, 2019b.
Zhang, X., Zhang, Q., Hong, C., Zheng, Y., Geng, G., Tong, D., Zhang, Y., and Zhang, X.: Enhancement of PM2.5 Concentrations by Aerosol-Meteorology Interactions Over China, J. Geophys. Res.-Atmos., 123, 1179–1194, https://doi.org/10.1002/2017JD027524, 2018.
Zhang, X., Xu, X., Ding, Y., Liu, Y., Zhang, H., Wang, Y., and Zhong, J.: The impact of meteorological changes from 2013 to 2017 on PM2.5 mass reduction in key regions in China, Sci. China Earth Sci., 62, 1885–1902, https://doi.org/10.1007/s11430-019-9343-3, 2019c.
Zhang, X. Y., Wang, J. Z., Wang, Y. Q., Liu, H. L., Sun, J. Y., and Zhang, Y. M.: Changes in chemical components of aerosol particles in different haze regions in China from 2006 to 2013 and contribution of meteorological factors, Atmos. Chem. Phys., 15, 12935–12952, https://doi.org/10.5194/acp-15-12935-2015, 2015.
Zhang, Y., Li, Z., Zhang, Y., Li, D., Qie, L., Che, H., and Xu, H.: Estimation of aerosol complex refractive indices for both fine and coarse modes simultaneously based on AERONET remote sensing products, Atmos. Meas. Tech., 10, 3203–3213, https://doi.org/10.5194/amt-10-3203-2017, 2017b.
Zhang, Z., Engling, G., Lin, C.-Y., Chou, C. C. K., Lung, S.-C. C., Chang, S.-Y., Fan, S., Chan, C.-Y., and Zhang, Y.-H.: Chemical speciation, transport and contribution of biomass burning smoke to ambient aerosol in Guangzhou, a mega city of China, Atmos. Environ., 44, 3187–3195, https://doi.org/10.1016/j.atmosenv.2010.05.024, 2010.
Zhao, B., Jiang, J. H., Gu, Y., Diner, D., Worden, J., Liou, K.-N., Su, H., Xing, J., Garay, M., and Huang, L.: Decadal-scale trends in regional aerosol particle properties and their linkage to emission changes, Environ. Res. Lett., 12, 054021, https://doi.org/10.1088/1748-9326/aa6cb2, 2017.
Zhao, Y., Huang, Y., Xie, F., Huang, X., and Yang, Y.: The effect of recent controls on emissions and aerosol pollution at city scale: A case study for Nanjing, China, Atmos. Environ., 246, 118080, https://doi.org/10.1016/j.atmosenv.2020.118080, 2021.
Zheng, Y., Xue, T., Zhang, Q., Geng, G., Tong, D., Li, X., and He, K.: Air quality improvements and health benefits from China's clean air action since 2013, Environ. Res. Lett., 12, 114020, https://doi.org/10.1088/1748-9326/aa8a32, 2017.
Zhong, Q., Tao, S., Ma, J., Liu, J., Shen, H., Shen, G., Guan, D., Yun, X., Meng, W., Yu, X., Cheng, H., Zhu, D., Wan, Y., and Hu, J.: PM2.5 reductions in Chinese cities from 2013 to 2019 remain significant despite the inflating effects of meteorological conditions, One Earth, 4, 448–458, https://doi.org/10.1016/j.oneear.2021.02.003, 2021.
CMA12 for July is as follows: (AVERAGE(Jan:Dec) + AVERAGE(Feb:Jan)) 2.
Both model and satellite AOD time series were divided by their respective values in July 2010; i.e., at the start of the normalized time series, each of the normalized time series has the value 1, as illustrated in Figs. 5, 7, 9, 11, and 13. If there are no meteorological effects on AOD, the model data points in the time series are all 1; any deviation from 1 indicates meteorological influences on the AOD. Any deviation between the satellite and model data indicates anthropogenic influences on AOD.