the Creative Commons Attribution 4.0 License.
the Creative Commons Attribution 4.0 License.
 | 01 Oct 2025
Complementary aerosol mass spectrometry elucidates sources of wintertime submicron particle pollution in Fairbanks, Alaska, during ALPACA 2022
Brice Temime-Roussel
Benjamin Chazeau
Sarah Albertin
Stephen R. Arnold
Brice Barret
Slimane Bekki
Natalie Brett
Meeta Cesler-Maloney
Elsa Dieudonne
Kayane K. Dingilian
Javier G. Fochesatto
Jingqiu Mao
Allison Moon
Joel Savarino
William Simpson
Rodney J. Weber
Kathy S. Law
Fairbanks, Alaska, is a sub-Arctic city that frequently suffers from the non-attainment of national air quality standards in the wintertime due to the coincidence of weak atmospheric dispersion and increased local emissions. As part of the Alaskan Layered Pollution and Chemical Analysis (ALPACA) campaign, we deployed a Chemical Analysis of Aerosol Online (CHARON) inlet coupled with a proton transfer reaction time-of-flight mass spectrometer (PTR-ToF MS) and an Aerodyne high-resolution aerosol mass spectrometer (AMS) to measure organic aerosol (OA) and non-refractory submicron particulate matter (NR-PM1), respectively. We deployed a positive matrix factorization (PMF) analysis for the source identification of NR-PM1. The AMS analysis identified three primary factors: biomass burning, hydrocarbon-like, and cooking factors, which together accounted for 28 %, 38 %, and 11 % of the total OA, respectively. Additionally, a combined organic and inorganic PMF analysis revealed two further factors: one enriched in nitrates and another rich in sulfates of organic and inorganic origin. The PTRCHARON factorization could identify four primary sources from residential heating: one from oil combustion and three from wood combustion, categorized as low temperature, softwood, and hardwood. Collectively, all residential heating factors accounted for 79 % of the total OA. Cooking and road transport were also recognized as primary contributors to the overall emission profile provided by PTRCHARON. All PMF analyses could apportion a single oxygenated secondary organic factor. These results demonstrate the complementarity of the two instruments and their ability to describe the complex chemical composition of PM1 and related sources. This work further demonstrates the capability of PTRCHARON to provide both qualitative and quantitative information, offering a comprehensive understanding of the OA sources. Such insights into the sources of submicron aerosols can ultimately assist environmental regulators and citizens in improving the air quality in Fairbanks and in rapidly urbanizing regional sub-Arctic areas.
- Article
(8857 KB) - Full-text XML
-
Supplement
(18738 KB) - BibTeX
- EndNote


Extremely cold urban regions of the Earth, such as in the Arctic, experience poor dispersion of atmospheric pollution, especially during the wintertime when unique meteorological characteristics, such as extremely low solar radiation and strong radiative cooling at the surface, are coupled with enhanced local anthropogenic emissions from heating, industry, and transport. A good example is the sub-Arctic city of Fairbanks, Alaska, where air quality standards are frequently violated during the winter, with concentrations of fine particulate matter (i.e. with aerodynamic diameters smaller than 2.5 µm; PM2.5), exceeding the 24 h limit of 35 µg m−3 as defined by EPA's National Ambient Air Quality Standards (Dunleavy and Brune, 2020; Fairbanks Air Quality Plan, 2024). Not only is Fairbanks one of the cities with the most polluted wintertime air in the US, but it has also been declared a “moderate non-attainment area” since 2009. Due to the persistence of the problem, it was reclassified as a “severe non-attainment area” in 2017. Increased local anthropogenic emissions and poor atmospheric dispersion due to strong surface-based temperature inversions ( in the lowest 10 m above the ground) are major causes of wintertime pollution in the region (Tran and Mölders, 2011; Mayfield and Fochesatto, 2013). Many research studies have recognized biomass combustion as the major source of aerosol in Fairbanks (Ward et al., 2012; Wang and Hopke, 2014; Kotchenruther, 2016; Ye and Wang, 2020; Haque et al., 2021) that drives overall PM2.5 concentrations across the city during strong temperature inversion conditions (Robinson et al., 2023). A comprehensive study covering three winters from 2008 to 2011 apportioned 60 %–80 % of PM2.5 mass at four locations in Fairbanks to emissions from residential wood stoves, the open burning of biomass, outdoor boilers, and other solid-fuel combustion (Ward et al., 2012). Source apportionment of year-round PM2.5 in the past two decades (2008–2009 (Haque et al., 2021), 2005–2012 (Wang and Hopke, 2014), 2009–2014 (Kotchenruther, 2016), and 2013–2019 (Ye and Wang, 2020)) also revealed wood smoke as a major contributor to PM2.5 loads: 47.5 % (Haque et al., 2021), 40.5 % (Wang and Hopke, 2014), ∼52 % (Kotchenruther, 2016), and ∼19 % (Ye and Wang, 2020). Wildfire activity and residential wood combustion are the major sources in summer and winter, respectively. The persistent role of wood-burning emissions in shaping the air quality of Fairbanks during winters triggered the implementation of a two-stage burn restriction in 2015 by the Alaska Department of Environmental Conservation (ADEC). The ADEC advisories restricted the operation of solid-fuel heating devices and required alternative heat sources to be used on days with weak atmospheric dispersion and PM2.5 levels exceeding 25 µg m−3, as observed or forecasted (Fye et al., 2009; Czarnecki, 2017; Jentgen, 2022). Sulfate has been observed to be the second-largest component of PM2.5 mass in Fairbanks (Ward et al., 2012; Wang and Hopke, 2014 ), forming ∼33 % of the annual average PM2.5 mass (Ye and Wang, 2020). Isotope analyses have revealed 62 % of this PM2.5 sulfate to be primary (e.g. from residential heating oil combustion) during the winters (Moon et al., 2023).
The aforementioned studies on air quality in Fairbanks have focused on PM2.5 even though PM1 has been recognized as the major cause of adverse health effects (Wang et al., 2015; Mainka and Zajusz-Zubek, 2019) due to its capability to spread deeper into the respiratory or cardiovascular system (Meng et al., 2013; Liu et al., 2013; Chen et al., 2017). Currently, efforts to monitor PM1 are surprisingly scarce, even in “non-attaining” cities such as Fairbanks, underscoring the need for a better characterization of submicron aerosols to understand local sources and chemical composition and ultimately to inform public health and support policy decisions.
Mass spectrometric techniques have advanced over the years, featuring greater mass accuracy, resolving power, and sensitivity. For instance, the Aerodyne high-resolution time-of-flight aerosol mass spectrometer (HR-ToF AMS; called AMS from hereon) is a well-established method for quantifying non-refractory NR-PM1. Aerosol vaporization at high temperatures and electron ionization result in substantive molecular decomposition, facilitating quantification with a high time-resolution (Decarlo et al., 2006) but at the cost of molecular-level information. This limitation has encouraged the rise of complementary techniques. For instance, extractive electrospray ionization (EESI)-ToF MS has been successfully deployed in Beijing (Tong et al., 2021) and in Zurich to resolve multiple OA sources (Stefenelli et al., 2019a; Qi et al., 2019). Although the instrument provides molecular-level information, its quantitative response is variable and selective for polar species, preventing its independent application for ambient measurements. Other measurement methods, such as a thermal desorption aerosol gas chromatograph (TAG) coupled to a flame ionization detector (FID) and a mass spectrometer (MS) (Williams et al., 2006) and filter inlet for gas and aerosol chemical ionization ToF mass spectrometer (FIGAERO-CIMS) (Lopez-Hilfiker et al., 2014), similarly offer better a chemical resolution than the AMS but at a lower temporal resolution. Semi-continuous measurements, such as those from TAG and FIGAERO-CIMS, may not capture the rapid variation in sources.
To improve the analysis of submicron OA in ambient air, a novel inlet system called the Chemical Analysis for Aerosol Online (CHARON) was developed to collect real-time measurements (Eichler et al., 2015). This inlet minimizes thermal and ionization-induced fragmentation of sampled OA by employing a low-temperature vaporization system (≤ 150 °C) coupled with a relatively softer ionization method, such as the proton-transfer reaction (PTR). The CHARON PTR-ToF MS (called PTRCHARON from hereon) was successfully used for the characterization of OA from ship exhaust (Eichler et al., 2017); ambient OA in Lyon, France, and Valencia, Spain; and OA source apportionment in Innsbruck, Austria (Müller et al., 2017). Recently, the inlet was used to quantify individual compounds in laboratory-generated secondary organic aerosol (SOA; Lannuque et al., 2023) and complex mixtures, such as vehicular petrol emissions and atmospheric organic matter (Piel et al., 2019; Kostenidou et al., 2024). The system can also measure gas-phase species, creating the opportunity to explore volatile organic compound (VOC) precursor emissions or phase partitioning (Peng et al., 2023; Gkatzelis et al., 2018). Overall, PTRCHARON and AMS are complementary techniques; the former features molecular-level information about the OA faction but has limited ability to detect particles below 150 nm (Eichler et al., 2015); the latter covers a smaller particle size range (i.e. >60 nm) and detects inorganic components too (Decarlo et al., 2006). Together, they provide an excellent combination of real-time and quantitative data on atmospheric ambient aerosol.
The detailed composition of submicron aerosol in Fairbanks – and other anthropogenically influenced sub-Arctic regions – is still not well understood. To address this issue, we deployed PTRCHARON and an AMS in the urban centre of Fairbanks during the Alaskan Layered Pollution And Chemical Analysis (ALPACA) campaign as part of the French Climate-relevant Aerosol Sources and Processes in the Arctic (CASPA) project in January–February 2022 (Simpson et al., 2019, 2024). We aimed to determine the composition, concentrations, and sources of atmospheric NR-PM1. In this paper, we present (i) an intercomparison of the performance of the two instruments focusing on OA quantitation, (ii) the identification of major OA sources in Fairbanks, and (iii) the source apportionment of organic and inorganic aerosol (e.g. ammonium, nitrate, and sulfate). These findings highlight the synergistic benefits of combining multiple analytical techniques and emphasize how soft ionization mass spectroscopic methods enhance molecular-level insights into particulate organic carbon. This integrated approach advances our understanding of the complex composition of particulate matter, offering valuable contributions to environmental characterization and source apportionment studies.
2.1 Field campaign
The data presented in this study were collected during the ALPACA campaign in Fairbanks, Alaska, US, from 20 January to 26 February 2022. ALPACA is an international collaborative field experiment that aims to understand the sources of outdoor and indoor air pollution in the cold and dark conditions of Fairbanks' winter. The scientific objectives and broad preliminary findings of the experiment were recently reviewed (Simpson et al., 2024). All instruments used for this study were housed in a trailer parked at the Community and Technical College (CTC) of the University of Alaska, Fairbanks (64.84064° N, 147.72677° W; 136 m a.s.l.). The CTC is in the urban core of Fairbanks, close (within 40 m) to a central downtown road and parking area (Simpson et al., 2024); residential activities dominate the west of this locality, while the north and east have commercial activity.
The trailer was equipped with a suite of particle counters and mass spectrometers, featuring high temporal resolutions (ranging from 10 s to 2 min). A scanning mobility particle sizer (SMPS) and a multi-angle absorption photometer (MAAP) were utilized to measure the distribution of particles sized 15.1–661.2 nm and black carbon concentrations, respectively. A separate inlet was used for measurements conducted with a commercial optical particle counter (OPC; model 1.109, Grimm Aerosol Technik, Germany) at a time resolution of 1 min. Two mass spectrometers, PTRCHARON (150–1000 nm) and AMS (60–700 nm), were connected to the same inlet that sampled air at 3.5 m above ground level through a short (≈1 m) stainless steel tube with a (1.27 cm) outer diameter extending through the trailer roof. A HEPA filter was placed upstream of the inlet for 1 h at regular intervals (twice a week) to measure the instrumental background. Additionally, meteorological data, including ambient temperatures at 3 and 23 m, wind speed and direction, and trace gases (namely CO, SO2, O3, NO and NO2), were recorded as described in a previous study associated with the campaign (Cesler-Maloney et al., 2022).
2.2 Instrumentation
2.2.1 PTR-ToF MS: operation and data processing
The OA was quantified with a PTR-ToF MS (PTR-TOF 6000 X2, Ionicon Analytik GmbH, Austria) coupled with a CHARON inlet in near real time at a 20 s temporal resolution, i.e. PTRCHARON. The CHARON inlet has been described in detail by Eichler et al. (Eichler et al., 2015), and its applications were further evaluated and improved in subsequent studies (Müller et al., 2017, 2019; Leglise et al., 2019; Piel et al., 2019; Peng et al., 2023). Here, the PTR-ToF MS was configured to alternate between the sampling of ambient air to measure VOCs for 15 min (not included in the current study) and the sampling of particulate matter through the CHARON inlet for 45 min. The instrument was operated at a low EN of 65 Td (i.e. drift voltage or pressure; pressure, temperature, and voltage of the drift tube were set at 2.6 mbar, 120 °C, and 265 V, respectively) and in RF mode for optimal sensitivity. The thermodesorber was operated at 150 °C and 8 mbar; this combination of moderate temperature with low pressure expands the range of detection to include extremely low-volatility organic compounds (ELVOCs) as well (Piel et al., 2021). Raw data were obtained, as described in Sect. S1 in the Supplement, and pre-processed with an Ionicon Data Analyzer (IDA; version 1.0.0.2, Ionicon Analytik Ges.m.b.H., Innsbruck, Austria), followed by post-processing (i.e. background subtraction, conversion of raw signal to mixing ratios, temporal averaging, PMF input generation) with an in-house data-processing tool, PeTeR Toolkit (version 6.0; Igor 6.37). The error matrix was also calculated by PeTeR, taking into account uncertainties in ion counts and background signals. Among the resolved 1118 ions spanning the range of 50–425, only 336 were retained above the SN, and 318 ions could be given a molecular formula based on the criteria described in Sect. S2. The PTR-ToF MS records raw signals in counts per second (cps) that were converted to mixing ratios according to the molecular identity determined for the detected ions and their protonation efficiencies (further details in Sect. S1). For comparison with the AMS, mixing ratios were converted to mass concentrations, i.e. µg m−3, using Eq. (S2) in the Supplement. Mass concentrations calculated for PTRCHARON require a critical correction for the enrichment of sampled OA in the aerodynamic lens of the CHARON inlet (Eichler et al., 2015; Müller et al., 2017); further details are provided in Sect. S3. The total (or bulk) OA at a given point in time was the sum of mass concentrations of all ions, which was corrected for fragmentation using a previously reported method (Leglise et al., 2019), which increased the total OA mass concentrations by 17 %.
Species with were retained for the PMF of OA, as molecules of 18–50 were presented in low concentrations, are expected to be too volatile to be present in OA, and were likely detected by PTRCHARON as artefacts from the denuder. Time series were averaged to 2 min (from 20 s), and two matrices ( time points) were extracted: (i) ion concentrations and (ii) their measurement uncertainties, using PeTeR. The final matrices had the following dimensions: 336×17 986. Where required, ion intensities (in either ppb or µg m−3) were normalized to the sum of all measured intensities.
2.2.2 HR-ToF AMS: operation and data processing
NR-PM1 was monitored with a 1 min time resolution by a high-resolution time-of-flight aerosol mass spectrometer (AMS) (Aerodyne Research Inc., Billerica, US), extensively described by Decarlo et al. (2006) and Canagaratna et al. (2007). Briefly, ambient particles are sampled through a critical orifice, focused into a narrow beam by an aerodynamic lens, accelerated towards a standard vaporizer heated at 600 °C, and then ionized by electron impact (70 eV at 10−7 torr). Finally, the ions are analysed by a time-of-flight mass spectrometer. Standard calibrations were performed using 300 nm size-selected dried ammonium nitrate and ammonium sulfate particles at the beginning and the end of the campaign. Nitrate-equivalent values of sample mass concentrations were converted by applying relative ionization efficiencies (RIEs) for organics, nitrates, ammonium, sulfate, and chloride (1.4, 1.1, 3.15, 1.93, and 1.3, respectively). The collection efficiency (CE) has been calculated in PIKA using the composition-dependent CE (CDCE) method, following the approach of Middlebrook et al. (2012). The calculated CE values ranged from 1.00 to 0.35.
Data were averaged to 2 min and extracted as concentration and measurement uncertainty matrices ( points) using SQUIRREL version 1.65 and PIKA version 1.25 in Igor 8.04. Separate matrices (and subsequently PMF) were prepared for organic only (abbreviated as AMSorg) and by combining organic and inorganic species (abbreviated as AMSorg + inorg). The inorganic species included in the analyses were nitrate ( 30, NO+ and 46, ), sulfate ( 48, SO+; 64, ; 80, ; 81, ; and 98, ), ammonium ( 15, NH+; 16, ; and 17, ), and chloride ( 35, Cl+ and 36, HCl+). Error matrices were calculated by PIKA based on uncertainty in ion counts, background signal, air beam correction, and electronic noise (Sueper, 2014). Atomic OC and HC ratios were calculated based on established methods (Aiken et al., 2007, 2008; Canagaratna et al., 2015). Where needed for comparison with PTRCHARON, mass concentrations of polycyclic aromatic hydrocarbons (PAHs) were estimated from fragments as described previously (Herring et al., 2015) and levoglucosan was estimated as detailed in Sect. S4.
Species with 12–120 were retained for PMF in this study, excluding important PAHs detected up to 252; such PAHs were used as external tracers for factor identification. All PAHs were included in total OA quantification and associated comparisons. This exclusion is expected to cause underestimation below 2 % of the mass of some factors, particularly hydrocarbon-like organic aerosol (HOA) and biomass-burning organic aerosol (BBOA). Final matrices from the AMSorg and AMSorg + inorg analyses had the following dimensions: 193×24 762 and 205×24 762, respectively.
2.3 Source apportionment: positive matrix factorization
Source apportionment was performed using a PMF implemented in the multilinear engine (ME-2) (Paatero, 1997a, 1999). The PMF was configured and analysed using the SoFi (Source Finder) Pro interface (Canonaco et al., 2013) (version 8.4.1.9.1; Igor 8.04). PMF is a descriptive mathematical algorithm that describes the input data, i.e. measurements of several variables collected over time (here, time points), as a linear combination of factors that have constant mass spectra associated with temporally varying concentrations of the spectral constituents (Paatero, 1997b; Paatero and Tapper, 1994). The mathematical expressions and functions of the PMF algorithm have been exhaustively detailed in previous studies (e.g. Tong et al., 2021; Stefenelli et al., 2019a; Chen et al., 2022; Chazeau et al., 2022). Below, we summarize the user-defined configurations applied in SoFi Pro to optimize the PMF of our datasets, PTRCHARON, AMSorg, and AMSorg + inorg.
General methodology for PMF analysis
A preliminary PMF was performed without using a priori information to explore factor variability and source contributions to guide the selection of an optimal solution before applying constraints. We considered solutions ranging from 3 to 13 factors, applying a step-wise, cell-wise down-weighting approach: variables with (“bad” variables) were down-weighted by a factor of 10, while those with (“weak” variables) were down-weighted by a factor of 2 (Paatero and Hopke, 2003; Ulbrich et al., 2009). Upon establishing some primary factors, such as cooking and biomass burning, which were successfully identified in unconstrained trials, we narrowed the range of possible solutions by applying the a-value approach, which allows for improved factorization by constraining the PMF with external data when available (Canonaco et al., 2013; Paatero, 1999). For instance, a factor profile from a PMF trial in the same experiment, a time series from an external tracer, or a well-established factor profile for a source from another experiment may be provided to the PMF as an “anchor” or “vector”, around which it can build a factor in its overall solution. The extent to which each PMF factor can diverge from the anchor is defined by the value of a (Tong et al., 2021), which varies from 0 to 1. This anchor can be provided for one or multiple factors and has been proven to improve the quality of PMF solutions compared to unconstrained trials (Tong et al., 2021; Stefenelli et al., 2019a; Chen et al., 2022).
Currently, there are no objective criteria for choosing the optimal number of factors; however, several criteria have been proposed in the literature to inform an appropriate choice (Chen et al., 2022; Zhang et al., 2011; Ulbrich et al., 2009; Crippa et al., 2014). The PMF solutions reported here were primarily selected based on their physical meaning, which was determined by the presence of known tracer compounds in the factors and temporal correlation with co-located measurements of external tracers (e.g. NOx, SO2). We selected eight-, four-, and six-factor solutions from PTRCHARON, AMSorg, and AMSorg + inorg, respectively. The justification for these solutions is presented in Table S2 in the Supplement. Once the most suitable solution, i.e. the base-case, was established, bootstrap analyses were performed to assess its stability, evaluate uncertainties, and conduct a sensitivity analysis on the range of a values used. In an unblocked bootstrapping approach, the original matrices (both data and error) are perturbed by random resampling of the rows to create a new input of the same dimensions, resulting in some duplications and deletions throughout the input (Paatero et al., 2014). The need and application of this approach differed between PTRCHARON and the two AMS datasets, as discussed in Sects. S5 and S6, respectively. Ancillary data on particle size distribution have been associated with mass spectrometry data in an additional PMF analysis (Sect. S7 in the Supplement). Finally, the quality of the solutions was assessed by the values and from key diagnostic plots of residuals, as well as from the statistical stability across multiple runs (Figs. S5–S7 in the Supplement).
3.1 Campaign overview
Figure 1 summarizes the meteorological conditions, chemical composition, and particle size distribution of NR-PM1 observed from 20 January to 26 February 2022. High aerosol loads coincided with poor atmospheric dispersion due to low wind speeds () and low temperatures (below −10 °C), associated with strong surface temperature inversions. The temperature differences between 23 and 3 m a.s.l. ranged from 3 to 10 °C. The average values of BC and NR-PM1, measured with MAAP and AMS, were and , respectively. During intense pollution events, the daily average concentrations of NR-PM1 were 24–27 µg m−3. During the same sampling period at the NCore site (Fairbanks), PM2.5 values of ∼25 and were reported (Robinson et al., 2023). Ancillary OPC measurements at the CTC site showed that the hourly PM1 mass comprised up to 99 % of the PM2.5. Organic matter was the predominant component of NR-PM1 throughout the campaign, constituting of its total mass, while chloride, ammonium, nitrate, and sulfate contributed 2±3 %, 3±3 %, 6±4 %, and 22±10 %, respectively. This finding aligns with previous studies in Fairbanks, where OA was the largest component of PM2.5 mass (Ward et al., 2012; Ye and Wang, 2020; Robinson et al., 2024). Specifically, according to a recent study conducted from 2020 to 2021, ACSM analysis during wintertime demonstrated that inorganics formed less than 25 % of the PM2.5 mass, with sulfate (∼10 %) and nitrate (∼ 8 %) being the predominant components (Robinson et al., 2024). Despite the different average concentrations, the fractional contributions of these non-refractory components remained almost invariable throughout the campaign (Fig. 1d). The detailed molecular-level composition of organics with PTRCHARON reveals that a large majority of organics comprise only C, H, and/or O atoms, while only of the OACHARON mass measured with this instrument was attributable to heteroatomic molecules, including organonitrates and organosulfates (Figs. 4 and S8). Generally, heteroatomic species cannot be distinguished at a resolving power of 5000 FWHM in complex environmental mixtures, such as atmospheric aerosol (Reemtsma, 2009). In this study, based on the low formula error and the lack of an appropriate alternate, we gave 53 low-concentration ions (<2 % of the total signal) CHOS or CHNO identities. However, due to the low confidence in their formula assignments, they were not considered for factor identification. Prominent peaks include 217.09 (C12H12N2O2), 219.09 (C15H10N2), 123.05 (C4H10O2S), and 151.08 (C6H14O2S).
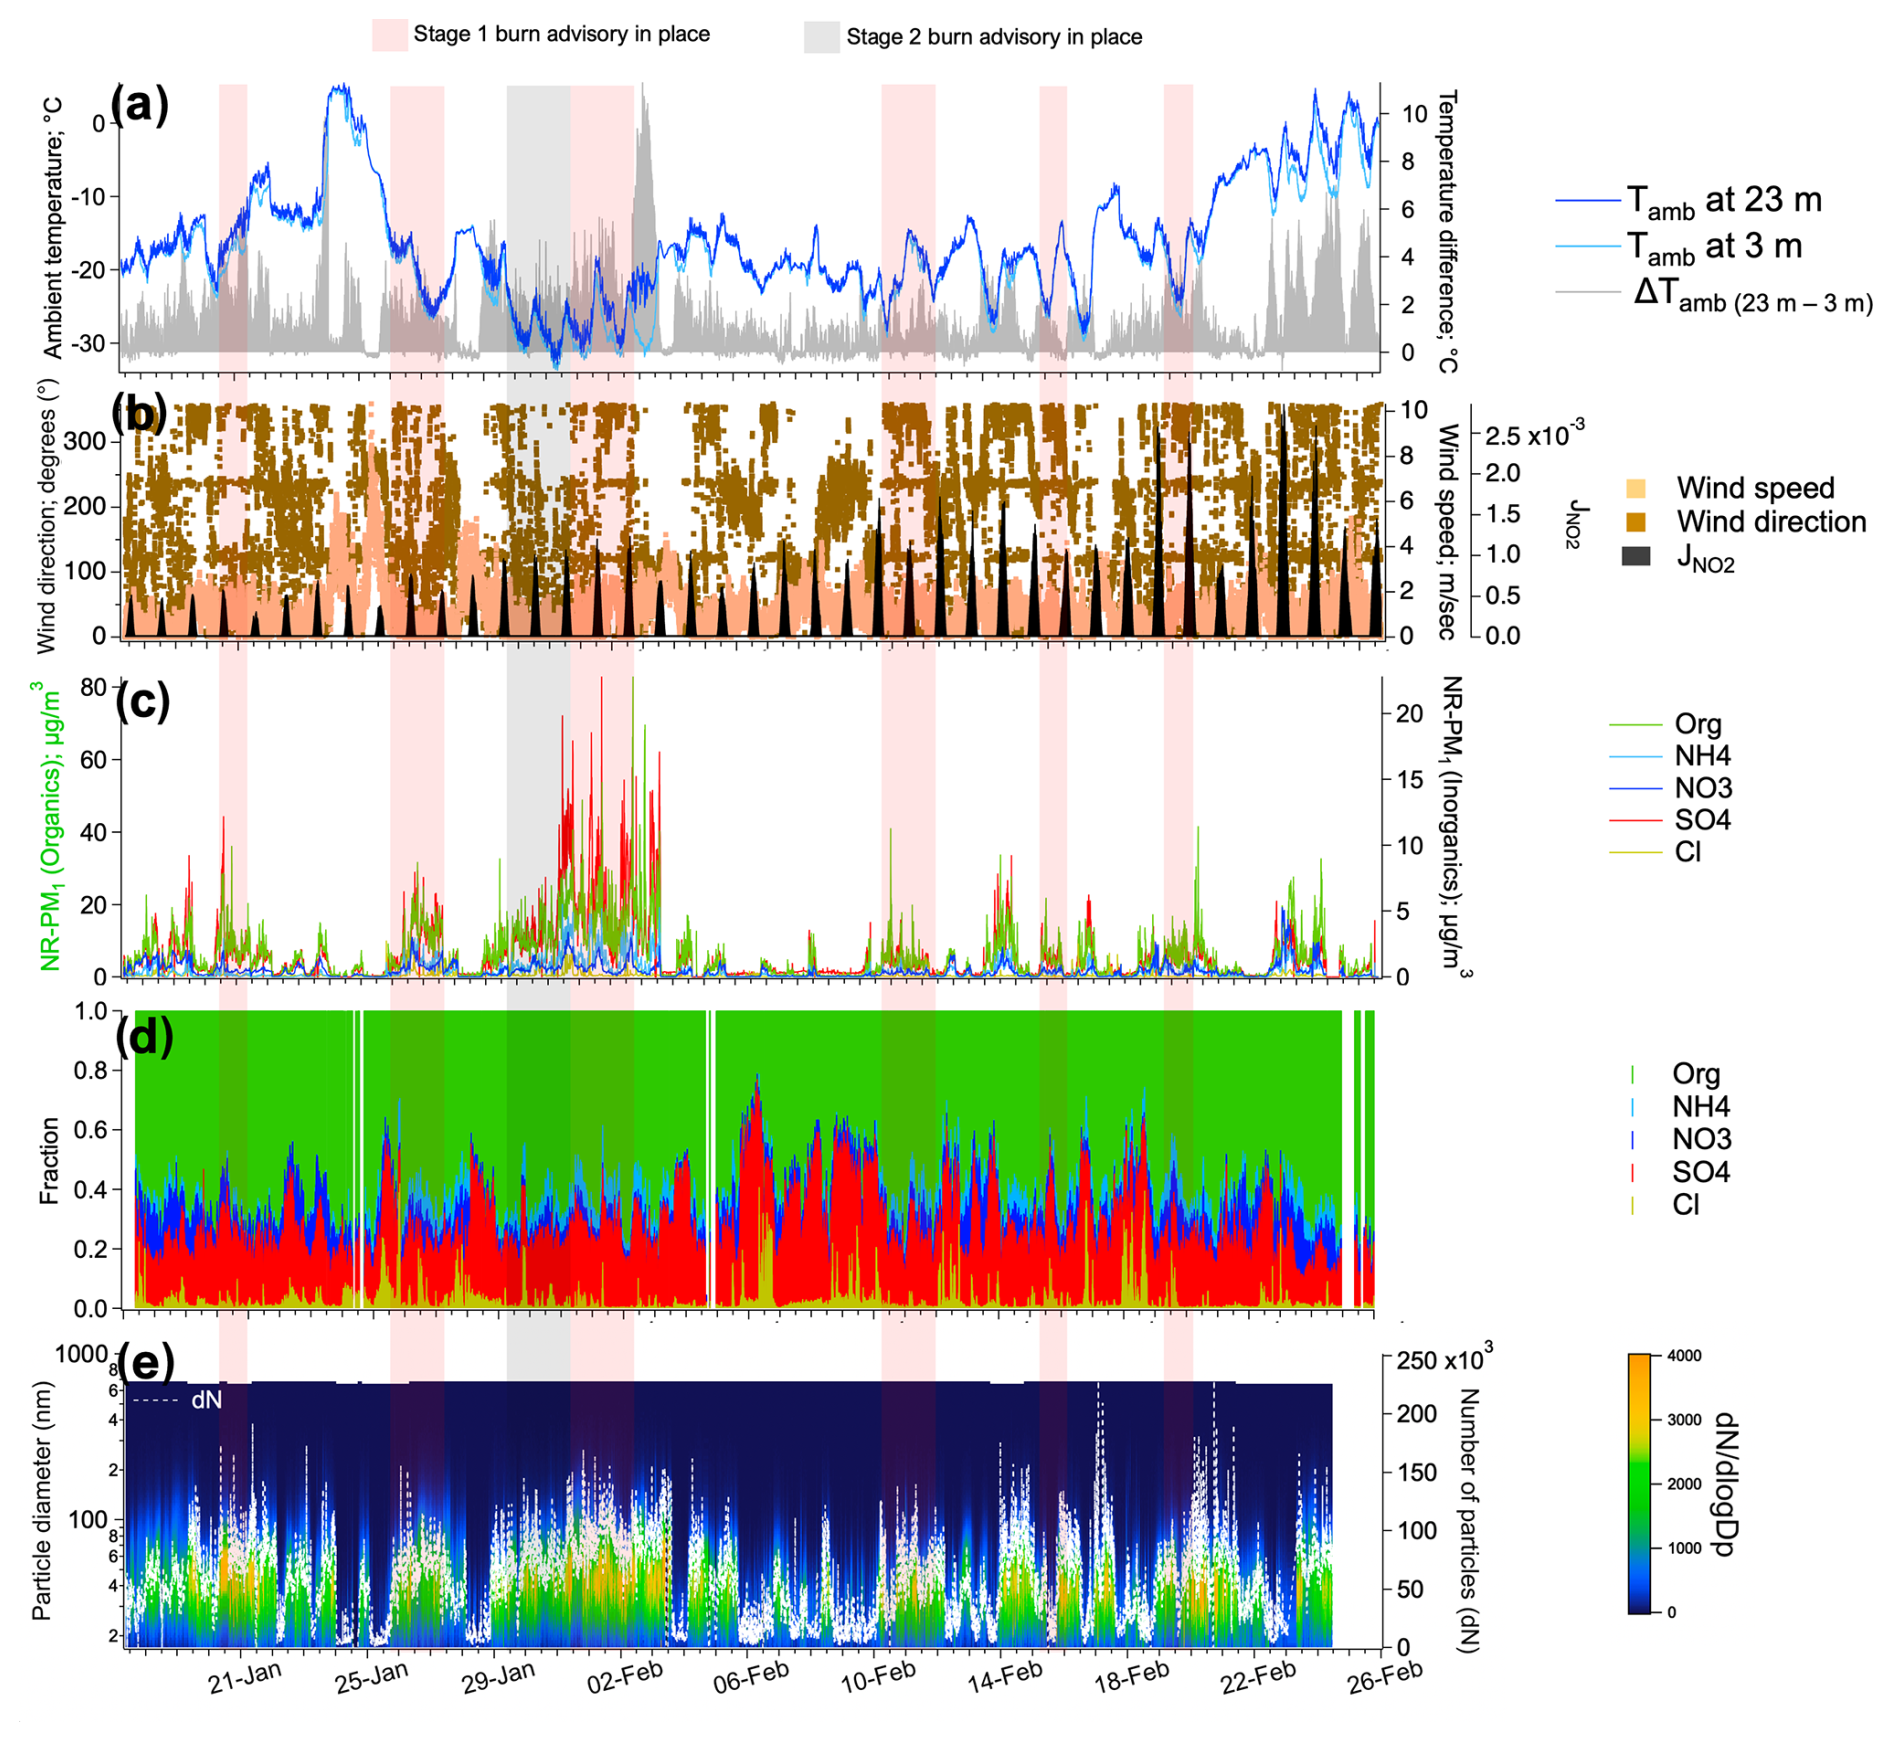
Figure 1Overview of meteorological parameters and aerosol properties. The shaded areas indicate the periods when Stage 1 (red) and Stage 2 (black) advisories (“burn bans”) from the Alaska Department of Environmental Conservation were in place in Fairbanks. (a) Ambient temperature at 3 and 23 m and difference in temperature between the two heights, (b) wind speed and direction with the daily sunlight in terms of the NO2 photolysis rate coefficient () (Simpson et al., 2024), (c, d) absolute and fractional compositions of non-refractory fine particulate matter (NR-PM1) from the AMS, and (e) size distribution of PM1 from the SMPS.
On average, the OA mass loading recovered by PTRCHARON (i.e. OACHARON) accounted for approximately 85 % of the OA mass measured by the AMS (i.e. OAAMS). While the two instruments showed a good temporal agreement ( as depicted in Fig. 2a and b, measurements were biased either towards AMSorg or PTRCHARON (i.e. distributed away from the 1:1 line in the scatter plot of Fig. 2c) during different periods of the campaign. These trends could be explained by the variation in the relative contributions of two major emission sources identified by both instruments in this study: on-road transport and biomass burning. OACHARON was comparable to OAAMS, when the relative contribution of BBOAAMS, org was more than 50 % of total OAAMS and HOAAMS, org (i.e. transportCHARON) was less than 10 % (Fig. 2d and e). Similar trends were observed for some major constituents of BBOA, e.g. levoglucosan and a PAH (C20H12), as shown in Fig. S9. Part of such discrepancy can be traced back to the size transmission of particles, where sub-100 nm urban vehicular emissions are underestimated by PTRCHARON (Guo et al., 2020; Pikridas et al., 2015; Louis et al., 2017; Kostenidou et al., 2020) and larger than 100 nm biomass burning emissions (Reid et al., 2005) are estimated well (Janhäll et al., 2010). Another part of the quantitative difference can be explained by the PTR limitation in ionization and the induced fragmentation of analyte ions. Tests conducted in our laboratory with five C16–C26 alkanes as markers of vehicular emissions revealed that they undergo extensive fragmentation, resulting in 2–4 times underestimation of their actual concentrations. In line with this, the ineffective ionization of saturated alkanes by PTR (Ellis and Mayhew, 2014) and their tendency to undergo dissociative ionization (Gueneron et al., 2015) have also been reported.
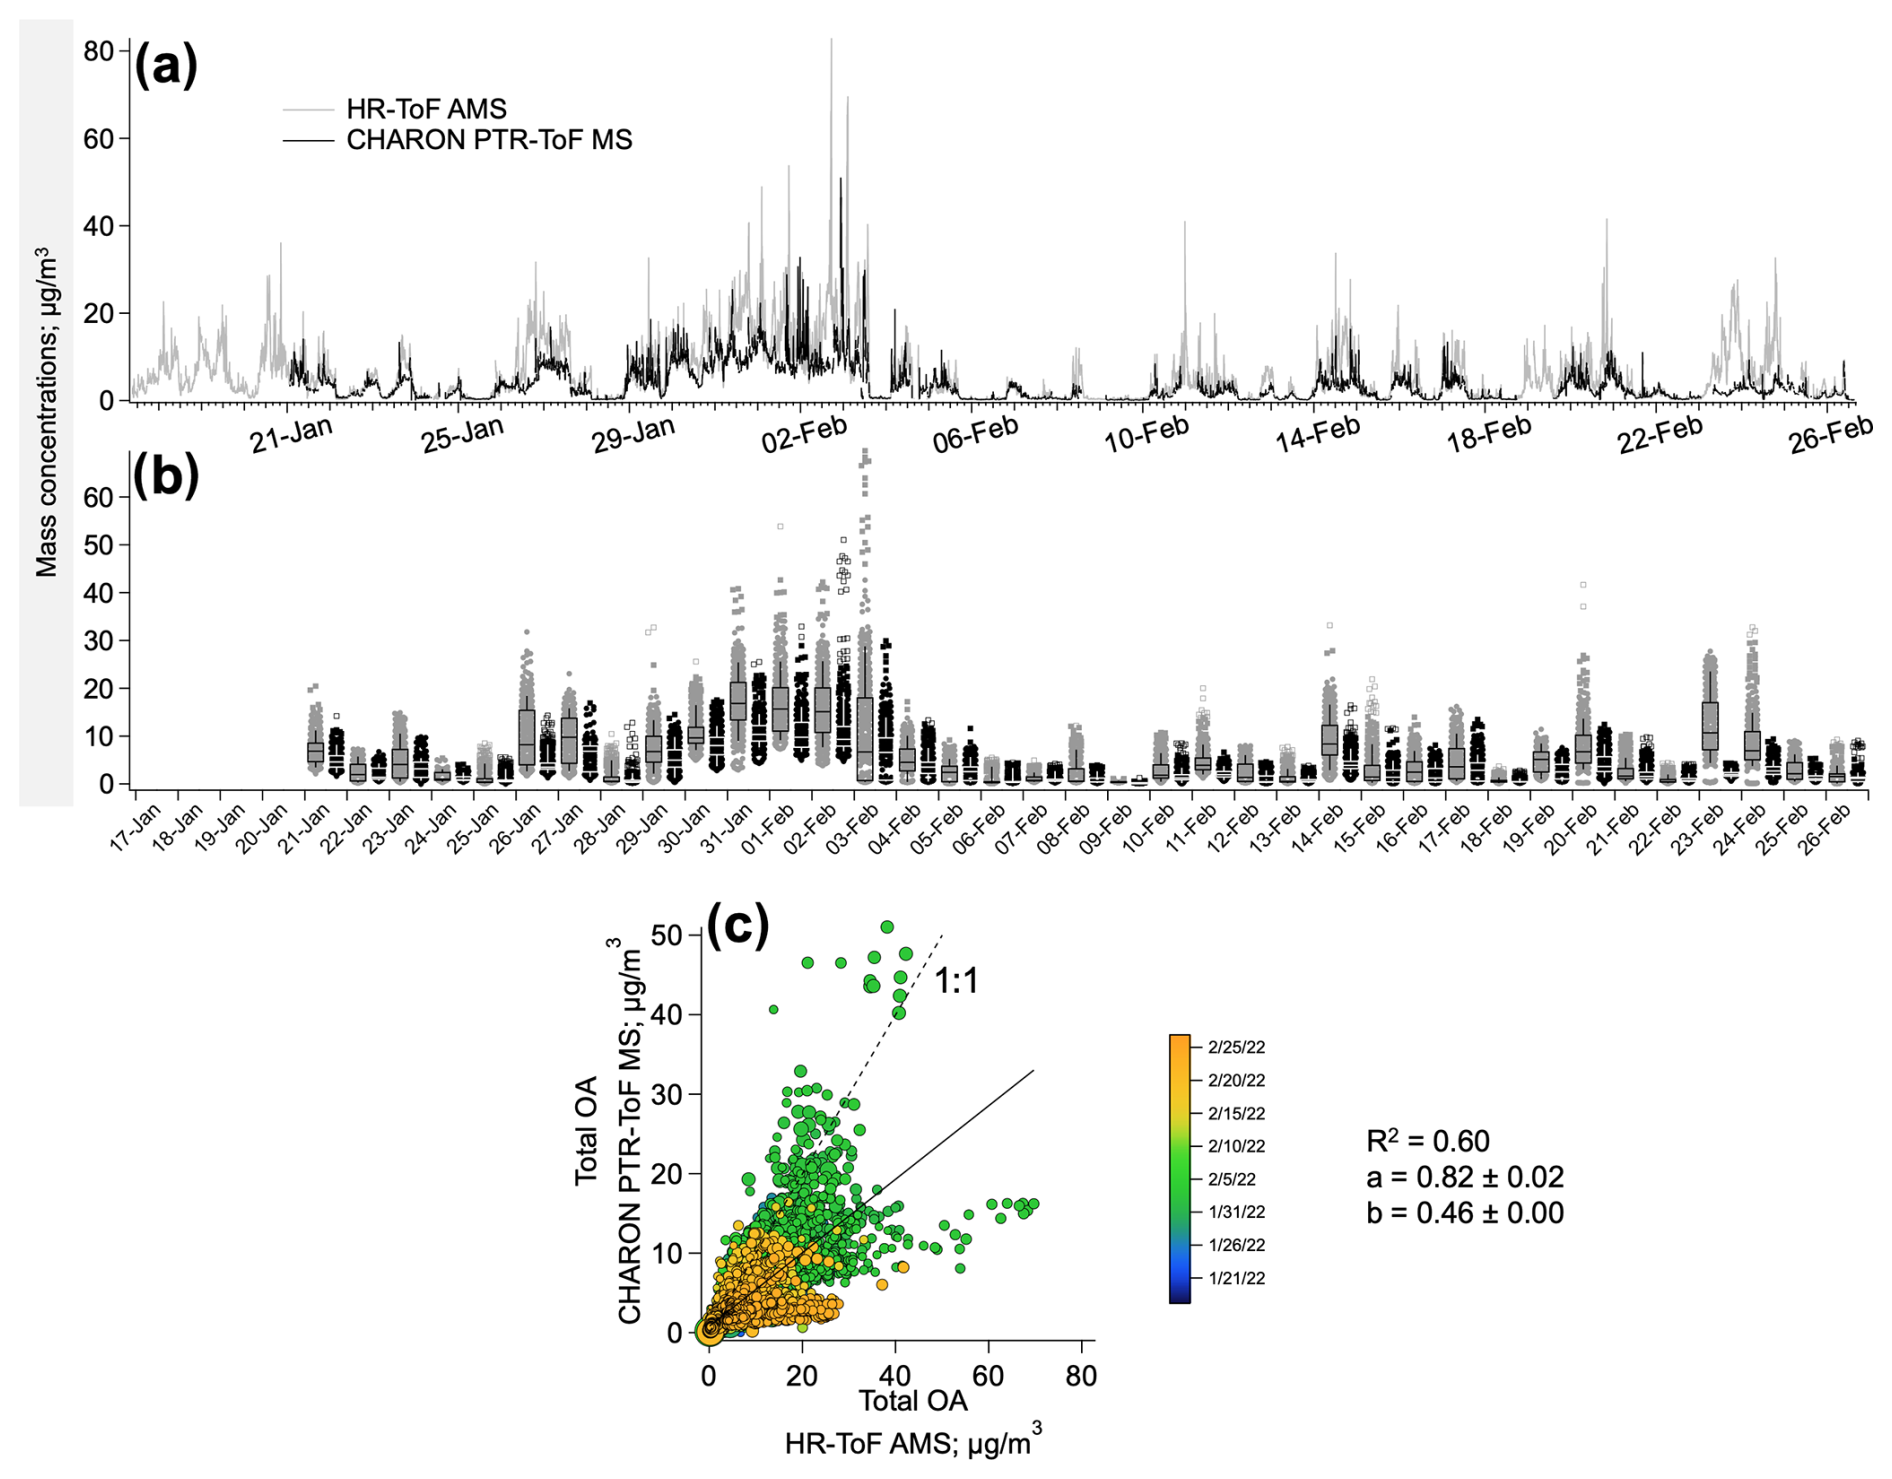
Figure 2Comparison of total OA measured with PTRCHARON and the AMS. (a) Absolute concentrations of OA measured with the AMS and OAcorr (fragmentation-corrected OA) from PTRCHARON, (b) daily average concentrations of OA, and (c) scatter plot of total OA measured with the AMS and PTRCHARON. Data points are coloured by the dates, and the legend is written as MM/DD/YY. Data points are sized by the geometric mean mass of the dM/dlogDp from SMPS (50–500 nm). The dashed line denotes the 1:1 relationship. Coefficients a and b denote the slope and the intercept for the linear regression (p≤ 0.05; solid line) and are written with ± 1 standard deviation.
3.2 Source apportionment
3.2.1 Overview of source apportionment
A four-factor solution was selected for the AMSorg measurements with three primary factors (i.e. hydrocarbon-like organic aerosol, HOA; cooking organic aerosol, COA; and biomass burning organic aerosol, BBOA) and an oxygenated or aged OA factor (i.e. OOA). The mass spectra and time series are presented in the Supplement (Fig. S10). The counterparts of these four factors were diagnosed in AMSorg + inorg based on a high temporal correlation (R2>0.9; Table S4 in the Supplement), along with two additional factors: a sulfur-rich factor (labelled sulf-OA) and a nitrate-rich factor (labelled AmNi) (Fig. 3). An eight-factor solution was selected for PTRCHARON and is summarized in Figs. 4 and 5. To differentiate between corresponding factors retrieved from the different datasets, they have been assigned unique subscripts, e.g. COAAMS, org, COAAMS, org + inorg, or COAAMS (i.e. referring to both AMS datasets) or COACHARON. Amongst the three datasets, COA, HOA (labelled “transport” in PTRCHARON analyses), and OOA were common. A single BBOA factor was observed in AMSorg and AMSorg + inorg, while four chemically distinct but closely co-varying counterparts were detected by PTRCHARON.
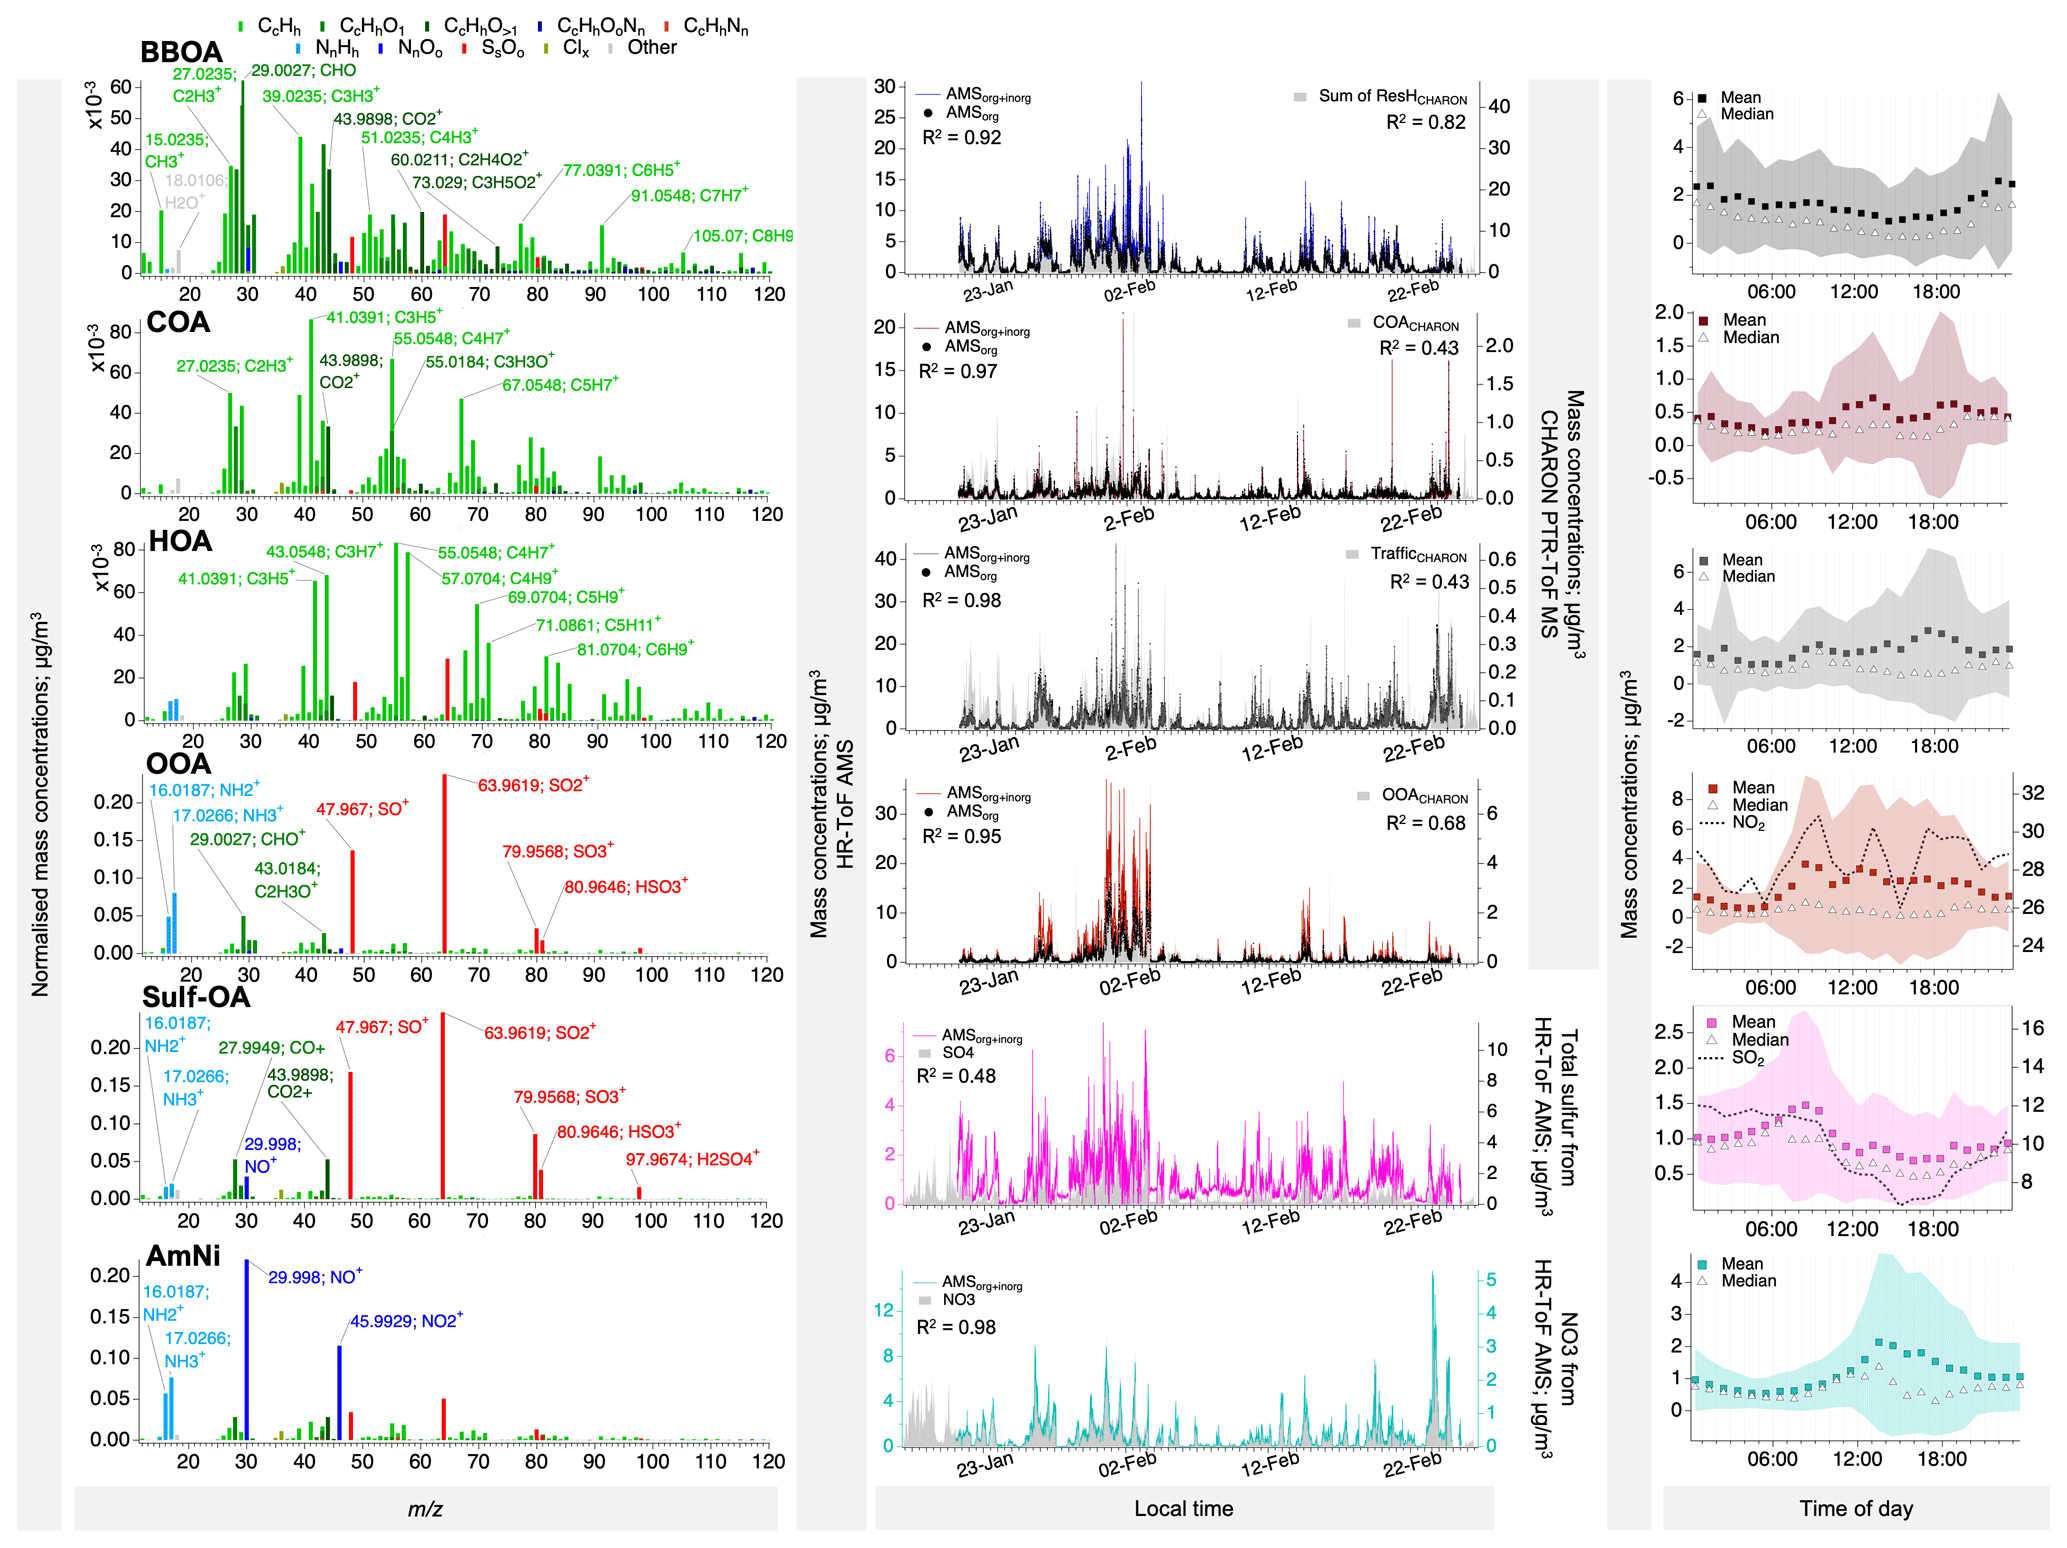
Figure 3Overview of the positive matrix factorization output for NR-PM1 measurements with AMSorg + inorg. Mass concentrations were normalized to the sum of the concentrations of all ions. Time series are overlaid with those of the corresponding factor (if available) in AMSorg and PTRCHARON analysis or an external tracer. Correlation coefficients (R2; p≤0.05) are also provided, and slopes can be found in Table S5 in the Supplement or Table 1.
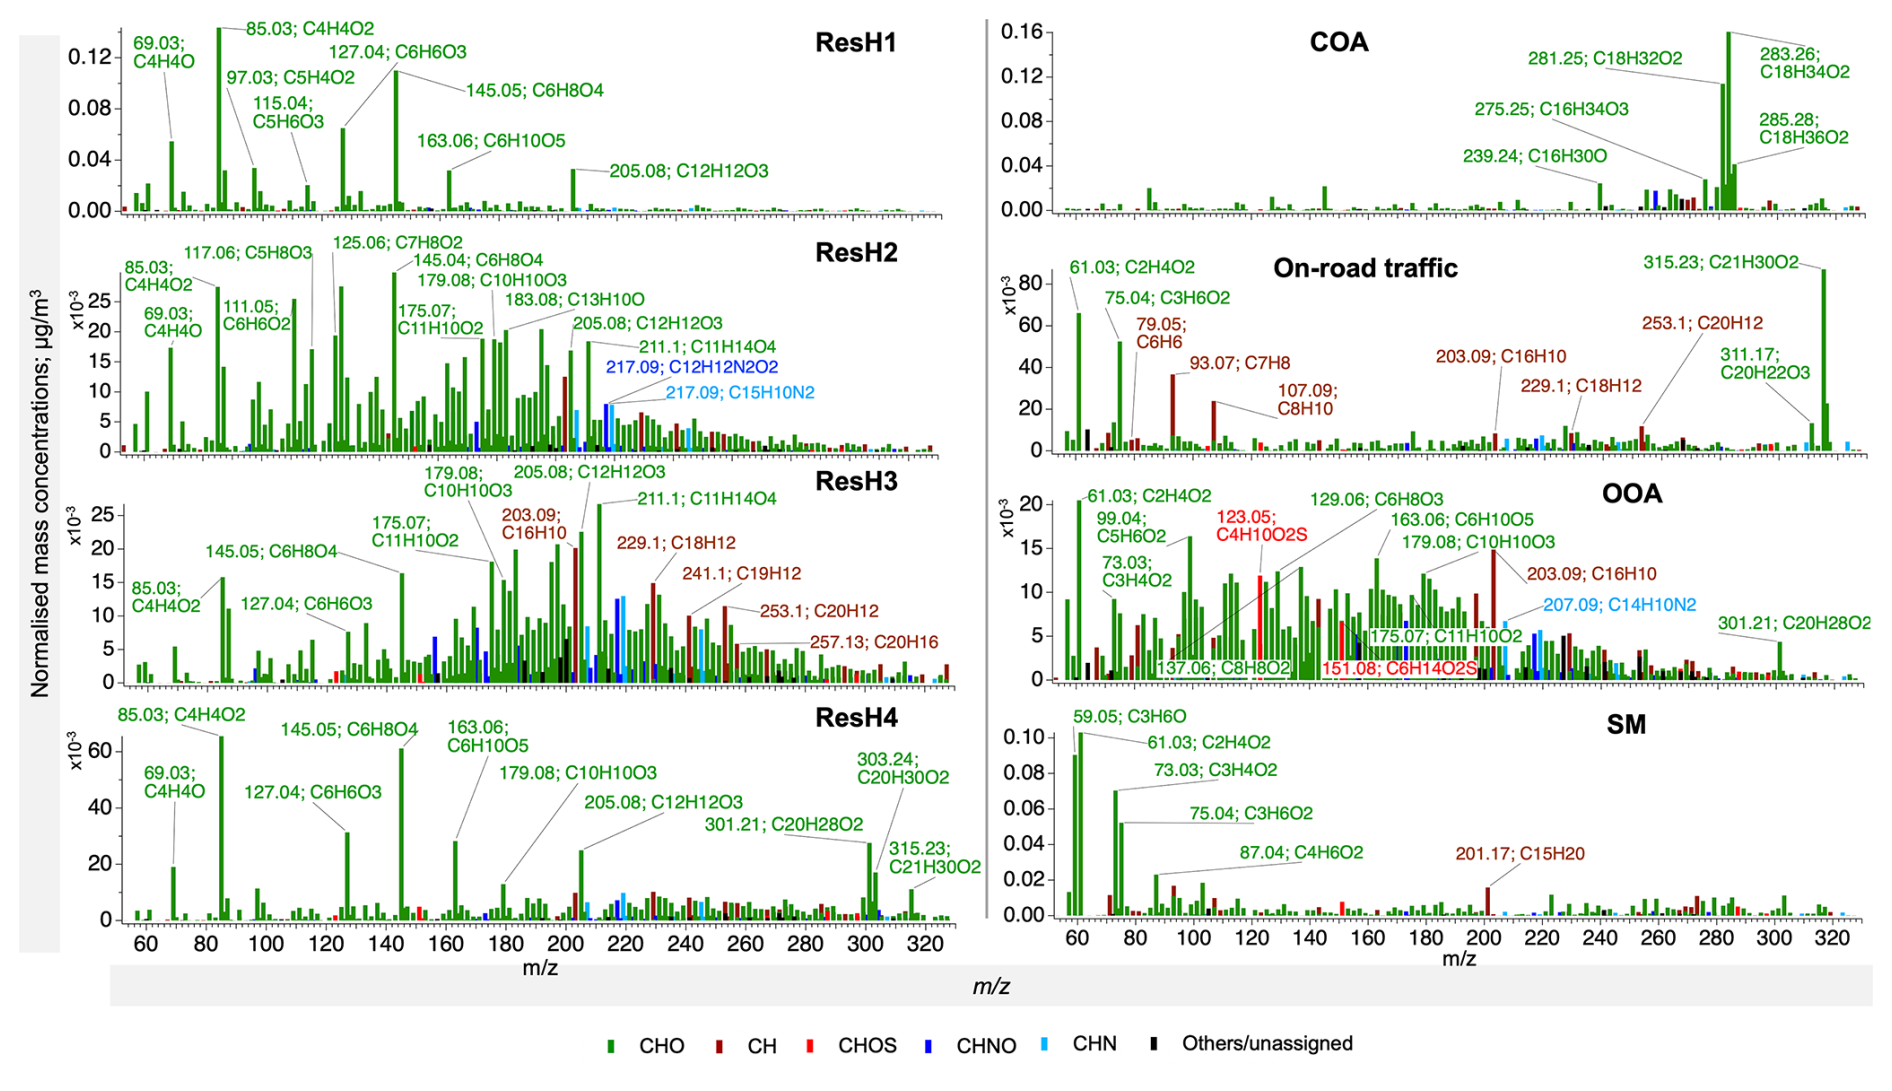
Figure 4Normalized mass spectra of factors from the PMF of PTRCHARON measurements. Mass concentrations are normalized to the sum of concentrations of all ions. Peaks are coloured by the molecular group (CHO, CHNO, CHOS, CH, CHN) of the formula assigned. Unassigned species are shown in black. Further information, such as tentative identities and formula errors, can be found in dataset 1 in the Supplement.
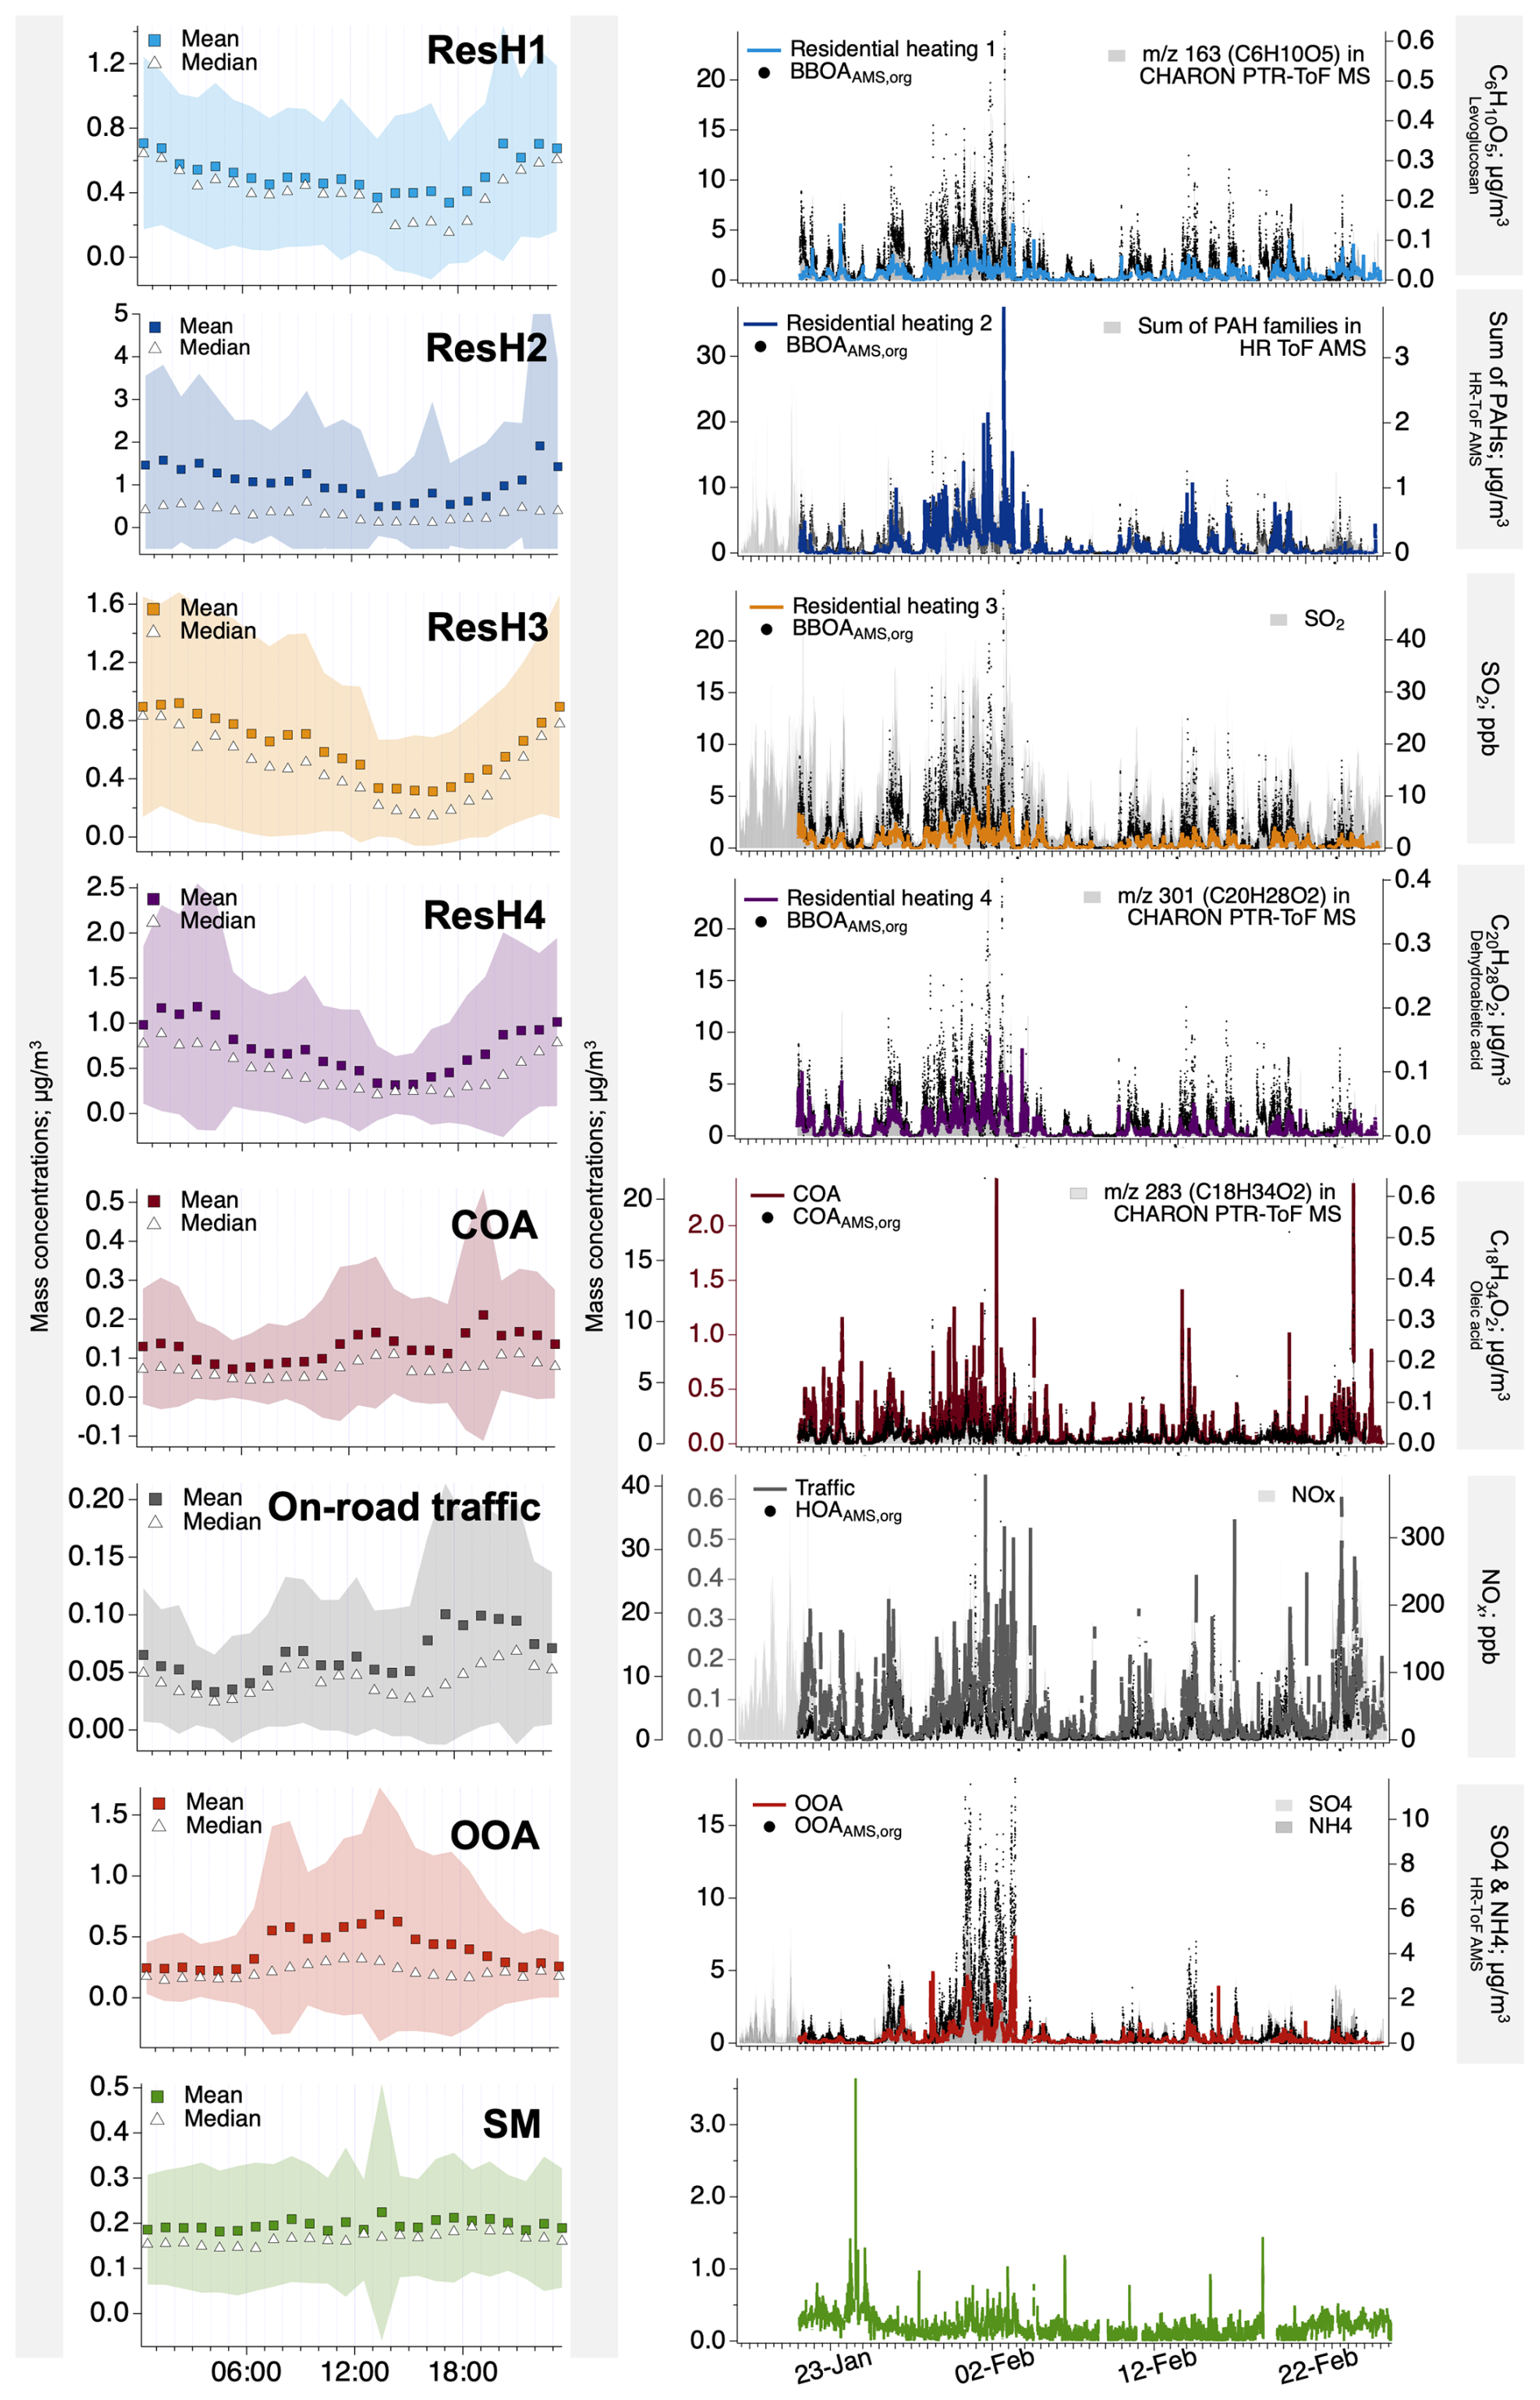
Figure 5Diurnal profiles and complete time series of factors from the positive matrix factorization of PTRCHARON measurements. In the second column, time series are overlaid on those of the corresponding factor in AMSorg and an external tracer or marker ion. Correlation coefficients (R2; p≤0.05) are also provided, and slopes can be found in Table S4 in the Supplement or Table 1.
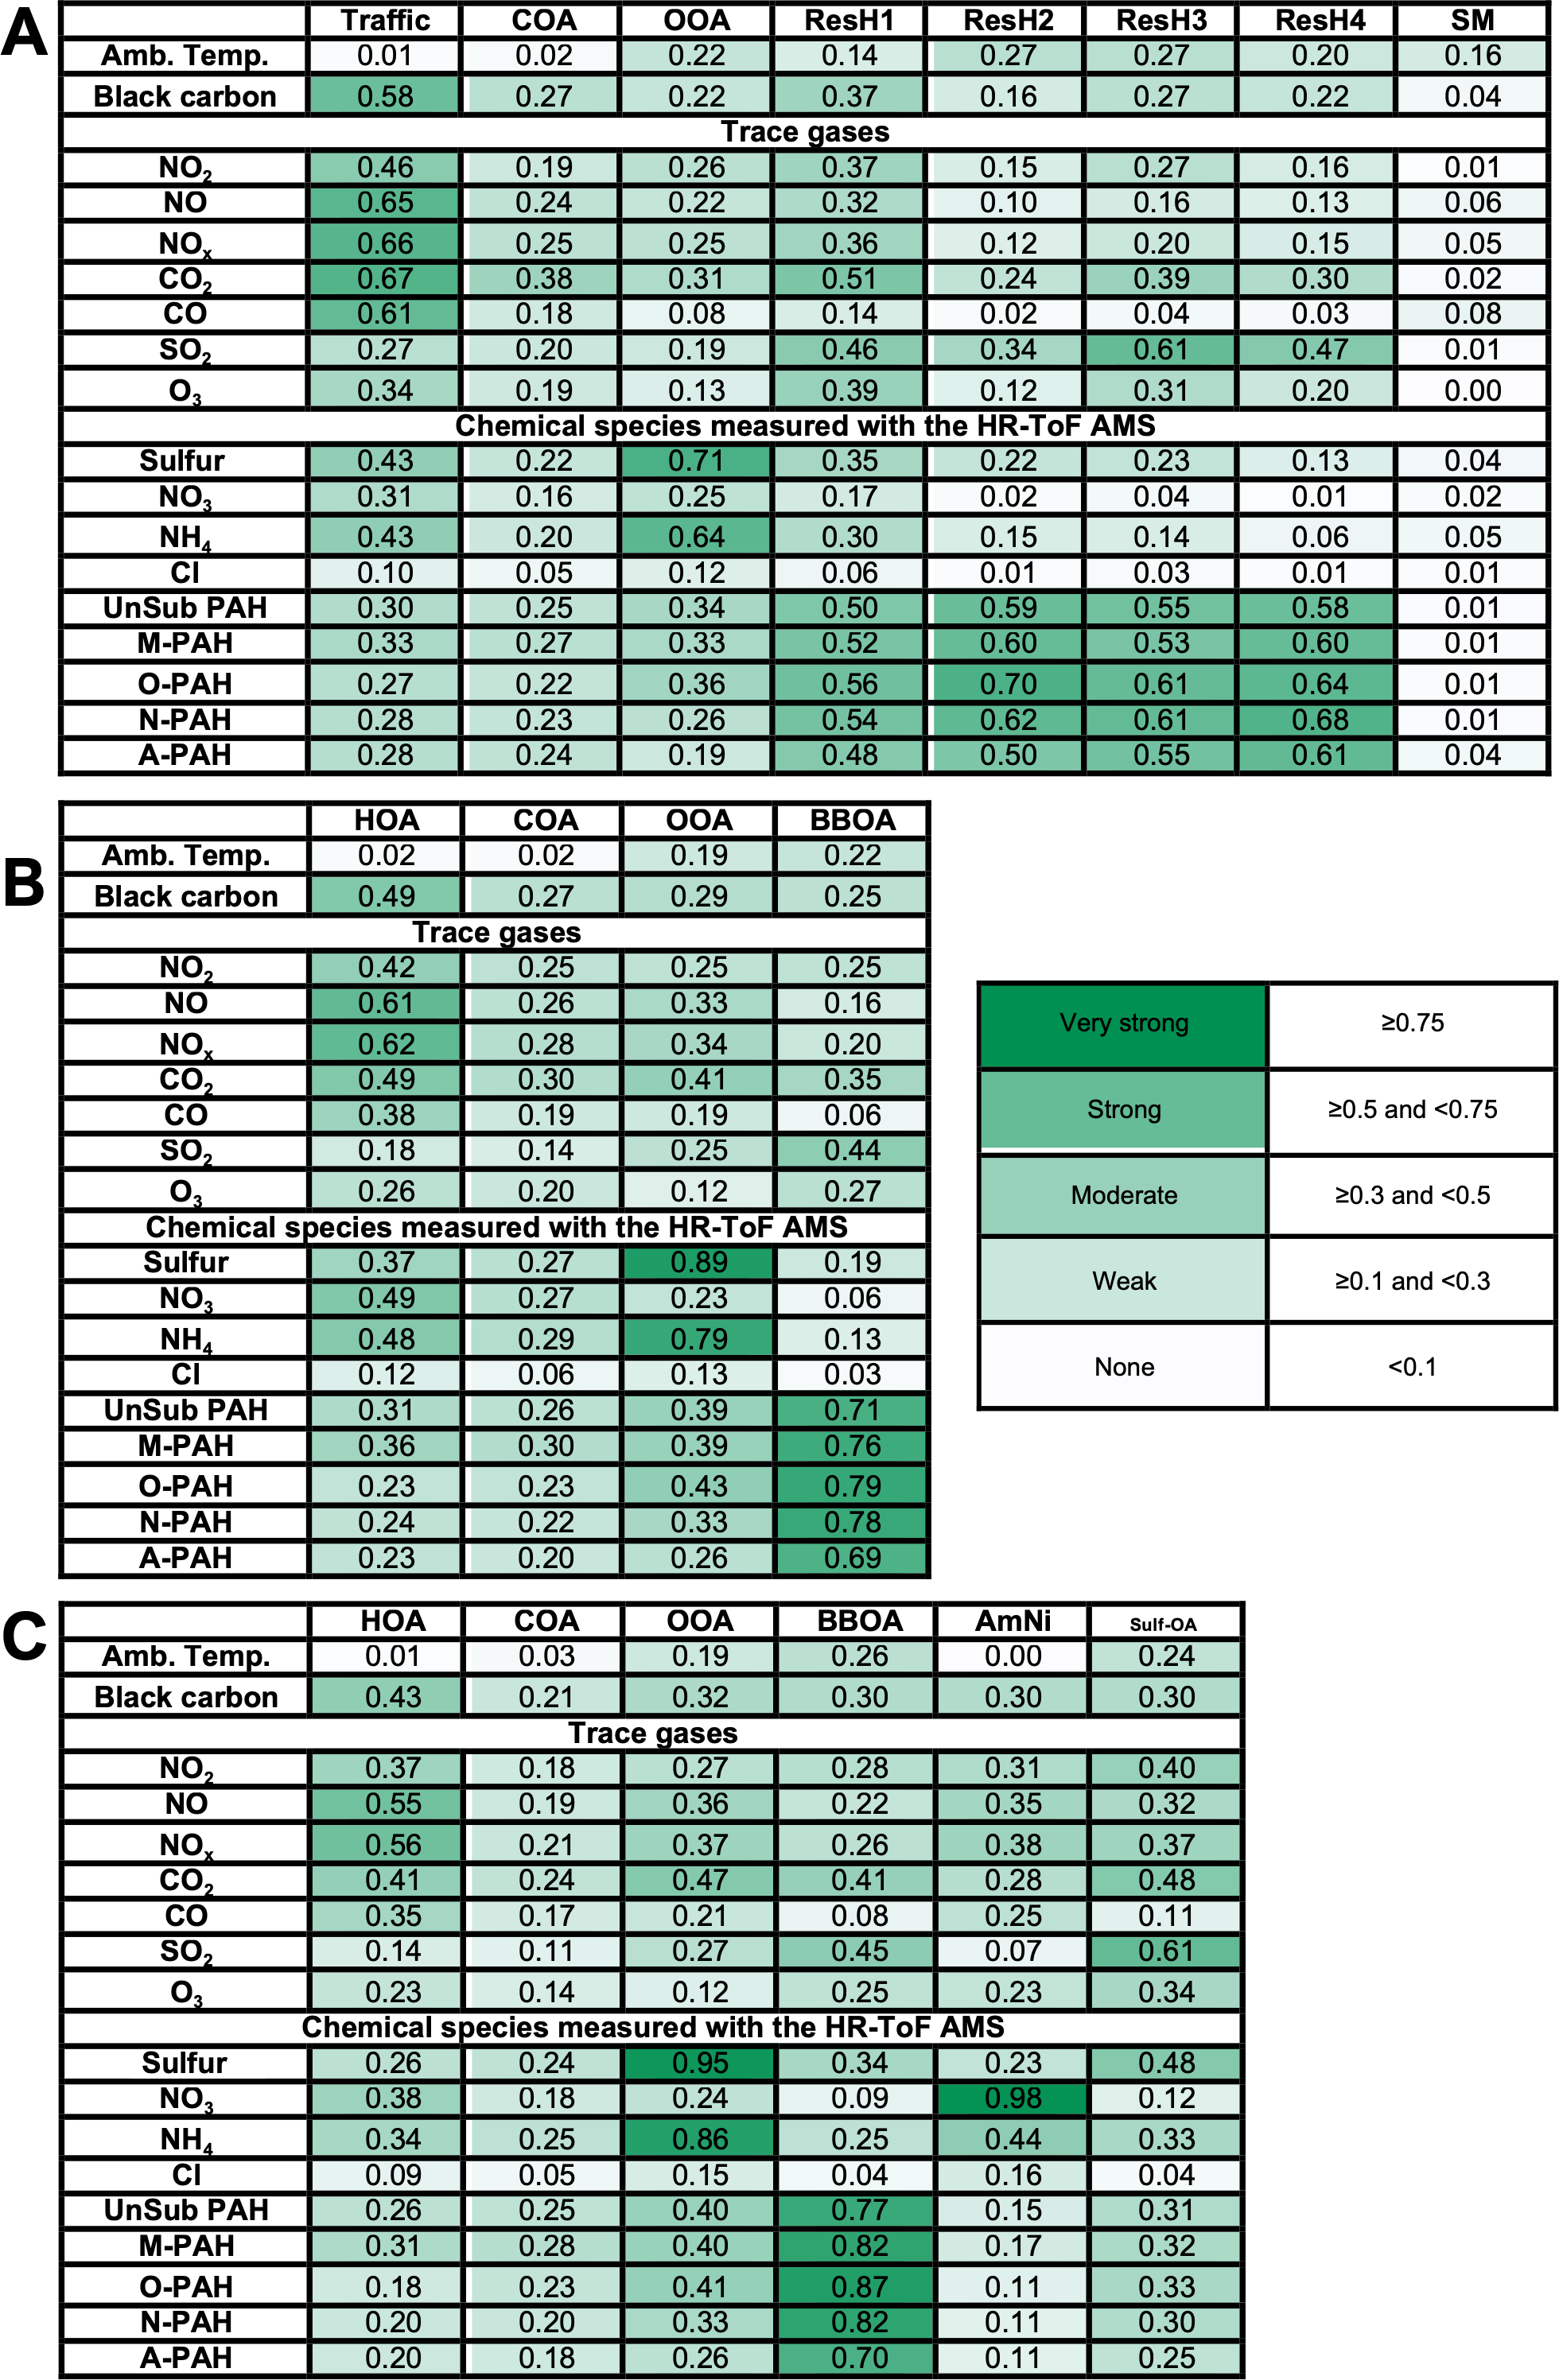
Table 1Linear regression (R2; p≤0.05) between the time series of factors derived from (a) PTRCHARON, (b) AMSorg, and (c) AMSorg + inorg measurements, with external tracers and chemical species (S- and N-containing species and PAHs) measured with the AMS.
3.2.2 Organic aerosol from residential heating
Both AMS analyses indicate that biomass burning was a major source of PM1 during the ALPACA campaign. On average, BBOA contributed (28±18 % of total OAAMS) and NR-PM1 (19±14 % of total NR-PM1 mass). The mass spectra of BBOAAMS featured a strong peak at 60 () and 73 () (Fig. S10A and B). These fragments are markers of anhydrosugars in wood-forming polymers, such as cellulose. Wood combustion has previously been estimated to be the largest emitter of aerosols in Fairbanks and surrounding areas, where it may produce as much as 80 % of the aerosol load. Wood-burning emissions are also the major driver of the spatial variability of PM2.5 and BC in Fairbanks during strong atmospheric temperature inversions. Other typical residential heating sources of emissions in Fairbanks include coal, gas, and fuel oil.
The BBOAAMS factor was strongly correlated with PAHs (R2≥0.7), while a moderate correlation was observed with SO2 (R2=0.4; Table 1). While PAHs are a major component of biomass combustion emissions, the emission of SO2 is largely associated with coal and oil combustion (Smith et al., 2011; Dunleavy and Brune, 2019). However, the AMS was unable to distinguish between multiple combustion-related sources. As shown in the diurnal plots in Fig. 3, the concentration of the BBOAAMS factor enhanced at ∼1800 AKST stayed stable through the night and then decreased in the early morning. Its lowest mass concentrations occurred during the afternoon (13:00–15:00 AKST). Therefore, BBOAAMS was associated with residential heating – the combustion of various fuels by residents within their homes (non-commercially), such as in wood-burning stoves, furnaces, and boilers, for heating their living spaces. We did not find evidence of OA or NR-PM1 from commercial heat sources, such as power plants, likely due to their small contribution to surface-level aerosol, as smokestacks typically lie above the inversion layer.
PTRCHARON apportioned of OACHARON, on average, to four distinct residential heating-related sources expressed as ResH1–4 (62±26 % of total OACHARON). These factors closely co-varied in time and were correlated reasonably well (R2 = 0.5–0.7; Table S5) with the BBOAAMS factor. In addition, combining all four residential heating-related factors in PTRCHARON into a composite factor increased the correlation (R2) with AMSorg and AMSorg + inorg to 0.79 and 0.82, respectively, suggesting that PMF was unable to effectively separate these closely co-varying residential heating factors in the AMS dataset.
The four factors from PTRCHARON were identified as different sources based on the distribution of key marker species and their correlation with external (e.g. trace gases) and internal (e.g. PAH) influences. Levoglucosan is used here as an internal tracer of biomass burning, being relatively stable under atmospheric conditions (Fraser and Lakshmanan, 2000). Protonated levoglucosan ( 163) and its fragments (at 85, 127, and 145) were found in ResH1, ResH4, and ResH2 with 30 %, 26 %, and 14 % of the total signal, respectively (Fig. S11), suggesting that they originate from biomass wood-burning (Figs. 4 and S11). These three factors collectively accounted for (47±20 %) of total factorized OACHARON.
ResH1 includes low-temperature combustion markers. This factor is small as it contributes only an average of (14 %) of the total OACHARON, but it contains the highest fraction of levoglucosan (∼30 %). Approximately 65 % of the total signal of ResH1 is due to compounds with six or fewer carbon atoms, compared to heavier species present in the other factors (Fig. S13). The most abundant species are at 69.03 (C4H4O; furan) (Palm et al., 2020; Jiang et al., 2019), 87.04 (C4H6O2; oxobutanal) (Brégonzio-Rozier et al., 2015), 97.03 (C5H4O2; furfural), 109.0286 (C6H4O2; benzoquinone) (Stefenelli et al., 2019b), and 115.04 (C5H6O3; methyl-dihydrofuran) (Koss et al., 2018). Consistent with these molecular formulae, the concentration-weighted average OC of ResH1 was relatively higher (i.e. 0.42) compared to other residential heating factors (O/C = 0.2–0.3). The most abundant species observed in ResH1 can be attributed to depolymerization reactions occurring during low temperatures and the early stages of the combustion process (Collard and Blin, 2014; Sekimoto et al., 2017).
ResH2 and ResH4 include OA from hardwood and pinewood combustion, respectively. Two more factors associated with wood burning were ResH2 and ResH4. Their average concentrations were 1.1±1.9 and , respectively, corresponding to 28 % and 20 % of OACHARON (Fig. 6). ResH2 was the dominant factor in the PMF and could reach during the most severe pollution episodes. Both factors were associated with particles greater than 300 nm (Fig. S12), typical of wood smoke (Glasius et al., 2006), and presented unique molecular signatures of different wood types (Fig. S11). Generally, the specific nature of wood cannot be inferred unambiguously because the emissions of known marker species, such as levoglucosan or methoxy phenols, vary not just with fuel used and its quality but also with the type of heating appliance, operational conditions, appliance efficiency, and stage in the combustion cycle (Fine et al., 2002; Alves et al., 2017). Regardless, several studies (Fine et al., 2002; Schauer and Cass, 2000; Kawamoto, 2017) have distinguished between softwood and hardwood by investigating the presence of marker compounds, which were also observed in our study, such as substituted phenols and resin acids (Fig. S11).
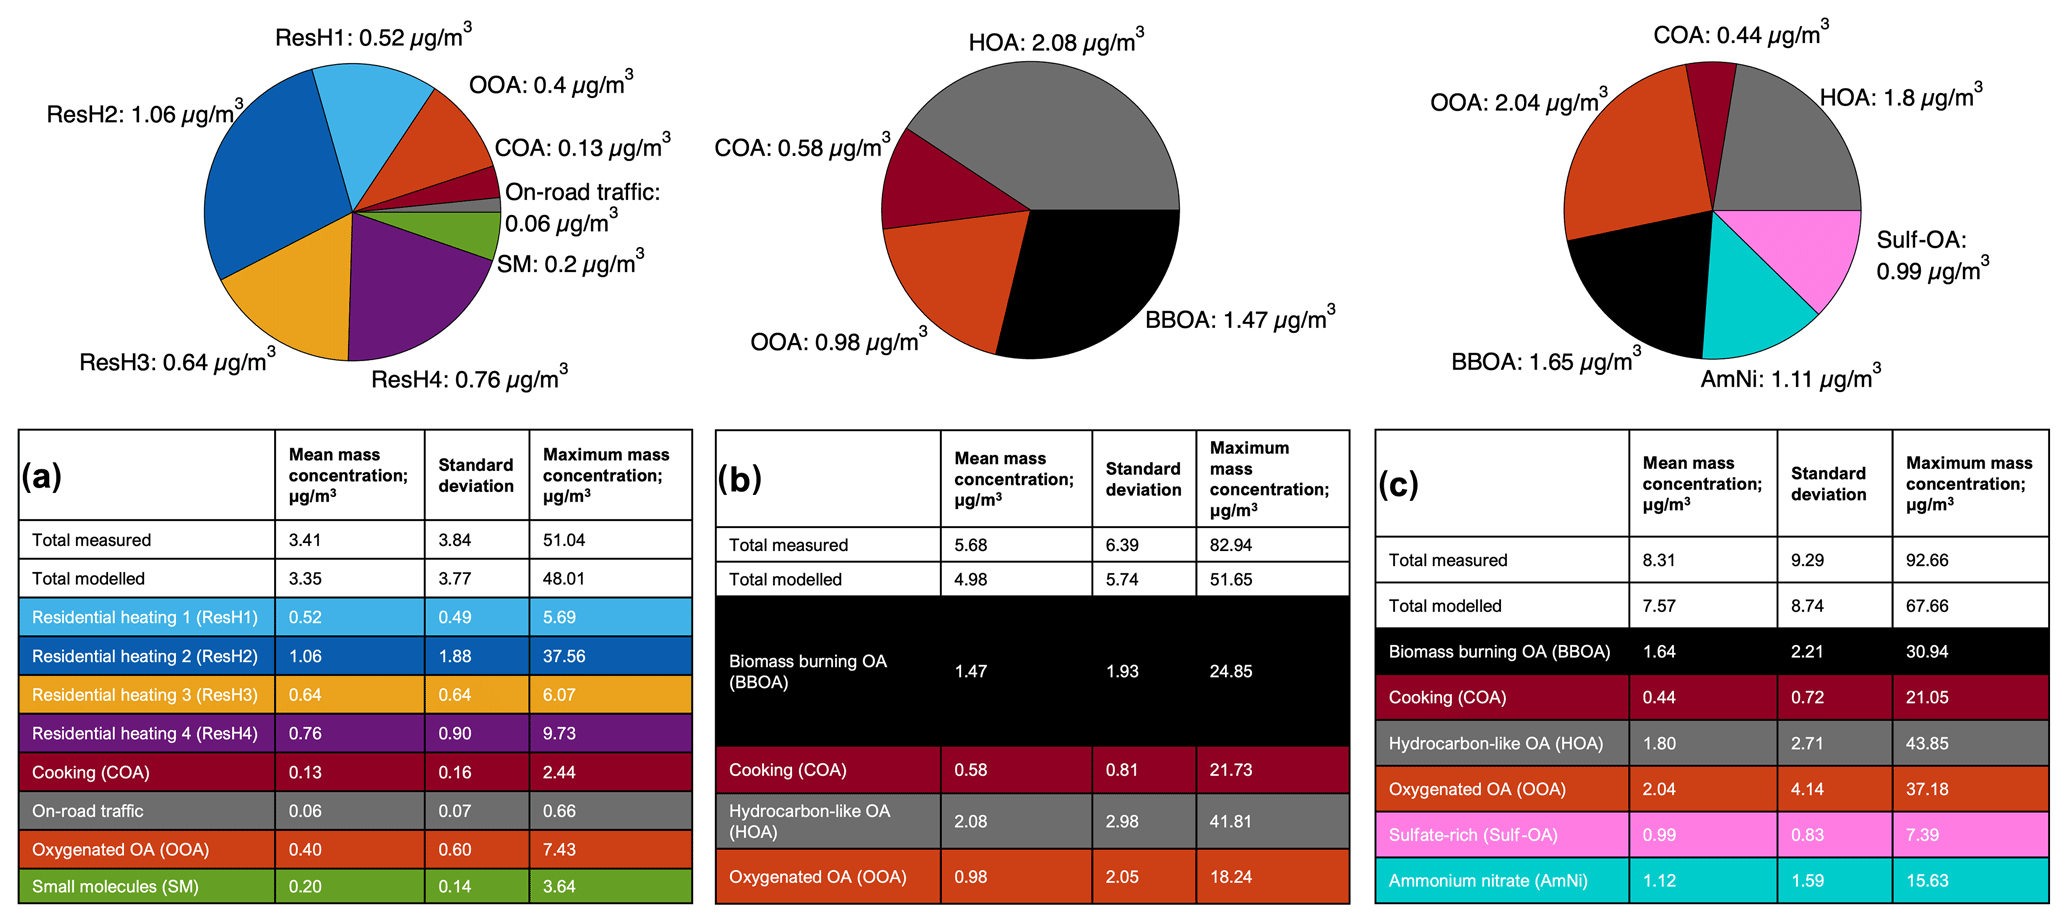
Figure 6Campaign averages of mass concentrations apportioned to each factor in (a) PTRCHARON, (b) AMSorg, and (c) AMSorg + inorg analyses. Slices of pies are equivalent to the average absolute concentrations. A complete time series of fractional contributions can be found in Fig. S14.
ResH2 featured an abundance of methoxy phenols, including C7H8O2 (guaiacol), C8H10O3 (syringol), C10H10O3 (conifer aldehyde), C6H6O2 (benzenediol or methyl-furfural), and C8H10O2 (creosol), which collectively accounted for ∼9 % of the total signal compared to 1,%, 2,%, and 2 % in ResH1, ResH3, and ResH4, respectively. These compounds are important products of lignin pyrolysis in birch, aspen, and spruce and are usually detected in the gas phase at mild ambient temperatures (Kong et al., 2021). Guaiacol and syringol are depolymerization products of guaiacyl and syringyl units of lignin at 200–400 °C, and they rapidly transition to catechols, cresols, and phenols during secondary pyrolysis reactions at 400–450° C (Kawamoto, 2017). While guaiacols are emitted by both hardwood and softwood, semi- or low-volatility substituted syringols are emitted in higher amounts by hardwood combustion (Kawamoto, 2017; Fine et al., 2002, 2001; Schauer and Cass, 2000). In this study, derivatives of guaiacols, including C10H12O2 (eugenol), C10H14O2 (4-propyl guaiacol), and C10H10O3 (conifer aldehyde), presented higher “relative concentration” (Eq. S3 in the Supplement) of 0.56–1.41 for ResH2 and ResH4 compared to ResH1 (<0). Other compounds, such as C8H8O3 (vanillin), C9H10O3 (acetovanillone), C10H12O3 (propiovanillone), and C10H12O4 (methyl-homovanillate), were predominantly found in ResH2. Similarly, substituted syringols, i.e. C11H14O3 (methoxy eugenol), C10H12O4 (acetosyringone), and C11H14O4 (syringyl acetone, propionyl syringol, or sinapyl alcohol), were almost entirely associated with ResH2 as well. These compounds have been reported as markers of hardwood burning (Fine et al., 2001), implying a greater contribution of hardwood emissions to the ResH2 factor. In Alaska, relevant hardwood species include deciduous leafy trees such as paper birch, balsam poplar, and quaking aspen. (Alaska Department of Environmental Conservation, 2023).
The ResH4 factor presented a unique fingerprint characterized by oxygenated molecules bearing more than 13 carbon atoms (Fig. S13), such as C16H30O6 ( 319.21), C20H28O2 ( 301.21), C20H18O4 ( 323.12), C20H30O2 ( 303.24), and C22H18O ( 299.14), in addition to the levoglucosan marker ions (26 % of the total signal). The intense signals from 301 (C20H28O2) and 303 (C20H30O2) (Fig. S11) are likely related to resin acids, dehydroabietic acid, and abietic acid, respectively, which are almost exclusively emitted from the thermal alteration of resins in coniferous species, and thus are indicative of softwood burning (Simoneit, 2002, 1999). Due to the presence of these compounds, ResH4 was interpreted as an OA factor influenced by softwood combustion. Softwood species in Alaska include trees with needles and cones, such as hemlock, cedar, and spruce (Adec, 2023).
ResH3 includes OA from heating oil combustion. This factor contributed to 16±9 % of the total OACHARON (). It showed the characteristic diurnal pattern of residential heating as it correlated quite well (R2=0.56) with BBOAAMS, org. However, its chemical composition differed from that of the other residential heating factors. Notably, levoglucosan contributed to a smaller fraction of the total signal of ResH3 (i.e. 9 %) compared to other residential heating factors (14 %–30 %; Fig. S11), while PAHs represented a much larger fraction of its total signal (for instance, 30 %, 31 %, and 29 % of C16H10 ( 203.09), C18H12 ( 229.10), and C20H12 ( 253.10); Fig. S13). These PAHs could be fluoranthene (or pyrene), naphthacene (or benzo(x)anthracene, chrysene), and benzo(x)pyrene (or benzo(x)fluoranthene), which have been reported in emissions of light oil combustion (Bari et al., 2009). Additionally, ResH3 was strongly correlated with SO2 (R2=0.61), compared to a lower correlation (R2≤0.47) with the other residential heating factors. The residential combustion of heating oil is an important source of SO2 in Fairbanks, compared to wood and coal. This is because ∼ two-thirds of households use oil-fired space heaters with high sulfur content of >1600 ppm (e.g. no. 1 and no. 2 fuel oil and waste motor oil) (Dunleavy and Brune, 2019). Consistent with the possibility of the ResH3 factor being associated with fuel oil emissions, the factor is characterized by particles smaller than 100 nm (Fig. S12), and due to the CHARON inlet's cut-off, its mass concentration was possibly underestimated.
3.2.3 Hydrocarbon-like organic aerosol
The HOAAMS factors were characterized by notable peaks at 43 (), 57 (), 71 (), 85 (), and 99 (), belonging to the series, typical of n- and branched alkanes. Additional peaks at 55 (), 69 (), 81 (), 83 (), 95 (), 97 (), 107 (), 109 (), and 111 () represented the and series, related to cycloalkanes (McLafferty and Tureč̌ek, 1993). These ions are associated with engine-lubricating oils, vehicular exhaust, and diesel fuel (Canagaratna et al., 2004). The HOAAMS factors contributed 38±20 % and 21±14 % of the OAAMS and NR-PM1 mass, respectively (Figs. 6 and S14).
The unconstrained PTRCHARON analysis was unable to apportion a road-transport-related factor; however, by constraining the factorization with the time series of a mobile petrol factor, identified in the gas-phase PTR-ToF MS analyses of the ALPACA campaign (Temime-Roussel et al., 2022), a small road-transport-associated factor was identified. For instance, the latter was strongly correlated with black carbon and NOx (R2 of 0.58 and 0.66; Table 1) and featured high contributions of C8H10 (xylene, ethylbenzene), C7H8 (toluene), and C6H6 (benzene) (Figs. 4 and S11). Despite exhibiting some reasonable diurnal trends peaking during the morning (09:00 AKST) and evening (17:00–16:00 AKST) rush hours (Fig. 5), the factor accounted for negligible concentrations () and presented some unlikely species, such as 315.22 (C21H30O2; possibly cannabidiol) absent in the unconstrained PMF. For instance, on average, of OA was associated with HOAAMS, org, compared to only for the road transportCHARON factor (Fig. 6). These discrepancies are largely instrumental, partly due to the poor transmission of the small particles (<100 nm) by the CHARON inlet and the limited sensitivity towards hydrocarbons by PTR, but other possible biases can be due to the heating oil OA signal interfering with HOAAMS, as discussed in Sect. S8.
3.2.4 Cooking organic aerosol
Another primary factor identified in Fairbanks was cooking, likely arising from residential or commercial activities around the CTC. The COAAMS factor featured a high abundance of ions, along with prominent O1 fragments at 55 (C3H3O+), 84 (C5H8O+), and 98 (C6H10O+), originating from organic acids (Mohr et al., 2009) and used as diagnostic markers of COA in urban settings (Sun et al., 2011). The value (i.e. the ratio of fractions of to ) was ∼3.00 for COAAMS, compared to ∼1.04 for HOAAMS (Fig. S10D). As a reliable tracer for COA remains unidentified in the AMS spectrum, a is considered a characteristic feature (Katz et al., 2021; Sun et al., 2011). The PMF analysis of PTRCHARON also revealed a distinct COA factor dominated by the long-chain fatty acids C18H32O2, C18H34O2, and C18H36O2, identified as linoleic, oleic, and stearic acids, respectively, contributing 11 %, 16 %, and 4 % to the total COACHARON mass (Figs. 4 and S11). These fatty acids are commonly found in OA from cooking oil and meat (Katz et al., 2021; Mohr et al., 2009). COACHARON contributed a maximum of ∼9 % of the total OACHARON mass and exhibited a unique diurnal pattern visualized in Fig. 5, with a minor maximum in the afternoon (lunchtime) and a second maximum in the evening (dinnertime). The average absolute concentrations of COA were 0.6±0.8 for the AMS and for PTRCHARON. Such a discrepancy can be explained by the same reason discussed above and detailed in Sect. S9.
3.2.5 Oxygenated organic aerosol
Past source apportionment studies have reported multiple OOA factors differing in volatilities or oxygenation levels (e.g. Stefenelli et al., 2019a; Kumar et al., 2022; Cash et al., 2020). Here, we diagnosed only a single OOA factor in either AMS or PTRCHARON measurements. Specifically, the OOAAMS factors were identified based on a prominent peak at 43 (C2H3O+) and 29 (CHO+; Fig. S10A) and showed a strong correlation (R2=0.74) with OOACHARON. The average absolute concentrations of OOACHARON and OOAAMS, org were 0.4±0.6 and , respectively. Notably, the most intense ions in the mass spectrum of OOACHARON have been tentatively assigned to 73.03 (C3H5O2, e.g. methyl-glyoxal), 99.04 (C5H6O2, e.g. oxo-pentanal), 113.06 (C6H8O2, e.g. methyl-oxo-pentanal), 127.08 (C7H10O2; e.g. heptadienoic acid), 137.06 (C8H8O2; e.g. methoxy-benzaldehyde), 167.10 (C10H14O2), 171.07 (C8H10O4), and 185.10 (C13H12O; e.g. benzyl phenol). Among these compounds, some have previously been associated with the atmospheric oxidation or photolysis of BBOA (Montoya-Aguilera et al., 2017; Lignell et al., 2013; Smith et al., 2020), while others could be due to the oxidation of aromatic VOCs originating from road transport (Temime-Roussel et al., 2022). Few other species overlapped with the residential heating tracers, notably 163.06 (C6H10O5; e.g. levoglucosan), 179.08 (C10H10O3; e.g. conifer aldehyde), and 301.21 (C20H28O2; e.g. dehydroabietic acid). However, given the prominence of wood burning as a major primary emission, the OOA is likely linked to BBOA. A recent study in Fairbanks identified wintertime OOA as a mixture of BBOA and SOA formed from non-photochemical processing using ACSM (Robinson et al., 2024). The examination of f44 versus f60 in the AMSorg dataset plot (Fig. S10C) is consistent with aged OOA derived from biomass burning, as previously demonstrated by Xu et al. (2023). Another recent source apportionment study using the HR-ToF AMS at a site close to the CTC did not identify an OOA factor, while BBOA, HOA, and a mixed primary factor (HOA, COA, etc.) comprised 45 %, 25 %, and 31 % of total OA, respectively (Yang et al., 2024). A limited OOA formation is plausible due to reduced solar light exposure during this period of the year (Cesler-Maloney et al., 2024). However, the absence of OOA is more likely a result of an unresolved organic fraction.
Sulfate and OOA. An intriguing insight about the OOA factor emerged from the AMSorg + inorg measurements, indicating the significant content of sulfur-containing compounds (Fig. S15). The AMS does not distinguish between the different sulfur-containing species, but following guidelines from previous works (Chen et al., 2019; Schueneman et al., 2021), we could explore the ratio of sulfur fragments to investigate the presence of different species such as hydroxymethanesulfonate (HMS; CH2(OH)SO−3), (bisulfite), (sulfate), and H2SO4 (sulfuric acid). An organosulfate content of () was then derived using the ratios of SO+ and ions against , , and ions, as detailed by Song et al. (2019). This value is in good agreement with previous reports from the same field campaign (Campbell et al., 2022; Robinson et al., 2024). Additionally, to mimic the potential matrix effects of wood-burning OA on sulfate fragmentation patterns, AMS spectra from a solution of (NH4)2SO4 mixed with various amounts of levoglucosan (i.e. 0 %–80 % in mass) were compared to ambient data and PMF factors, as shown in Fig. S16a. Among the sulfate-rich factors, OOAAMS, org + inorg exhibited lower to intensities, suggesting a higher fraction of organosulfate compounds, as is also evidenced in Fig. S16D and E by the strong correlation between the derived organosulfur fraction and sulfate ions in the OOAAMS, org + inorg factor (R2=0.85, slope=0.57).
Further information on chemical composition was gathered by comparing the AMS results to the IC measurements from the PM0.7 filters sampled as part of another ALPACA study (Dingilian et al., 2024). Despite the good correlations between the two datasets, as shown in Fig. 7a, the AMS underestimated sulfate, ammonium, and nitrate by 30 %, 26 %, and 35 %, respectively (see Sect. 2.2.2). Both the total estimated organosulfur fraction and the OOAAMS, org + inorg factor presented robust correlations (R2>0.90) with the S(IV) and HMS ions from the filter analysis and a somewhat weaker correlation () with the ion (Figs. 7 and S16F–I). The OOAAMS, org + inorg factor was also strongly correlated with ammonium (AMS data R2=0.86, Table 1; filter IC R2=0.77, Fig. 7b), potentially promoting the formation of S(IV) species (Campbell et al., 2024). This author also reported that S(IV) species, including HMS, represented the major secondary organosulfur component of PM2.5 in Fairbanks during wintertime, contributing 26 %–41 % of total sulfate (Campbell et al., 2022). Overall, the molecular-level composition of OOA from PTRCHARON and the inorganic chemical information from AMSorg + inorg, as well as diurnal patterns with enhanced concentrations in the afternoon (Fig. 3), are indicative of chemical daytime processing, underscoring the need for further exploration of the atmospheric processing pathways involved.
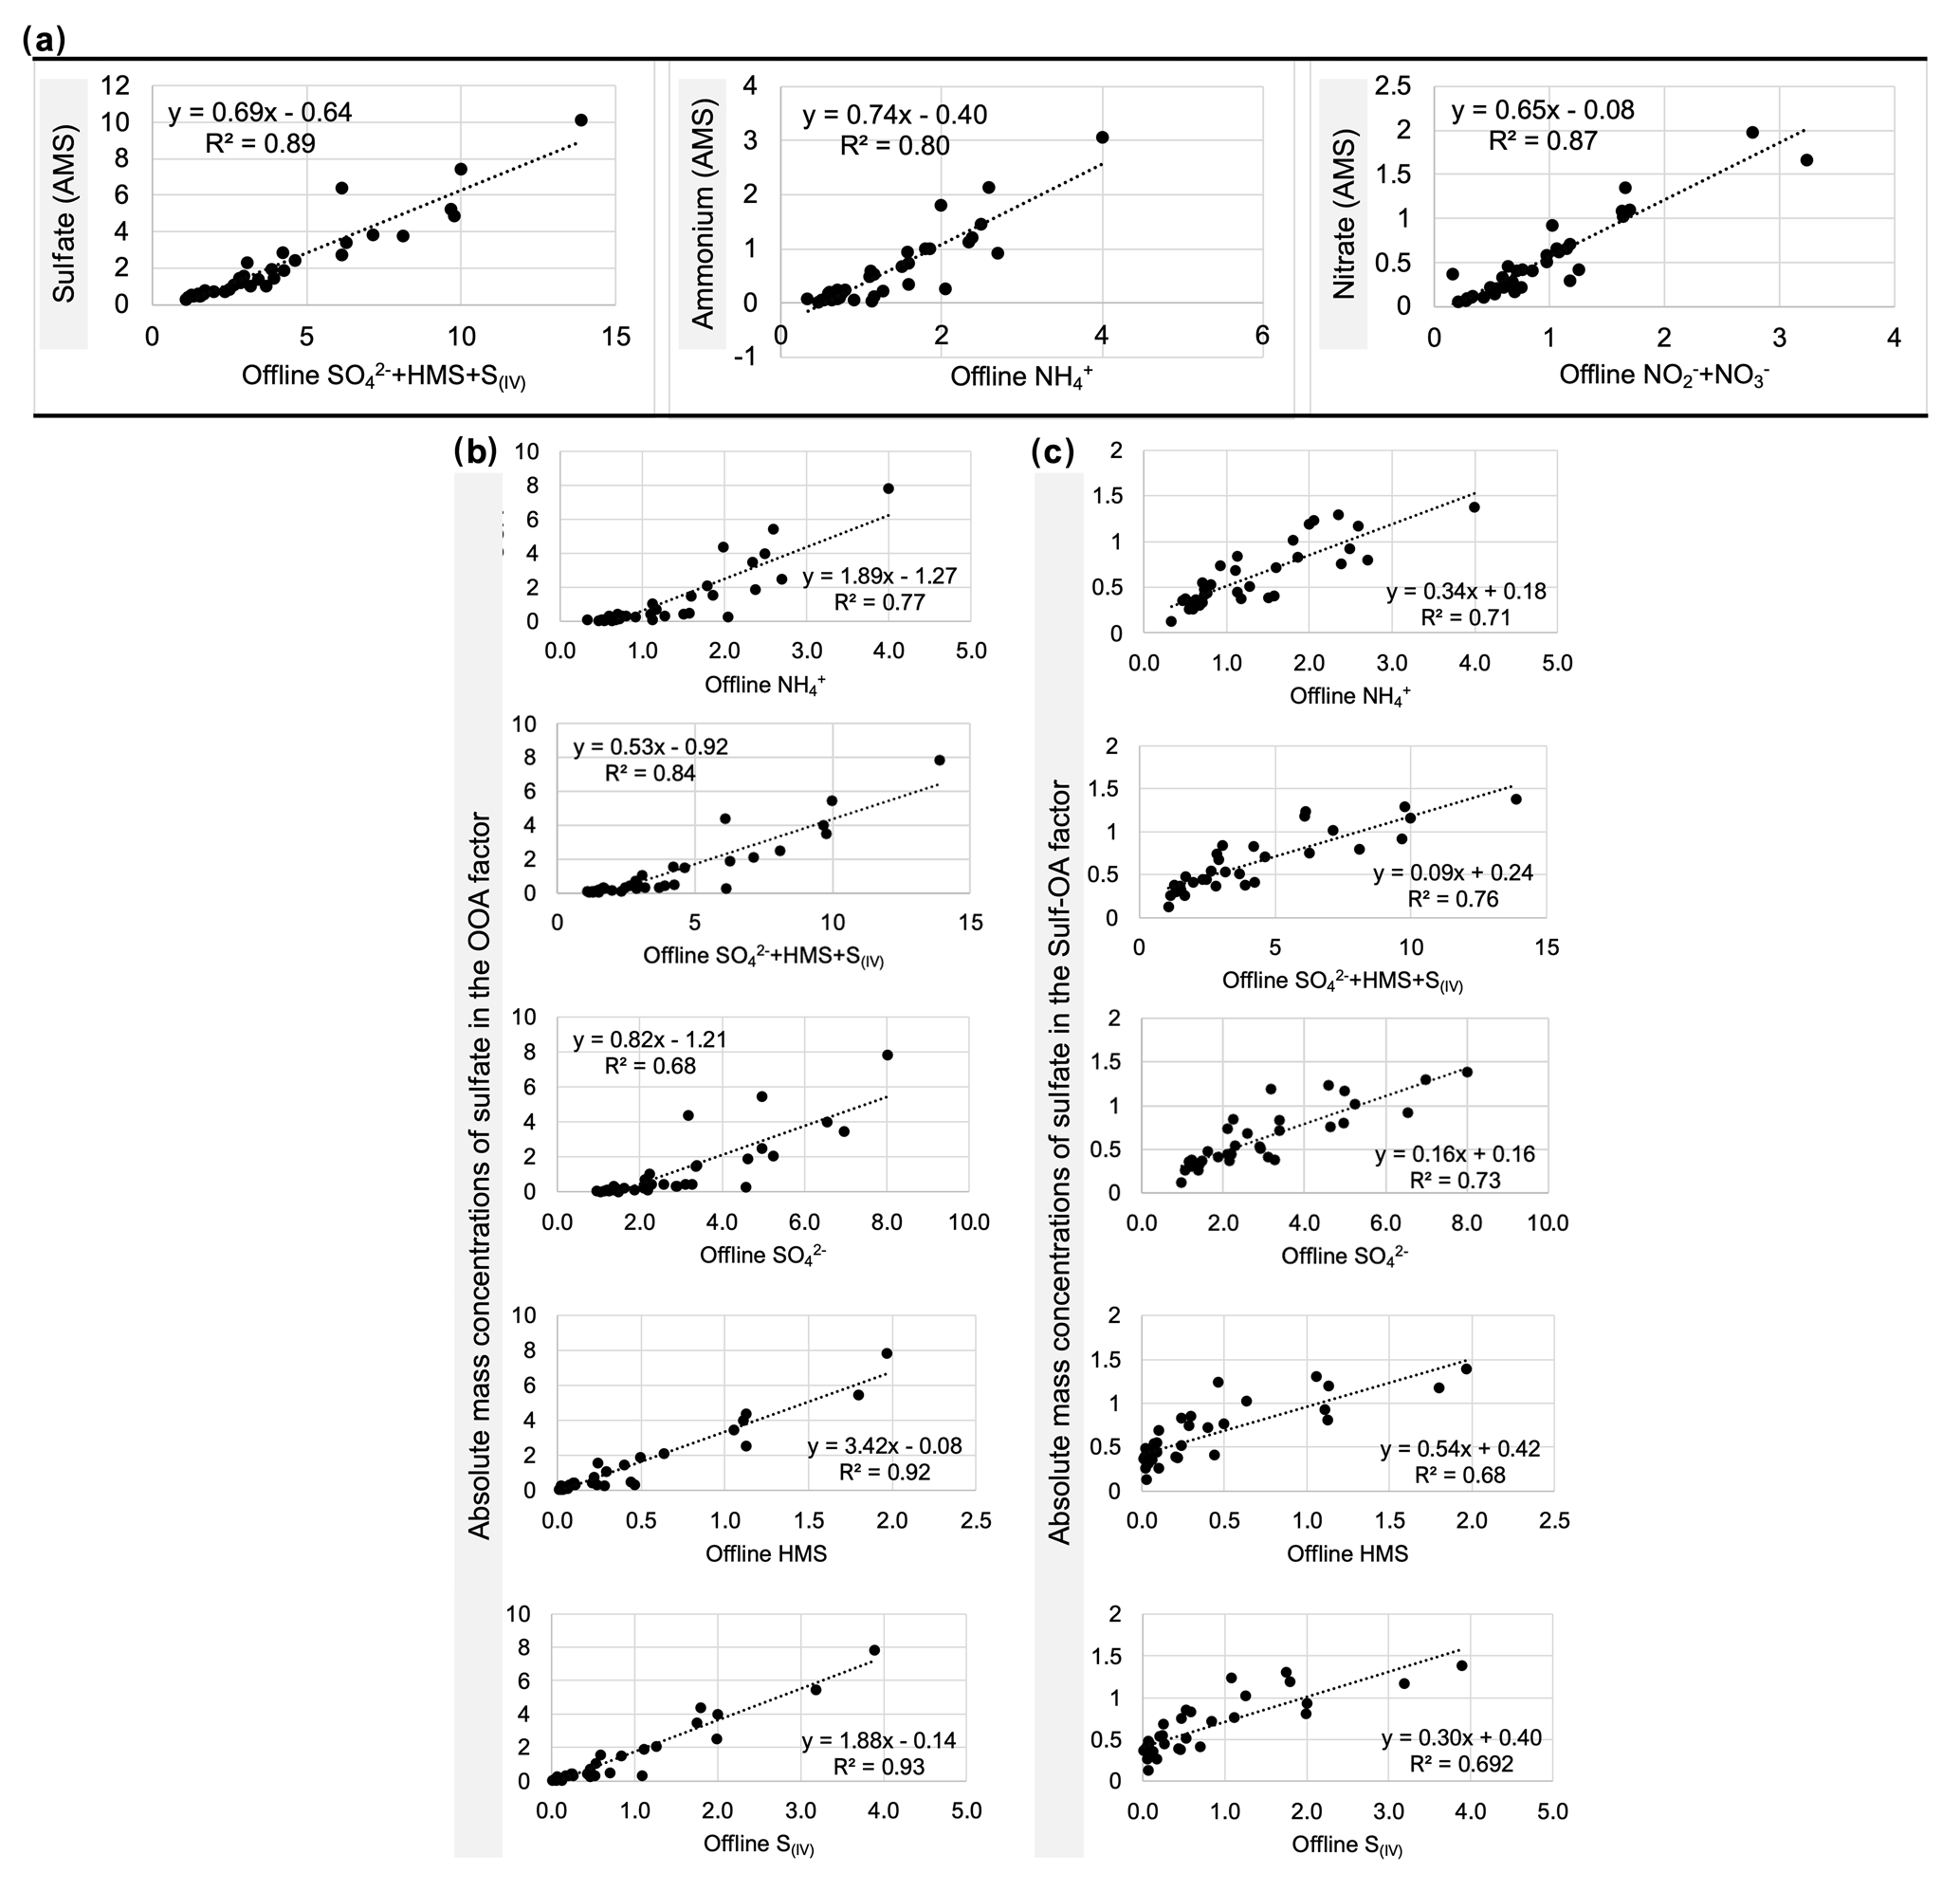
Figure 7Scatter plots showing the correlation (R2; p≤0.05) between inorganic species measured with the AMS and offline ion chromatography of chemical species in PM0.7 collected on filters. Comparison of (a) total mass concentrations of sulfur- and nitrogen-containing species, (b) OOAAMS, org + inorg factor with different species from IC analysis, and (c) sulf-OA factor with different species from IC analysis.
3.2.6 Additional insights from combined analysis of organic and inorganic AMS data
Two additional factors, sulf-OA (i.e. sulfur-rich OA) and AmNi (i.e. ammonium nitrate), were observed from the PMF of AMSorg + inorg (Fig. 3). Approximately 40 %–60 % of these factors' masses comprised sulfur and nitrogen species (Fig. S15).
Sulfur-rich organic aerosol. Sulf-OA is composed of sulfate (60 %), organics (30 %), ammonium (6 %), and nitrate (4 %). The chemical composition was further explored via the analysis detailed in Sect. 3.2.4, as shown in Fig. S16A, where the factor is positioned between H2SO4 and (NH4)2SO4. The measured [NH4][SO4] ratio was 0.07, considerably lower than the theoretical mass ratio of 0.38 and 0.18 of (NH4)2SO4 and NH4HSO4, respectively, indicating the acidic nature of sulf-OA (Chen et al., 2019). The factor was well correlated with SO2 (R2=0.6) and moderately correlated with the ResH3 factor (R2 of 0.33). The factor was also associated with ultrafine particles in the 50–80 nm range (Fig. S12D). Regardless of the low correlation, we speculate that ResH3 and sulf-OA originated from the same source, i.e. the residential combustion of heating oil, and their temporal disagreement may result from instrumental biases of the CHARON inlet in quantifying particles smaller than 100 nm (Fig. S12B and D). For instance, as shown in Fig. S12E and F, the organic ResH3 supersedes sulf-OA concentrations when larger particles are abundant, and it has lower concentrations of smaller particles.
This factor contained () of total sulfate measured with the AMS, and it dominated during the low-pollution periods, which were more frequent and lasted longer than the high-pollution events (Fig. 1). Other primary factors, HOAAMS, org + inorg, COAAMS, org + inorg, and BBOAAMS, org + inorg, contained an additional 11±9 % of sulfate (), so collectively, primary factors made up 69±24 % () of total sulfate. This value is in close agreement with a previous ALPACA study that reported ∼62 ±12 % of total mass to be of primary origin (Moon et al., 2023).
AmNi factor. The second inorganic factor was composed of 35 % nitrate, 14 % ammonium, and 43 % organics, accounting for 71±23 % of the total nitrate measured by the AMS (R2=0.98). The average concentration of this factor and the nitrate species in it were 1.1±1.6 and . The factor was more abundant when NOx concentrations were high (above 130 ppbv; Fig. S17b). Its diurnal trend peaked at around 14:00 AKST (Fig. 3), roughly 3–4 h after the morning peak of HOAAMS, and was associated with relatively small particles of 110 nm (Fig. S12D). A high contribution of aliphatic moieties characterized the organic fraction, and according to the difference in mass concentrations of HOAAMS, org and HOAAMS, org + inorg of 13 % (Fig. S17A), we speculate that some organic components of HOAAMS, org were transferred to the AmNi factor (Fig. 6). All these elements suggest a probable contribution from the vehicular emissions to this factor. The presence of inorganic compounds provided additional variables to the PMF, thereby improving the resolution of factors into distinct AmNi and HOAAMS, org + inorg factors.
During the period of the campaign, 12–48 h long ADEC advisories for wood-burning restrictions were implemented seven times. The variation in the relative contributions of ResH1–4 during these advisories is depicted in Figs. 8 and S18–S21. For all advisory events, ResH2 and ResH4, i.e. wood smoke, were the predominant contributors before and after the advisories were in place. A notable increase was observed in the ResH3 contribution, i.e. heating oil, during the second (stage 1), fifth (stage 1), sixth (stage 1), and seventh advisory events. At the same time, ResH2 (i.e. hardwood-related fuels) remained a prominent contributor to OACHARON during the third (stage 2), fourth (stage 1), and fifth (stage 1) advisories. Most households in Fairbanks use heating oil (∼72 % of residents), followed by wood (∼22 % of residents) (Dunleavy and Brune, 2019), which was not reflected in the relative contributions apportioned to ResH3. This can be linked to a higher PM1 release from wood combustion per given volume of fuel compared to heating oil and/or an underestimation of ResH3 by PTRCHARON being associated with a size smaller than 100 nm (Fig. S12).
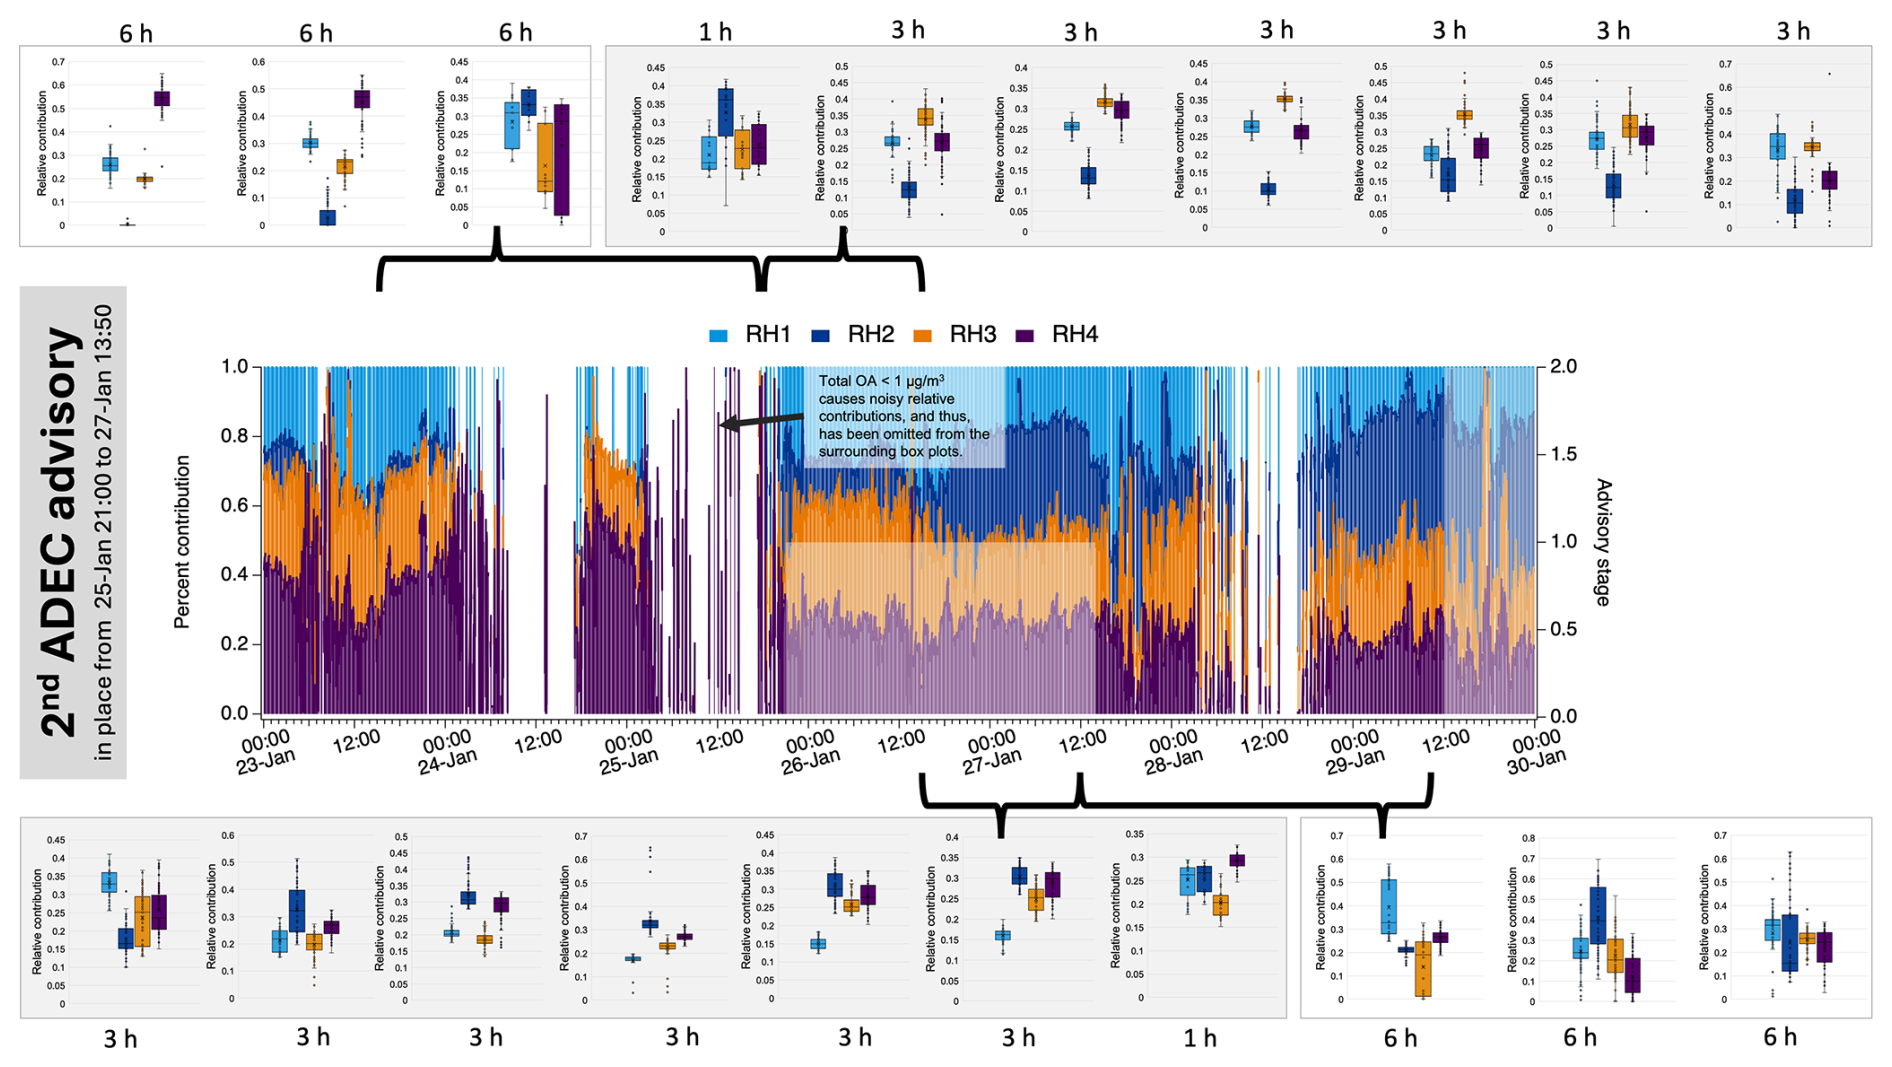
Figure 8Variation in the relative contributions of residential heating factors to total biomass-burning OA concentrations. For simplicity, only the second ADEC advisory implemented during the campaign is shown. Contributions are also shown for approximately 2 d before and after the advisory for comparison, along with their 6 h averages as box plots (white panels), when suitable data were available (e.g. periods with noisy data were omitted and the adjacent period is shown instead). For better visualization of variation in contributions, when the advisory was in place, 3 h averages are shown (grey panels). To account for a lag in the appearance of variations in emission sources, 1 h averages are shown for the beginning and end of the advisory event.
As expected, the absolute average concentrations of all factors were inversely related to ambient temperature; however, the per cent change differed considerably across factors. Specifically, as temperatures decreased from −10 °C to below −25 °C, the average absolute concentrations for transportCHARON, COACHARON, OOACHARON, and ResH1–4 increased 0.25 times, 0.75 times, 9.0 times, 1.4 times, 25.1 times, 3.0 times, and 2.9 times, respectively (Fig. S22). The steep increase in the relative contribution of ResH2, associated with hardwood tracers, contrasts with previous reports based on surveys (Dunleavy and Brune, 2019) and organic tracers (Haque et al., 2021), indicating birch and spruce as the most popular firewood in Fairbanks. Laboratory studies have shown that the burning of softwood pellets of Douglas fir or eastern white pine emits less PM than hardwood pellets of the same volume, and this response varies based on the moisture content of the wood and the heating appliance used (Morin et al., 2022). Also, ResH2 comprises a broader spectrum of volatile and semi-volatile substituted phenolic species. Thus, it is likely to undergo efficient gas-to-particle partitioning at low temperatures, leading to increased OA loads (Ijaz et al., 2025).
A CHARON inlet coupled with PTR-ToF MS and HR-ToF AMS were deployed during the Alaskan Layered Pollution And Chemical Analysis (ALPACA) campaign. The PMF analysis of the AMS data revealed three primary factors: biomass burning, hydrocarbon-like, and cooking factors, accounting for 28 %, 38 %, and 11 % of the total OA, respectively. A combined organic and inorganic PMF analysis provided additional insights. It revealed the presence of organosulfur compounds, mostly associated with the OOA factor and with another sulfate-rich factor of an acidic nature. A nitrate factor associated with hydrocarbon-like OA and high NOx levels was interpreted as aged road transport emissions. The PTRCHARON PMF analysis could differentiate between four residential heating sources – one oil combustion and three wood combustion types associated with a low temperature and softwood or hardwood combustion. Such factorization was achieved with the support of specific tracers that CHARON could successfully identify as furans, aromatic alcohols (resorcinol, guaiacol, eugenol, syringol), aldehydes (furfural, conifer aldehyde), acids (benzoic, dehydroabietic, abietic, linoleic, oleic, and stearic), and various PAHs. Collectively, all residential heating factors accounted for 79 % of the total OACHARON. Cooking and road transport were also recognized as primary sources by PTRCHARON. All PMF analyses could apportion a single secondary organic fraction accounting for 11 %–19 % of the total OA. This work demonstrates the complementarity of the two instruments and their ability to describe the complex chemical composition of PM1 and its related sources. The enhanced deconvolution of closely co-varying sources of ambient pollution epitomizes the novelty of our study. It demonstrates the capability of PTRCHARON to deliver detailed qualitative and quantitative insights, thus enabling a comprehensive understanding of organic aerosol sources. These advances can support environmental regulators and citizens' efforts in improving air quality in Fairbanks and in fast-urbanizing regional sub-Arctic areas.
The supporting text, figures, and tables are available in the Supplement.
The supplement related to this article is available online at https://doi.org/10.5194/acp-25-11789-2025-supplement.
The paper was written with contributions from all authors. BTR and BD'A set up, ran, and maintained the instrumentation during the campaign in Fairbanks. SA, NB, and ED aided during the campaign. MC-M collected and contributed meteorological and trace gas data. RJW, KKD, and AM provided data on the ion chromatography analysis of offline filter samples. BTR and AI processed and analysed the data, with help from BC. WS and KSL coordinated the ALPACA and CASPA projects. KSL, BD'A, BB, SB, JGF, JM, and JS contributed to funding acquisition for the CASPA project. BD'A supervised the project reported here.
The contact author has declared that none of the authors has any competing interests.
Publisher's note: Copernicus Publications remains neutral with regard to jurisdictional claims made in the text, published maps, institutional affiliations, or any other geographical representation in this paper. While Copernicus Publications makes every effort to include appropriate place names, the final responsibility lies with the authors.
We thank the ALPACA team of researchers and all others involved in designing the project and providing the necessary logistical support to carry it out. We thank Anna Tobler (Datalystica Ltd, Switzerland) for providing technical support for the SoFi analysis. We thank the MASSALYA instrumental platform (Aix-Marseille Université, Laboratory of Chemistry and Environment) for the measurements used in this publication. Amna Ijaz is grateful to Subuktageen Qitta, Nastaran Mahmud, Laal Boo’on-Wali, and Minuit Mahmud for the many valuable discussions that helped in the compilation of this report.
This research has been supported by the Agence Nationale de la Recherche (grant no. ANR-21-CE01-0017-04). Kayane K. Dingilian and Rodney J. Weber were supported by the Atmospheric Geoscience Program of the National Science Foundation (NSF; grant no. AGS-2029730) and the NSF's Navigating the New Arctic Program (grant no. NNA-1927778). Stephen R. Arnold acknowledges support from the UK Natural Environment Research Council (grant no. NE/W00609X/1).
This paper was edited by Ivan Kourtchev and reviewed by three anonymous referees.
Aiken, A. C., DeCarlo, P. F., and Jimenez, J. L.: Elemental analysis of organic species with electron ionization high-resolution mass spectrometry, Anal. Chem., 79, 8350–8358, 2007.
Aiken, A. C., Decarlo, P. F., Kroll, J. H., Worsnop, D. R., Huffman, J. A., Docherty, K. S., Ulbrich, I. M., Mohr, C., Kimmel, J. R., and Sueper, D.: OC and OMOC ratios of primary, secondary, and ambient organic aerosols with high-resolution time-of-flight aerosol mass spectrometry, Environ. Sci. Technol., 42, 4478–4485, 2008.
Alaska Department of Environmental Conservation: Know Your Wood, https://www.rural.dec.alaska.gov/air/burnwise/know-your-wood (last access: 31 August 2025), 2023.
Alves, C. A., Vicente, E. D., Rocha, S., and Vicente, A. M.: Organic tracers in aerosols from the residential combustion of pellets and agro-fuels, Air Qual. Atmos. Hlth., 10, 37–45, 2017.
Bari, M. A., Baumbach, G., Kuch, B., and Scheffknecht, G.: Wood smoke as a source of particle-phase organic compounds in residential areas, Atmos. Environ., 43, 4722–4732, 2009.
Brégonzio-Rozier, L., Siekmann, F., Giorio, C., Pangui, E., Morales, S. B., Temime-Roussel, B., Gratien, A., Michoud, V., Ravier, S., Cazaunau, M., Tapparo, A., Monod, A., and Doussin, J.-F.: Gaseous products and secondary organic aerosol formation during long term oxidation of isoprene and methacrolein, Atmos. Chem. Phys., 15, 2953–2968, https://doi.org/10.5194/acp-15-2953-2015, 2015.
Campbell, J. R., Battaglia Jr., M., Dingilian, K., Cesler-Maloney, M., St. Clair, J. M., Hanisco, T. F., Robinson, E., DeCarlo, P., Simpson, W., and Nenes, A.: Source and Chemistry of Hydroxymethanesulfonate (HMS) in Fairbanks, Alaska, Environ. Sci. Technol., 56, 7657–7667, https://doi.org/10.1021/acs.est.2c00410, 2022.
Campbell, J. R., Battaglia Jr., M., Dingilian, K. K., Cesler-Maloney, M., Simpson, W. R., Robinson, E. S., DeCarlo, P. F., Temime-Roussel, B., D'Anna, B., and Holen, A. L.: Enhanced aqueous formation and neutralization of fine atmospheric particles driven by extreme cold, Science Advances, 10, eado4373, https://doi.org/10.1126/sciadv.ado4373, 2024.
Canagaratna, M. R., Jayne, J. T., Ghertner, D. A., Herndon, S., Shi, Q., Jimenez, J. L., Silva, P. J., Williams, P., Lanni, T., and Drewnick, F.: Chase studies of particulate emissions from in-use New York City vehicles, Aerosol Sci. Tech., 38, 555–573, 2004.
Canagaratna, M., Jayne, J., Jimenez, J., Allan, J., Alfarra, M., Zhang, Q., Onasch, T., Drewnick, F., Coe, H., and Middlebrook, A.: Chemical and microphysical characterization of ambient aerosols with the aerodyne aerosol mass spectrometer, Mass Spectrom. Rev., 26, 185–222, 2007.
Canagaratna, M. R., Jimenez, J. L., Kroll, J. H., Chen, Q., Kessler, S. H., Massoli, P., Hildebrandt Ruiz, L., Fortner, E., Williams, L. R., Wilson, K. R., Surratt, J. D., Donahue, N. M., Jayne, J. T., and Worsnop, D. R.: Elemental ratio measurements of organic compounds using aerosol mass spectrometry: characterization, improved calibration, and implications, Atmos. Chem. Phys., 15, 253–272, https://doi.org/10.5194/acp-15-253-2015, 2015.
Canonaco, F., Crippa, M., Slowik, J. G., Baltensperger, U., and Prévôt, A. S. H.: SoFi, an IGOR-based interface for the efficient use of the generalized multilinear engine (ME-2) for the source apportionment: ME-2 application to aerosol mass spectrometer data, Atmos. Meas. Tech., 6, 3649–3661, https://doi.org/10.5194/amt-6-3649-2013, 2013.
Cash, J. M., Langford, B., Di Marco, C., Mullinger, N. J., Allan, J., Reyes-Villegas, E., Joshi, R., Heal, M. R., Acton, W. J. F., Hewitt, C. N., Misztal, P. K., Drysdale, W., Mandal, T. K., Shivani, Gadi, R., Gurjar, B. R., and Nemitz, E.: Seasonal analysis of submicron aerosol in Old Delhi using high-resolution aerosol mass spectrometry: chemical characterisation, source apportionment and new marker identification, Atmos. Chem. Phys., 21, 10133–10158, https://doi.org/10.5194/acp-21-10133-2021, 2021.
Cesler-Maloney, M., Simpson, W. R., Miles, T., Mao, J., Law, K. S., and Roberts, T. J.: Differences in Ozone and Particulate Matter Between Ground Level and 20 m Aloft are Frequent During Wintertime Surface-Based Temperature Inversions in Fairbanks, Alaska, J. Geophys. Res.-Atmos., 127, e2021JD036215, https://doi.org/10.1029/2021JD036215, 2022.
Cesler-Maloney, M., Simpson, W., Kuhn, J., Stutz, J., Thomas, J., Roberts, T., Huff, D., and Cooperdock, S.: Shallow boundary layer heights controlled by the surface-based temperature inversion strength are responsible for trapping home heating emissions near the ground level in Fairbanks, Alaska, EGUsphere [preprint], https://doi.org/10.5194/egusphere-2023-3082, 2024.
Chazeau, B., El Haddad, I., Canonaco, F., Temime-Roussel, B., d'Anna, B., Gille, G., Mesbah, B., Prévôt, A. S., Wortham, H., and Marchand, N.: Organic aerosol source apportionment by using rolling positive matrix factorization: Application to a Mediterranean coastal city, Atmos. Environ., 14, X100176, https://doi.org/10.1016/j.aeaoa.2022.100176, 2022.
Chen, G., Li, S., Zhang, Y., Zhang, W., Li, D., Wei, X., He, Y., Bell, M. L., Williams, G., and Marks, G. B.: Effects of ambient PM1 air pollution on daily emergency hospital visits in China: an epidemiological study, The Lancet Planetary Health, 1, e221–e229, 2017.
Chen, G., Canonaco, F., Tobler, A., Aas, W., Alastuey, A., Allan, J., Atabakhsh, S., Aurela, M., Baltensperger, U., and Bougiatioti, A.: European aerosol phenomenology-8: Harmonised source apportionment of organic aerosol using 22 Year-long ACSM/AMS datasets, Environ. Int., 166, 107325, PMID 35716508, https://doi.org/10.1016/j.envint.2022.107325, 2022.
Chen, Y., Xu, L., Humphry, T., Hettiyadura, A. P., Ovadnevaite, J., Huang, S., Poulain, L., Schroder, J. C., Campuzano-Jost, P., and Jimenez, J. L.: Response of the aerodyne aerosol mass spectrometer to inorganic sulfates and organosulfur compounds: Applications in field and laboratory measurements, Environ. Sci. Technol., 53, 5176–5186, 2019.
Collard, F.-X. and Blin, J.: A review on pyrolysis of biomass constituents: Mechanisms and composition of the products obtained from the conversion of cellulose, hemicelluloses and lignin, Renew. Sustain. Energ. Rev., 38, 594–608, https://doi.org/10.1016/j.rser.2014.06.013, 2014.
Crippa, M., Canonaco, F., Lanz, V. A., Äijälä, M., Allan, J. D., Carbone, S., Capes, G., Ceburnis, D., Dall'Osto, M., Day, D. A., DeCarlo, P. F., Ehn, M., Eriksson, A., Freney, E., Hildebrandt Ruiz, L., Hillamo, R., Jimenez, J. L., Junninen, H., Kiendler-Scharr, A., Kortelainen, A.-M., Kulmala, M., Laaksonen, A., Mensah, A. A., Mohr, C., Nemitz, E., O'Dowd, C., Ovadnevaite, J., Pandis, S. N., Petäjä, T., Poulain, L., Saarikoski, S., Sellegri, K., Swietlicki, E., Tiitta, P., Worsnop, D. R., Baltensperger, U., and Prévôt, A. S. H.: Organic aerosol components derived from 25 AMS data sets across Europe using a consistent ME-2 based source apportionment approach, Atmos. Chem. Phys., 14, 6159–6176, https://doi.org/10.5194/acp-14-6159-2014, 2014.
Czarnecki, N.: Local Air Quality Regulations: How to Participate and Comply, Clear the Air Home Heating Forum and Expo, https://www.fnsb.gov/DocumentCenter/View/637/Local-Air-Quality-Regulations-PDF, 2017.
DeCarlo, P. F., Kimmel, J. R., Trimborn, A., Northway, M. J., Jayne, J. T., Aiken, A. C., Gonin, M., Fuhrer, K., Horvath, T., and Docherty, K. S.: Field-deployable, high-resolution, time-of-flight aerosol mass spectrometer, Anal. Chem., 78, 8281–8289, 2006.
Dingilian, K., Hebert, E., Battaglia Jr., M., Campbell, J. R., Cesler-Maloney, M., Simpson, W., St. Clair, J. M., Dibb, J., Temime-Roussel, B., and D'anna, B.: Hydroxymethanesulfonate and Sulfur (IV) in Fairbanks Winter During the ALPACA Study, ACS ES&T Air, https://doi.org/10.1021/acsestair.4c00012, 2024.
Dunleavy, M. and Brune, J. W.: Amendments to: State Air Quality Control Plan, vol. III: Appendix III. D.7.06, https://dec.alaska.gov/media/19033/appendix-iii-registered-12-9-19.pdf (last access: 9 September 2025), 2019.
Dunleavy, M. J. and Brune, J. W.: Amendments to State Air Quality Control Plan, vol. III: Appendix III. D.7.7, Alaska Department of Environmental Conservation, https://dec.alaska.gov/media/22038/appendix-iii-d77-control-strategies-adopted-11-18-20.pdf (last access: 9 September 2025), 2020.
Eichler, P., Müller, M., D'Anna, B., and Wisthaler, A.: A novel inlet system for online chemical analysis of semi-volatile submicron particulate matter, Atmos. Meas. Tech., 8, 1353–1360, https://doi.org/10.5194/amt-8-1353-2015, 2015.
Eichler, P., Müller, M., Rohmann, C., Stengel, B., Orasche, J. R., Zimmermann, R., and Wisthaler, A.: Lubricating oil as a major constituent of ship exhaust particles, Environ. Sci. Tech. Let., 4, 54–58, 2017.
Ellis, A. and Mayhew, C.: Chemical Ionization: Chemistry, Thermodynamics and Kinetics, Proton Transfer Reaction Mass Spectrometry, 25–48, ISBN 978-1-4051-7668-2, 2014.
Fairbanks Air Quality Plan: https://www.epa.gov/ak/fairbanks-air-quality-plan, last access: 7 May 2024.
Fine, P. M., Cass, G. R., and Simoneit, B. R.: Chemical characterization of fine particle emissions from fireplace combustion of woods grown in the northeastern United States, Environ. Sci. Technol., 35, 2665–2675, 2001.
Fine, P. M., Cass, G. R., and Simoneit, B. R.: Organic compounds in biomass smoke from residential wood combustion: Emissions characterization at a continental scale, J. Geophys. Res.-Atmos., 107, ICC11-11–ICC11-19, 2002.
Fraser, M. P. and Lakshmanan, K.: Using levoglucosan as a molecular marker for the long-range transport of biomass combustion aerosols, Environ. Sci. Technol., 34, 4560–4564, 2000.
Fye, M., Havel, B., Havel, H., and Putnam, J.: Opportunities for Air Quality Improvement in the Fairbanks North Star Borough, http://raperkins.net/ESM%20web/EProjectReports/Opportunities%20for%20Air%20Quality%20Improvement%20in%20the%20Fairbanks%20North%20Star%20Borough.pdf (last access: 9 September 2025), 2009.
Gkatzelis, G. I., Hohaus, T., Tillmann, R., Gensch, I., Müller, M., Eichler, P., Xu, K.-M., Schlag, P., Schmitt, S. H., Yu, Z., Wegener, R., Kaminski, M., Holzinger, R., Wisthaler, A., and Kiendler-Scharr, A.: Gas-to-particle partitioning of major biogenic oxidation products: a study on freshly formed and aged biogenic SOA, Atmos. Chem. Phys., 18, 12969–12989, https://doi.org/10.5194/acp-18-12969-2018, 2018.
Glasius, M., Ketzel, M., Wåhlin, P., Jensen, B., Mønster, J., Berkowicz, R., and Palmgren, F.: Impact of wood combustion on particle levels in a residential area in Denmark, Atmos. Environ., 40, 7115–7124, 2006.
Gueneron, M., Erickson, M. H., VanderSchelden, G. S., and Jobson, B. T.: PTR-MS fragmentation patterns of gasoline hydrocarbons, Int. J. Mass Spectrom., 379, 97–109, 2015.
Guo, S., Hu, M., Peng, J., Wu, Z., Zamora, M. L., Shang, D., Du, Z., Zheng, J., Fang, X., and Tang, R.: Remarkable nucleation and growth of ultrafine particles from vehicular exhaust, P. Natl. Acad. Sci. USA, 117, 3427–3432, 2020.
Haque, M. M., Kawamura, K., Deshmukh, D. K., Kunwar, B., and Kim, Y.: Biomass burning is an important source of organic aerosols in interior Alaska, J. Geophys. Res.-Atmos., 126, e2021JD034586, https://doi.org/10.1029/2021JD034586, 2021.
Herring, C. L., Faiola, C. L., Massoli, P., Sueper, D., Erickson, M. H., McDonald, J. D., Simpson, C. D., Yost, M. G., Jobson, B. T., and VanReken, T. M.: New methodology for quantifying polycyclic aromatic hydrocarbons (PAHs) using high-resolution aerosol mass spectrometry, Aerosol Sci. Tech., 49, 1131–1148, 2015.
Ijaz, A., Temime Roussel, B., Kammer, J., Mao, J., Simpson, W., Law, K., and D'Anna, B.: In situ measurements of gas-particle partitioning of organic compounds in Fairbanks, Faraday Discuss., 258, 23–39, https://doi.org/10.1039/D4FD00175C, 2025.
Janhäll, S., Andreae, M. O., and Pöschl, U.: Biomass burning aerosol emissions from vegetation fires: particle number and mass emission factors and size distributions, Atmos. Chem. Phys., 10, 1427–1439, https://doi.org/10.5194/acp-10-1427-2010, 2010.
Jentgen, M.: Technical support document for Alaska Department of Environmental Conservation's (ADEC) control measure analysis, under 40 CFR 1010(a) and (c), US EPA, Region 10, Air and Radiation Division, https://www.epa.gov/system/files/documents/2023-01/fairbanks-tsd-control-measure-analysis-09-27-2022.pdf, 2022.
Jiang, X., Tsona, N. T., Jia, L., Liu, S., Zhang, H., Xu, Y., and Du, L.: Secondary organic aerosol formation from photooxidation of furan: effects of NOx and humidity, Atmos. Chem. Phys., 19, 13591–13609, https://doi.org/10.5194/acp-19-13591-2019, 2019.
Katz, E. F., Guo, H., Campuzano-Jost, P., Day, D. A., Brown, W. L., Boedicker, E., Pothier, M., Lunderberg, D. M., Patel, S., and Patel, K.: Quantification of cooking organic aerosol in the indoor environment using aerodyne aerosol mass spectrometers, Aerosol Sci. Tech., 55, 1099–1114, 2021.
Kawamoto, H.: Lignin pyrolysis reactions, J. Wood Sci., 63, 117–132, 2017.
Kong, X., Salvador, C. M., Carlsson, S., Pathak, R., Davidsson, K. O., Le Breton, M., Gaita, S. M., Mitra, K., Hallquist, Å. M., and Hallquist, M.: Molecular characterization and optical properties of primary emissions from a residential wood burning boiler, Sci. Total Environ., 754, 142143, https://doi.org/10.1016/j.scitotenv.2020.142143, 2021.
Koss, A. R., Sekimoto, K., Gilman, J. B., Selimovic, V., Coggon, M. M., Zarzana, K. J., Yuan, B., Lerner, B. M., Brown, S. S., Jimenez, J. L., Krechmer, J., Roberts, J. M., Warneke, C., Yokelson, R. J., and de Gouw, J.: Non-methane organic gas emissions from biomass burning: identification, quantification, and emission factors from PTR-ToF during the FIREX 2016 laboratory experiment, Atmos. Chem. Phys., 18, 3299–3319, https://doi.org/10.5194/acp-18-3299-2018, 2018.
Kostenidou, E., Martinez-Valiente, A., R'Mili, B., Marques, B., Temime-Roussel, B., Durand, A., André, M., Liu, Y., Louis, C., Vansevenant, B., Ferry, D., Laffon, C., Parent, P., and D'Anna, B.: Technical note: Emission factors, chemical composition, and morphology of particles emitted from Euro 5 diesel and gasoline light-duty vehicles during transient cycles, Atmos. Chem. Phys., 21, 4779–4796, https://doi.org/10.5194/acp-21-4779-2021, 2021.
Kostenidou, E., Marques, B., Temime-Roussel, B., Liu, Y., Vansevenant, B., Sartelet, K., and D'Anna, B.: Secondary organic aerosol formed by Euro 5 gasoline vehicle emissions: chemical composition and gas-to-particle phase partitioning, Atmos. Chem. Phys., 24, 2705–2729, https://doi.org/10.5194/acp-24-2705-2024, 2024.
Kotchenruther, R. A.: Source apportionment of PM2.5 at multiple Northwest US sites: Assessing regional winter wood smoke impacts from residential wood combustion, Atmos. Environ., 142, 210–219, 2016.
Kumar, V., Giannoukos, S., Haslett, S. L., Tong, Y., Singh, A., Bertrand, A., Lee, C. P., Wang, D. S., Bhattu, D., Stefenelli, G., Dave, J. S., Puthussery, J. V., Qi, L., Vats, P., Rai, P., Casotto, R., Satish, R., Mishra, S., Pospisilova, V., Mohr, C., Bell, D. M., Ganguly, D., Verma, V., Rastogi, N., Baltensperger, U., Tripathi, S. N., Prévôt, A. S. H., and Slowik, J. G.: Highly time-resolved chemical speciation and source apportionment of organic aerosol components in Delhi, India, using extractive electrospray ionization mass spectrometry, Atmos. Chem. Phys., 22, 7739–7761, https://doi.org/10.5194/acp-22-7739-2022, 2022.
Lannuque, V., D'Anna, B., Kostenidou, E., Couvidat, F., Martinez-Valiente, A., Eichler, P., Wisthaler, A., Müller, M., Temime-Roussel, B., Valorso, R., and Sartelet, K.: Gas–particle partitioning of toluene oxidation products: an experimental and modeling study, Atmos. Chem. Phys., 23, 15537–15560, https://doi.org/10.5194/acp-23-15537-2023, 2023.
Leglise, J., Müller, M., Piel, F., Otto, T., and Wisthaler, A.: Bulk Organic Aerosol Analysis by Proton-Transfer-Reaction Mass Spectrometry: An Improved Methodology for the Determination of Total Organic Mass, O: C and H: C Elemental Ratios, and the Average Molecular Formula, Anal. Chem., 91, 12619–12624, 2019.
Lignell, H., Epstein, S. A., Marvin, M. R., Shemesh, D., Gerber, B., and Nizkorodov, S.: Experimental and theoretical study of aqueous cis-pinonic acid photolysis, J. Phys. Chem.-USA, 117, 12930–12945, 2013.
Liu, L., Breitner, S., Schneider, A., Cyrys, J., Brüske, I., Franck, U., Schlink, U., Leitte, A. M., Herbarth, O., and Wiedensohler, A.: Size-fractioned particulate air pollution and cardiovascular emergency room visits in Beijing, China, Environ. Res., 121, 52–63, 2013.
Lopez-Hilfiker, F. D., Mohr, C., Ehn, M., Rubach, F., Kleist, E., Wildt, J., Mentel, Th. F., Lutz, A., Hallquist, M., Worsnop, D., and Thornton, J. A.: A novel method for online analysis of gas and particle composition: description and evaluation of a Filter Inlet for Gases and AEROsols (FIGAERO), Atmos. Meas. Tech., 7, 983–1001, https://doi.org/10.5194/amt-7-983-2014, 2014.
Louis, C., Liu, Y., Martinet, S., D'Anna, B., Valiente, A. M., Boreave, A., R'Mili, B., Tassel, P., Perret, P., and Andre, M.: Dilution effects on ultrafine particle emissions from Euro 5 and Euro 6 diesel and gasoline vehicles, Atmos. Environ., 169, 80–88, 2017.
Mainka, A. and Zajusz-Zubek, E.: PM1 in ambient and indoor air – urban and rural areas in the Upper Silesian Region, Poland, Atmosphere, 10, 662, https://doi.org/10.3390/atmos10110662, 2019.
Mayfield, J. A. and Fochesatto, G. J.: The layered structure of the winter atmospheric boundary layer in the interior of Alaska, J. Appl. Meteorol. Clim., 52, 953–973, 2013.
McLafferty, F. W. and Tureč̌ek, F.: Interpretation of mass spectra, 4th edn., University Science Books, Mill Valley (Calif.), 51–83, ISBN 0935702253, 1993.
Meng, X., Ma, Y., Chen, R., Zhou, Z., Chen, B., and Kan, H.: Size-fractionated particle number concentrations and daily mortality in a Chinese city, Environ. Health Persp., 121, 1174–1178, 2013.
Middlebrook, A. M., Bahreini, R., Jimenez, J. L., and Canagaratna, M. R.: Evaluation of composition-dependent collection efficiencies for the aerodyne aerosol mass spectrometer using field data, Aerosol Sci. Tech., 46, 258–271, 2012.
Mohr, C., Huffman, J. A., Cubison, M. J., Aiken, A. C., Docherty, K. S., Kimmel, J. R., Ulbrich, I. M., Hannigan, M., and Jimenez, J. L.: Characterization of primary organic aerosol emissions from meat cooking, trash burning, and motor vehicles with high-resolution aerosol mass spectrometry and comparison with ambient and chamber observations, Environ. Sci. Technol., 43, 2443–2449, 2009.
Montoya-Aguilera, J., Horne, J. R., Hinks, M. L., Fleming, L. T., Perraud, V., Lin, P., Laskin, A., Laskin, J., Dabdub, D., and Nizkorodov, S. A.: Secondary organic aerosol from atmospheric photooxidation of indole, Atmos. Chem. Phys., 17, 11605–11621, https://doi.org/10.5194/acp-17-11605-2017, 2017.
Moon, A., Jongebloed, U., Dingilian, K. K., Schauer, A. J., Chan, Y.-C., Cesler-Maloney, M., Simpson, W. R., Weber, R. J., Tsiang, L., and Yazbeck, F.: Primary Sulfate Is the Dominant Source of Particulate Sulfate during Winter in Fairbanks, Alaska, ACS ES&T Air, 1, 139–149, https://doi.org/10.1021/acsestair.3c00023, 2023.
Morin, B., Allen, G., Marin, A., Rector, L., and Ahmadi, M.: Impacts of wood species and moisture content on emissions from residential wood heaters, JAPCA J. Air Waste Ma., 72, 647–661, 2022.
Müller, M., Leglise, J., Piel, F., and Wisthaler, A.: A CHARON PTR-ToF-MS study on the volatility of freshly formed biogenic SOA, EGU General Assembly, Vienna, Austria, 7–12 April 2019, EGU2019-13371, 2019.
Müller, M., Eichler, P., D'Anna, B., Tan, W., and Wisthaler, A.: Direct sampling and analysis of atmospheric particulate organic matter by proton-transfer-reaction mass spectrometry, Anal. Chem., 89, 10889–10897, 2017.
Paatero, P.: Least squares formulation of robust non-negative factor analysis, Chemometr. Intell. Lab., 37, 23–35, 1997a.
Paatero, P.: A weighted non-negative least squares algorithm for three-way “PARAFAC” factor analysis, Chemometr. Intell. Lab., 38, 223–242, 1997b.
Paatero, P.: The multilinear engine – a table-driven, least squares program for solving multilinear problems, including the n-way parallel factor analysis model, J. Comput. Graph. Stat., 8, 854–888, 1999.
Paatero, P. and Tapper, U.: Positive matrix factorization: A non-negative factor model with optimal utilization of error estimates of data values, Environmetrics, 5, 111–126, 1994.
Paatero, P. and Hopke, P. K.: Discarding or downweighting high-noise variables in factor analytic models, Anal. Chim. Acta, 490, 277–289, 2003.
Paatero, P., Eberly, S., Brown, S. G., and Norris, G. A.: Methods for estimating uncertainty in factor analytic solutions, Atmos. Meas. Tech., 7, 781–797, https://doi.org/10.5194/amt-7-781-2014, 2014.
Palm, B. B., Peng, Q., Fredrickson, C. D., Lee, B. H., Garofalo, L. A., Pothier, M. A., Kreidenweis, S. M., Farmer, D. K., Pokhrel, R. P., and Shen, Y.: Quantification of organic aerosol and brown carbon evolution in fresh wildfire plumes, P. Natl. Acad. Sci. USA, 117, 29469–29477, 2020.
Peng, Y., Wang, H., Gao, Y., Jing, S., Zhu, S., Huang, D., Hao, P., Lou, S., Cheng, T., Huang, C., and Zhang, X.: Real-time measurement of phase partitioning of organic compounds using a proton-transfer-reaction time-of-flight mass spectrometer coupled to a CHARON inlet, Atmos. Meas. Tech., 16, 15–28, https://doi.org/10.5194/amt-16-15-2023, 2023.
Piel, F., Müller, M., Mikoviny, T., Pusede, S. E., and Wisthaler, A.: Airborne measurements of particulate organic matter by proton-transfer-reaction mass spectrometry (PTR-MS): a pilot study, Atmos. Meas. Tech., 12, 5947–5958, https://doi.org/10.5194/amt-12-5947-2019, 2019.
Piel, F., Müller, M., Winkler, K., Skytte af Sätra, J., and Wisthaler, A.: Introducing the extended volatility range proton-transfer-reaction mass spectrometer (EVR PTR-MS), Atmos. Meas. Tech., 14, 1355–1363, https://doi.org/10.5194/amt-14-1355-2021, 2021.
Pikridas, M., Sciare, J., Freutel, F., Crumeyrolle, S., von der Weiden-Reinmüller, S.-L., Borbon, A., Schwarzenboeck, A., Merkel, M., Crippa, M., Kostenidou, E., Psichoudaki, M., Hildebrandt, L., Engelhart, G. J., Petäjä, T., Prévôt, A. S. H., Drewnick, F., Baltensperger, U., Wiedensohler, A., Kulmala, M., Beekmann, M., and Pandis, S. N.: In situ formation and spatial variability of particle number concentration in a European megacity, Atmos. Chem. Phys., 15, 10219–10237, https://doi.org/10.5194/acp-15-10219-2015, 2015.
Qi, L., Chen, M., Stefenelli, G., Pospisilova, V., Tong, Y., Bertrand, A., Hueglin, C., Ge, X., Baltensperger, U., Prévôt, A. S. H., and Slowik, J. G.: Organic aerosol source apportionment in Zurich using an extractive electrospray ionization time-of-flight mass spectrometer (EESI-TOF-MS) – Part 2: Biomass burning influences in winter, Atmos. Chem. Phys., 19, 8037–8062, https://doi.org/10.5194/acp-19-8037-2019, 2019.
Reemtsma, T.: Determination of molecular formulas of natural organic matter molecules by (ultra-) high-resolution mass spectrometry: status and needs, J. Chromatogr. A, 1216, 3687–3701, 2009.
Reid, J. S., Koppmann, R., Eck, T. F., and Eleuterio, D. P.: A review of biomass burning emissions part II: intensive physical properties of biomass burning particles, Atmos. Chem. Phys., 5, 799–825, https://doi.org/10.5194/acp-5-799-2005, 2005.
Robinson, E. S., Cesler-Maloney, M., Tan, X., Mao, J., Simpson, W., and DeCarlo, P. F.: Wintertime spatial patterns of particulate matter in Fairbanks, AK during ALPACA 2022, Environmental Science: Atmospheres, 3, 568–580, 2023.
Robinson, E. S., Battaglia Jr., M., Campbell, J. R., Cesler-Maloney, M., Simpson, W., Mao, J., Weber, R. J., and DeCarlo, P. F.: Multi-year, high-time resolution aerosol chemical composition and mass measurements from Fairbanks, Alaska, Environmental Science: Atmospheres, 4, 685–698, https://doi.org/10.1039/D4EA00008K, 2024.
Schauer, J. J. and Cass, G. R.: Source apportionment of wintertime gas-phase and particle-phase air pollutants using organic compounds as tracers, Environ. Sci. Technol., 34, 1821–1832, 2000.
Schueneman, M. K., Nault, B. A., Campuzano-Jost, P., Jo, D. S., Day, D. A., Schroder, J. C., Palm, B. B., Hodzic, A., Dibb, J. E., and Jimenez, J. L.: Aerosol pH indicator and organosulfate detectability from aerosol mass spectrometry measurements, Atmos. Meas. Tech., 14, 2237–2260, https://doi.org/10.5194/amt-14-2237-2021, 2021.
Sekimoto, K., Li, S.-M., Yuan, B., Koss, A., Coggon, M., Warneke, C., and de Gouw, J.: Calculation of the sensitivity of proton-transfer-reaction mass spectrometry (PTR-MS) for organic trace gases using molecular properties, International Journal of Mass Spectrometry, 421, 71–94, 2017.
Simoneit, B. R.: A review of biomarker compounds as source indicators and tracers for air pollution, Environ. Sci. Pollut. R., 6, 159–169, 1999.
Simoneit, B. R.: Biomass burning – a review of organic tracers for smoke from incomplete combustion, Appl. Geochem., 17, 129–162, 2002.
Simpson, W., Law, K., Schmale, J., et al.: Alaskan Layered Pollution And Chemical Analysis (ALPACA) White Paper, https://alpaca.community.uaf.edu/wp-content/uploads/sites/758/2019/05/ALPACA-whitepaper.pdf (last access: 9 September 2025), 2019.
Simpson, W. R., Mao, J., Fochesatto, G. J., Law, K. S., DeCarlo, P. F., Schmale, J., Pratt, K. A., Arnold, S. R., Stutz, J., Dibb, J. E., Creamean, J. M., Weber, R. J., Williams, B. J., Alexander, B., Hu, L., Yokelson, R. J., Shiraiwa, M., Decesari, S., Anastasio, C., D'Anna, B., Gilliam, R. C., Nenes, A., St. Clair, J. M., Trost, B., Flynn, J. H., Savarino, J., Conner, L. D., Kettle, N., Heeringa, K. M., Albertin, S., Baccarini, A., Barret, B., Battaglia, M. A., Bekki, S., Brado, T. J., Brett, N., Brus, D., Campbell, J. R., Cesler-Maloney, M., Cooperdock, S., Cysneiros De Carvalho, K., Delbarre, H., DeMott, P. J., Dennehy, C. J. S., Dieudonné, E., Dingilian, K. K., Donateo, A., Doulgeris, K. M., Edwards, K. C., Fahey, K., Fang, T., Guo, F., Heinlein, L. M. D., Holen, A. L., Huff, D., Ijaz, A., Johnson, S., Kapur, S., Ketcherside, D. T., Levin, E., Lill, E., Moon, A. R., Onishi, T., Pappaccogli, G., Perkins, R., Pohorsky, R., Raut, J.-C., Ravetta, F., Roberts, T., Robinson, E. S., Scoto, F., Selimovic, V., Sunday, M. O., Temime-Roussel, B., Tian, X., Wu, J., and Yang, Y.: Overview of the Alaskan Layered Pollution and Chemical Analysis (ALPACA) Field Experiment, ACS EST Air, 1, 200–222, https://doi.org/10.1021/acsestair.3c00076, 2024.
Smith, S. J., van Aardenne, J., Klimont, Z., Andres, R. J., Volke, A., and Delgado Arias, S.: Anthropogenic sulfur dioxide emissions: 1850–2005, Atmos. Chem. Phys., 11, 1101–1116, https://doi.org/10.5194/acp-11-1101-2011, 2011.
Smith, D. M., Cui, T., Fiddler, M. N., Pokhrel, R. P., Surratt, J. D., and Bililign, S.: Laboratory studies of fresh and aged biomass burning aerosol emitted from east African biomass fuels – Part 2: Chemical properties and characterization, Atmos. Chem. Phys., 20, 10169–10191, https://doi.org/10.5194/acp-20-10169-2020, 2020.
Song, S., Gao, M., Xu, W., Sun, Y., Worsnop, D. R., Jayne, J. T., Zhang, Y., Zhu, L., Li, M., Zhou, Z., Cheng, C., Lv, Y., Wang, Y., Peng, W., Xu, X., Lin, N., Wang, Y., Wang, S., Munger, J. W., Jacob, D. J., and McElroy, M. B.: Possible heterogeneous chemistry of hydroxymethanesulfonate (HMS) in northern China winter haze, Atmos. Chem. Phys., 19, 1357–1371, https://doi.org/10.5194/acp-19-1357-2019, 2019.
Stefenelli, G., Pospisilova, V., Lopez-Hilfiker, F. D., Daellenbach, K. R., Hüglin, C., Tong, Y., Baltensperger, U., Prévôt, A. S. H., and Slowik, J. G.: Organic aerosol source apportionment in Zurich using an extractive electrospray ionization time-of-flight mass spectrometer (EESI-TOF-MS) – Part 1: Biogenic influences and day–night chemistry in summer, Atmos. Chem. Phys., 19, 14825–14848, https://doi.org/10.5194/acp-19-14825-2019, 2019a.
Stefenelli, G., Jiang, J., Bertrand, A., Bruns, E. A., Pieber, S. M., Baltensperger, U., Marchand, N., Aksoyoglu, S., Prévôt, A. S. H., Slowik, J. G., and El Haddad, I.: Secondary organic aerosol formation from smoldering and flaming combustion of biomass: a box model parametrization based on volatility basis set, Atmos. Chem. Phys., 19, 11461–11484, https://doi.org/10.5194/acp-19-11461-2019, 2019b.
Sueper, D.: Squirrel and Pika Error Estimates, https://cires1.colorado.edu/jimenez-group/ToFAMSResources/ToFSoftware/PikaNotes/HRErrorEstimatesPk_1_13.pdf (last access: 9 September 2025), 2014.
Sun, Y.-L., Zhang, Q., Schwab, J. J., Demerjian, K. L., Chen, W.-N., Bae, M.-S., Hung, H.-M., Hogrefe, O., Frank, B., Rattigan, O. V., and Lin, Y.-C.: Characterization of the sources and processes of organic and inorganic aerosols in New York city with a high-resolution time-of-flight aerosol mass apectrometer, Atmos. Chem. Phys., 11, 1581–1602, https://doi.org/10.5194/acp-11-1581-2011, 2011.
Temime Roussel, B., Cesler-Maloney, M., Chazeau, B., Ijaz, A., Brett, N., Law, K., Bekki, S., Mao, J., Ketcherside, D., Selimovic, V., Hu, L., Simpson, W. R., and D'Anna, B.: Concentrations and Sources of VOCs during wintertime urban pollution at Fairbanks, Alaska, 1 December 2022, https://agu.confex.com/agu/fm22/meetingapp.cgi/Paper/1072876 (last access: 31 August 2025), 2022.
Tong, Y., Pospisilova, V., Qi, L., Duan, J., Gu, Y., Kumar, V., Rai, P., Stefenelli, G., Wang, L., Wang, Y., Zhong, H., Baltensperger, U., Cao, J., Huang, R.-J., Prévôt, A. S. H., and Slowik, J. G.: Quantification of solid fuel combustion and aqueous chemistry contributions to secondary organic aerosol during wintertime haze events in Beijing, Atmos. Chem. Phys., 21, 9859–9886, https://doi.org/10.5194/acp-21-9859-2021, 2021.
Tran, H. N. and Mölders, N.: Investigations on meteorological conditions for elevated PM2.5 in Fairbanks, Alaska, Atmos. Res., 99, 39–49, 2011.
Ulbrich, I. M., Canagaratna, M. R., Zhang, Q., Worsnop, D. R., and Jimenez, J. L.: Interpretation of organic components from Positive Matrix Factorization of aerosol mass spectrometric data, Atmos. Chem. Phys., 9, 2891–2918, https://doi.org/10.5194/acp-9-2891-2009, 2009.
Wang, Y. and Hopke, P. K.: Is Alaska truly the great escape from air pollution?-long term source apportionment of fine particulate matter in Fairbanks, Alaska, Aerosol Air Qual. Res., 14, 1875–1882, 2014.
Wang, Y. Q., Zhang, X. Y., Sun, J. Y., Zhang, X. C., Che, H. Z., and Li, Y.: Spatial and temporal variations of the concentrations of PM10, PM2.5 and PM1 in China, Atmos. Chem. Phys., 15, 13585–13598, https://doi.org/10.5194/acp-15-13585-2015, 2015.
Ward, T., Trost, B., Conner, J., Flanagan, J., and Jayanty, R.: Source apportionment of PM2.5 in a subarctic airshed-fairbanks, Alaska, Aerosol Air Qual. Res., 12, 536–543, 2012.
Williams, B. J., Goldstein, A. H., Kreisberg, N. M., and Hering, S. V.: An in-situ instrument for speciated organic composition of atmospheric aerosols: Thermal desorption a erosol GC/MS-FID (TAG), Aerosol Sci. Tech., 40, 627–638, 2006.
Xu, W., Li, Z., Zhang, Z., Li, J., Karnezi, E., Lambe, A. T., Zhou, W., Sun, J., Du, A., and Li, Y.: Changes in physicochemical properties of organic aerosol during photochemical aging of cooking and burning emissions, J. Geophys. Res.-Atmos., 128, e2022JD037911, https://doi.org/10.1029/2022JD037911, 2023.
Yang, Y., Battaglia, M. A., Mohan, M. K., Robinson, E. S., DeCarlo, P. F., Edwards, K. C., Fang, T., Kapur, S., Shiraiwa, M., and Cesler-Maloney, M.: Assessing the Oxidative Potential of Outdoor PM2.5 in Wintertime Fairbanks, Alaska, ACS ES&T Air, PMID 38482267, https://doi.org/10.1021/acsestair.3c00066, 2024.
Ye, L. and Wang, Y.: Long-term air quality study in Fairbanks, Alaska: Air pollutant temporal variations, correlations, and PM2.5 source apportionment, Atmosphere, 11, 1203, 2020.
Zhang, Q., Jimenez, J. L., Canagaratna, M. R., Ulbrich, I. M., Ng, N. L., Worsnop, D. R., and Sun, Y.: Understanding atmospheric organic aerosols via factor analysis of aerosol mass spectrometry: a review, Anal. Bioanal. Chem., 401, 3045–3067, 2011.