the Creative Commons Attribution 4.0 License.
the Creative Commons Attribution 4.0 License.
 | 30 Sep 2025
Radiative and climate effects of aerosol scattering in long-wave radiation based on global climate modelling
Thomas Drugé
Pierre Nabat
Martine Michou
Marc Mallet
The few studies that considered aerosol scattering in the long-wave (LW) typically relied on using simple corrective factors instead of including it in the radiative code. To analyse the climatic effects of physically accounting for this process, simulations have been performed with the ARPEGE-Climat atmospheric global climate model over the 1985–2014 period using the ecRad radiation scheme and updated optical properties of coarse aerosols, particularly dust. The evaluation of the model coarse-aerosol optical depth (AOD) against AERONET data over North Africa and the Arabian Peninsula shows the ability of ARPEGE-Climat to capture spatio-temporal variations in coarse AOD despite regional biases. The comparison of simulations with and without LW aerosol scattering shows that this process leads to a significant increase in downwelling surface LW radiation in dust-emitting regions (+5 W m−2 on average) between March and September, correlated with the largest coarse AOD. This increase results in a rise in minimum near-surface temperatures of up to +1 °C. It is also associated with an outgoing LW radiation decrease at the top of the atmosphere (TOA). However, during certain months and in certain regions, near-surface temperatures can be significantly reduced due to short-wave surface radiation decreases related to increases in low-level clouds. A precipitation increase over Sahel during September, linked to wetter atmospheric layers, is also simulated. Neglecting LW aerosol scattering in climate simulations therefore has significant impacts on climate, notably in dust-emitting regions. Globally, the LW aerosol-scattering contribution to radiation is 0.4 W m−2 at both the surface and TOA.
- Article
(15939 KB) - Full-text XML
- BibTeX
- EndNote


Aerosols impact the climate by disrupting the Earth's energy budget. The latest Intergovernmental Panel on Climate Change Assessment Report (Masson-Delmotte et al., 2021, IPCC report AR6) highlights that the dominant contribution to the aerosol effective radiative forcing (ERF) arises from aerosol–cloud interactions (ERFaci), with high confidence. The 1750–2014 ERFaci is assessed to be −1.0 W m−2 (−1.7 to −0.3 W m−2) (medium confidence), while the other part of the ERF, attributed to aerosol–radiation interactions (ERFari), is assessed to be −0.3 W m−2 (−0.6 to 0.0 W m−2) (medium confidence). Regarding aerosol–radiation interactions, which are of particular interest to this paper, a deeper understanding of the processes governing aerosol radiative properties has emerged since the previous IPCC report (IPCC, 2013, AR5). The magnitude of ERFari in the AR6 has been reduced by about 50 % compared to in the AR5 based on agreement between observation-based and modelling-based evidence. A synthesis of the literature cited in Masson-Delmotte et al. (2021) is that short-wave (SW) flux changes can be attributed to aerosol–radiation and aerosol–cloud interactions, while the small positive long-wave (LW) flux changes are associated with aerosol–cloud interactions, particularly those linked to changes in liquid-water path. However, LW flux changes resulting from aerosol–radiation interactions are not mentioned even though uncertainties remain, particularly concerning assumptions about aerosol emissions masses, size distributions, optical properties (Hess et al., 1998; Dobbie et al., 2003), and mixing states (Myhre et al., 2013; Szopa et al., 2021).
Several studies have shown that, even though the effects of most aerosol species (particularly fine particles) on LW radiation are small compared to their effects on SW radiation, highly absorbing and scattering large particles, such as mineral dust, have an LW forcing that can counteract their cooling effect in the SW (Fouquart et al., 1987; Hansell et al., 2010; Di Sarra et al., 2011; Sicard et al., 2014; Di Biagio et al., 2020). Additionally, a growing body of recent work focusing on the microphysical properties and radiative effects of dust in the LW range is now available (Hansell et al., 2010; Haywood et al., 2011; Köhler et al., 2011; Osborne et al., 2011; Weinzierl et al., 2011; Sicard et al., 2014; Di Biagio et al., 2017, 2019, 2020; Fountoulakis et al., 2024). Often cited in the subject, Dufresne et al. (2002), using a radiative transfer model and standard vertical profiles of dust aerosol, highlight the importance of the mineral aerosol scattering in relation to LW radiation. The study shows that neglecting this effect may lead to an underestimation of the LW aerosol forcing of about 50 % at the top of the atmosphere (TOA) and 15 % at the surface. Both Dufresne et al. (2002) and Sicard et al. (2014) underlined that the LW aerosol radiative forcing (RF) is at its maximum at wavelengths between 8 and 13 µm, as expected, while Sicard et al. (2014) indicated that large particles have a non-negligible effect in the 17–22 µm range at the TOA. Furthermore, Dufresne et al. (2002) demonstrated that the LW aerosol scattering only slightly affects heating rates inside the atmosphere: neglecting it leads to a maximum reduction of 10 % in the cooling caused by aerosols at the top of the aerosol layer while slightly increasing the cooling at the surface.
Despite these studies, the aerosol LW radiative forcing is still only partially accounted for in both global and regional climate models. While the aerosol LW absorption is considered, LW scattering is not (Sicard et al., 2014; Granados-Muñoz et al., 2019; Di Biagio et al., 2020). In the best cases, the missing aerosol LW scattering is “artificially” accounted for by increasing either the aerosol optical depth (AOD) or the retrieved TOA direct radiative effect (DRE) using constant correction factors that are independent from the dust situation. For example, in Miller et al. (2006), LW scattering is represented by a 30 % increase in dust optical thickness based on the calculations of Dufresne et al. (2002). In their study, Kok et al. (2017) follow this conservative approach, assuming that LW scattering enhances the LW absorption radiative effect by a factor of 0.3, accounting for 23 % of the LW DRE at the TOA. However, these corrections represent only about half of the value estimated by Dufresne et al. (2002) and Sicard et al. (2014). A different example is demonstrated by Di Biagio et al. (2020), who corrected their LW DRE, calculated as the difference between LW radiative fluxes with and without dust in the LMDZOR-INCA model, by applying a multiplicative factor of 2.04 at the TOA (where the scattering contribution to the TOA LW DRE is then 51 %) and of 1.18 at the surface (where the scattering contribution to the surface LW DRE is then 15 %) based on Dufresne et al. (2002). Di Biagio et al. (2020) estimated a global annual mean all-sky LW DRE of mineral dust at the TOA of +0.22 W m−2, which lies between the AEROCOM median estimate (+0.15 W m−2) and the estimate of Kok et al. (2017) (+0.29 W m−2). Similarly, because their radiative transfer model did not account for aerosol LW scattering, Ito et al. (2021) followed Di Biagio et al. (2020) and multiplied their LW radiative fluxes by the adjustment factors from Di Biagio et al. (2020). Likewise, Li et al. (2021) artificially increased the LW dust DRE at the TOA by 51 % to account for scattering effects neglected by the global atmosphere model CAM. With this adjustment, they estimated an LW dust DRE at the TOA of between +0.14 and +0.20 W m−2. A final example is provided by Hogan and Bozzo (2018), who ran the European Centre for Medium-Range Weather Forecasts (ECMWF) numerical weather prediction (NWP) model with the ecRad radiation scheme, which is able to consider the LW aerosol scattering (see also Sect. 2.1). They concluded that turning on aerosol LW scattering impacts global mean surface and TOA LW irradiances only up to +0.1 W m−2, which is far from the 3 to 5 W m−2 cited in Dufresne et al. (2002) for standard vertical profiles and, thus, is negligible in the context of NWP.
In addition to the inadequate representation of aerosol LW scattering, global and regional climate models also struggle with accurately representing various characteristics of coarse particles, particularly dust. This limitation is especially important for the LW DRE as these coarse particles have the greatest impact in this spectral range (Dufresne et al., 2002; Di Biagio et al., 2020). Sicard et al. (2014) demonstrated that LW scattering has no effect on aerosol forcing for radii lower than 0.1 µm. However, for particles with radii larger than 0.1 µm, they estimated that this process contributes up to 38 % of the LW aerosol forcing at the TOA and up to 18 % at the surface, with the highest contribution coming from particles with a radius of 0.5 µm. In their study, Di Biagio et al. (2020) used a superposition of four lognormal modes to represent the aerosol size distribution in their aerosol model. They showed that the mode with a mass median diameter (MMD) of 7 µm represents more than 60 % of the DRE LW. Additionally, they showed that the fraction of dust with an MMD above 20 µm contributes to about 30 % of the DRE. Climate models, however, tend to overestimate the mass concentration of dust particles with a diameter smaller than 2 µm and underestimate the concentration of large dust particles (greater than 5 µm) compared to observations (Kok, 2011; Kok et al., 2017; Ryder et al., 2019; Di Biagio et al., 2020). Kok et al. (2017) applied constraints to dust emission sizes to better match observations and concluded that particles with diameters smaller than 20 µm contribute an average of 4.3 % of the emitted dust mass, which is significantly lower than the 5 %–35 % assumed in many global models. Furthermore, Van Der Does et al. (2018) highlighted new observations suggesting the presence of giant mineral dust particles, with a diameter larger than 75 µm and up to 450 µm, far from their source, 2400 and 3500 km away. Another challenge is the difficulty in accurately quantifying the optical properties of dust in the LW spectral range despite recent advances in this area (Granados-Muñoz et al., 2019). Most global models use the dust complex refractive index described in Volz (1973), which is based on dust collected at Barbados after being transported from the Sahara. However, recent laboratory measurements of dust samples suggest that the imaginary part of this refractive index is too high, which could lead to an overestimation of dust absorption (Di Biagio et al., 2014, 2017, 2019). Finally, dust particles are generally considered to be spherical in climate models; this has only a limited impact on the DRE at the TOA (Bellouin et al., 2004; Colarco et al., 2014).
In this study, we analyse the radiative and climatic impacts of the aerosol scattering in the LW spectral range through simulations using a new version of the CNRM (National Centre for Meteorological Research) global climate atmospheric model, ARPEGE-Climat. Unlike previous studies, we parameterise aerosol scattering in the LW spectrum within the radiation scheme ecRad (Hogan and Bozzo, 2018), which is implemented in ARPEGE-Climat. This approach allows us to estimate the impact of LW aerosol scattering through its physical representation. This work also involved updating the optical properties of aerosols in the LW spectrum, particularly those of dust. Section 2 describes the climate model and the simulations carried out, while the updated aerosol optical properties are detailed in Sect. 3. Section 4 presents the evaluation of coarse AOD, with a particular focus on the local scale, through a comparison with Aerosol Robotic Network (AERONET) data. Section 5 analyses the model results, and Sect. 6 summarises the conclusions.
2.1 The ARPEGE-Climat global climate model
The present study has been conducted with a new version of the ARPEGE-Climat global atmosphere model, which is the atmospheric component of the Centre National de Recherches Météorologiques (CNRM) climate model. This new version, referred to as v7.0.1, is an update of version 6.3 (Roehrig et al., 2020), which was used for the sixth phase of the Coupled Model Intercomparison Project (CMIP6). V7.0.1 is based on cycle 48t1_op1 of the ARPEGE/IFS system, a system developed jointly by Météo-France and the ECMWF for both NWP and climate applications.
As with other atmospheric models, ARPEGE-Climat consists of a dry dynamical core and a suite of physical parameterisations that represent diabatic processes. In short, ARPEGE-Climat v7.0.1 very largely shares the choices made for the ARPEGE NWP version, which means that these choices differ from those of the ARPEGE-Climat CMIP6 version. This is particularly the case for the parameterisations of the deep convection and of the radiation. Specifically, the convection scheme is based on the work of Tiedtke (1989), with many subsequent modifications, as reported in Bechtold et al. (2008, 2014); Becker et al. (2021). The radiation scheme used is “ecRad” (Hogan and Bozzo, 2018), which has been operational in the IFS NWP model since 2017. The ecRad scheme represents the latest advancement in several decades of development to improve the radiative transfer scheme used in the IFS. It provides multiple options for handling sub-grid cloud structures and the optical properties of gases, aerosols, and clouds. The configuration used in this study computes gas optical properties using the Rapid Radiation Transfer Model for general circulation models (GCMs), RRTMG (Mlawer et al., 1997; Iacono et al., 2008), across 16 spectral bands in the LW and 14 spectral bands in the SW. It also treats the cloud sub-grid structure using the Monte Carlo Independent Column Approximation (McICA, Pincus et al., 2003). The long-wave scattering of clouds and/or aerosols can be turned on or off. We kept LW scattering of clouds on in all of our simulations and turned on or turned off the LW scattering of the aerosols (see Sect. 2.2).
The radiation scheme in ARPEGE-Climat is provided with profiles of aerosol mass mixing ratios for various aerosol species. During the setup phase of ecRad, each aerosol species is mapped to pre-computed aerosol optical properties, which are stored in a NetCDF file. These properties are calculated using Mie theory and averaged to the RRTMG bands. The use of two-stream scattering in RRTM could also cause some heating biases in the UV and visible spectra (Hsu and Prather, 2021). For each aerosol species, the optical properties include the mass extinction coefficient, the single-scattering albedo, and the asymmetry factor. Some aerosol species are hydrophilic, meaning that their optical properties are stored as a function of relative humidity, with bins of 10 % width (except between 80 % and 100 %, where the bin width is 5 %). When optical properties are computed for these species, the nearest bin is selected based on the current relative humidity.
Aerosol mass mixing ratios come from the TACTIC aerosol scheme, originally described by Michou et al. (2015) and Nabat et al. (2015a). This version has been largely evaluated through CMIP6 simulations (Michou et al., 2020) and further developed to include nitrate aerosols (Drugé et al., 2019) and brown-carbon aerosols (Drugé et al., 2022). In the present study, seven aerosol types have been considered, excluding brown carbon. These include desert dust, with three size bins (diameter limits of 0.01, 1.0, 2.5, and 20 µm); sea salt, with three size bins (diameter limits of 0.01, 1.0, 10.0, and 100.0 µm); sulfate in one bin; organic matter, with two bins (hydrophilic and hydrophobic); black carbon, with two bins (hydrophilic and hydrophobic); nitrate, with two bins (formed by gas-to-particle reactions and heterogeneous chemistry); and ammonium in one bin. These aerosol types represent the main anthropogenic and natural aerosol species of the troposphere that we assume to be externally mixed. ARPEGE-Climat v7.0.1 accounts for interactions between particles and radiation (direct aerosol effect). However, the interactions between aerosols and clouds (indirect aerosol effects) are not considered in this version of the model. During ARPEGE-Climat simulations, aerosol optical properties are based on look-up tables pre-calculated using a Mie code and the aerosol sphericity hypothesis (Ackerman and Toon, 1981). These optical properties are also dependent on the relative humidity, except for desert dust and hydrophobic black carbon and organic matter.
The atmospheric dynamics and physics are computed on a T127 triangular grid truncation or associated reduced Gaussian grid, which corresponds to a spatial resolution of approximately 150 km in both longitude and latitude. ARPEGE-Climat is a “high-top” model with 91 vertical levels, extending from the surface to 0.01 hPa in the mesosphere. These levels use hybrid σ pressure coordinates (Simmons and Burridge, 1981), with 15 levels below 1500 m. To simulate surface state variables and fluxes, ARPEGE-Climat uses the SURFace EXternalisée (SURFEX) modelling platform (version 8.1 here), which is present in cycle 48t1 of the ARPEGE/IFS system (Le Moigne et al., 2020). This platform operates over the same grid and with the same time step as the rest of the model. Physical processes at the land surface are represented using the Interaction Soil-Biosphere-Atmosphere (ISBA) land surface model (Noilhan and Mahfouf, 1996).
2.2 Model simulation configurations and reference dataset
Two configurations of ARPEGE-Climat, specifically of the ecRad radiation scheme, have been used in this study, turning on or turning off the LW aerosol scattering, to run two amip-type simulations over a 30-year period (1985–2014). In the rest of the paper, we refer to these two simulations as NOLWAS (without LW aerosol scattering) and LWAS (with LW aerosol scattering). The forcings used in these simulations are those from the CMIP6 framework (Eyring et al., 2016), which include, among others, sea surface temperatures and sea ice concentrations. As for the aerosol forcing, to minimise computational time, we have used a 3D monthly climatology of aerosol concentrations (14 aerosol bins or species in total) over the ARPEGE-Climat grid that we provided as input into ecRad in the NOLWAS and LWAS simulations. This climatology is based on a 10-year simulation (2005–2014) using the version of the TACTIC aerosol scheme described in Drugé et al. (2022) without brown carbon as it was not relevant for this study. The various radiative diagnostics provided in this study have been computed under all-sky conditions and under clear-sky ones, as classically done. Under clear-sky conditions, only clouds are removed, with surface temperatures and water vapour remaining unchanged.
We used data from the Aerosol Robotic Network (AERONET) (Holben et al., 1998), which are available for the period of 2000–2020, depending on the station, to evaluate the ability of ARPEGE-Climat to reproduce coarse AOD. AERONET is a globally distributed network of ground-based sun photometers that provide local, column-integrated aerosol properties, including total, coarse, and fine AOD at various wavelengths. For this study, we used version-3 data (level 1.5 with an automated cloud screening) (Sinyuk et al., 2020). AOD at 550 nm was derived using Ångström coefficients between the closest available upper and lower wavelengths. Monthly climatologies were then computed over the available periods to compare with the model monthly climatology. It is worth mentioning that AERONET AOD measurements have an uncertainty of less than 0.01 for wavelengths longer than 440 nm and less than 0.02 for UV wavelengths (Eck et al., 1999; Kinne et al., 2013). Additionally, AERONET AOD values are derived during the daytime, whereas our model AOD is averaged over day and night.
For the evaluation, we selected 12 AERONET stations that have enough data to compute an averaged annual cycle representative of the climate of the 2000–2020 period. In that sense, we kept only AERONET monthly data with at least eight daily values to derive the mean of each month, and, for a given month, we kept only the stations with at least 3-monthly values over the 2000–2020 period. These stations, which we numbered in alphabetical order, are located in southern Europe, northern Africa, and over the Arabian Peninsula, where the maximum amount of coarse AOD is found. In order to represent a region with significant sea salt aerosols, we also include one station (station 1) in the southern Indian Ocean, even if the observations available at this station do not meet our selection criteria. See Table A1 for the characteristics of the AERONET stations of this study.
This section focuses on the desert dust and sea salt aerosols as these species are the main sources of coarse aerosols. We calculated optical properties from refractive indices (RIs) using a Mie code.
For desert dust aerosols, a new RI has been introduced into TACTIC for this study, represented by purple dots in Fig. 1, with the original version shown by red dots. This updated RI is based on several studies: Di Biagio et al. (2017) for wavelengths between 3 and 15 µm and Woodward (2001) for higher wavelengths between 15 and 40 µm. The study of Di Biagio et al. (2017) was selected because it presents a desert dust RI derived from the mineralogical composition and size distribution of mineral dust obtained through in situ measurements in a smog chamber. Their study covers 137 desert dust samples coming from various natural soils across eight regions, including northern Africa, the Sahel, the Middle East, South America, and others. This large sample captures the diversity of sources and the heterogeneity of soil composition at the global scale. The complex desert dust RI is finally derived through optical inversion using extinction spectrum and size distribution measured in the smog chamber. Di Biagio et al. (2017) observed significant variability in the imaginary LW RI across samples, ranging from 0.001 to 0.92, reflecting differences in particle composition. In contrast, the real part of the desert dust RI was less variable, ranging from 0.84 to 1.94. In our study, since the aerosol optical properties are not calculated online but instead are based on pre-calculated look-up tables, an average value per wavelength of between 3 and 15 µm was calculated based on the Di Biagio et al. (2017) study for both the real and imaginary parts of the desert dust RI. For wavelengths between 15 and 40 µm, as in the IFS model, our desert dust RI is based on an earlier study (Woodward, 2001), which provides desert dust RI values for both the real and imaginary parts derived from a range of measurements taken at various locations (Carlson and Benjamin, 1980; Sokolik et al., 1993, 1998).
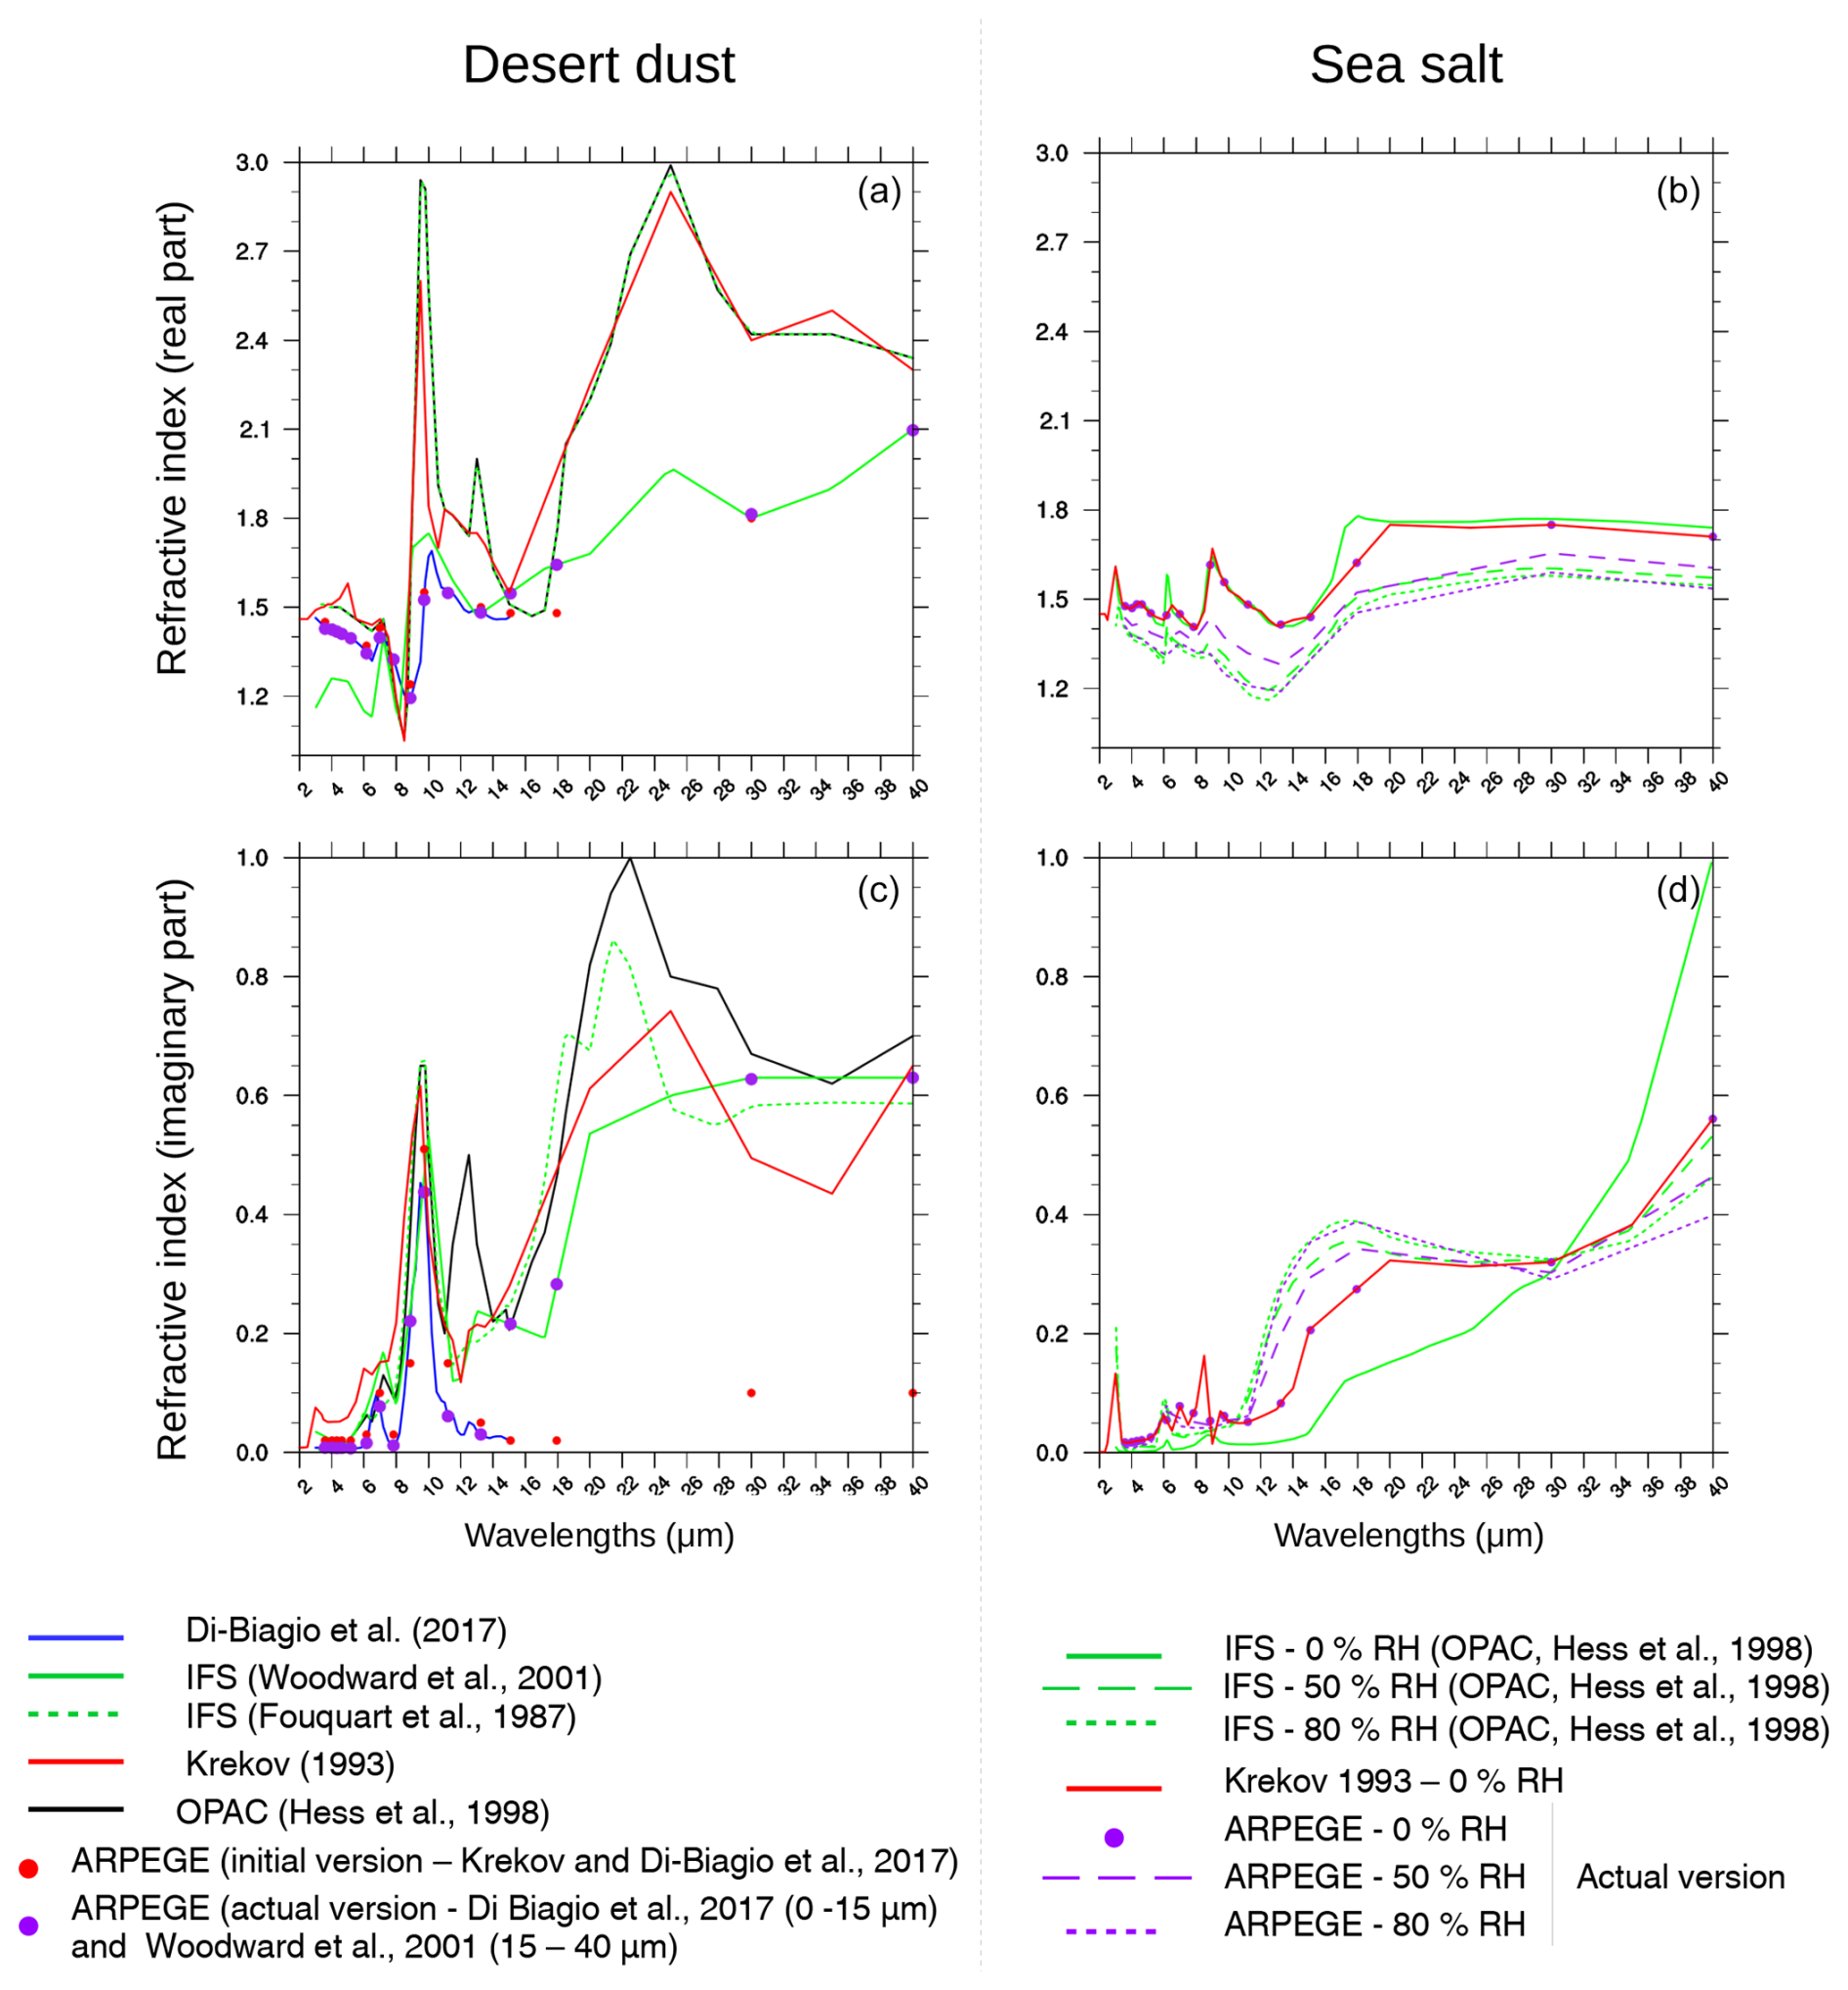
Figure 1Real (first line) and imaginary (second line) refractive indices of desert dust (a, c) and sea salt (b, d) particles. The optical properties used in this study were calculated from the refractive indices shown in purple.
As shown in Fig. 1, the desert dust RI used in this study ranges from 1.2 to 2.1 for the real part and from 0 to 0.65 for the imaginary part. Compared to OPAC (Hess et al., 1998), Krekov (Krekov, 1993), and IFS (Fouquart option; Fouquart et al., 1987), our desert dust RI shows some differences. Specifically, for its real part, Fig. 1 indicates that the values used in this study are lower than those from Krekov and OPAC for wavelengths above 20 µm. Regarding the imaginary part, our values are lower than those from OPAC, IFS, and Krekov. Compared to our initial values (red dots), our new imaginary desert dust RI shows higher values from 15 µm, bringing them closer to other datasets. Desert dust optical properties calculated from this updated RI (not shown here) are now closer to those used in the IFS model.
The sea salt RI used in this work remains unchanged from previous versions of the TACTIC scheme. It is based on the study by Krekov (1993), which presents values for 0 % relative humidity. It is important to note that sea salt RI has been less extensively studied than desert dust RI in the scientific literature. The real and imaginary parts of the sea salt RI for several relative humidities (0, 50, and 80 %) are shown in Fig. 1. This figure illustrates that the sea salt RI used in IFS, which corresponds to OPAC data (Hess et al., 1998), is quite similar to the one used here. Similarly, Irshad et al. (2009) report sea salt real and imaginary RI values that are also consistent with those used here. The optical properties calculated from this RI (not shown here) are similar to those used in the IFS model, except for the largest particles, which exhibit notably lower extinction and a higher asymmetry parameter. These differences are primarily due to difference in the particle size between the coarsest bin used in the ARPEGE-Climat model and the one used in the IFS model.
In the ARPEGE-Climat global climate model, coarse aerosols correspond to desert dust bins 2 (1–2.5 µm diameter) and 3 (2.5–20 µm diameter), sea salt bins 2 (1–10 µm diameter) and 3 (10–100 µm diameter), and coarse nitrate (see Drugé et al., 2019, for details). Figure 2 presents the annual mean of the coarse AOD simulated by ARPEGE-Climat over the period 1985–2014. The maximum coarse AOD, reaching values of around 0.40, is located in the Arabian Peninsula and in northern Africa (a region that will be referred as “N-Africa” in the rest of the paper), within the latitude band of 10–30° N. This maximum coarse AOD is consistent with the AeroCom phase-3 ensemble median (14 models) presented in Gliß et al. (2021). Over these regions, the seasonal cycle of coarse-aerosol AOD is compared with measurements from various AERONET stations. The data from stations in Niger (2), Senegal (4), Saudi Arabia (11), and Algeria (12), are shown in Fig. 2 and are representative of the model behaviour in these regions. These graphs clearly demonstrate that desert dust largely contributes to coarse AOD over N-Africa and the Arabian Peninsula, with a peak occurring between March and September.
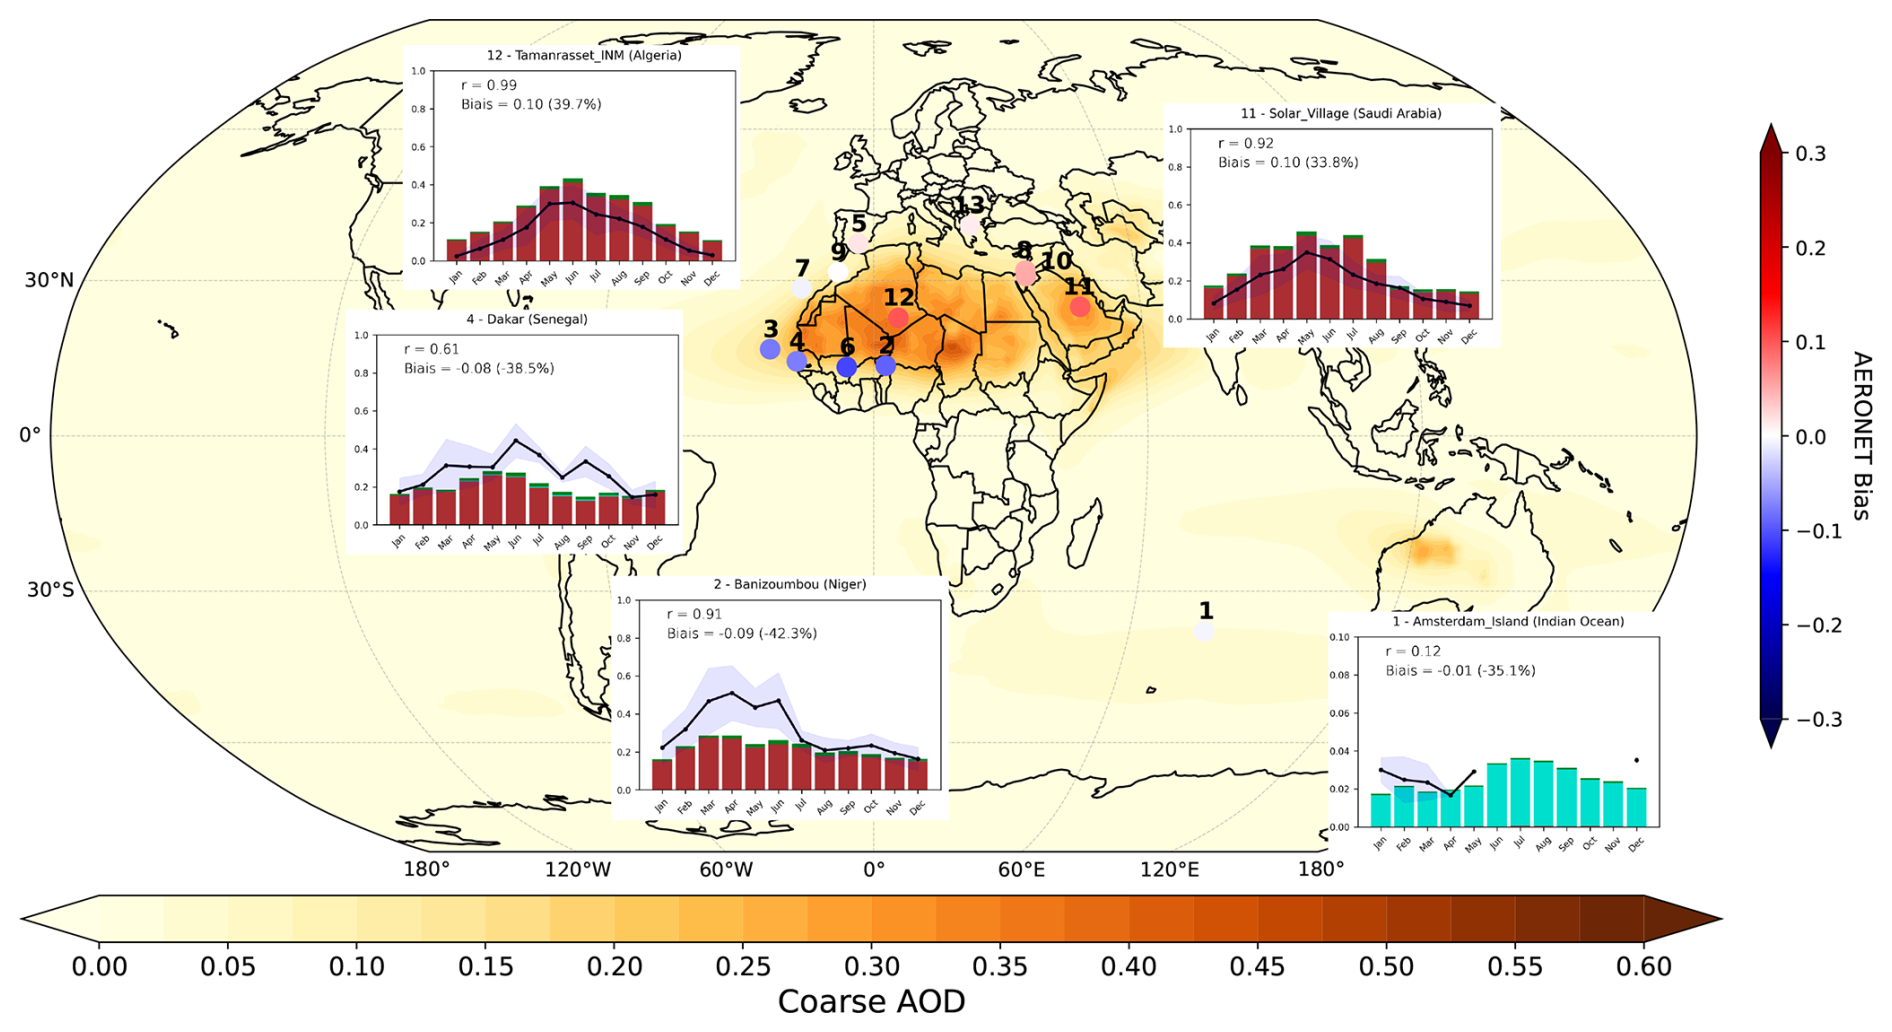
Figure 2Coarse AOD (550 nm, annual mean over 1985–2014) simulated by the ARPEGE-Climat model. AERONET stations are represented by circles (see Table A1 for details on these stations). The colour of the circles corresponds to the coarse-AOD bias between the model and the station. Annual cycles are shown for five AERONET stations, compared with AERONET measurements (black, with standard deviation in light blue). Coarse desert dust is shown in brown, coarse sea salt is shown in cyan, and coarse nitrate is shown in green.
Correlation coefficients (r) between ARPEGE-Climat model results and AERONET coarse-AOD measurements (climatological series) in dust-emitting regions are generally high (r > 0.61), indicating that the model effectively captures the spatio-temporal variations in coarse AOD. The coarse-AOD biases range from −0.11 to +0.10, depending on the location of the station. Specifically, stations in the northern part of the regions of N-Africa and the Arabian Peninsula, such as in Saudi Arabia (11) and Algeria (12), show a peak in coarse AOD during May and June, which is rather well reproduced by the model. However, measurements at these stations also reveal an overestimation of about 30 %–40 % (+0.10) in coarse AOD by the model throughout the year. In contrast, stations in the southern part of the region of N-Africa and the Arabian Peninsula, such as Niger (2) and Senegal (4), show a significant underestimation of the coarse AOD simulated by the model, with biases of about 40 %–50 % (−0.10) relative to AERONET data. In particular, the AERONET measurements at Niger (2) show a peak during March, April, May, and June, which is not captured by the ARPEGE-Climat model. Similarly, stations in Cape Verde (3) and Mali (6), shown in Fig. A1 in the Appendix, also display an underestimation of coarse AOD simulated by the model. In comparison, Gliß et al. (2021) also noted in their study that the AeroCom phase-3 models underestimate coarse AOD by 46 % when compared to 222 AERONET stations around the globe. Finally, stations in Spain (5), the Canary Islands (7), Israel (8 and 10), Morocco (9), and Greece (13), shown in Fig. A1, indicate that the coarse AOD simulated by ARPEGE-Climat is rather close to the AERONET measurements.
The station located in the Indian Ocean (1) is predominantly influenced by sea salt aerosols. Although AERONET data for this station are limited (see details in Sect. 2.3), they are consistent in terms of average values with the coarse AOD simulated by the model for this region. Nevertheless, as this coarse AOD is an order of magnitude lower than the ones from dust, the remainder of this study will focus on the N-Africa–Arabian Peninsula region, where the coarse AOD and radiative impact are at their maximum.
The effects of taking into account the LW aerosol scattering on several diagnostics, specifically high-level (above 440 hPa) and low-level (below 640 hPa) cloud area fractions, net LW radiation at the surface and at the TOA, and daily minimum near-surface temperature (2 m; in the rest of the paper, we refer to it as surface temperature), are shown in Figs. 3 and 4 over our regions of interest. For more information, these results are presented at the global scale in Fig. A2. To improve clarity, the results are shown for four specific months, namely March, May, July, and September, which cover the period of maximum coarse AOD (see Fig. 2).
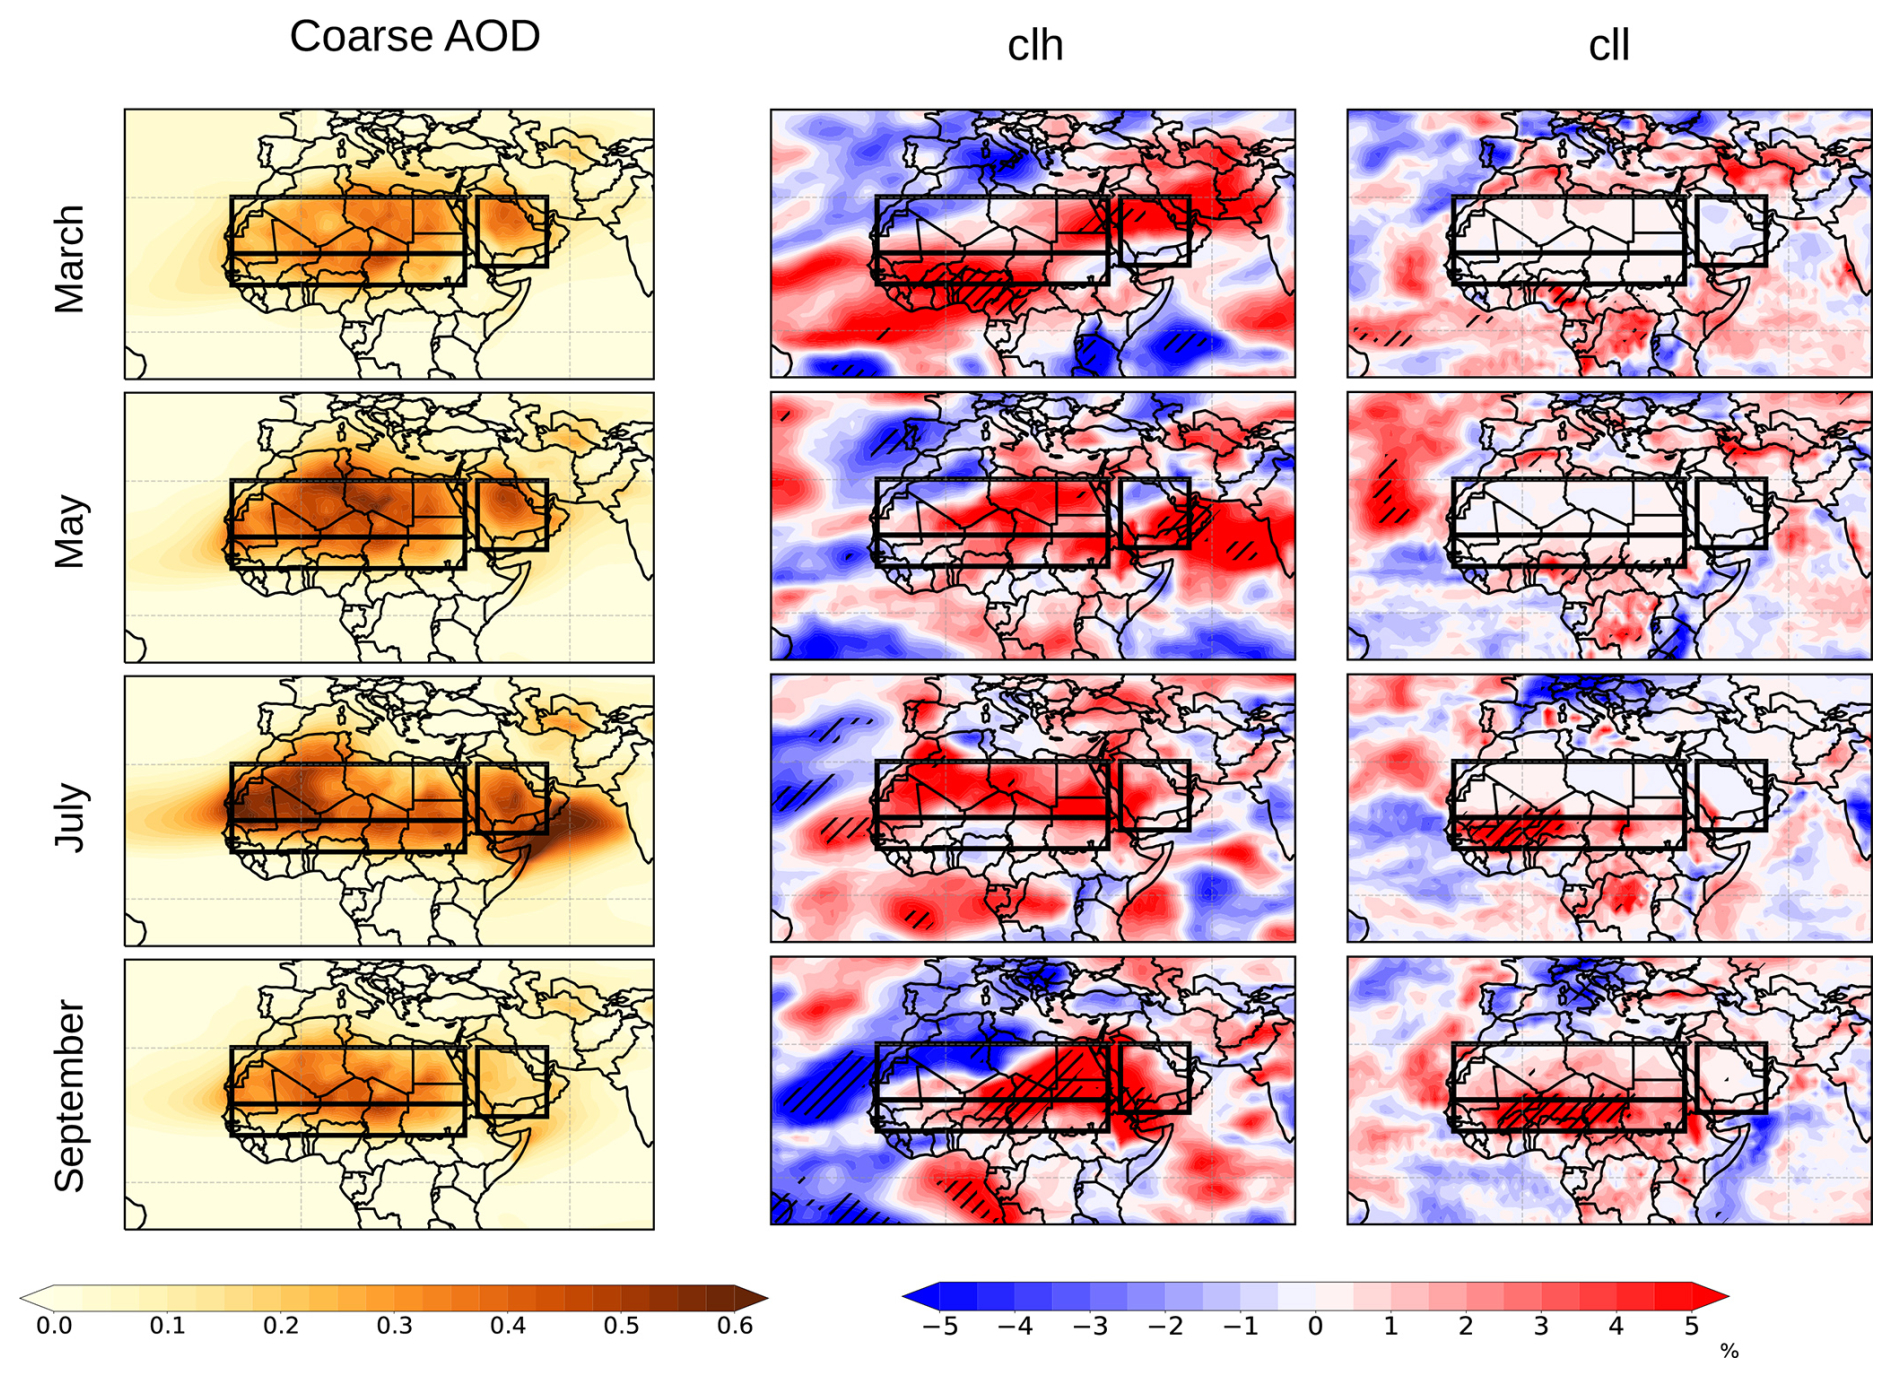
Figure 3Coarse AOD (550 nm, left column) and mean differences (1985–2014) between the LWAS and NOLWAS simulations (LWAS minus NOLWAS) in terms of cloud area fraction (%) at high (above 440 hPa, middle column) and low (below 640 hPa, right column) altitudes (clh and cll, respectively) for the months of March (first line), May (second line), July (third line), and September (fourth line). Hatching indicates regions with a significant effect at the 0.05 level (Student's t test).
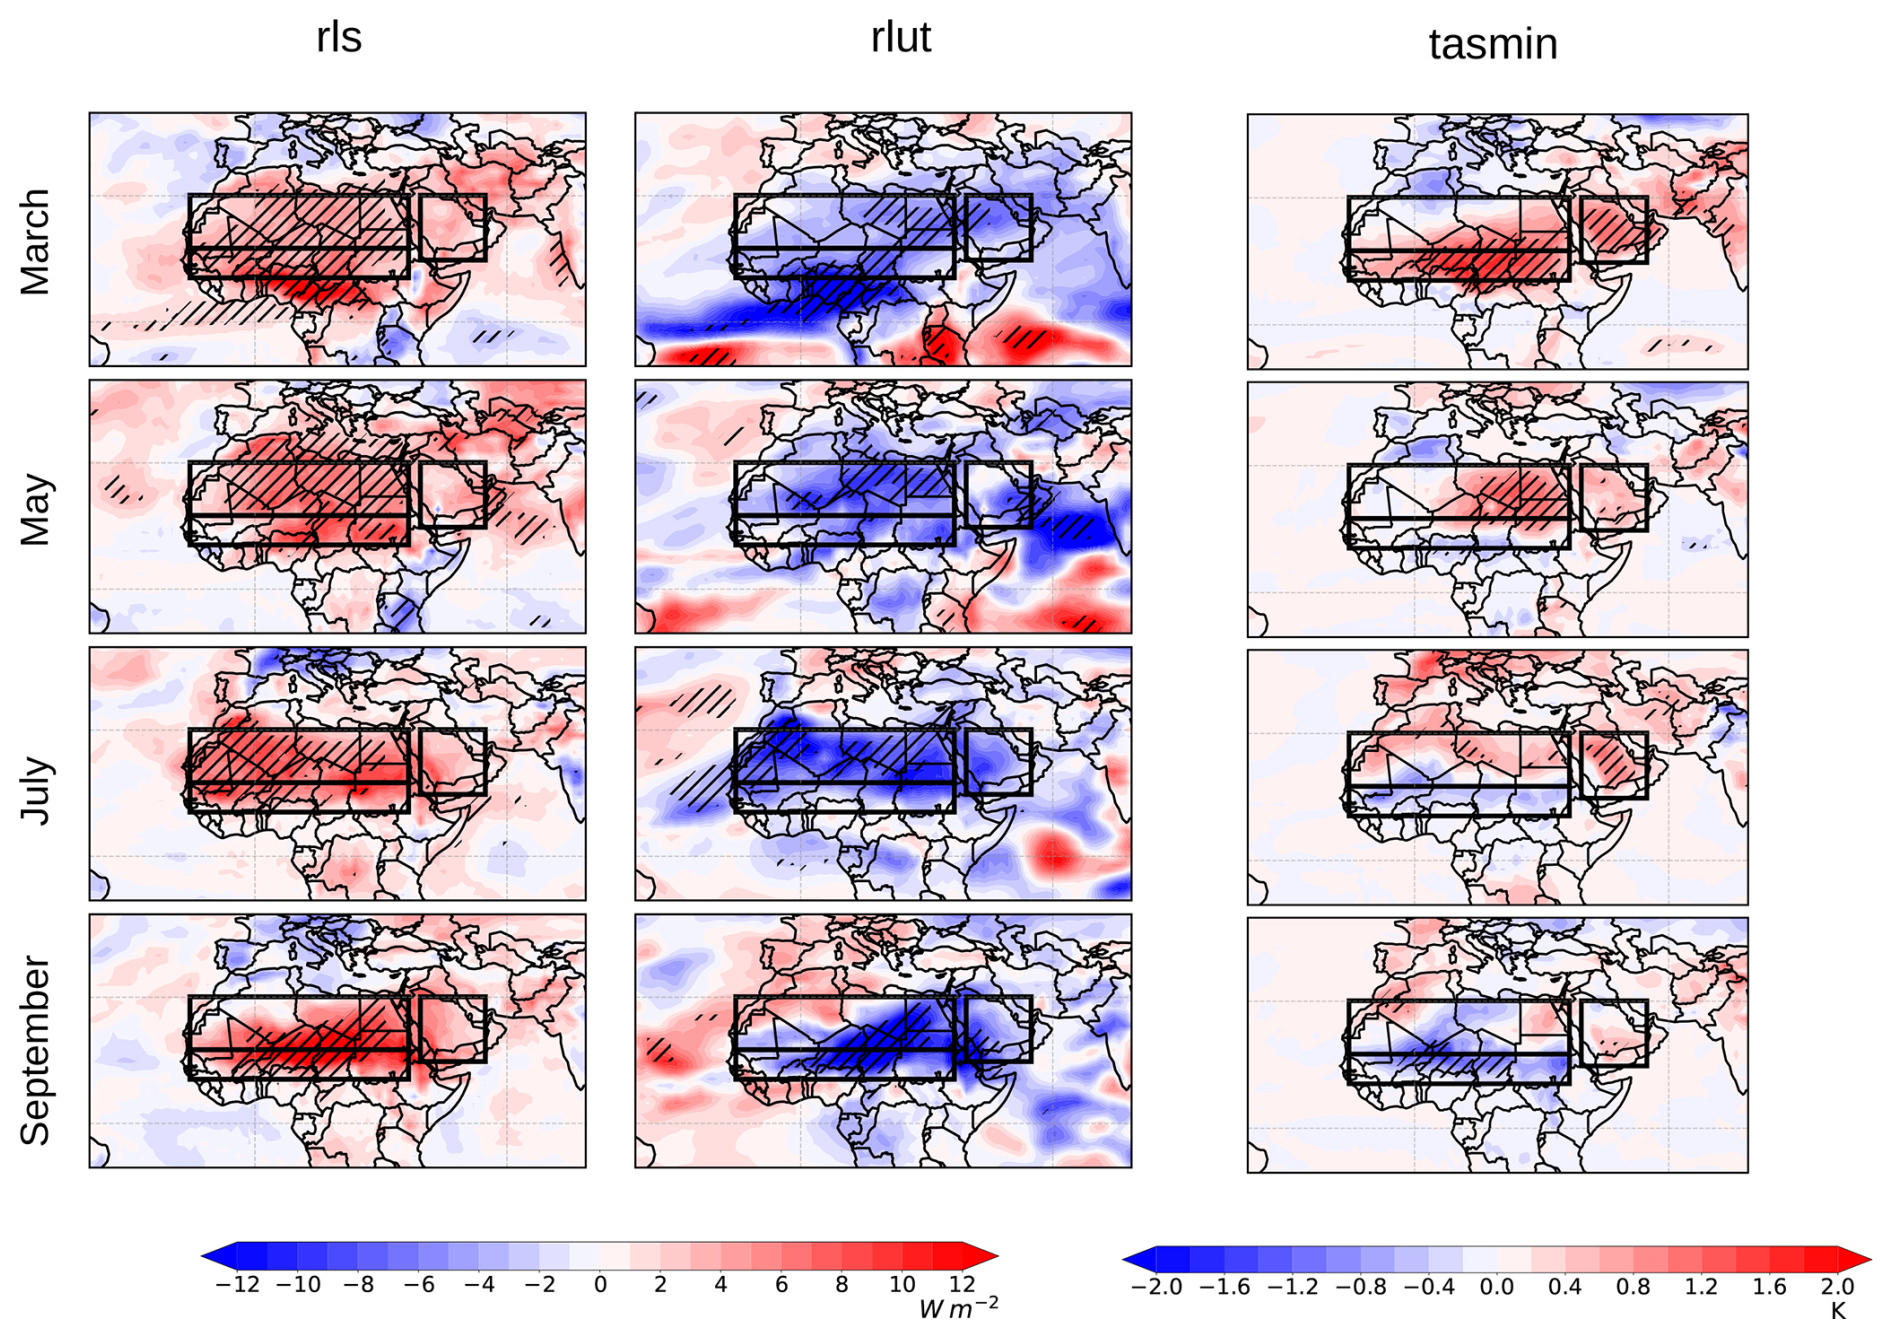
Figure 4Same as in Fig. 3 for rls (net LW surface radiation, rls = rlds − rlus, with rlds being the downward LW surface radiation and rlus being the upward LW surface radiation, W m−2), rlut (TOA outgoing LW radiation, W m−2), and tasmin (minimum surface temperature, K).
A significant increase in net surface LW radiation (up to +8 W m−2) due to the aerosol scattering in the LW is observed in Fig. 4 over much of N-Africa for the 4 selected months. Similarly, a significant decrease in outgoing LW radiation at the TOA is observed, though this effect is somewhat less widespread. These changes in radiation are also evident under clear-sky conditions, as shown in Fig. A3. Our results indicate that they are even more significant under clear-sky conditions over these 4 months, particularly the decrease in LW radiation at the TOA, confirming that the LW scattering of coarse aerosols has a direct impact on radiation over N-Africa. During March and May, Fig. 4 indicates significant increases in daily minimum surface temperature over the region (up to +1.0 °C), which are consistent with the rise in LW radiation at the surface. It is interesting to note that the area covered by this daily minimum surface temperature increase is much smaller than the area covered by the LW surface radiation increase. In contrast, for July and September, both Figs. 4 and A3 show a drop in daily minimum and maximum surface temperatures in the south of the N-Africa region (up to −1 °C), which is significant in September. These temperature decreases appear to be linked to a significant decrease in SW surface radiation (shown in Fig. A4) due to an increase in low-troposphere cloud area fraction, as observed in Fig. 3.
Further details regarding the annual cycle of these variables are presented in Fig. 5 over three specific regions highly exposed to dust: the Sahara (18–30° N, 16° W–36° E), the Sahel (10–18° N, 16° W–36° E), and the Arabian Peninsula (15–30° N, 40–55° E). These regions are highlighted with black frames in Figs. 3 and 4. Over the Sahara and Sahel, a significant increase in net surface LW radiation (+5 W m−2 on average) is observed from February to October, as shown in Fig. 5. Changes in radiation, particularly outgoing LW radiation at the TOA, due to clouds (the difference between all-sky and clear-sky fluxes) appear to be mostly correlated with changes in high-troposphere cloud area fraction. In fact, the most important changes in radiation associated with clouds occur in July and August over the Sahara, in April over the Sahel, and in April and August over the Arabian Peninsula, coinciding with the peak increases in high-troposphere cloud area fraction over these regions. Figure 5 also highlights an increase in daily minimum surface temperature during April, May, June, and July over the Sahara (+0.5 °C on average) and during March (+1.0 °C) and April (+0.5 °C) over the Sahel. These temperature increases are directly linked to the changes in surface LW radiation over these regions. In contrast, for July, August, and September, Fig. 5 shows a significant decrease in the daily minimum (−0.5 °C) and maximum (−0.8 °C) surface temperatures over the Sahel. This figure also shows that this temperature drop is the result of a significant drop in net SW surface radiation due to a significant increase in low-troposphere cloud area fraction. Additionally, including aerosol scattering in the LW spectral range leads to a significant increase in precipitation over the Sahel during September (+0.6 mm d−1), as shown in Fig. A5 (note that convective precipitation is identical to total precipitation in this region). In order to propose hypotheses to explain these changes in precipitation and clouds, Fig. A6 presents the vertical velocity changes at 925 and 500 hPa, and Fig. A7 presents the vertical velocity, temperature, and specific humidity vertical profiles over the Sahel during September. These figures show that the significant reduction in temperature below 700 hPa (Fig. A7d) over this region reduces convection in the lowest atmospheric layers (vertical velocity values are less negative in the LWAS simulation below 700 hPa; see Fig. A7a). This drop in low-level convection, combined with a significant rise in humidity, has resulted in a stabilisation of the lowest atmospheric layers and an increase in low-level clouds over the Sahel in September. Conversely, above 700 hPa, Fig. A7a highlights a significant increase in convection. Associated with a deep-convection regime (negative vertical velocity absolute value; see Fig. A7a) and coupled with a humidity augmentation (Fig. A7c), this enhanced convection, possibly caused by a significant increase in wind convergence at 700 hPa (Figs. A7b and A9), tends to favour high-level clouds over the Sahel in September. In addition, the increase in humidity observed here over the Sahel in September could be due to an increase in wind from the Atlantic Ocean, particularly at 850 hPa and above, as shown in Fig. A10. To summarise, it would appear that the addition of aerosol diffusion in the LW contributed to opposite changes in the lower layers (reduced convection and increased humidity) and the middle and upper troposphere (increased convection and clouds) in the Sahel in September, with a potentially important role of wind.
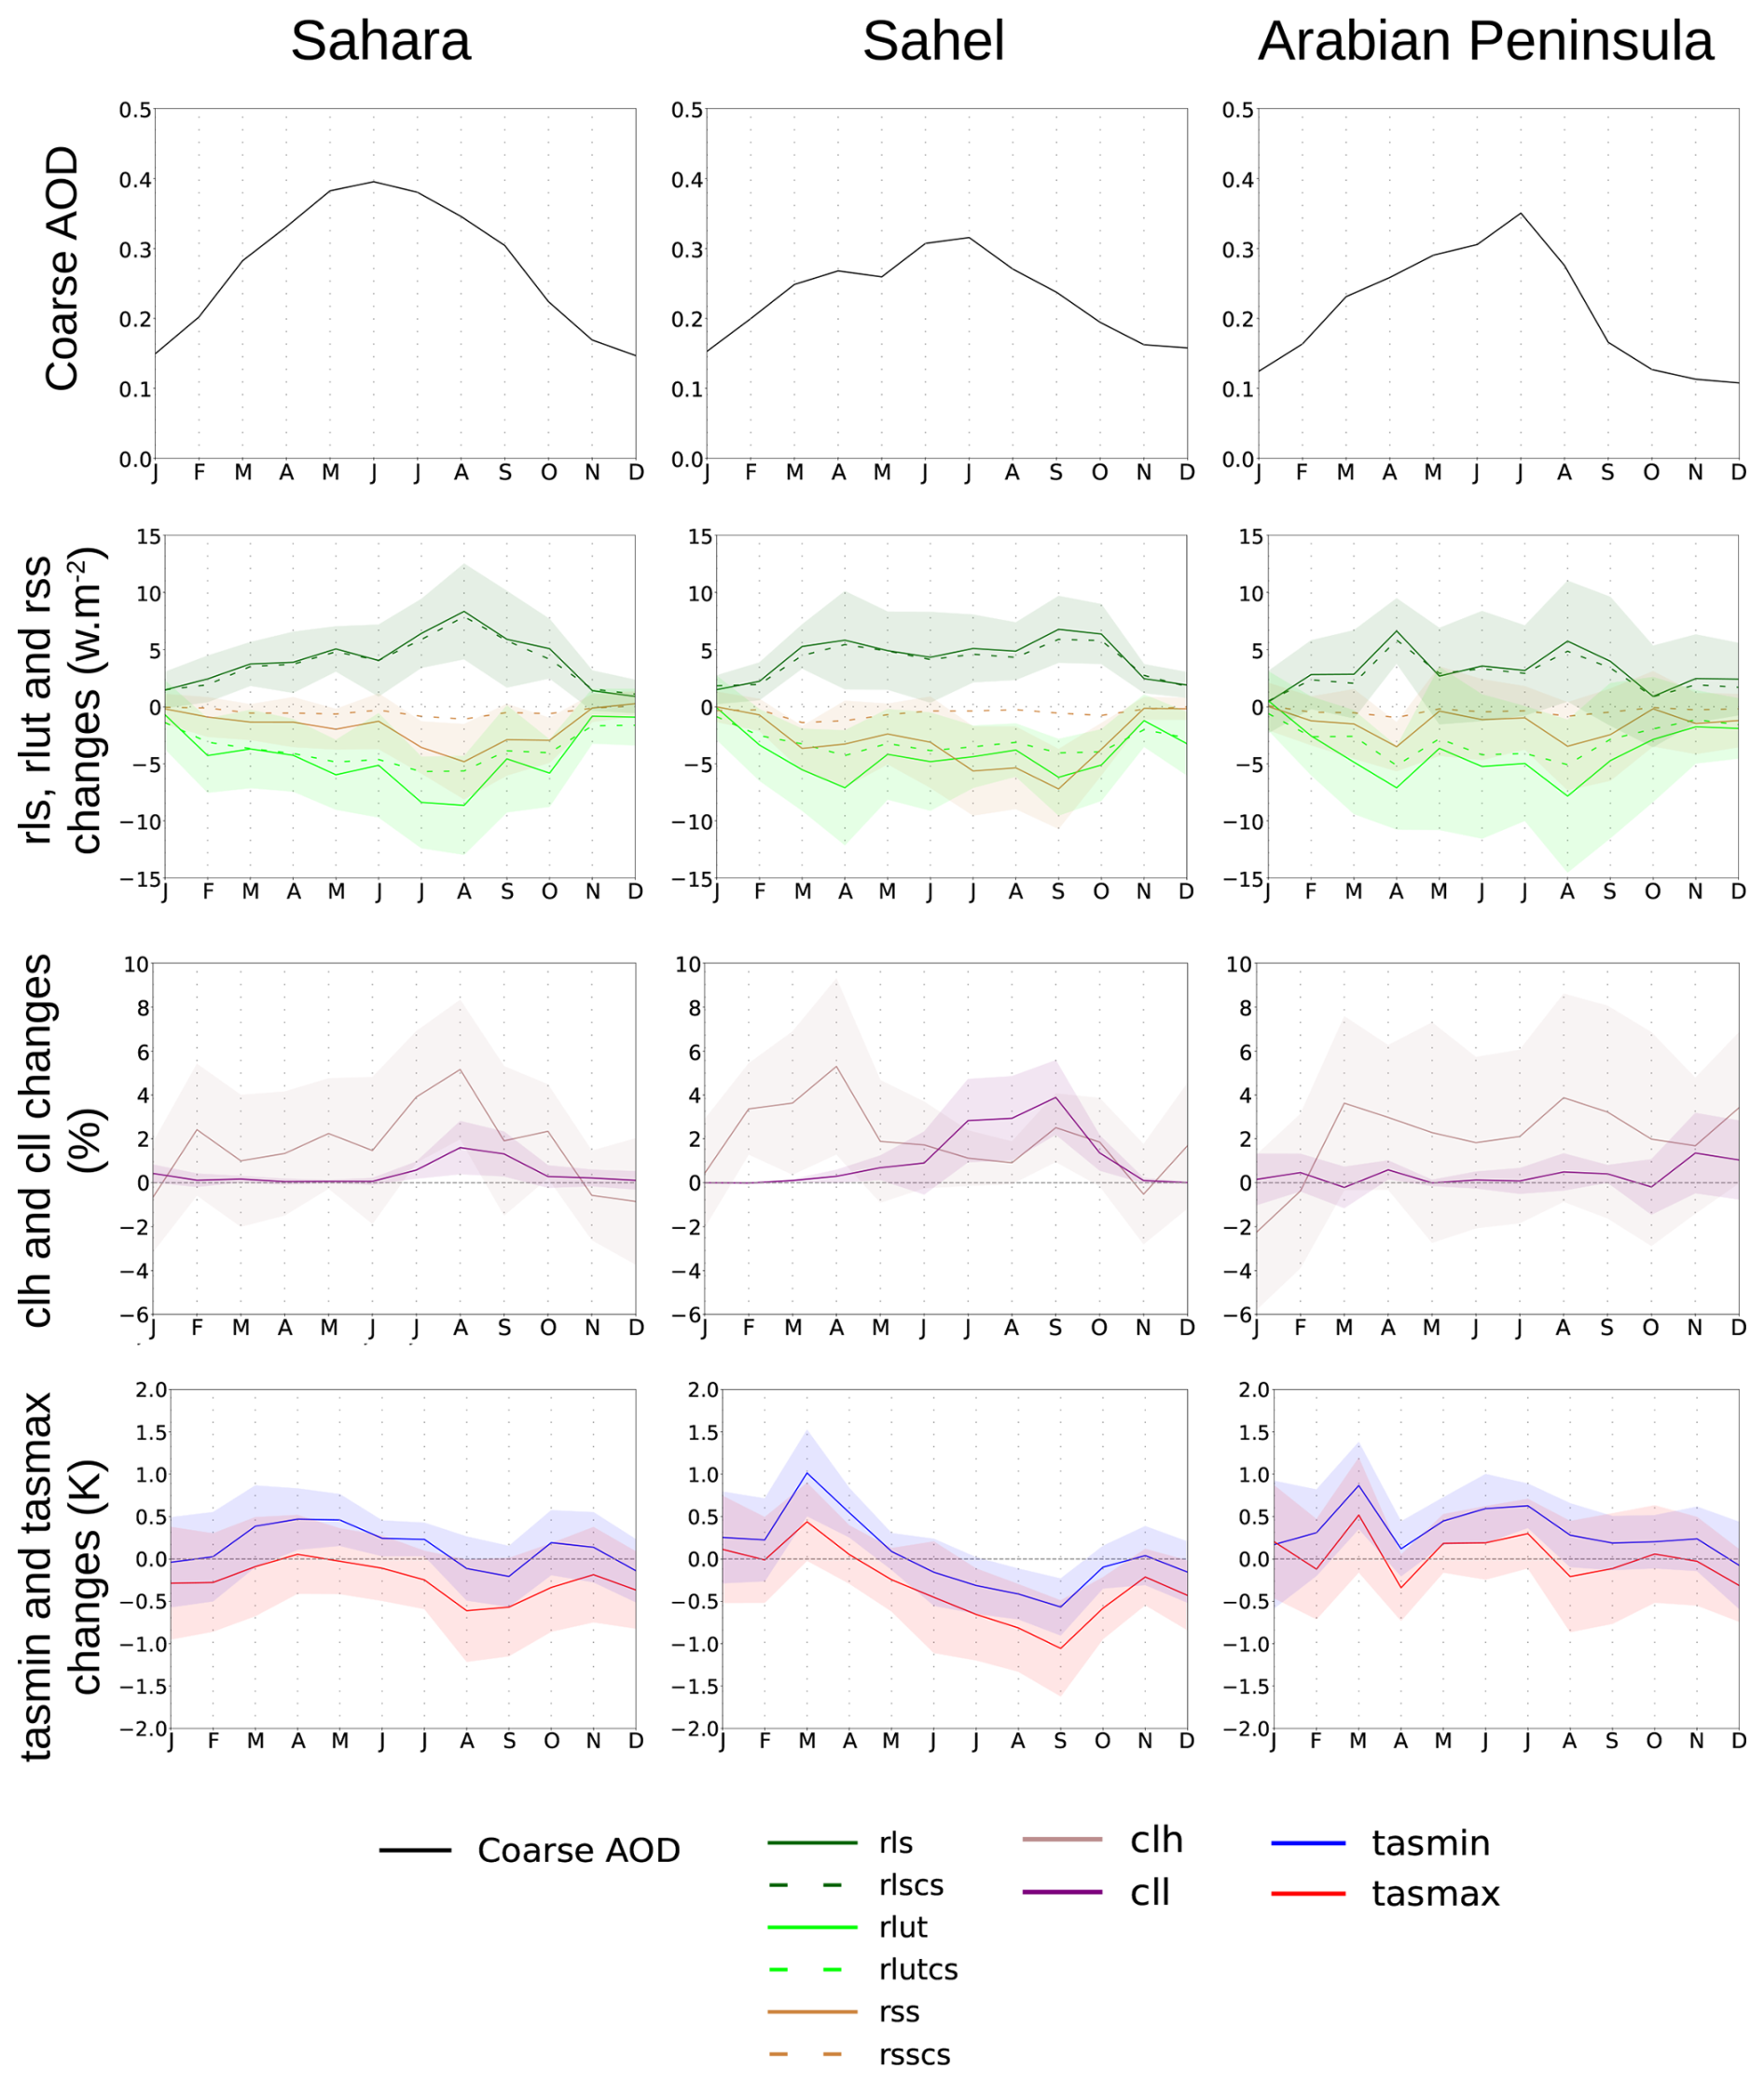
Figure 5Annual cycle of coarse AOD (550 nm) and annual (1985–2014) cycles of changes in rls (net LW surface radiation, rls = rlds − rlus, W m−2), rlut (TOA outgoing LW radiation, W m−2), rss (net SW surface radiation, rss = rsds − rsus, W m−2), clh and cll (high – above 440 hPa – and low – below 640 hPa – troposphere cloud area fraction, %) changes, and tasmax and tasmin changes (maximum and minimum surface temperature, K) between the LWAS and NOLWAS simulations (LWAS minus NOLWAS) over three regions: the Sahara, Sahel, and Arabian Peninsula. Confidence intervals are indicated in light colour (Student's t test, 0.05 level).
Similarly, over the Sahara in August, the increase in high-level clouds observed could also be due to an increase in humidity (Fig. A8c) coupled with a significant increase in convection (Figs. A6 and A8a) above 700 hPa, which is probably due to a significant increase in wind convergence at 700 hPa (Fig. A8b). Lastly, over the Arabian Peninsula region, Fig. 5 shows significant increases in daily minimum surface temperature during March (+1 °C) and also during May, June, and July (+0.5 °C), which can be attributed to the increased LW radiation at the surface from aerosol scattering. It is noteworthy that the greatest direct impact is on daily minimum surface temperatures (which occurs during the night), which are more influenced by changes in LW radiation, rather than on daily maximum surface temperatures, which are more influenced by SW radiation. The impact of the aerosol scattering in the LW spectrum on the LW heating rate has also been studied over the Sahara region (see Fig. A11) and has been found to be relatively weak, which is consistent with the study of Dufresne et al. (2002). The only significant impact is between the surface and 700 hPa, consistently with the vertical coarse-aerosol concentration profile, in July, which is the month with the highest AOD (0.55) over the Sahara region. On the other hand, no significant change is visible in September.
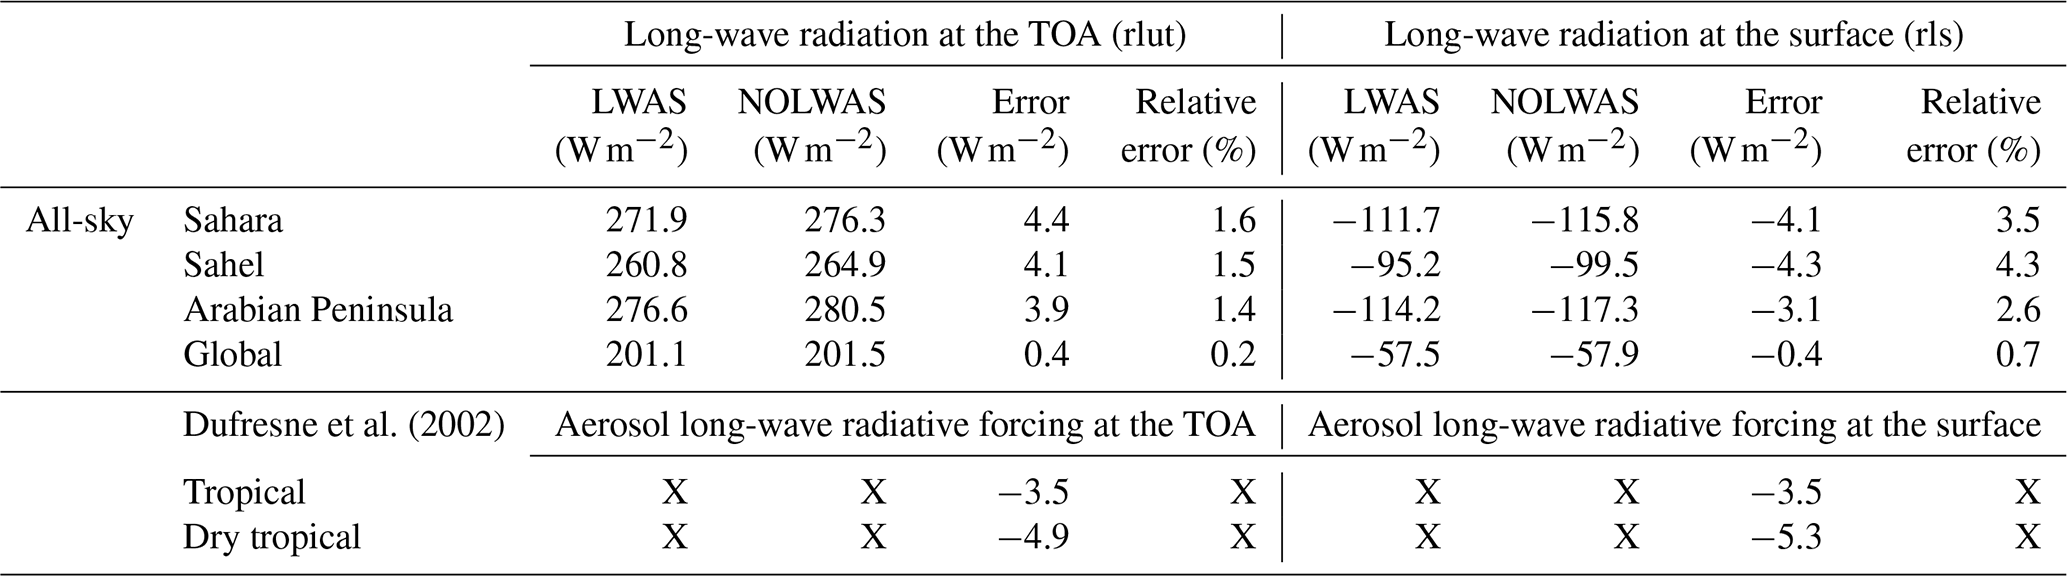
Annual averages of the LW radiation at the TOA and at the surface over the three regions studied are summarised in Table 1 (all-sky conditions) and Table A2 (clear-sky conditions). Neglecting LW aerosol scattering (NOLWAS simulation) results in a net LW radiation underestimation of between −3.1 and −4.3 W m−2 (i.e. between 2.6 % and 3.5 % of the total) at the surface and between −3.9 and −4.4 W m−2 (i.e. between 1.4 % and 1.6 % of the total) at the TOA under all-sky conditions. Under clear-sky conditions and as an annual average, LW scattering of aerosols has less impact on radiation. Indeed, under clear-sky conditions, neglecting LW aerosol scattering results in a net LW radiation underestimation if between −2.7 and −4.0 W m−2 (i.e. between 2.2 % and 3.2 % of the total) at the surface and between −2.9 and −3.7 W m−2 (i.e. between 1.0 % and 1.3 % of the total) at the TOA. These results are consistent with those of Dufresne et al. (2002) for the tropical and dry tropical atmospheric profiles, as summarised in Table 1. Specifically, they showed that neglecting LW aerosol scattering could lead to a radiative forcing error in the LW range comprised of between −3.5 and −5.3 W m−2 at the surface and between −3.5 and −4.9 W m−2 at the TOA, which is in close agreement with our results. However, it is important to note that the configuration of our simulations does not allow for a direct calculation of the aerosol LW radiative forcing. Consequently, the radiative flux differences presented here account for both changes in aerosol radiative forcing and changes in weather. Dufresne et al. (2002) also showed that LW scattering can have varying impacts on radiation depending on the thickness and altitude of the aerosol layer, which may explain the greater impact at the surface (in percentages) than at the TOA in our study.
Dufresne et al. (2002)Table 1Annual mean (1985–2014) of the LW radiation at the TOA (rlut) and at the surface (rls) under all-sky conditions over the three regions considered in this study, namely the Sahara (18–30° N, 16° W–36° E), the Sahel (10–18° N, 16° W–36° E), and the Arabian Peninsula (15–30° N, 40–55° E), compared with the error not considering aerosol LW radiative forcing for tropical and dry tropical atmospheric profiles in the study of Dufresne et al. (2002).
On a larger scale (Fig. A2 and Table 1), our study shows a global annual mean contribution of aerosol LW scattering of +0.4 W m−2 at the surface and of −0.4 W m−2 at the TOA (i.e. net LW radiation at the TOA of +0.4 W m−2) under all-sky conditions. We note that the areas that are statistically significant mostly correspond to those analysed above, i.e. the Sahara, Sahel, and Arabian Peninsula. In comparison, studies by Di Biagio et al. (2020) and Hogan and Bozzo (2018) suggest a weaker impact from aerosol LW scattering. Indeed, Hogan and Bozzo (2018) concluded that turning on aerosol LW scattering has an impact on the global mean net LW irradiances of only up to +0.1 W m−2 at the surface and the TOA. Under clear-sky conditions (without cloud contribution but accounting for other weather changes), the global annual mean contribution of aerosol LW scattering (+0.3 W m−2 at the surface and TOA) is closer to the values reported by Hogan and Bozzo (2018), even though it remains 3 times higher. For their part, Di Biagio et al. (2020) highlighted a global annual mean all-sky DRE of desert dust of +0.22 W m−2 at the TOA in the LW range, with an LW scattering contribution of 51 %. However, Di Biagio et al. (2020) calculated a lower estimate of the LW scattering by coarse dust as they applied an LW DRE correction that accounted for only the LW scattering of dust with a diameter smaller than 10 µm. Additionally, the use of different aerosol optical properties may also partially explain the discrepancies between our results and their study.
Aerosol scattering in the LW spectrum is still neglected very often in climate models at both regional and global scales despite several studies highlighting the significance of this process for large particles such as desert dust. To date, when LW aerosol scattering is not completely neglected, it is typically treated in a simplistic manner by applying constant correction factors to “artificially” increase the AOD or the retrieved TOA direct radiative effect.
In contrast to previous approaches, we have been able to analyse the impacts of the LW aerosol scattering physically modelled in the CNRM ARPEGE-Climat global climate atmospheric model. We analysed climatological results from 30-year-long CMIP6 amip-type simulations (1985–2014) over the globe, with a focus on three regions characterised by the highest coarse-aerosol AOD.
We revised the optical properties of coarse aerosols, especially those of dust, for the 16 LW spectral bands of ecRad. Our updated dust refractive indices are derived from multiple studies: Di Biagio et al. (2017) for wavelengths ranging from 3 to 15 µm and Woodward (2001) for longer wavelengths of 15–40 µm.
The ARPEGE-Climat coarse-AOD climatology over North Africa and the Arabian Peninsula successfully captures the spatio-temporal variations of the AERONET data, with an average correlation coefficient of 0.86. Coarse-AOD biases range from −0.11 to +0.10, depending on the station's location. In the northern part of these regions, the model generally overestimates coarse AOD by about 30 %–40 % (+0.10) throughout the year, while, over the southern part of these regions, it underestimates coarse AOD by approximately 40 %–50 % (−0.10).
Over the three regions examined in this study (the Sahara, Sahel, and Arabian Peninsula), accounting for aerosol scattering in the LW spectral range leads to a significant increase in surface LW radiation (+5 W m−2 on average) from March to September. This change induces notable temperature increases, particularly in daily minimum surface temperature (ranging from +0.5 and +1 °C, depending on the region and time period), which are directly linked to the rise in LW radiation at the surface. Conversely, in certain months, both daily minimum and maximum surface temperatures drop significantly (up to −0.8 °C). These decreases in surface temperature are associated with changes in clouds, wind circulation and atmospheric stability, varying from month to month and from region to region. Thus, a significant reduction in SW surface radiation consistent with the cooling could be due to a significant increase in low-troposphere cloud area fraction. This increase in low-level clouds is likely the result of stronger stratification in the lower troposphere, which is a consequence of weaker convection at these altitudes. Finally, a significant increase in precipitation, associated with enhanced convection above 700 hPa, is also observed over the Sahel in September. Uncertainties are, however, important in these conclusions, given that these results may be affected by the various coarse-AOD biases discussed above. The results presented here may also be model-dependent, and further studies using different climate models would be valuable to assess the robustness of these findings.
This study highlights the importance of incorporating aerosol scattering into the LW spectrum in climate models. However, it is important to note that these results may be underestimated because the coarsest dust particles (with a diameter greater than 20 µm) are not yet taken into account in the model. Moreover, the underestimation of coarse AOD near the Sahel, probably linked to a poor representation of the African monsoon in the simulation in which the AOD dataset was produced (Roehrig et al., 2020), could contribute to underestimating the effects in this region. Additionally, while several studies have already been published, further research is needed to improve the knowledge about the refractive index of large particles such as desert dust or sea salt and, more broadly, their optical properties. Using an interactive aerosol scheme would also provide a better representation of the spatio-temporal variability of aerosols in the model and allow for the study of specific events such as intense dust episodes or heatwaves. Finally, convection-permitting or fully coupled atmosphere–ocean climate model simulations would be relevant to explicitly represent convection and for enabling LW aerosol scattering to influence air–sea interactions.
Table A1Characteristics of the AERONET stations used in this study: station name, location, altitude, number of months with data available over at least 3 years during the observation period (2000–2020), and total years available over the observation period (2000–2020).
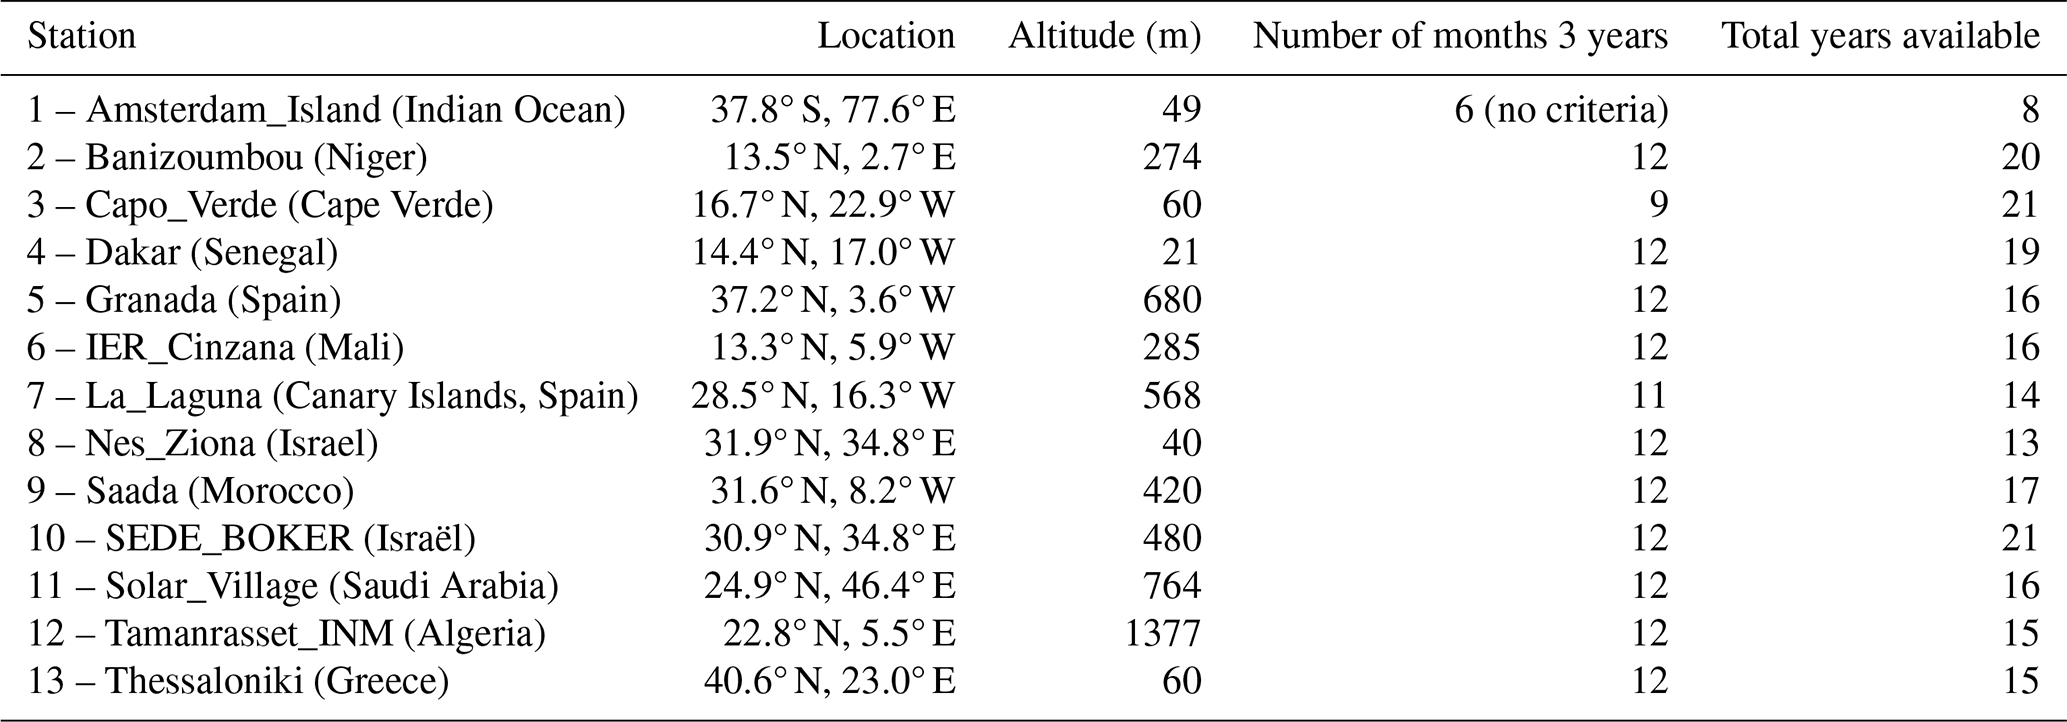
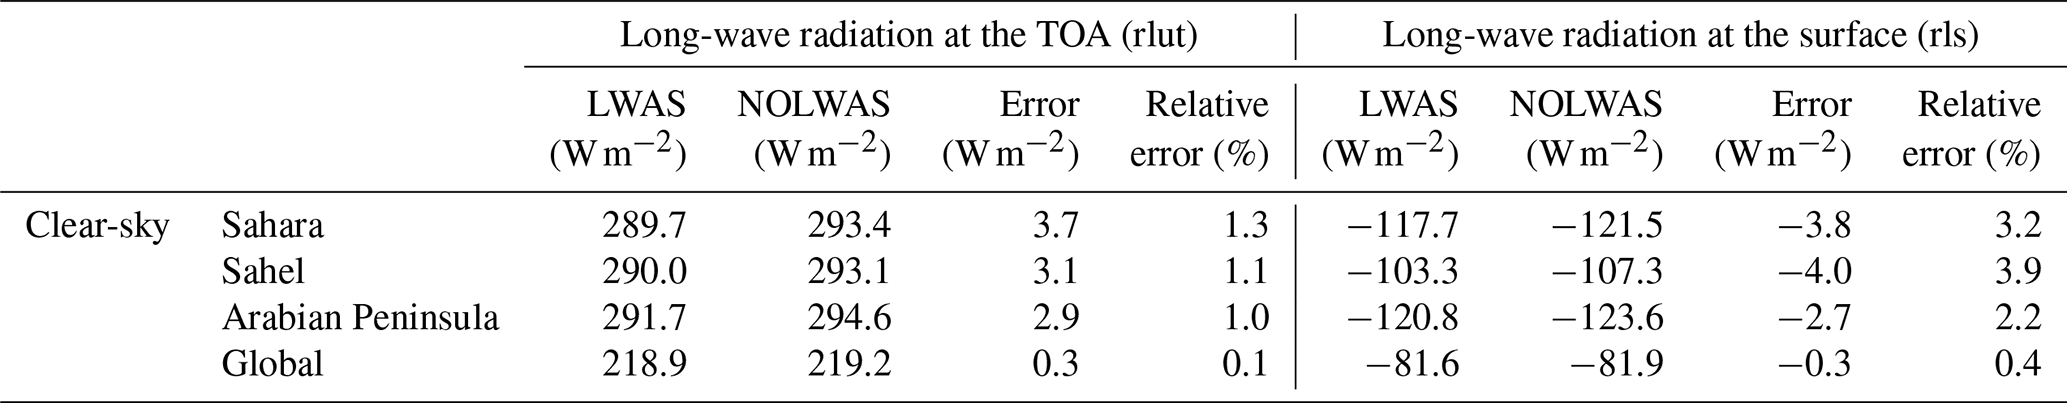
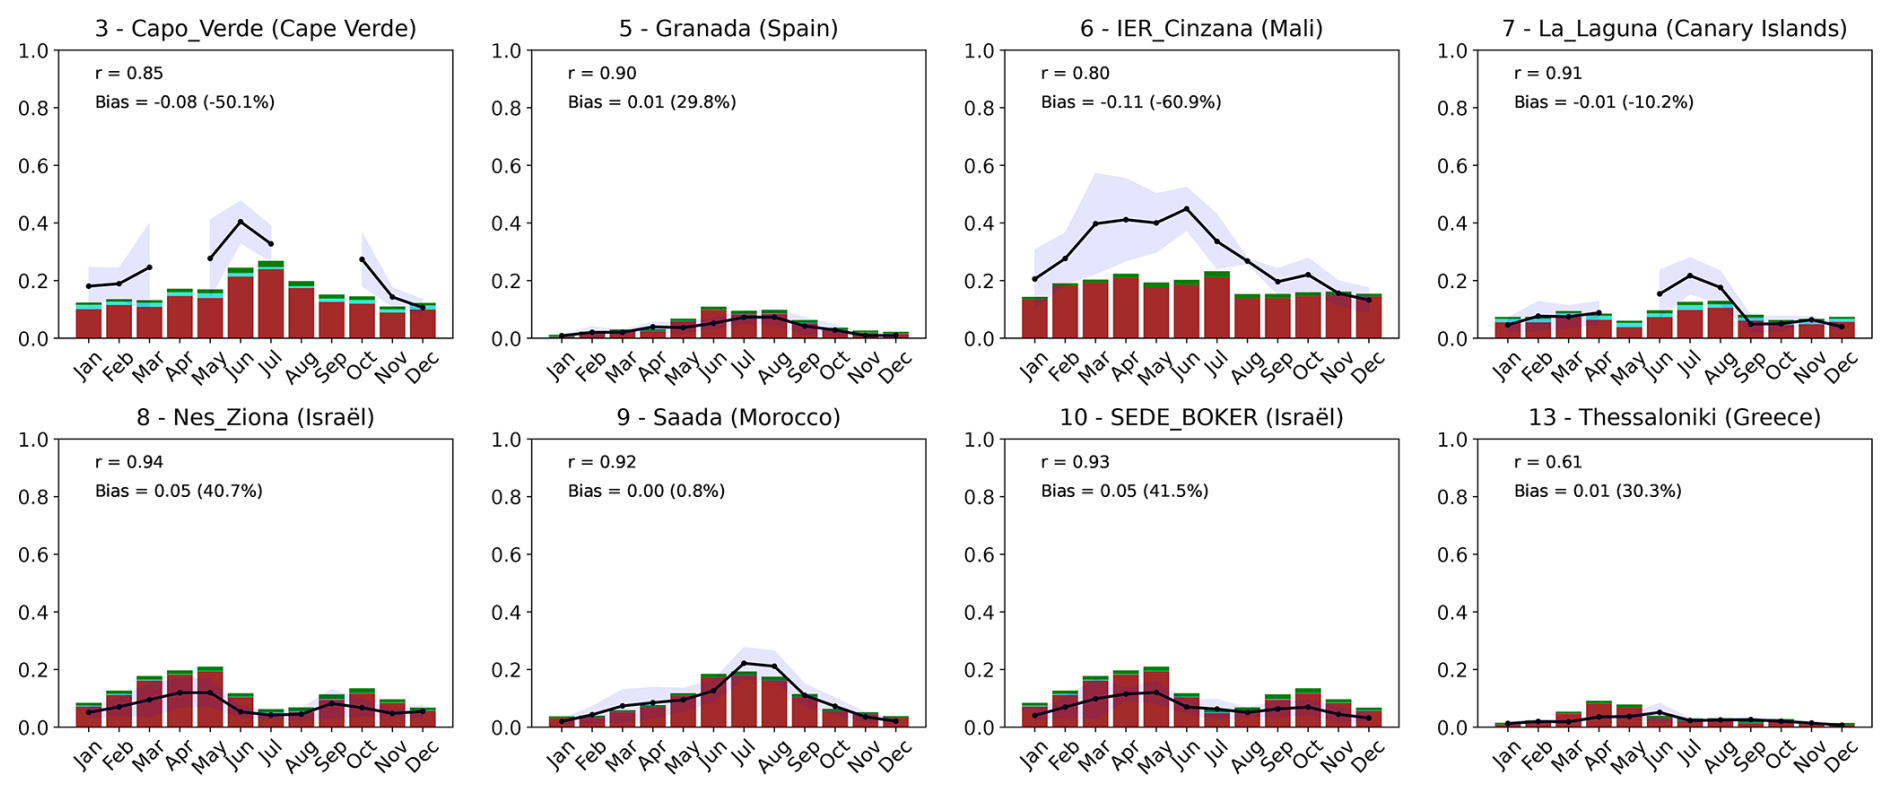
Figure A1Annual cycles of coarse AOD simulated by the ARPEGE-Climat model (desert dust in brown, sea salt in cyan, and nitrate in green) compared with AERONET measurements (black, with standard deviation in light blue). The locations of the stations are shown in Fig. 2 (see Table A1 for details on these AERONET stations).
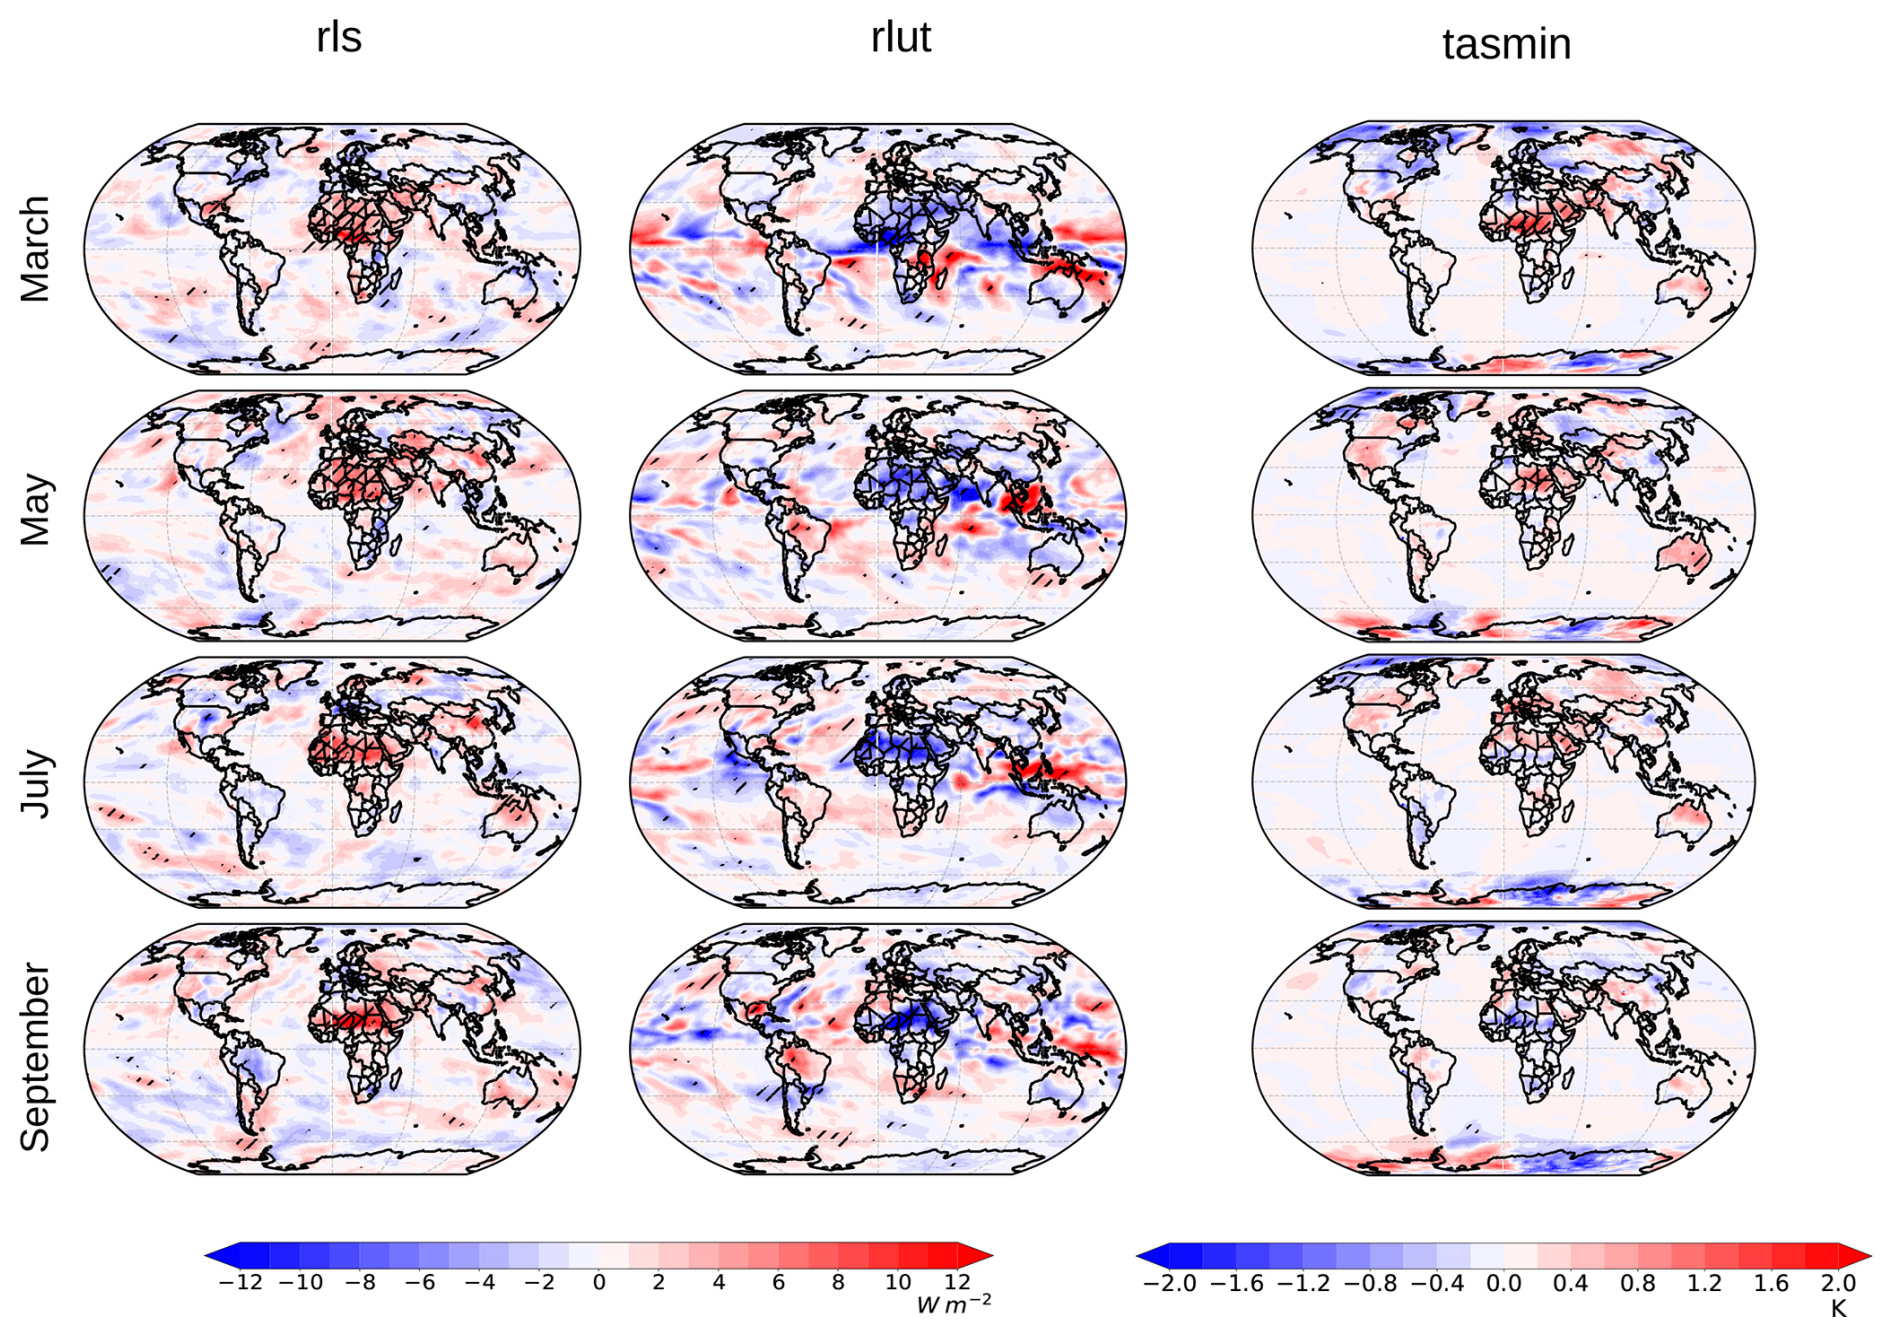
Figure A2Changes (1985–2014), at the global scale, between the LWAS and NOLWAS simulations (LWAS minus NOLWAS) in rls (net LW surface radiation, rls = rlds − rlus, W m−2), rlut (TOA outgoing LW radiation, W m−2), and tasmin (minimum surface temperature, K) for the months of March (first line), May (second line), July (third line), and September (fourth line). Hatching indicates regions with a significant effect at the 0.05 level (Student's t test).
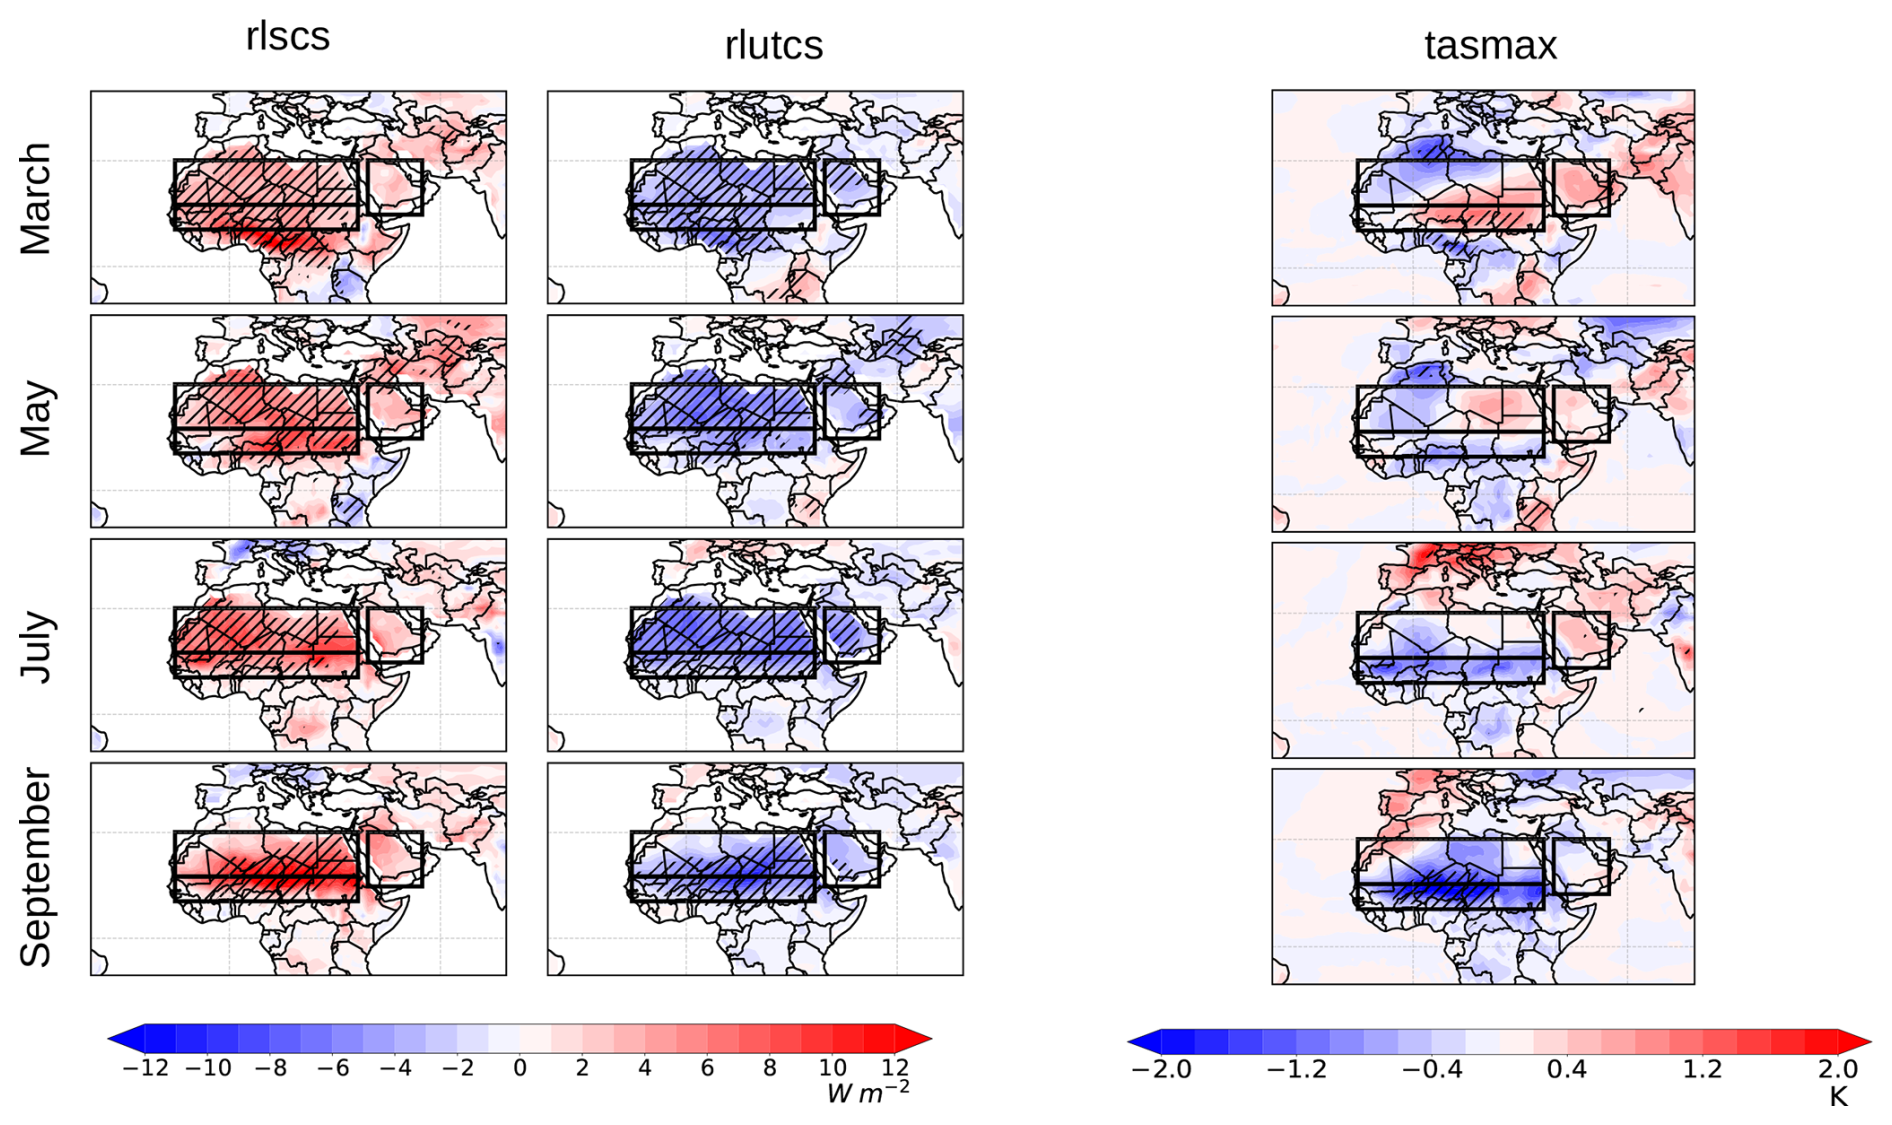
Figure A3Same as Fig. 4 for rlscs (net LW surface radiation under clear-sky conditions, W m−2), rlutcs (TOA outgoing LW radiation under clear-sky conditions, W m−2), and tasmax (maximum surface temperature, K) for the months of March (first line), May (second line), July (third line), and September (fourth line). Hatching indicates regions with a significant effect at the 0.05 level (Student's t test).
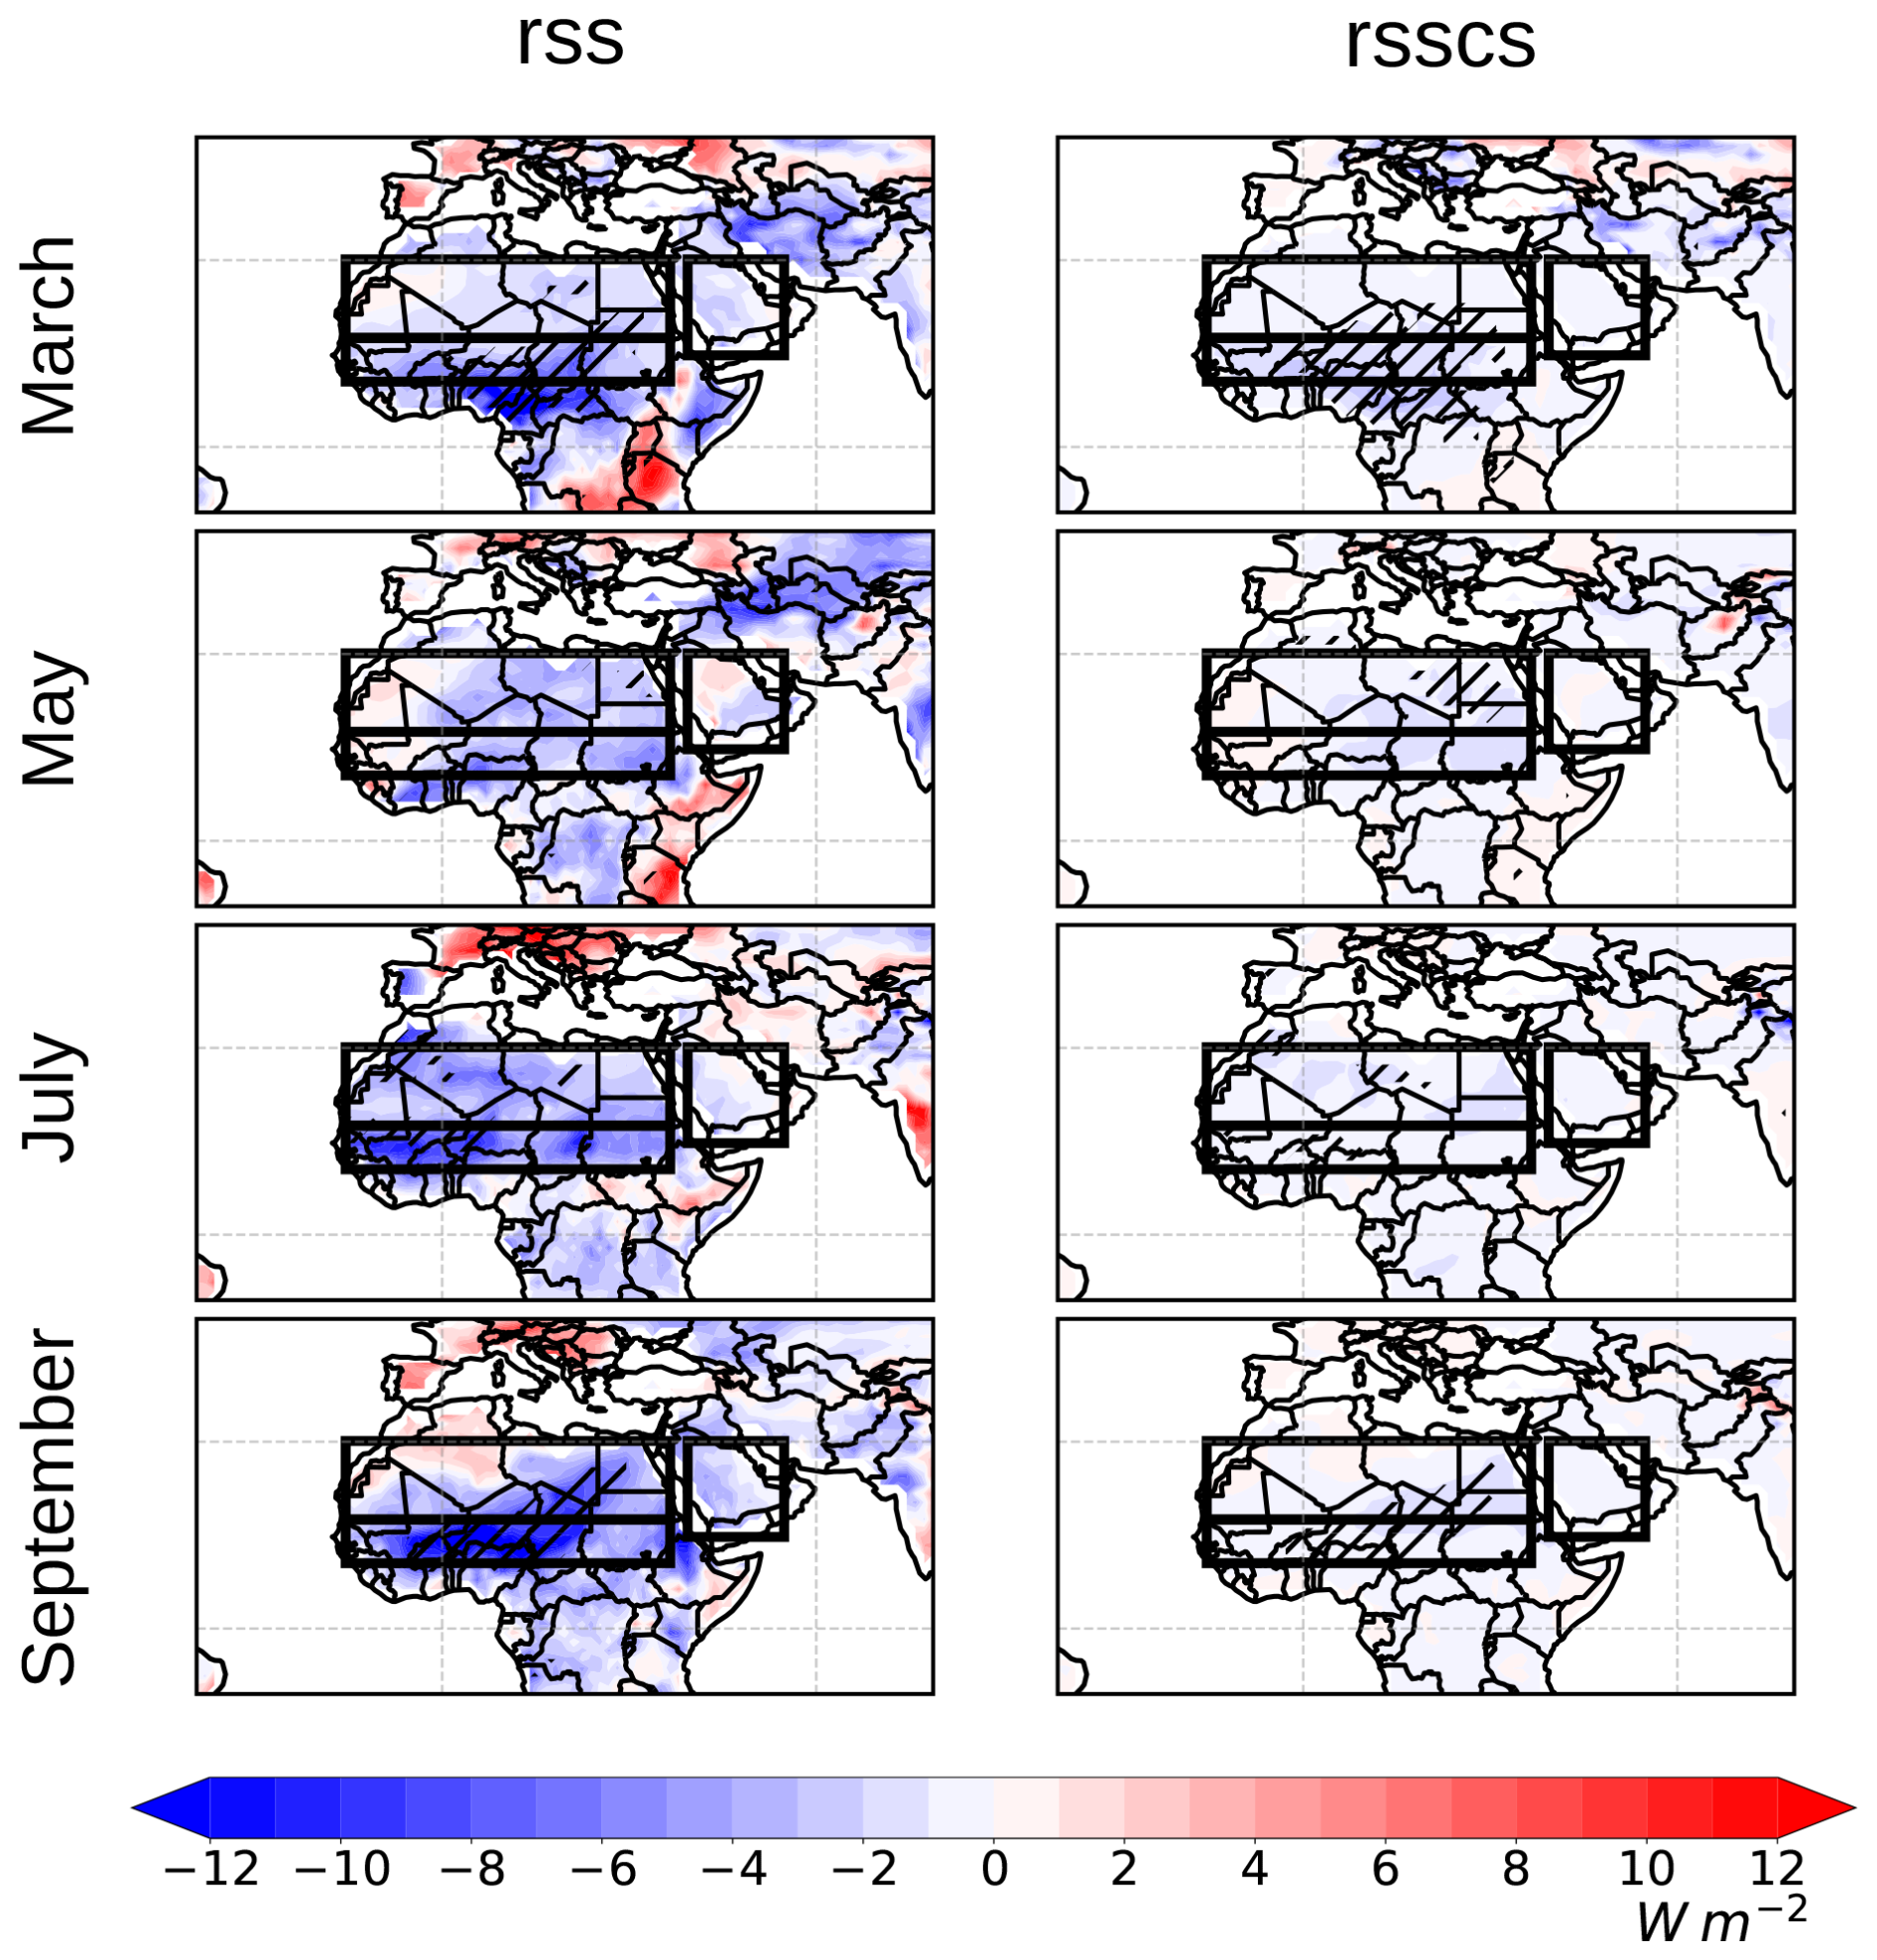
Figure A4Same as Fig. A3 but for rss (net SW surface radiation, rss = rsds − rsus, W m−2) and rsscs (net SW surface radiation under clear-sky conditions, W m−2).
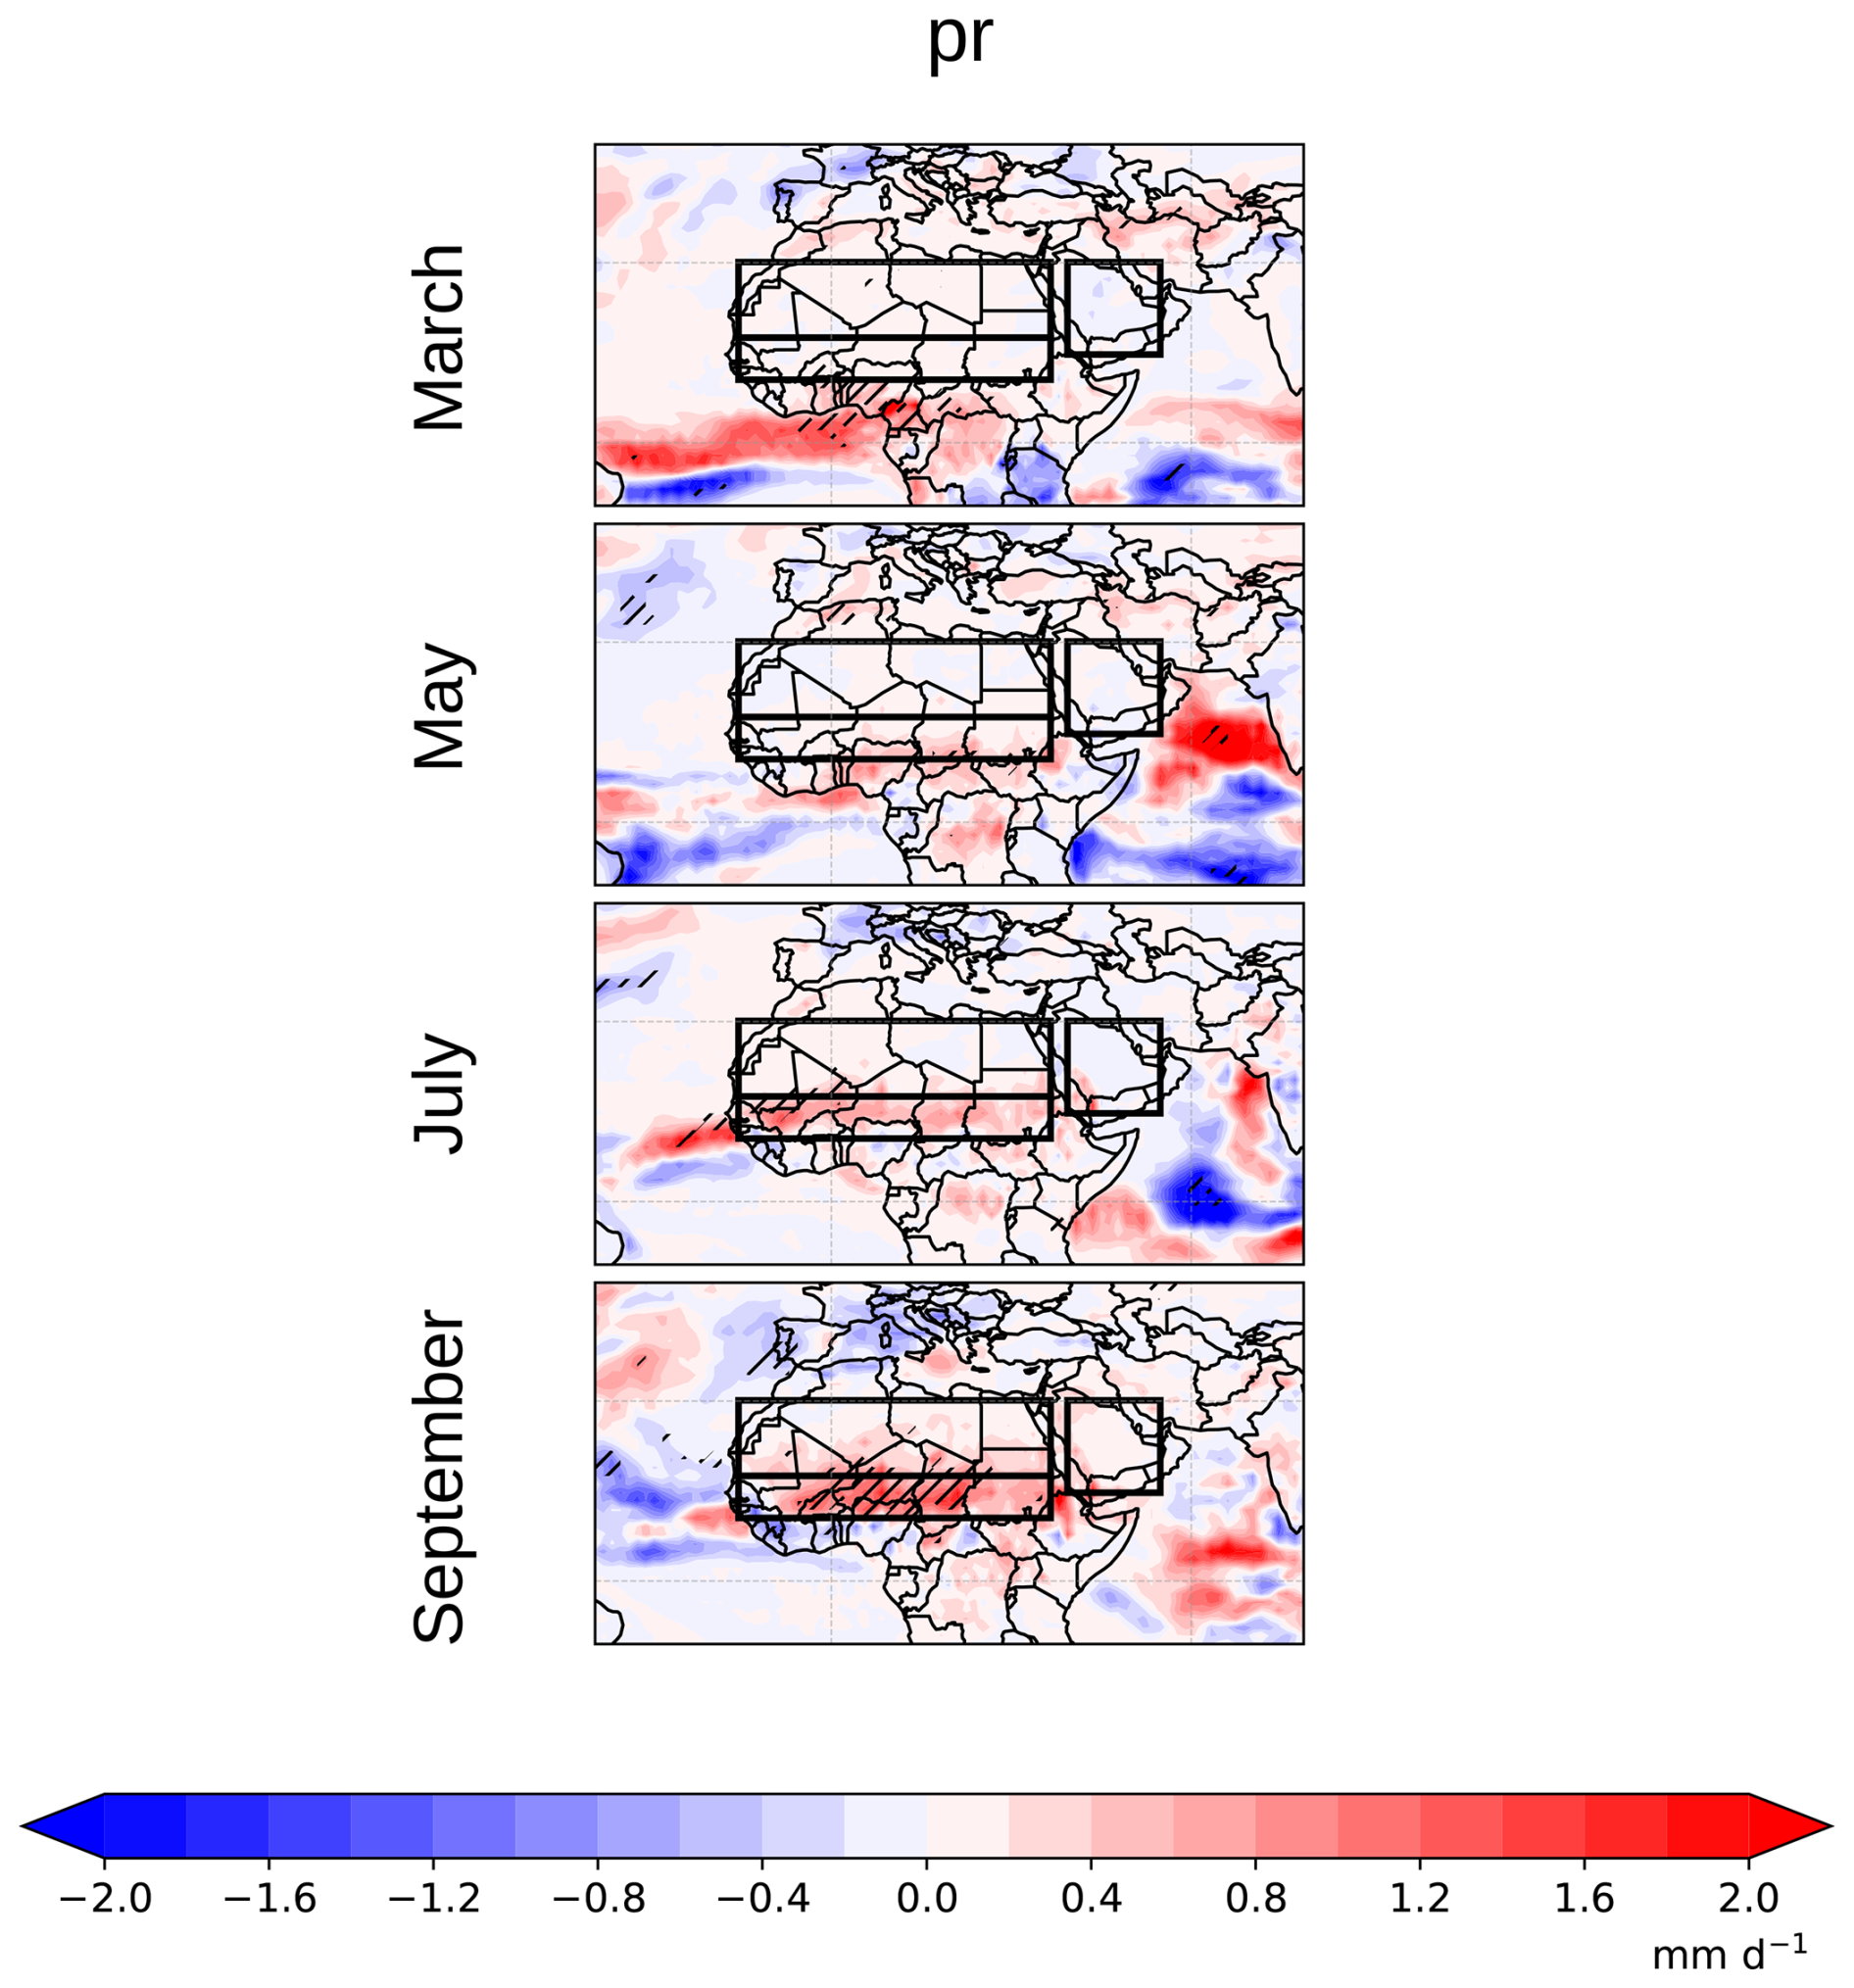
Figure A5Same as Fig. A3 but for pr (precipitation, mm d−1).
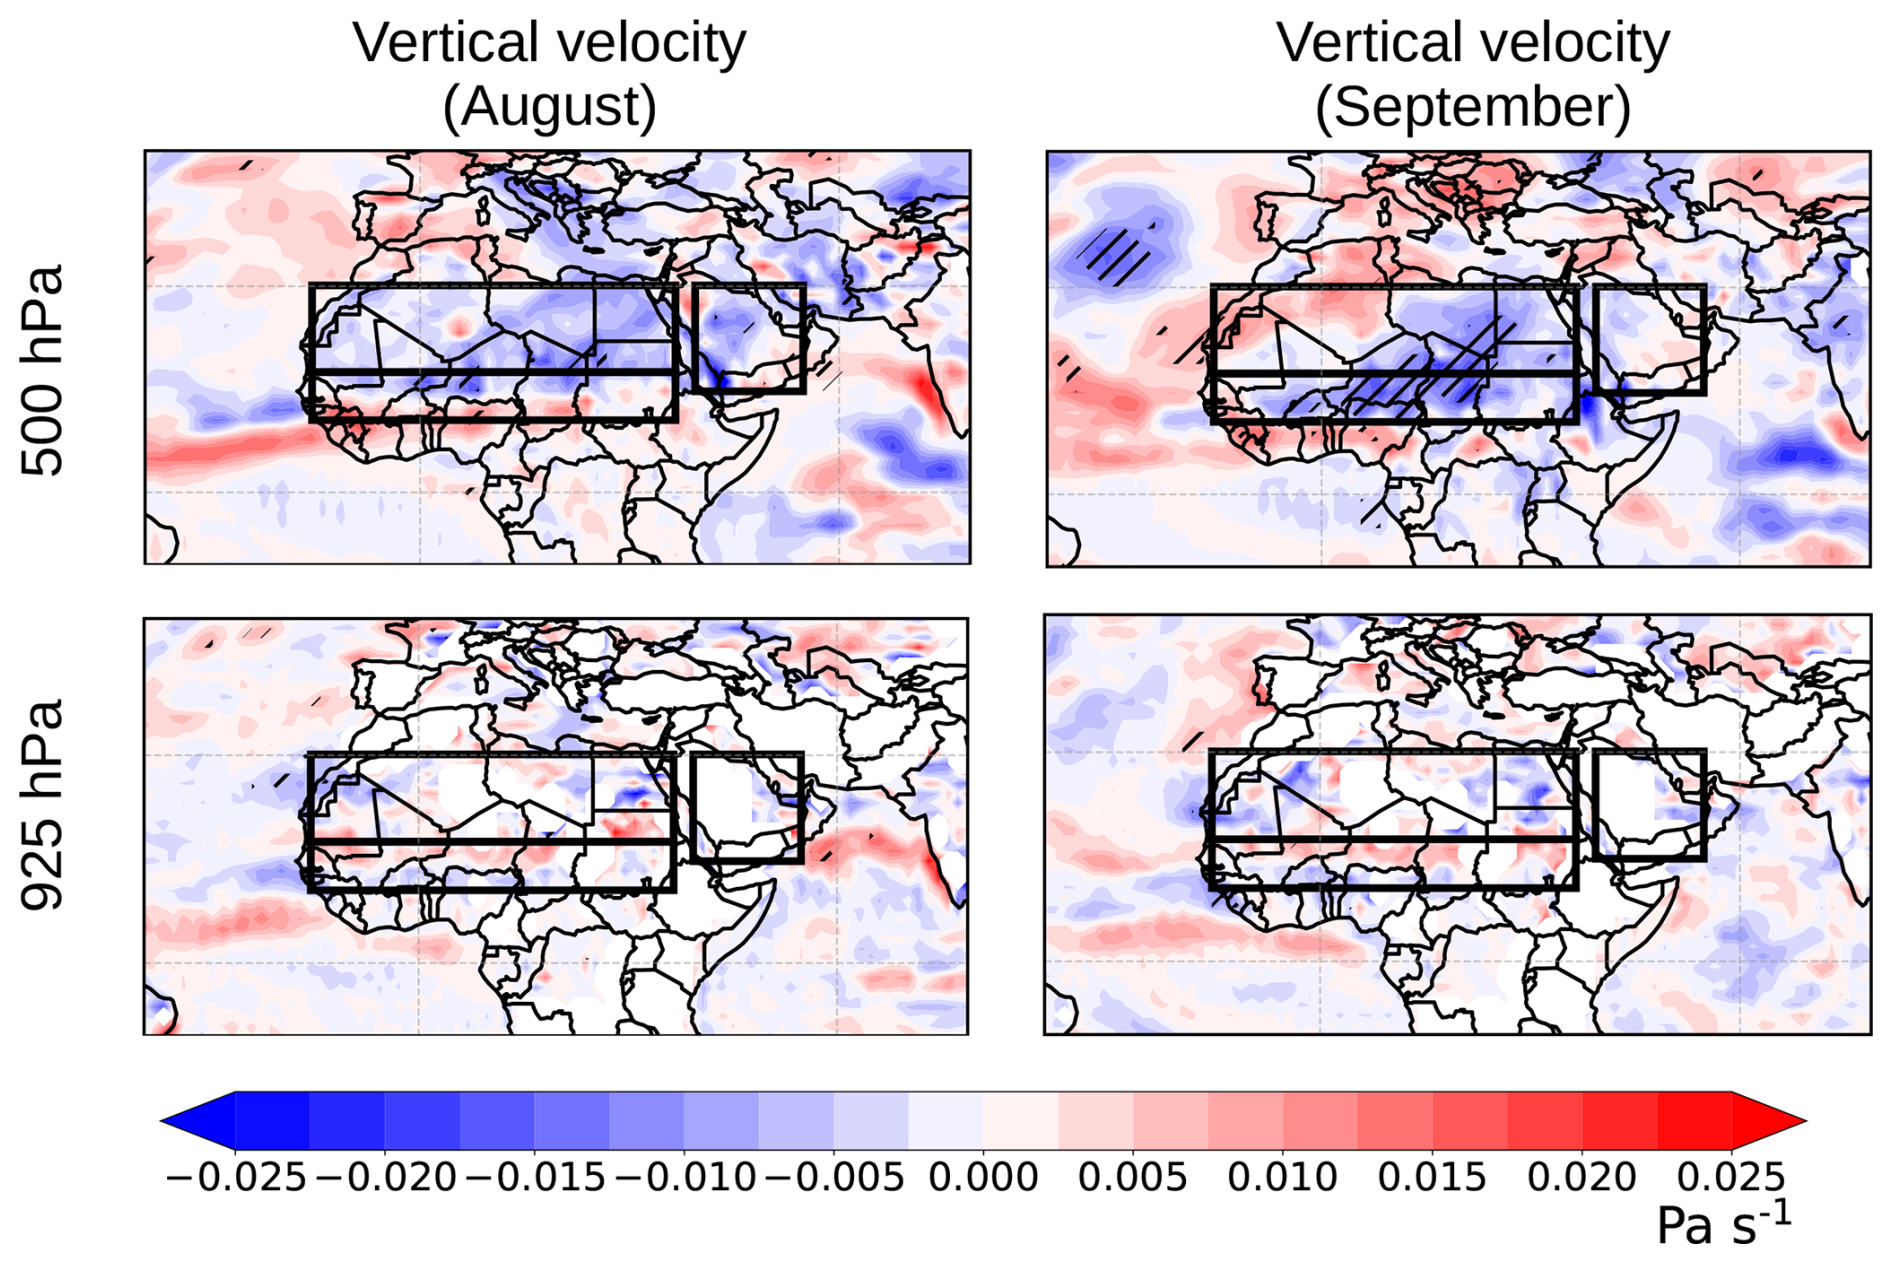
Figure A6Mean differences (1985–2014) between the LWAS and NOLWAS simulations (LWAS minus NOLWAS) in vertical velocity (500 and 925 hPa) for August and September.
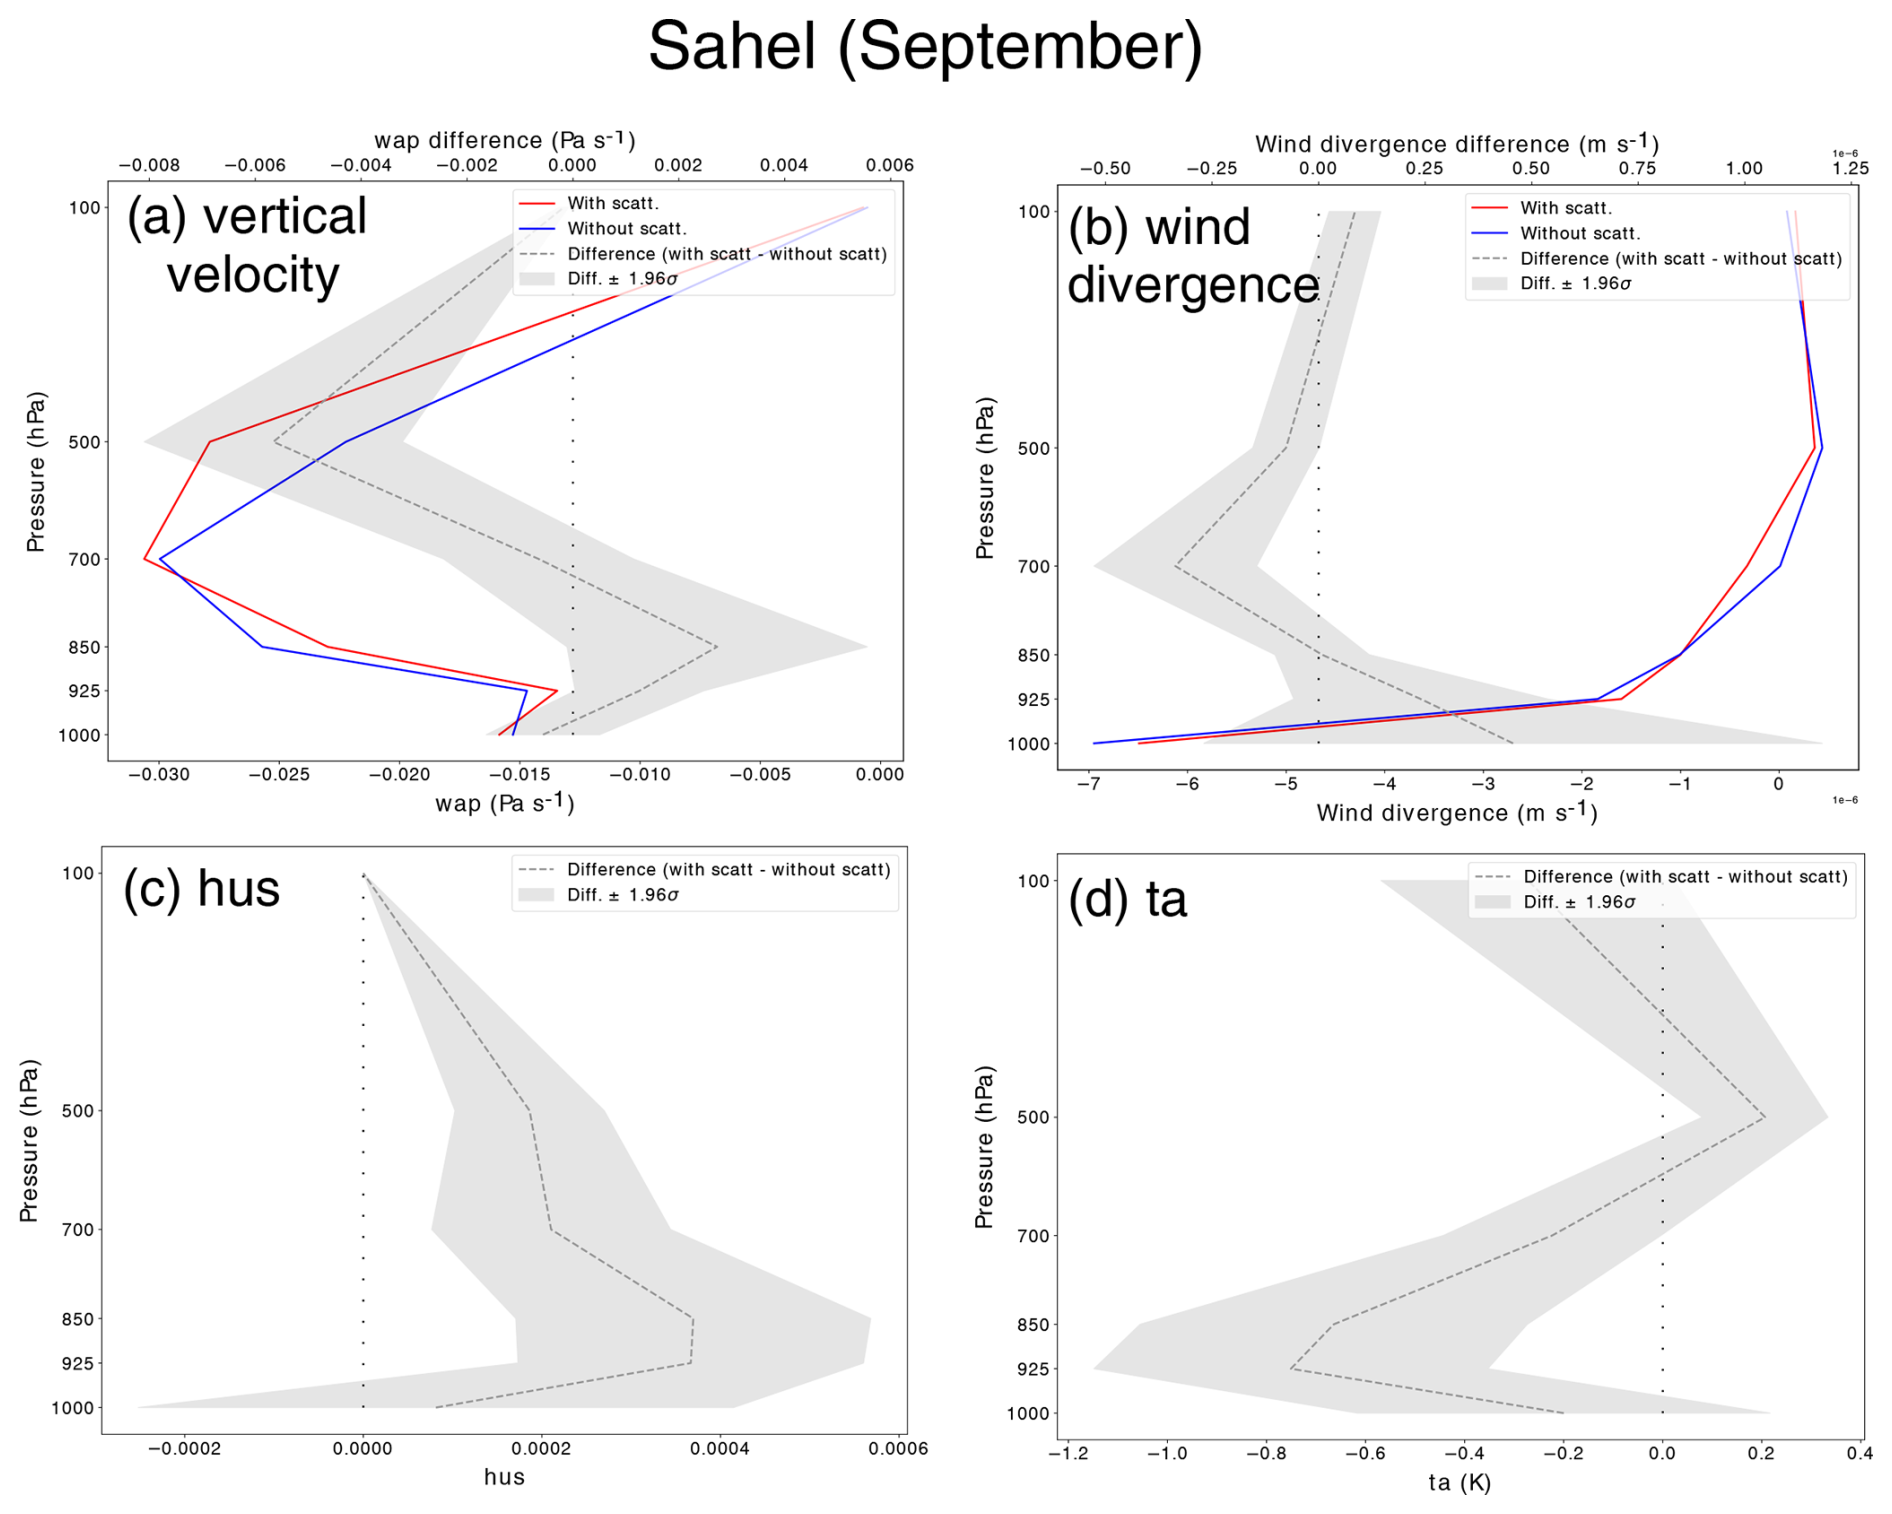
Figure A7Vertical profiles of vertical velocity (a), wind divergence (b), specific humidity (hus, c), and temperature (ta, d) over the Sahel in September for the LWAS (red) and NOLWAS (blue) simulations. The difference between these two simulations (LWAS minus NOLWAS) is shown (dashed grey line). Confidence intervals for no significant changes are indicated in light-grey colour (Student's t test, 0.05 level).
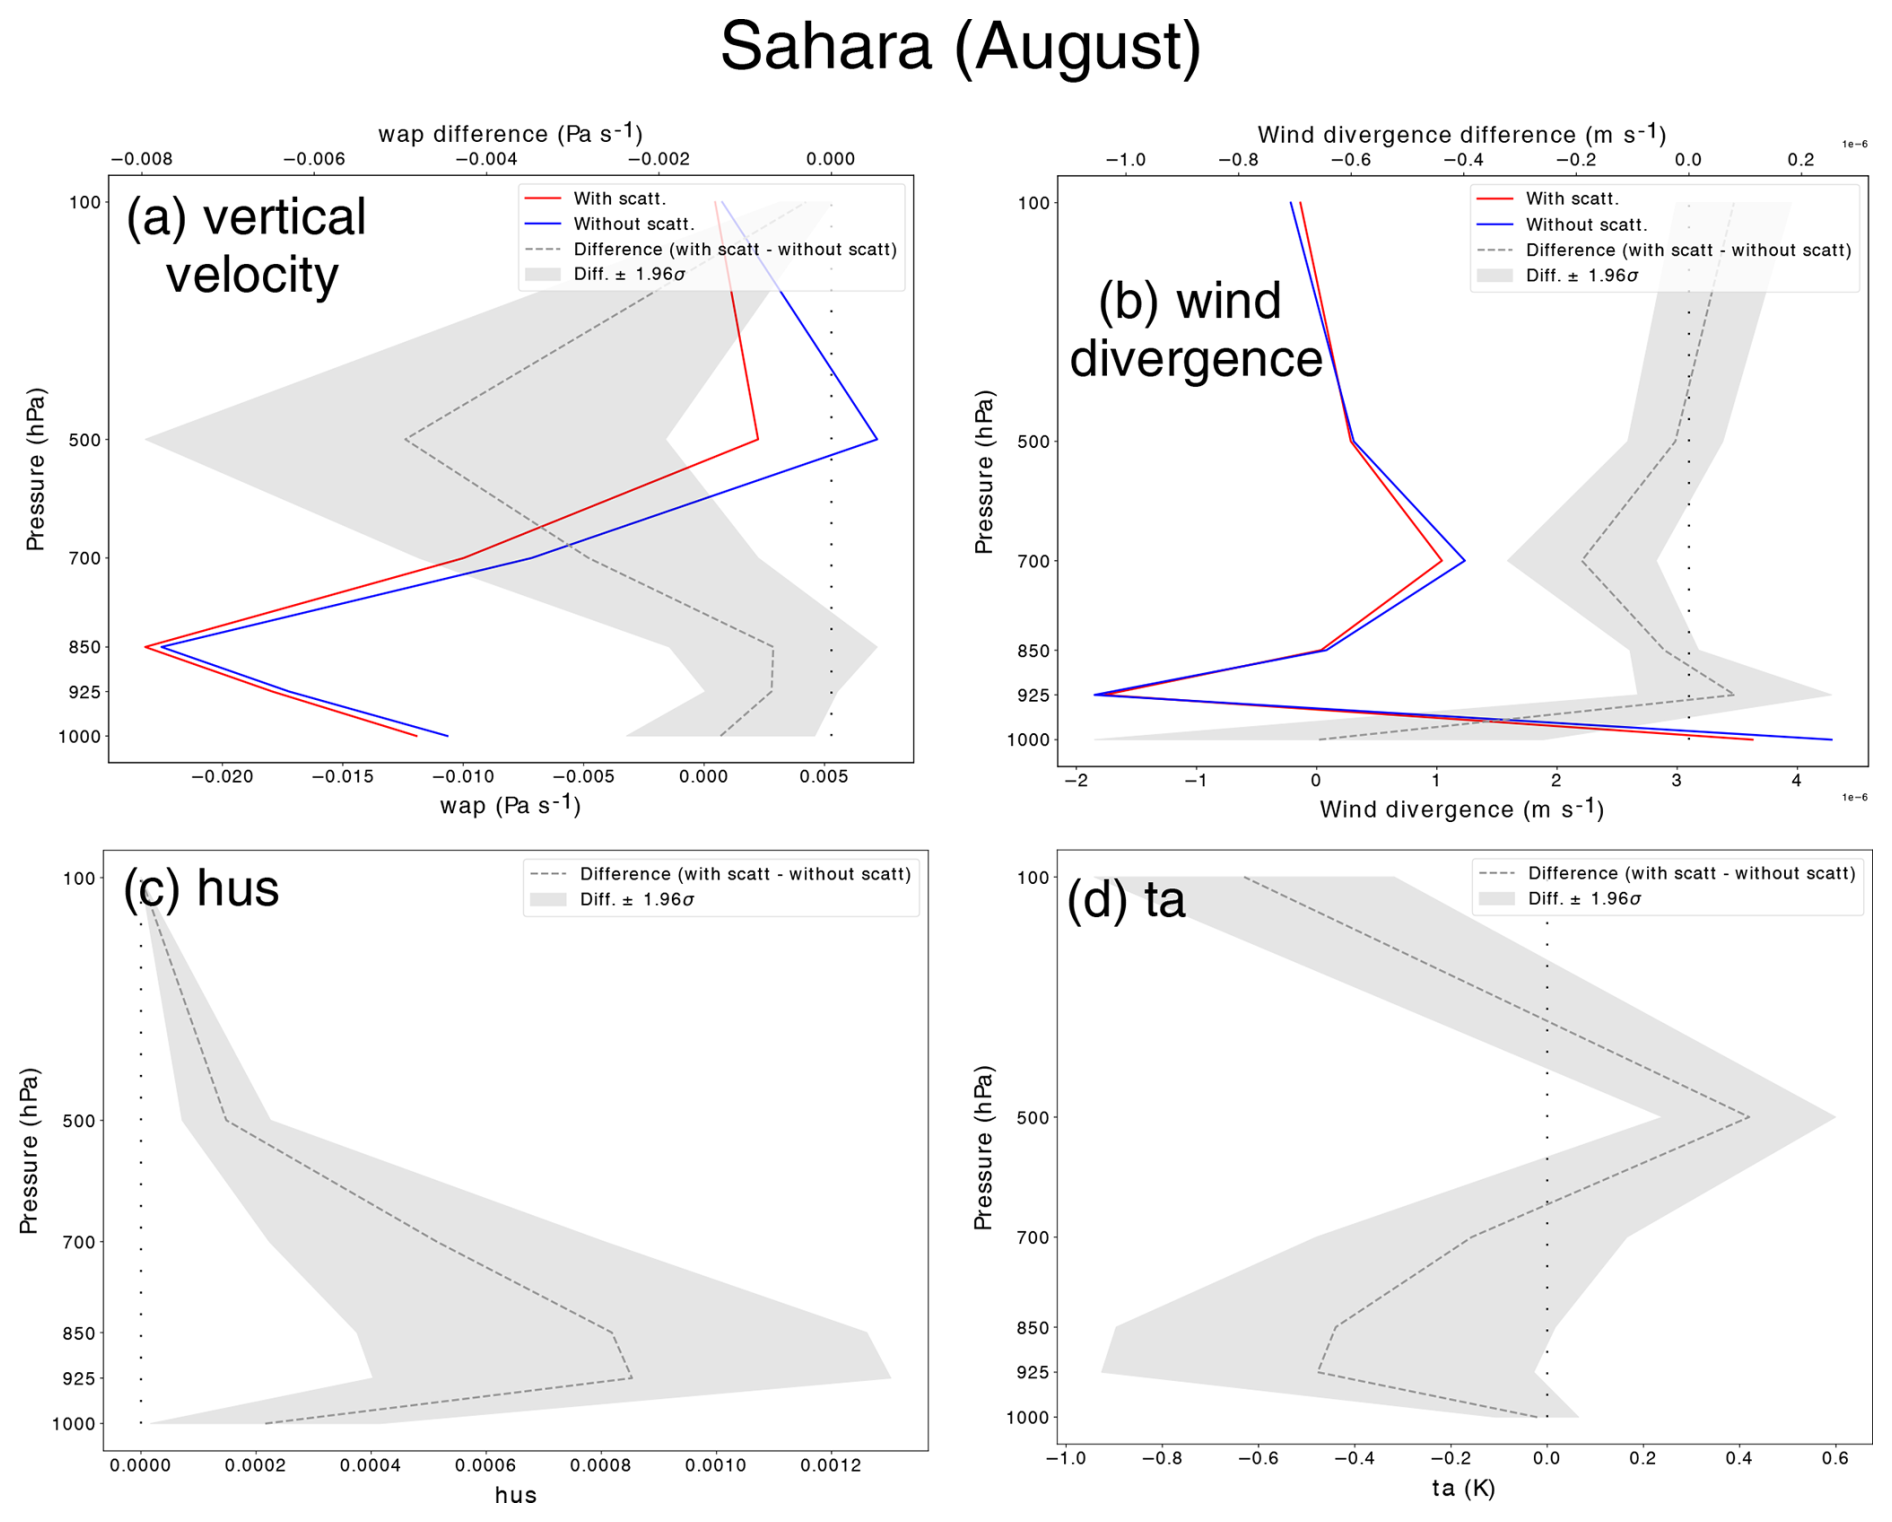
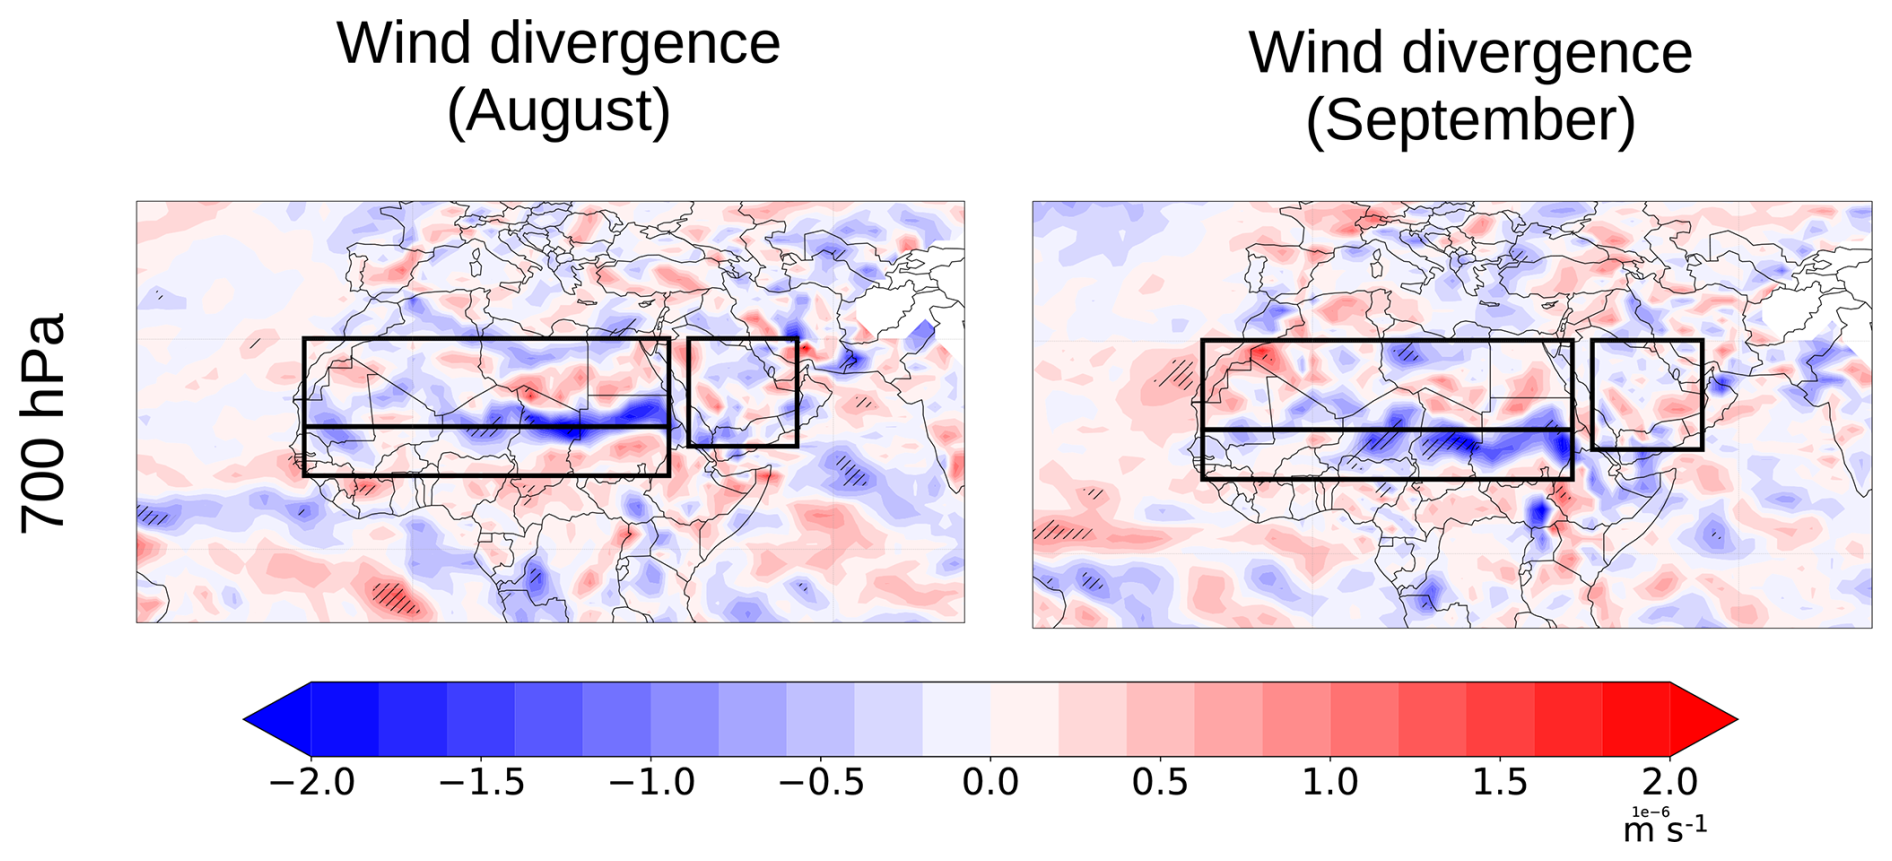
Figure A9Mean differences (1985–2014) between the LWAS and NOLWAS simulations (LWAS minus NOLWAS) in wind divergence (700 hPa) for August and September.
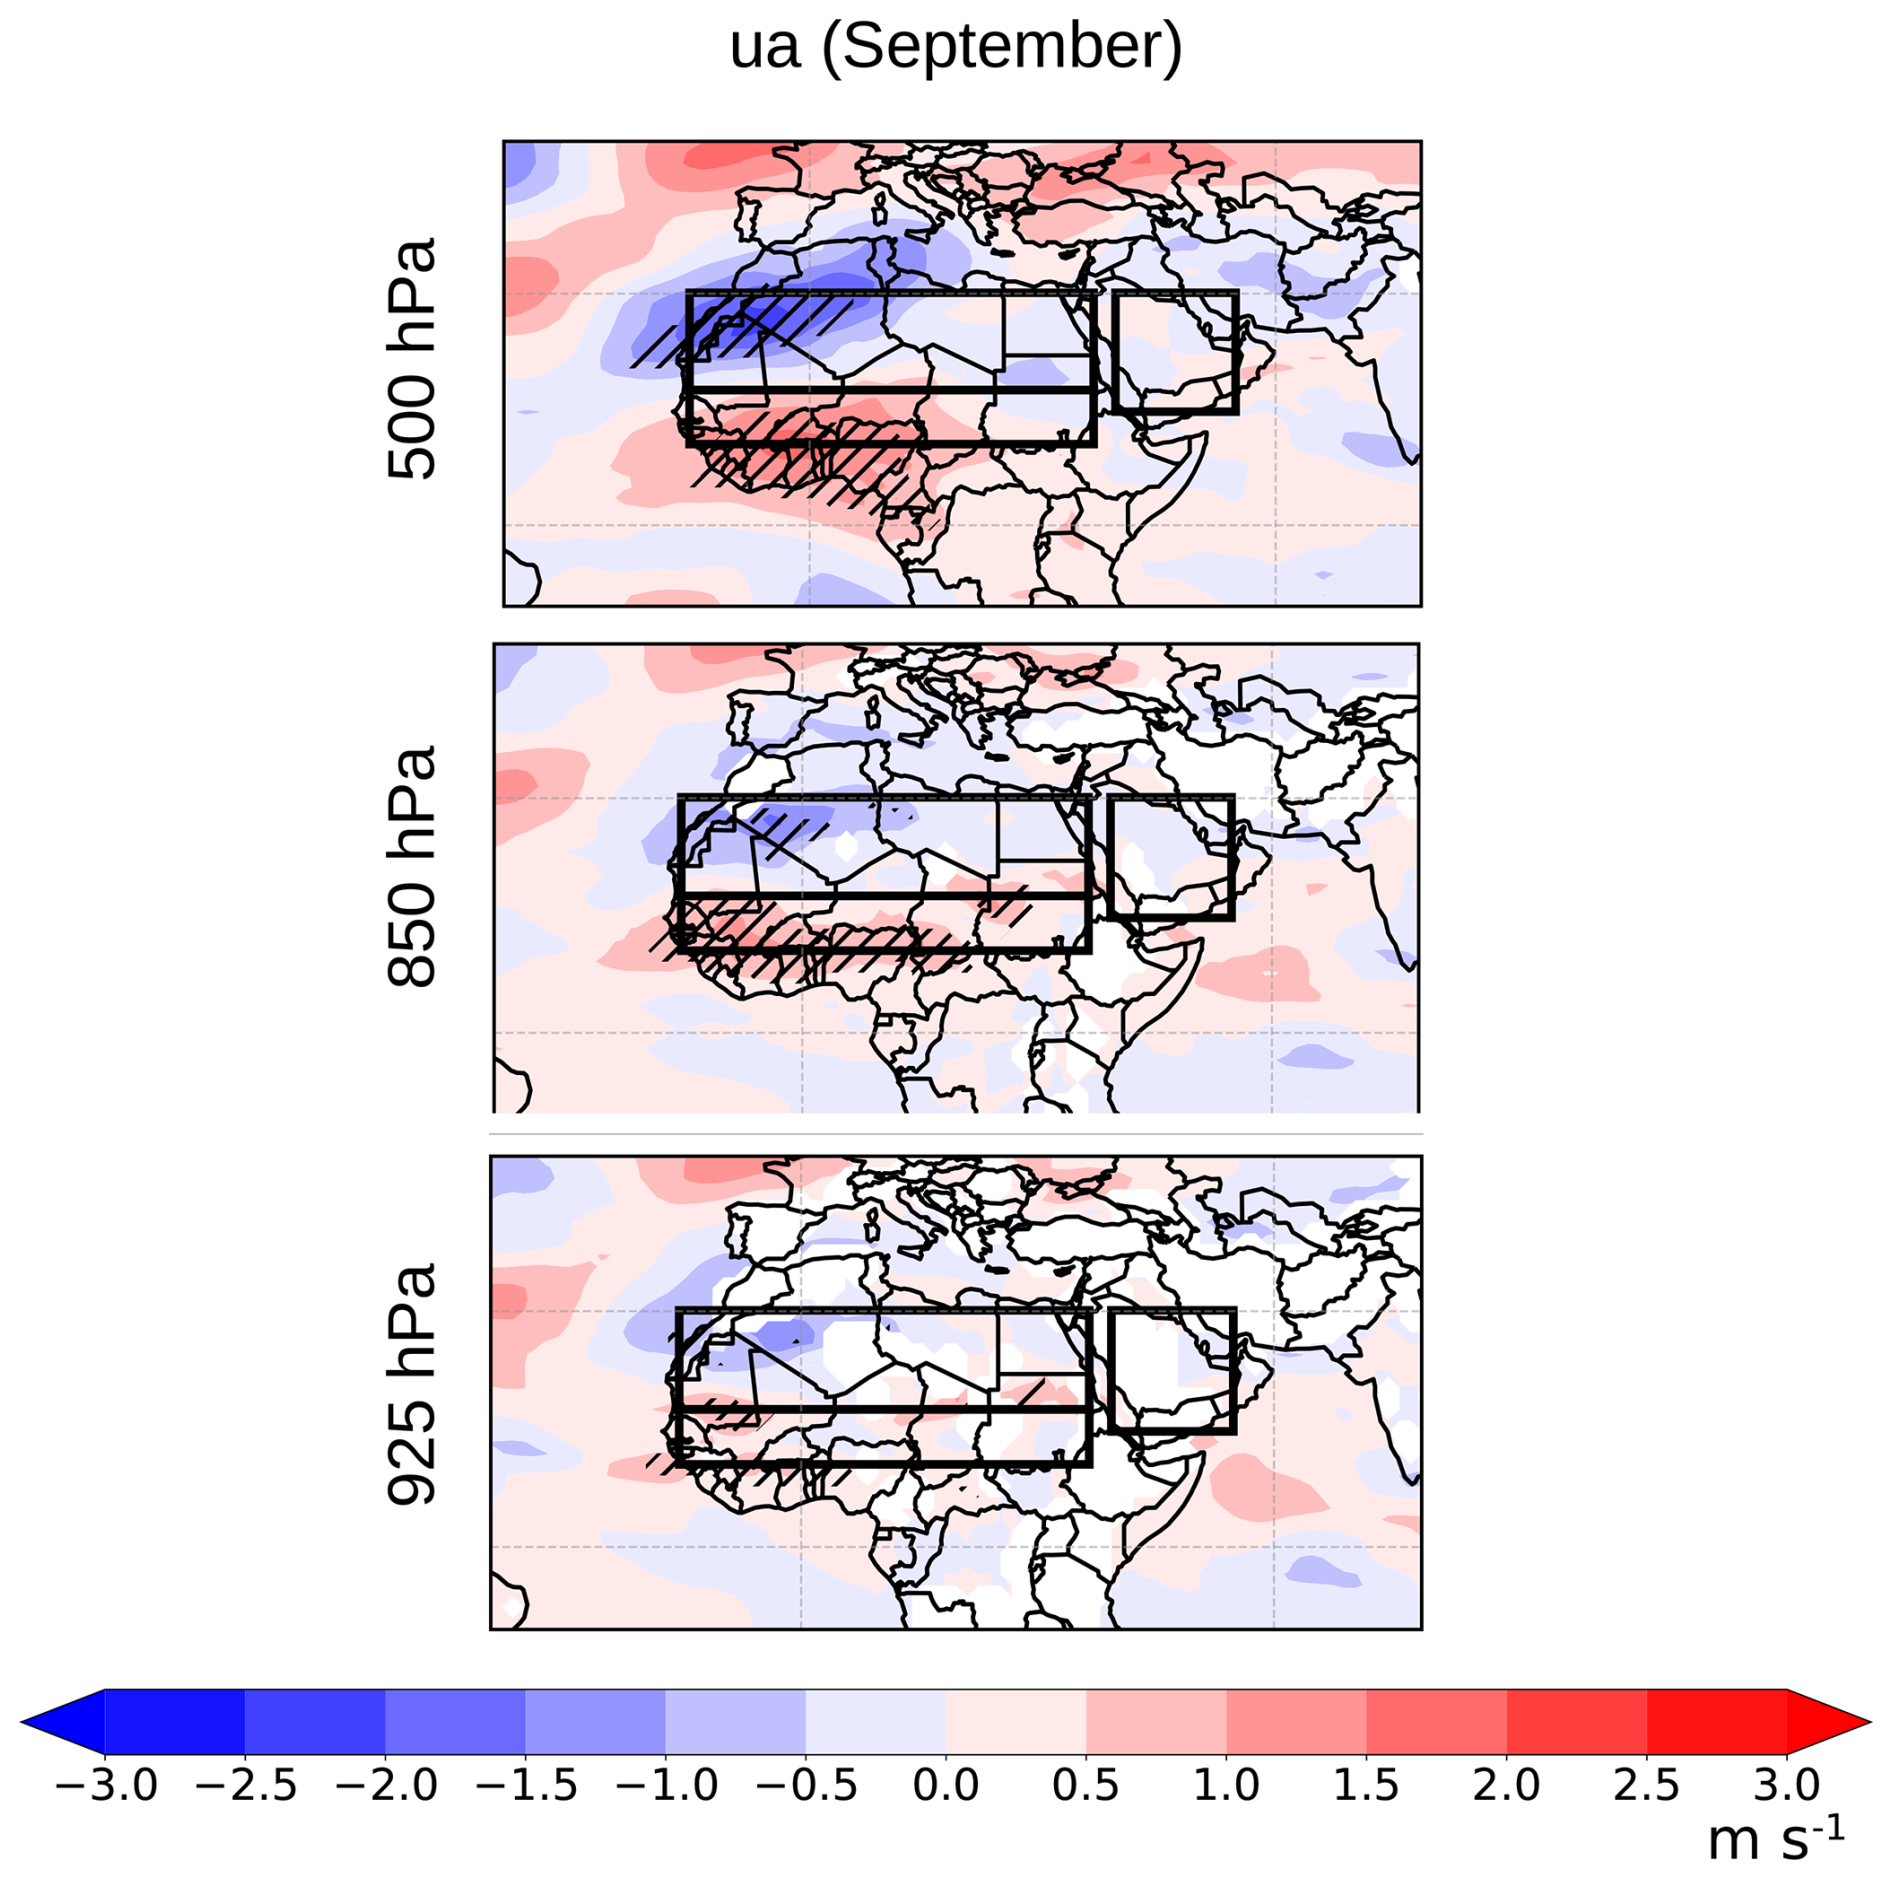
Figure A10Mean differences (1985–2014) between the LWAS and NOLWAS simulations (LWAS minus NOLWAS) in eastward wind (ua, 500, 850, and 925 hPa) for September.
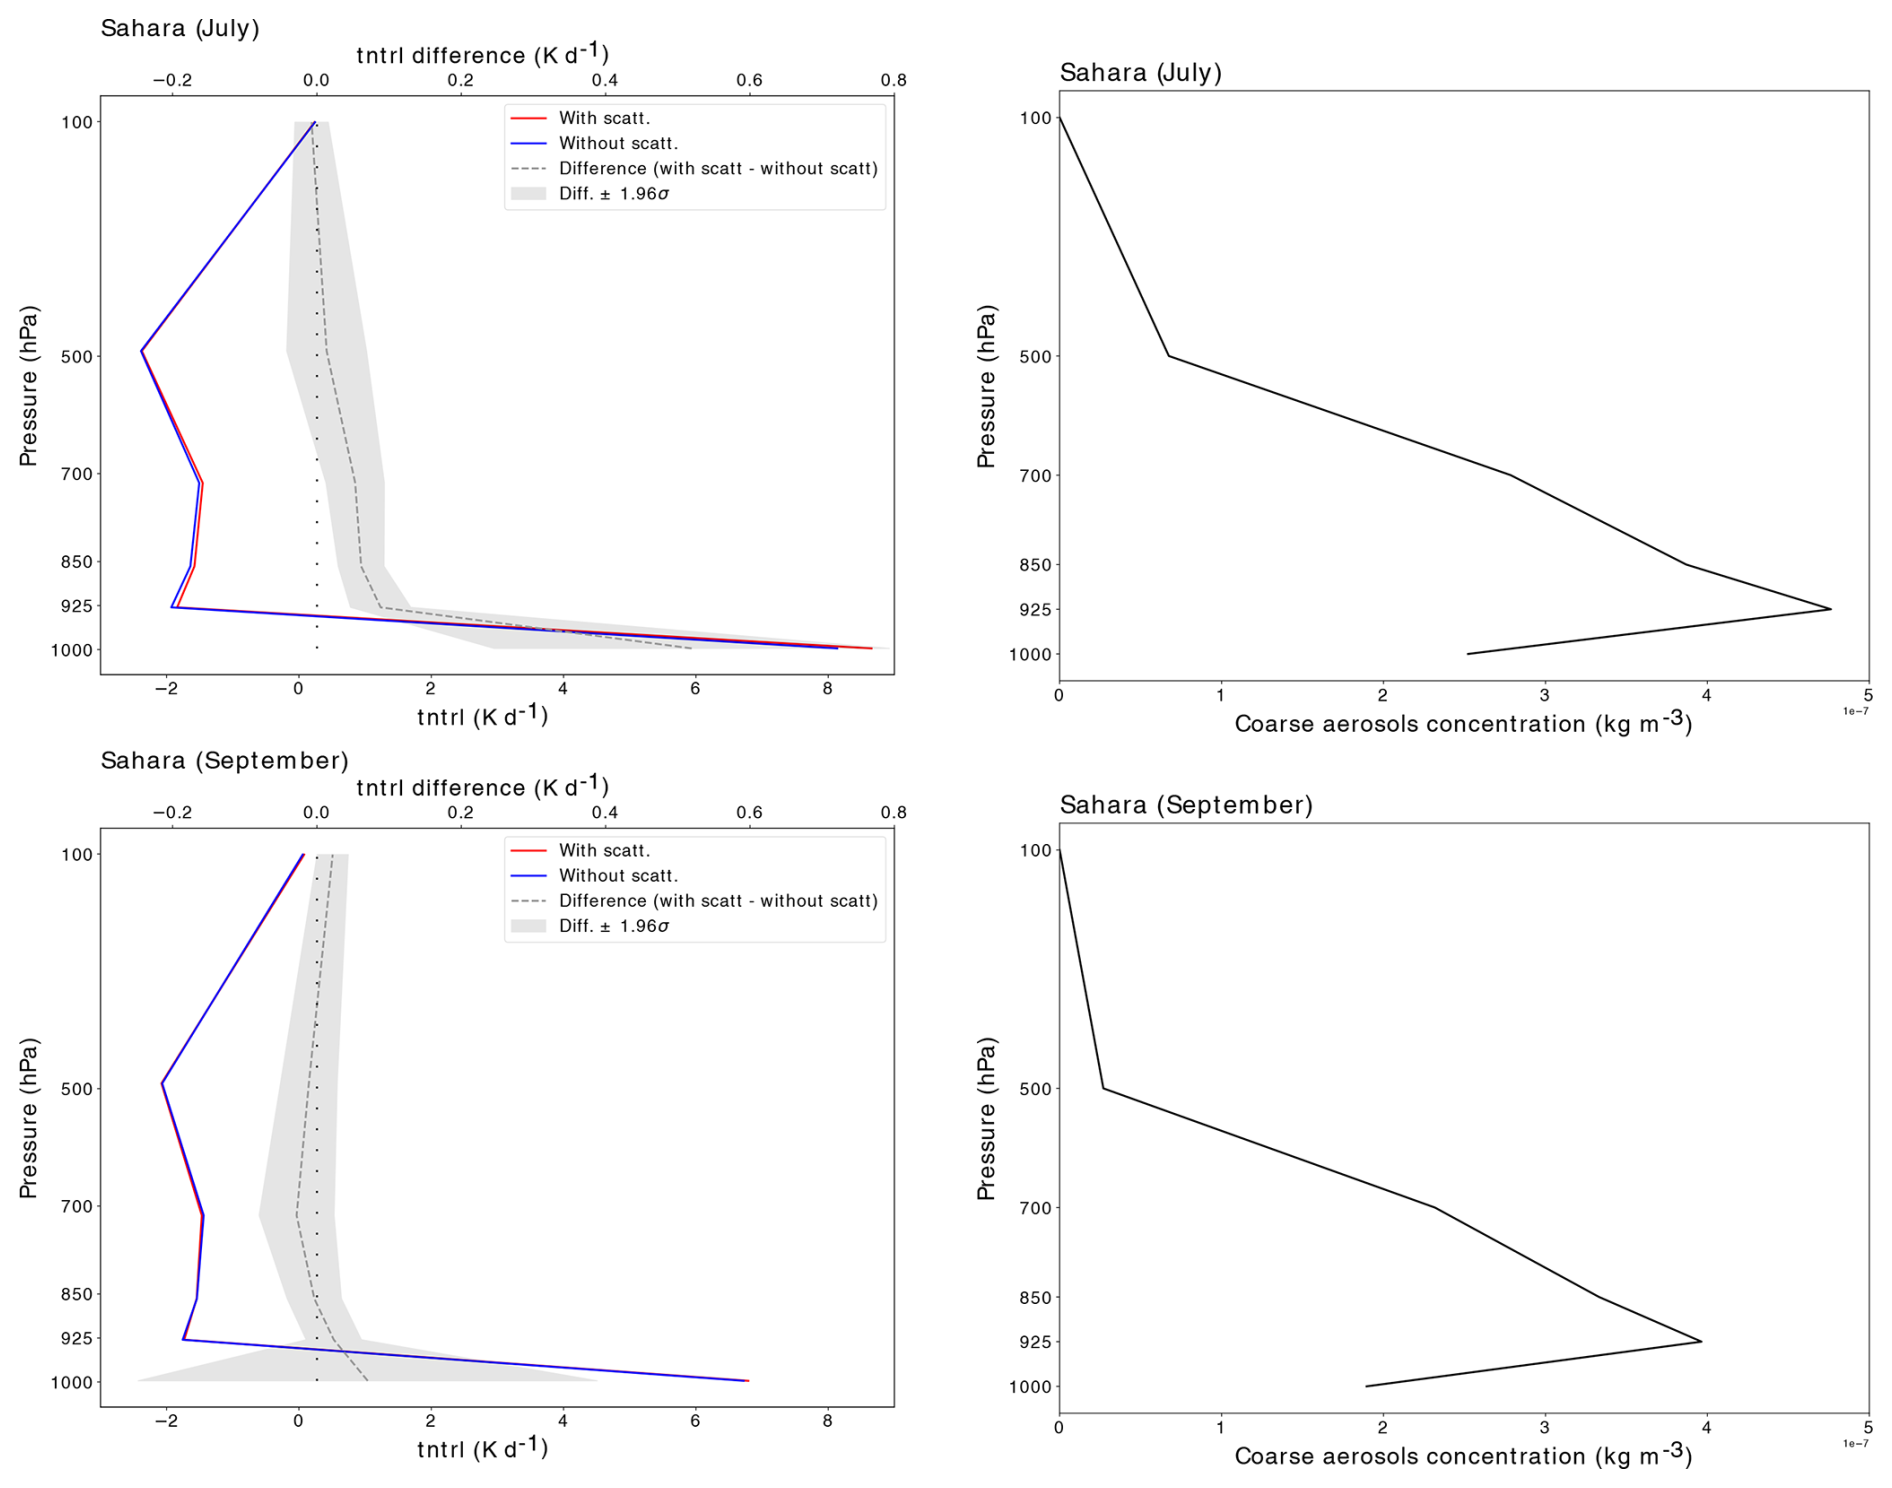
Figure A11LW heating-rate (tntrl) vertical profiles over the Sahara region in July and September for the LWAS (red) and NOLWAS (blue) simulations. The difference between these two simulations (LWAS minus NOLWAS) is shown in grey. Confidence intervals for no significant changes are indicated in light-grey colour (Student's t test, 0.05 level). Associated coarse-aerosol concentration vertical profiles are shown on the right.
This study relies entirely on publicly available data, which are available at https://doi.org/10.5281/zenodo.14186858 (Drugé et al., 2024). AERONET data are available at https://aeronet.gsfc.nasa.gov/ (last access: 30 October 2024).
All of the authors designed the experiment methodology, and TD carried out the experiment. TD wrote the paper with contributions from all of the co-authors.
The contact author has declared that none of the authors has any competing interests.
Publisher's note: Copernicus Publications remains neutral with regard to jurisdictional claims made in the text, published maps, institutional affiliations, or any other geographical representation in this paper. While Copernicus Publications makes every effort to include appropriate place names, the final responsibility lies with the authors.
We thank the principal investigators of the AERONET network and their staff for establishing and maintaining the different sites used in this investigation. We also acknowledge the support of the entire team in charge of the CNRM climate models and, in particular, Romain Roehrig and Yves Bouteloup for their contributions. Supercomputing time was provided by the Météo-France/DSI supercomputing centre.
This work has received funding from the European Union's Horizon 2020 research and innovation programme under grant agreement no. 101003536 (ESM2025 – Earth System Models for the Future), as well as from the European Union's Horizon innovation programme under grant agreement no. 101081193 (OptimESM – Optimal High Resolution Earth System Models for Exploring Future Climate Change). This study has also received funding from Agence Nationale de la Recherche – France 2030 as part of the PEPR TRACCS programme under grant no. ANR-22-EXTR-0009.
This paper was edited by Stephanie Fiedler and reviewed by three anonymous referees.
Ackerman, T. P. and Toon, O. B.: Absorption of visible radiation in atmosphere containing mixtures of absorbing and nonabsorbing particles, Appl. Optics, 20, 3661–3668, https://doi.org/10.1364/AO.20.003661, 1981. a
Bechtold, P., Köhler, M., Jung, T., Doblas-Reyes, F., Leutbecher, M., Rodwell, M. J., Vitart, F., and Balsamo, G.: Advances in simulating atmospheric variability with the ECMWF model: from synoptic to decadal time-scales, Q. J. Roy. Meteor. Soc., 134, 1337–1351, https://doi.org/10.1002/qj.289, 2008. a
Bechtold, P., Semane, N., Lopez, P., Chaboureau, J.-P., Beljaars, A., and Bormann, N.: Representing equilibrium and nonequilibrium convection in large-scale models, J. Atmos. Sci., 71, 734–753, https://doi.org/10.1175/JAS-D-13-0163.1, 2014. a
Becker, T., Bechtold, P., and Sandu, I.: Characteristics of convective precipitation over tropical Africa in storm-resolving global simulations, Q. J. Roy. Meteor. Soc., 147, 4388–4407, https://doi.org/10.1002/qj.4185, 2021. a
Bellouin, N., Boucher, O., Vesperini, M., and Tanré, D.: Estimating the direct aerosol radiative perturbation: impact of ocean surface representation and aerosol non-sphericity, Q. J. Roy. Meteor. Soc., 130, 2217–2232, https://doi.org/10.1256/qj.03.136, 2004. a
Carlson, T. N. and Benjamin, S. G.: Radiative heating rates for Saharan dust, J. Atmos. Sci., 37, 193–213, https://doi.org/10.1175/1520-0469(1980)037%3C0193:RHRFSD%3E2.0.CO;2, 1980. a
Colarco, P. R., Nowottnick, E. P., Randles, C. A., Yi, B., Yang, P., Kim, K.-M., Smith, J. A., and Bardeen, C. G.: Impact of radiatively interactive dust aerosols in the NASA GEOS-5 climate model: sensitivity to dust particle shape and refractive index, J. Geophys. Res.-Atmos., 119, 753–786, https://doi.org/10.1002/2013JD020046, 2014. a
Di Biagio, C., Formenti, P., Styler, S., Pangui, E., and Doussin, J.-F.: Laboratory chamber measurements of the longwave extinction spectra and complex refractive indices of African and Asian mineral dusts, Geophys. Res. Lett., 41, 6289–6297, https://doi.org/10.1002/2014GL060213, 2014. a
Di Biagio, C., Formenti, P., Balkanski, Y., Caponi, L., Cazaunau, M., Pangui, E., Journet, E., Nowak, S., Caquineau, S., Andreae, M. O., Kandler, K., Saeed, T., Piketh, S., Seibert, D., Williams, E., and Doussin, J.-F.: Global scale variability of the mineral dust long-wave refractive index: a new dataset of in situ measurements for climate modeling and remote sensing, Atmos. Chem. Phys., 17, 1901–1929, https://doi.org/10.5194/acp-17-1901-2017, 2017. a, b, c, d, e, f, g
Di Biagio, C., Formenti, P., Balkanski, Y., Caponi, L., Cazaunau, M., Pangui, E., Journet, E., Nowak, S., Andreae, M. O., Kandler, K., Saeed, T., Piketh, S., Seibert, D., Williams, E., and Doussin, J.-F.: Complex refractive indices and single-scattering albedo of global dust aerosols in the shortwave spectrum and relationship to size and iron content, Atmos. Chem. Phys., 19, 15503–15531, https://doi.org/10.5194/acp-19-15503-2019, 2019. a, b
Di Biagio, C., Balkanski, Y., Albani, S., Boucher, O., and Formenti, P.: Direct radiative effect by mineral dust aerosols constrained by new microphysical and spectral optical data, Geophys. Res. Lett., 47, e2019GL086186, https://doi.org/10.1029/2019GL086186, 2020. a, b, c, d, e, f, g, h, i, j, k, l, m
Di Sarra, A., Di Biagio, C., Meloni, D., Monteleone, F., Pace, G., Pugnaghi, S., and Sferlazzo, D.: Shortwave and longwave radiative effects of the intense Saharan dust event of 25–26 March 2010 at Lampedusa (Mediterranean Sea), J. Geophys. Res.-Atmos., 116, D23209, https://doi.org/10.1029/2011JD016238, 2011. a
Dobbie, S., Li, J., Harvey, R., and Chỳlek, P.: Sea-salt optical properties and GCM forcing at solar wavelengths, Atmos. Res., 65, 211–233, https://doi.org/10.1016/S0169-8095(02)00150-3, 2003. a
Drugé, T., Nabat, P., Mallet, M., and Somot, S.: Model simulation of ammonium and nitrate aerosols distribution in the Euro-Mediterranean region and their radiative and climatic effects over 1979–2016, Atmos. Chem. Phys., 19, 3707–3731, https://doi.org/10.5194/acp-19-3707-2019, 2019. a, b
Drugé, T., Nabat, P., Mallet, M., Michou, M., Rémy, S., and Dubovik, O.: Modeling radiative and climatic effects of brown carbon aerosols with the ARPEGE-Climat global climate model, Atmos. Chem. Phys., 22, 12167–12205, https://doi.org/10.5194/acp-22-12167-2022, 2022. a, b
Drugé, T., Nabat, P., Michou, M., and Mallet, M.: Radiative and climatic impacts of coarse aerosols scattering in the long-wave spectrum, Zenodo [code], https://doi.org/10.5281/zenodo.14186858, 2024. a
Dufresne, J.-L., Gautier, C., Ricchiazzi, P., and Fouquart, Y.: Longwave scattering effects of mineral aerosols, J. Atmos. Sci., 59, 1959–1966, https://doi.org/10.1175/1520-0469(2002)059<1959:LSEOMA>2.0.CO;2, 2002. a, b, c, d, e, f, g, h, i, j, k, l, m
Eck, T. F., Holben, B., Reid, J., Dubovik, O., Smirnov, A., O'neill, N., Slutsker, I., and Kinne, S.: Wavelength dependence of the optical depth of biomass burning, urban, and desert dust aerosols, J. Geophys. Res.-Atmos., 104, 31333–31349, https://doi.org/10.1029/1999JD900923, 1999. a
Eyring, V., Bony, S., Meehl, G. A., Senior, C. A., Stevens, B., Stouffer, R. J., and Taylor, K. E.: Overview of the Coupled Model Intercomparison Project Phase 6 (CMIP6) experimental design and organization, Geosci. Model Dev., 9, 1937–1958, https://doi.org/10.5194/gmd-9-1937-2016, 2016. a
Fountoulakis, I., Tsekeri, A., Kazadzis, S., Amiridis, V., Nersesian, A., Tsichla, M., Proestakis, E., Gkikas, A., Papachristopoulou, K., Barlakas, V., Emde, C., and Mayer, B.: A sensitivity study on radiative effects due to the parameterization of dust optical properties in models, Atmos. Chem. Phys., 24, 4915–4948, https://doi.org/10.5194/acp-24-4915-2024, 2024. a
Fouquart, Y., Bonnel, B., Brogniez, G., Buriez, J., Smith, L., Morcrette, J., and Cerf, A.: Observations of Saharan aerosols: results of ECLATS field experiment. Part II: Broadband radiative characteristics of the aerosols and vertical radiative flux divergence, J. Appl. Meteorol., 26, 38–52, https://doi.org/10.1175/1520-0450(1987)026%3C0038:OOSARO%3E2.0.CO;2, 1987. a, b
Gliß, J., Mortier, A., Schulz, M., Andrews, E., Balkanski, Y., Bauer, S. E., Benedictow, A. M. K., Bian, H., Checa-Garcia, R., Chin, M., Ginoux, P., Griesfeller, J. J., Heckel, A., Kipling, Z., Kirkevåg, A., Kokkola, H., Laj, P., Le Sager, P., Lund, M. T., Lund Myhre, C., Matsui, H., Myhre, G., Neubauer, D., van Noije, T., North, P., Olivié, D. J. L., Rémy, S., Sogacheva, L., Takemura, T., Tsigaridis, K., and Tsyro, S. G.: AeroCom phase III multi-model evaluation of the aerosol life cycle and optical properties using ground- and space-based remote sensing as well as surface in situ observations, Atmos. Chem. Phys., 21, 87–128, https://doi.org/10.5194/acp-21-87-2021, 2021. a, b
Granados-Muñoz, M. J., Sicard, M., Román, R., Benavent-Oltra, J. A., Barragán, R., Brogniez, G., Denjean, C., Mallet, M., Formenti, P., Torres, B., and Alados-Arboledas, L.: Impact of mineral dust on shortwave and longwave radiation: evaluation of different vertically resolved parameterizations in 1-D radiative transfer computations , Atmos. Chem. Phys., 19, 523–542, https://doi.org/10.5194/acp-19-523-2019, 2019. a, b
Hansell, R., Tsay, S., Ji, Q., Hsu, N., Jeong, M., Wang, S., Reid, J., Liou, K., and Ou, S.: An assessment of the surface longwave direct radiative effect of airborne Saharan dust during the NAMMA field campaign, J. Atmos. Sci., 67, 1048–1065, https://doi.org/10.1175/2009JAS3257.1, 2010. a, b
Haywood, J., Johnson, B., Osborne, S., Mulcahy, J., Brooks, M., Harrison, M., Milton, S., and Brindley, H.: Observations and modelling of the solar and terrestrial radiative effects of Saharan dust: a radiative closure case-study over oceans during the GERBILS campaign, Q. J. Roy. Meteor. Soc., 137, 1211–1226, https://doi.org/10.1002/qj.770, 2011. a
Hess, M., Koepke, P., and Schult, I.: Optical properties of aerosols and clouds: the software package OPAC, B. Am. Meteorol. Soc., 79, 831–844, https://doi.org/10.1175/1520-0477(1998)079<0831:OPOAAC>2.0.CO;2, 1998. a, b, c
Hogan, R. J. and Bozzo, A.: A flexible and efficient radiation scheme for the ECMWF model, J. Adv. Model. Earth Sy., 10, 1990–2008, https://doi.org/10.1029/2018MS001364, 2018. a, b, c, d, e, f
Holben, B. N., Eck, T. F., Slutsker, I. a., Tanre, D., Buis, J., Setzer, A., Vermote, E., Reagan, J. A., Kaufman, Y., Nakajima, T., Lavenu, F., Jankowiak, I., and Smirnov, A.: AERONET – a federated instrument network and data archive for aerosol characterization, Remote Sens. Environ., 66, 1–16, https://doi.org/10.1016/S0034-4257(98)00031-5, 1998. a
Hsu, J. C. and Prather, M. J.: Assessing uncertainties and approximations in solar heating of the climate system, J. Adv. Model. Earth Sy., 13, e2020MS002131, https://doi.org/10.1029/2020MS002131, 2021. a
Iacono, M. J., Delamere, J. S., Mlawer, E. J., Shephard, M. W., Clough, S. A., and Collins, W. D.: Radiative forcing by long-lived greenhouse gases: calculations with the AER radiative transfer models, J. Geophys. Res.-Atmos., 113, D13103, https://doi.org/10.1029/2008JD009944, 2008. a
IPCC: Climate change 2013: the physical science basis: Working Group I contribution to the Fifth assessment report of the Intergovernmental Panel on Climate Change, Cambridge University Press, Cambridge, Royaume-Uni et New York (État de New York), États-Unis d'Amérique, https://doi.org/10.1017/CBO9781107415324, 2013. a
Irshad, R., Grainger, R. G., Peters, D. M., McPheat, R. A., Smith, K. M., and Thomas, G.: Laboratory measurements of the optical properties of sea salt aerosol, Atmos. Chem. Phys., 9, 221–230, https://doi.org/10.5194/acp-9-221-2009, 2009. a
Ito, A., Adebiyi, A. A., Huang, Y., and Kok, J. F.: Less atmospheric radiative heating by dust due to the synergy of coarser size and aspherical shape, Atmos. Chem. Phys., 21, 16869–16891, https://doi.org/10.5194/acp-21-16869-2021, 2021. a
Kinne, S., O'Donnel, D., Stier, P., Kloster, S., Zhang, K., Schmidt, H., Rast, S., Giorgetta, M., Eck, T. F., and Stevens, B.: MAC-v1: a new global aerosol climatology for climate studies, J. Adv. Model. Earth Sy., 5, 704–740, https://doi.org/10.1002/jame.20035, 2013. a
Köhler, C. H., Trautmann, T., Lindermeir, E., Vreeling, W., Lieke, K., Kandler, K., Weinzierl, B., Groß, S., Tesche, M., and Wendisch, M.: Thermal IR radiative properties of mixed mineral dust and biomass aerosol during SAMUM-2, Tellus B, 63, 751–769, https://doi.org/10.1111/j.1600-0889.2011.00563.x, 2011. a
Kok, J. F.: A scaling theory for the size distribution of emitted dust aerosols suggests climate models underestimate the size of the global dust cycle, P. Natl. Acad. Sci. USA, 108, 1016–1021, https://doi.org/10.1073/pnas.1014798108, 2011. a
Kok, J. F., Ridley, D. A., Zhou, Q., Miller, R. L., Zhao, C., Heald, C. L., Ward, D. S., Albani, S., and Haustein, K.: Smaller desert dust cooling effect estimated from analysis of dust size and abundance, Nat. Geosci., 10, 274–278, https://doi.org/10.1038/ngeo2912, 2017. a, b, c, d
Krekov, G.: Models of atmospheric aerosols, in: Aerosol Effects on Climate (A93-39529 15-42), edited by: Jennings, S. G., U. of Arizona Press, Tucson, Ariz., 9–72, ISBN 0816513627, 1993. a, b
Le Moigne, P., Besson, F., Martin, E., Boé, J., Boone, A., Decharme, B., Etchevers, P., Faroux, S., Habets, F., Lafaysse, M., Leroux, D., and Rousset-Regimbeau, F.: The latest improvements with SURFEX v8.0 of the Safran–Isba–Modcou hydrometeorological model for France, Geosci. Model Dev., 13, 3925–3946, https://doi.org/10.5194/gmd-13-3925-2020, 2020. a
Li, L., Mahowald, N. M., Miller, R. L., Pérez García-Pando, C., Klose, M., Hamilton, D. S., Gonçalves Ageitos, M., Ginoux, P., Balkanski, Y., Green, R. O., Kalashnikova, O., Kok, J. F., Obiso, V., Paynter, D., and Thompson, D. R.: Quantifying the range of the dust direct radiative effect due to source mineralogy uncertainty, Atmos. Chem. Phys., 21, 3973–4005, https://doi.org/10.5194/acp-21-3973-2021, 2021. a
Masson-Delmotte, V., Zhai, P., Pirani, S., Connors, C., Péan, S., Berger, N., Caud, Y., Chen, L., Goldfarb, M., and Scheel Monteiro, P. M.: Ipcc, 2021: Summary for policymakers. in: Climate Change 2021: The Physical Science Basis. Contribution of Working Group I to the Sixth Assessment Report of the Intergovernmental Panel on Climate Change, Cambridge University Press, Cambridge, United Kingdom and New York, NY, USA, https://doi.org/10.1017/9781009157896.001, 2021. a, b
Michou, M., Nabat, P., and Saint-Martin, D.: Development and basic evaluation of a prognostic aerosol scheme (v1) in the CNRM Climate Model CNRM-CM6, Geosci. Model Dev., 8, 501–531, https://doi.org/10.5194/gmd-8-501-2015, 2015. a
Michou, M., Nabat, P., Saint-Martin, D., Bock, J., Decharme, B., Mallet, M., Roehrig, R., Séférian, R., Sénési, S., and Voldoire, A.: Present-day and historical aerosol and ozone characteristics in CNRM CMIP6 simulations, J. Adv. Model. Earth Sy., 12, e2019MS001816, https://doi.org/10.1029/2019MS001816, 2020. a
Miller, R., Cakmur, R., Perlwitz, J., Geogdzhayev, I., Ginoux, P., Koch, D., Kohfeld, K., Prigent, C., Ruedy, R., Schmidt, G., and Tegen, I.: Mineral dust aerosols in the NASA Goddard Institute for Space Sciences ModelE atmospheric general circulation model, J. Geophys. Res.-Atmos., 111, D06208, https://doi.org/10.1029/2005JD005796, 2006. a
Mlawer, E. J., Taubman, S. J., Brown, P. D., Iacono, M. J., and Clough, S. A.: Radiative transfer for inhomogeneous atmospheres: RRTM, a validated correlated-k model for the longwave, J. Geophys. Res.-Atmos., 102, 16663–16682, https://doi.org/10.1029/97JD00237, 1997. a
Myhre, G., Shindell, D., and Pongratz, J.: Anthropogenic and natural radiative forcing in: Climate Change 2013: The Physical Science Basis. Working Group I Contribution to the Fifth Assessment Report of the Intergovernmental Panel on Climate Change, Cambridge University Press, Cambridge, UK and New York, https://doi.org/10.1017/CBO9781107415324.018, 2013. a
Nabat, P., Somot, S., Mallet, M., Michou, M., Sevault, F., Driouech, F., Meloni, D., di Sarra, A., Di Biagio, C., Formenti, P., Sicard, M., Léon, J.-F., and Bouin, M.-N.: Dust aerosol radiative effects during summer 2012 simulated with a coupled regional aerosol–atmosphere–ocean model over the Mediterranean, Atmos. Chem. Phys., 15, 3303–3326, https://doi.org/10.5194/acp-15-3303-2015, 2015a. a
Noilhan, J. and Mahfouf, J.-F.: The ISBA land surface parameterisation scheme, Global Planet. Change, 13, 145–159, https://doi.org/10.1016/0921-8181(95)00043-7, 1996. a
Osborne, S., Baran, A., Johnson, B., Haywood, J., Hesse, E., and Newman, S.: Short-wave and long-wave radiative properties of Saharan dust aerosol, Q. J. Roy. Meteor. Soc., 137, 1149–1167, https://doi.org/10.1002/qj.771, 2011. a
Pincus, R., Barker, H. W., and Morcrette, J.-J.: A fast, flexible, approximate technique for computing radiative transfer in inhomogeneous cloud fields, J. Geophys. Res.-Atmos., 108, 4376, https://doi.org/10.1029/2002JD003322, 2003. a
Roehrig, R., Beau, I., Saint-Martin, D., Alias, A., Decharme, B., Guérémy, J.-F., Voldoire, A., Abdel-Lathif, A. Y., Bazile, E., Belamari, S., Blein, S., Bouniol, D., Bouteloup, Y., Cattiaux, J., Chauvin, F., Chevallier, M., Colin, J., Douville, H., Marquet, P., Michou, M., Nabat, P., Oudar, T., Peyrillé, P., Piriou, J.-M., Salas y Mélia, D., Séférian, R., and Sénési, S.: The CNRM global atmosphere model ARPEGE-Climat 6.3: description and evaluation, J. Adv. Model. Earth Sy., 12, e2020MS002075, https://doi.org/10.1029/2020MS002075, 2020. a, b
Ryder, C. L., Highwood, E. J., Walser, A., Seibert, P., Philipp, A., and Weinzierl, B.: Coarse and giant particles are ubiquitous in Saharan dust export regions and are radiatively significant over the Sahara, Atmos. Chem. Phys., 19, 15353–15376, https://doi.org/10.5194/acp-19-15353-2019, 2019. a
Sicard, M., Bertolín, S., Mallet, M., Dubuisson, P., and Comerón, A.: Estimation of mineral dust long-wave radiative forcing: sensitivity study to particle properties and application to real cases in the region of Barcelona, Atmos. Chem. Phys., 14, 9213–9231, https://doi.org/10.5194/acp-14-9213-2014, 2014. a, b, c, d, e, f, g
Simmons, A. J. and Burridge, D. M.: An energy and angular-momentum conserving vertical finite-difference scheme and hybrid vertical coordinates, Mon. Weather Rev., 109, 758–766, https://doi.org/10.1175/1520-0493(1981)109%3C0758:AEAAMC%3E2.0.CO;2, 1981. a
Sinyuk, A., Holben, B. N., Eck, T. F., Giles, D. M., Slutsker, I., Korkin, S., Schafer, J. S., Smirnov, A., Sorokin, M., and Lyapustin, A.: The AERONET Version 3 aerosol retrieval algorithm, associated uncertainties and comparisons to Version 2, Atmos. Meas. Tech., 13, 3375–3411, https://doi.org/10.5194/amt-13-3375-2020, 2020. a
Sokolik, I., Andronova, A., and Johnson, T. C.: Complex refractive index of atmospheric dust aerosols, Atmos. Environ. A-Gen., 27, 2495–2502, https://doi.org/10.1016/0960-1686(93)90021-P, 1993. a
Sokolik, I. N., Toon, O. B., and Bergstrom, R. W.: Modeling the radiative characteristics of airborne mineral aerosols at infrared wavelengths, J. Geophys. Res.-Atmos., 103, 8813–8826, https://doi.org/10.1029/98JD00049, 1998. a
Szopa, S., Naik, V., Adhikary, B., Artaxo, P., Berntsen, T., Collins, W., Fuzzi, S., Gallardo, L., Kiendler, Scharr, A., Klimont, Z., Liao, H., Unger, N., and Zanis, P.: Short-Lived Climate Forcers, in: Climate Change 2021: The Physical Science Basis. Contribution of Working Group I to the Sixth Assessment Report of the Intergovernmental Panel on Climate Change, Cambridge University Press, Cambridge, United Kingdom and New York, NY, USA, https://doi.org/10.1017/9781009157896.008, 2021. a
Tiedtke, M.: A comprehensive mass flux scheme for cumulus parameterization in large-scale models, Mon. Weather Rev., 117, 1779–1800, https://doi.org/10.1175/1520-0493(1989)117%3C1779:ACMFSF%3E2.0.CO;2, 1989. a
Van Der Does, M., Knippertz, P., Zschenderlein, P., Giles Harrison, R., and Stuut, J.-B. W.: The mysterious long-range transport of giant mineral dust particles, Science Advances, 4, eaau2768, https://doi.org/10.1126/sciadv.aau2768, 2018. a
Volz, F. E.: Infrared optical constants of ammonium sulfate, Sahara dust, volcanic pumice, and flyash, Appl. Optics, 12, 564–568, https://doi.org/10.1364/AO.12.000564, 1973. a
Weinzierl, B., Sauer, D., Esselborn, M., Petzold, A., Veira, A., Rose, M., Mund, S., Wirth, M., Ansmann, A., Tesche, M., Gross, S., and Freudenthaler, V.: Microphysical and optical properties of dust and tropical biomass burning aerosol layers in the Cape Verde region – an overview of the airborne in situ and lidar measurements during SAMUM-2, Tellus B, 63, 589–618, https://doi.org/10.1111/j.1600-0889.2011.00566.x, 2011. a
Woodward, S.: Modeling the atmospheric life cycle and radiative impact of mineral dust in the Hadley Centre climate model, J. Geophys. Res.-Atmos., 106, 18155–18166, https://doi.org/10.1029/2000JD900795, 2001. a, b, c
- Abstract
- Introduction
- Methodology
- Dust and sea salt optical properties
- Evaluation of the AOD of coarse aerosols
- Radiative and climatic impacts of the LW aerosol scattering
- Conclusions
- Appendix A
- Data availability
- Author contributions
- Competing interests
- Disclaimer
- Acknowledgements
- Financial support
- Review statement
- References