the Creative Commons Attribution 4.0 License.
the Creative Commons Attribution 4.0 License.
 | 22 Sep 2025
Impacts of aerosol–radiation and aerosol–cloud interactions on a short-term heavy-rainfall event – a case study in the Guanzhong Basin, China
Naifang Bei
Bo Xiao
Ruonan Wang
Yuning Yang
Lang Liu
Yongming Han
Guohui Li
Atmospheric aerosols influence clouds and precipitation by aerosol–radiation interactions (ARIs) and aerosol–cloud interactions (ACIs). In this study, the synergetic effect of ARIs and ACIs on the development and precipitation of a mesoscale convective system (MCS) that occurred in the Guanzhong Basin (GZB) of central China have been examined using a cloud-resolving fully coupled weather research and forecasting model with chemistry (WRF-Chem). The model reasonably reproduces the temporal variation and spatial distribution of air pollutants, the hourly rain rate, and daily precipitation distribution against observations in the GZB. Sensitivity simulations are conducted under different aerosol scenarios by adjusting the anthropogenic emissions. When the ARI effect is not considered, the daily precipitation does not show an increasing trend with increasing aerosols in the GZB. This primarily reflects the effects of ACIs due to competition among convective clouds to available water vapor in the development of the MCS. ARIs exert two opposite effects on convection: a stabilizing effect to suppress convection and a lifting effect to foster convection, which counteract each other. When the lifting effect outweighs stabilizing effect, the updraft is enhanced, which increases precipitation in the GZB. However, the synergetic effect of ARIs and ACIs significantly suppress precipitation when the particulate-matter (PM) pollution is severe. Note that the synergetic effect consistently decreases the precipitation in the whole domain with increasing aerosols, but ARIs play a more important role in the decreasing trend of the precipitation with deterioration of PM pollution.
- Article
(19162 KB) - Full-text XML
-
Supplement
(701 KB) - BibTeX
- EndNote


Atmospheric aerosols influence both cloud processes (e.g., initiation time, lifetime, and spatial extent) and precipitation characteristics (including duration, frequency, and cumulative amount), with these coupled interactions remaining the dominant source of uncertainty in quantifying climate forcing agents and refining future scenarios (IPCC, 2013). The aerosol effect on cloud and precipitation is primarily focused on two critical aspects, including the ability of aerosols to act as cloud condensation nuclei (CCN) and/or ice nuclei (IN) and their influence on the atmospheric thermodynamic structure (Boucher et al., 2013; Huang and Ding, 2021; Zhao et al., 2024).
By serving as CCN and IN, aerosols can increase cloud albedo (Twomey, 1977), cloud longwave emissivity (Garrett and Zhao, 2006), and extend cloud lifetime (Albrecht, 1989; Christensen et al., 2020), which is referred to as aerosol indirect effect (AIE) or aerosol–cloud interaction (ACI). By absorbing and scattering incident solar radiation, aerosols can enhance atmospheric stability. This occurs as they cool the ground surface while heating the atmosphere, subsequently affecting the development of clouds and precipitation (Charlson et al., 1992; Sun and Zhao, 2021), which is also termed the aerosol direct effect (ADE). The absorbing aerosols within clouds can also accelerate evaporation of cloud droplets by absorbing solar radiation, leading to reductions in cloud cover and precipitation, and decreases in cloud albedo (Ackerman et al., 2000), which is named the semi-direct radiative effect. Together with ADE, it is defined as aerosol–radiation interaction (ARI).
Despite significant advancements in understanding the mechanisms of ACIs, there are still considerable uncertainties regarding the impacts of aerosols on precipitation for various cloud regimes and environment conditions, especially in mixed-phase convective clouds (Tao et al., 2012; Wang et al., 2013; Li et al., 2019). The impact of ACIs on precipitation varies under different meteorological conditions (Khain et al., 2008; Storer et al., 2010; Lebo and Morrison, 2014; Guo et al., 2016; Chen et al., 2020), cloud types (Tao et al., 2007; Lee et al., 2008), precipitation types (Guo et al., 2018; Sun and Zhao, 2021), cloud/precipitation development stages (Guo et al., 2014), aerosol composition and size distribution (Zhang et al., 2002; Jiang et al., 2018; Xi et al., 2024), the relative location of aerosol and cloud vertical locations (Ackerman et al., 2000; Sand et al., 2020; Senf et al., 2021), and orography conditions (Yang and Li, 2014; Nugent et al., 2016).
It has been well established that elevated aerosol concentrations increase the cloud droplet number concentration (CDNC), thus reducing cloud particle sizes, inhibiting collision and coalescence processes, and increasing the cloud liquid (Zhao et al., 2018). Increased cloud liquid in the air is evaporated or frozen through enhancing freezing of cloud liquid and parcel buoyancy. The increased cloud liquid mass can further invigorate convection and enhance precipitation (Rosenfeld et al., 2008; Chen et al., 2017; Dagan et al., 2017). Furthermore, increased cloud liquid mass can increase evaporation to strengthen gust fronts, which reinforces convective clouds and the related precipitation amount in turn (Khain et al., 2005; Tao et al., 2007; Lee et al., 2018). Aerosols have also been demonstrated to suppress the precipitation of warm clouds across various regions globally (Ackerman et al., 2003; Wang et al., 2011). Decreased droplet sizes within aerosol-laden clouds restrain the coalescence of droplets, which can slow the conversion from cloud droplets into rainwater, to the extent of completely suppressing the formation of warm rain (Rosenfeld et al., 2001).
Lau et al. (2008) found that aerosols broadly influence atmospheric conditions by affecting the thermodynamic properties and modifying large-scale circulation through various feedback processes. However, the radiative impacts of absorbing versus scattering aerosols differ significantly, leading to diverse effects on cloud formation and precipitation (Li et al., 2017; Sun and Zhao, 2021). Absorbing aerosols can significantly alter the development of clouds and precipitation by changing the vertical temperature profiles and disturbing local atmospheric circulation (Sun and Zhao, 2021). Their impacts on precipitation are especially related to the relative position of aerosols with respect to clouds (Kaufman and Koren, 2006; Wilcox, 2012). While scattering aerosols tend to cool the ground surface, thereby enhancing atmospheric stability and inhibiting both convection and rainfall. Due to the complex and nonlinear nature of aerosol radiative interactions with cloud-precipitation processes, variations in aerosol levels can lead to a shift from enhancing precipitation to suppressing it (Jiang et al., 2016; Wang et al., 2023). ARIs can also impact precipitation by altering wind speed, which is primarily due to reduced water vapor advection and evaporation (Koren et al., 2004; Yang et al., 2013a).
Fast-growing industries and city expansions have substantially increased aerosol levels over the past three decades in the Guanzhong Basin (GZB) of central China (Bei et al., 2016a, b, 2017). The basin is located in the transitional zone between the Qinling Mountains and the Loess Plateau (34–35.5° N, 106.5–110.5° E, refer to Fig. 1: the area surrounded by blue lines). Studies on the aerosol impact on precipitation in the GZB and surrounding areas (GZBs) are mostly focused on the rainfall over the mountain area due to the extensive long-term observational data available from Mt. Hua's summit. In addition, the area is highly prone to orographic precipitation and is significantly influenced by aerosol transport from the heavily polluted upwind areas (Rosenfeld et al., 2007; Yang et al., 2013a, b). Rosenfeld et al. (2007) proposed that the hilly precipitation at Mt. Hua near Xi'an could be decreased by 30 % to 50 % during hazy conditions. Yang et al. (2013b) found that the decreasing trend of orographic precipitation correlate well with the deterioration of the air pollution at Mt. Hua and in the GZB based on more observational analyses, supporting the hypothesis that both aerosol microphysical and radiative effects could reduce orographic precipitation.
In the present study, we examine the synergetic effects of ARIs and ACIs on a short-term heavy-precipitation event that occurred in the GZB using a fully coupled cloud-resolving WRF-Chem model. The WRF-Chem model and experiment design are described in Sect. 2. In Sect. 3 we present results and discussion. A summary and conclusions are given in Sect. 4.
2.1 WRF-Chem Model
A specific version of the WRF-Chem model, with modifications by Li et al. (2010, 2011a, b, 2012) based on the original version by Grell et al. (2005), is used to study impacts of anthropogenic aerosols on a short-time heavy-rainfall event that occurred in the GZB on 24 July 2016. A Goddard shortwave module developed by Chou and Suarez (1999) and Chou et al. (2001) is employed to account for the ARI effect. A two-moment bulk microphysics scheme with aerosol effects developed by Morrison et al. (2009) is used to consider the ACI effect. Detailed model description of the WRF-Chem model, the calculation of aerosol optical properties, and activation of aerosols to CCN and IN can be found in the Supplement (Sects. S1, S2, and S3).
2.2 Experiments design
In this study, the WRF-Chem model is configured with two one-way nested grids with spacing of 9 km (301 × 301 grid points) for domain 1 (D01) and 3 km (301 × 301 grid points) for domain 2 (D02). The two domains are both centered at Xi'an (34.25° N, 109° E) (Fig. 1). The simulations of D01 provide meteorological and chemical initial and boundary conditions for D02. The simulations of D02 are primarily used to investigate the impact of ACIs and ARIs on precipitation in the GZB. The one-way nesting approach is intentionally adopted to prevent aerosol-induced changes in D02 from dynamically feeding back to D01, thereby maintaining identical meteorological forcing across all sensitivity experiments (e.g., F_BASE vs. F_ARI0). This isolation ensures that precipitation differences in D02 are solely attributable to aerosol effects (ARIs/ACIs) rather than confounding meteorological variability. The vertical dimension is divided into 51 layers, extending from the ground level up to the 50 hPa altitude. The model employs vertically staggered grids with enhanced resolution near the ground surface (30 m vertical spacing), increasing to progressively coarser resolution at higher elevations (reaching 400 m grid spacing above 2.5 km). This configuration aims to enhance the resolution within the planetary boundary layer (PBL), thereby capturing finer details in this critical atmospheric region.
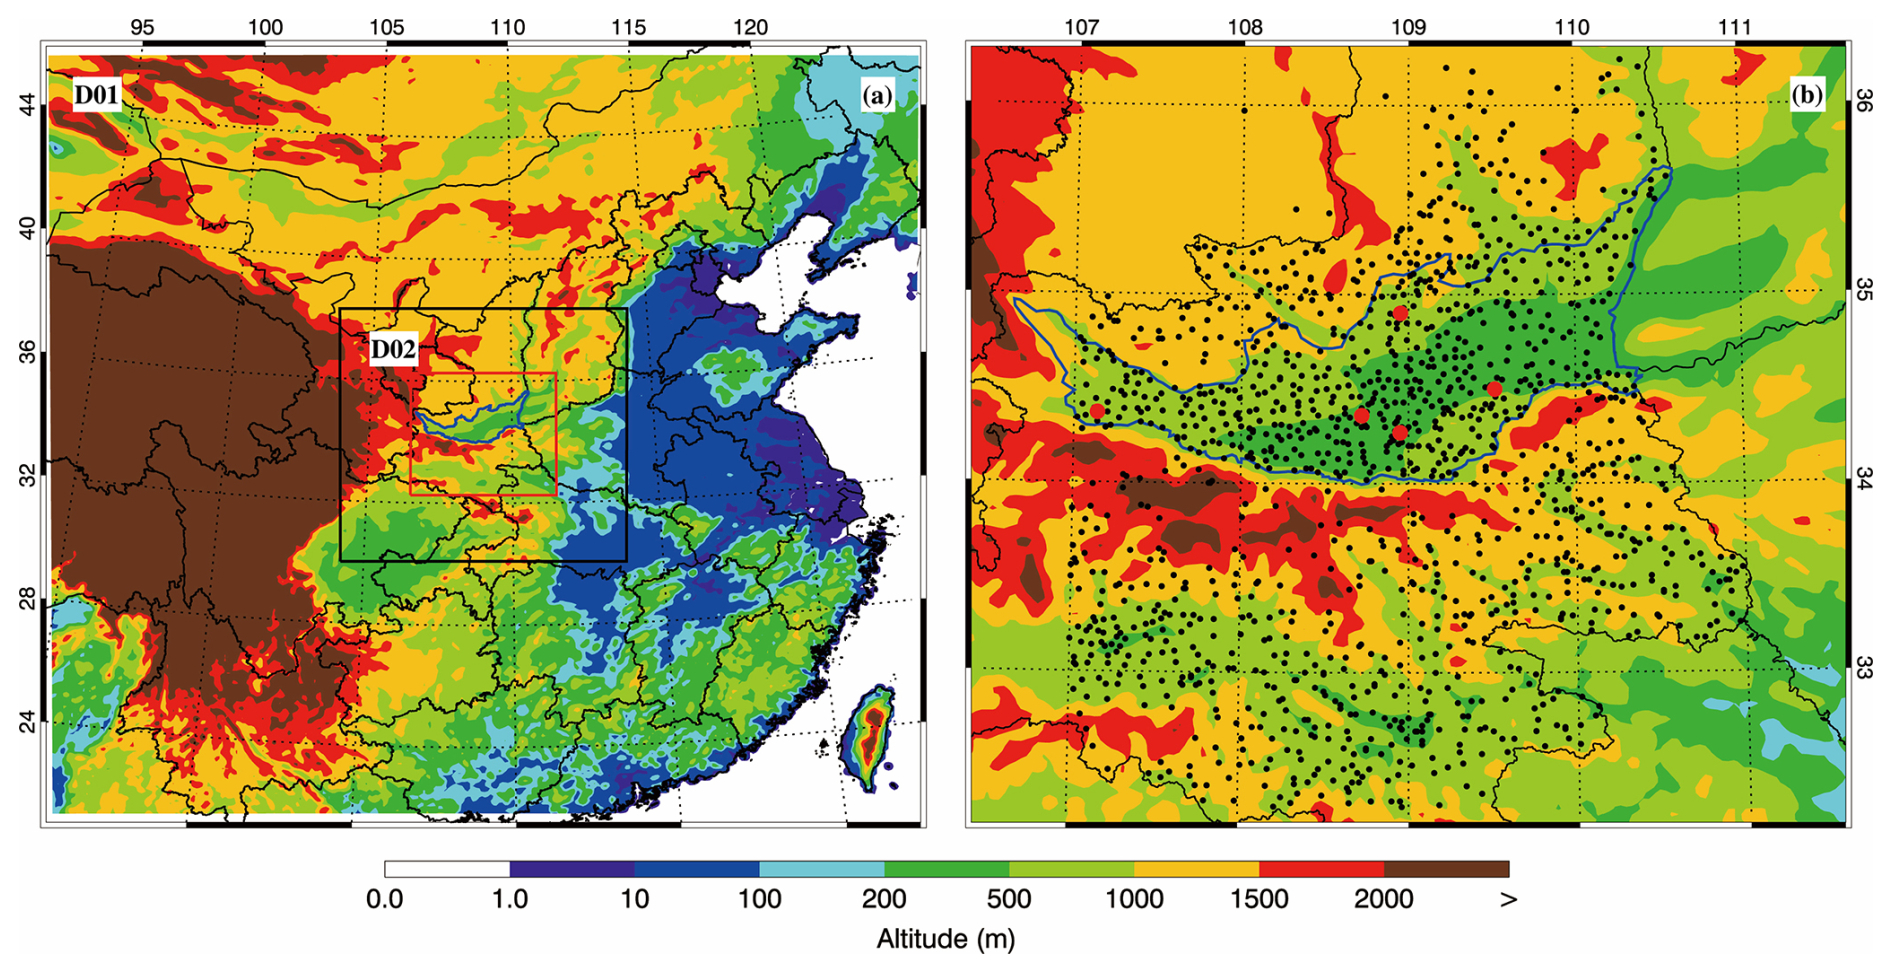
Figure 1(a) WRF-Chem simulation domain with topography and (b) Guanzhong basin with monitoring sites. In (a) and (b), the area surrounded by blue lines represents the Guanzhong basin. In (b), the black dots denote the meteorological sites with rain gauge and the red dots denote the sites with air pollutants observations.
The WRF-Chem is first integrated for an 84 h period from 12:00 UTC (20:00 LT) of 21 July to 00:00 UTC (08:00 LT) of 25 July 2016 for D01, with a 30 h spin-up time. The meteorological initial and boundary conditions are from the National Centers for Environmental Prediction (NCEP) final operational global gridded analysis (FNL) (1° × 1°). The chemical initial and boundary conditions are derived through interpolation from the 6 h output of a global chemical transport model for O3 and related chemical tracers (MOZART) (Horowitz et al., 2003). We vary the aerosol concentrations in the atmosphere through adjusting anthropogenic emissions. A set of 41 anthropogenic emission scale factors (AESFs) is used in the numerical experiments, ranging from 2−3 to 23 with an exponential increasing step of 0.15. A total of 41 sensitivity simulations are conducted for D01.
The WRF-Chem model is then integrated for a 24 h period from 00:00 UTC (08:00 LT) of 24 July to 00:00 UTC (08:00 LT) of 25 July 2016 for D02. In order to investigate the impacts of aerosols with different concentrations on the short time heavy-rainfall event through ARIs, ACIs, and both of them together, two groups of experiments are designed based on D02. Both ARI and ACI effects are considered in the control simulation, in which the meteorological and chemical initial and boundary conditions are interpolated from the simulation of D01 with an AESF of 1.0 (hereafter referred to as CTRL). The results in the CTRL are used to validate the model performance. Based on the CTRL, the first group of sensitivity experiments are conducted, in which the AESF is adjusted according to that for D01 (hereafter referred as to F_BASE). The chemical initial and boundary conditions for the member of F_BASE are interpolated from the corresponding member of D01 with the same AESF. The second group of sensitivity experiments is the same as the F_BASE but the ARI effect is turned off (hereafter referred as to F_ARI0). The model set-up is the same for all experiments, except for the anthropogenic emission amplitude. The detailed model configuration is listed in Table S1 in the Supplement.
2.3 Model validation and statistical metrics
Hourly precipitation observations at meteorological sites with rain gauge in the GZBs are from the China Meteorological Administration. Hourly observations of air pollutants (including particulate-matter pollutants (PMs)), including PM2.5, O3, NO2, and SO2 are from the Ministry of Ecology and Environment of China. The performance of the WRF-Chem model simulations is assessed by comparing them with observations using metrics including the mean bias (MB), root-mean-square error (RMSE), and the index of agreement (IOA). The IOA describes the relative difference between the model and observation, ranging from 0 to 1, with 1 indicating perfect agreement. The population mean (p-mean hereafter) of a given variable across all qualified grid points is used to assess the general impact of aerosol variations on cloud or cloud systems. A detailed description of MB, RMSE, IOA, and p-mean can be found in Sect. S4.
3.1 Case descriptions and model validation
The selected heavy-rainfall event occurred at the local time of 24–25 July 2016 in the GZB. The rain gauge observations show that the 24 h accumulated rainfall reaches 100 mm over the GZB with the maximum hourly precipitation of 66.6 mm occurring in Xi'an. During the event, the GZB is located near the bottom of a trough at 850 hPa, in the front of the trough at 700 and 500 hPa, and in the center of a high-pressure system in the upper level (200 hPa), which are basically conducive to occurrence and development of low-level convections (Fig. 2). The radiosonde observations on 24 and 25 July are shown in Fig. 3. The high convective available potential energy (CAPE) of 5045 J kg−1 is observed at 12:00 UTC (20:00 LT) 24 July (Fig. 3b), which is directly before the heavy-rainfall peak (14:00 UTC/22:00 LT) in Xi'an. The value of CAPE decreases to 2486 J kg−1 at 00:00 UTC (08:00 LT) 25 July (Fig. 3c), which is plausibly attributed to post-precipitation stabilization through latent heat release and nocturnal surface cooling following sunset.
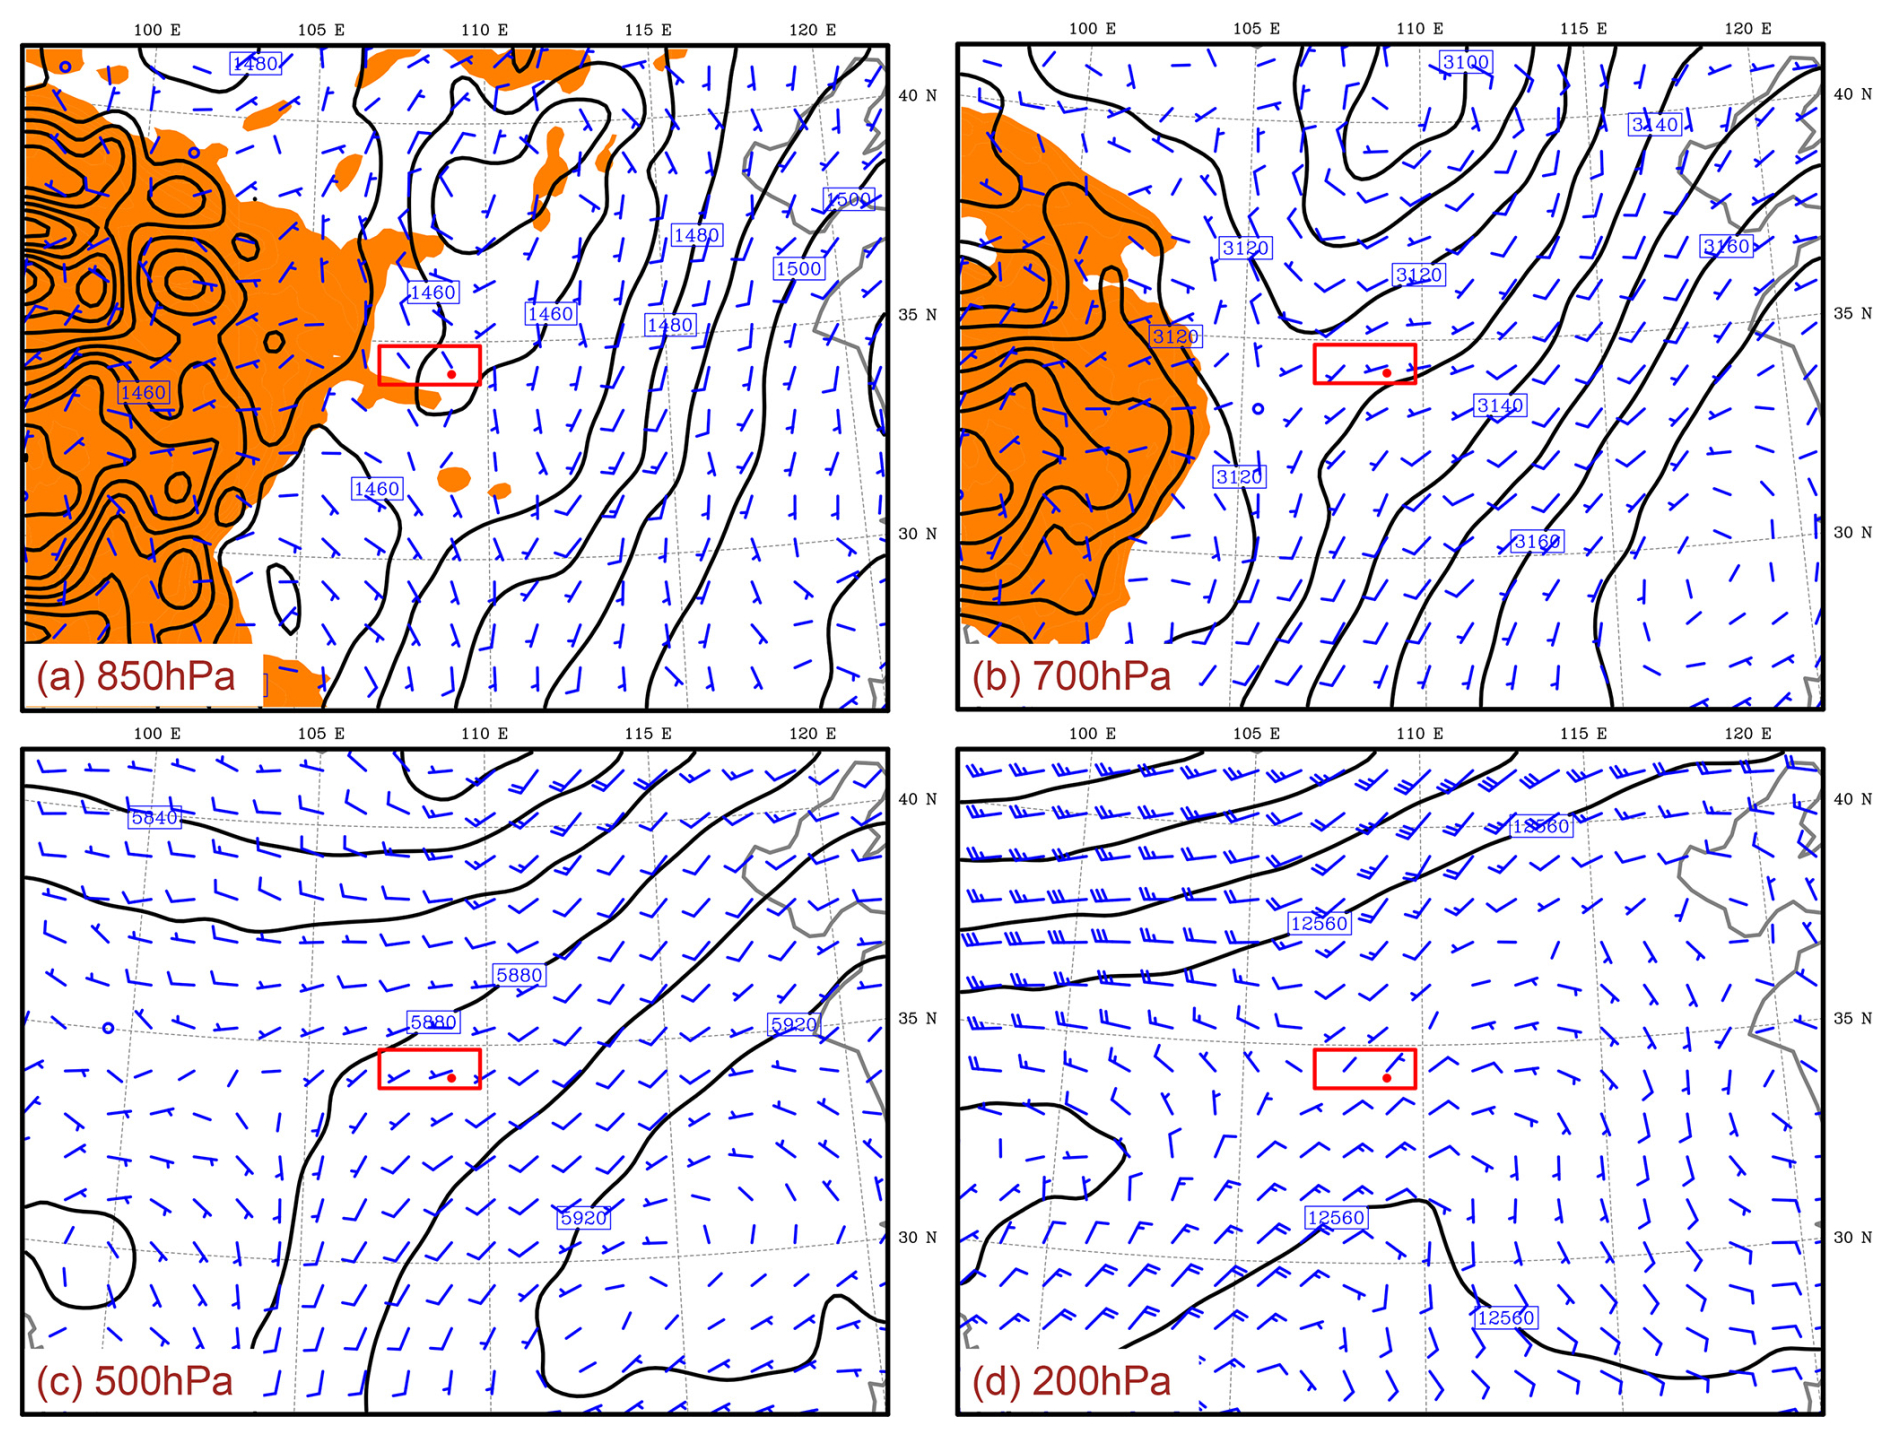
Figure 2Synoptic pattern at (a) 850 hPa, (b) 700 hPa, (c) 500 hPa, and (d) 200 hPa on 24 July 2016. The red rectangle shows the location of the GZB.
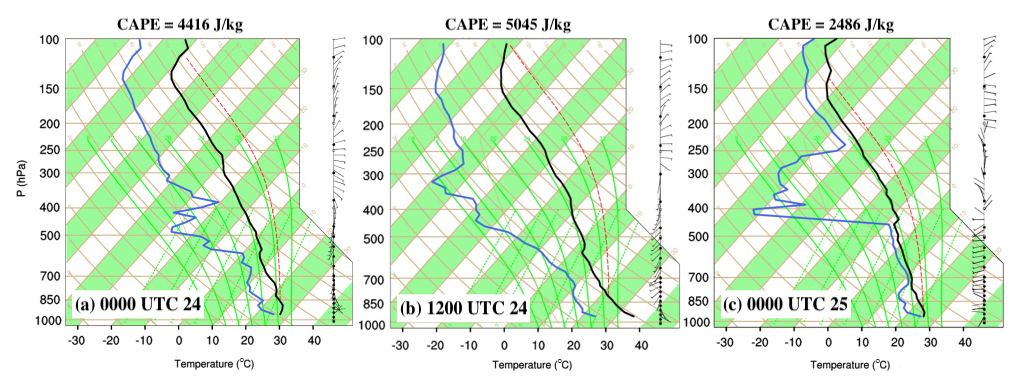
Figure 3Atmospheric sounding over the GZB (108.97° E, 34.43° N) at (a) 00:00 UTC and (b) 12:00 UTC (20:00 LT) on 24, and (c) 00:00 UTC (08:00 LT) on 25 July 2016. The black line denotes the temperature, and the blue line represents the dew point temperature.
Figure 4 presents the spatial distribution of simulated and observed concentrations of PM2.5, O3, NO2, and SO2 at 00:00 UTC (08:00 LT) on 24 July 2016. In general, the model reasonably simulates the pattern of air pollutants compared to observations at monitoring sites in the GZB. The PM2.5 concentration generally exceeds 50 µg m−3, and the SO2 level is also high at urban areas and industrial zones in the basin. Figure 5 shows simulated (red line) and observed (black dots) diurnal profiles of hourly mass concentrations of PM2.5, O3, NO2, and SO2 averaged at monitoring sites in the GZB on 24 July 2016. The model yields the reasonable temporal variations of air pollutants against observations, particularly regarding PM2.5 and O3, with an IOA of 0.88 and 0.96, respectively. The model tends to underestimate the PM2.5 concentration during daytime, with an MB of −4.5 µg m−3. The model overestimates NO2 by 0.76 µg m−3 and underestimates SO2 by 0.23 µg m−3, with an IOA of 0.68 and 0.51, respectively (Fig. 5c, d). NO2 over-predictions appear primarily from 12:00 to 18:00 UTC (20:00–02:00 LT), which results from the uncertainty of the nighttime traffic emission inventory and the possibly under-predicted PBL; SO2 bias mainly stem from point sources, which is highly sensitive to uncertainties in simulated wind fields.
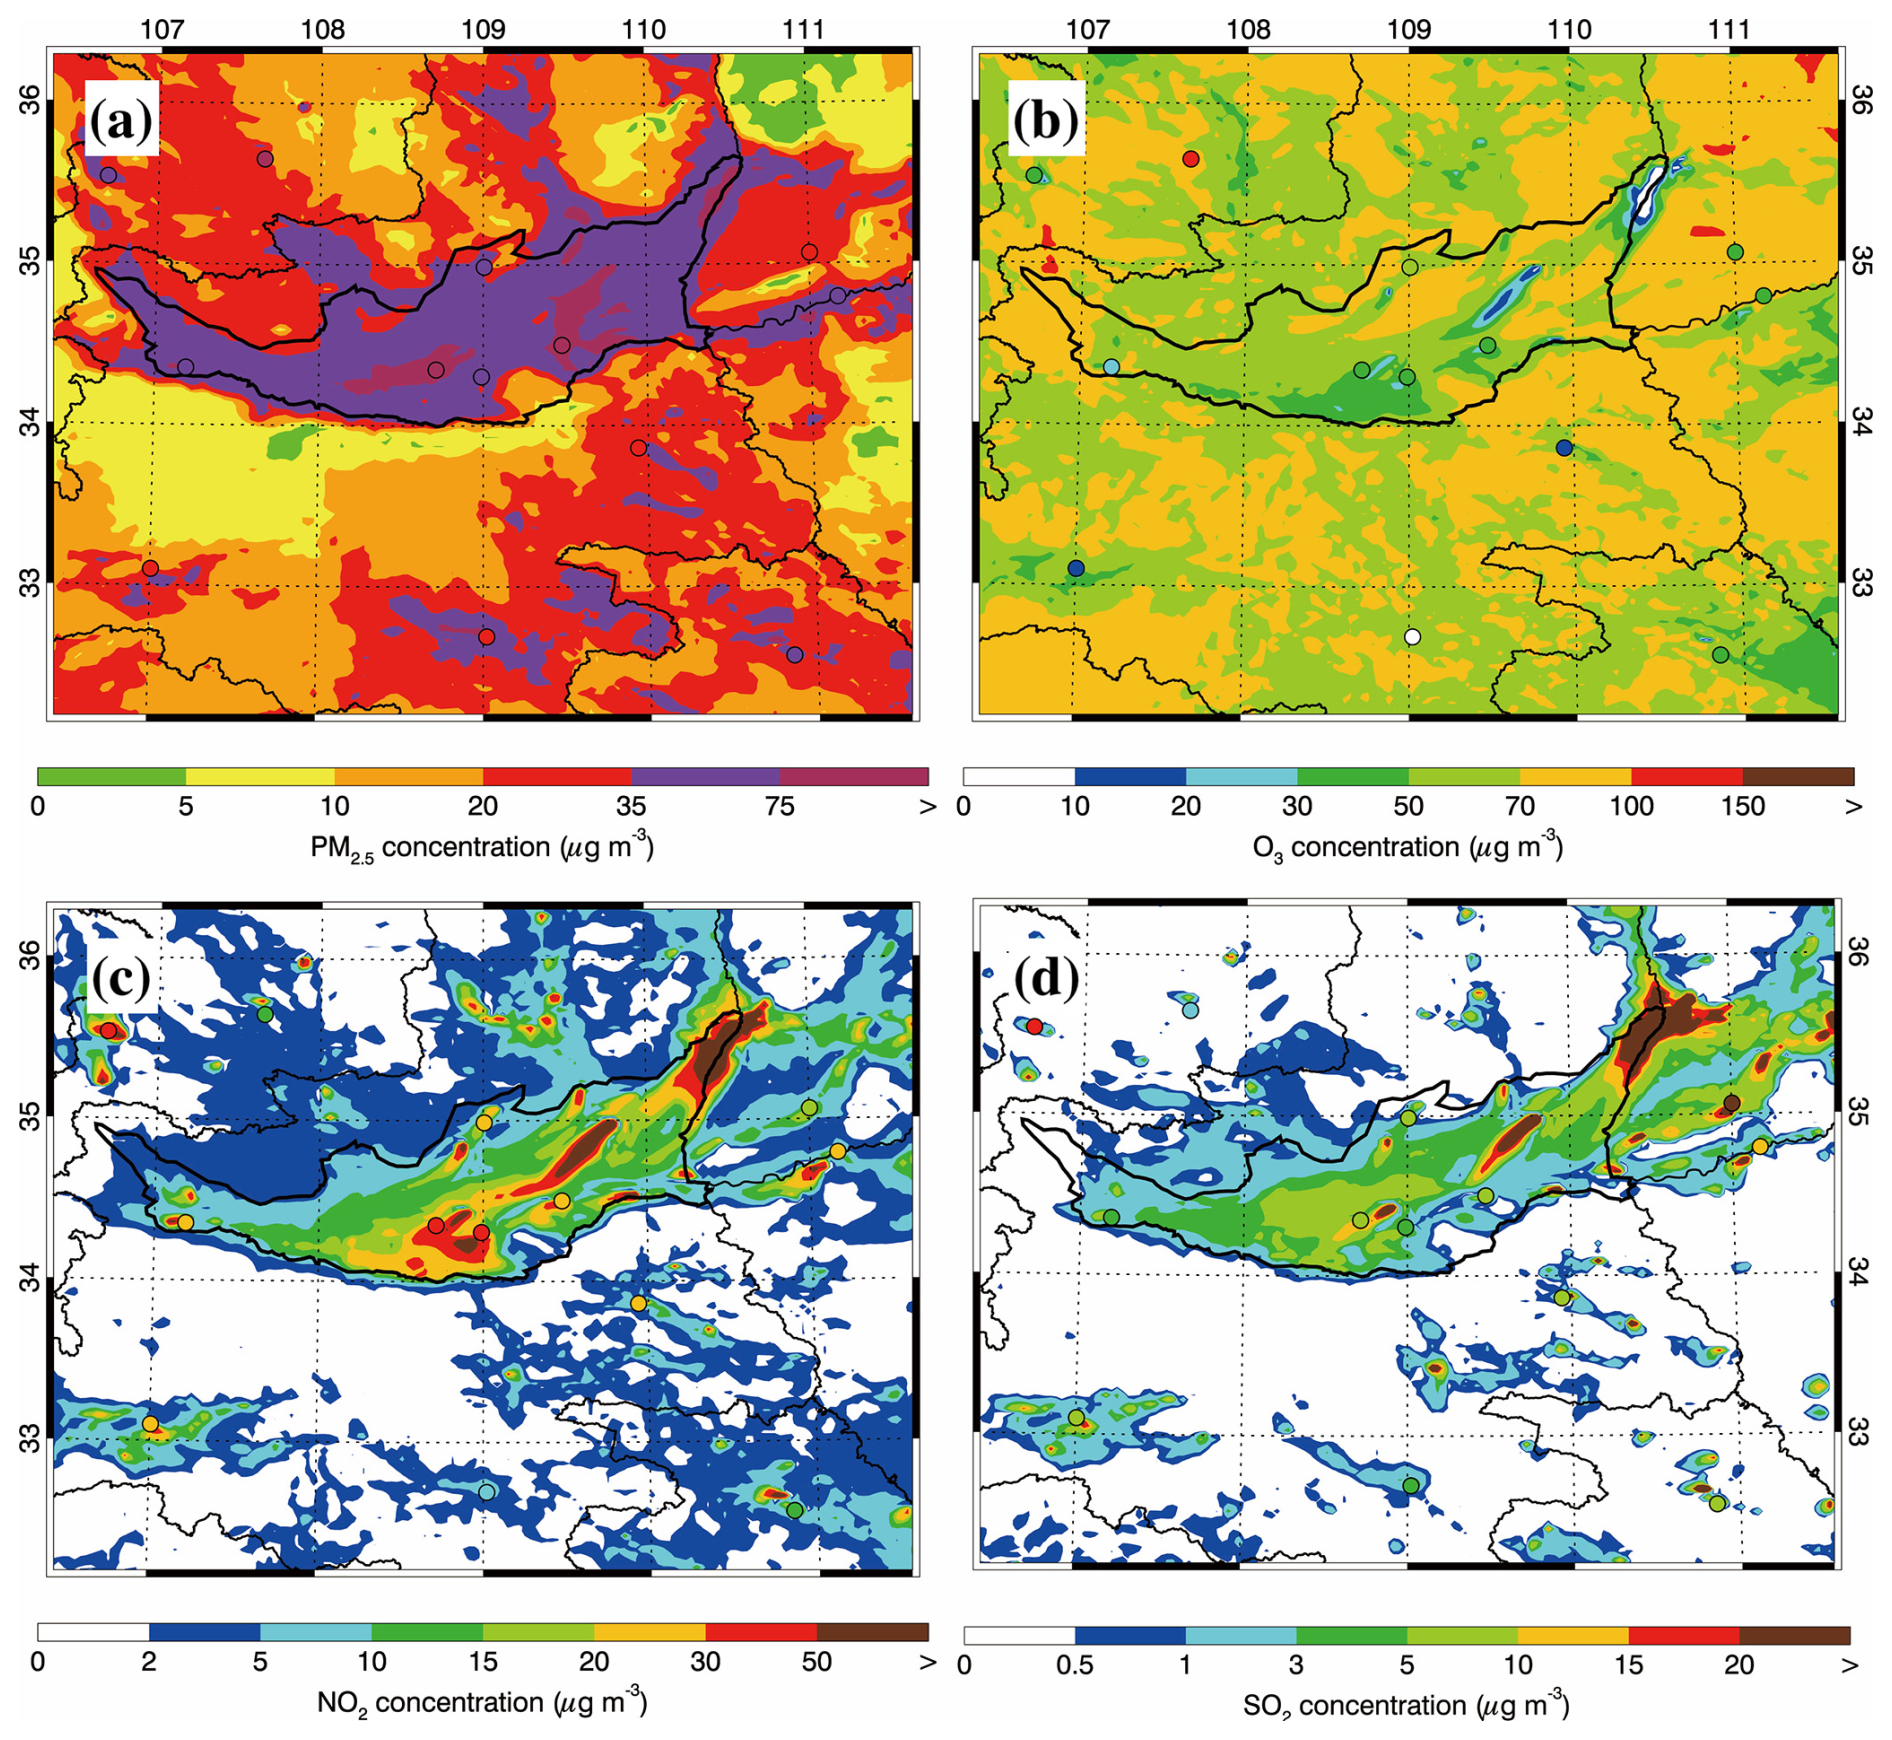
Figure 4Pattern comparisons of simulated (color counters) versus observed (colored dots) near-surface mass concentrations of (a) PM2.5, (b) O3, (c) NO2 and (d) SO2 at 00:00 UTC (08:00 LT) on 24 July 2016.
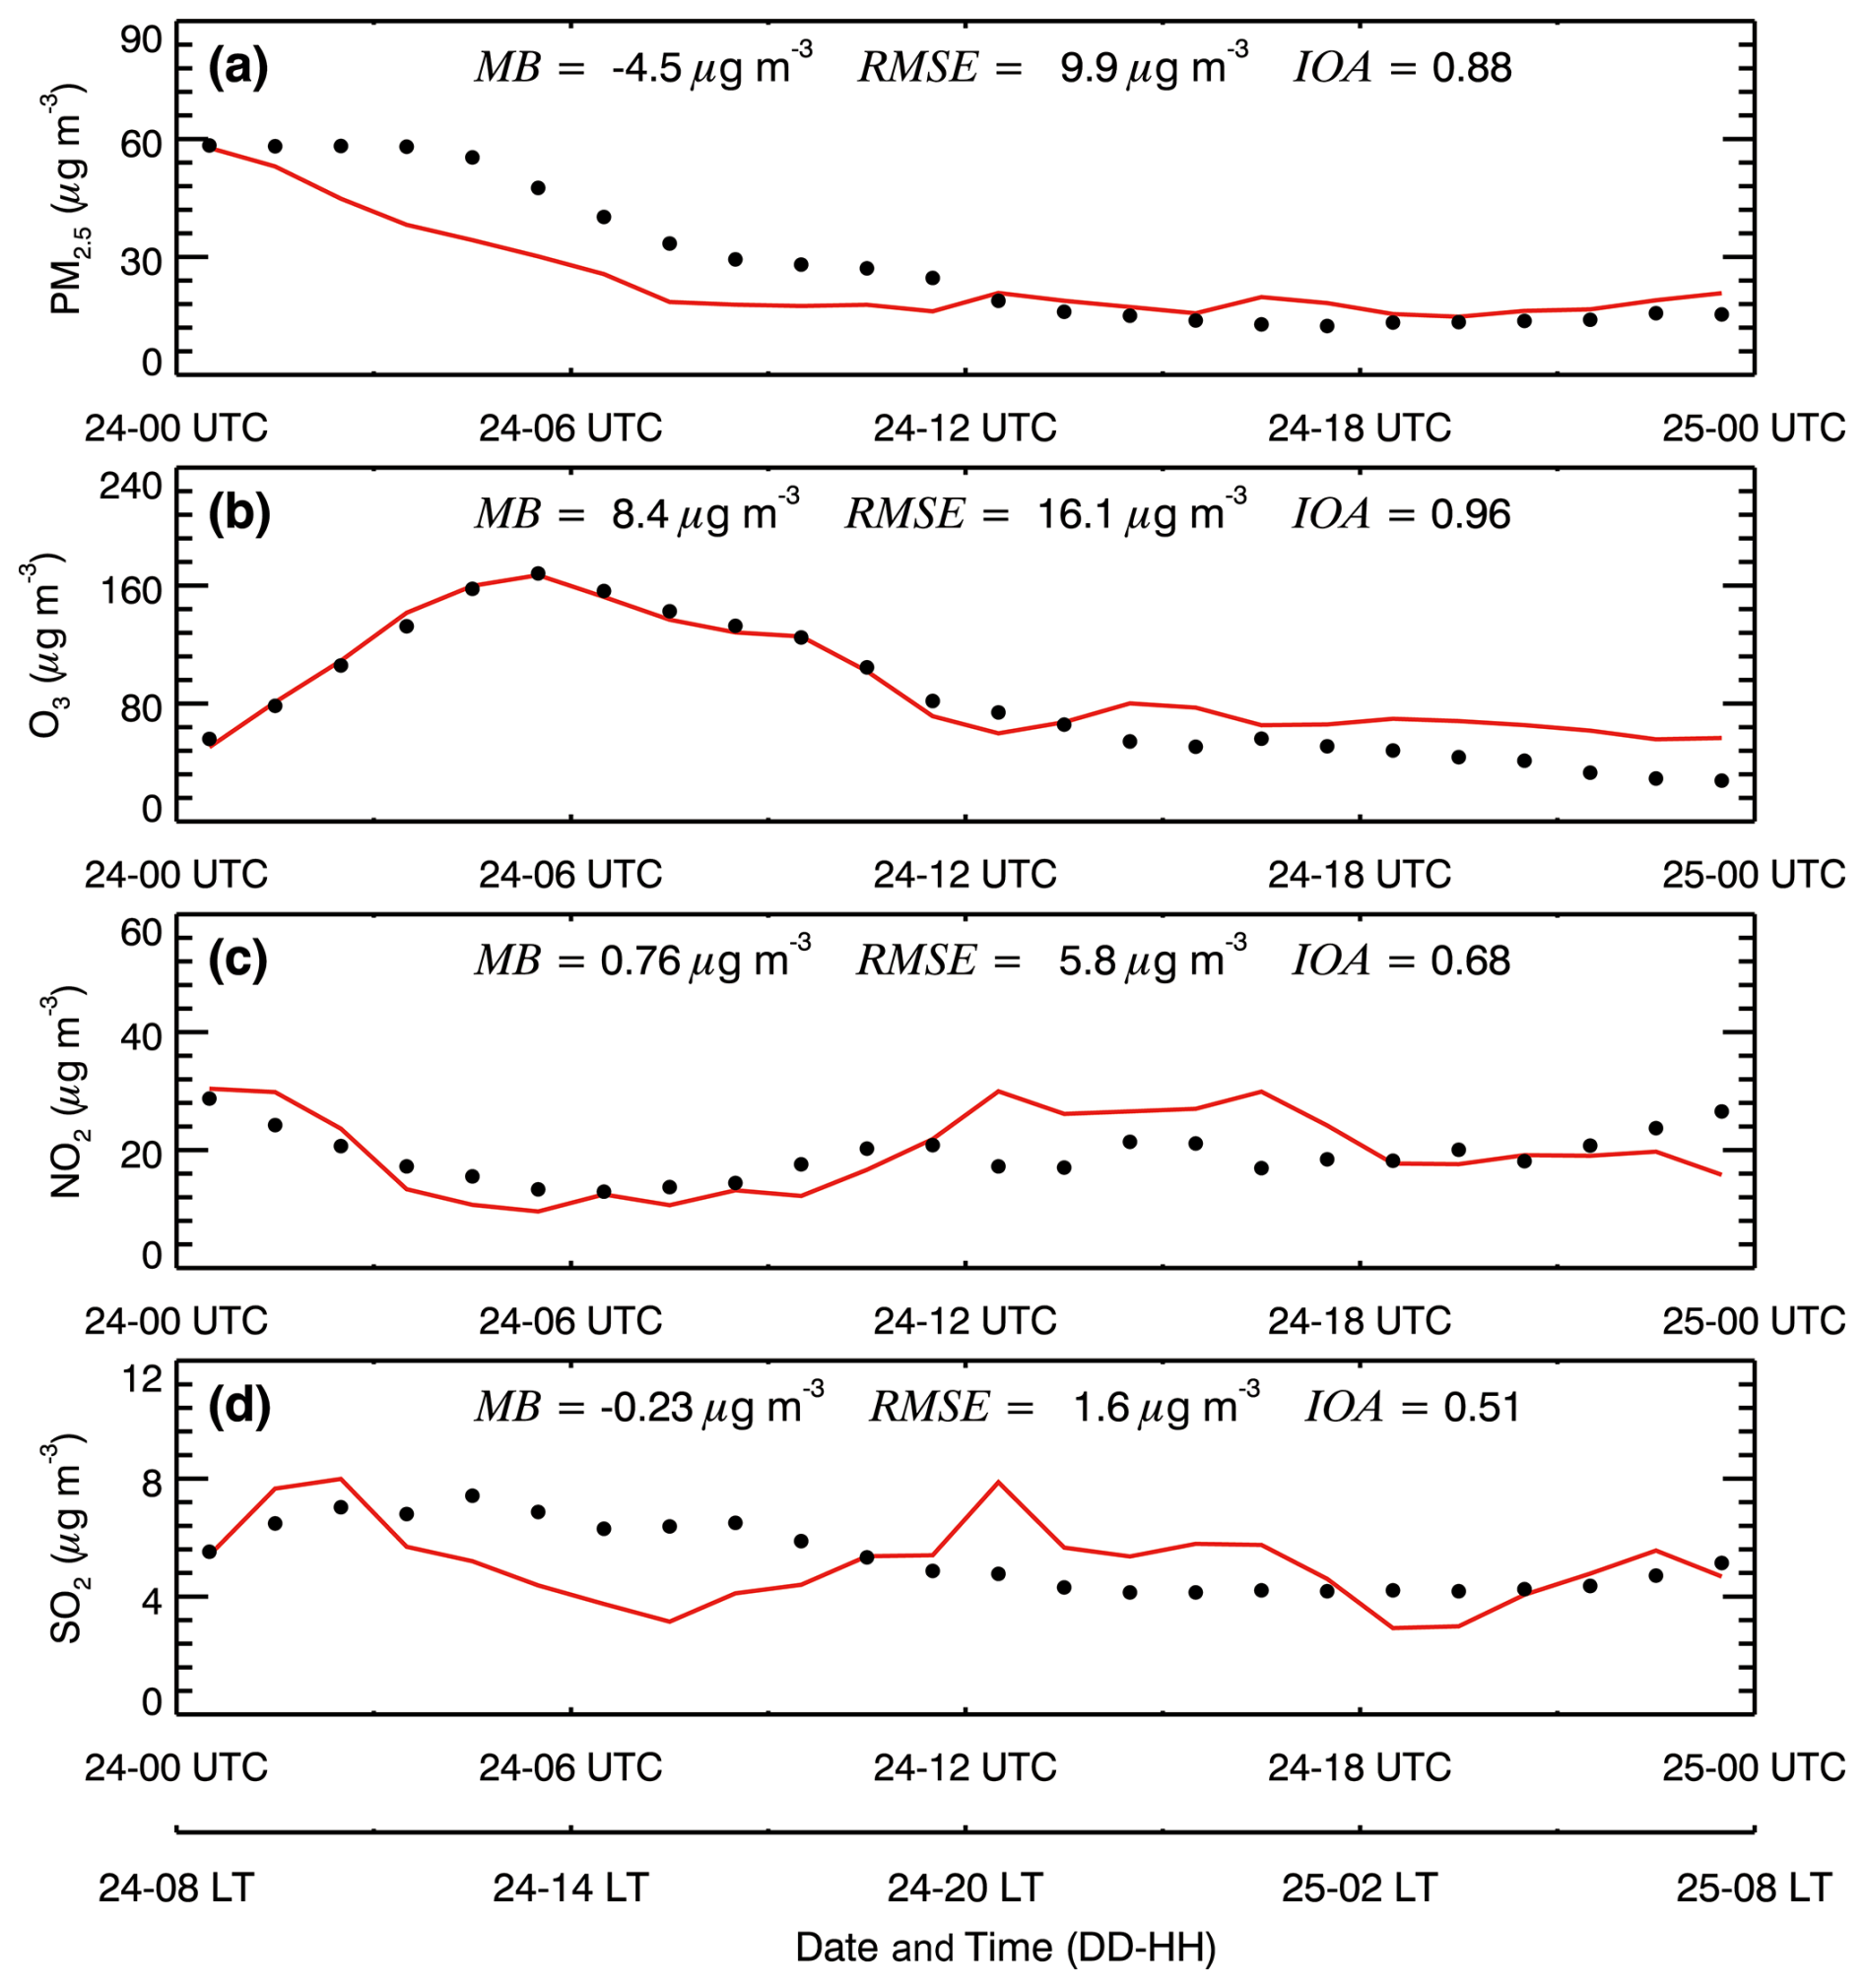
Figure 5Comparison of observed (black dots) and simulated (solid red lines) diurnal profile of near-surface hourly mass concentrations of (a) PM2.5, (b) O3, (c) NO2, and (d) SO2 averaged at monitoring sites in the GZB on 24 July 2016.
Figure 6 shows the time series of precipitation rates averaged at meteorological sites with rain gauge in the GZB and GZBs on 24 July 2016. The model performs well in simulating the hourly rain rate compared to observations. For example, the enhancement of rain rate from 10:00 to 14:00 UTC (from 18:00 to 22:00 LT) is reproduced, and the rapid falloff from 1400 to 1800 UTC (from 22:00 LT on 24 July to 02:00 LT on 25 July) is simulated. The MB and IOA are −0.03 mm h−1 and 0.98 in the GZB, and −0.01 mm h−1 and 0.96 in the GZBs, respectively. Figure 7 presents the pattern comparison of the daily precipitation in the GZBs. The model generally replicates the precipitation distribution against the observations, for instance, the maximal precipitation center in the central GZB is well simulated. However, there exist considerable underestimation and overestimation of precipitation, showing difficulties in simulating convective rainfall with the model. These discrepancies primarily stem from uncertainties in meteorological field simulations (e.g., moisture transport, vertical wind shear), yet their consistent propagation across all sensitivity experiments minimizes impacts on aerosol effect quantification, as differences between simulations solely reflect aerosol perturbations.
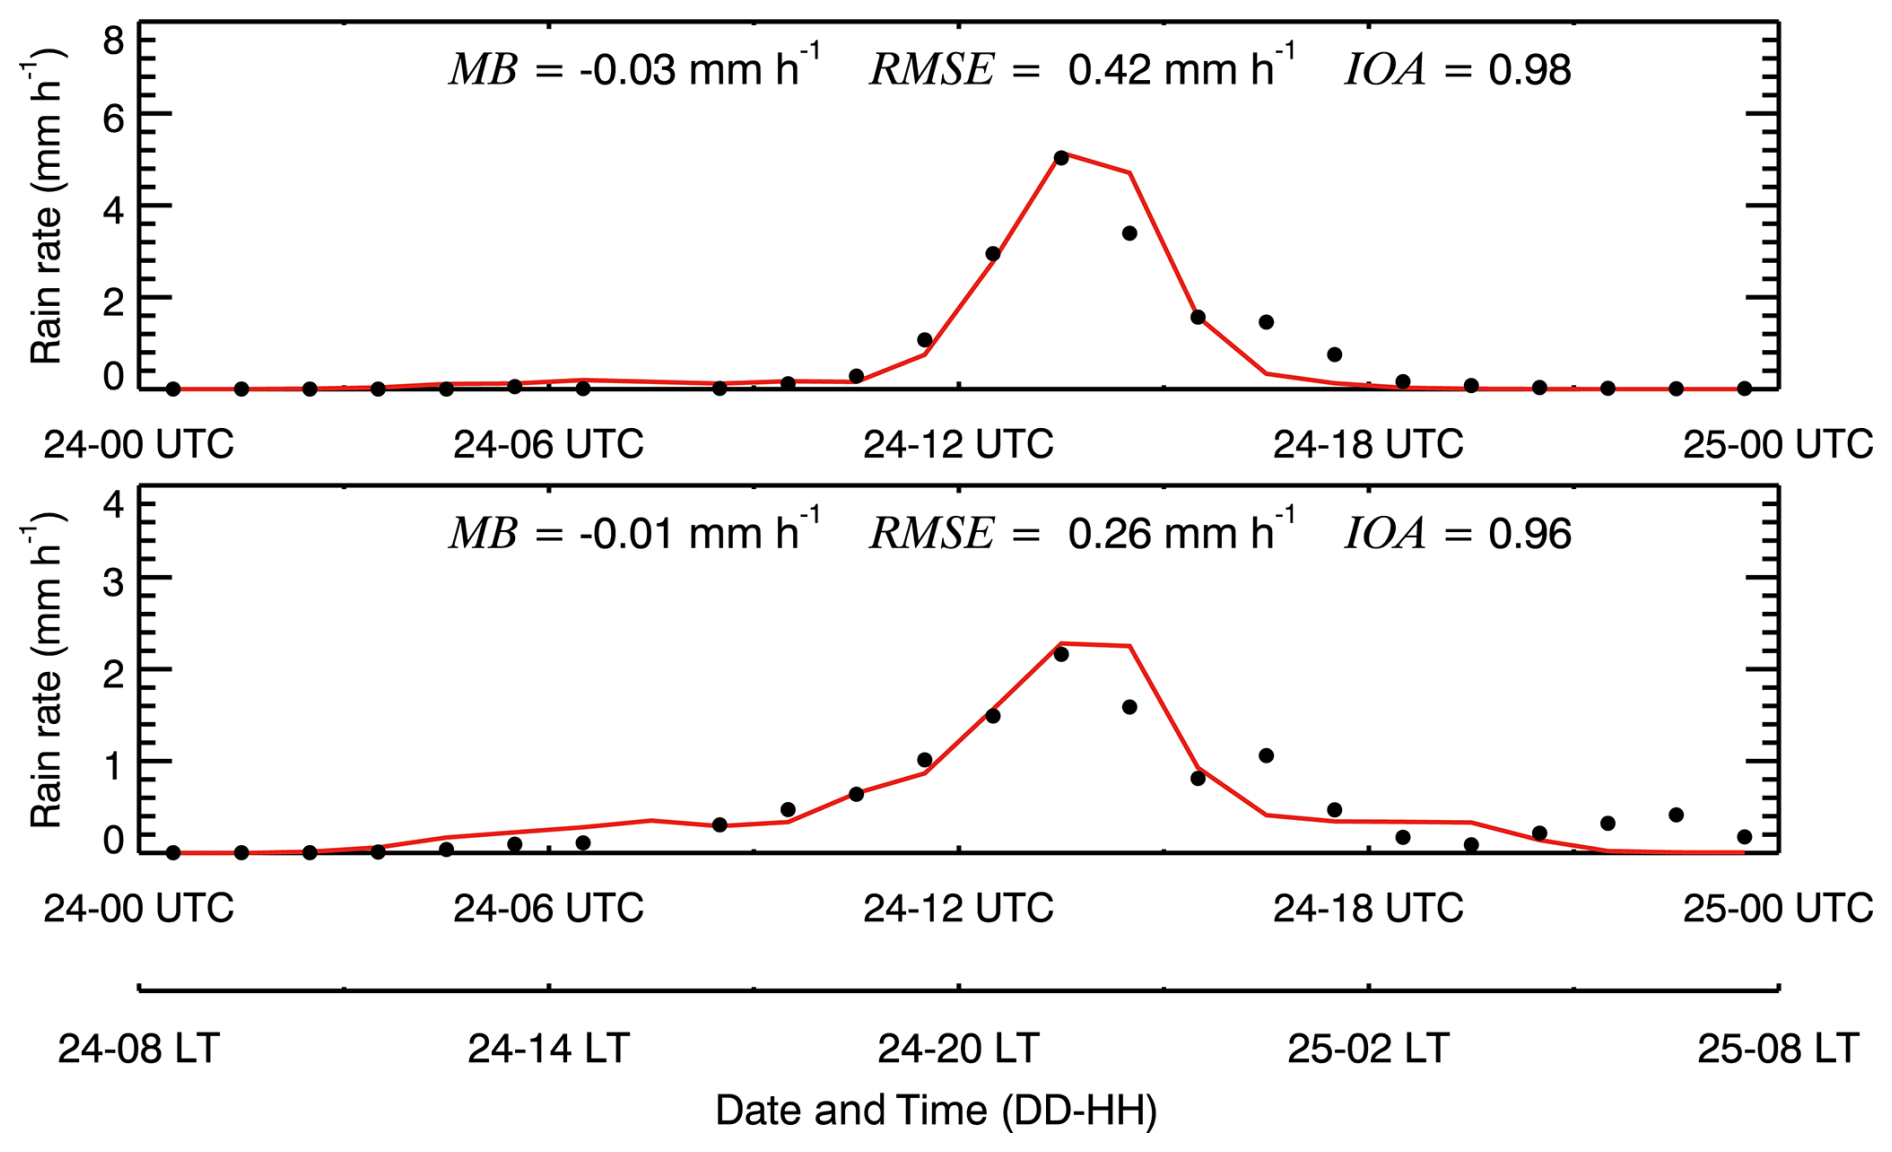
Figure 6Comparison of observed (black dots) and simulated (solid red lines) diurnal profile of hourly rain rate averaged at monitoring sites in the (a) GZB and (b) GZBs on 24 July 2016.
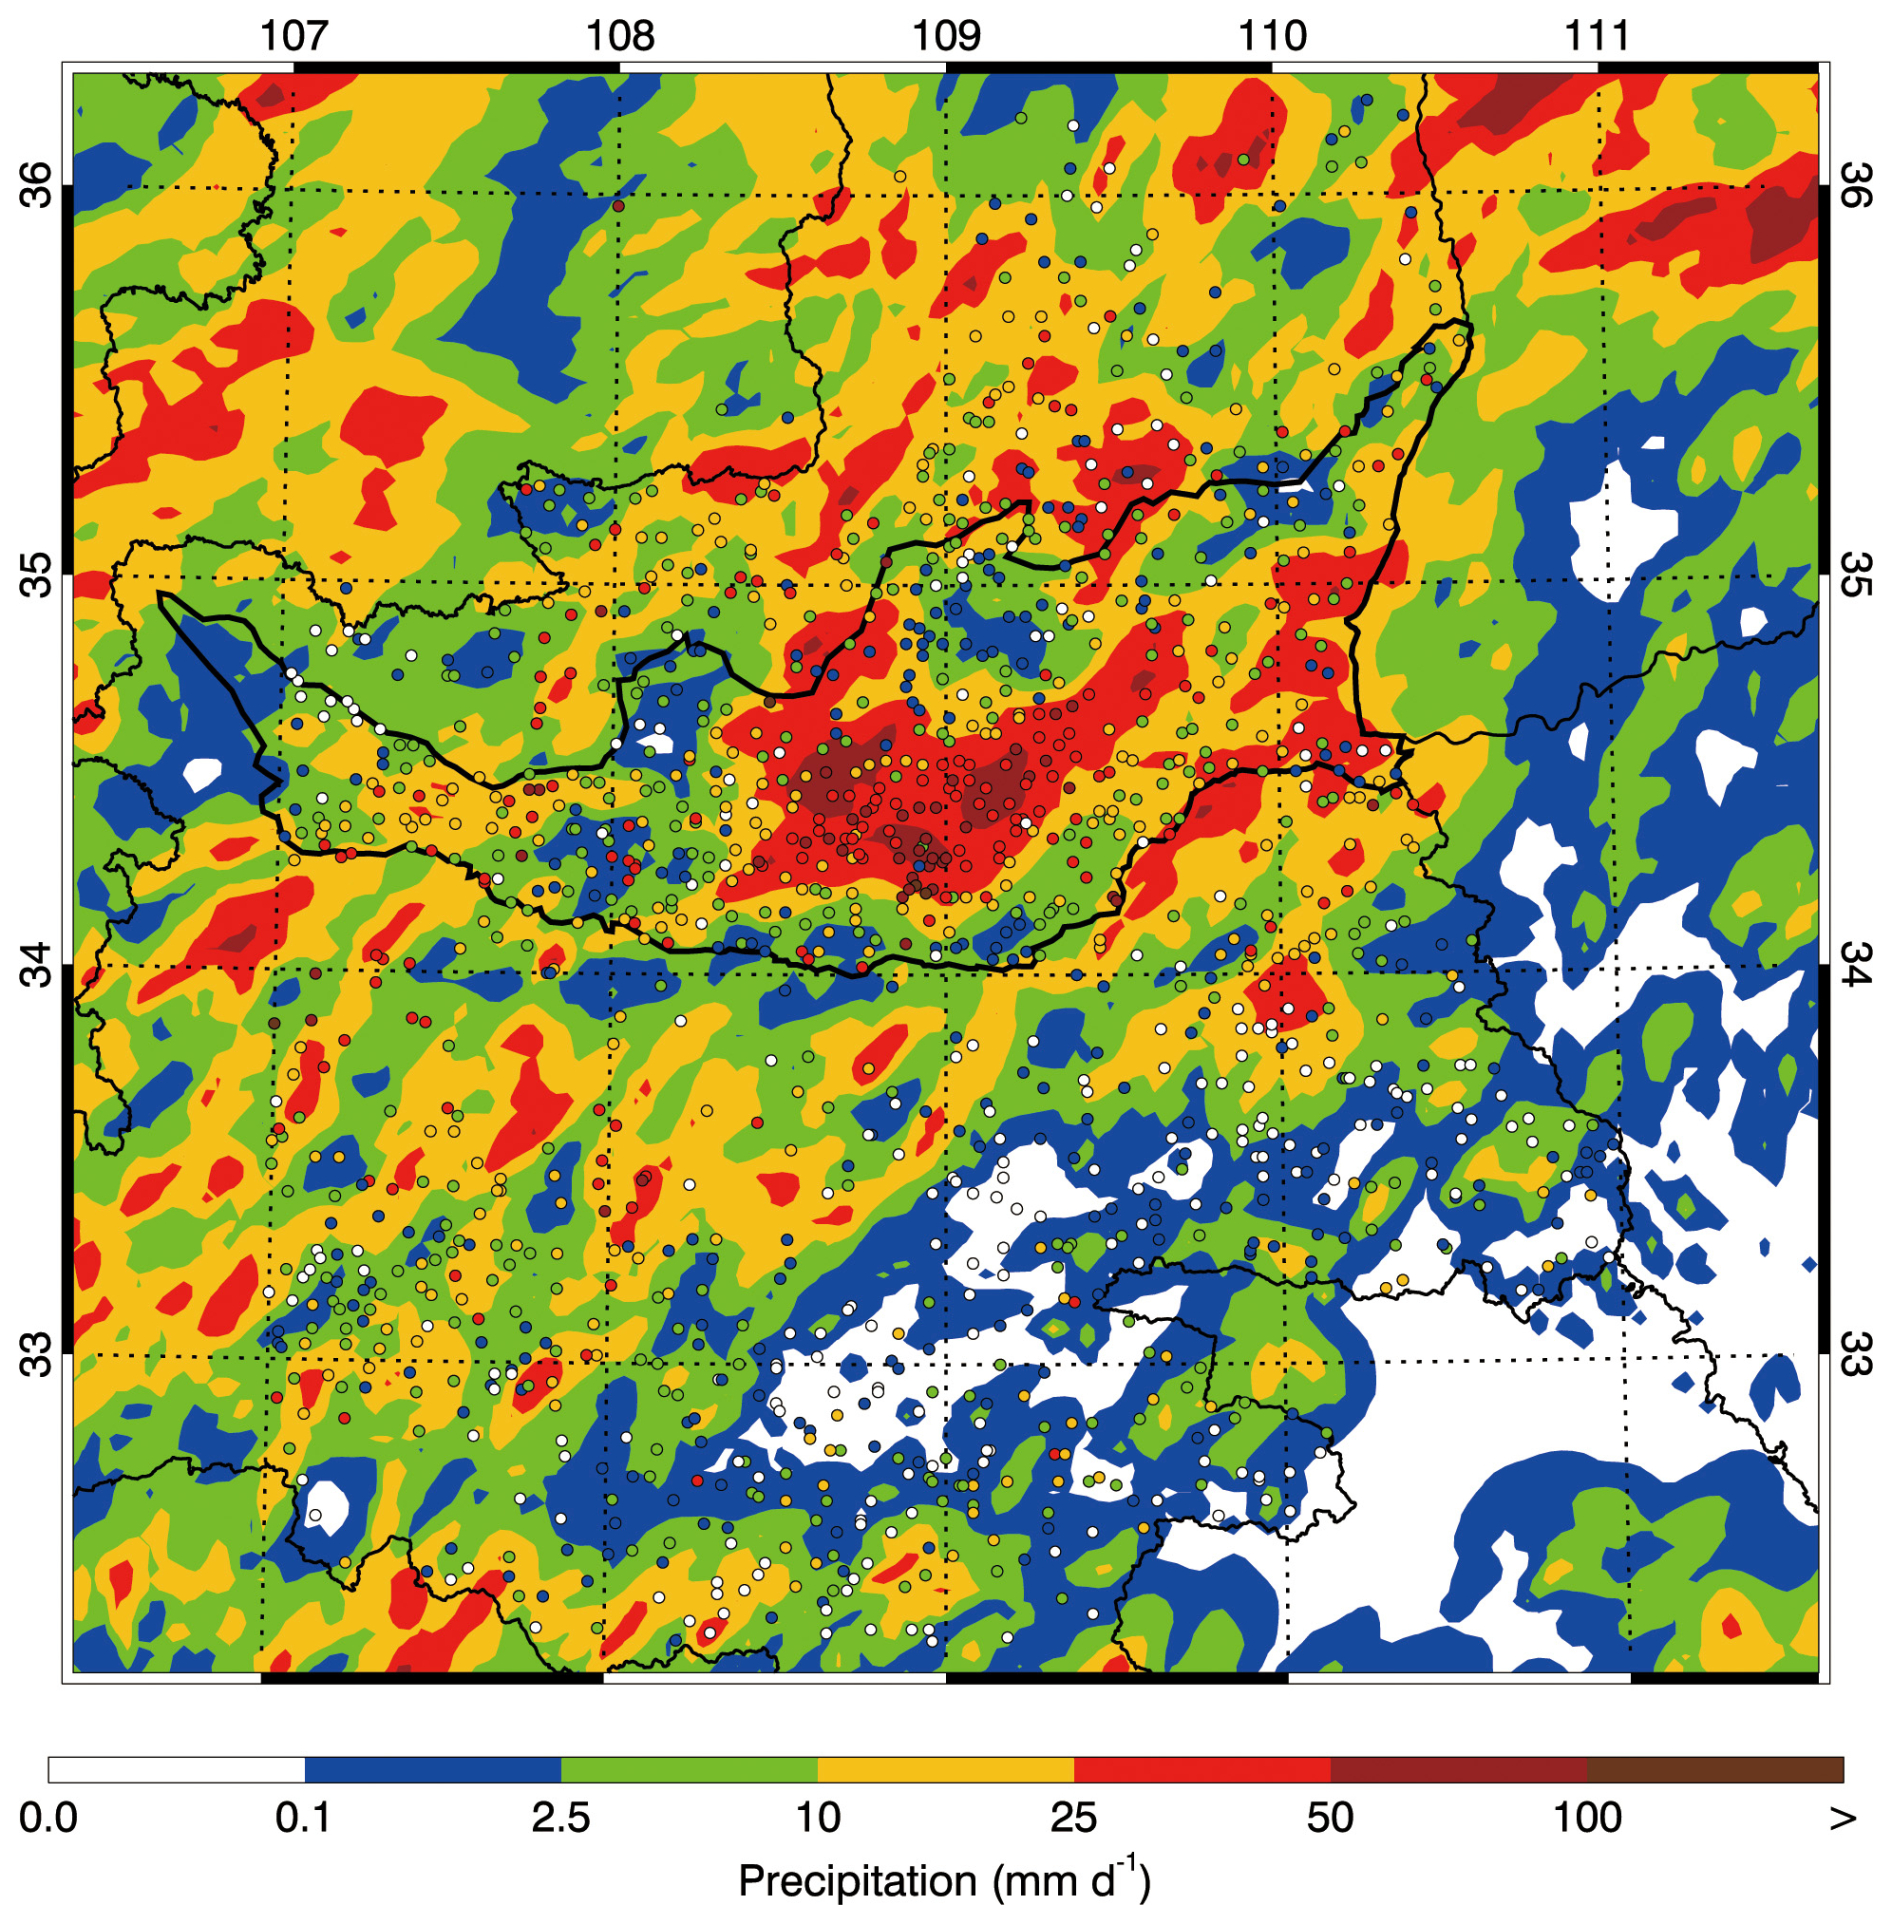
Figure 7Pattern comparisons of simulated (color counters) versus observed (colored dots) accumulative precipitation on 24 July 2016.
3.2 Impacts of ARIs on meteorological fields in the GZB
We first examine ARI effects on the profile of temperature and water vapor in the morning (from 00:00 to 04:00 UTC/from 08:00 to 12:00 LT), since after 04:00 UTC (12:00 LT) near-surface [PM2.5] start decreasing (Fig. 5a) and clouds commence to form and develop, with occurrence of sporadic precipitation in the GZB (Fig. 6a). The cloud optical thickness is far greater than the aerosol optical depth (AOD), so the thermodynamic effect of cloud perturbation caused by ACIs would conceal that of ARIs.
Figure 8a shows the variation of the average near-surface PM2.5 concentration in the morning in the GZB with increasing anthropogenic emissions. Near-surface PM2.5 concentrations monotonically increase with increasing anthropogenic emissions as expected, showing a proportional relationship. With the increasing AESF or anthropogenic emissions, the increasing rate of near-surface [PM2.5] is enhanced (Table S2). For example, when the AESF increases from 0.125 to 1.0, near-surface [PM2.5] increase by 6.6 times. However, when the AESF increases from 1.0 to 8.0, the enhancement of [PM2.5] is 9.4 times, which is mainly caused by the ARI effect which suppresses development of the PBL to increase the near-surface air pollutant level and enhanced the formation of secondary aerosols (Wu et al., 2019). As the major absorbing aerosol in the atmosphere, the near-surface concentration of black carbon also increases with increasing AESF, but its linear relationship with the AESF is better than that of PM2.5 (Fig. 8b). The AOD and absorbing AOD (AAOD) also reveal the similar monotonically increasing relationship with the AESF in the GZB (Fig. 8c–d). When the AESF is 1.0 (CTRL case), the AOD and AAOD are, respectively, approximately 0.44 and 0.04, with a single scattering albedo of approximately 0.91, indicating a moderately strong absorbing atmosphere over the GZB.
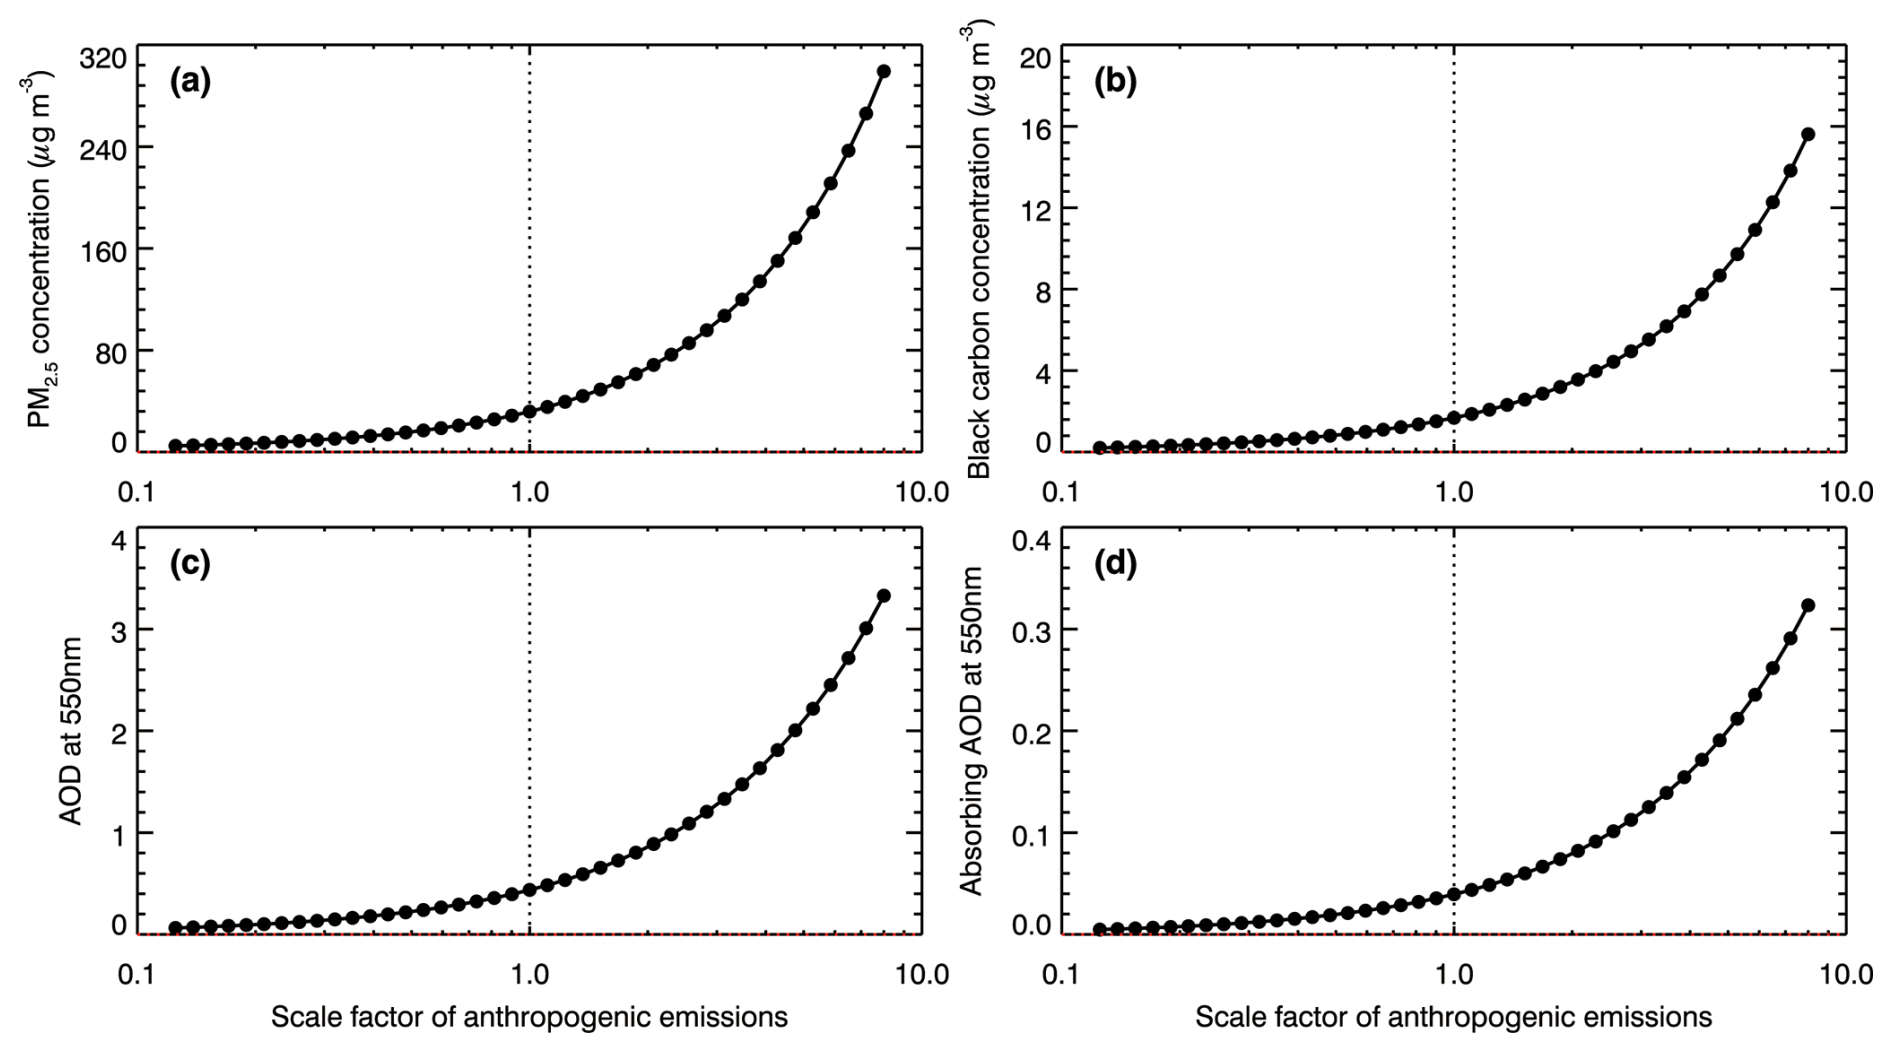
Figure 8Average (a) near-surface PM2.5 (b) black carbon mass concentration, (c) AOD at 550 nm, and (d) absorbing AOD at 550 nm in the GZB from 00:00 to 04:00 UTC (from 08:00 to 12:00 LT), as a function of the scale factor of anthropogenic emissions.
Aerosols in the atmosphere attenuate incident solar radiation by scattering and absorption and further decrease the solar radiation down to the surface, causing less sensible heat flux to lower the temperature of low-level atmosphere. However, aerosol light absorption tends to heat the atmosphere. Figure 9a provides the ARI effect on the average temperature profile from 00:00 to 04:00 UTC (from 08:00 to 12:00 LT) over the GZB by comparing the F_BASE and F_ARI0 under different aerosol conditions. The ARI effect lowers the temperature of the low-level atmosphere, and the temperature decrease becomes increasingly significant with increasing AESF but is not sensitive to height. Absorbing aerosols heat the atmosphere from around 900–1000 to 2000–2500 m and the thickness of the heated atmosphere increases with increasing AESF. Previous studies have also reported such a phenomenon (Ding et al., 2016; Gao et al., 2016; Wilcox et al., 2016). Meanwhile, the perturbation of temperature profile caused by ARIs also suppresses development of the PBL, which does not facilitate dispersion of air pollutants and water vapor in the PBL. Therefore, the ARI effect increases the atmospheric stability, which tends to inhibit cloud formation and development. The ARI effect increases the mass mixing ratio of water vapor in the atmosphere below approximately 500 m and decreases it in the atmosphere from approximately 500 to 1700 m (Fig. 9b). The temperature enhancement caused by absorbing aerosols above the PBL causes a “warm bubble” effect (Fig. 9a) (Wu et al., 2025), which could induce updrafts to promote convection. As shown in Fig. 9c, the heating effect of the ARI generates a secondary upward movement in the atmosphere above approximately 300 m. Interestingly, ARIs exert two opposite effects on cloud formation and development, i.e., a stabilizing effect and a lifting effect, which counteract each other. If the stabilizing effect outweighs the lifting effect, ARIs inhibit cloud formation and development; the effect is opposite when the lifting effect outweighs the stabilizing effect.
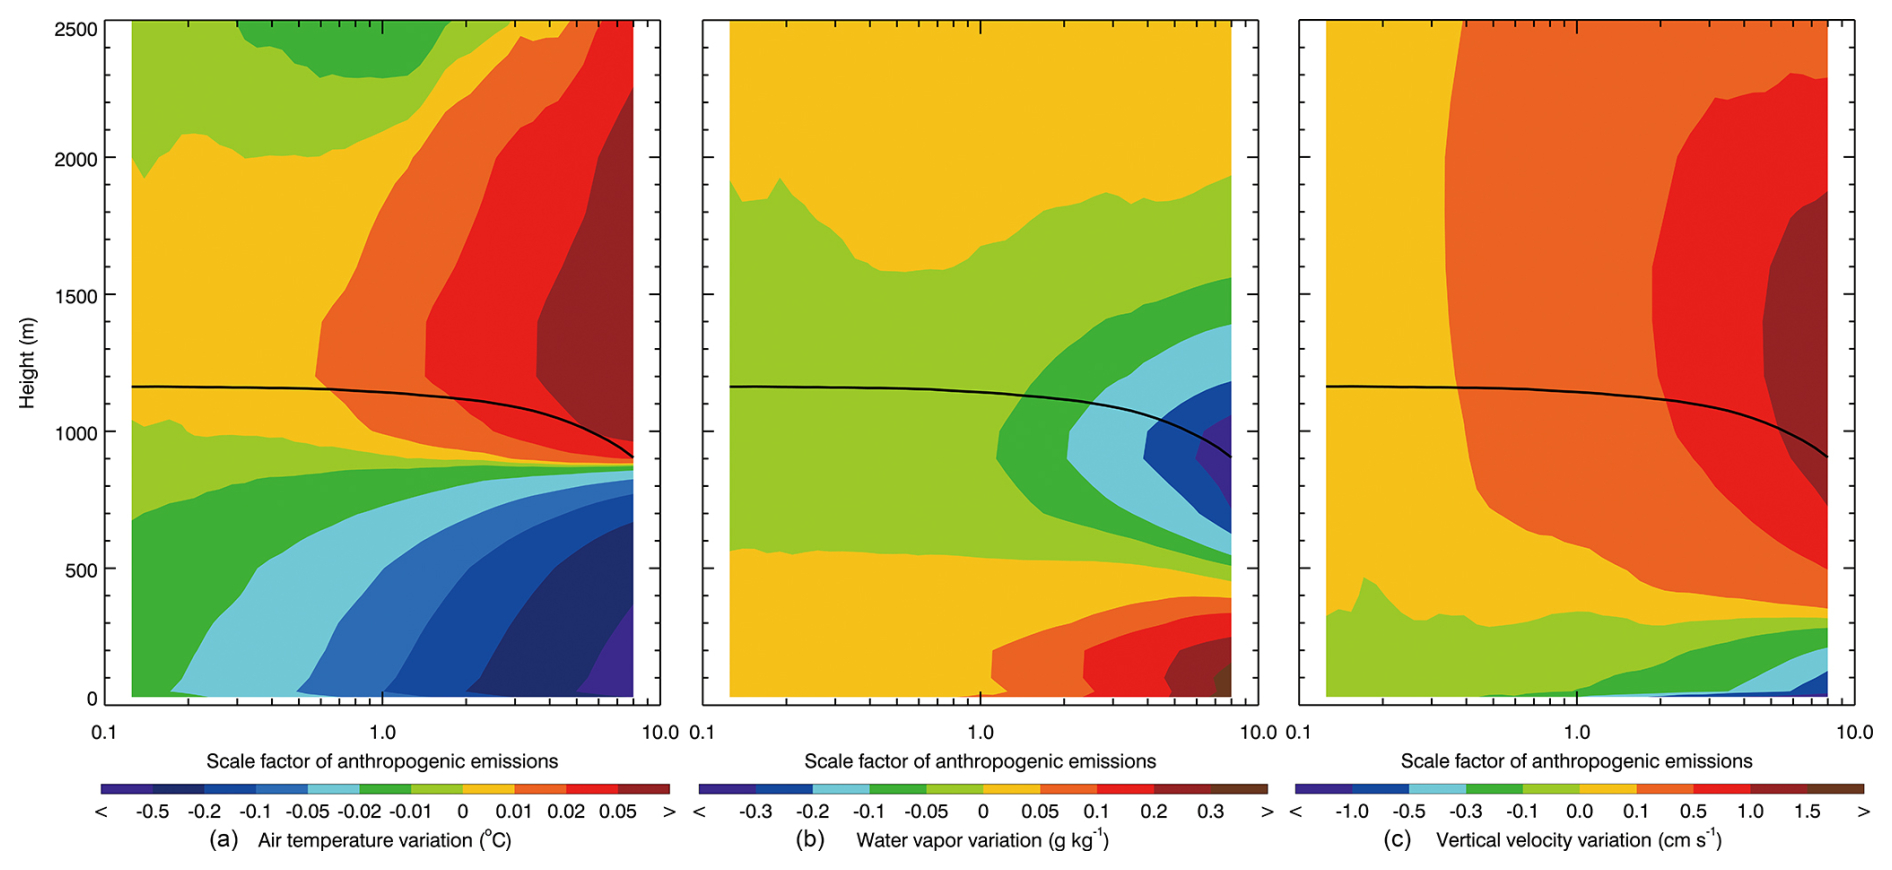
Figure 9Average profile variation of (a) air temperature, (b) water vapor, and (c) vertical velocity in the GZB from 00:00 to 04:00 UTC (from 08:00 to 12:00 LT) caused by ARIs, as a function of the scale factor of anthropogenic emissions. The black line denotes the PBL height.
3.3 Response of cloud properties to changes of aerosols
We next investigate the effect of ACIs and ARIs on cloud properties and precipitation during the main precipitation period from 08:00 to 18:00 UTC (from 16:00 LT on 24 July to 02:00 LT on 25 July). Figure 10a presents the dependence of the p-mean of CDNC over the GZB from 08:00 to 18:00 UTC on the AESF, revealing an increasing of CDNC with increasing AESF in F_BASE and F_ARI0. Increased anthropogenic emissions increase aerosol concentrations, providing more CCN to activate to form cloud droplets, which has been reported in many previous studies (Li et al., 2008, 2009). The ARI effect considerably influences the CDNC with the same AESF (Fig. 10b). When the AESF is less than 0.33, the ARI effect decreases the CDNC. With the AESF exceeding 0.33, the ARI effect increases the CDNC, and the enhancement of the CDNC becomes increasingly significant with the AESF exceeding 1.6.
It has been well established that elevated aerosols increase CDNC and decrease the droplet size, inhibiting collision and coalescence processes, and further leading to more cloud water in the air. In the F_ARI0, the cloud water path (CWP) averaged in the GZB from 08:00 to 18:00 UTC generally increases with the AESF when the AESF is less than 5.4 (Fig. 10c). However, in the F_BASE, the CWP shows an increasing trend with the AESF when the AESF is less than 1.6, and when the AESF exceeds 1.6, the CWP fluctuates in the range between 50 and 56 g m−2. In addition, when the AESF is less than 1.6, the ARI effect increases or decreases the CWP by up to 5 %. (Fig. 10d). When the AESF exceeds 1.6, the ARI effect decreases the CWP by more than 10 %. Apparently, the ARI effect on the CDNC and CWP varies with the AESF. When the AESF is more than 1.6, the ARI effect considerably increases the CDNC but decreases the CWP.
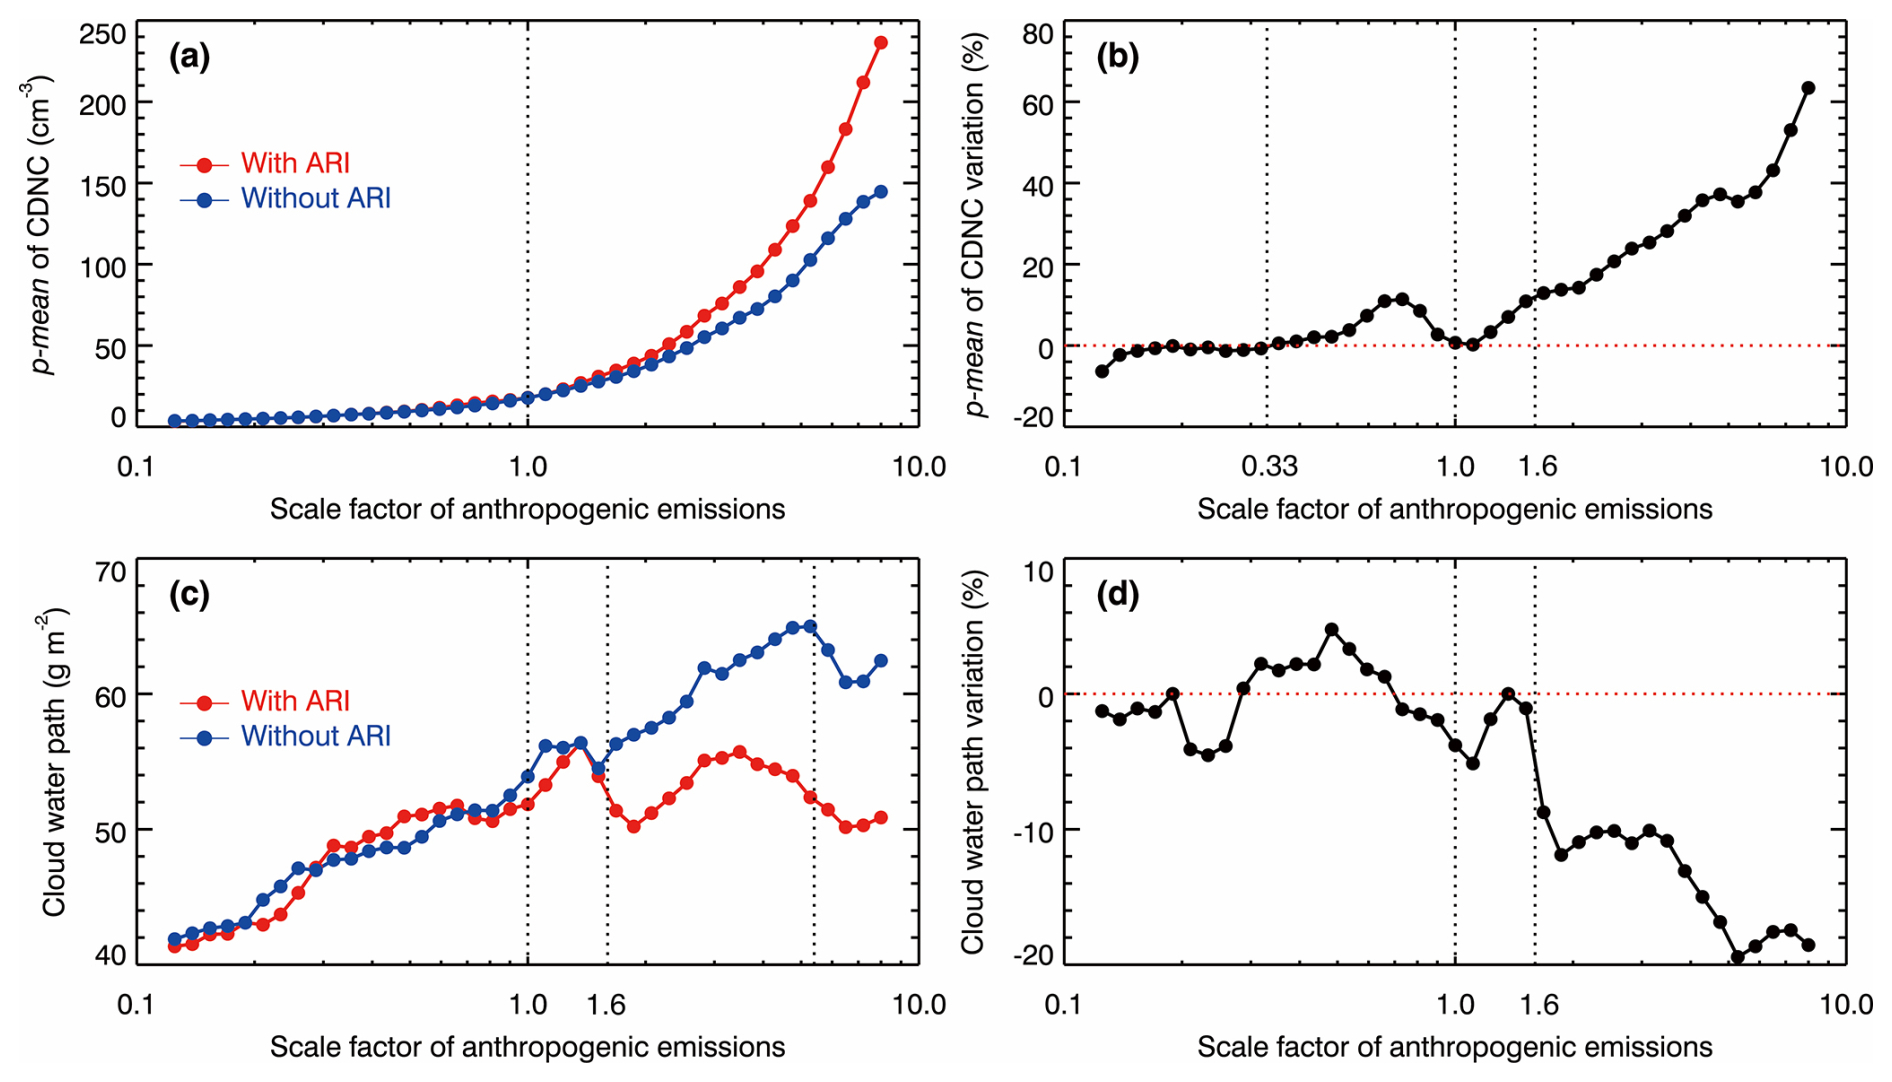
Figure 10(a) p-mean of CDNC, (b) variation of p-mean of CDNC due to ARIs, (c) average CWP, and (d) variation of CWP due to ARIs over the GZB from 08:00 to 18:00 UTC (from 16:00 LT on 24 July to 02:00 LT on 25 July), as a function of the scale factor of anthropogenic emissions.
The ARI effect can be reflected by variations of the updraft in the GZB. Figure 11a shows the variation of the updraft averaged from 08:00 to 18:00 UTC over the GZB with the AESF. In the F_ARI0, increasing AESF or aerosols does not enhance updrafts or even slightly weaken the updrafts, particularly with the AESF exceeding 2.3. Previous studies have proposed that increased aerosols reduce cloud particle sizes to decrease the efficiency of collision and collection, increasing the freezing of cloud droplets and associated latent heat release above the 0 °C isotherm and invigorating convective clouds (Li et al., 2008; Rosenfeld et al., 2008; Chen et al., 2017; Dagan et al., 2017). However, in this study, increased aerosols do not increase the ice-phase hydrometeors which generally show a slight decreasing trend with the AESF in F_ARI0 (Fig. 11c). The main reason for the decreasing trend of updrafts with increasing aerosols is limitation of available water vapor in the development of the mesoscale convective system (MCS). If some convective clouds in an MCS are invigorated by increased aerosols, more cloud water and ice-phase hydrometeors are produced in those clouds, which decreases the available water vapor for other cloud development. With increasing AESF or aerosols, the formation of ice-phase hydrometeors is gradually inhibited due to increasing small cloud droplets, causing a decrease of updrafts (Fig. 11b and d).
The ARI effect modulates the updraft in the GZB with the AESF less than 1.6, and the updraft variation due to the ARI effect is in the range between −4 % to 4 % (Fig. 11b). As discussed above, ARIs cause the stabilizing and lifting effect on convections. When the lifting effect surpasses the stabilizing effect, updrafts are intensified and convection is fostered by ARIs. Menon et al. (2002) reported that absorbing aerosols over Asia can increase low-level convergence and vertical velocity, overcoming the stabilizing effects of ARIs to enhance the summer monsoonal circulation. Li et al. (2016) demonstrated that ARIs induced by absorbing aerosols could vary the thermodynamic stability and convective potentials of the low-level atmosphere, reinforcing the early East Asian summer monsoon. However, when the stabilizing effect outweighs the lifting effect, the value of CAPE is reduced by ARIs and the upward movement is suppressed. When the AESF is more than 1.6, the ARI effect decreases the updraft consistently and the updraft decrease generally becomes increasingly significant with increasing AESF.
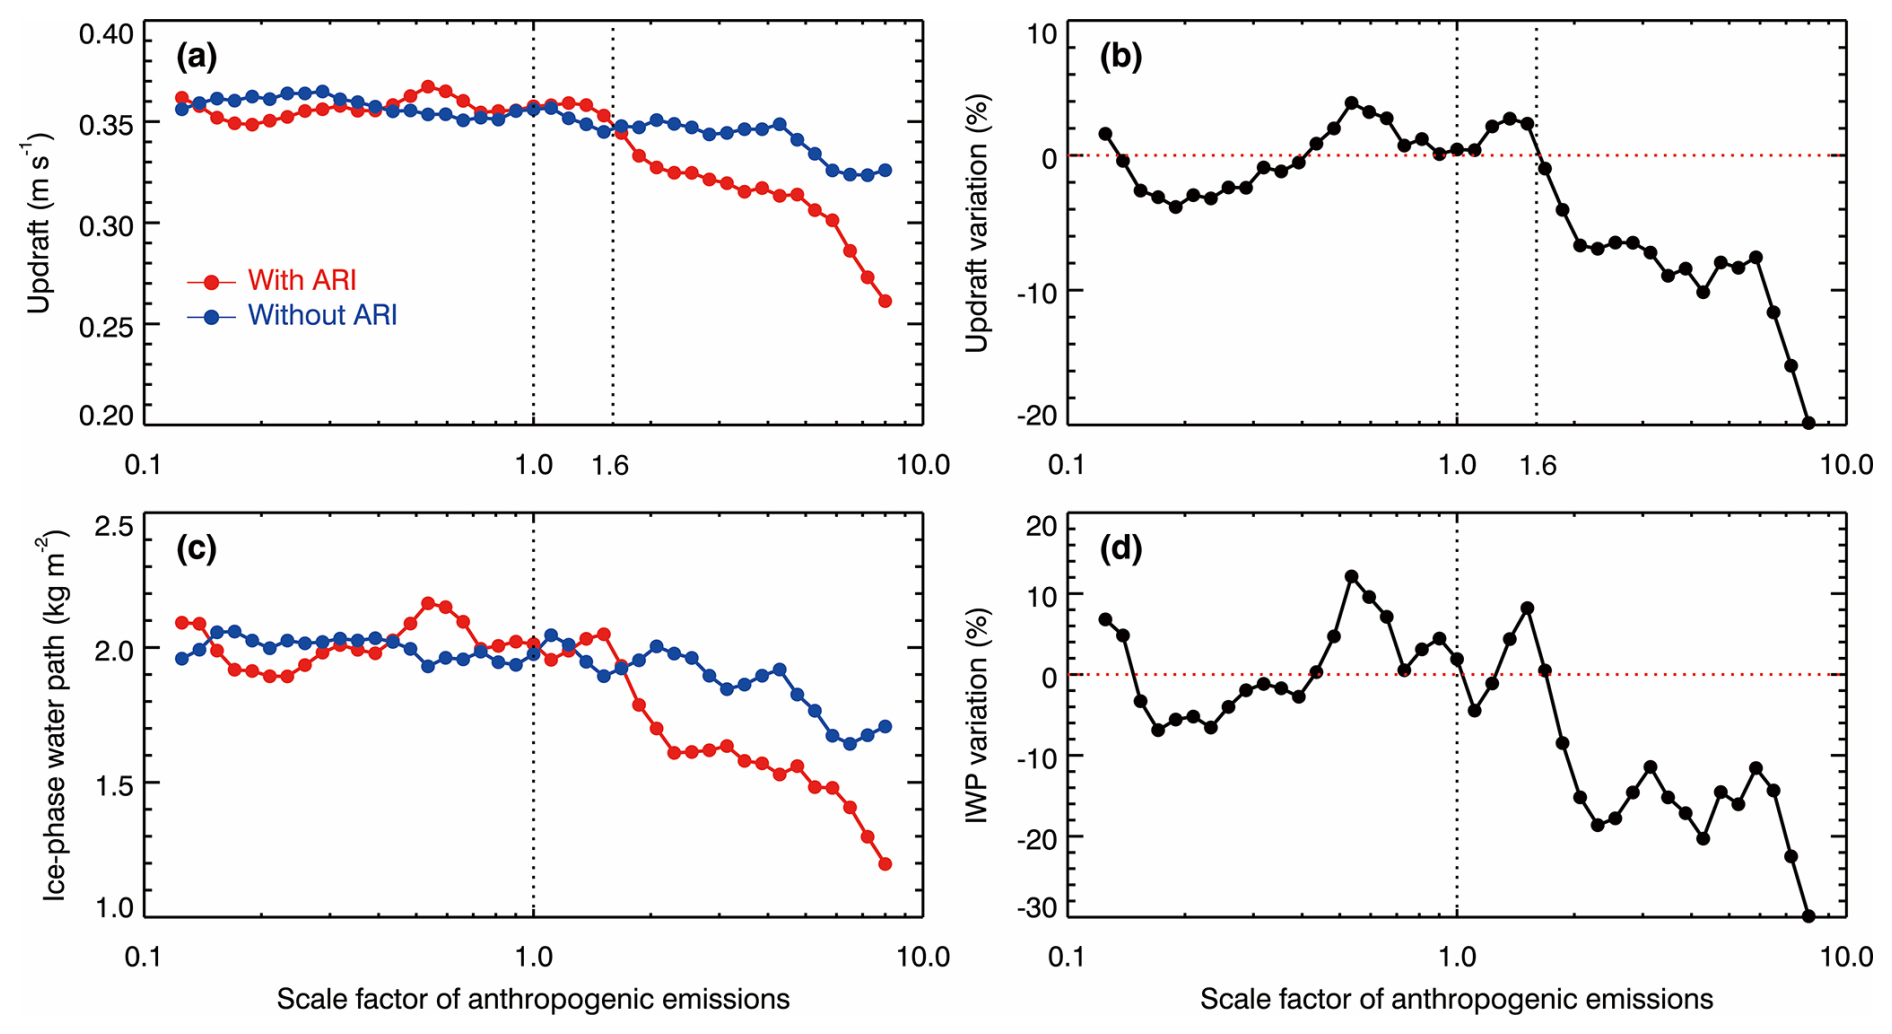
Figure 11Average (a) updraft, (b) variation of updraft due to ARIs, (c) ice water path (IWP), and (d) variation of IWP due to ARIs over the GZB from 08:00 to 18:00 UTC (from 16:00 LT on 24 July to 02:00 LT on 25 July), as a function of the scale factor of anthropogenic emissions.
Note that the variation of CWP caused by ARIs is well correlated with that of updraft in the GZB, with a correlation coefficient of 0.87, showing that ARI-induced enhancement of updrafts favors water vapor condensation on cloud droplets. The ARI-induced perturbations reveal a negative correlation (r = −0.86) between aerosol-mediated CDNC variations and updraft variations. Generally, increased updraft elevates water vapor supersaturation to activate more aerosols, increasing CDNC and further enhancing water vapor condensation. The CDNC is also determined by the conversion efficiency from cloud to rain water, which is dependent on the effective radius of cloud droplets. Figure 12a illustrates the dependence of p-mean of cloud effective radius (Reff) on the AESF in F_BASE and F_ARI0; Reff decreases monotonically with increasing AESF in the two group simulations. In general, increasing Reff decreases the autoconversion from cloud to rain water. With the AESF exceeding 0.24, the ARI effect decreases Reff and the Reff is reduced by over 5 % when the AESF is more than 1.6 (Fig. 12b). The variation of CDNC due to ARIs is highly correlated with that of Reff, with a correlation coefficient of approximately −0.98.
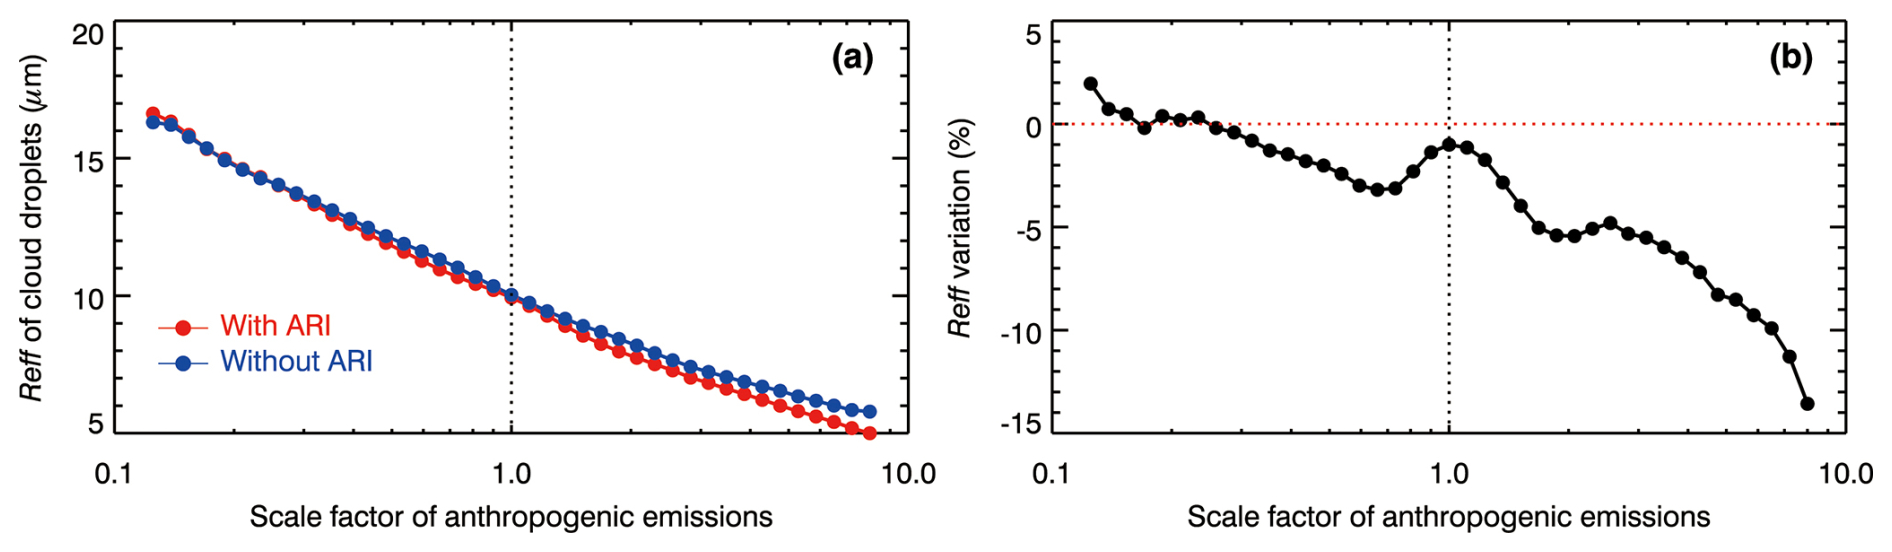
Figure 12Average (a) Effective radius (Reff) of cloud droplets and (b) variation of Reff due to ARIs over the GZB from 08:00 to 18:00 UTC (from 16:00 LT on 24 July to 02:00 LT on 25 July), as a function of the scale factor of anthropogenic emissions.
3.4 Aerosol effects on precipitation
Figure 13a provides the variation of the average daily precipitation in the GZB with the AESF in F_BASE and F_ARI0. When ARIs are excluded or only ACIs are considered in F_ARI0, the daily precipitation shows a nonlinear relationship with the AESF. When the AESF is less than approximately 2.4, the precipitation is not sensitive to the AESF, and does not show either increasing or decreasing trend with the AESF, fluctuating in the range between 15.0 and 16.0 mm d−1. With the AESF exceeding 2.4, the precipitation generally shows a decreasing trend with the AESF. In the F_BASE with the ARI effect, the precipitation also shows fluctuation with the AESF less than 2.4, but the fluctuation amplitude is more significant than that in F_ARI0, in the range between 14.0 and 17.0 mm d−1. When the AESF is more than 2.4, the precipitation decreases rapidly with increasing AESF.
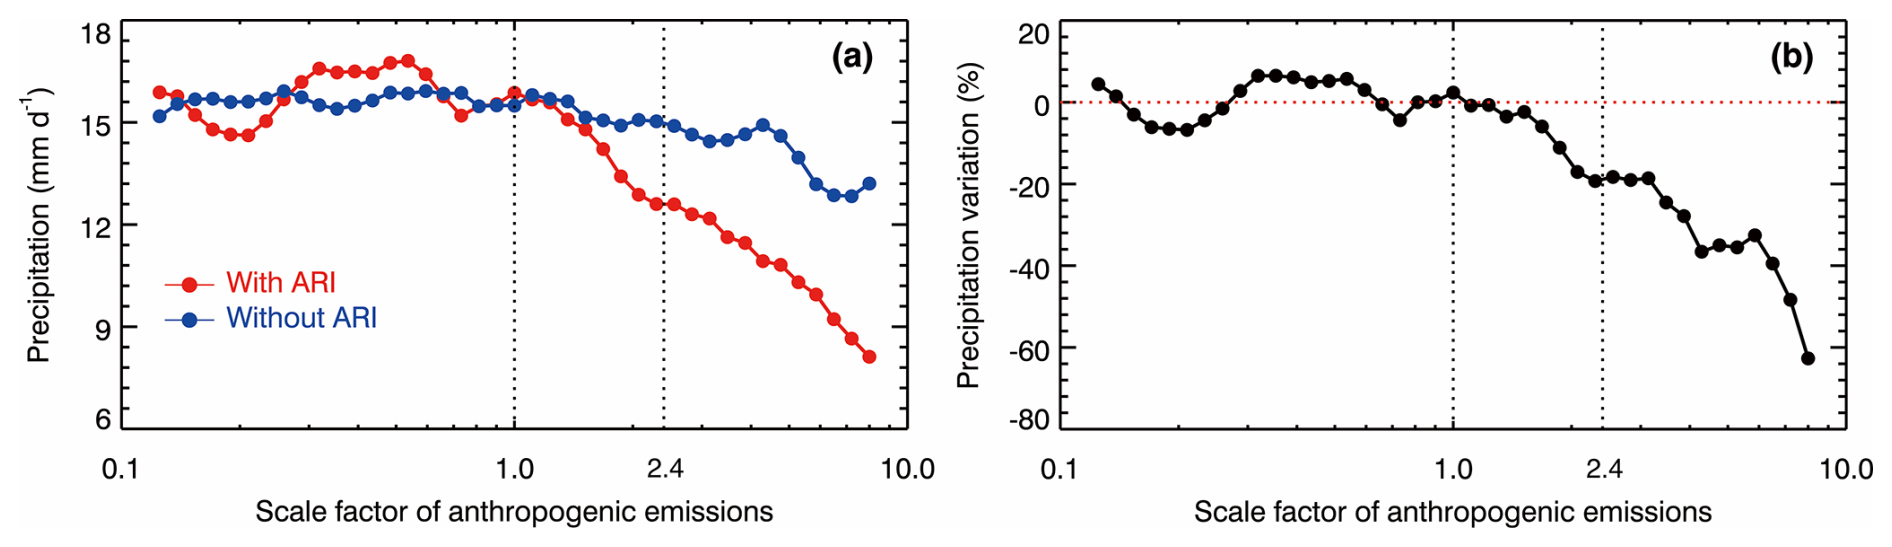
Figure 13Average (a) accumulative precipitation and (b) variation of precipitation due to ARIs in the GZB on 24 July 2016, as a function of the scale factor of anthropogenic emissions.
Multifarious measurements and numerous modeling simulations have revealed that increased aerosols invigorate convective clouds and enhance precipitation (Cerveny and Balling, 1998; Shepherd and Burian, 2003; Khain et al., 2005; Lin et al., 2006; Tao et al., 2007; Li et al., 2008; Lee et al., 2018). Recent study has demonstrated aerosol-induced nonlinear regulation of convective precipitation-top heights via phase-change energy partitioning, showing invigoration-to-suppression transitions, with negligible near surface rainfall sensitivity due to boundary layer evaporation dominance (Sun et al., 2023). We do not observe significant increasing trend of precipitation with increasing AESF in both F_BASE and F_ARI0. This discrepancy probably stems from the unique dynamical context of our case: the MCS developed under strong synoptic forcing (850 hPa trough and 200 hPa divergence in Fig. 2), where large-scale moisture convergence dominated precipitation production, effectively masking aerosol microphysical effects at moderate loading (AESF < 1.0). In addition, when the AESF is more than 1.0, the decreasing trend of precipitation with increasing AESF becomes significant. Elevated aerosols increase CDNC and cloud water content and reduce droplet size to inhibit autoconversion, enhancing glacier processes to invigorate convection and further precipitation. However, when the droplet size is decreased to a threshold due to increased aerosols, the glacier process is inhibited and convection commences to be weakened, causing a decrease of precipitation. This threshold behavior (AESF > 1.0) emerges only when aerosol-induced microphysical suppression overwhelms the dynamical moisture supply capacity. Although our simulations show that CDNC and CWP increase monotonically with increasing AESF, the total ice-phase hydrometeors and updrafts do not have significant increasing trend with the AESF less than 1.0. When the AESF is more than 1.0, those two variables exhibit a decreasing trend with the AESF. As discussed above, the main reason for this is competition between convective clouds for available water vapor in the MCS.
The precipitation variation caused by the ARI effect fluctuates in the range −7.0 % to 7.0 % with the AESF less than 1.7 (Fig. 13b). When the AESF is more than 1.7, the ARI effect substantially decreases precipitation. The precipitation variation due to ARIs is highly correlated with that of updraft, with a coefficient of 0.94. In addition, the variation direction of the two variables is generally the same, showing that the ARI-induced variation of updraft is the main reason for the precipitation variation.
Figure 14 shows the daily precipitation distribution under different AESFs in the F_ARI0 and F_BASE. Daily precipitation intensity is classified following the China Meteorological Administration standard into five categories: light (0.1–9.9 mm d−1), moderate (10–24.9 mm d−1), heavy (25–49.9 mm d−1), torrential (50–99.9 mm d−1), and downpour (≥ 100 mm d−1) rainfall (Ma et al., 2015), which are visually distinguished in the figure by color. The maximal precipitation center is generally concentrated in the central GZB, but the distribution of heavy and torrential rainfall presents significant changes with increasing AESF. The impact of ARIs on precipitation distribution in the GZB is not very significant when the AESF is less than 1.0. With the AESF exceeding 1.0, the ARI effect significantly decreases the area with heavy and torrential rainfall, particularly with regard to the torrential rainfall. As shown in Fig. 13b, the ARI effect increases the total precipitation in the GZB by approximately 6.5 % with the AESF of 0.35. Comparing Fig. 14d0 and 14d1, the ARI effect also increases considerably the area with heavy rainfall, but the precipitation in the south (the area surrounded by the white rectangle) of the GZB is decreased. The average daily precipitation is 16.7 and 15.8 mm d−1 in the GZB, and 9.6 and 13.9 mm d−1 in the south area with and without the ARI effect, respectively. The grid number with occurrence of heavy and torrential rainfall is 878 and 774 in the GZB with the ARI effect, and 802 and 721 without the ARI effect, respectively. In the south area, the number is 824 and 170 with the ARI effect, and 1125 and 381 without the ARI effect, respectively. When the lifting effect outweighs the stabilizing effect due to ARIs in the GZB, the increased vertical wind speed (as evidenced by enhanced vertical velocities in Fig. 11b) induces the horizontal convergence above the PBL, causing the transport of water vapor from its surroundings, which enhances precipitation in the GZB but reduces precipitation in its surroundings. Additional contributing mechanisms also exist, including but not limited to the effect of ARIs-induced aerosol spatial heterogeneity on thermodynamic-dynamic fields, cloud, and precipitation processes. These complex interactions warrant further investigation through targeted sensitivity experiments.
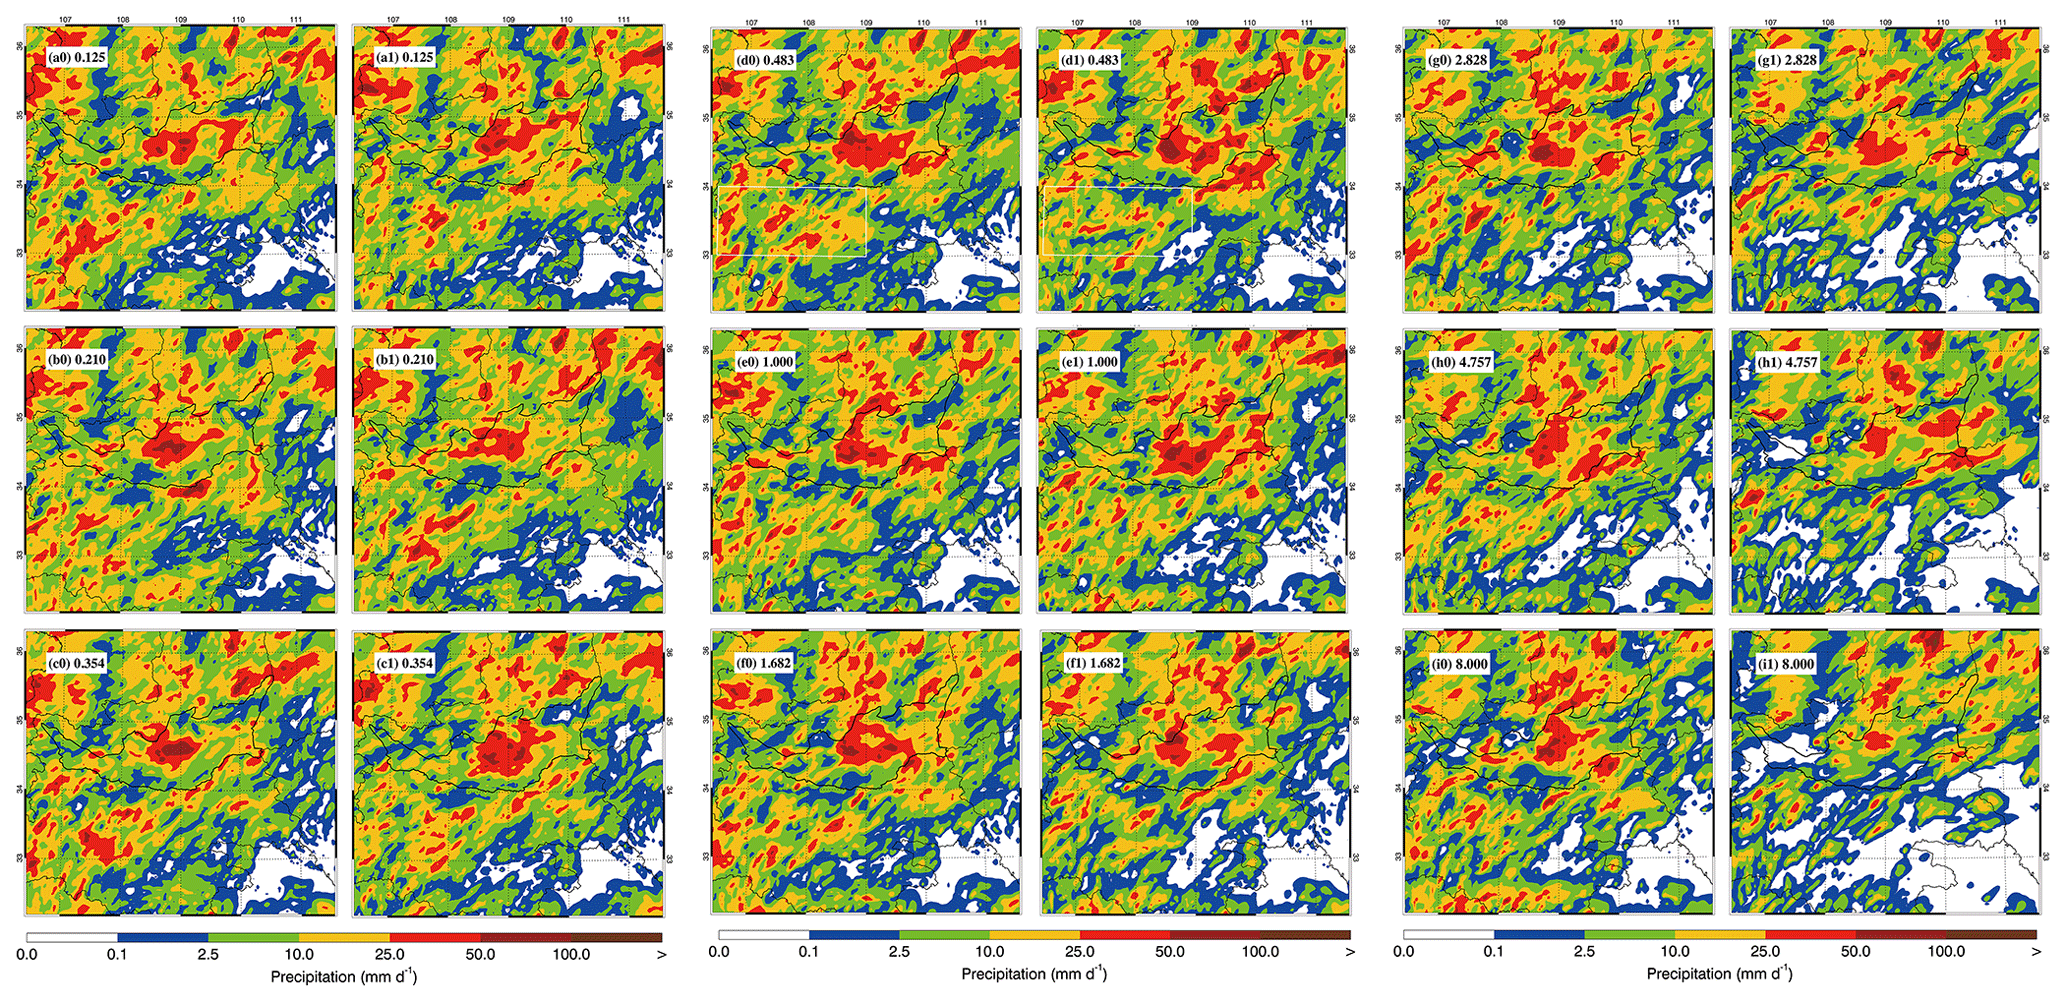
Figure 14Accumulative precipitation distribution on 24 July 2016 for various scale factor of anthropogenic emissions when ARIs are not considered (*0), and (*1) are considered.
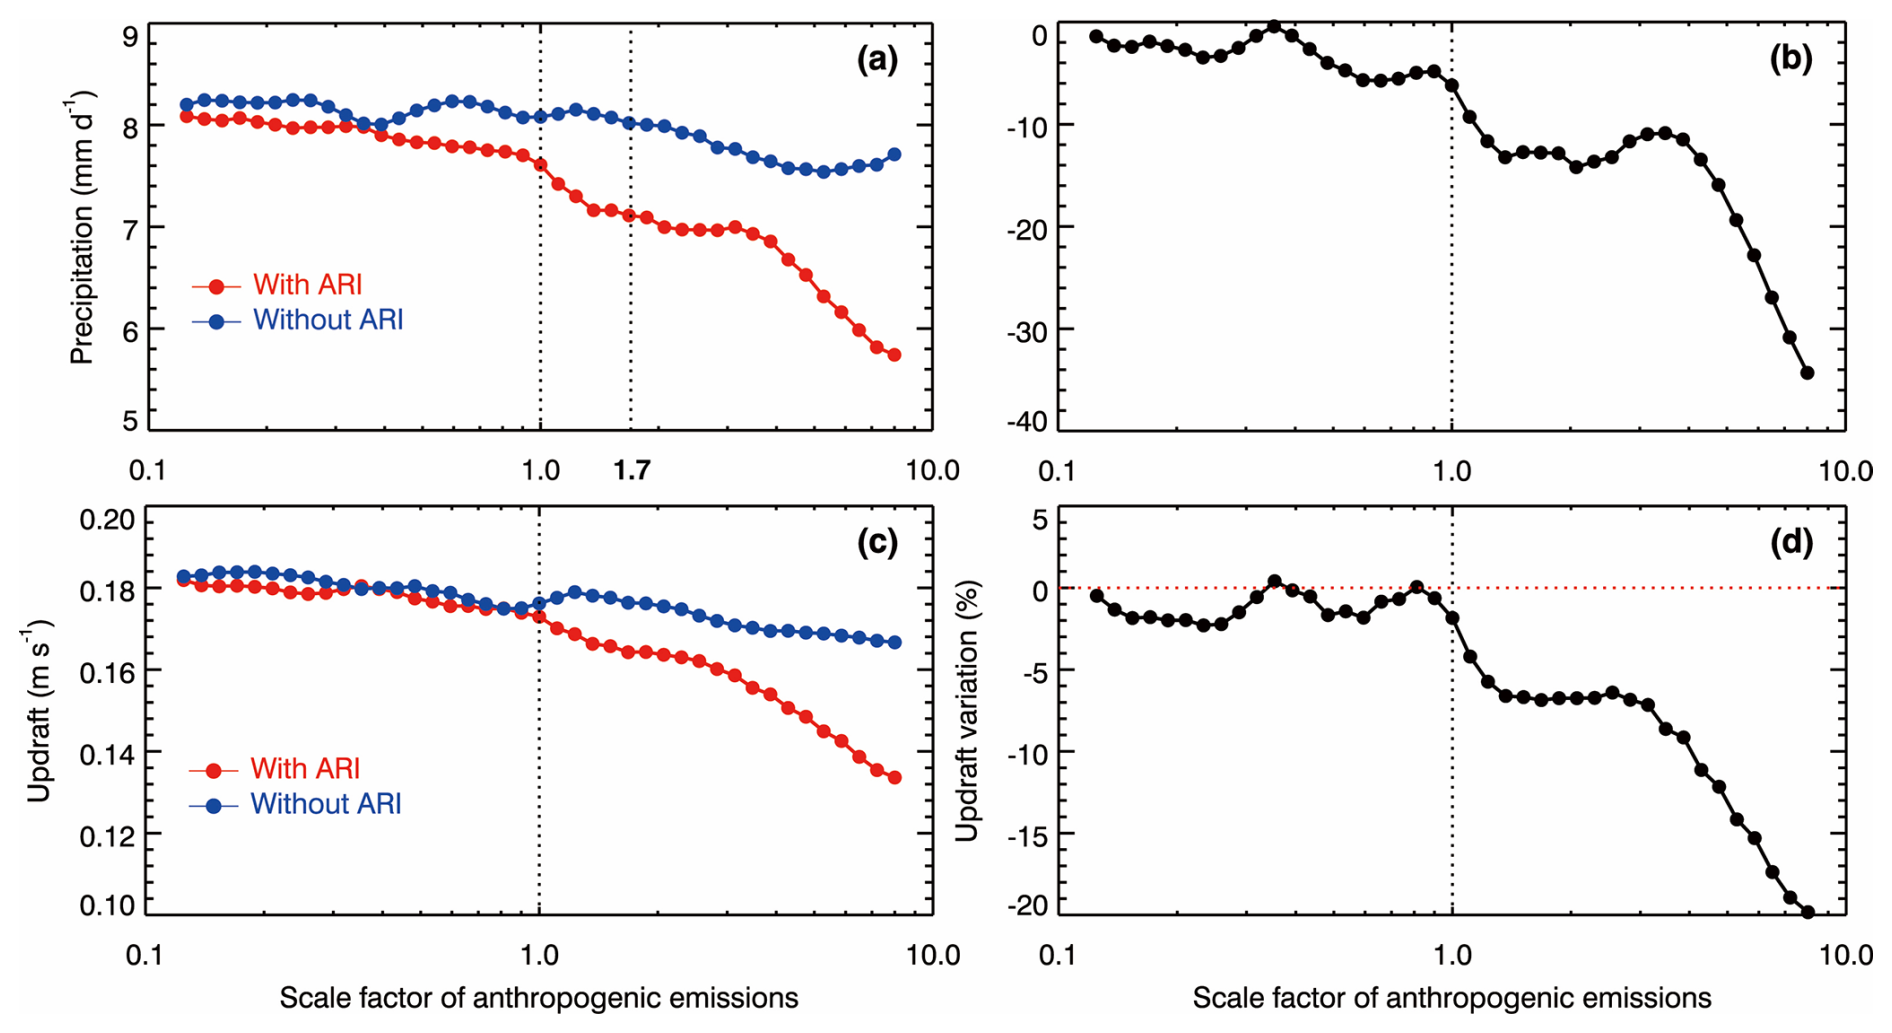
Figure 15Average (a) daily precipitation, and (b) variation of daily precipitation, (c) updraft and (d) variation of updraft due to ARIs from 08:00 to 18:00 UTC (from 16:00 LT on 24 July to 02:00 LT on 25 July) over the whole domain, as a function of the scale factor of anthropogenic emissions.
We further investigate the impact of ACIs and ARIs on the precipitation in the whole domain in which the water vapor input and output are fixed in lateral boundaries. Therefore, the total water vapor mass is conserved or not altered by the aerosol effect in the whole domain during the integration period. In the F_ARI0, when the AESF is less than 1.7, the precipitation varies insignificantly with the AESF, i.e., the mean of the precipitation for the first 26 members is 8.15 mm d−1, but the standard deviation is only 0.01 m d−1 (Fig. 15a). With the AESF exceeding 1.7, the precipitation shows a decreasing trend with the AESF. When the ARI effect is considered in the F_BASE, increasing aerosols consistently decreases the precipitation of the whole domain. The ARI effect also consistently decreases the precipitation with the same AESF, and the precipitation decrease is more than 10 % when the AESF exceeds 1.0 (Fig. 15b). In addition, the lifting effect induced by ARIs also considerably modulates the decreasing trend of precipitation with the AESF. The variation of p-mean of the updraft due to ARIs in the domain is highly correlated with that of the precipitation, with a correlation coefficient of 0.96 (Fig. 15b, d).
An MCS occurred in the GZBs with heavy rainfall on 24 July 2016 and has been investigated using a fully coupled cloud-resolving WRF-Chem model. The synergetic effect of ACIs and ARIs on the precipitation process of the MCS has been assessed by sensitivity studies with various aerosol scenarios through adjusting the anthropogenic emissions.
In general, the WRF-Chem model replicates the temporal variation and spatial distribution of air pollutants well when comparing to measurements in the GZB. The model also performs well in simulating the hourly rain rate and reasonably reproduces the daily precipitation against observations in the GZB and GZBs.
Sensitivity simulations show that ARIs generally cool the atmosphere near the ground surface but heat it above the PBL, causing the stabilizing and lifting effect which exert opposite effects on convection. When ARIs are not considered, the daily precipitation in the GZB is not sensitive to aerosol concentrations when PM pollution is not severe, but shows a decreasing trend with further deterioration of PM pollution. The main reason for a non-increasing trend of the precipitation with increasing aerosols is competition among convective clouds for available water vapor in development of the MCS. Too many small cloud droplets caused by increased aerosols also inhibit the formation of ice-phase hydrometeors to decrease updrafts and further precipitation.
The ARI effect considerably modulates precipitation in the GZB. When the lifting effect outweighs the stabilizing effect, the updraft is enhanced, causing an increase of precipitation in the GZB. However, the effect is opposite when the stabilizing effect outweighs the lifting effect. Furthermore, the ARI effect does not enhance precipitation in the whole domain with the same anthropogenic emission. In addition, the synergetic effect of ACIs and ARIs consistently decreases the precipitation in the whole domain, but ARIs considerably modulate the decreasing trend of the precipitation.
The hourly ambient surface O3, NO2 and PM2.5 mass concentrations are “real-time” released by the Ministry of Environmental Protection, China, on the website http://www.aqistudy.cn/ (last access: 9 August 2024), freely downloaded from http://106.37.208.233:20035/ (last access: 19 September 2024; China MEP, 2013). Precipitation observations at meteorological sites with rain gauge in the GZBs are from the China Meteorological Administration, which can be accessed at https://data.cma.cn/data/cdcdetail/dataCode/A.0012.0001.html (last access: 19 September 2024).
The supplement related to this article is available online at https://doi.org/10.5194/acp-25-10931-2025-supplement.
GL, as the corresponding author, provided the ideas and financial support, verified the conclusions, and revised the paper. NB conducted research, designed the experiments, performed the simulation, processed the data, prepared the data visualization, and prepared the manuscript, with contributions from all authors. XB and YH provided the data and primary data processing and reviewed the manuscript. RW validated the model performance, analyzed the study data, and reviewed the manuscript. YY and LL analyzed the initial simulation data and visualized the model results.
The contact author has declared that none of the authors has any competing interests.
Publisher’s note: Copernicus Publications remains neutral with regard to jurisdictional claims made in the text, published maps, institutional affiliations, or any other geographical representation in this paper. While Copernicus Publications makes every effort to include appropriate place names, the final responsibility lies with the authors.
This work is financially supported by the National Key Research and Development Program of China (grant no. 2022YFF0802502), Naifang Bei acknowledges the National Natural Science Foundation of China (grant no. 41975175) and the Key Research and Development Program of Shaanxi (grant no. 2024SF-ZDCYL-05-05).
This work is financially supported by the National Key Research and Development Program of China (grant no. 2022YFF0802502), the National Natural Science Foundation of China (grant no. 41975175), and the Key Research and Development Program of Shaanxi (grant no. 2024SF-ZDCYL-05-05).
This paper was edited by Zhanqing Li and reviewed by three anonymous referees.
Ackerman, A. S., Toon, O. B., Stevens, D. E., Heymsfield, A. J., Ramanathan, V., and Welton, E. J.: Reduction of tropical cloudiness by soot, Science, 288, 1042–1047, https://doi.org/10.1126/science.288.5468.1042, 2000.
Ackerman, A. S., Toon, O. B., Stevens, D. E., and Coakley Jr., J. A.: Enhancement of cloud cover and suppression of nocturnal drizzle in stratocumulus polluted by haze, Geophys. Res. Lett., 30, 1381, https://doi.org/10.1029/2002GL016634, 2003.
Albrecht, B. A.: Aerosols, cloud microphysics, and fractional cloudiness, Science, 245, 1227–1230, https://doi.org/10.1126/science.245.4923.1227, 1989.
Bei, N., Li, G., Huang, R.-J., Cao, J., Meng, N., Feng, T., Liu, S., Zhang, T., Zhang, Q., and Molina, L. T.: Typical synoptic situations and their impacts on the wintertime air pollution in the Guanzhong basin, China, Atmos. Chem. Phys., 16, 7373–7387, https://doi.org/10.5194/acp-16-7373-2016, 2016a.
Bei, N., Xiao, B., Meng, N., and Feng, T.: Critical role of meteorological conditions in a persistent haze episode in the Guanzhong basin, China, Sci. Total Environ., 550, 273–284, https://doi.org/10.1016/j.scitotenv.2015.12.159, 2016b.
Bei, N., Wu, J., Elser, M., Feng, T., Cao, J., El-Haddad, I., Li, X., Huang, R., Li, Z., Long, X., Xing, L., Zhao, S., Tie, X., Prévôt, A. S. H., and Li, G.: Impacts of meteorological uncertainties on the haze formation in Beijing–Tianjin–Hebei (BTH) during wintertime: a case study, Atmos. Chem. Phys., 17, 14579–14591, https://doi.org/10.5194/acp-17-14579-2017, 2017.
Boucher, O., Randall, D., Artaxo, P., Bretherton, C., Feingold, G., Forster, P., Kerminen, V., Kondo, Y., Liao, H., and Lohmann, U.: Clouds and aerosols, in: Climate change 2013: The physical science basis. Contribution of working group I to the fifth assessment report of the intergovernmental panel on climate change, Cambridge University Press, 571–657, https://hdl.handle.net/11858/00-001M-0000-0018-F5F9-F (last access: 20 September 2024), 2013.
Cerveny, R. S. and Balling, R. C.: Weekly cycles of air pollutants, precipitation and tropical cyclones in the coastal NW Atlantic region, Nature, 394, 561–563, https://doi.org/10.1038/29043, 1998.
Charlson, R. J., Schwartz, S. E., Hales, J. M., Cess, R. D., Coakley Jr., J. A., Hansen, J. E., and Hofmann, D. J.: Climate forcing by anthropogenic aerosols, Science, 255, 423–430, https://doi.org/10.1126/science.255.5043.423, 1992.
Chen, Q., Fan, J., Yin, Y., and Han, B.: Aerosol impacts on mesoscale convective systems forming under different vertical wind shear conditions, J. Geophys. Res.-Atmos., 125, e2018JD030027, https://doi.org/10.1029/2018JD030027, 2020.
Chen, Q., Koren, I., Altaratz, O., Heiblum, R. H., Dagan, G., and Pinto, L.: How do changes in warm-phase microphysics affect deep convective clouds?, Atmos. Chem. Phys., 17, 9585–9598, https://doi.org/10.5194/acp-17-9585-2017, 2017.
China MEP (Ministry of Environmental Protection, China): Online Monitoring and Analysis Platform of China Air Quality [data set], http://www.aqistudy.cn/ (last access: 9 August 2024), 2013 (in Chinese).
Chou, M. D. and Suarez, M. J.: A solar radiation parameterization for atmospheric studies, in: Technical Report Series on Global Modeling and Data Assimilation (NASA/TM-1999-104606), edited by: Suarez M. J., Goddard Space Flight Center, Greenbelt, Maryland, 15, https://ntrs.nasa.gov/citations/19990060930 (last access: 22 September 2024), 1999.
Chou, M. D., Suarez, M. J., Liang, X. Z., Yan, M. M. H., and Cote, C.: A thermal infrared radiation parameterization for atmospheric studies, in: Technical Report Series on Global Modeling and Data Assimilation (No. NASA/TM-2001-104606), edited by: Suarez M. J., Goddard Space Flight Center, Greenbelt, Maryland, 19, https://ntrs.nasa.gov/citations/20010072848 (last access: 22 September 2024), 2001.
Christensen, M. W., Jones, W. K., and Stier, P.: Aerosols enhance cloud lifetime and brightness along the stratus-to-cumulus transition, P. Natl. Acad. Sci. USA, 117, 17591–17598, https://doi.org/10.1073/pnas.1921231117, 2020.
Dagan, G., Koren, I., Altaratz, O., and Heiblum, R. H.: Time-dependent, non-monotonic response of warm convective cloud fields to changes in aerosol loading, Atmos. Chem. Phys., 17, 7435–7444, https://doi.org/10.5194/acp-17-7435-2017, 2017.
Ding, A. J., Huang, X., Nie, W., Sun, J. N., Kerminen, V. M., Petäjä, T., Su, H., Cheng, Y. F., Yang, X. Q., Wang, M. H., Chi, X. G., Wang, J. P., Virkkula, A., Guo, W. D., Yuan, J., Wang, S. Y., Zhang, R. J., Wu, Y. F., Song, Y., Zhu, T., Zilitinkevich, S., Kulmala, M., and Fu, C. B.: Enhanced haze pollution by black carbon in megacities in China, Geophys. Res. Lett., 43, 2873–2879, https://doi.org/10.1002/2016GL067745, 2016.
Gao, M., Carmichael, G. R., Wang, Y., Saide, P. E., Yu, M., Xin, J., Liu, Z., and Wang, Z.: Modeling study of the 2010 regional haze event in the North China Plain, Atmos. Chem. Phys., 16, 1673–1691, https://doi.org/10.5194/acp-16-1673-2016, 2016.
Garrett, T. J. and Zhao, C.: Increased Arctic cloud longwave emissivity associated with pollution from mid-latitudes, Nature, 440, 787–789, https://doi.org/10.1038/ nature04636, 2006.
Grell, G. A., Peckham, S. E., Schmitz, R., McKeen, S. A., Frost, G., Skamarock, W. C., and Eder, B.: Fully coupled “online” chemistry within the WRF model, Atmos. Environ., 39, 6957–6975, https://doi.org/10.1016/j.atmosenv.2005.04.027, 2005.
Guo, J., Deng, M., Fan, J., Li, Z., Chen, Q., Zhai, P., Dai, Z., and Li, X.: Precipitation and air pollution at mountain and plain stations in northern China: Insights gained from observations and modeling, J. Geophys. Res.-Atmos., 119, 4793–4807, https://doi.org/10.1002/2013JD021161, 2014.
Guo, J., Deng, M., Lee, S. S., Wang, F., Li, Z., Zhai, P., Liu, H., Lv, W., Yao, W., and Li, X.: Delaying precipitation and lightning by air pollution over the Pearl River Delta. Part I: Observational analyses, J. Geophys. Res.-Atmos., 121, 6472–6488, https://doi.org/10.1002/2015JD023257, 2016.
Guo, J., Liu, H., Li, Z., Rosenfeld, D., Jiang, M., Xu, W., Jiang, J. H., He, J., Chen, D., Min, M., and Zhai, P.: Aerosol-induced changes in the vertical structure of precipitation: a perspective of TRMM precipitation radar, Atmos. Chem. Phys., 18, 13329–13343, https://doi.org/10.5194/acp-18-13329-2018, 2018.
Horowitz, L. W., Walters, S., Mauzerall, D. L., Emmons, L. K., Rasch, P. J., Granier, C., Tie, X., Lamarque, J.-F., Schultz, M. G., Tyndall, G. S., Orlando, J. J., and Brasseur, G. P.: A global simulation of tropospheric ozone and related tracers: Description and evaluation of MOZART, version 2, J. Geophys. Res. Atmos., 108, 4784, https://doi.org/10.1029/2002JD002853, 2003.
Huang, X. and Ding, A.: Aerosol as a critical factor causing forecast biases of air temperature in global numerical weather prediction models, Sci. Bull., 66, 1917–1924, https://doi.org/10.1016/j.scib.2021.05.009, 2021.
IPCC: Climate Change 2013: The Physical Science Basis. Contribution of working group I to the fifth assessment report of IPCC the intergovernmental panel on climate change, Cambridge University Press, 1535, https://doi.org/10.1017/CBO9781107415324, 2013.
Jiang, M., Li, Z., Wan, B., and Cribb, M.: Impact of aerosols on precipitation from deep convective clouds in eastern China, J. Geophys. Res.-Atmos., 121, 9607–9620, https://doi.org/10.1002/2015JD024246, 2016.
Jiang, J. H., Su, H., Huang, L., Wang, Y., Massie, S., Zhao, B., Omar, A., and Wang Z.: Contrasting effects on deep convective clouds by different types of aerosols, Nat. Commun., 9, 3874, https://doi.org/10.1038/s41467-018-06280-4, 2018.
Kaufman, Y. J. and Koren, I.: Smoke and pollution aerosol effect on cloud cover, Science, 313, 655–658, https://doi.org/10.1126/science.1126232, 2006.
Khain, A., Rosenfeld, D., and Pokrovsky, A.: Aerosol impact on the dynamics and microphysics of deep convective clouds, Q. J. Roy. Meteor. Soc., 131, 2639–2663, https://doi.org/10.1256/qj.04.62, 2005.
Khain, A. P., BenMoshe, N., and Pokrovsky, A.: Factors determining the impact of aerosols on surface precipitation from clouds: An attempt at classification, J. Atmos. Sci., 65, 1721–1748, https://doi.org/10.1175/2007JAS2515.1, 2008.
Koren, I., Kaufman, Y. J., Remer, L. A., and Martins, J. V.: Measurement of the effect of Amazon smoke on inhibition of cloud formation, Science, 303, 1342–1345, https://doi.org/10.1126/science.1089424, 2004.
Lau, K. M., Ramanathan, V., Wu, G. X., Li, Z., Tsay, S. C., Hsu, C., Sikka, R., Holben, B., Lu, D., Tartari, G., Chin, M., Koudelova, P., Chen, H., Ma, Y., Huang, J., Taniguchi, K., and Zhang, R.: The Joint Aerosol–Monsoon Experiment: A new challenge for monsoon climate research, B. Am. Meteorol. Soc., 89, 369–384, https://doi.org/10.1175/BAMS-89-3-369, 2008.
Lebo, Z. J. and Morrison, H.: Dynamical effects of aerosol perturbations on simulated idealized squall lines, Mon. Weather Rev., 142, 991–1009, https://doi.org/10.1175/MWR-D-13-00156.1, 2014.
Lee, S. S., Donner, L. J., Phillips, V. T., and Ming, Y.: Examination of aerosol effects on precipitation in deep convective clouds during the 1997 ARM summer experiment, Q. J. Roy. Meteor. Soc., 134, 1201–1220, https://doi.org/10.1002/qj.287, 2008.
Lee, S. S., Kim, B.-G., Li, Z., Choi, Y.-S., Jung, C.-H., Um, J., Mok, J., and Seo, K.-H.: Aerosol as a potential factor to control the increasing torrential rain events in urban areas over the last decades, Atmos. Chem. Phys., 18, 12531–12550, https://doi.org/10.5194/acp-18-12531-2018, 2018.
Li, G., Lei, W., Zavala, M., Volkamer, R., Dusanter, S., Stevens, P., and Molina, L. T.: Impacts of HONO sources on the photochemistry in Mexico City during the MCMA-2006/MILAGO Campaign, Atmos. Chem. Phys., 10, 6551–6567, https://doi.org/10.5194/acp-10-6551-2010, 2010.
Li, G., Bei, N., Tie, X., and Molina, L. T.: Aerosol effects on the photochemistry in Mexico City during MCMA-2006/MILAGRO campaign, Atmos. Chem. Phys., 11, 5169–5182, https://doi.org/10.5194/acp-11-5169-2011, 2011a.
Li, G., Zavala, M., Lei, W., Tsimpidi, A. P., Karydis, V. A., Pandis, S. N., Canagaratna, M. R., and Molina, L. T.: Simulations of organic aerosol concentrations in Mexico City using the WRF-CHEM model during the MCMA-2006/MILAGRO campaign, Atmos. Chem. Phys., 11, 3789–3809, https://doi.org/10.5194/acp-11-3789-2011, 2011b.
Li, G., Lei, W., Bei, N., and Molina, L. T.: Contribution of garbage burning to chloride and PM2.5 in Mexico City, Atmos. Chem. Phys., 12, 8751–8761, https://doi.org/10.5194/acp-12-8751-2012, 2012.
Li, S., Wang, T., Solmon, F., Zhuang, B., Wu, H., Xie, M., Han, Y., and Wang, X.: Impact of aerosols on regional climate in southern and northern China during strong/weak East Asian summer monsoon years, J. Geophys. Res.-Atmos., 121, 4069–4081, https://doi.org/10.1002/2015JD023892, 2016.
Li, G., Wang, Y., Lee, K.-H., Diao, Y., and Zhang, R.: Impacts of aerosols on the development and precipitation of a mesoscale squall line, J. Geophys. Res., 114, D17205, https://doi.org/10.1029/2008JD011581, 2009.
Li, G., Wang, Y., and Zhang, R.: Implementation of a two-moment bulk microphysics scheme to the WRF model to investigate aerosol-cloud interaction, J. Geophys. Res. Atmos., 113, D15211, https://doi.org/10.1029/2007JD009361, 2008.
Li, Y., Zhang, F., Li, Z., Sun, L., Wang, Z., Li, P., Sun, Y., Ren, J., Wang, Y., Cribb, M., and Yuan, C.: Influences of aerosol physiochemical properties and new particle formation on CCN activity from observation at a suburban site of China, Atmos. Res., 188, 80–89, https://doi.org/10.1016/j.atmosres.2017.01.009, 2017.
Li, Z., Wang, Y., Guo, J., Zhao, C., Cribb, M. C., Dong, X., Fan, J., Gong, D., Huang, J., Jiang, M., Jiang, Y., Lee, S.-S., Li, H., Li, J., Liu, J., Qian, Y., Rosenfeld, D., Shan, S., Sun, Y., Wang, H., Xin, J., Yan, X., Yang, X., Yang, X-q., Zhang, F., and Zheng, Y.: East Asian study of tropospheric aerosols and their impact on regional clouds, precipitation, and climate (EAST- AIRCPC), J. Geophys. Res.-Atmos., 124, 13026–13054, https://doi.org/10.1029/2019JD030758, 2019.
Lin, J. C., Matsui, T., Pielke Sr, R. A., and Kummerow, C.: Effects of biomass-burning-derived aerosols on precipitation and clouds in the Amazon Basin: a satellite-based empirical study, J. Geophys. Res. Atmos., 111, D19204, https://doi.org/10.1029/2005JD006884, 2006.
Ma, S., Zhou, T., Dai, A., and Han, Z.: Observed changes in the distributions of daily precipitation frequency and amount over China from 1960 to 2013, J. Climate, 28, 6960–6978, https://doi.org/10.1175/JCLI-D-15-0011.1, 2015.
Menon, S., Hansen, J., Nazarenko, L., and Luo, Y.: Climate effects of black carbon aerosols in China and India, Science, 297, 2250–2253, https://doi.org/10.1126/science.1075159, 2002.
Morrison, H., Thompson, G., and Tatarskii, V.: Impact of cloud microphysics on the development of trailing stratiform precipitation in a simulated squall line: Comparison of one-and two-moment schemes, Mon. Weather Rev., 137, 991–1007, https://doi.org/10.1175/2008MWR2556.1, 2009.
Nugent, A. D., Watson, C. D., Thompson, G., and Smith, R. B.: Aerosol impacts on thermally driven orographic convection, J. Geophys. Res.-Atmos., 73, 3115–3132, https://doi.org/10.1175/JAS-D-15-0320.1, 2016.
Rosenfeld, D., Rudich, Y., and Lahav, R.: Desert dust suppressing precipitation: A possible desertification feedback loop, P. Natl. Acad. Sci. USA, 98, 5975–5980, https://doi.org/10.1073/pnas.101122798, 2001.
Rosenfeld, D., Dai, J., Yu, X., Yao, Z., Xu, X., Yang, X., and Du, C.: Inverse relations between amounts of air pollution and orographic precipitation, Science, 315, 1396–1398, https://doi.org/10.1126/science.1137949, 2007.
Rosenfeld, D., Lohmann, U., Raga, G. B., O'Dowd, C. D., Kulmala, M., Fuzzi, S., Reissell, A., amd Andreae, M. O.: Flood or drought: How do aerosols affect precipitation, Science, 321, 1309–1313, https://doi.org/10.1126/science.1160606, 2008.
Sand, M., Samset, B. H., Tsigaridis, K., Bauer, S. E., and Myhre, G.: Black Carbon and Precipitation: An Energetics Perspective, J. Geophys. Res.-Atmos., 125, https://doi.org/10.1029/2019jd032239, 2020.
Senf, F., Quaas, J., and Tegen: Absorbing aerosol decreases cloud cover in cloud-resolving simulations over Germany, Q. J. Roy. Meteor. Soc., 147, 4083–4100, https://doi.org/10.1002/qj.4169, 2021.
Shepherd, J. M. and Burian, S. J.: Detection of urban-induced rainfall anomalies in a major coastal city, Earth Interact., 7, 1–17, https://doi.org/10.1175/1087-3562(2003)007<0001:DOUIRA>2.0.CO;2, 2003.
Storer, R. L., van den Heever, S. C., and Stephens, G. L.: Modeling aerosol impacts on convective storms in different environments, J. Atmos. Sci., 67, 3904–3915, https://doi.org/10.1175/2010JAS3363.1, 2010.
Sun, Y. and Zhao, C.: Distinct impacts on precipitation by aerosol radiative effect over three different megacity regions of eastern China, Atmos. Chem. Phys., 21, 16555–16574, https://doi.org/10.5194/acp-21-16555-2021, 2021.
Sun, Y., Wang, Y., Zhao, C., Zhou, Y., Yang, Y., Yang, X., Fan, H., Zhao, X., and Yang, J.: Vertical dependency of aerosol impacts on local scale convective precipitation, Geophys. Res. Lett., 50, e2022GL102186, https://doi.org/10.1029/2022GL102186, 2023.
Tao, W. K., Li, X. W., Khain, A., Matsui, T., and Lang, S.: Role of atmospheric aerosol concentration on deep convective precipitation: Cloud-resolving model simulation, J. Geophys. Res.-Atmos., 112, D24S18, https://doi.org/10.1029/2007JD008728, 2007.
Tao, W. K., Chen, J. P., Li, Z., Wang, C., and Zhang, C.: Impact of aerosols on convective clouds and precipitation, Rev. Geophys., 50, RG2001, https://doi.org/10.1029/2011RG000369, 2012.
Twomey, S.: The influence of pollution on the shortwave albedo of clouds, J. Atmos. Sci., 34, 1149–1152, https://doi.org/10.1175/1520-0469(1977)034<1149:TIOPOT>2.0.CO;2, 1977.
Wang, Y., Wan, Q., Meng, W., Liao, F., Tan, H., and Zhang, R.: Long-term impacts of aerosols on precipitation and lightning over the Pearl River Delta megacity area in China, Atmos. Chem. Phys., 11, 12421–12436, https://doi.org/10.5194/acp-11-12421-2011, 2011.
Wang, Y., Fan, J., Zhang, R., Leung, L. R., and Franklin, C.: Improving bulk microphysics parameterizations in simulations of aerosol effects, J. Geophys. Res.-Atmos., 118, 5361–5379, https://doi.org/10.1002/jgrd.50432, 2013.
Wang, H., Tan, Y., Shi, Z., Yang, N., and Zheng, T.: Diurnal differences in the effect of aerosols on cloud-to-ground lightning in the Sichuan Basin, Atmos. Chem. Phys., 23, 2843–2857, https://doi.org/10.5194/acp-23-2843-2023, 2023.
Wilcox, E. M.: Direct and semi-direct radiative forcing of smoke aerosols over clouds, Atmos. Chem. Phys., 12, 139–149, https://doi.org/10.5194/acp-12-139-2012, 2012.
Wilcox, E. M., Thomas, R. M., Praveen, P. S., Pistone, K., Bender, F. A. M., and Ramanathan, V.: Black carbon solar absorption suppresses turbulence in the atmospheric boundary layer, Proc. Natl. Acad. Sci. USA, 113, 11794–11799, https://doi.org/10.1073/pnas.1525742113, 2016.
Wu, J., Bei, N., Hu, B., Liu, S., Zhou, M., Wang, Q., Li, X., Liu, L., Feng, T., Liu, Z., Wang, Y., Cao, J., Tie, X., Wang, J., Molina, L. T., and Li, G.: Is water vapor a key player of the wintertime haze in North China Plain?, Atmos. Chem. Phys., 19, 8721–8739, https://doi.org/10.5194/acp-19-8721-2019, 2019.
Wu, J., Bei, N., Wang, Y., Su, X., Zhang, N., Wang, L., Hu, B., Wang, Q., Jiang, Q., Zhang, C., Liu, Y., Wang, R., Li, X., Lu, Y., Liu, Z., Cao, J., Tie, X., Li, G., and Seinfeld, J.: Aerosol light absorption alleviates particulate pollution during wintertime haze events, P. Natl. Acad. Sci. USA, 122, e2402281121, https://doi.org/10.1073/pnas.2402281121, 2025.
Xi, J., Li, R., Fan, X., and Wang, Y.: Aerosol effects on the three-dimensional structure of organized precipitation systems over Beijing-Tianjin-Hebei region in summer, Atmos. Res., 298, 107146, https://doi.org/10.1016/j.atmosres.2023.107146, 2024.
Yang, X., Ferrat, M., and Li, Z.: New evidence of orographic precipitation suppression by aerosols in central China, Meteorol. Atmos. Phys., 119, 17–29, https://doi.org/10.1007/s00703-012-0221-9, 2013a.
Yang, X., Yao, Z., Li, Z., and Fan, T.: Heavy air pollution suppresses summer thunderstorms in central China, J. Atmos. Sol. Terr. Phys., 95, 28–40, https://doi.org/10.1016/j.jastp.2012.12.023, 2013b.
Yang, X. and Li, Z.: Increases in thunderstorm activity and relationships with air pollution in southeast China, J. Geophys. Res.-Atmos., 119, 1835–1844, https://doi.org/10.1002/2013JD021224, 2014.
Zhang, Y., Easter, R. C., Ghan, S. J., and Abdul-Razzak, H.: Impact of aerosol size representation on modeling aerosol-cloud interactions, Geophys. Res.-Atmos., 107, 4558, https://doi.org/10.1029/2001JD001549, 2002.
Zhao, C., Qiu, Y., Dong, X., Wang, Z., Peng, Y., Li, B., Wu, Z., and Wang, Y.: Negative aerosol-cloud re relationship from aircraft observations over Hebei, China, Earth Space Sci., 5, 19–29, https://doi.org/10.1002/2017EA000346, 2018.
Zhao, C., Sun, Y., Yang, J., Li, J., Zhou, Y., Yang, Y., Fan, H., and Zhao X.: Observational evidence and mechanisms of aerosol effects on precipitation, Sci. Bull., 69, 1569–1580, https://doi.org/10.1016/j.scib.2024.03.014, 2024.