the Creative Commons Attribution 4.0 License.
the Creative Commons Attribution 4.0 License.
 | 18 Sep 2025
The atmospheric settling of commercially sold microplastics
Alina Sylvia Waltraud Reininger
Daria Tatsii
Taraprasad Bhowmick
Gholamhossein Bagheri
Andreas Stohl
The atmosphere plays a major role in the dispersion of microplastics in the environment. The atmospheric transport of large microplastics is strongly influenced by their settling behavior, which depends on their physical properties, including size and shape. However, experimental data on the settling behavior of commercially available microplastics with complex, nonspherical shapes in air are rare. Here we present experiments on the gravitational settling velocity of commercially available glitters (nominal diameters between 0.1 and 3 mm) and fibers (lengths between 1.2 and 5 mm). We observed that glitters and fibers settle up to 74 % and 78 % slower compared to volume-equivalent spheres, respectively. The atmospheric transport of fibers has been studied previously; however, there are no studies on the atmospheric transport potential of glitters. Therefore, we used an atmospheric transport model constrained by our experimental results to assess the transport potential of glitters. Our results reveal that glitters exhibit transport distances 12 %–261 % greater than volume-equivalent spheres, highlighting their elevated atmospheric transport potential. As a result, the environmental impact of glitter particles, especially following their use in entertainment events, warrants attention and mitigation.
- Article
(5761 KB) - Full-text XML
-
Supplement
(20045 KB) - BibTeX
- EndNote


Microplastics, synthetic polymers ranging from 1 to 5000 µm in size, are a major source of pollution worldwide (Petersen and Hubbart, 2021). They can be categorized as either primary microplastics – manufactured intentionally for products such as cosmetics, cleaning agents, and personal care products (Auta et al., 2017) – or secondary microplastics, formed by the fragmentation of larger plastics (Petersen and Hubbart, 2021). Shapes of microplastics include films, irregular particles, fibers, spheres, and spheroids (Hartmann et al., 2019), with the observed shapes often differing by location (Zhang et al., 2020; Petersen and Hubbart, 2021). In many studies of urban locations, for example, fibers have been identified as the most common shape of microplastics (Dris et al., 2015; Liu et al., 2019a; Zhou et al., 2017; Cai et al., 2017). Fibers are also the dominant shape observed in several remote locations (Brahney et al., 2020; Cabrera et al., 2020; Ambrosini et al., 2019). Similar to fibers, films have been detected in both urban (Abbasi et al., 2019; Cai et al., 2017; Zhou et al., 2017) and remote locations (Allen et al., 2020; Cabrera et al., 2020). Glitter – small, flat, reflective particles ranging from 50 up to 6350 µm, with 200 µm being the most popular size (Yurtsever, 2019b; Blackledge and Jones, 2007) – is classified as a primary microplastic. Glitter particles can be described as films or irregular particles, according to the nomenclature recommendations of Hartmann et al. (2019), or disks, as done by Tinklenberg et al. (2023, 2024). The production typically involves plastics, metal foils, or dyes (Tagg and Ivar do Sul, 2019; Zanini et al., 2024). As an alternative, renewable, plant-based raw materials, such as seaweed, regenerated cellulose, mica powders, and glycerin, are produced (Yurtsever, 2019b; Zanini et al., 2024). According to the report of Market Research Intellect (2025), the glitter powder market was valued at USD 100 million in 2023 and is expected to reach USD 324.34 million by 2031. The growth in the glitter powder industry can be attributed to its broad application and an increasing demand in many sectors, such as the automobile, textile, and cosmetic industries (Market Research Intellect, 2025; Zanini et al., 2024). Furthermore, there is a growing interest in crafting activities where glitter powder is added to decorations, gift cards, and arts (Market Research Intellect, 2025; Yurtsever, 2019a). Glitter is also extensively used in the entertainment sector for decorations, stage sets, special effects, and events such as carnivals and shows (Yurtsever, 2019a; Zanini et al., 2024; Market Research Intellect, 2025).
Microplastics are associated with substantial harmful effects on the environment. Several studies have investigated the adverse effects (e.g., acute toxicity, increased susceptibility to pollutants and mortality, reduced food intake, and potential bioaccumulation) of microplastic fibers on soil and aquatic organisms (Gray and Weinstein, 2017; Romanó de Orte et al., 2019; Kwak et al., 2022; Song et al., 2019; Kim et al., 2021). Furthermore, airborne fibers have the potential to harm the human respiratory systems (Prata, 2018). However, glitter has received less scientific attention than fibers (Yurtsever, 2019b; Zanini et al., 2024). Glitter has been reported in riverbed and coastal sediments, surface waters (Nithin et al., 2022; Ballent et al., 2016), wastewater treatment plants (Lusher et al., 2017; Raju et al., 2020), and street dust (Abbasi et al., 2017, 2019; Dehghani et al., 2017). Due to the recycling of biosolids, glitter poses a threat to farm soil and soil invertebrates (Harley-Nyang et al., 2022; Dąbrowska, 2022; Medyńska-Juraszek and Jadhav, 2022; Chen et al., 2024). Both conventional and biodegradable glitter cause ecological impacts in aquatic ecosystems (Green et al., 2021; Yoshida et al., 2023). In aquatic organisms, glitter is associated with internal damage; adverse effects on embryonic development; biovolume increment; an increase in antioxidant defense; and reduced survival, feeding, hatch, and growth rates (Abessa et al., 2023; Machado et al., 2023; Provenza et al., 2022; Das Pramanik et al., 2023).
For transporting microplastics to different environmental media, the atmosphere plays an important role (Dris et al., 2016; Allen et al., 2020; Bergmann et al., 2019; Liu et al., 2019b; Trainic et al., 2020; Wright et al., 2020; Huang et al., 2021; Mandal et al., 2024; Martynova et al., 2024). Particle shape is a key factor influencing the atmospheric transport potential of microplastics, primarily through its effect on terminal settling velocity vt. A particle obtains its terminal settling velocity when the force of gravity is balanced by the drag force. vt is calculated by
where g is the gravitational acceleration; Ccun is the Cunningham slip correction factor (which accounts for reduced drag on particles < 1 µm); deq is the volume-equivalent diameter of a sphere; ρp and ρa are the densities of the particle and the air, respectively; and CD is the dimensionless drag coefficient, which depends on the particle's shape and orientation (Bagheri and Bonadonna, 2016).
Only a limited number of experimental studies have examined the settling behavior of microplastic films, disks, fibers, and fragments in air (Qi et al., 2012; Preston et al., 2023; Tatsii et al., 2024; Tinklenberg et al., 2023, 2024; Musso et al., 2024). This study is the first to investigate the atmospheric transport potential of glitter in the size range of 50 µm to 3 mm. For that, we conducted laboratory experiments to measure the gravitational settling behavior of microplastic glitters of six sizes. Additionally, we examined the settling behavior of eight sizes of commercially available microplastic fibers with lengths ranging from 1.2 to 5 mm. Such fibers, in contrast to the 3D-printed fibers used by Tatsii et al. (2024), can contain imperfections that might impact their settling behavior. These experimental findings were then integrated into an atmospheric transport model to evaluate the residence times and travel distances of glitter particles, as the atmospheric transport potential of fibers has been investigated in detail by Tatsii et al. (2024).
2.1 Particle properties
Experiments were performed for six different sizes of glitter particles (craft glitter, Hemway), characterized by hexagonal or irregular shapes. These glitter particles have nominal diameters of 0.1, 0.2, 0.4, 0.6, 1, and 3 mm, with the longest dimensions L from 0.18–3.29 mm (Table 1). Their densities were determined with a helium pycnometer (AccuPyc II 1340 V3.00, Micromeritics Instrument Corporation), resulting in an average density of 1.39 g cm−3, ranging from 1.38–1.40 g cm−3. The glitter particles' dimensions were determined using a 3D laser microscope (VK-X260K, Keyence International (Belgium) NV/SA) and the software ImageJ (Schneider et al., 2012). The sphericity Ψ, which compares the surface area of a sphere to that of a nonspherical particle with equivalent volume, ranges from 0.83 to 0.19. It is defined as Ψ = , with SA being the surface area of the particle.
Table 1Characteristics of the glitters and their modeled and measured settling velocities.*
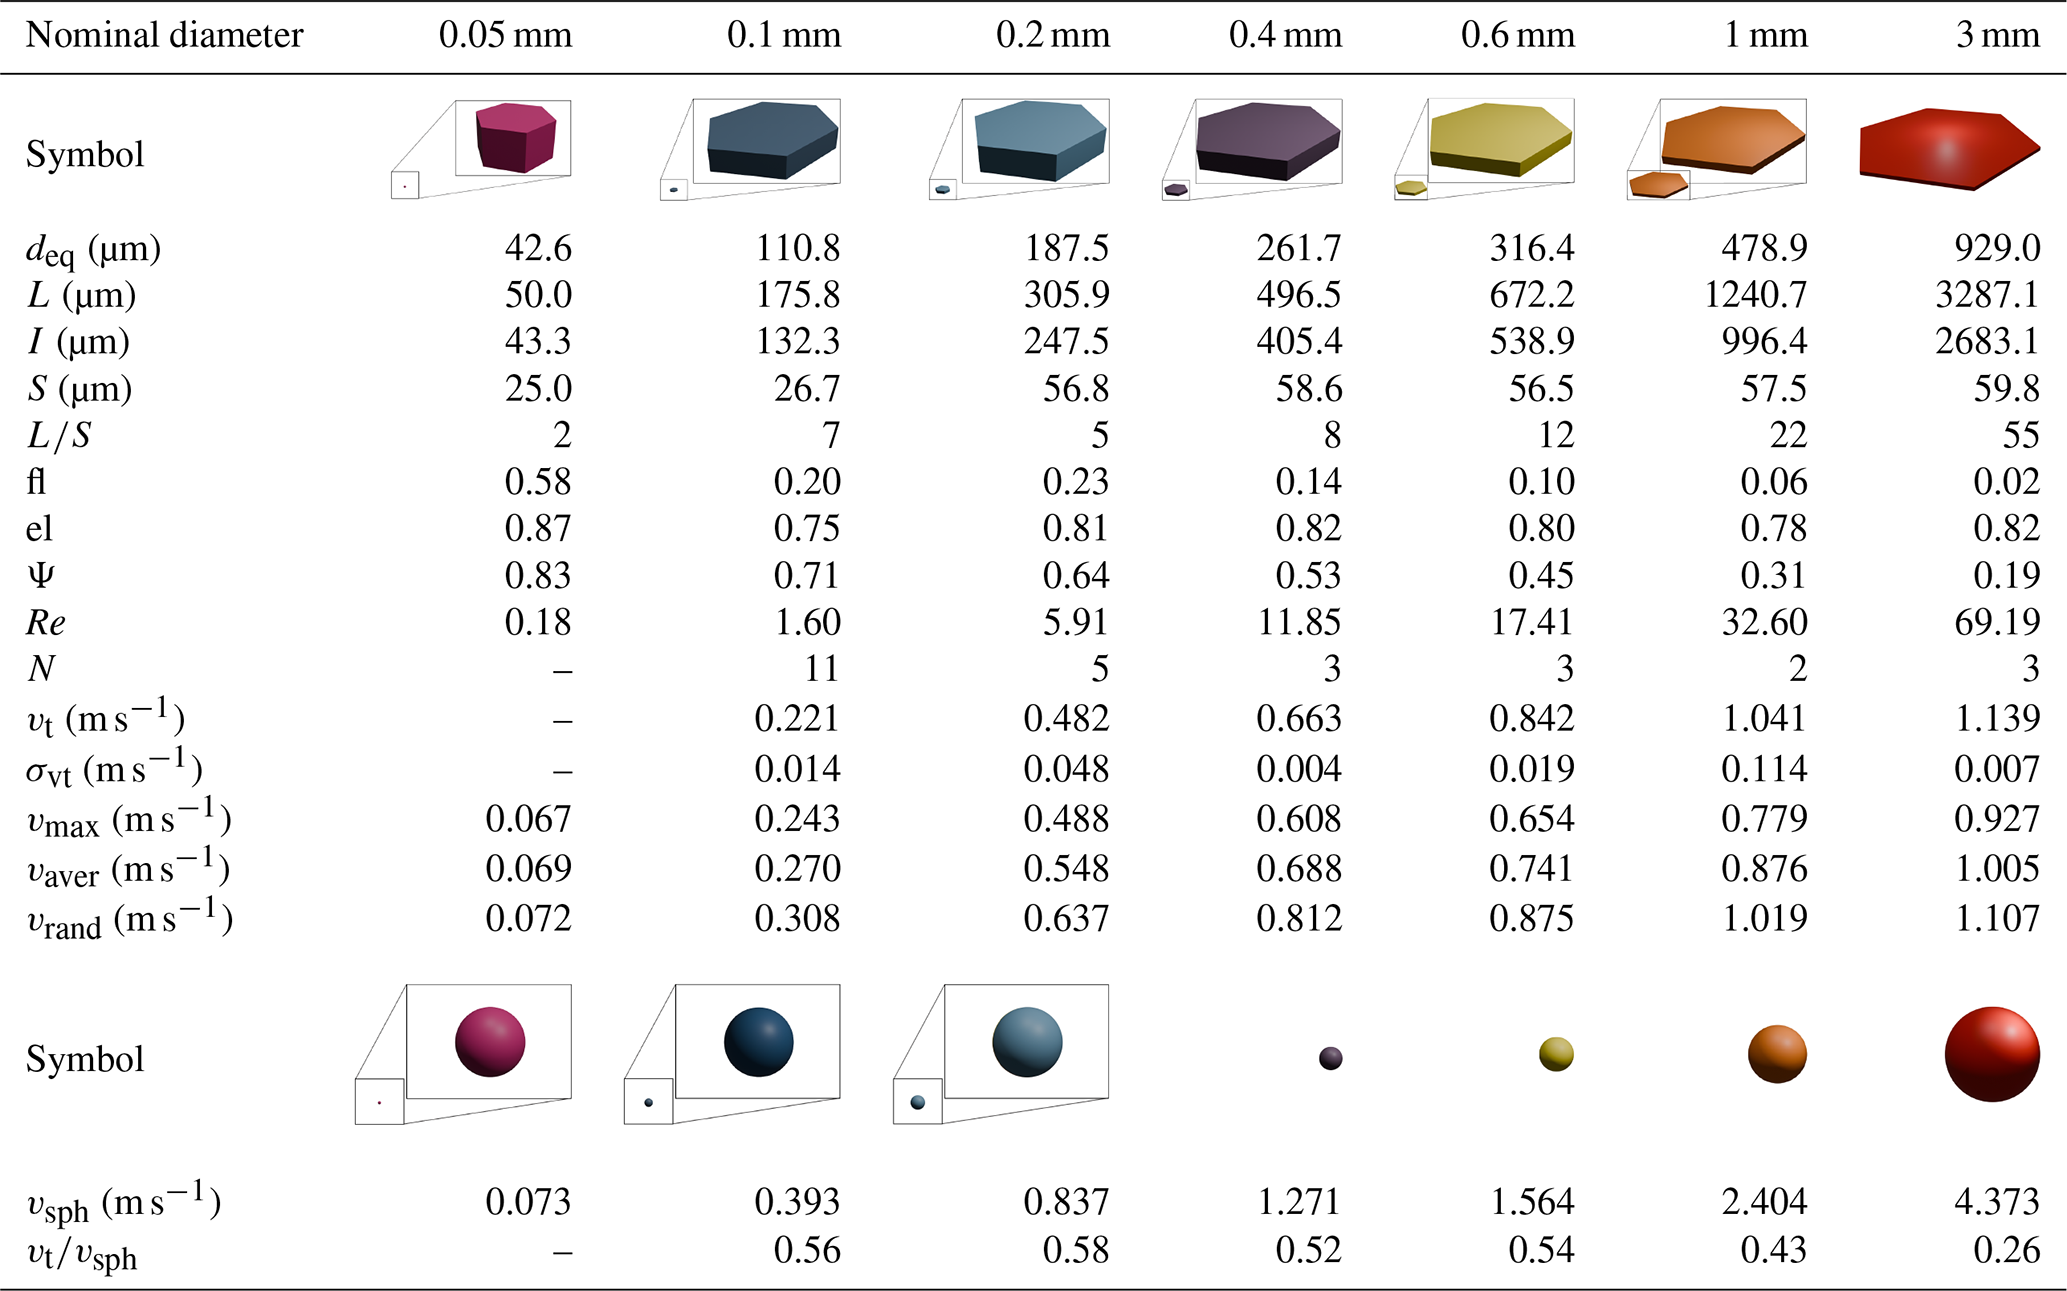
* deq is the volume equivalent diameter of a sphere, L is the longest, I the intermediate, and S the shortest dimension of the particle. fl is the particle's flatness and el is its elongation. Ψ is the sphericity, which compares the surface area of a particle to that of sphere , with SA being the surface area of the particle. The Reynolds number Re is defined as , where ρa is the density and ν is the kinematic viscosity of the air. N is the number of successful experiments. The measured settling velocity vt is given as the average over the number of experiments of the corresponding shape and size, with σvt being the standard deviation. vrand, vmax, vaver, and vsph are the modeled velocities with random-orientation drag, maximum-orientation drag, average-orientation drag, and volume equivalent spheres, respectively. For glitters with nominal diameters of 0.05 mm, no experiments but simulations have been performed, and their properties are listed for the sake of completeness.
The fibers consist of Polyamide 6.6 Precision Cut Flock (Flockan) with a density of 1.15 g cm−3. Eight fiber sizes were studied, with lengths ranging from 1.2 to 5 mm and diameters between 10 and 105 µm (Table 2). The fibers possess aspect ratios (ARs) (longest dimension L shortest dimension S) between 36 and 121 and no or a small curvature. The sphericity ranges from 0.11 to 0.01. Microscopic images of the glitter particles and fibers are presented in Figs. 2a–d and S1–S3 in the Supplement.
Table 2Characteristics of the fibers and their modeled and measured settling velocities.*
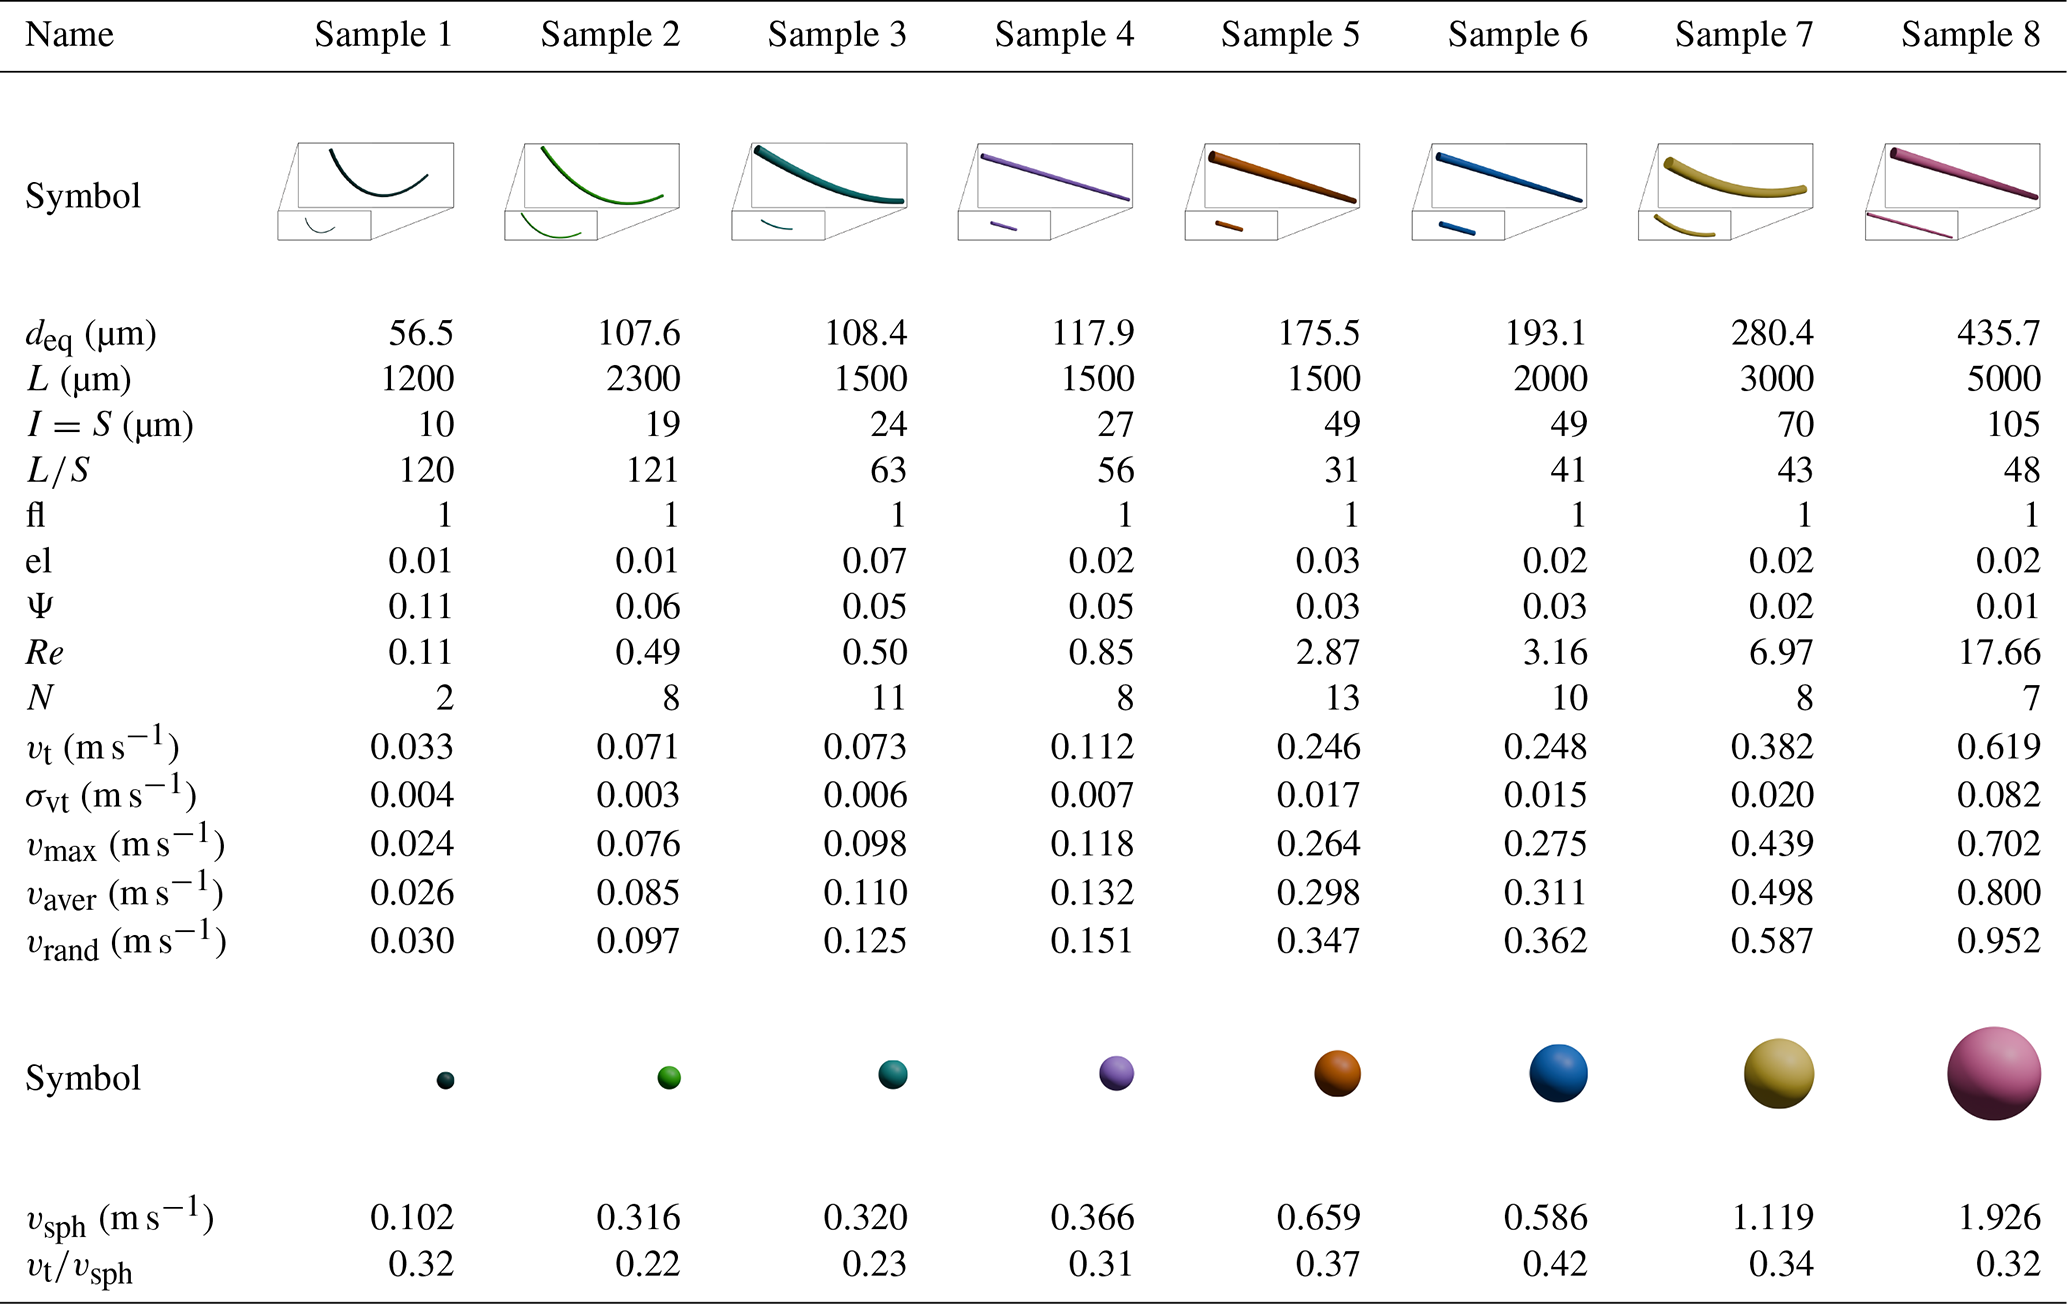
* deq is the volume equivalent diameter of a sphere, L is the longest, I the intermediate, and S the shortest dimension of the particle. fl is the particle's flatness and el is its elongation. Ψ is the sphericity, which compares the surface area of a particle to that of sphere , with SA being the surface area of the particle. The Reynolds number Re is defined as , where ρa is the density and ν is the kinematic viscosity of the air. N is the number of successful experiments. The measured settling velocity vt is given as the average over the number of experiments of the corresponding shape and size, with σvt being the standard deviation. vrand, vmax, vaver, and vsph are the modeled velocities with random-orientation drag, maximum-orientation drag, average-orientation drag, and volume equivalent spheres, respectively.
2.2 Experimental setup
In our experimental setup, one can measure the three-dimensional translational and rotational motion of solid particles between 0.1 and 5 mm in quiescent air. The setup consists of an air-filled settling chamber, where the particles can settle under gravity, surrounded by four high-speed cameras. The settling chamber is a reinforced steel chamber with four glass windows and airtight sealed edges; it has dimensions of 90 × 90 × 200 mm in the X (direction of the light path from the LED), Y (horizontal direction orthogonal to X), and Z (direction of gravity) directions. A detachable bottom drawer allows for collection of the particles after an experiment. A particle injector is mounted on the settling chamber's removable top cover. The settling chamber is installed on a high-precision XYZ stage, which allows movement of the settling chamber with 10 µm spatial resolution in all three directions (Bhowmick et al., 2024a). A photograph of the settling chamber is shown in Fig. 1a.
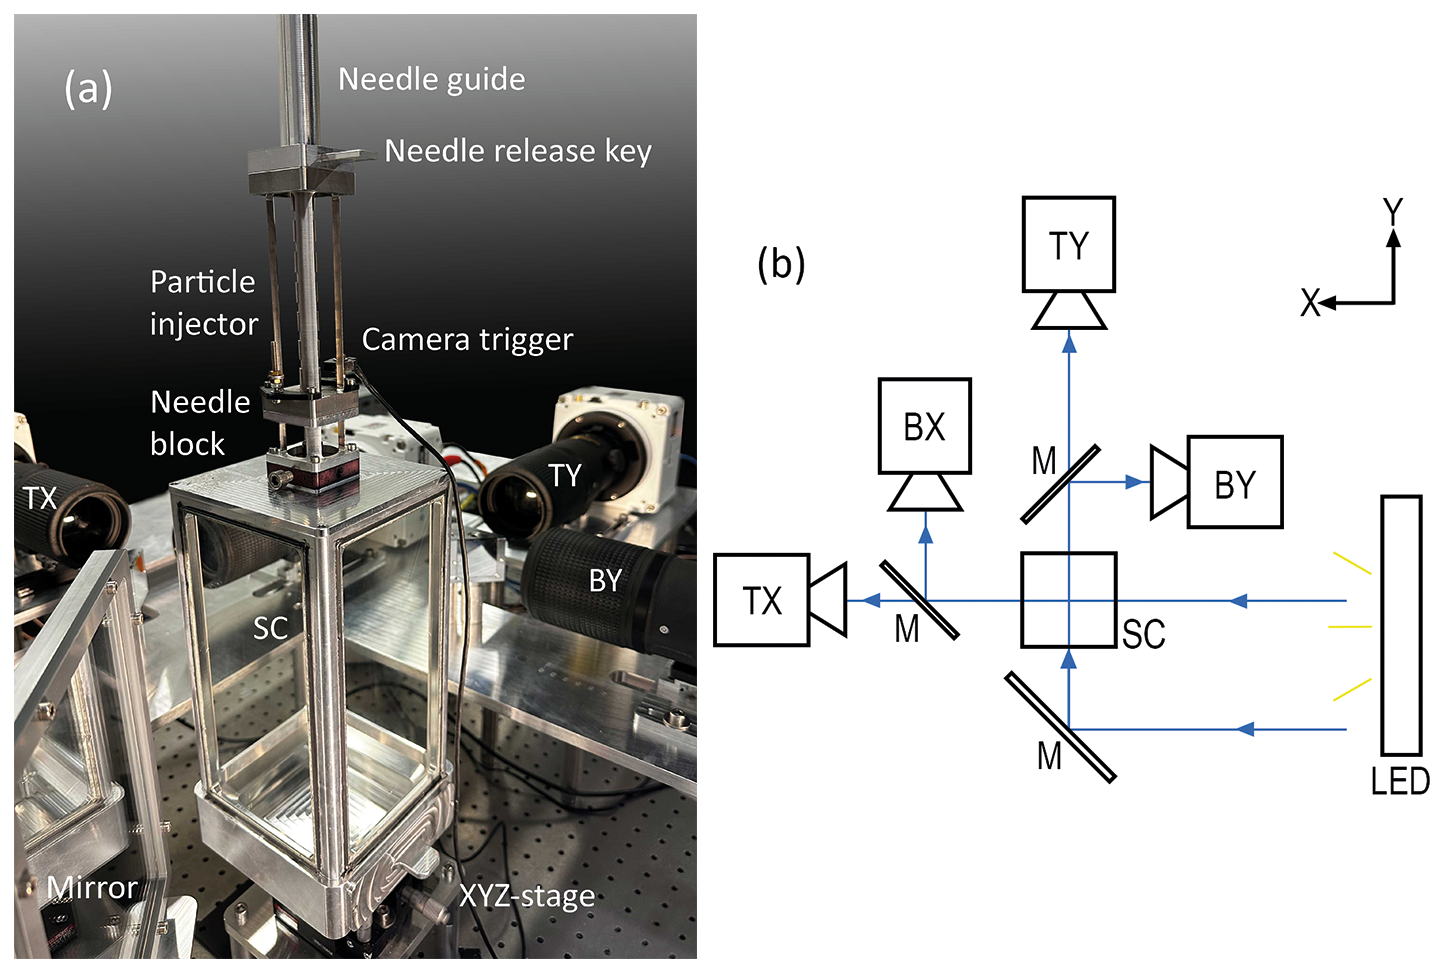
Figure 1Experimental setup. (a) Photo of the settling chamber (SC) with the particle injector and the XYZ stage. Three cameras (TX, TY, and BY) and a mirror can be seen. (b) Schematic view of the experimental setup showing the two upper cameras (TX) and (TY); the two lower cameras (BX) and (BY); the mirror (M) arrangement; and the settling chamber (SC), LED, and illumination/imaging paths.
The four high-speed cameras (Phantom VEO4K 990L, Vision Research) synchronized with a high-frequency pulsed white LED array (LED-Flashlight 300, model number 1103445, LaVision GmbH) surround the settling chamber, as shown in Fig. 1b. Only one camera receives direct light from the LED, the remaining three receive light reflected by mirrors. A waveform generator controls the pulse rate, amplitude, offset of the waveform, and duty cycle of the LED and creates a synchronization signal for the exposure times of all cameras. To control the cameras, the Phantom Camera Control (PCC) software was used. Further details of the setup, as well as the postprocessing and calibration processes, are described in Bhowmick et al. (2024a) and Tatsii et al. (2024). For the experiments, the resolution of the cameras was set to 4096 × 1140 pixels, each pixel corresponding to a physical area of 6.75 × 6.75 µm2; however, the smallest dimensions of the tested particles are larger than this value. The exposure time was set to 5 µs. For samples 1–4 of the fibers, a frame rate of 200 frames per second was chosen. For all other particles, the frame rate was set to 1492 frames per second.
Prior to the experiments, the model of Bagheri and Bonadonna (2016, 2019) was used to estimate the vertical distance at which the particles approximately reach their terminal velocity. The settling chamber was positioned accordingly using the XYZ stage to allow the cameras to capture particles near their steady-state velocity. After calibration, particles were introduced into the settling chamber using the particle injector. For this, a single particle was placed on top of a particle injector needle (a cylindrical rod with a length of 200 mm, a diameter of 12 mm, and a conical tip; Bhowmick et al., 2024a), which was then inserted into a needle guide. A release key that was placed into one of the needle grooves secured the needle in place. Upon removal of the key, the needle dropped vertically until stopped by a needle block, causing the particle to detach. Different grooves represent different particle initial velocities, ranging between 0.42 and 1.5 m s−1 (Bhowmick et al., 2024a). Notice that insertion speeds are chosen to be close to expected terminal settling velocities, so particles can accelerate or decelerate in the air column, depending on whether insertion is slower or faster than the terminal settling velocity. As soon as the particle detached, cameras were activated by an external photoelectric trigger. When a particle was observed by all four cameras, the images were stored for postprocessing. Figures 2e–h and S4–S5 illustrate overlays of particle images recorded by the cameras.
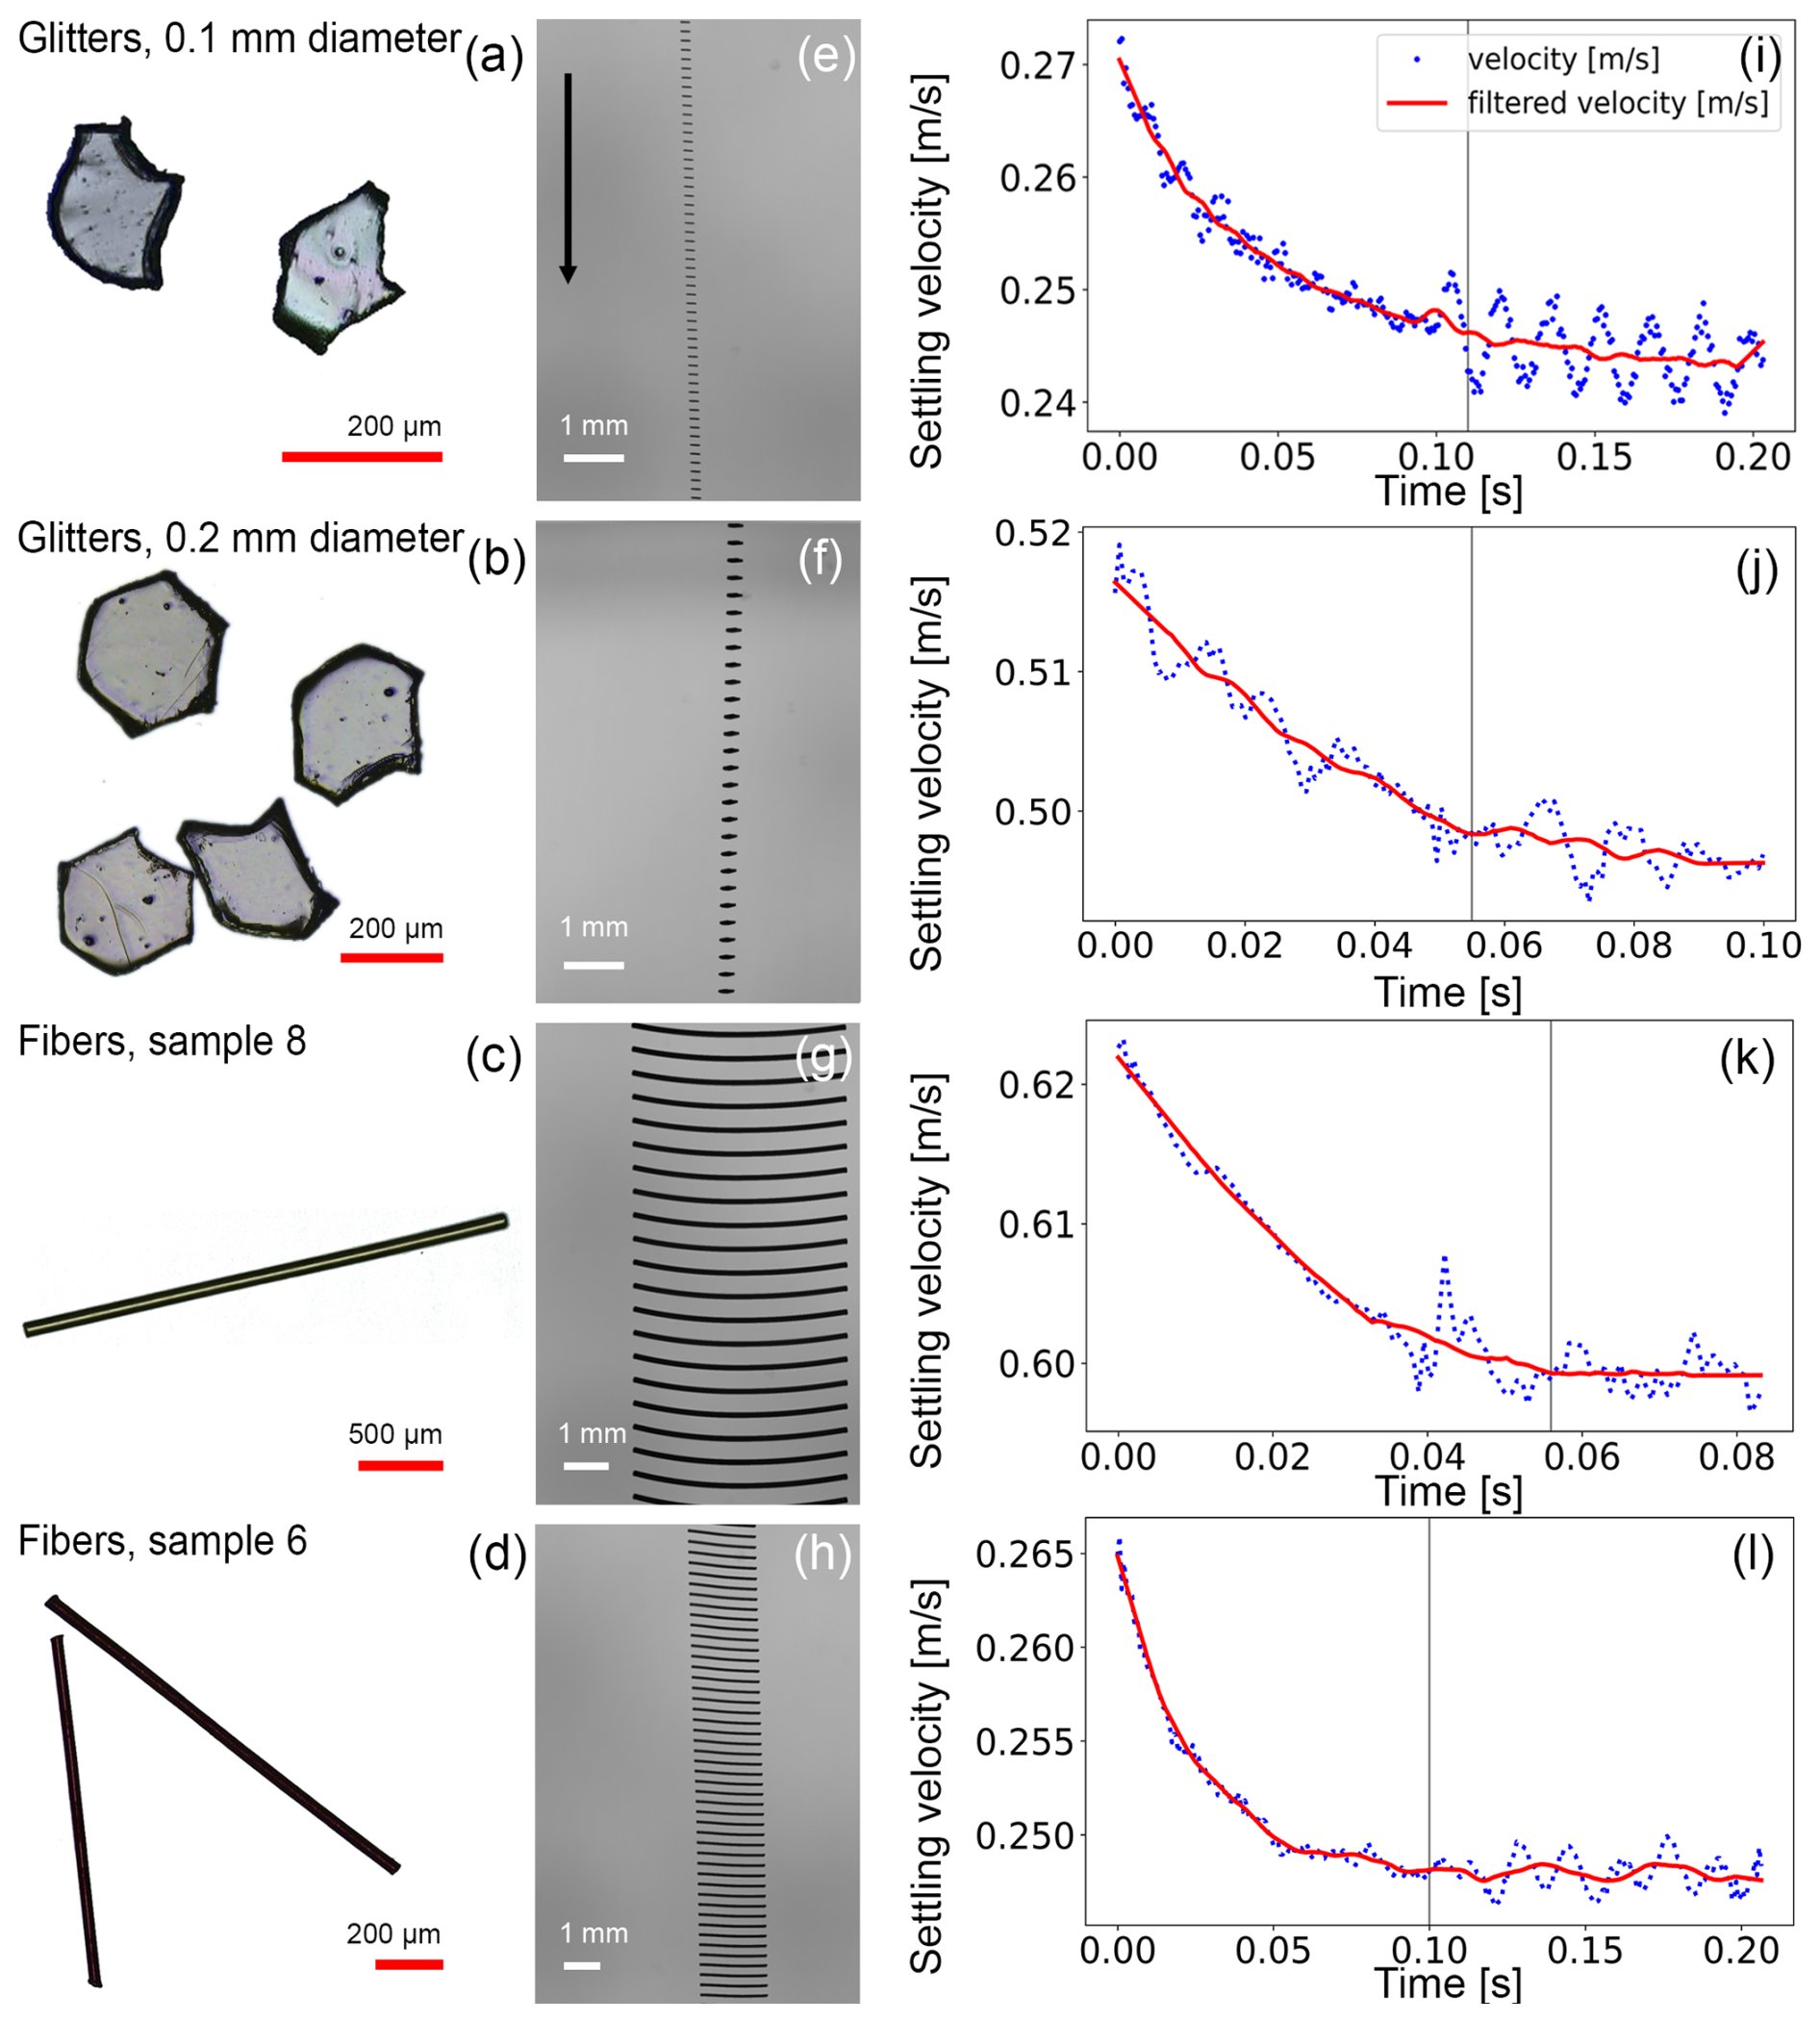
Figure 2Example of the glitters and fibers and their settling behavior. (a–d) Microscopic images of glitter particles and fibers. (e–h) Overlays of particle images recorded by the cameras. The vertical vector shows the direction of gravity. (i–l) The post-processed velocity time series of the particles. The dots represent the experimental post-processed data, and the filtered data are shown as solid red lines. The right half of the dashed grey line in panels (i)–(l) indicates the data selected for the settling velocity analysis.
2.3 Verification of the setup
The sensitivity tests of the experimental setup by Bhowmick et al. (2024a) showed that possible uncertainties in measurements caused by a change of temperature due to illumination and airflow caused by needle movement are negligible. Bhowmick et al. (2024a) and Tatsii et al. (2024) both thoroughly verified the setup by dropping spheres and nonspherical particles of different diameters and comparing the measured settling velocities to the empirical model of Clift and Gauvin (1971) and to the direct numerical simulations of (Bhowmick et al., 2025). The authors report relative errors below 5 %. We point out that the stated error of the Clift and Gauvin (1971) model is about 6 % at Reynold's numbers below 3 × 10⁵ (Clift and Gauvin, 1971), and the average error of the Bagheri and Bonadonna (2016) model is 10 %.
2.4 Postprocessing and data analysis
Following the method outlined in Bhowmick et al. (2024a), for each camera, a median image background was calculated using all available frames and subsequently subtracted from the images. Then, a small region around the particle was cropped, and the resulting image was independently thresholded. The centroid position and longest length were extracted from the thresholded image using the OpenCV 2 library (Open Source Computer Vision Library) in Python. The centroids were used to determine the three-dimensional positions of the particles, and the velocities were extracted using a sixth-order finite difference scheme.
To ensure that the terminal settling velocity had been reached, only experimental runs with relative changes in velocity of less than 10 % over a wide number of frames were chosen. Figure 2i–l show the post-processed settling velocities corresponding to the particles shown in Fig. 2a–d. Noise that was caused by an inaccurate estimation of the centroid position was removed by applying a Savitzky–Golay filter. For the selected experimental runs, the settling velocities were averaged over the number of frames. Then the settling velocities obtained for individual particles were averaged over the number of experiments performed for each particle type.
2.5 Drag coefficient of nonspherical particles
For describing the drag coefficient of spheres, accurate analytical and empirical models exist (Clift and Gauvin, 1971). For nonspherical particles, such generalized models do not exist; however, some empirical relationships have been determined as a function of particle shape. According to Coyle et al. (2023) and Saxby et al. (2018), the semi-empirical settling scheme of Bagheri and Bonadonna (2016, 2019) provides excellent results for the drag coefficient of nonspherical particles of various shapes. This scheme is suited for regular and irregular particle shapes settling in gas or liquids at Reynolds numbers smaller than 3 × 10⁵. The results are based on analytical solutions for ellipsoids in Stokes' regime (Oberbeck, 1876) and measurements of the drag coefficient of 300 regular and irregular particles in air in settling columns and in a wind tunnel. Additionally, 881 experimental data points compiled from the literature for particles of regular shapes in gases and liquids were considered. The scheme by Bagheri and Bonadonna (2016, 2019) is based on the Stokes kS and Newton drag corrections kN, which represent the ratio of the drag coefficient of a nonspherical particle and the drag coefficient of a volume equivalent sphere in Stokes' and Newton's regime, respectively. These parameters are derived from Ganser (1993). Bagheri and Bonadonna (2016, 2019) introduced shape descriptors such as Stokes FS and Newton form factors FN, which are based on the particle's volume-equivalent diameter deq, flatness (f = ), and elongation (e = ), where L, I, and S are the particle's longest, intermediate, and shortest dimensions, respectively. These shape descriptors are easier to measure and correlate better with the Stokes kS and Newton drag corrections kN than sphericity, a widely used shape descriptor (Bagheri and Bonadonna, 2016). The chain of equations to calculate the drag coefficient can be found in the Supplement (Eqs. S1–S11). The model distinguishes between random-orientation drag (i.e., drag coefficient CD of the particle when averaged over many random orientations), maximum-orientation drag (i.e., drag coefficient when the particle's maximum projection area is normal to gravity), and also minimum-orientation drag (i.e., drag coefficient when the particle's minimum projection area is normal to gravity). Additionally, an average between the predictions for random-orientation-drag and maximum-orientation-drag has been introduced by Tatsii et al. (2024), hereafter referred to as the average-orientation-drag model. There is also a simplified version of the model in which the shape of the particle is approximated by an ellipsoid of similar form by neglecting the term in the Stokes form factor FS and in Newton form factor FN (Bagheri and Bonadonna, 2016, 2019). In this study, the full model version is used for both glitters and fibers; however, we also provide results using the simplified model for fibers, as suggested by Tatsii et al. (2024). The settling velocities of the volume-equivalent spheres are not measured but modeled, since the settling velocities of spheres are well known and need no further investigation.
2.6 Atmospheric transport modeling
We simulated the atmospheric transport of the glitter sizes used in the experiments and also for the smallest commercially available glitter particles (0.05 mm nominal diameter; no experiments performed) using the Lagrangian transport and dispersion model FLEXPART (FLEXible PARTicle) version 11 (Bakels et al., 2024). The atmospheric transport of fibers has been investigated in detail before, e.g., by Tatsii et al. (2024). FLEXPART simulates the transport, turbulent diffusion, dry and wet deposition, decay, and first-order chemical reactions of tracers from local to global scales released from point, line, area, or volume sources (Pisso et al., 2019). Particles in FLEXPART are advanced by motion vectors combining the grid-scale wind velocity from linearly interpolated meteorological input data, the parameterized stochastic turbulent wind velocity, and, for aerosols, the settling velocity (Bakels et al., 2024). For calculating the setting velocities, the full maximum-orientation-drag model of Bagheri and Bonadonna (2016, 2019) was used for these simulations.
Separate instantaneous releases of 10 000 particles were done twice per day at 03:00 and 15:00 LT (local time) on the 1st and 15th of each month for a 1-year period. The particles were released from a vertical line source between 10 and 100 m above ground level from six different locations representing a range of meteorological conditions controlling wet and dry deposition: London (51°30′ N, 0°7′ W), Shanghai (31°13′ N, 121°28′ E), Brasília (15°47′ S, 47°52′ W), Cairo (30°1′ N, 31°14′ W), New Orleans (29°57′ N, 90°4′ W), and Reykjavík (64°7’ N, 21°49′ W). The simulation times (listed in Table S2 in the Supplement) were selected based on preliminary test simulations to ensure that all airborne microplastics were deposited within the given time frames, while keeping computational cost at a minimum. As input for the simulations, the most recent reanalysis dataset of the European Centre for Medium-Range Weather Forecasts, ERA5 (Hersbach et al., 2020), with hourly 0.5° × 0.5° horizontal resolution, was used. The output was produced with a 0.5° × 0.5° horizontal resolution, and concentrations are sampled from 6 to 900 s, depending on particle size. Around the release points, nested grids were used with resolutions of 0.005, 0.0005, and 0.0001° for glitters and spheres with nominal diameters of 0.05, 0.1, and 0.2–3 mm, respectively.
Based on the simulations' output, average atmospheric residence times and transport distances of the particles were determined. The relative decrease in total atmospheric particle mass as a function of time t was averaged over the number of releases and fitted to y = . Residence times were then determined as e-folding times te. The mean atmospheric transport distance is calculated from the distance of grid cell ij from the release point, Dij; the total mass deposited in grid cell ij, Mij; and the total mass deposited in the deposition field, ∑ijMij:
The deposition field represents the sum of dry and wet deposition fields. In FLEXPART, the dry deposition is treated as an exponential decay law of the dry deposition velocity, which is simulated with the resistance methodology, accounting for the aerodynamic and quasi-laminar sublayer resistances, as well as the settling velocity (Slinn, 1982). The wet deposition scheme in FLEXPART distinguishes between in-cloud and below-cloud scavenging. The in-cloud scavenging coefficient depends on the scavenging ratio between the concentration of a substance in precipitation and the concentration in air, further outlined in Grythe et al. (2017); the precipitation rate; and the cloud depth where precipitation occurs (Bakels et al., 2024). Below-cloud scavenging depends on the relationship between aerosol and hydrometeor size and type, which is taken into account by the scheme of Wang et al. (2014) in FLEXPART. The removal of particle mass due to wet deposition is determined by an exponential decay function with the scavenging coefficient as decay constant. In the wet scavenging scheme of FLEXPART, the cloud condensation nuclei (CCN) and ice-nucleating particle (INP) efficiencies were set to 0.001 and 0.01, representing hydrophobic particles (Evangeliou et al., 2020). Scavenging efficiencies for rain and snow were assumed as 1, following Evangeliou et al. (2020). However, the exact scavenging efficiencies of microplastics are currently unknown. To address this uncertainty, we explored the sensitivity of FLEXPART to high CCN (0.5) and IN efficiencies (0.8) (Evangeliou et al., 2020). We also tested low scavenging efficiencies for rain (0.6) and snow (0.5) (Wang et al., 2014). We found that atmospheric lifetime and transport distances were relatively insensitive to the tested range of wet scavenging parameters, with a total variation below 5 % (Table S1). This is caused by the dominance of dry deposition driven by gravitational settling.
3.1 Gravitational settling of glitters
The measured gravitational settling velocities for glitter particles range from 0.22 to 1.14 m s−1, whereas the corresponding calculated settling velocities of volume-equivalent spheres range from 0.39 to 4.37 m s−1 (Fig. 3a).
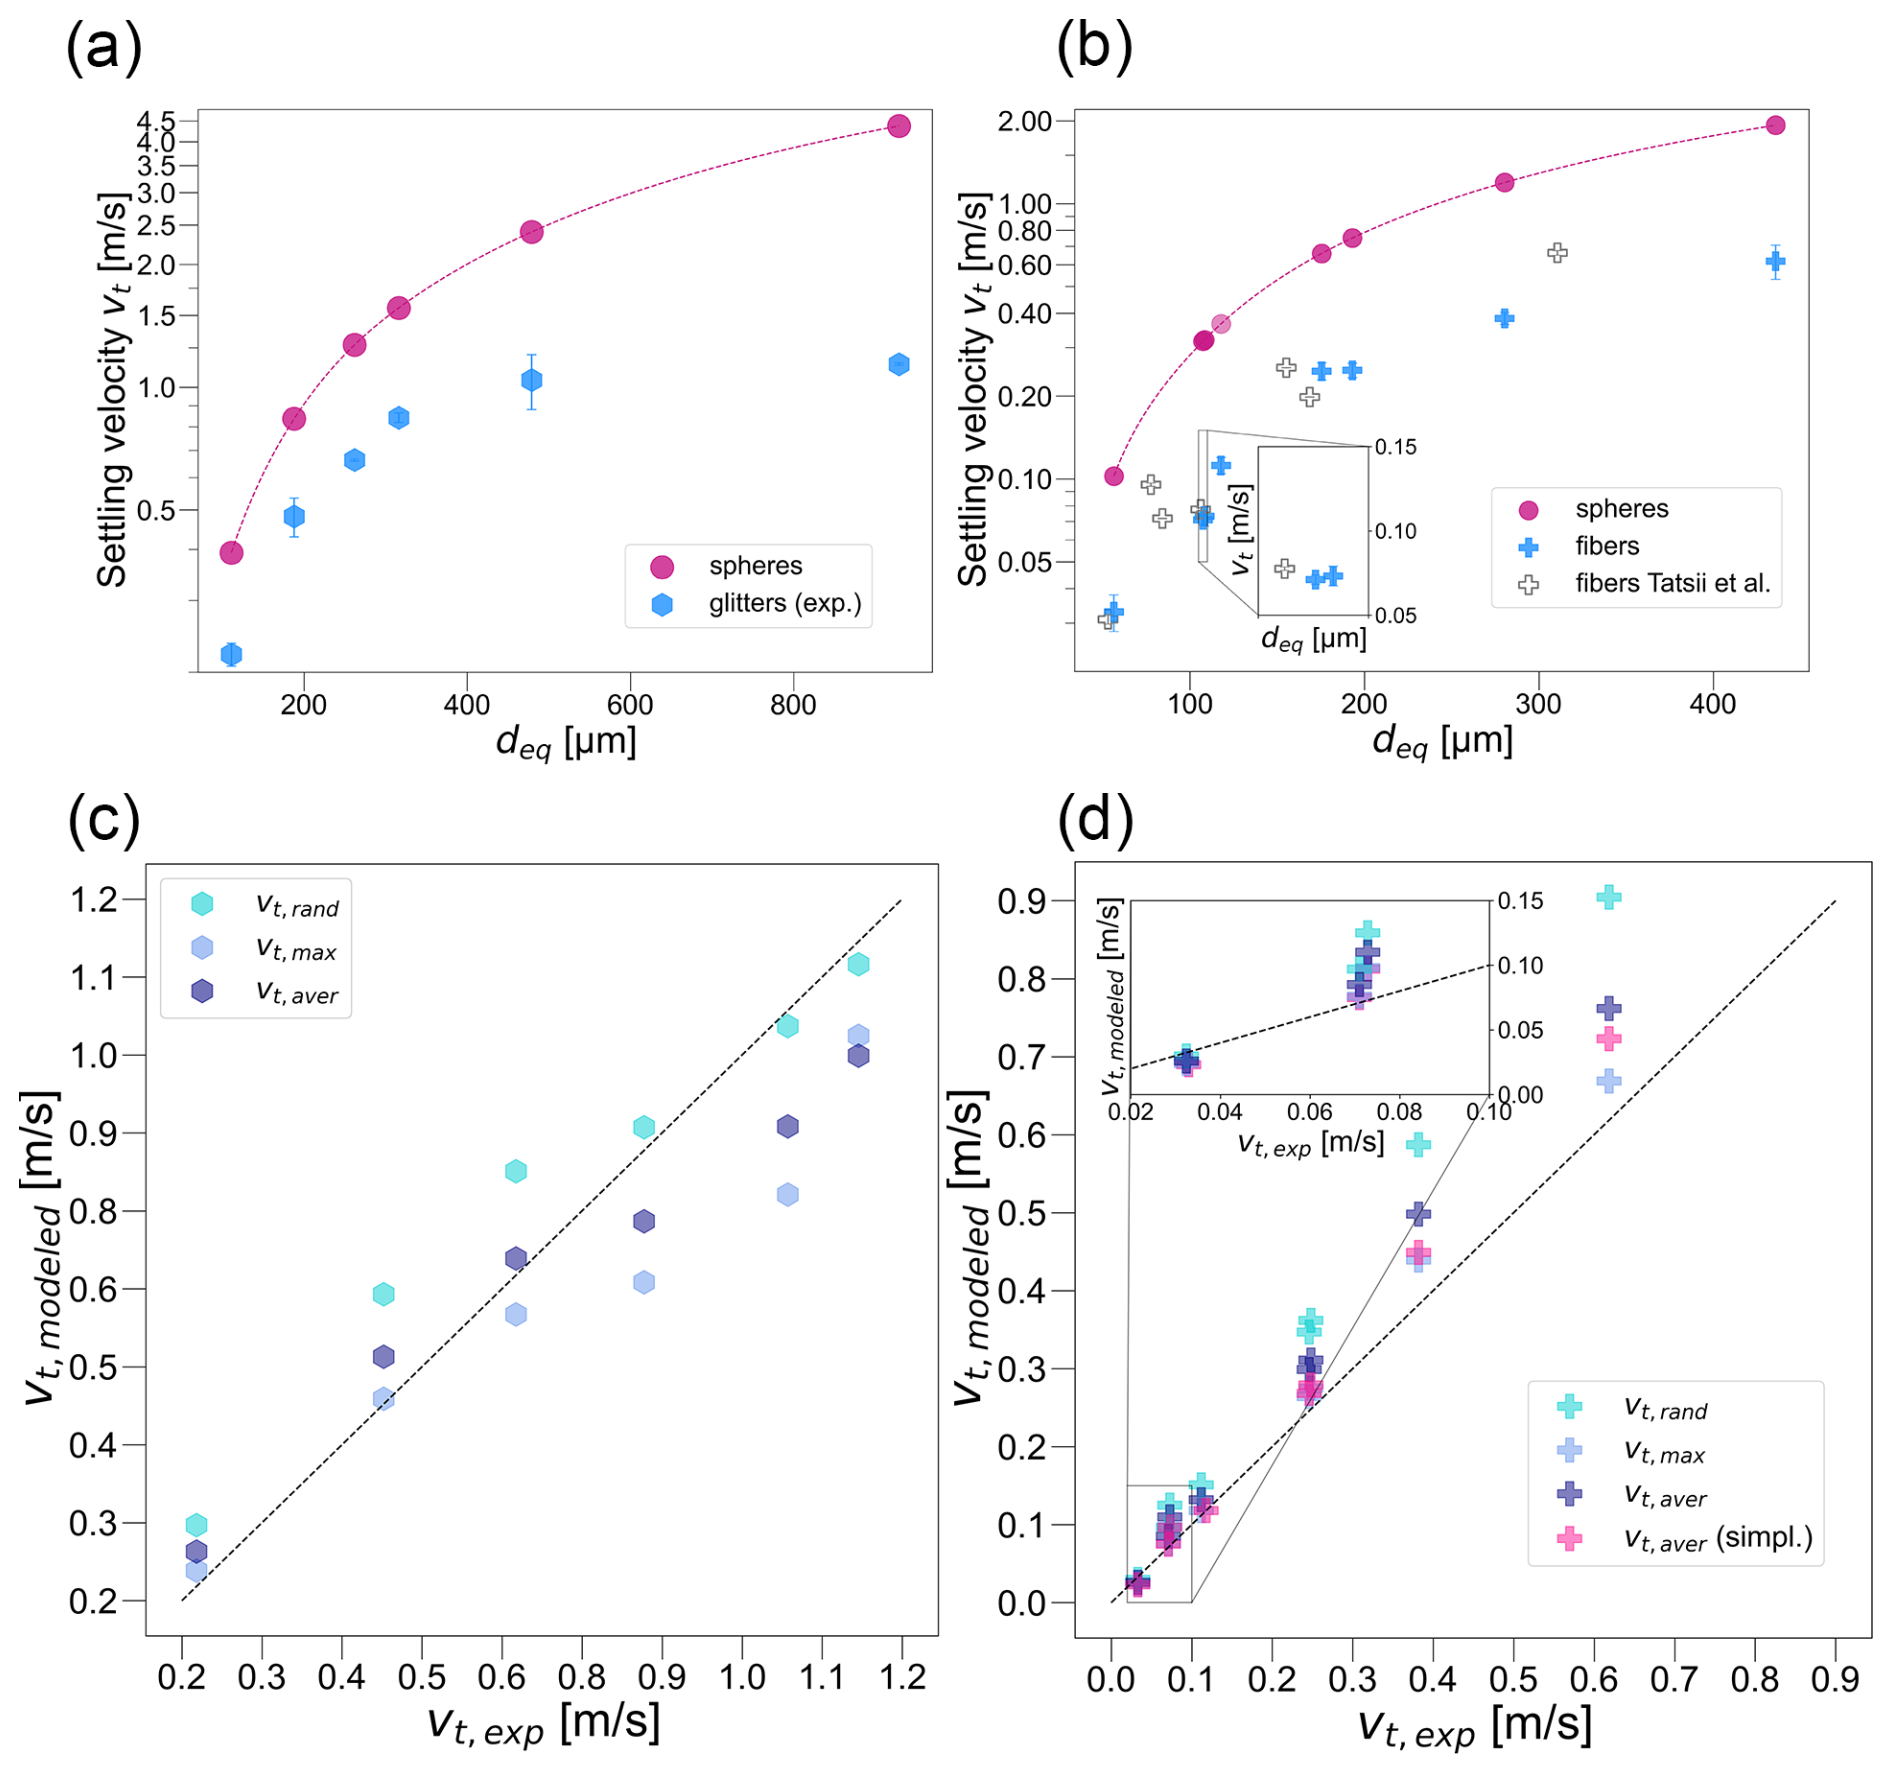
Figure 3Observed and modeled settling velocities. Measured (blue symbols) settling velocities of glitters (a) and fibers (b) as a function of particle size, expressed as the diameter of a sphere of equivalent volume. Error bars depict the standard deviation. Modeled values of spheres of equivalent volume are shown with pink circles. Blue hexagons (a) and crosses (b) represent experimental results for glitters and fibers, respectively. White crosses in panel (b) depict previously published experimental results of settling velocities of straight fibers (Tatsii et al., 2024). The inset in panel (b) shows a closer view of the experimental data on fiber settling velocities. Scatterplot comparing the modeled and measured settling velocities of glitters (c) and fibers (d). Modeled values were calculated with the full model version for random (light blue), maximum-drag (blue), and averaged (dark blue) orientations. In panel (d), settling velocities of straight fibers modeled with the simplified average-orientation-drag model (Tatsii et al., 2024) are depicted as well (pink crosses). The inset in panel (d) shows a closer view of the measured vs. modeled settling velocities of fibers. The dotted line shows the 1:1 relation.
The gravitational settling velocities of glitters are reduced by 42 % to 74 % compared to volume-equivalent spheres (Table 1). The relative differences between the settling velocities of spherical and nonspherical particles tend to increase with increasing particle size and decreasing sphericity Ψ. The greatest reductions in settling velocity occur for glitters with the largest aspect ratios ( ≥ 22), where settling velocities are only 43 % and 26 % of those of volume-equivalent spheres.
Figure 3c compares the observed gravitational settling velocities of the glitters with those predicted by the model of Bagheri and Bonadonna (2016, 2019), shown in Table 1. With average-orientation-drag configuration, the model of Bagheri and Bonadonna (2016, 2019) agrees well with the measurements, with a relative difference of 14.4 %. The highest deviations are received with the random-orientation-drag configuration (19.0 %). This configuration performs well for large glitter particles (nominal diameters > 0.4 mm), with a relative difference of 3.6 % but performs less accurately for smaller particles (0.1 and 0.2 mm nominal diameters), with an average relative difference of 26.3 %. The best overall agreement is achieved for the maximum-orientation-drag configuration, which yields an average relative difference of 13.2 %. This configuration shows the most accurate predictions for particles ≤ 0.2 mm, with an average relative difference of 5.2 %. In general, the model of Bagheri and Bonadonna (2016, 2019) overestimates the settling velocities of small glitters and underestimates those of large glitters. It should also be noted that the estimation of settling velocities is based on the mean of the measured dimensions and the nominal shapes of the particles given by the manufacturer, which may be subject to some variation, as shown in Figs. 2 and S1–S3. As a result, the discrepancies between the model of Bagheri and Bonadonna (2016, 2019) and the glitter particles are partly attributable to imperfections in the shape and size of the particles. It is important to note that the experimental results presented here are specific to still-air conditions. To understand how turbulence may alter settling behavior, Tinklenberg et al. (2024) investigated the effect of turbulence on PET disks between 0.3 and 3 mm falling in air. The smaller disks (0.3 and 0.5 mm nominal diameters) settled with the largest projection-area normal to the falling direction, independently of turbulence. The settling velocities of larger particles (nominal diameters of 1–3 mm) decreased in turbulent conditions, for the 3 mm disks influenced most significantly (up to 35 % compared to still-air conditions), which is attributed to drag nonlinearity. The authors report a much more randomized orientation distribution for millimeter-sized disks falling in turbulent air compared to quiescent air. Rotation rates, however, were not significantly altered.
Overall, as particle size increases, the comparison of observed and modeled settling velocities suggests a shift from maximum-orientation drag to average-orientation drag and then to random-orientation drag. This can best be seen in Fig. 3c, which compares modeled and observed settling velocities. In fact, in our experiments, we observed that the smallest glitters (0.1 and 0.2 mm nominal diameters) reached a terminal, steady-state orientation with their largest projection area perpendicular to the settling direction. Similar behavior has been observed by Bhowmick et al. (2024a, b) and Tinklenberg et al. (2023) in air and by Goral et al. (2023) for flat disks, square plates, and irregularly shaped microplastics in distilled water. In contrast, for larger glitter particles, tumbling motions occurred that increased with increasing particle size. This is in agreement with the observed shift of the best-suited particle-orientation model with particle size. In the literature, a Reynolds number Re ≈ 100 is quoted as a threshold below which particles tend to fall with their maximum projection area normal to the direction of gravity (Bagheri and Bonadonna, 2016; Willmarth et al., 1964). However, in our experiments, tumbling motions occur already at Re < 100, from about Re = 17 and becoming quite pronounced at Re = 69. Further investigation is needed to ascertain whether this discrepancy arises from differences in particle shapes or from variations in the experimental setups, each with its distinct capabilities and limitations.
3.2 Gravitational settling of fibers
The measured gravitational settling velocities for fibers range from 0.03 to 0.62 m s−1. The corresponding calculated settling velocities of volume-equivalent spheres range from 0.10 to 1.93 m s−1 (Fig. 3b). The settling velocities of fibers are reduced by 58 %–78 % compared to volume-equivalent spheres (Table 2). As with the glitters and in agreement with the results of Tatsii et al. (2024), the largest differences are observed for fibers with the largest aspect ratios ( = 63, 121).
Figure 3d presents a comparison of the modeled and experimental settling velocities of the fibers. The scheme of Bagheri and Bonadonna (2016, 2019) agrees best with the experiments with maximum-orientation-drag configuration, with a deviation of 12.4 %. For average-orientation drag, the relative difference is 21.6 %, and the largest deviation occurs again with random-orientation drag (31.7 %).
In our experiments, most fibers achieved a terminal, steady-state orientation with their largest projected area normal to gravity, which is in agreement with previous work (Tatsii et al., 2024; Bhowmick et al., 2024a, b; Newsom and Bruce, 1994; Goral et al., 2023). This explains why the maximum-orientation-drag configuration works best for all particle sizes. The simplified average-orientation-drag model works well for fibers too (Table S3), similar to the study of Tatsii et al. (2024). For the simplified model, the best agreement is again achieved for the maximum-orientation-drag configuration, with a relative difference of 7.3 %, followed by the average-orientation-drag configuration (13.2 %). The largest difference occurs for random-orientation drag (24.3 %). However, Tatsii et al. (2024) investigated custom-produced fibers with submicron precision, minimizing the occurrence of imperfection and irregularities. In contrast, the commercially available fibers examined here are associated with certain deviations from the nominal size and shape, which introduces some uncertainties in the comparisons. Broadening the context to include turbulent conditions, Tatsii et al. (2024) compared the smallest atmospheric vortices (Kolmogorov microscales) with the properties of the microplastic fibers used in their experiments. Their conclusions are relevant for our fibers as well, as they are similar in size. They found that the timescales for alignment in fiber orientation are smaller than the smallest timescales typically encountered in atmospheric turbulence and that their settling velocities are larger than the Kolmogorov velocity scale. Therefore, they conclude that their measured settling velocities are representative of fibers in a turbulent atmosphere.
3.3 Impact on atmospheric transport
The good agreement between measured and modeled settling velocities allows for the use of the full Bagheri and Bonadonna (2016, 2019) scheme with maximum-orientation drag for simulating the gravitational settling of glitters in the atmosphere. For this, the scheme has been implemented into the Lagrangian transport model FLEXPART. Figure 4 shows the atmospheric transport potential of glitters, represented by the annual mean of atmospheric horizontal travel distance and residence time, averaged over all six release points. Figures S6–S7 depict annual mean atmospheric travel distances and residence times for each release point separately. Differences in travel distance and residence time that occur between release points can be attributed to different meteorological conditions, causing differences, for example, in vertical transport and, especially, wet deposition. In the following, we concentrate on the results averaged over all release sites.
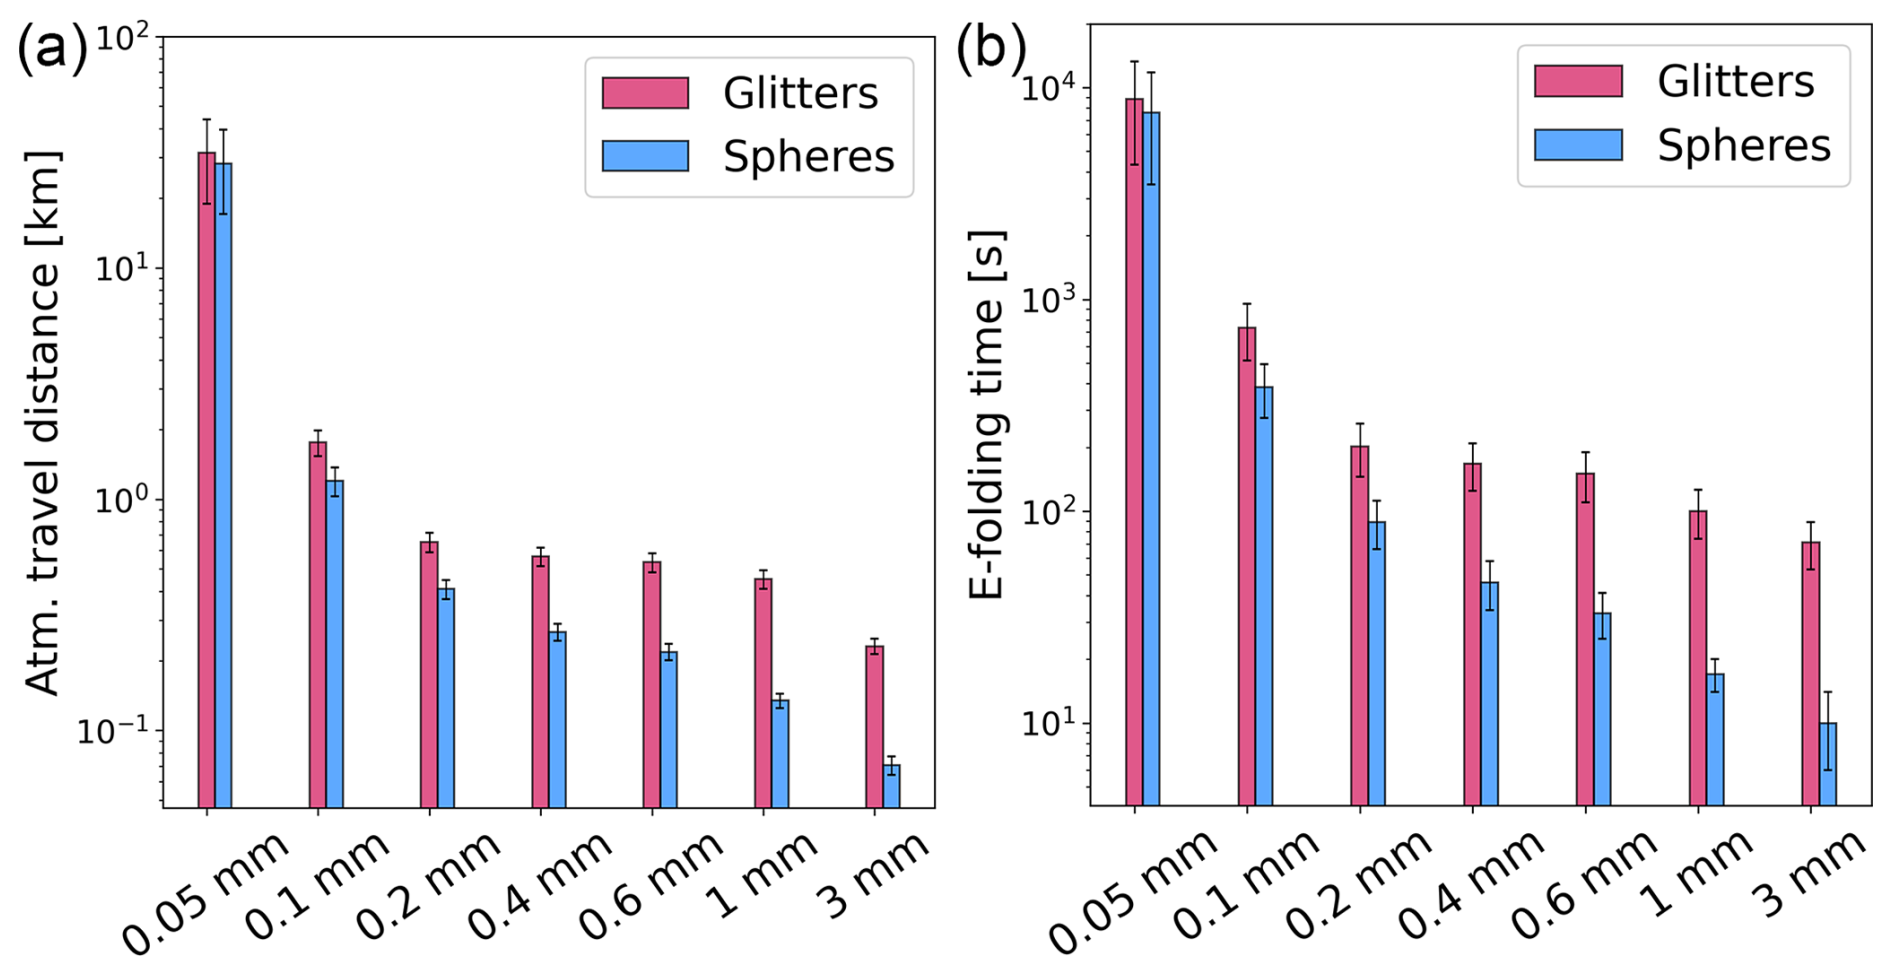
Figure 4Atmospheric transport potential of glitters and volume-equivalent spheres. Shown are annual mean atmospheric horizontal travel distances (a) and atmospheric residence times (b) of glitters (pink) and spheres (blue). The results are averaged over all release points. Standard deviations are depicted by whiskers.
With increasing equivalent diameter, the particles' mean horizontal atmospheric travel distances resulting from the FLEXPART simulations decrease (Fig. 4a): glitters with nominal diameters of 0.05, 0.1, 0.2, 0.4, 0.6, 1, and 3 mm travel 33.24, 1.52, 0.57, 0.48, 0.45, 0.38, and 0.21 km on average, and their volume-equivalent spheres travel 29.47, 1.04, 0.34, 0.22, 0.18, 0.11, and 0.06 km, respectively. The smallest commercially available glitters therefore have the potential to pollute the areas surrounding the cities they are released in, while glitters larger than that are deposited close to their release points and will likely only affect the cities directly. However, resuspension of deposited particles, which is not considered in our simulations, may extend the effective transport distances substantially for all of the studied particles. The e-folding times of glitters with nominal diameters of 0.05, 0.1, 0.2, 0.4, 0.6, 1, and 3 mm are 146.83, 12.25, 3.36, 2.78, 2.50, 1.67, and 1.18 min, respectively, while the residence times of respective volume-equivalent spheres are 127.00, 6.42, 1.48, 0.77, 0.55, 0.28, and 0.15 min.
Across all release points, the travel distances of 0.05, 0.1, 0.2, 0.4, 0.6, 1, and 3 mm glitters are 12 ± 5 %, 48 ± 6 %, 69 ± 14 %, 118 ± 11 %, 147 ± 10 %, 238 ± 19 %, and 261 ± 48 % greater than those of volume-equivalent spheres. This can be attributed to the longer atmospheric residence times of nonspherical particles in comparison to spherical ones (Fig. 4b). The mean atmospheric residence times of 0.05, 0.1, 0.2, 0.4, 0.6, 1, and 3 mm glitters are 7 ± 14 %, 90 ± 9 %, 128 ± 11 %, 264 ± 41 %, 346 ± 49 %, 477 ± 99 %, and 699 ± 213 % longer compared to volume-equivalent spheres. Notice that, similar to the settling velocities, the relative differences between spherical and nonspherical particles for both travel distances and residence times increase with decreasing sphericity.
We compare these results with findings from other modeling approaches: Saxby et al. (2018) find that nonspherical particles (sphericity = 0.5) travel 44 % further than spheres from their source. The authors used the atmospheric dispersion model NAME (Numerical Atmospheric-dispersion Modelling Environment; Jones et al., 2007) and a measured shape parameter. Using Hybrid Single-Particle Lagrangian Integrated Trajectory model (HYSPLIT; Stein et al., 2015) backward-trajectory analyses, Wright et al. (2020) estimate that 100 µm spheres (ρ = 1.05 g cm−3, vt = 0.32 m s−1) travel up to approximately 12 km. It is important to note, however, that the settling velocities used by these authors have been estimated by Stokes' law. Long et al. (2022) utilized the Bagheri and Bonadonna (2016) scheme together with the Weather Research and Forecasting (WRF) model to predict the travel distances of microplastics. The fragments used by these authors show densities (1.1–1.2 g cm−3) and longest dimensions (60, 150, and 260 µm) comparable to some glitters in the current study. However, they have considerably smaller thickness (3 µm), sphericity (0.29, 0.18, and 0.12), and equivalent diameter (27, 51, and 73 µm) compared to glitters with similar longest dimensions. Therefore, for these fragments, the authors report settling velocities of 0.01 m s−1 and travel distances > 1000 km. A comparison to the results of Long et al. (2022) would therefore not make much sense. Instead, their results are included as a valuable demonstration of atmospheric transport potential of small fragments.
The gravitational settling velocities of glitter particles with nominal diameters between 0.1 and 3 mm and fibers with lengths between 1.2 and 5 mm were measured in a settling chamber. The observed settling velocities were compared to settling velocities of volume-equivalent spheres and to modeled velocities using the Bagheri and Bonadonna (2016, 2019) shape-correction scheme. We have determined that glitters and fibers settle up to 74 % and 78 % slower compared to volume-equivalent spheres, respectively. The results are similar to those of Tatsii et al. (2024), who investigated the shape dependency of CD for 3D-printed, uniform microplastic fibers. They found that settling velocities of fibers are reduced by up to 76 % compared to volume-equivalent spheres, with highly elongated fibers exhibiting great atmospheric transport potential, capable of reaching remote locations such as the Arctic, when emitted in populated regions. The good agreement between modeled and observed settling velocities (average relative differences of 13.2 % for glitters and 12.4 % for fibers) shows that the model is suitable also for non-ideal, commercially available particles, which often have rough and complex surfaces. This is an important extension of the work of Tatsii et al. (2024), who only used microplastic fibers with perfectly defined shapes.
We use the Lagrangian transport model FLEXPART (Bakels et al., 2024) with an implemented shape correction scheme (Bagheri and Bonadonna, 2016, 2019) to simulate the atmospheric transport of glitter particles. By that, we have shown that commercial glitters have relatively large atmospheric transport potential, with the smallest particles traveling up to 33 km. Our simulation results also demonstrate that microplastic glitters are transported substantially farther than volume-equivalent spheres in the atmosphere: the atmospheric transport distances of microplastic glitters are up to 3.5 times greater than those of volume-equivalent spheres. This is a result of the longer atmospheric residence times of glitters, with e-folding times up to 7.4 times longer compared to spheres. These results indicate that glitter, when released into the air, may be transported on urban and regional scales. The same also holds true for microplastic fibers, as shown by Tatsii et al. (2024). This is particularly relevant for glitter released during parades or carnivals in cities, since airborne glitters may be deposited in soils and water bodies in and outside of the city, including also agricultural fields or conservation areas. Similarly, fibers released, for example, from clothes could easily be transported beyond the urban area. Especially for smaller glitters and fibers, the atmosphere therefore constitutes an important transport medium, which is problematic since these particles are associated with the greatest harm for organisms and soils (Medyńska-Juraszek and Jadhav, 2022; Provenza et al., 2022). Furthermore, microplastic particles under weathering processes such as UV radiation, oxidation, or abrasion can degradate and fragment (Andrady, 2011), which will increase their transport potential. Resuspension from the ground would further enhance this, with particles potentially grasshopping several times before being incorporated into the soil matrix or a water body, which may – at least temporarily – halt the atmospheric transport.
Microplastic films or disks of higher aspect ratios and smaller sizes than considered here might even have larger atmospheric transport potential, constituting a possible field of further research. Overall, our results enhance the understanding of the shape-dependent settling behavior of airborne microplastics and can be used to constrain atmospheric transport models by accounting for such complex shapes as hexagonal disks and highly elongated fibers. The size and shape of the glitter particles used in this work are comparable to other aerosols, exhibiting disk-like shapes, such as plate crystals, mineral dust, pollen, or spores. This similarity extends the relevance of our work to these other types of particles.
The data underlying the study are openly available on Zenodo and can be accessed via https://doi.org/10.5281/zenodo.15744633 (Reininger, 2025).
The supplement related to this article is available online at https://doi.org/10.5194/acp-25-10691-2025-supplement.
AS, GB, DT, and AR: conceptualization and research design. AR, TB, and GB: preparation of the experiments. AR and TB: experiments. GB: postprocessing of the experimental data. AR, TB, and GB:analysis of the experimental data. AR, DT, and AS: FLEXPART modeling. AR, DT, and AS: analysis of the model results. AR: visualization. AR, DT, AS, TB, and GB: interpretation of the results. AR: writing (original draft). AR, DT, AS, TB, and GB: writing (review and editing). DT, AS, TB, and GB: supervision.
The contact author has declared that none of the authors has any competing interests.
Publisher’s note: Copernicus Publications remains neutral with regard to jurisdictional claims made in the text, published maps, institutional affiliations, or any other geographical representation in this paper. While Copernicus Publications makes every effort to include appropriate place names, the final responsibility lies with the authors.
The authors thank Alfredo Soldati, Giuseppe Carlo Alp Caridi, and Vlad Giurgiu from the Institute of Fluid Dynamics and Heat Transfer, TU Wien, for supplying the fibers and Alexander Bismarck and Qixiang Jiang from the Department of Materials Chemistry, University of Vienna, for providing the pycnometer for the density measurements of the glitter particles. We would like to thank the Max Planck Society and the MPI-DS for their support.
This research has been supported by the research platform PLENTY (Plastics in the Environment and Society) financed by the University of Vienna (project number 326400). Open-access funding provided by the University of Vienna.
This paper was edited by Sergio Rodríguez and reviewed by two anonymous referees.
Abbasi, S., Keshavarzi, B., Moore, F., Delshab, H., Soltani, N., and Sorooshian, A.: Investigation of microrubbers, microplastics and heavy metals in street dust: a study in Bushehr city, Iran, Environ. Earth Sci., 76, 798, https://doi.org/10.1007/s12665-017-7137-0, 2017. a
Abbasi, S., Keshavarzi, B., Moore, F., Turner, A., Kelly, F. J., Dominguez, A. O., and Jaafarzadeh, N.: Distribution and potential health impacts of microplastics and microrubbers in air and street dusts from Asaluyeh County, Iran, Environ. Pollut., 244, 153–164, https://doi.org/10.1016/j.envpol.2018.10.039, 2019. a, b
Abessa, D. M. d. S., Albanit, L. F., Moura, P. H. P. d., Nogueira, V. S., Santana, F. T., Fagundes, K., Ueda, M., Muller, O. P. d. O., and Cesar-Ribeiro, C.: A Glow before Darkness: Toxicity of Glitter Particles to Marine Invertebrates, Toxics, 11, 617, https://doi.org/10.3390/toxics11070617, 2023. a
Allen, S., Allen, D., Phoenix, V. R., Le Roux, G., Durántez Jiménez, P., Simonneau, A., Binet, S., and Galop, D.: Atmospheric transport and deposition of microplastics in a remote mountain catchment, Nat. Geosci., 12, 339–344, https://doi.org/10.1038/s41561-019-0335-5, 2020. a, b
Ambrosini, R., Azzoni, R. S., Pittino, F., Diolaiuti, G., Franzetti, A., and Parolini, M.: First evidence of microplastic contamination in the supraglacial debris of an alpine glacier, Environ. Pollut., 253, 297–301, https://doi.org/10.1016/j.envpol.2019.07.005, 2019. a
Andrady, A. L.: Microplastics in the marine environment, Mar. Pollut. Bull., 62, 1596–1605, https://doi.org/10.1016/j.marpolbul.2011.05.030, 2011. a
Auta, H., Emenike, C., and Fauziah, S.: Distribution and importance of microplastics in the marine environment: A review of the sources, fate, effects, and potential solutions, Environ. Int., 102, 165–176, https://doi.org/10.1016/j.envint.2017.02.013, 2017. a
Bagheri, G. and Bonadonna, C.: On the drag of freely falling non-spherical particles, Powder Technol., 301, 526–544, https://doi.org/10.1016/j.powtec.2016.06.015, 2016. a, b, c, d, e, f, g, h, i, j, k, l, m, n, o, p, q, r, s
Bagheri, G. and Bonadonna, C.: Erratum to “On the drag of freely falling non-spherical particles” [Powder Technology 301 (2016) 526–544, DOI: 10.1016/j.powtec.2016.06.015], Powder Technol., 349, 108, https://doi.org/10.1016/j.powtec.2018.12.040, 2019. a, b, c, d, e, f, g, h, i, j, k, l, m, n
Bakels, L., Tatsii, D., Tipka, A., Thompson, R., Dütsch, M., Blaschek, M., Seibert, P., Baier, K., Bucci, S., Cassiani, M., Eckhardt, S., Groot Zwaaftink, C., Henne, S., Kaufmann, P., Lechner, V., Maurer, C., Mulder, M. D., Pisso, I., Plach, A., Subramanian, R., Vojta, M., and Stohl, A.: FLEXPART version 11: improved accuracy, efficiency, and flexibility, Geosci. Model Dev., 17, 7595–7627, https://doi.org/10.5194/gmd-17-7595-2024, 2024. a, b, c, d
Ballent, A., Corcoran, P. L., Madden, O., Helm, P. A., and Longstaffe, F. J.: Sources and sinks of microplastics in Canadian Lake Ontario nearshore, tributary and beach sediments, Mar. Pollut. Bull., 110, 383–395, https://doi.org/10.1016/j.marpolbul.2016.06.037, 2016. a
Bergmann, M., Mützel, S., Primpke, S., Tekman, M. B., Trachsel, J., and Gerdts, G.: White and wonderful? Microplastics prevail in snow from the Alps to the Arctic, Sci. Adv, 5, eaax1157, https://doi.org/10.1126/sciadv.aax1157, 2019. a
Bhowmick, T., Seesing, J., Gustavsson, K., Guettler, J., Wang, Y., Pumir, A., Mehlig, B., and Bagheri, G.: Inertia Induces Strong Orientation Fluctuations of Nonspherical Atmospheric Particles, Phys. Rev. Lett., 132, 034101, https://doi.org/10.1103/PhysRevLett.132.034101, 2024a. a, b, c, d, e, f, g, h, i
Bhowmick, T., Wang, Y., Latt, J., and Bagheri, G.: Twist, turn and encounter: the trajectories of small atmospheric particles unravelled, arXiv [preprint], https://doi.org/10.48550/arXiv.2408.11487, 28 August 2024b. a, b
Bhowmick, T., Latt, J., Wang, Y., and Bagheri, G.: Palabos Turret: A particle-resolved numerical framework for settling dynamics of arbitrary-shaped particles, Comput. Fluids, 299, 106696, https://doi.org/10.1016/j.compfluid.2025.106696, 2025. a
Blackledge, R. D. and Jones Jr., E. L.: All that Glitters Is Gold!, John Wiley & Sons, Ltd, Chap. 1, 1–32, https://doi.org/10.1002/9780470166932.ch1, ISBN 9780470166932, 2007. a
Brahney, J., Hallerud, M., Heim, E., Hahnenberger, M., and Sukumaran, S.: Plastic rain in protected areas of the United States, Science, 368, 1257–1260, https://doi.org/10.1126/science.aaz5819, 2020. a
Cabrera, M., Valencia, B. G., Lucas-Solis, O., Calero, J. L., Maisincho, L., Conicelli, B., Massaine Moulatlet, G., and Capparelli, M. V.: A new method for microplastic sampling and isolation in mountain glaciers: A case study of one antisana glacier, Ecuadorian Andes, Case Studies in Chemical and Environmental Engineering, 2, 100051, https://doi.org/10.1016/j.cscee.2020.100051, 2020. a, b
Cai, L., Wang, J., Peng, J., Tan, Z., Zhan, Z., Tan, X., and Chen, Q.: Characteristic of microplastics in the atmospheric fallout from Dongguan city, China: preliminary research and first evidence, Environ. Sci. Pollut. R., 24, 24928–24935, https://doi.org/10.1007/s11356-017-0116-x, 2017. a, b
Chen, P.-H., Droguet, B. E., Lam, I., Green, D. S., Vignolini, S., Gu, Z., De Silva, S., and Reichman, S. M.: Assessing the ecotoxicological effects of novel cellulose nanocrystalline glitter compared to conventional polyethylene terephthalate glitter: Toxicity to springtails (Folsomia candida), Chemosphere, 366, 143315, https://doi.org/10.1016/j.chemosphere.2024.143315, 2024. a
Clift, R. and Gauvin, W. H.: Motion of entrained particles in gas streams, Can. J. Chem. Eng., 49, 439–448, https://doi.org/10.1002/cjce.5450490403, 1971. a, b, c, d
Coyle, R., Service, M., Witte, U., Hardiman, G., and McKinley, J.: Modeling Microplastic Transport in the Marine Environment: Testing Empirical Models of Particle Terminal Sinking Velocity for Irregularly Shaped Particles, ACS ES&T Water, 3, 984–995, https://doi.org/10.1021/acsestwater.2c00466, 2023. a
Das Pramanik, D., Lei, S., Kay, P., and Goycoolea, F. M.: Investigating on the toxicity and bio-magnification potential of synthetic glitters on Artemia salina, Mar. Pollut. Bull., 190, 114828, https://doi.org/10.1016/j.marpolbul.2023.114828, 2023. a
Dehghani, S., Moore, F., and Akhbarizadeh, R.: Microplastic pollution in deposited urban dust, Tehran metropolis, Iran, Environ. Sci. Pollut. R., 24, 20360–20371, https://doi.org/10.1007/s11356-017-9674-1, 2017. a
Dris, R., Gasperi, J., Rocher, V., Saad, M., Renault, N., and Tassin, B.: Microplastic contamination in an urban area: a case study in Greater Paris, Environ. Chem., 12, 592–599, https://doi.org/10.1071/EN14167, 2015. a
Dris, R., Gasperi, J., Saad, M., Mirande, C., and Tassin, B.: Synthetic fibers in atmospheric fallout: A source of microplastics in the environment?, Environ. Pollut., 104, 290–293, https://doi.org/10.1016/j.marpolbul.2016.01.006, 2016. a
Dąbrowska, A.: Soil microplastics – current research trends and challenges: preliminary results of the earthworm Eisenia fetida impact on glitters, Acta Horticulturae et Regiotecturae, 25, 141–150, https://doi.org/10.2478/ahr-2022-0018, 2022. a
Evangeliou, N., Grythe, H., Klimont, Z., Heyes, C., Eckhardt, S., Lopez-Aparicio, S., and Stohl, A.: Atmospheric transport is a major pathway of microplastics to remote regions, Nat. Commun., 11, 3381, https://doi.org/10.1038/s41467-020-17201-9, 2020. a, b, c
Ganser, G. H.: A rational approach to drag prediction of spherical and nonspherical particles, Powder Technol., 77, 143–152, https://doi.org/10.1016/0032-5910(93)80051-B, 1993. a
Goral, K. D., Guler, H. G., Larsen, B. E., Carstensen, S., Christensen, E. D., Kerpen, N. B., Schlurmann, T., and Fuhrman, D. R.: Settling velocity of microplastic particles having regular and irregular shapes, Environ. Res., 228, 115783, https://doi.org/10.1016/j.envres.2023.115783, 2023. a, b
Gray, A. D. and Weinstein, J. E.: Size- and shape-dependent effects of microplastic particles on adult daggerblade grass shrimp (Palaemonetes pugio), Environ. Toxicol. Chem., 36, 3074–3080, https://doi.org/10.1002/etc.3881, 2017. a
Green, D. S., Jefferson, M., Boots, B., and Stone, L.: All that glitters is litter? Ecological impacts of conventional versus biodegradable glitter in a freshwater habitat, J. Hazard. Mater., 402, 124070, https://doi.org/10.1016/j.jhazmat.2020.124070, 2021. a
Grythe, H., Kristiansen, N. I., Groot Zwaaftink, C. D., Eckhardt, S., Ström, J., Tunved, P., Krejci, R., and Stohl, A.: A new aerosol wet removal scheme for the Lagrangian particle model FLEXPART v10, Geosci. Model Dev., 10, 1447–1466, https://doi.org/10.5194/gmd-10-1447-2017, 2017. a
Harley-Nyang, D., Memon, F. A., Jones, N., and Galloway, T.: Investigation and analysis of microplastics in sewage sludge and biosolids: A case study from one wastewater treatment works in the UK, Sci. Total Environ., 823, 153735, https://doi.org/10.1016/j.scitotenv.2022.153735, 2022. a
Hartmann, N., Hüffer, T., Thompson, R., Hassellöv, M., Verschoor, A., Daugaard, A., Rist, S., Karlsson, T., Brennholt, N., Cole, M., Herrling, M., Hess, M., Ivleva, N., Lusher, A., and Wagner, M.: Are We Speaking the Same Language? Recommendations for a Definition and Categorization Framework for Plastic Debris., Environ. Sci. Technol., 53, 1039–1047, https://doi.org/10.1021/acs.est.8b05297, 2019. a, b
Hersbach, H., Bell, B., Berrisford, P., Hirahara, S., Horányi, A., Muñoz-Sabater, J., Nicolas, J., Peubey, C., Radu, R., Schepers, D., Simmons, A., Soci, C., Abdalla, S., Abellan, X., Balsamo, G., Bechtold, P., Biavati, G., Bidlot, J., Bonavita, M., De Chiara, G., Dahlgren, P., Dee, D., Diamantakis, M., Dragani, R., Flemming, J., Forbes, R., Fuentes, M., Geer, A., Haimberger, L., Healy, S., Hogan, R. J., Hólm, E., Janisková, M., Keeley, S., Laloyaux, P., Lopez, P., Lupu, C., Radnoti, G., de Rosnay, P., Rozum, I., Vamborg, F., Villaume, S., and Thépaut, J.-N.: The ERA5 global reanalysis, Q. J. Roy. Meteor. Soc., 146, 1999–2049, https://doi.org/10.1002/qj.3803, 2020. a
Huang, Y., He, T., Yan, M., Yang, L., Gong, H., Wang, W., Qing, X., and Wang, J.: Atmospheric transport and deposition of microplastics in a subtropical urban environment, J. Hazard. Mater., 416, 126168, https://doi.org/10.1016/j.jhazmat.2021.126168, 2021. a
Jones, A., Thomson, D., Hort, M., and Devenish, B.: The UK Met Office's next-generation atmospheric dispersion model, NAME III, in: Air pollution modeling and its application XVII, Springer, 580–589, https://doi.org/10.1007/978-0-387-68854-1_62, 2007. a
Kim, D., Kim, H., and An, Y.-J.: Effects of synthetic and natural microfibers on Daphnia magna–Are they dependent on microfiber type?, Aquat. Toxicol., 240, 105968, https://doi.org/10.1016/j.aquatox.2021.105968, 2021. a
Kwak, J. I., Liu, H., Wang, D., Lee, Y. H., Lee, J.-S., and An, Y.-J.: Critical review of environmental impacts of microfibers in different environmental matrices, Comp. Biochem. Phys. C, 251, 109196, https://doi.org/10.1016/j.cbpc.2021.109196, 2022. a
Liu, K., Wang, X., Fang, T., Xu, P., Zhu, L., and Li, D.: Source and potential risk assessment of suspended atmospheric microplastics in Shanghai, Sci. Total Environ., 675, 462–471, https://doi.org/10.1016/j.scitotenv.2019.04.110, 2019a. a
Liu, K., Wu, T., Wang, X., Song, Z., Zong, C., Wei, N., and Li, D.: Consistent Transport of Terrestrial Microplastics to the Ocean through Atmosphere, Environ. Sci. Technol., 53, 10612–10619, https://doi.org/10.1021/acs.est.9b03427, 2019b. a
Long, X., Fu, T.-M., Yang, X., Tang, Y., Zheng, Y., Zhu, L., Shen, H., Ye, J., Wang, C., Wang, T., and Li, B.: Efficient Atmospheric Transport of Microplastics over Asia and Adjacent Oceans, Environ. Sci. Technol., 56, 6243–6252, https://doi.org/10.1021/acs.est.1c07825, 2022. a, b
Lusher, A. L., Hurley, R., Vogelsang, C., Nizzetto, L., and Olsen, M.: Mapping microplastics in sludge, NIVA, https://niva.brage.unit.no/niva-xmlui/handle/11250/2493527 (last access: 15 September 2025), 2017. a
Machado, M. J., Dextro, R. B., Cruz, R. B., Cotta, S. R., and Fiore, M. F.: Response of two cyanobacterial strains to non-biodegradable glitter particles, Aquat. Toxicol., 260, 106590, https://doi.org/10.1016/j.aquatox.2023.106590, 2023. a
Mandal, M., Roy, A., Singh, P., and Sarkar, A.: Quantification and characterization of airborne microplastics and their possible hazards: a case study from an urban sprawl in eastern India, Front. Environ. Chem., 5, 1499873, https://doi.org/10.3389/fenvc.2024.1499873, 2024. a
Market Research Intellect: Glitter Powder Market Size By Product, By Application, By Geography, Competitive Landscape And Forecast, https://www.marketresearchintellect.com/product/global-glitter-powder-market/ (last access: 15 September 2025), 2025. a, b, c, d
Martynova, A., Genchi, L., Laptenok, S. P., Cusack, M., Stenchikov, G. L., Liberale, C., and Duarte, C. M.: Atmospheric microfibrous deposition over the Eastern Red Sea coast, Sci. Total Environ., 907, 167902, https://doi.org/10.1016/j.scitotenv.2023.167902, 2024. a
Medyńska-Juraszek, A. and Jadhav, B.: Influence of Different Microplastic Forms on pH and Mobility of Cu2+ and Pb2+ in Soil, Molecules, 27, 1744, https://doi.org/10.3390/molecules27051744, 2022. a, b
Musso, M. M., Harms, F., Martina, M., Fischer, E. K., Leitl, B., and Trini Castelli, S.: Experimental investigation of the fallout dynamics of microplastic fragments in wind tunnel: The BURNIA agenda, J. Hazard. Mater. Adv., 14, 100433, https://doi.org/10.1016/j.hazadv.2024.100433, 2024. a
Newsom, R. and Bruce, C.: The dynamics of fibrous aerosols in a quiescent atmosphere, Phys. Fluids, 6, 521–530, 1994. a
Nithin, A., Sundaramanickam, A., and Sathish, M.: Seasonal distribution of microplastics in the surface water and sediments of the Vellar estuary, Parangipettai, southeast coast of India, Mar. Pollut. Bull., 174, 113248, https://doi.org/10.1016/j.marpolbul.2021.113248, 2022. a
Oberbeck, A.: Ueber stationäre Flüssigkeitsbewegungen mit Berücksichtigung der inneren Reibung, J. reine angew. Math., 81, 62–80, 1876. a
Petersen, F. and Hubbart, J. A.: The occurrence and transport of microplastics: The state of the science, Sci. Total Environ., 758, 143936, https://doi.org/10.1016/j.scitotenv.2020.143936, 2021. a, b, c
Pisso, I., Sollum, E., Grythe, H., Kristiansen, N. I., Cassiani, M., Eckhardt, S., Arnold, D., Morton, D., Thompson, R. L., Groot Zwaaftink, C. D., Evangeliou, N., Sodemann, H., Haimberger, L., Henne, S., Brunner, D., Burkhart, J. F., Fouilloux, A., Brioude, J., Philipp, A., Seibert, P., and Stohl, A.: The Lagrangian particle dispersion model FLEXPART version 10.4, Geosci. Model Dev., 12, 4955–4997, https://doi.org/10.5194/gmd-12-4955-2019, 2019. a
Prata, J. C.: Airborne microplastics: Consequences to human health?, Environ. Pollut., 234, 115–126, https://doi.org/10.1016/j.envpol.2017.11.043, 2018. a
Preston, C. A., McKenna Neuman, C. L., and Aherne, J.: Effects of Shape and Size on Microplastic Atmospheric Settling Velocity, Environ. Sci. Technol., 57, 11937–11947, https://doi.org/10.1021/acs.est.3c03671, 2023. a
Provenza, F., Anselmi, S., Specchiulli, A., Piccardo, M., Barceló, D., Prearo, M., Pastorino, P., and Renzi, M.: Sparkling plastic: Effects of exposure to glitter on the Mediterranean mussel Mytilus galloprovincialis, Environ. Toxicol. Phar., 96, 103994, https://doi.org/10.1016/j.etap.2022.103994, 2022. a, b
Qi, G. Q., Nathan, G. J., and Kelso, R. M.: PTV measurement of drag coefficient of fibrous particles with large aspect ratio, Powder Technol., 229, 261–269, https://doi.org/10.1016/j.powtec.2012.06.049, 2012. a
Raju, S., Carbery, M., Kuttykattil, A., Senthirajah, K., Lundmark, A., Rogers, Z., SCB, S., Evans, G., and Palanisami, T.: Improved methodology to determine the fate and transport of microplastics in a secondary wastewater treatment plant, Water Res., 173, 115549, https://doi.org/10.1016/j.watres.2020.115549, 2020. a
Reininger, A.: Data on the gravitational settling experiments and FLEXPART simulations, Version v1, Zenodo [data set], https://doi.org/10.5281/zenodo.15744633, 2025. a
Romanó de Orte, M., Clowez, S., and Caldeira, K.: Response of bleached and symbiotic sea anemones to plastic microfiber exposure, Environ. Pollut., 249, 512–517, https://doi.org/10.1016/j.envpol.2019.02.100, 2019. a
Saxby, J., Beckett, F., Cashman, K., Rust, A., and Tennant, E.: The impact of particle shape on fall velocity: Implications for volcanic ash dispersion modelling, J. Volcanol. Geoth. Res., 362, 32–48, https://doi.org/10.1016/j.jvolgeores.2018.08.006, 2018. a, b
Schneider, C. A., Rasband, W. S., and Eliceiri, K. W.: NIH Image to ImageJ: 25 years of image analysis, Nat. Methods, 9, 671–675, https://doi.org/10.1038/nmeth.2089, 2012. a
Slinn, W.: Predictions for particle deposition to vegetative canopies, Atmos. Environ., 16, 1785–1794, https://doi.org/10.1016/0004-6981(82)90271-2, 1982. a
Song, Y., Cao, C., Qiu, R., Hu, J., Liu, M., Lu, S., Shi, H., Raley-Susman, K. M., and He, D.: Uptake and adverse effects of polyethylene terephthalate microplastics fibers on terrestrial snails (Achatina fulica) after soil exposure, Environ. Pollut., 250, 447–455, https://doi.org/10.1016/j.envpol.2019.04.066, 2019. a
Stein, A. F., Draxler, R. R., Rolph, G. D., Stunder, B. J., Cohen, M. D., and Ngan, F.: NOAA's HYSPLIT atmospheric transport and dispersion modeling system, B. Am. Meteorol. Soc., 96, 2059–2077, https://doi.org/10.1175/BAMS-D-14-00110.1, 2015. a
Tagg, A. S. and Ivar do Sul, J. A.: Is this your glitter? An overlooked but potentially environmentally-valuable microplastic, Mar. Pollut. Bull., 146, 50–53, https://doi.org/10.1016/j.marpolbul.2019.05.068, 2019. a
Tatsii, D., Bucci, S., Bhowmick, T., Guettler, J., Bakels, L., Bagheri, G., and Stohl, A.: Shape Matters: Long-Range Transport of Microplastic Fibers in the Atmosphere, Environ. Sci. Technol., 58, 671–682, https://doi.org/10.1021/acs.est.3c08209, 2024. a, b, c, d, e, f, g, h, i, j, k, l, m, n, o, p, q, r
Tinklenberg, A., Guala, M., and Coletti, F.: Thin disks falling in air, J. Fluid Mech., 962, A3, https://doi.org/10.1017/jfm.2023.209, 2023. a, b, c
Tinklenberg, A., Guala, M., and Coletti, F.: Turbulence effect on disk settling dynamics, J. Fluid Mech., 992, A4, https://doi.org/10.1017/jfm.2024.534, 2024. a, b, c
Trainic, M., Flores, J. M., Pinkas, I., Pedrotti, M. L., Lombard, F., Bourdin, G., Gorsky, G., Boss, E., Rudich, Y., Vardi, A., and Koren, I.: Airborne microplastic particles detected in the remote marine atmosphere, Communications Earth & Environment, 1, 64, https://doi.org/10.1038/s43247-020-00061-y, 2020. a
Wang, X., Zhang, L., and Moran, M. D.: Development of a new semi-empirical parameterization for below-cloud scavenging of size-resolved aerosol particles by both rain and snow, Geosci. Model Dev., 7, 799–819, https://doi.org/10.5194/gmd-7-799-2014, 2014. a, b
Willmarth, W. W., Hawk, N. E., and Harvey, R. L.: Steady and Unsteady Motions and Wakes of Freely Falling Disks, Phys. Fluids, 7, 197–208, https://doi.org/10.1063/1.1711133, 1964. a
Wright, S., Ulke, J., Font, A., Chan, K., and Kelly, F.: Atmospheric microplastic deposition in an urban environment and an evaluation of transport, Environ. Int., 136, 105411, https://doi.org/10.1016/j.envint.2019.105411, 2020. a, b
Yoshida, L. L., Bianchini Jr., I., and da Cunha-Santino, M. B.: Interference of glitter with the photosynthetic rates of a submerged macrophyte, Egeria densa, New Zeal. J. Bot., 63, 507–520, https://doi.org/10.1080/0028825X.2023.2276284, 2023. a
Yurtsever, M.: Glitters as a Source of Primary Microplastics: An Approach to Environmental Responsibility and Ethics, J. Agric. Environ. Ethics, 32, 459–478, https://doi.org/10.1007/s10806-019-09785-0, 2019a. a, b
Yurtsever, M.: Tiny, shiny, and colorful microplastics: Are regular glitters a significant source of microplastics?, Mar. Pollut. Bull., 146, 678–682, https://doi.org/10.1016/j.marpolbul.2019.07.009, 2019b. a, b, c
Zanini, M. L. d. O., Fonseca, L. M., Piecha, C. R., Corrêa, C. d. P. L., Dode, L. B., Zavareze, E. d. R., and Diaz, P. S.: A Review of Conventional and Environmentally Sustainable Glitter, Environmental Quality Management, 34, e22322, https://doi.org/10.1002/tqem.22322, 2024. a, b, c, d, e
Zhang, Y., Kang, S., Allen, S., Allen, D., Gao, T., and Sillanpää, M.: Atmospheric microplastics: A review on current status and perspectives, Earth-Sci. Rev., 203, 103118, https://doi.org/10.1016/j.earscirev.2020.103118, 2020. a
Zhou, Q., Tian, C., and Luo, Y.: Various forms and deposition fluxes of microplastics identified in the coastal urban atmosphere, Chinese Sci. Bull., 62, 3902–3909, https://doi.org/10.1360/N972017-00956, 2017. a, b