the Creative Commons Attribution 4.0 License.
the Creative Commons Attribution 4.0 License.
 | 17 Sep 2025
Stratospheric aerosol formed by intense volcanism–sea interaction during the 2022 Hunga Ha'apai eruption
Bengt G. Martinsson
Johan Friberg
Moa K. Sporre
The Hunga Tonga eruption on 15 January 2022 (HT-22) induced vigorous volcano–sea interaction. Here we study the stratospheric aerosol and water vapor resulting from the eruption using satellite-based instruments: the CALIOP lidar and the Microwave Limb Sounder (MLS). We investigate the stratospheric relative humidity following the record-breaking water vapor injections from the HT-22 eruption and the particle size of the aerosol. The HT-22 eruption injected its effluents into the deep Brewer–Dobson (BD) branch causing several years of stratospheric perturbation. The long duration and the aerosol concentration (among the highest) make the HT-22 eruption the strongest stratospheric aerosol event since the 1991 Mt. Pinatubo eruption despite a modest SO2 injection explaining only ∼30 % of the aerosol optical depth (AOD) from the HT-22 eruption according to our estimates. The stratospheric AOD level was established after 2 weeks, or possibly even earlier, which is a short time compared with the usual 2–3 months required to reach the maximum AOD following volcanic eruptions. We discuss the sources of the aerosol from the HT-22 eruption in relation to the low emission of SO2, its e-folding time, and volcanological observations of strong interactions with the sea containing not only water but also high concentrations of dissolved substances.
- Article
(6272 KB) - Full-text XML
-
Supplement
(713 KB) - BibTeX
- EndNote


Stratospheric background conditions are frequently offset by injections of copious quantities of aerosol and gases from explosive volcanic eruptions (Kremser et al., 2016) and intense wildfires forming pyrocumulonimbus clouds (Fromm et al., 2010). These events cause variable stratospheric impacts with durations of months to several years (Friberg et al., 2018), which are important to account for in climate models (Schmidt et al., 2018).
The Hunga Tonga–Hunga Ha'apai volcano erupted on 15 January 2022, with a volumetric flow rate an order of magnitude higher than that of the 1991 Mt Pinatubo eruption, and formed an umbrella cloud at 31 km and a second cloud at 17 km altitude (Gupta et al., 2022). Further, a record-breaking overshooting plume reached above 50 km (Carr et al., 2022; Proud et al., 2022; Taha et al., 2022). The volcanic explosivity index (VEI) value was estimated to be 6, based on seismological observations (Poli and Shapiro, 2022). Despite the high VEI, ash could not be detected in the ice-rich stratospheric clouds from the HT-22 eruption (Gupta et al., 2022), and the UV aerosol index (UVAI) indicates low ash content (Carn et al., 2022). This is further supported by CALIOP (Cloud-Aerosol LIdar with Orthogonal Polarization) measurements finding very low depolarization ratios, indicating dominance of spherical particles uncharacteristic of ash (Legras et al., 2022). Additionally, the volcanic layers in the stratosphere contained very low SO2 quantities for such a strong eruption (Carn et al., 2022).
Widespread damage to the seafloor with runouts exceeding 100 km was caused by volcaniclastic density currents, suggesting a collapsing eruption column entering the sea (Seabrook et al., 2023; Clare et al., 2023). Such a sequence of events where hot volcaniclastic density currents form induces strong interaction with seawater over vast areas that can supply hot water vapor, forming a plume that is buoyant at the base and accelerates as it rises (Mastin et al., 2024). A relatively small eruption can in this way form umbrella clouds the size and altitude of the HT-22 eruption, whereas entrainment of vapor from cold water does not (Mastin et al., 2024). Other possible mechanisms include formation of an explosive steam from superheated water in contact with the erupting magma (Millán et al., 2022).
The stratospheric background aerosol contains mainly sulfurous and carbonaceous components with some extraterrestrial and tropospheric components (Murphy et al., 2007; Kremser et al., 2016; Martinsson et al., 2019). Volcanic aerosol in the stratosphere normally contains large quantities of sulfuric acid formed from sulfur dioxide (SO2), water, carbonaceous material, and ash (Martinsson et al., 2009; Andersson et al., 2013; Friberg et al., 2014). Wildfires produce an aerosol initially dominated by organic and black carbon (Garofalo et al., 2019), where the former component is rapidly removed by photolysis (half-life 10 d) in the stratosphere (Martinsson et al., 2022; Friberg et al., 2023).
The volcanic and wildfire events also affect particle size distribution. During a long period with conditions close to the background, spanning 1998 to 2004, the particle volume mode was 0.2–0.3 µm in diameter, whereas it was approximately 1 µm in 1992–1993 after the Mt. Pinatubo eruption (Bauman et al., 2003; Wilson et al., 2008). Measurements from the second week after the 2017 Canadian wildfire showed particle diameter of 0.6–0.7 µm (Haarig et al., 2018; Hu et al., 2019).
In this work we investigate the stratospheric aerosol resulting from the HT-22 eruption in relation to the volcanological sequence of events during the eruption. We also investigate the interaction of the aerosol with the large quantities of water vapor injected into the stratosphere. The global stratospheric aerosol optical depth (AOD) is studied 1.5 years after the eruption, until the decommission of the NASA satellite CALIPSO (Cloud-Aerosol Lidar and Infrared Pathfinder Satellite Observation) and its lidar sensor CALIOP. Our incrementally developed evaluation software (Andersson et al., 2015; Friberg et al., 2018; Martinsson et al., 2022) based on methodology presented in Vernier et al. (2011) was applied on CALIOP level 1B data. In contrast to limb-oriented methodology, the nadir-oriented CALIOP provides viable results in dense aerosol layers from strong volcanic eruptions and wildfires after correction for attenuation (Martinsson et al., 2022). We also use the satellite Aura sensor MLS for measurements of water vapor and temperature. We find that the SO2 emissions from the HT-22 eruption cannot alone explain the high AOD level, nor can ash particles. We also find that the aerosol went deep into the stratosphere and that the 1-year AOD perturbation due to the HT-22 eruption is the largest since that of Mt. Pinatubo in 1991.
Two satellite-based instruments were used to investigate the stratosphere following the HT-22 eruption. Aerosol measurements were based on the CALIOP lidar aboard CALIPSO, whereas water vapor concentrations and atmospheric temperature were obtained from MLS aboard Aura.
2.1 CALIOP measurements
CALIPSO orbits the globe 14–15 times per day between 82° S and 82° N. The vertical resolutions of CALIOP are 30, 60, 180, and 300 m in the altitude ranges <8.2, 8.2–20.2, 20.2–30.1, and 30.1–40 km, respectively (Winker et al., 2007, 2010). The average global stratospheric AOD from the tropopause (obtained from the MERRA-2 reanalysis; Modern-Era Retrospective analysis for Research and Applications) to 35 km altitude in the stratosphere was computed from version 4-51 of CALIOP level 1B (NASA/LARC/SD/ASDC, 2024) at the wavelength 532 nm using nighttime measurements. The stratospheric AOD was computed in three layers: the lowermost stratosphere (LMS, tropopause to 380 K isentrope), the shallow BD branch (380–470 K isentropes), and the deep BD branch (470 K isentrope – 35 km altitude), where potential temperatures were obtained from MERRA-2 pressures and temperatures. The effective lidar ratio was estimated based on single, intense volcanic layers day 1–28 after the eruption. From initial high values (70 sr) the lidar ratio declined to 47.5 ± 10.2 sr. This is close to the commonly used CALIOP effective lidar ratio of 50 sr, which we therefore applied in this study. The attenuated backscatter CALIOP data were corrected by methods described in Martinsson et al. (2022). Based on measured parallel and perpendicularly polarized scattering, the volume depolarization was obtained and converted to particle depolarization ratios with methods described in Martinsson et al. (2022). Data were missing for 1 week from a few days after the eruption, and a long gap appeared from 21 October to 7 December 2022. Several minor gaps appeared during the first half-year of 2023 the last data produced by CALIOP.
2.2 MLS measurements
Water vapor concentrations were obtained in the 100–1 hPa range in 12 levels per decade from the MLS, version 5.0-1.0a, level 2 (Waters et al., 2006). The vertical resolution is 1.3–3.6 km (Lambert et al., 2020; Livesey et al., 2020). Data were screened based on error parameters supplied with the data, rendering a large fraction of the volcanic data invalid the first 2 weeks after the eruption. From the beginning of February 2022, when our evaluation starts, erroneous data became scarce.
Stratospheric temperatures in the pressure range 100–1 hPa were obtained from the MLS, which were used primarily to compute relative humidity and potential temperature. The latter allows analysis of transport in relation to isentropic surfaces. The potential temperatures were also used as a common ground in comparisons between MLS and CALIOP, where the native vertical scale of the former is atmospheric pressure and for the latter geometric altitude.
This work focuses on the stratospheric aerosol resulting from the HT-22 eruption. The altitude and latitude distributions will be presented here together with the evolution of the stratospheric aerosol extinction coefficients and AOD. However, we start by presenting stratospheric water vapor data from the HT-22 eruption to highlight the contrasting evolution of the two volcanic components. Water vapor data are also used for computations on relative humidity and vertical air motions presented in the Discussion section.
3.1 Water vapor
The record-breaking quantities of water vapor reaching the stratosphere following the HT-22 eruption have widely been reported on (Millán et al., 2022; Schoeberl et al., 2022; Xu et al., 2022; Zhu et al., 2022; Nedoluha et al., 2024). Here we present the distribution related to isentropic surfaces in contrast to previous authors, in particular the fate of water that reaches the deep branch of the BD circulation, i.e., above the potential temperature (Tp) of 470 K (Fueglistaler et al., 2009). Figure 1 shows monthly mean water vapor mass anomalies for years 2022 and 2023, where the masses of year 2021 were subtracted, the exception being January 2022 where only the days prior to the eruption are shown (1–14 January). The first 2 weeks after the eruption the MLS water vapor data from volcanic effluents frequently were erratic, probably due to high concentrations, and are not shown.
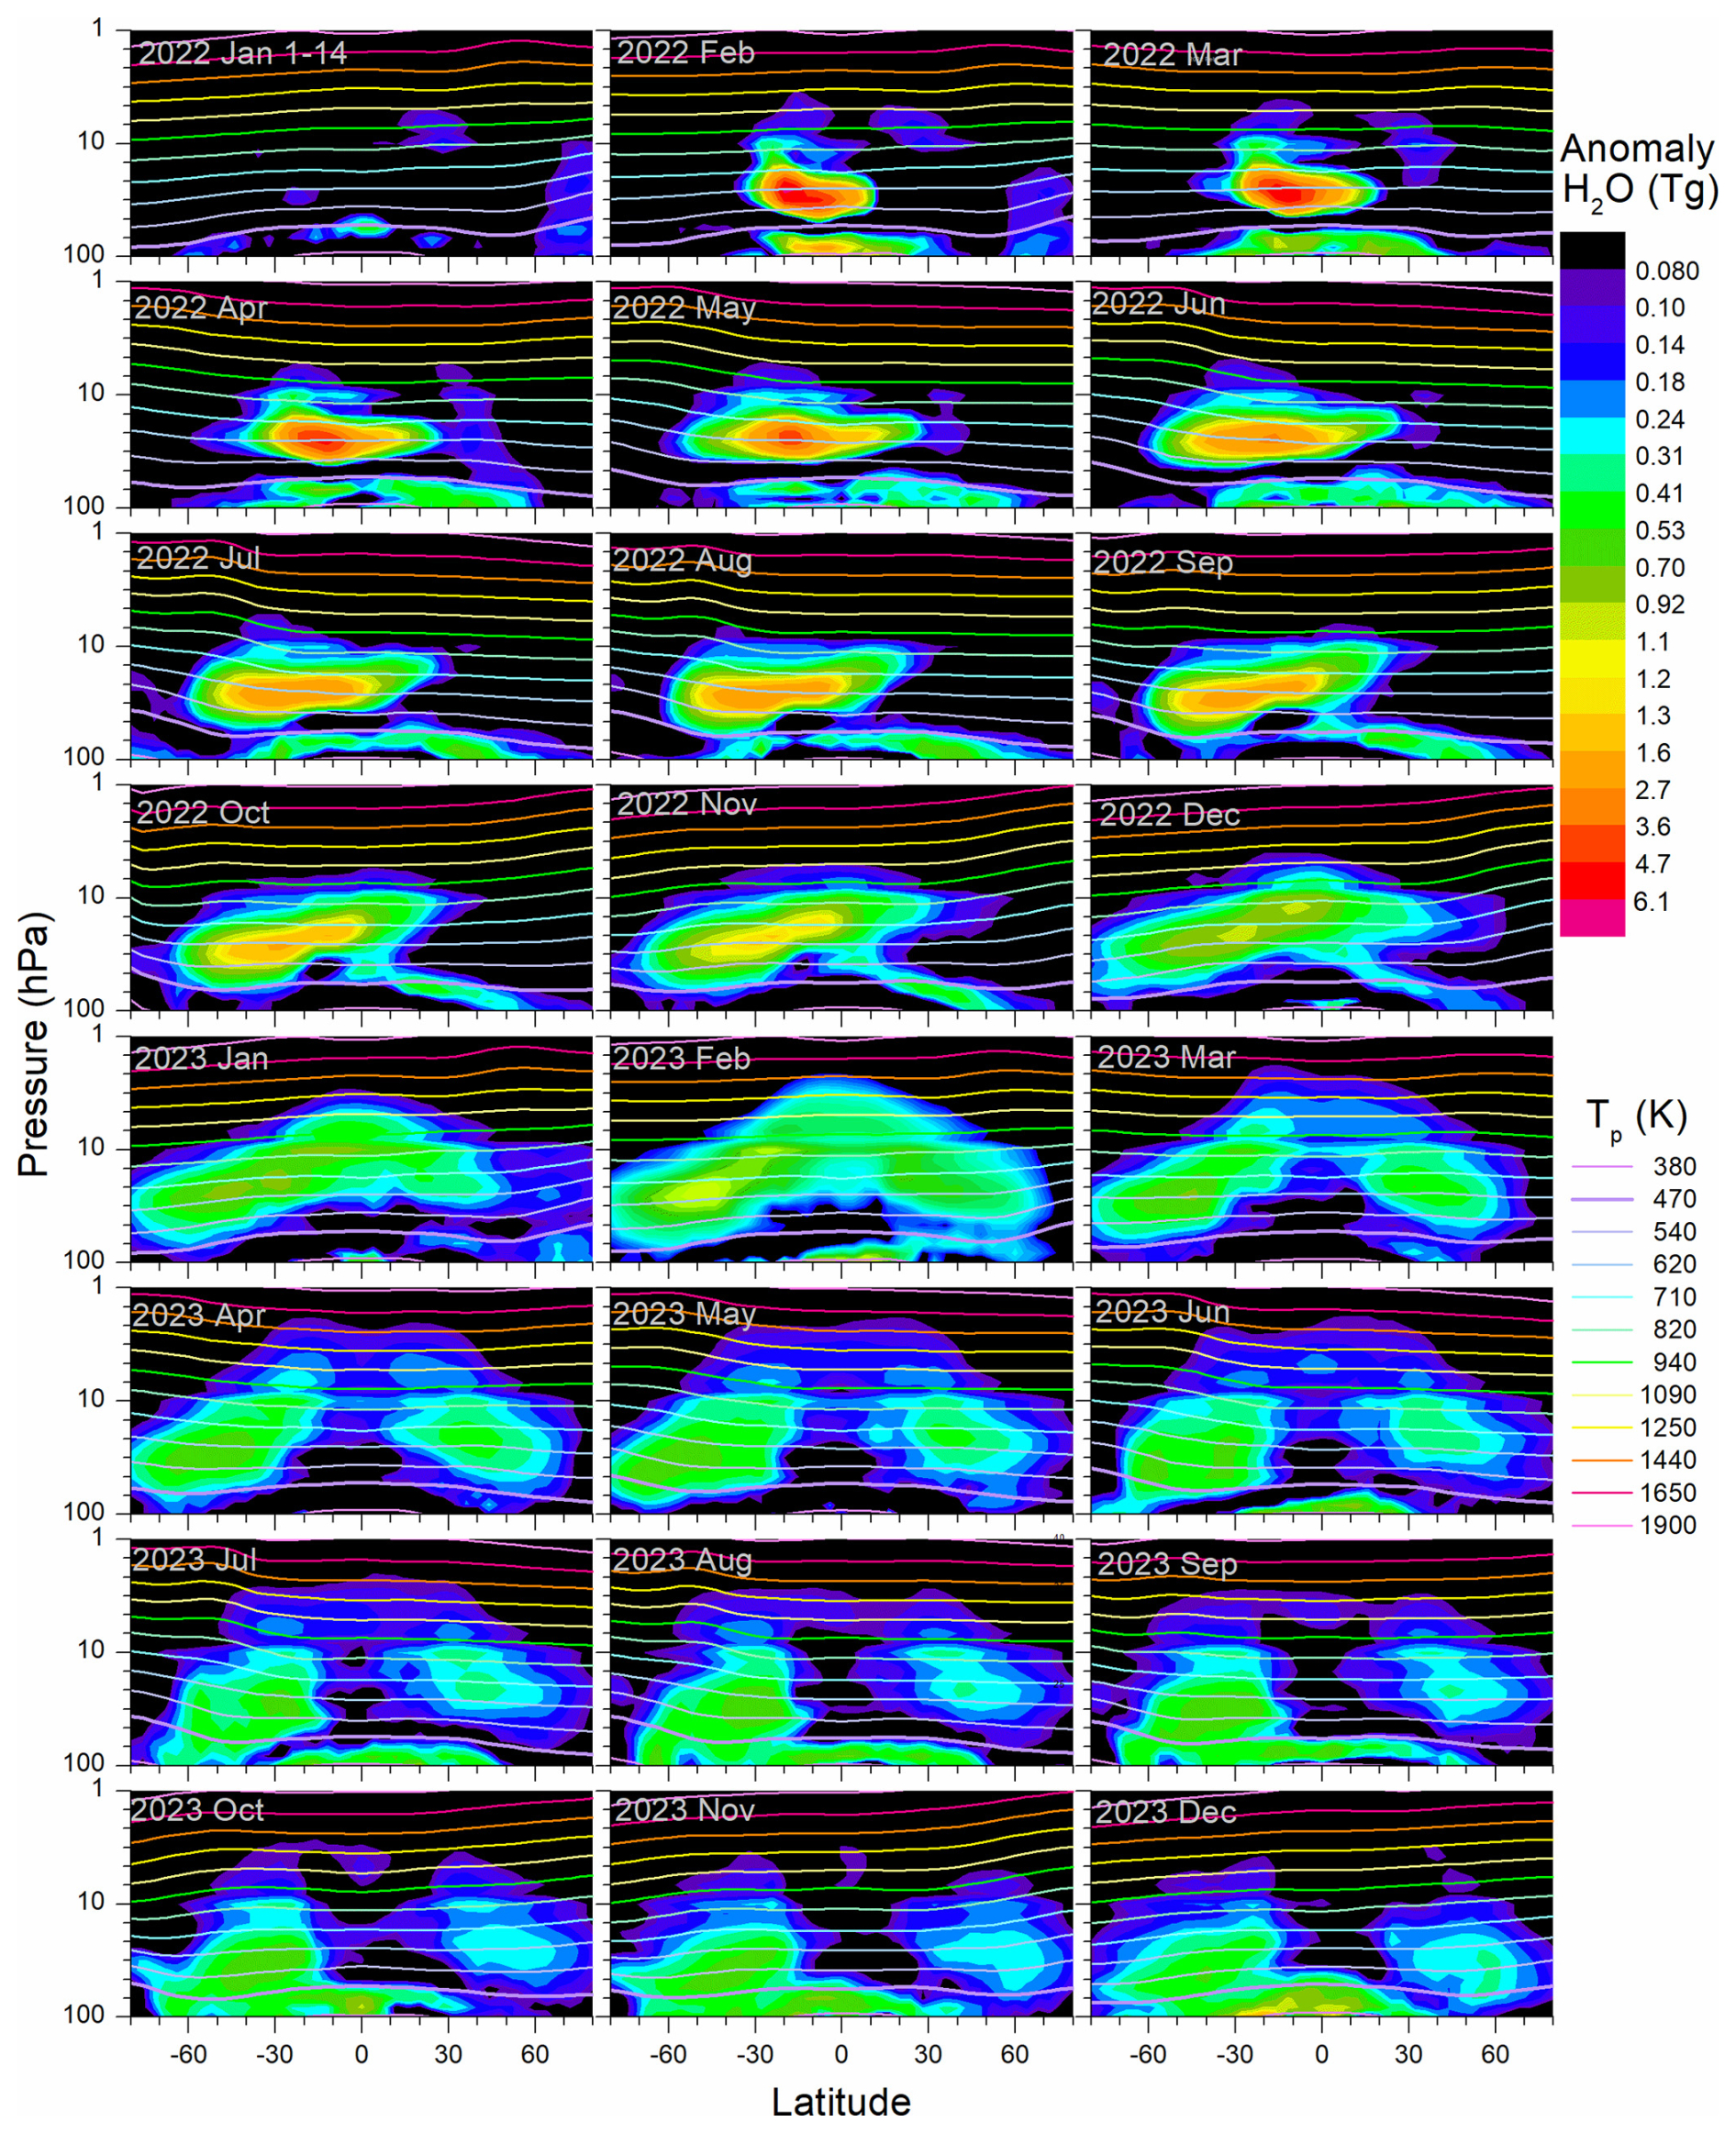
Figure 1Monthly averaged H2O mass anomaly (Tg) against latitude and altitude with pixel size (2.3 ± 0.14) × 1016 m3 times cos (Θ), where Θ is the latitude. Note that “2022 Jan 1–14” covers only the pre-eruption period 1–14 January. Overlain isentropes in the range 380–1900 K are shown, where Tp is the potential temperature. Note that the 380 K isentrope reaches below 100 hPa only in the tropics and that the 1900 K isentrope partly is found at pressures below 1 hPa. Vertical scale minor ticks: 1.5, 2.2, 3.2, 4.6, 6.8, and 10 times these values.
In February 2022 two layers appear, one minor in the shallow BD branch and the main layer in the deep BD branch, consistent with the reported eruption chronology (Gupta et al., 2022). The lower water vapor layer is spread rapidly latitudinally before it is transported below the lower atmospheric pressure limit used here (100 hPa).
The first months after the eruption the water of the upper layer remains in the tropics before a fraction clearly visible in May 2022 is transported to the southern extratropics (Figs. 1 and 2a). Towards the end of 2022 transport to the northern extratropics starts, and in February 2023 the water from the HT-22 eruption covers most of the globe. Later that year most of the water is found in the extratropics, whereas the water-rich air in the tropics is replaced in the BD circulation by younger tropospheric air that is unaffected by the HT-22 eruption (Figs. 1 and 2a). At the same time the water in the southern extratropics of the deep BD branch approaches and clearly descends below the 470 K isentrope in May 2023 (Figs. 1 and 2a), consistent with the extratropical downward motion of air.
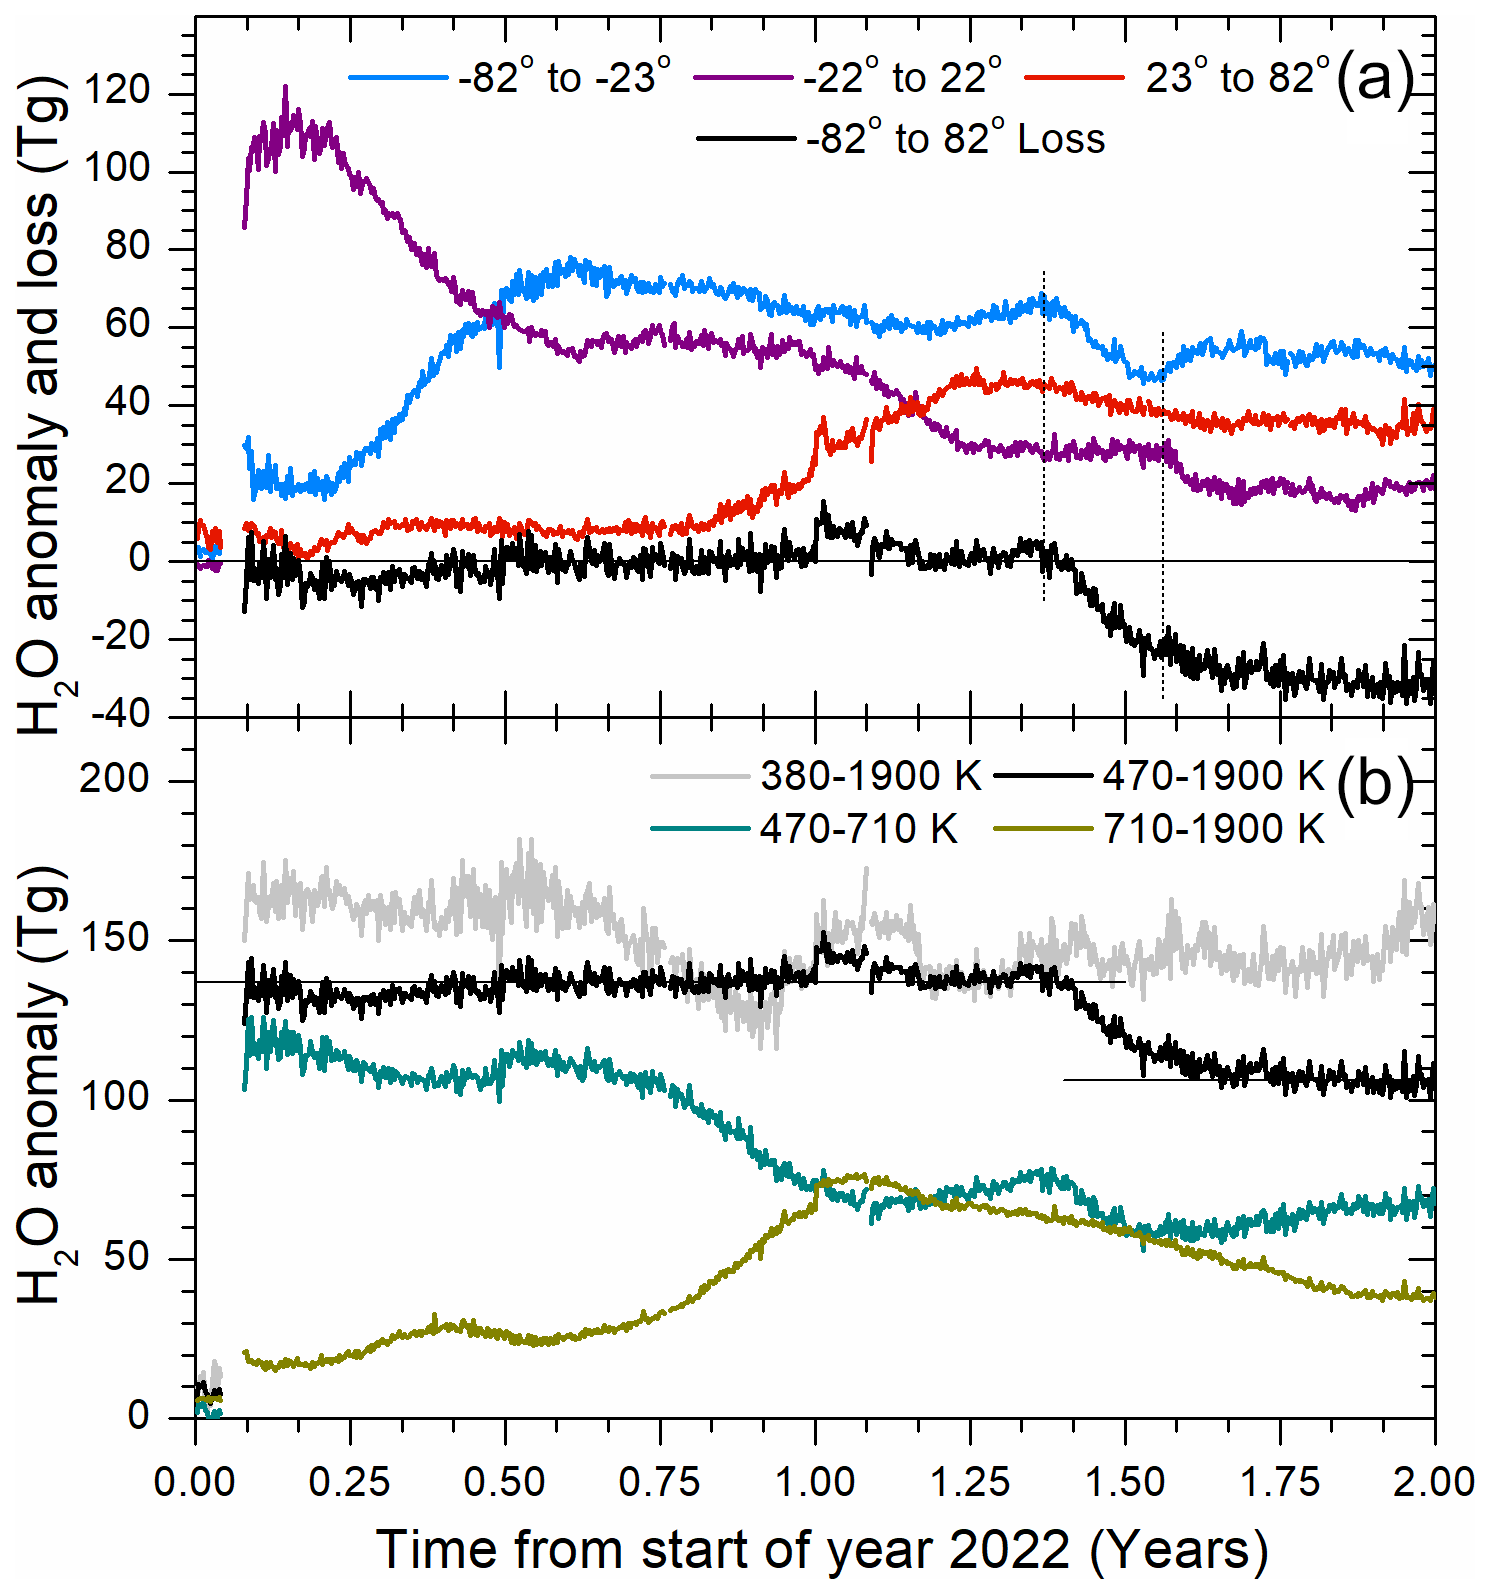
Figure 2Evolution of water vapor (H2O) anomaly following the 15 January 2022 Hunga Tonga eruption. (a) H2O anomaly in three latitude intervals and loss of H2O in a fourth latitude interval, all in the K range (the deep BD branch). Vertical lines mark the main region of H2O loss of the deep BD branch. (b) H2O anomaly in the latitude interval −82 to 82° in various potential temperature intervals (Tp). Horizontal lines show the average H2O anomaly from end of January 2022 to mid-May 2023 (136.9 ± 0.2 (standard error) Tg) and from the beginning of October to the end of December 2023 (106.1 ± 0.3 Tg).
The total quantity of water vapor from the HT-22 eruption in the stratosphere at Tp>380 K in the tropics and 100 hPa atmospheric pressure elsewhere is 160 Tg. The mass in the deep BD branch, which is a part of the previously mentioned layer, is 137 Tg. After of a year these categories reach the same level (Fig. 2b), implying that the lower water layer (injected below the deep BD branch) is transported down below the lower limit in altitude (atmospheric pressure 100 hPa) of the data used here. The water vapor displays considerable vertical transport in the deep BD branch. Dividing that branch into two Tp intervals (Fig. 2b) reveals a clear rise in the quantity of water in the upper interval in the last quarter of the year 2022. A small fraction of the water vapor reached high altitudes in the tropics during the year 2023 (Fig. 1), and some even reached altitudes above 1 hPa atmospheric pressure (∼48 km), i.e., the region of the stratopause, which can be seen in Fig. S1 in the Supplement but not in Fig. 1 because the much smaller integration volume increases the noise level.
The water anomaly remained constant in the deep BD branch with only minor fluctuations from February 2022 to May 2023 (Fig. 2b), whereafter the anomaly is reduced by 23 % due to transport to the shallow BD branch, a level that remains until the end of 2023.
3.2 Aerosol
The evolution of the stratospheric AOD following the HT-22 eruption has been reported by several authors using limb-viewing measurements (Bourassa et al., 2023; Sellitto et al., 2022; Taha et al., 2022) that suffer from event termination (“saturation”) in the first months after strong volcanic or wildfire events (Fromm et al., 2014; Chen et al., 2018; DeLand, 2019; Martinsson et al., 2022) and from problems measuring the lower parts of the stratosphere (Taha, 2020). Here we present results based on a nadir-viewing lidar technique (CALIOP) that is better suited for measurements in dense aerosol layers because they do not suffer from saturation effects and because attenuation of the lidar signal can be corrected for (Martinsson et al., 2022).
Just as for water vapor, we present monthly mean values of the aerosol distribution with overlaid isentropic surfaces (Fig. 3). January 2022 aerosol data show conditions prior to the eruption. Initially (February–June 2022) almost all the HT-22 aerosol is found in the deep BD branch (Tp>470 K). We identify downward motion of the aerosol centroid in the tropics, the most intense part shifting from isentrope 581 to 523 K from March to September 2022 despite the upward motion of air in the tropics as part of the BD circulation. This is caused by gravitational settling, and the aerosol that reaches the southern extratropics loses altitude even faster, aided by downward air motion in the extratropics, leading to an increasing fraction of the aerosol in the shallow BD branch from July 2022. The aerosol continues downwards, reaching the LMS (below 380 K) in December 2022 on its way out of the stratosphere.
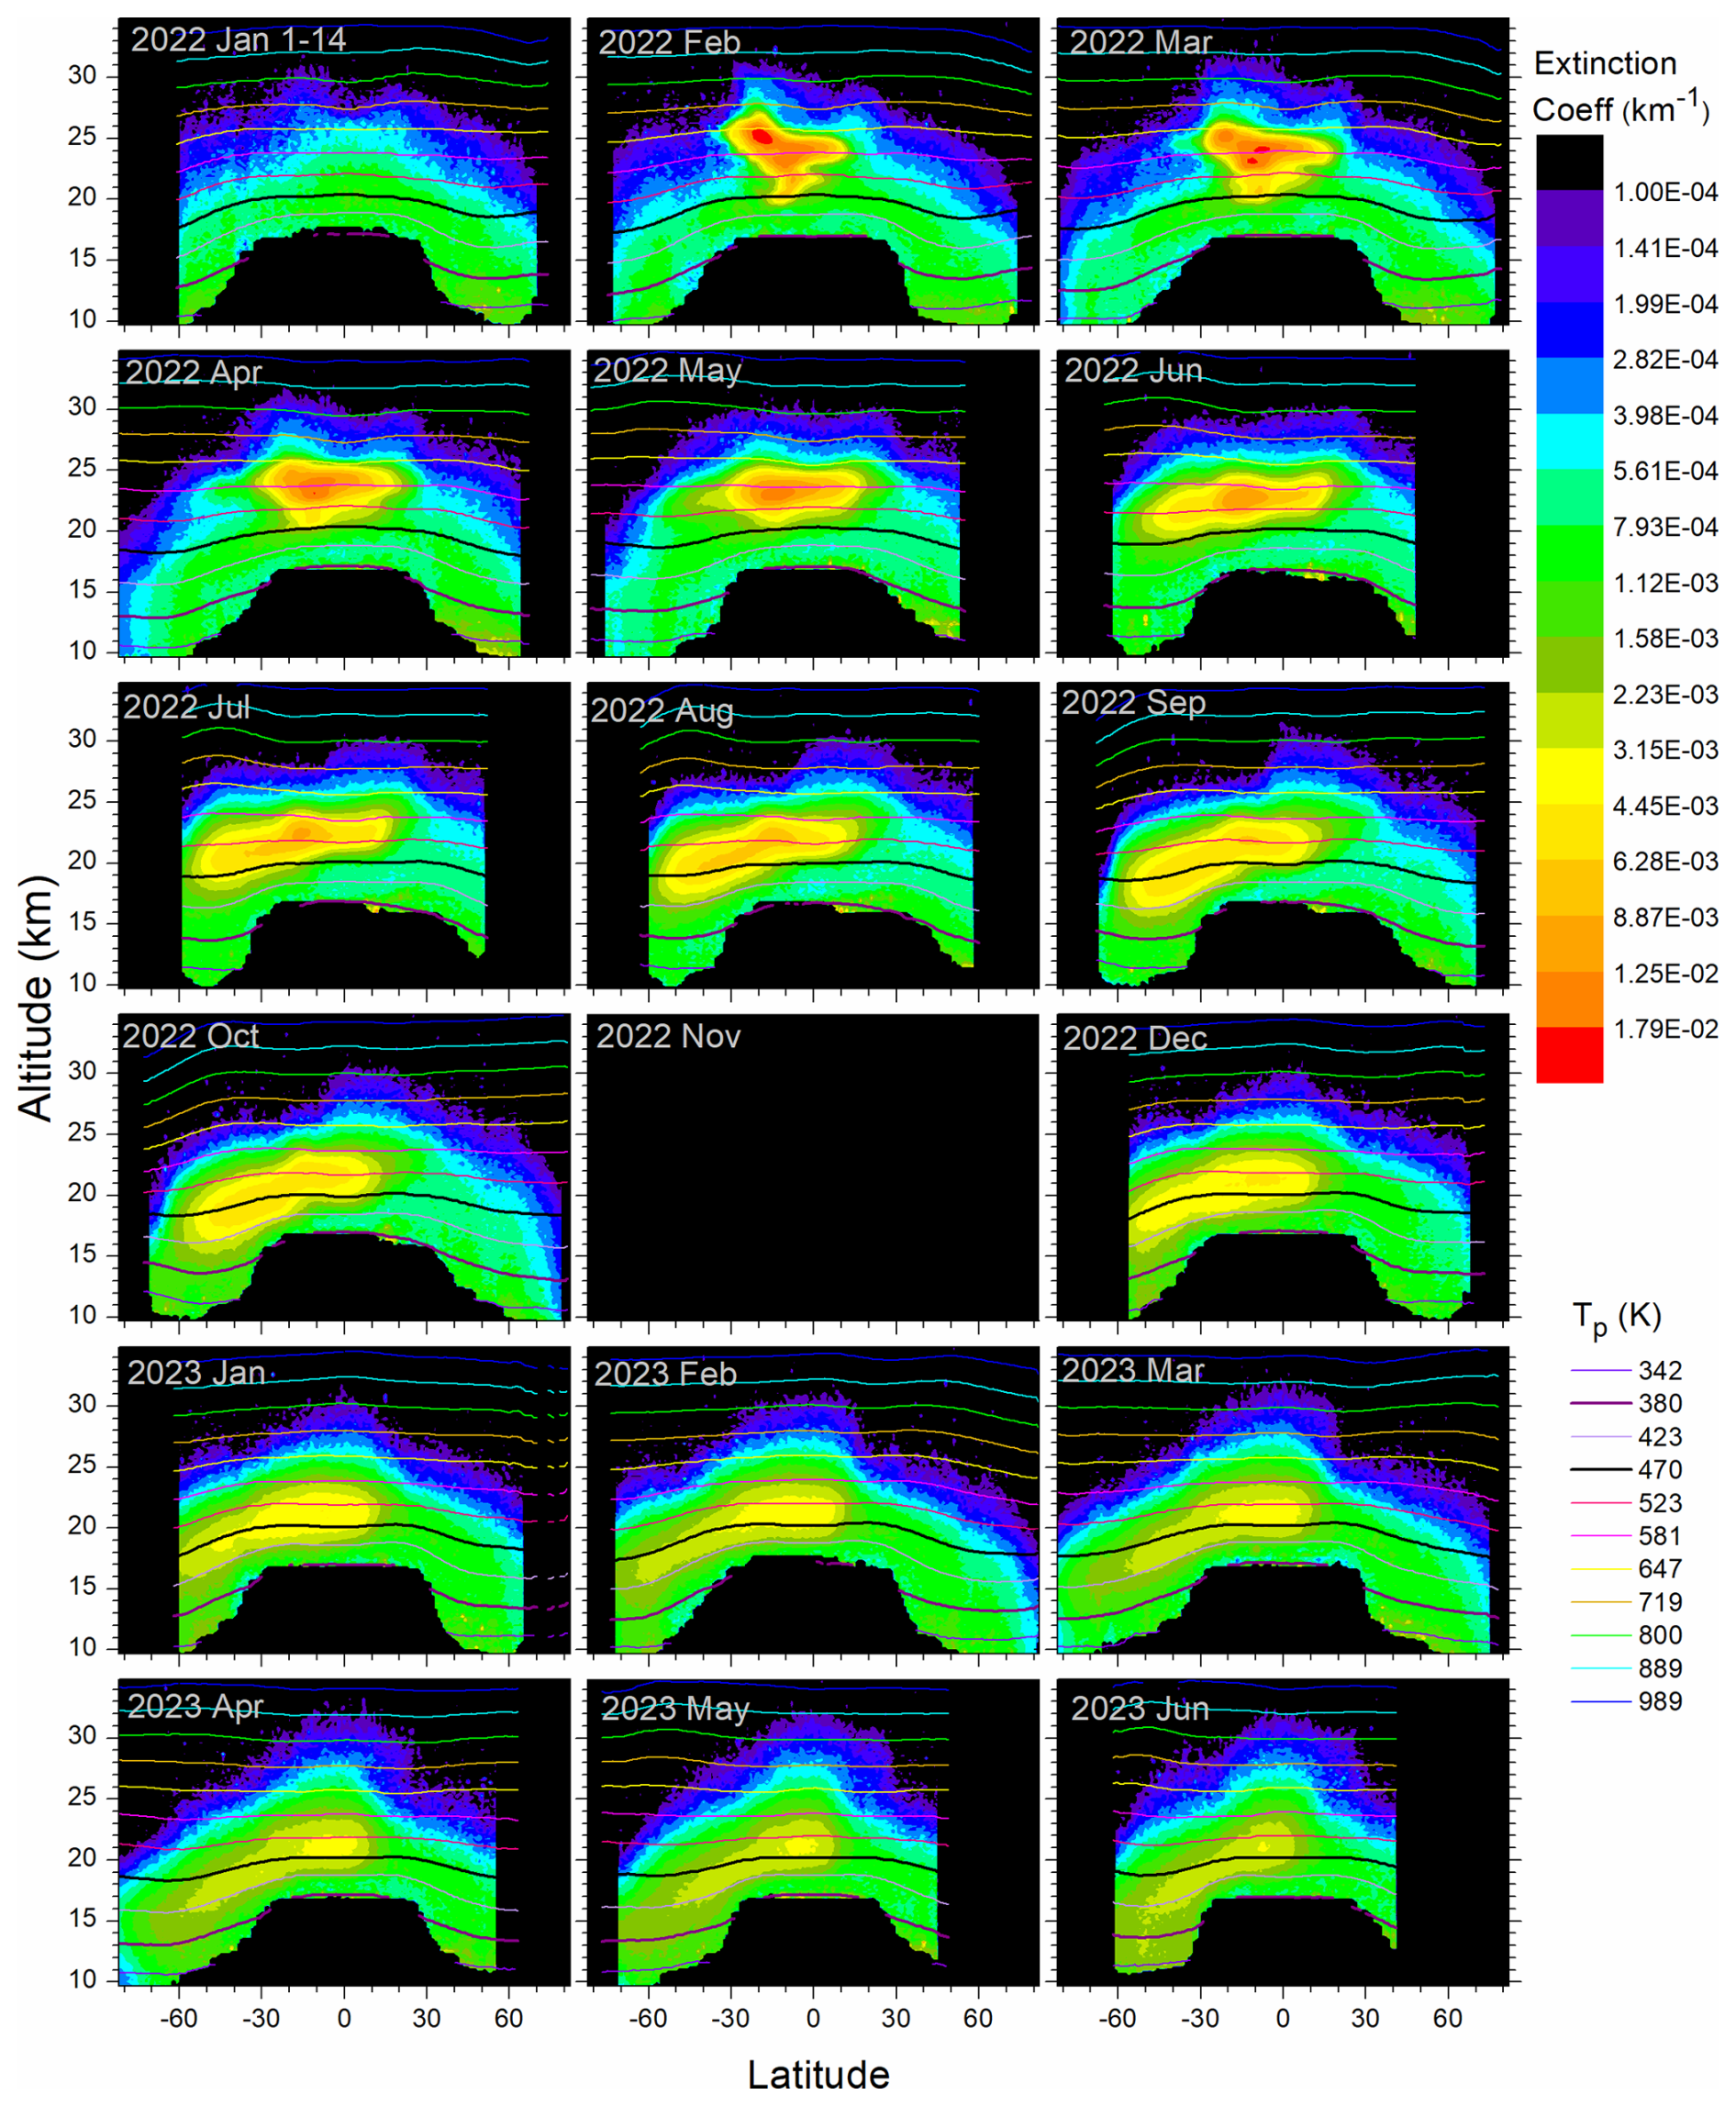
Figure 3Monthly average extinction coefficients dependent on latitude and altitude with overlaid potential temperature levels. Note that “2022 Jan 1–14” covers only the pre-eruption period 1–14 January.
Substantial quantities of aerosol entered the stratosphere because of the HT-22 eruption. The global average AOD reached 0.016 (Fig. 4a), which is among the highest stratospheric aerosol loads since the 1991 Mt. Pinatubo eruption. Already by the end of January, half a month after the eruption, the AOD level that remained for almost 1 year was reached. After that we see a decline where approximately half of the aerosol from the HT-22 eruption is removed during the first half-year of 2023. Almost the entire aerosol quantity from HT-22 was found in the deep BD branch the first months after the eruption (Fig. 4a) and in the tropics (Fig. 4b). We see transport to the southern extratropics starting in April 2022 in the deep BD followed by downward motion to the shallow BD branch starting in June 2022 (Fig. 4c). Only a small fraction of the aerosol reached the northern extratropics (Fig. 4d), in contrast to the transport of water vapor (Fig. 2a) that took place at a higher altitude (Fig. 1).
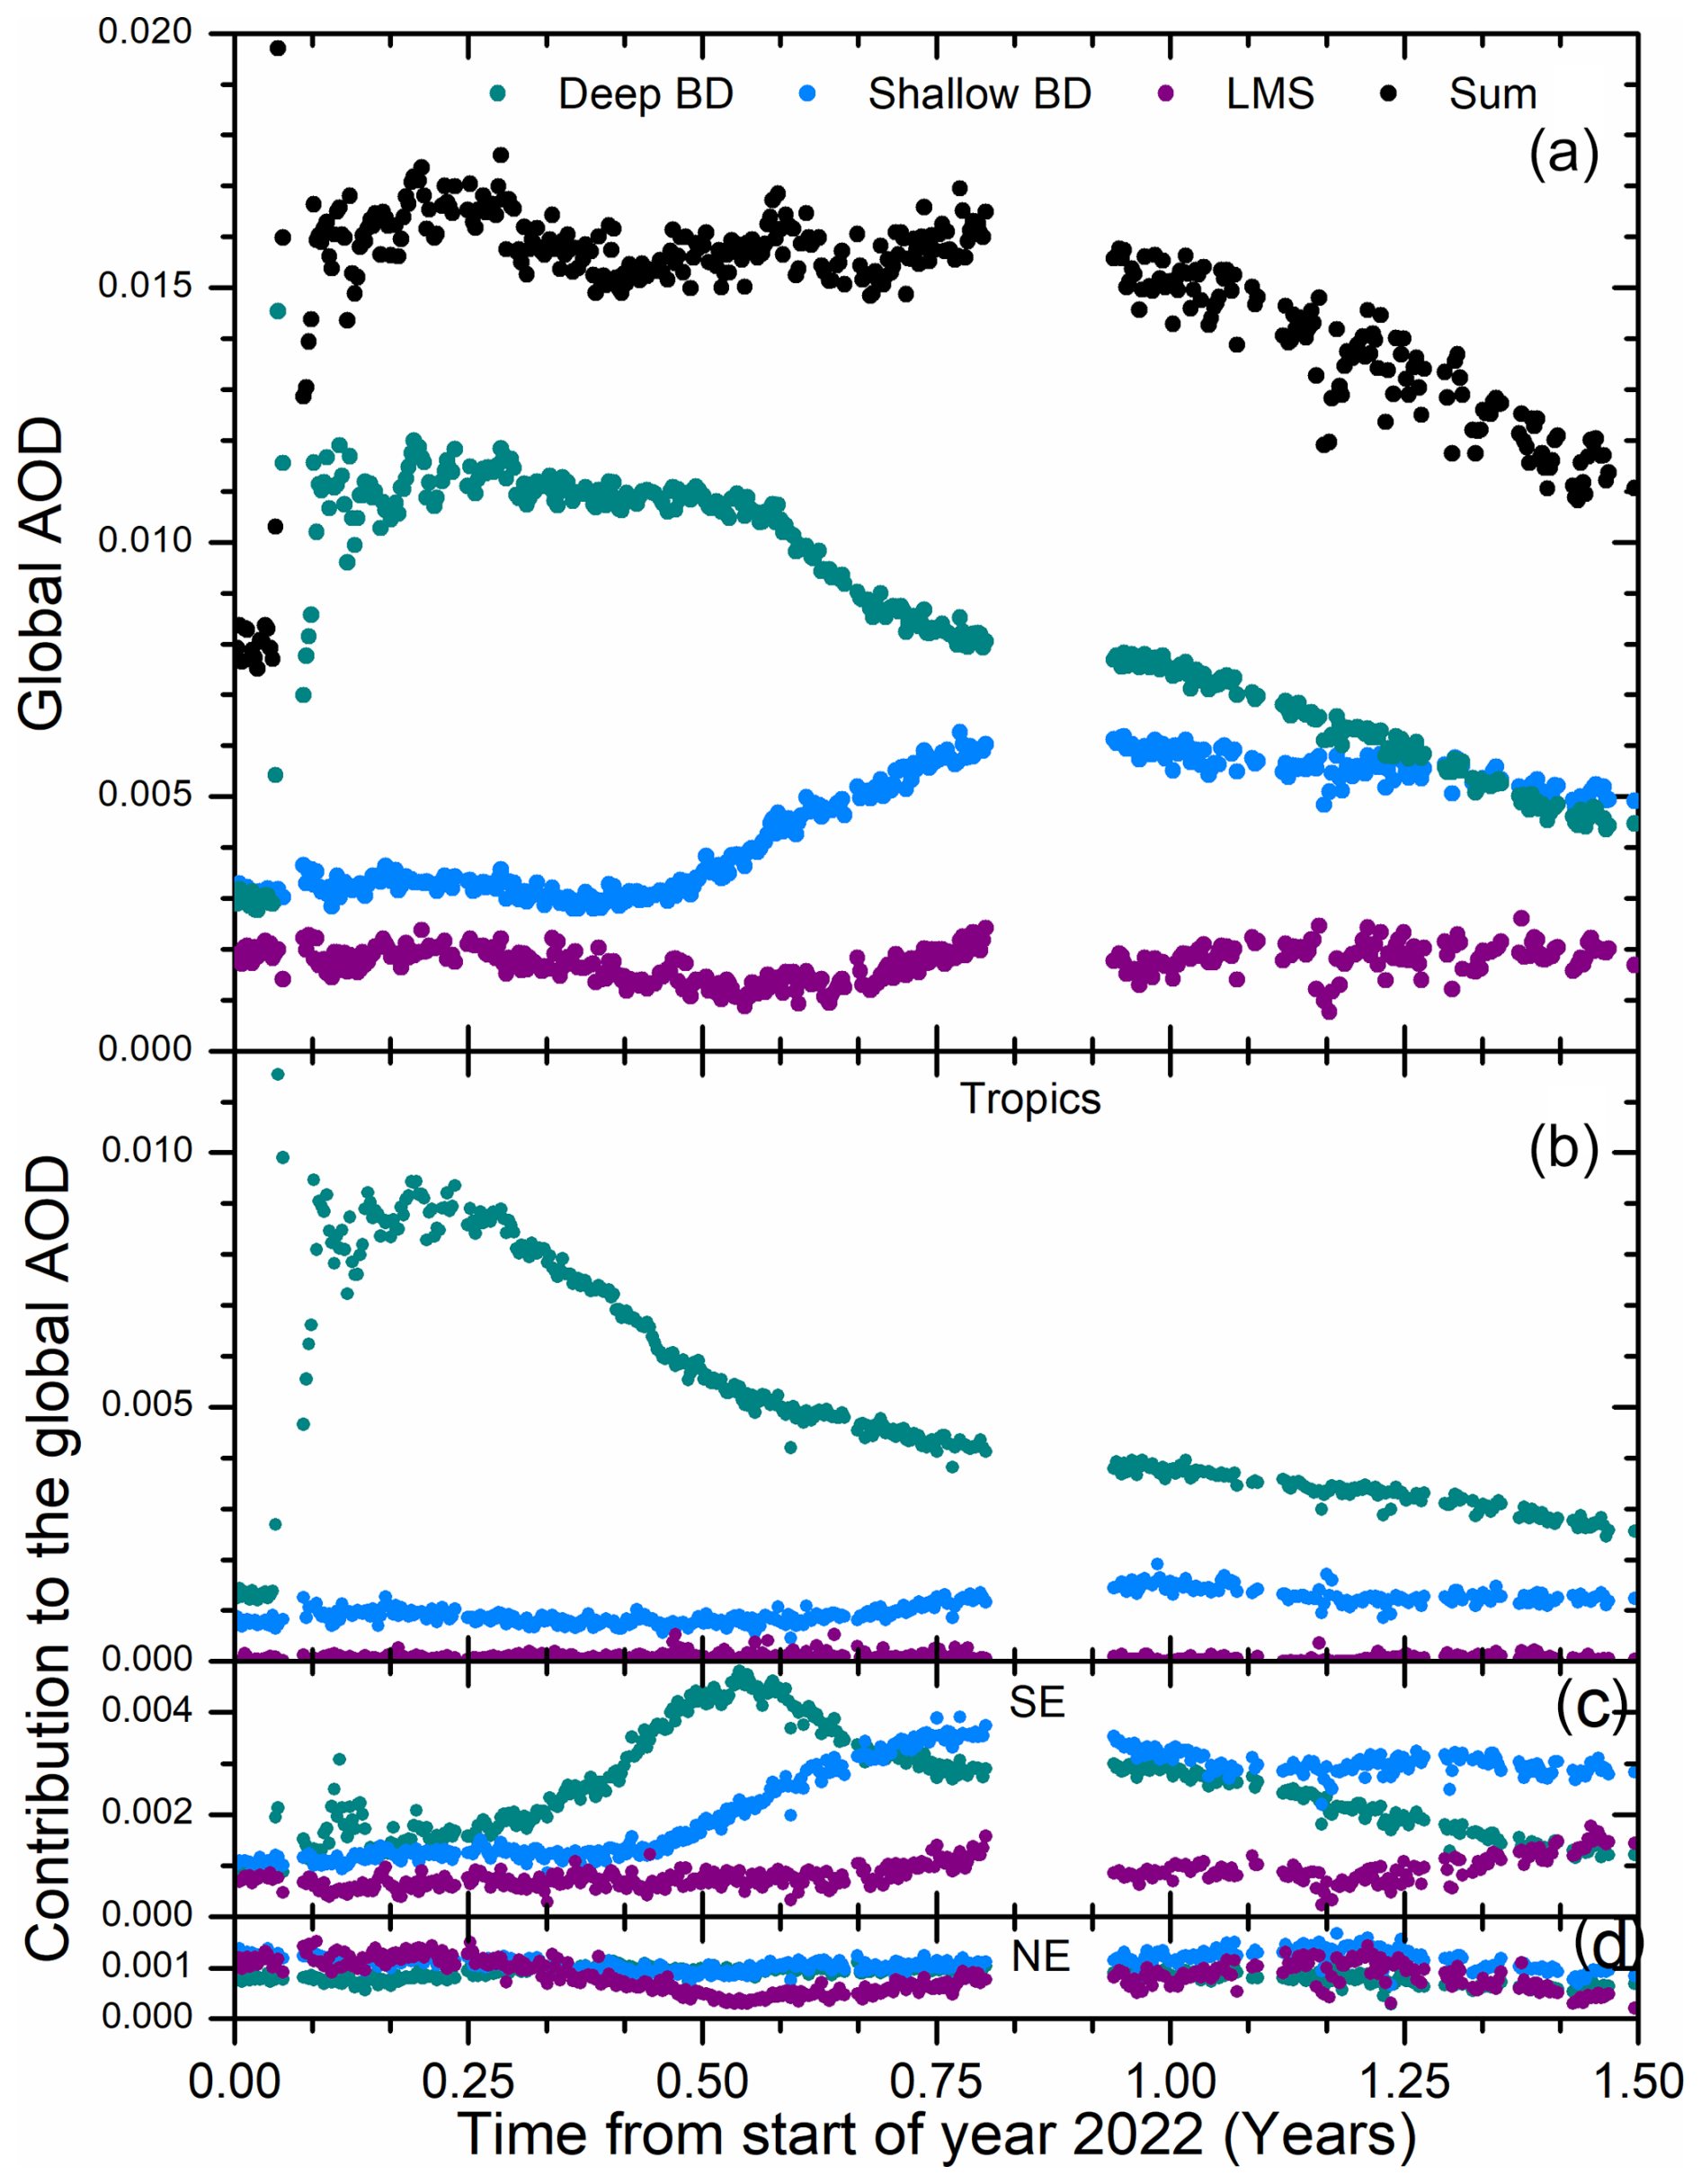
Figure 4(a) Global average AOD of the stratosphere from the tropopause to 35 km altitude and −82 to 82° in latitude (Sum) with the sub layers: the tropopause to 380 K potential temperature (Tp) (LMS), 380–470 K Tp (shallow Brewer–Dobson (BD) branch) and Tp 470 K to 35 km altitude (deep BD). Latitude distributions of AOD in the (b) tropics (−22 to 22°), (c) southern extratropics (SE) (−82 to −23°), and (d) northern extratropics (NE) (23 to 82°). The AODs are related to the global scale, i.e., the sum of SE, tropics, and NE graphs is the global AOD.
SO2 emissions from HT-22 eruptions took place over a period from 19 December 2021 to 15 January 2022 (Carn et al., 2022). Most of these eruptions reached 15–18 km in altitude, whereas the main eruption's umbrella cloud on 15 January 2022 reached 31 km, with an overshooting plume reaching 55–58 km (Gupta et al., 2022). Based on several methods the total SO2 emissions for this period is estimated to be 0.6–0.7 Tg, and that of the main umbrella cloud, reaching deep into the stratosphere, contained 0.4–0.5 Tg SO2 (Carn et al., 2022). Altitude-resolved SO2 measurements from MLS find a similar SO2 quantity deep into the stratosphere (Millán et al., 2022). Compared with the SO2 emissions, the stratospheric AOD generated by the HT-22 eruption is unexpectedly high. Here we will discuss reasons for this seeming discrepancy, and we start by examining water uptake as an explanation.
The temperature rises with altitude in the stratosphere, making the air very dry after passing the tropical cold point tropopause. The quantity of water vapor injected by the HT-22 eruption is unprecedented in the modern satellite era (Zhu et al., 2022). It has been suggested that hygroscopic growth could be an important process that affects the aerosol particle size and light scattering (Legras et al., 2022; Sellitto et al., 2022). Here we investigate the relative humidity by examining the five highest daily water vapor concentrations measured by the MLS during February 2022 (140 MLS profiles), when the volcanic effluents were concentrated to a relatively small volume. Based on MLS water vapor and temperature measurements the relative humidity was computed, where the saturation water vapor pressures were obtained from Murphy and Koop (2005). Figure 5a shows the average relative humidity of the profiles (140) from February 2022. At the lowest altitudes, close to 100 hPa, the relative humidity reaches 35 % because of the low temperature (Fig. 5a, upper scale), and, to a smaller degree, the lower volcanic layer (Fig. 1, February 2022). At higher altitude, the relative humidity rapidly declines as the temperature increases, becoming close to zero at altitudes above 10 hPa. However, a peak appears at 30 hPa caused by the main volcanic layer (above 470 K potential temperature) containing most of the stratospheric water vapor from the HT-22 eruption (Fig. 2b). In the following discussion we concentrate on that layer. The average positions of the 470 K isentrope and the peak water vapor concentration are shown in Fig. 5a, where the shift in the maximum relative humidity from the peak water vapor concentration is caused by the temperature gradient. The relative humidity at the peak water vapor concentration as well as the maximum relative humidity of all the 140 measurements are shown in Fig. 5b (note the shift of ±100 K in potential temperature to separate the two categories). The measurements of each of the two categories appear in groups depending on the altitude (or pressure level) of the water vapor layer. The maximum relative humidity above the 470 K isentrope is 13 %, and that of the peak water vapor is 11 %, whereas the averages are 5.1 % and 4.2 %. Such low relative humidities causes no or modest hygroscopic growth (Winkler, 1973), which affects particle size or light scattering only to a small degree.
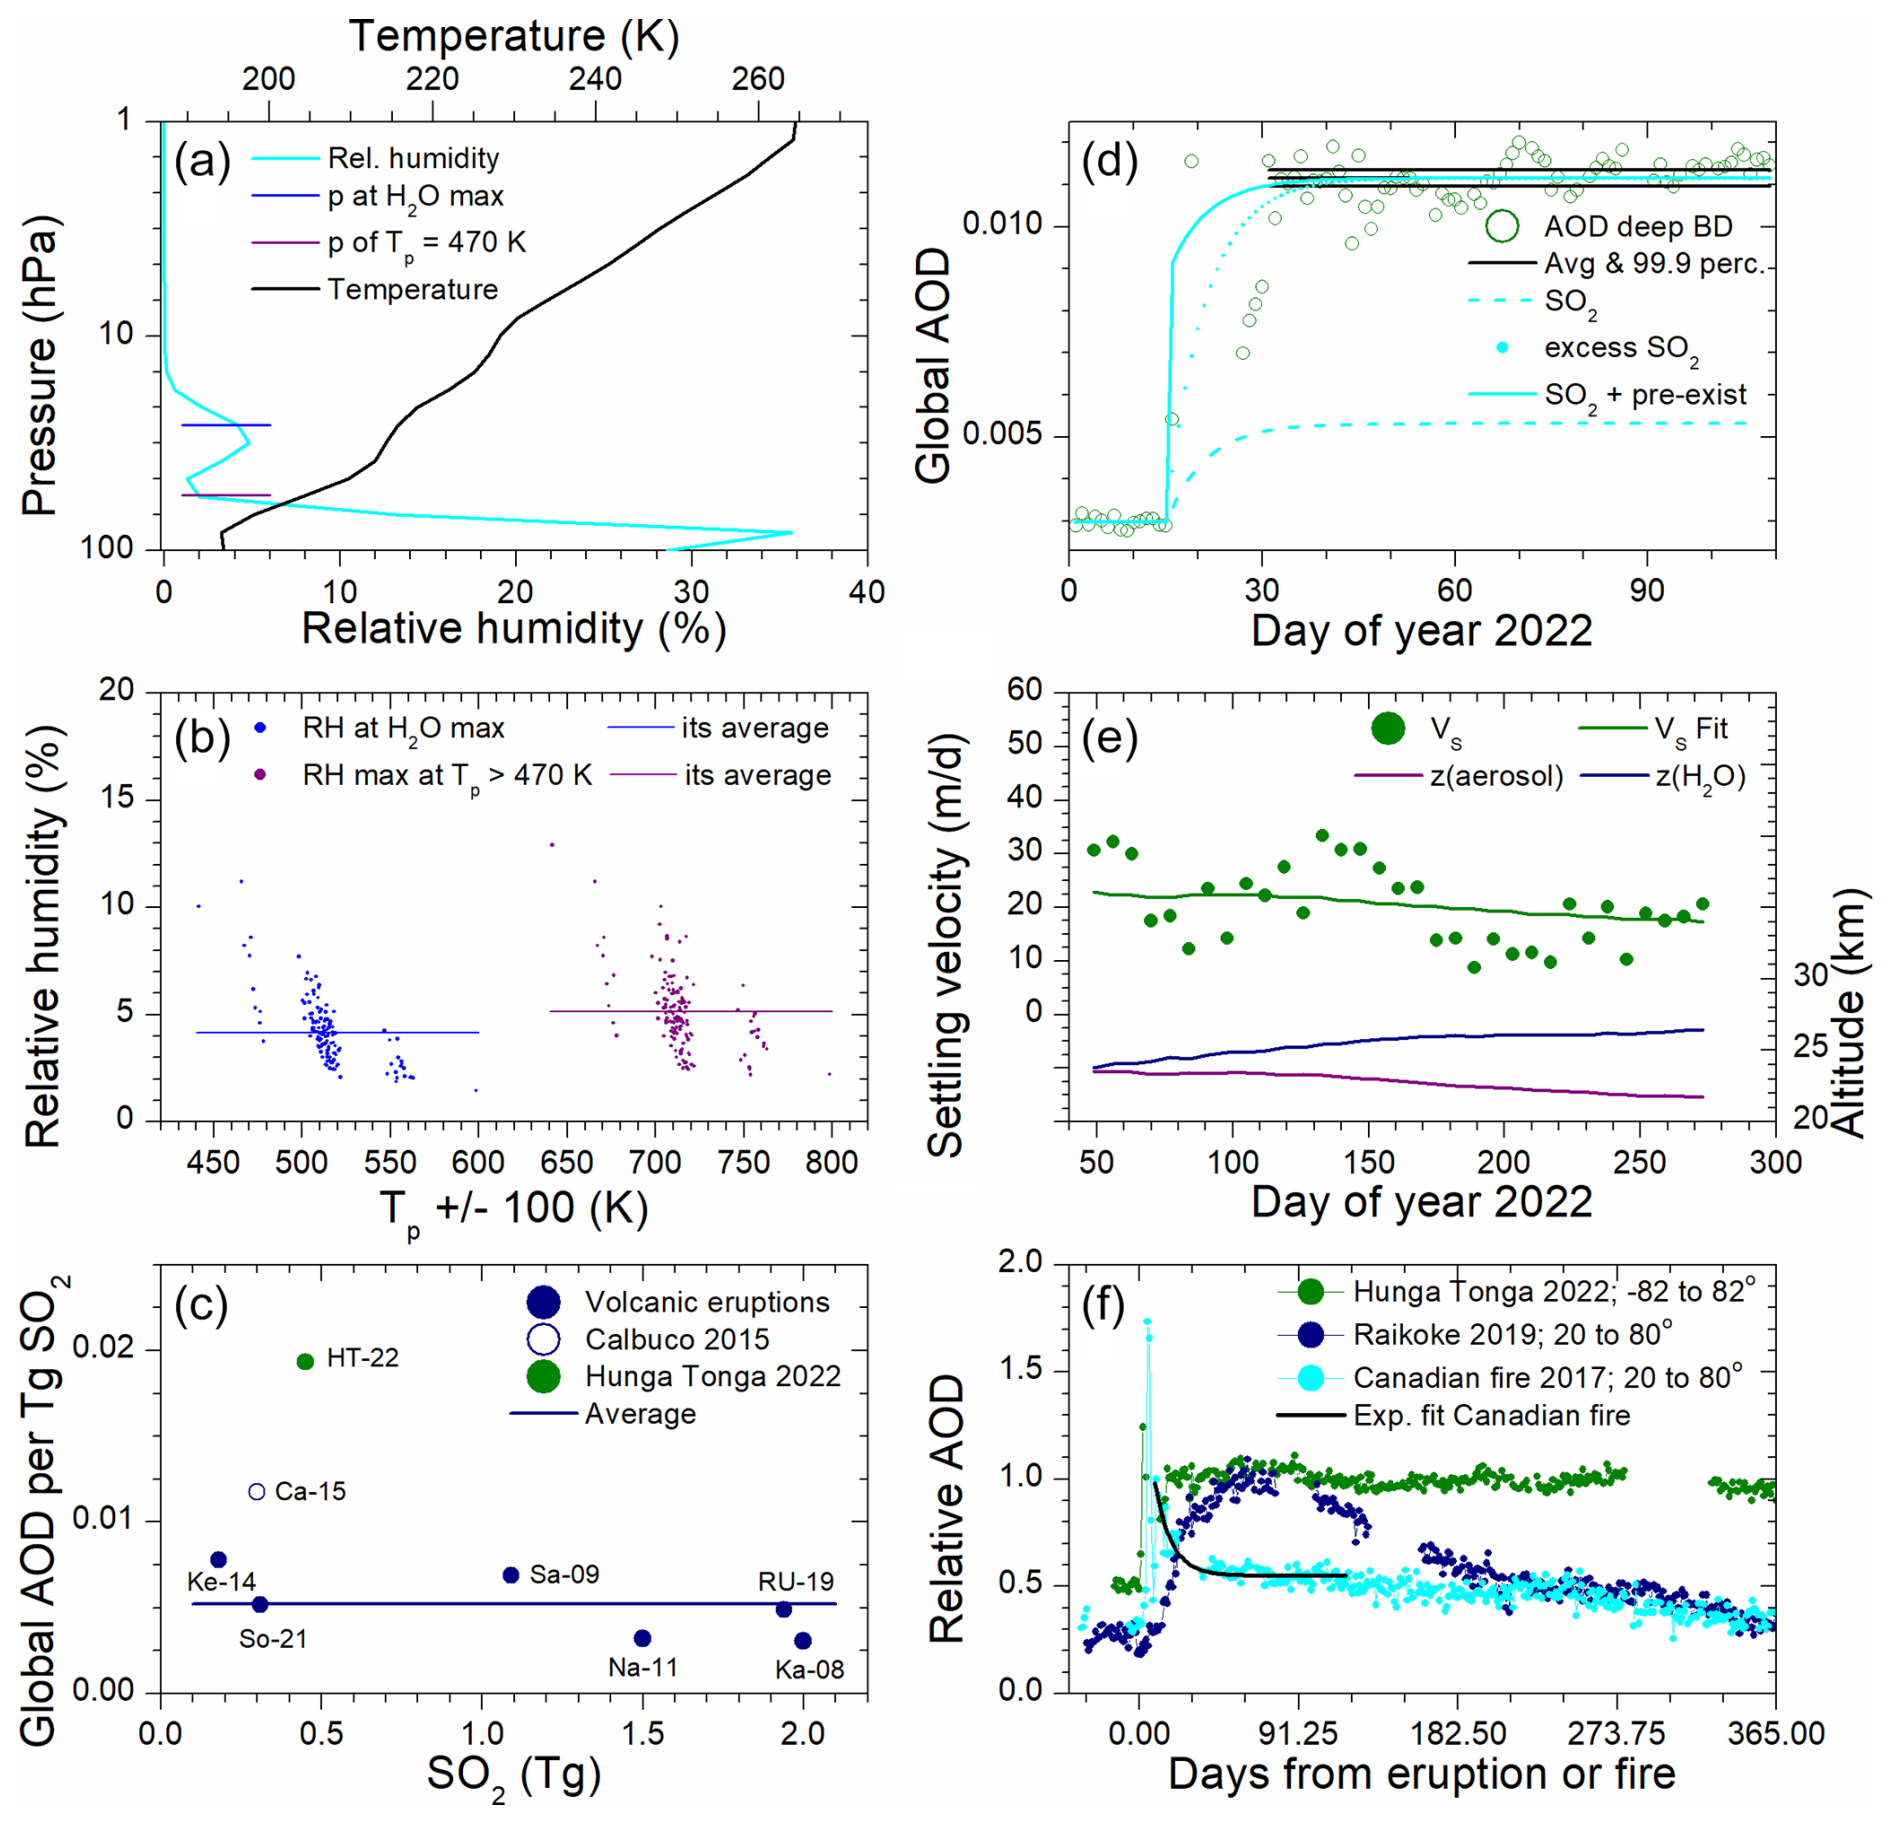
Figure 5Stratospheric characteristics after the HT-22 eruption. (a) Average relative humidity (RH) and temperature of the five daily H2O profiles with the highest concentration during February 2022. (b) RH at the maximum H2O concentration and maximum RH at potential temperatures >470 K of all the profiles mentioned in (a), with an average RH of 4.2 % and 5.1 %, respectively. The potential temperature (Tp) was shifted ±100 K to separate the two groups of data. (c) Global AOD per Tg SO2 emitted by recent volcanic eruptions related to SO2, the average being 0.0052 global AOD per Tg SO2 (see Table 1). (d) AOD in the upper BD branch with 99.9 percentile of the average marked and reported SO2 of 0.45 Tg (Carn et al., 2022) converted to AOD according to (c) (broken line), and the dotted line tests the evolution using an excess of 1.1 Tg SO2 to reach the measured AOD. The full cyan line displays the SO2 AOD (broken line) added by an assumed AOD from non-sulfate aerosol (“pre-exist”) from the eruption to reach the measured AOD. (e) Aerosol gravitational settling velocity (Vs) and fit (equivalent aerodynamic diameter 1.1 µm) and average altitudes (z; right scale) of the HT-22 aerosol and water vapor at latitudes −14 to −6°. (f) Normalized stratospheric AOD evolution over 1 year for one wildfire event (Martinsson et al., 2022) and two volcanic eruptions.
Several authors regard the aerosol from the HT-22 eruption as a sulfate aerosol (Khaykin et al., 2022; Legras et al., 2022; Sellitto et al., 2022, 2024; Taha et al., 2022; Zhu et al., 2022; Bernath et al., 2023; Duchamp et al., 2023; Kahn et al., 2024), although with questions on the relatively small quantity of SO2 emitted in relation to the AOD level (Carn et al., 2022). Here we will investigate this relation in more detail by forming the ratio of the maximum global stratospheric AOD rise above the pre-eruption AOD to the quantity of SO2 emitted by eight recent volcanic eruptions (Table 1 and Fig. 5c). This ratio is approximately 0.005 Tg−1 for most of the eruptions, whereas the Calbuco (Ca-15) and HT-22 deviate by having higher AOD per SO2 mass emitted. Most of these volcanic eruptions showed a depolarization ratio of less than 0.05 (Hoffmann et al., 2010; O'Neill et al., 2012; Zhuang and Yi, 2016; Voudouri et al., 2023), typical of aerosol dominated by spherical sulfuric acid particles. Volcanic ash settles rapidly by gravitation, but a fraction can remain for months in the stratosphere (Andersson et al., 2013). Vernier et al. (2016) found that this can affect stratospheric AOD, detecting an elevated depolarization ratio (0.05) 1 month after the Kelut eruption (Ke-14). The depolarization ratio of the aerosol from the Ca-15 eruption was much higher (0.18) 1 month after the eruption (Klekociuk et al., 2020), thus indicating a strong influence from ash on the AOD that likely explains the strong deviation in the AOD-to-SO2 ratio from the other eruptions. Ca-15 was therefore not included in the average AOD-to-SO2 ratio calculated here. The HT-22 eruption has the highest AOD-to-SO2 ratio but low depolarization ratio (Fig. S2); thus high ash concentration is not a valid explanation (Gupta et al., 2022; Carn et al., 2022; Legras et al., 2022).
Table 1Recent volcanic eruptions with SO2 emissions, global stratospheric optical depths (AOD), and literature references.
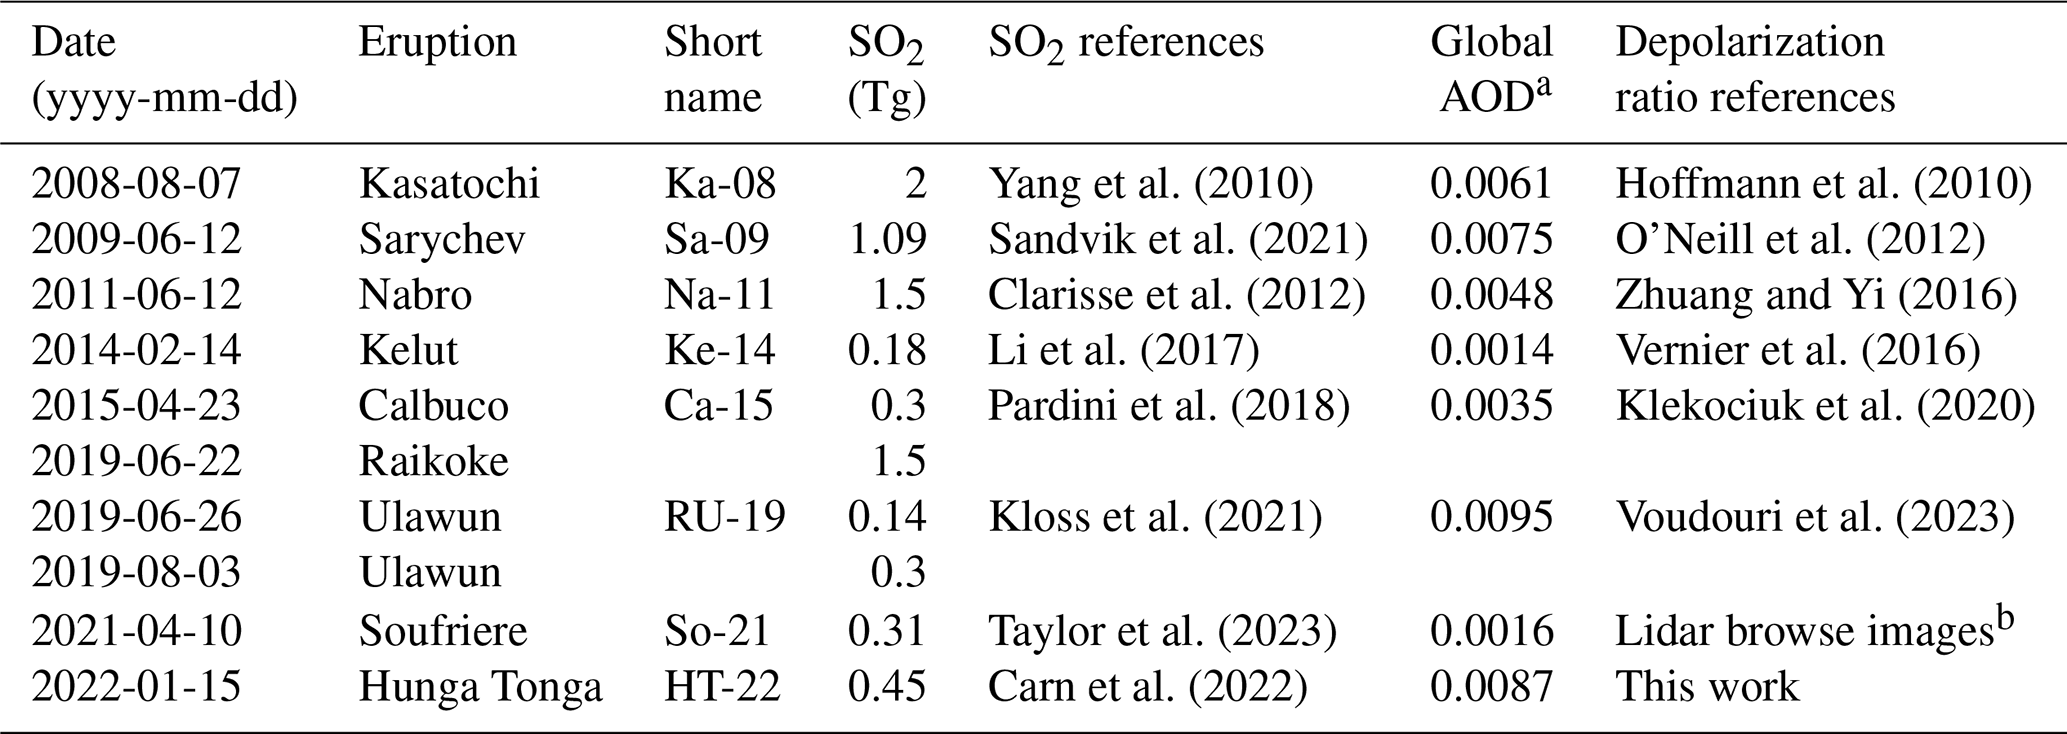
a Global stratospheric AOD maximum increase due to the eruptions. References: Friberg et al., 2018, and this work (2019–2023).
b Lidar Level 1 Browse Images – 2021-04-26 09:42:19Z (UTC) – Sect. 1 (https://www-calipso.larc.nasa.gov/products/lidar/browse_images/std_v451_index.php, last access: April 2024).
We adopt the central estimate of Carn et al. (2022), i.e., 0.45 Tg SO2 with an e-folding time of ∼6 d. The e-folding time is unusually short for stratospheric conditions, probably due to elevated water vapor concentrations (Carn et al., 2022). Figure 5d shows the AOD, with double-sided 99.9 % confidence interval of the mean in the deep BD branch, where all the aerosol from the HT-22 eruption was injected (Fig. 4a). Using the AOD-to-SO2 ratio based on six volcanic eruptions (Fig. 5c) to estimate the AOD based on the SO2 emissions, we end up with far-too- low AOD (Fig. 5d, broken line). To investigate the timing, we added 1.1 Tg excess SO2 to reach the measured AOD while preserving the measured e-folding time (dotted line). The excess SO2 reaches into the 99.9 % confidence interval of the average AOD after approximately 50 % longer time from the eruption compared to the time required for CALIOP to record a stable AOD. It is thus unlikely that the aerosol from the HT-22 eruption was formed from SO2 conversion alone, mainly because of the low SO2 emissions but also because of the timing. Other material must have already been present in the first days after the eruption. Making use of the AOD-to-SO2 ratio from Fig. 5c, adding non-sulfate aerosol from the HT-22 eruption adjusted to obtain the measured AOD, and using the measured SO2 mass and e-folding time results in the solid cyan line in Fig. 5d. Such a combination of non-sulfate aerosol from the eruption and SO2 conversion is consistent with the 99.9 % confidence interval of the AOD average.
The next question is what is the source of the non-sulfate aerosol that was present before the conversion of SO2? We have no measurements of the aerosol composition to aid in this respect. From the depolarization ratio (Fig. S2) we can rule out significant fractions of volcanic ash, which is also supported by other measurements (Gupta et al., 2022; Carn et al., 2022). To find another plausible source of the non-sulfate aerosol we consider the intense sea–volcanism interaction during the HT-22 eruption (Seabrook et al., 2023; Clare et al., 2023; Mastin et al., 2024; Millán et al., 2022) causing enhanced bubble bursting (Keene et al., 2007) and/or explosive superheated water. Such events are not only sources of water vapor but also release the entire seawater substance into the atmosphere, which includes sea salts. High concentrations of sea salt in volcanic ash fallout from the HT-22 eruption have been documented (Colombier et al., 2023). Sea salt particles enter the volcanic column together with the water vapor. As the particles are hygroscopic, they readily serve as condensation nuclei in cloud formations as the air cools on the way up to the stratosphere. In the competition for water, preferentially large particles are scavenged in cloud formations prior to the formation of precipitation. This leaves the smaller particles as an interstitial aerosol (Martinsson et al., 1999). The quantity of aerosol from the eruption present before the SO2 conversion (Fig. 5d) would correspond to aerosol formation from 1.1 Tg SO2 based on the AOD-to-SO2 ratio (Fig. 5c). Using this number as a coarse estimate we can compare it with the quantity of water injected into the deep BD branch (137 Tg; Fig. 2b). With the typical salinity of seawater (35 g kg−1), this quantity of water corresponds to 4.8 Tg of sea salt, which is 4 times the coarse estimate of non-sulfate aerosol mass.
Besides the water from enhanced bubble bursting induced by volcaniclastic density currents or explosive superheated water, water evaporates directly from a heated ocean without sea salt emissions. Additional quantitative uncertainties pertain to the relative losses of water and sea salt to precipitation. Given the orders of magnitude of these estimates we can from this standpoint conclude that aerosol formation from strong sea–volcanism interaction is a plausible source of a large fraction of the stratospheric aerosol from the HT-22 eruption. However, we also need to consider the low depolarization ratio of the HT-22 aerosol. Cubic sodium chloride particles can according to modeling show depolarization ratios in the range of 0 to approximately 0.25 with strong dependence on the particle size, being close to 0 for particle volume mean diameters less than 0.7–0.8 µm before it gradually increases (Murayama et al., 1999; Haarig et al., 2017). The aging of sea salt particles in the atmosphere tends to round the particles (Adachi and Buseck, 2015), thus reducing depolarization. To further investigate this matter, we need to consider the particle size distribution.
Several authors have reported on the stratospheric aerosol particle size following the HT-22 eruption, i.e., 0.6–1 µm diameter (Boichu et al., 2023), 0.8 µm (Duchamp et al., 2023) and 2–3 µm (Legras et al., 2022). While the former two estimates show good agreement, the latter, based on estimating the gravitational settling velocity, stands out by finding the particles to be larger than the other estimates. We used the same method as Legras et al. (2022) to estimate the settling velocity: , where V is the vertical velocity, V(aerosol) is the observed weekly change in the aerosol centroid altitude, and V(air) is estimated from the weekly change in the altitude of the water vapor centroid. Applying a 3-week moving average dampened variations in settling velocity, leading to Fig. 5e. The gravitational settling velocity varies around the value 20 m d−1, agreeing well with the results of Legras et al. (2022), whereas the conversion to particle size differs. The settling velocity of a given particle depends on the pressure and temperature because of the air viscosity and the Cunningham slip correction factor's dependence on the mean free path of the air. We computed the particle size that best fits the weekly settling velocity observations. Figure 5e shows decreased settling velocity as the aerosol falls to lower altitude. We found that the equivalent aerodynamic diameter was 1.1 µm, which is based on the assumptions of a spherical particle shape and particle density of 1 g cm−3. The low depolarization ratio (Fig. S2) validates the first assumption. The density of the particles is not known a priori. However, the low relative humidity (Fig. 5a and b) results in concentrated solution drops of sulfuric acid and sea salts, having density clearly exceeding 1 g cm−3; e.g., a 76.5 % sulfuric acid–water solution has a density of 1.75 g cm−3 at stratospheric conditions (Myhre et al., 1998). Applying that density results in a 0.70 µm geometric diameter and changing the density to 1.5 and 2 g cm−3 results in 0.81 and 0.62 µm diameters, respectively, which is in good agreement with estimates based on other methods. Based on our results and others (Boichu et al., 2023; Duchamp et al., 2023) we conclude that the HT-22 aerosol is submicron in diameter, in between stratospheric background and Mt. Pinatubo particle sizes (Bauman et al., 2003; Wilson et al., 2008). The depolarization ratio was already low in the first days after the eruption, when only a small fraction of the SO2 conversion was completed. However, the particle size of the HT-22 aerosol falls into the region where the depolarization ratio for cubic sodium chloride particles is small, thus not contradicting that sea salt from the volcanism–sea interaction was a strong source of the HT-22 aerosol.
The water vapor injected into the deep BD branch remained in the stratosphere for the full 2 years of this study, although 23 % was transported from the deep BD branch to the shallow one 1.5 years after the eruption (Fig. 2b). The stratospheric AOD remained almost constant for 1 year before starting to decline (Fig. 4a). Because of gravitational settling aerosol remains in the stratosphere for a shorter time than gases with low chemical reactivity. The combined effect of the 2019 Raikoke and Ulawun eruptions on the maximum global stratospheric AOD is the highest observed for recent eruptions (Table 1) when the lowest part of the stratosphere is also accounted for. The peak AOD from HT-22 eruption is slightly lower. However, the long duration of the AOD from the HT-22 eruption, caused by the powerful eruption placing the effluents in the deep BD branch in the tropics, makes it the most important in terms of stratospheric AOD since the 1991 eruption of Mt. Pinatubo (Fig. 5f). The first year after the eruption the AOD was 0.016. Subtracting average background AOD (Friberg et al., 2018) the stratospheric global mean AOD from the HT-22 eruption becomes 0.010. This corresponds to −0.24 W m−2 in global stratospheric total volcanic effective radiative forcing for the first year after the eruption, according to results based on volcanic activity years 1979 to 2015 (Schmidt et al., 2018).
The HT-22 was the last major volcanic eruption to be studied based on data from the CALIOP lidar aboard the CALIPSO satellite that ended its mission in June 2023. This is by far the most efficient method for studies of the initial months of stratospheric aerosol formation following volcanic eruptions and wildfires, because of its brilliant vertical resolution and optically short vertical path. Limb-viewing techniques suffer from event termination (saturation) for 2–3 months after a major stratospheric aerosol event (Martinsson et al., 2022; Fromm et al., 2014; Chen et al., 2018; DeLand, 2019). Figure 5f illustrates the importance of CALIOP by showing the AOD of two volcanic eruptions and one wildfire. Conversion of SO2 formed the Raikoke aerosol, resulting in a delay of 2–3 months before the AOD peaked, which is the case for most volcanic eruptions (Friberg et al., 2018). In contrast, sea salt aerosol from HT-22 present before the SO2 conversion dominated its AOD and we observed the maximum already after 2 weeks. That was the time required for the aerosol to become dispersed enough to allow approximately 10 CALIOP measurements per day in the volcanic effluents, thereby reducing the uncertainty in the daily average. Another special case was the 2017 Canadian wildfire, where we observed a strong and rapid decline in the stratospheric AOD (Fig. 5f) indicative of photolytic loss of organic aerosol (Martinsson et al., 2022). A study of the 2019/20 Australian wildfire showed similar losses, where a complex feed of wildfire aerosol from the upper troposphere for 1–2 weeks after the fire was also identified (Friberg et al., 2023), thanks to the special properties of the CALIOP instrument mentioned earlier. The decommissioning of the aging CALIOP in June 2023 will severely inhibit future studies of aerosol formation and losses in the stratosphere, prompting the need for new satellite-based lidar systems.
Aerosol and water vapor in the stratosphere emanating from the 15 January 2022 eruption in Hunga Tonga (HT-22) is investigated using satellite-based instruments CALIOP and MLS. Most of its effluents were injected into the deep branch of the stratospheric Brewer–Dobson (BD) circulation.
A small fraction of the record-breaking water vapor injections into the deep BD branch reached up to the stratopause after 1.25 years in the stratosphere, whereas 23 % was transported down to the shallow BD branch as the water vapor spread vertically. The water vapor injected into the deep BD branch remained in the stratosphere for the full 2 years of this study. The water vapor from the HT-22 eruption in the southern tropics steadily increased its latitudinal coverage, first to the southern midlatitudes. After 1 year most of the global stratosphere was covered with water vapor from the HT-22 eruption, before a reduction in the tropical stratospheric concentration appeared as the BD circulation and brought tropospheric air that was unaffected by the HT-22 eruption.
The aerosol and its precursor gases were initially at the same altitude as the water vapor from the HT-22 eruption, but gravitational settling of the aerosol particles gradually opened a gap in altitude, which resulted in the aerosol from the HT-22 eruption mainly appearing in the tropics and the Southern Hemisphere. The stratospheric aerosol optical depth (AOD) remained constant for 1 year after the eruption, before transport out of the stratosphere started. At the time of the decommission of the CALIOP instrument in June 2023, 50 % of the aerosol from the HT-22 eruption had been removed from the stratosphere.
The AOD level of the stratosphere was established already 2 weeks after the eruption and was unexpectedly high for a modest injection of 0.4–0.5 Tg SO2. Given the exceptional water vapor quantities from the HT-22 eruption, we investigated if hygroscopic growth affected the aerosol optical properties. Despite the record-breaking water vapor emissions, the average relative humidity remained below 5 % in the dry stratosphere, causing no or limited hygroscopic growth.
The gravitational settling velocity of the aerosol is estimated from the altitude evolution as ∼20 m d−1, corresponding to an equivalent aerodynamic diameter of 1.1 µm at the altitude of the aerosol layer. Assuming density of concentrated solution drops of 1.5–2 g cm−3 the geometrical diameter becomes 0.6–0.8 µm.
Comparing eight recent volcanic eruptions we find that the global AOD per mass of SO2 emitted from the HT-22 eruption is 4 times that of most other eruptions. The quantity of SO2 and ash emitted to the stratosphere was unusually small for an eruption with a volcanic explosivity index (VEI) value of 6. Aerosol formation from intense volcano–sea interaction provides sea salt aerosol as a plausible explanation for the unexpectedly high AOD.
The maximum global stratospheric AOD following the HT-22 eruption is among the highest observed in more than 30 years. The injection in the deep branch of DB circulation prolonged the perturbation of the stratospheric aerosol, making the HT-22 eruption the largest aerosol event since that of Mt. Pinatubo in 1991. The 1-year average global AOD of 0.01 from the HT-22 eruption can be estimated to be −0.24 W m−2 in global stratospheric total volcanic effective radiative forcing.
The data used are publicly available: CALIOP V4.51 lidar data (https://doi.org/10.5067/CALIOP/CALIPSO/CAL_LID_L1-Standard-V4-51, NASA/LARC/SD/ASDC, 2024) and MLS data (version 5.0-1.0a, level 2) from https://doi.org/10.5067/Aura/MLS/DATA2508 (Lambert et al., 2020).
The supplement related to this article is available online at https://doi.org/10.5194/acp-25-10677-2025-supplement.
BGM planned the study, undertook most of the data analysis, and wrote the paper. JF undertook part of the data analysis and MKS contributed. JF and MKS undertook data extraction and handling for the data analysis. All authors participated in discussions and commented on the manuscript.
The contact author has declared that none of the authors has any competing interests.
Publisher's note: Copernicus Publications remains neutral with regard to jurisdictional claims made in the text, published maps, institutional affiliations, or any other geographical representation in this paper. While Copernicus Publications makes every effort to include appropriate place names, the final responsibility lies with the authors.
Aerosol products from the CALIOP sensor were produced by NASA Langley Research Center. Water vapor and temperature profiles from MLS are supplied by Goddard Earth Sciences Data and Information Services Center.
This research has been supported by the Swedish National Space Agency (grant no. 2022-00157, Johan Friberg), the Crafoordska Stiftelsen (grant no. 20240901, Johan Friberg), the Svenska Forskningsrådet Formas (grant no. 2020-00997, Moa Sporre), and the Vetenskapsrådet (grant no. 2022-02836, Moa Sporre).
This paper was edited by Andreas Petzold and reviewed by Daniele Visioni and one anonymous referee.
Adachi, K. and Buseck, P. R.: Changes in shape and composition of sea-salt particles upon aging in an urban atmosphere, Atmos. Environ., 100, 1–9, https://doi.org/10.1016/j.atmosenv.2014.10.036, 2015.
Andersson, S. M., Martinsson, B. G., Friberg, J., Brenninkmeijer, C. A. M., Rauthe-Schöch, A., Hermann, M., van Velthoven, P. F. J., and Zahn, A.: Composition and evolution of volcanic aerosol from eruptions of Kasatochi, Sarychev and Eyjafjallajökull in 2008–2010 based on CARIBIC observations, Atmos. Chem. Phys., 13, 1781–1796, https://doi.org/10.5194/acp-13-1781-2013, 2013.
Andersson, S. M., Martinsson, B. G., Vernier, J. P., Friberg, J., Brenninkmeijer, C. A. M., Hermann, M., van Velthoven, P. F. J., and Zahn, A.: Significant radiative impact of volcanic aerosol in the lowermost stratosphere, Nat. Commun., 6, 1–8, https://doi.org/10.1038/ncomms8692, 2015.
Bauman, J. J., Russell, P. B., Geller, M. A., and Hamill, P.: A stratospheric aerosol climatology from SAGE II and CLAES measurements: 2. Results and comparisons, 1984–1999, J. Geophys. Res., 108, 4383, https://doi.org/10.1029/2002JD002993, 2003.
Bernath, P., Boone, C., Pastorek, A., Cameron, D., and Lecours, M.: Satellite characterization of global stratospheric sulfate aerosols released by Tonga volcano, J. Quant. Spectrosc. Ra., 299, 108520, https://doi.org/10.1016/j.jqsrt.2023.108520, 2023.
Boichu, M., Grandin, R., Blarel, L., Torres, B., Derimian, Y., Goloub, P., Brogniez, C., Chiapello, I., Dubovic, O., Mathurin, T., Pascal, N., Patou, M., and Riedi, J.: Growth and Global Persistence of Stratospheric Sulfate Aerosols From the 2022 Hunga Tonga–Hunga Ha'apai Volcanic Eruption, J. Geophys. Res.-Atmos., 128, e2023JD039010, https://doi.org/10.1029/2023JD039010, 2023.
Bourassa, A. E., Zawada, D. J., Rieger, L. A., Warnock, T. W., Toohey, M., and Degenstein, D. A.: Tomographic retrievals of Hunga Tonga-Hunga Ha'apai volcanic aerosol, Geophys. Res. Lett., 50, e2022GL101978, https://doi.org/10.1029/2022GL101978, 2023.
Carn, S. A., Krotkov, N. A., Fisher, B. L., and Li, C.: Out of the blue: Volcanic SO2 emissions during the 2021–2022 eruptions of Hunga Tonga – Hunga Ha'apai (Tonga), Front. Earth Sci., 10, 976962, https://doi.org/10.3389/feart.2022.976962, 2022.
Carr, J. L., Horváth, A., Wu, D. L., and Friberg, M. D.: Stereo plume height and motion retrievals for the record-setting Hunga TongaHunga Ha'apai eruption of 15 January 2022, Geophys. Res. Lett., 49, e2022GL098131, https://doi.org/10.1029/2022GL098131, 2022.
Chen, Z., Bhartia, P. K., Loughman, R., Colarco, P., and DeLand, M.: Improvement of stratospheric aerosol extinction retrieval from OMPS/LP using a new aerosol model, Atmos. Meas. Tech., 11, 6495–6509, https://doi.org/10.5194/amt-11-6495-2018, 2018.
Clare, M. A., Yeo, I. A., Watson, S., Wysoczanski, R., Seabrook, S., Mackay, K., Hunt, J. E., Lane, E., Talling, P. J., Pope, E., Cronin, S., Ribó, M., Kula, T., Tappin, D., Henrys, S., de Ronde, C., Urlaub, M., Kutterolf, S., Fonua, S., Panuve, S., Veverka, D., Rapp, R., Kamalov, V., and Williams, M.: Fast and destructive density currents created by ocean-entering volcanic eruptions, Science, 381, 1085–1092, 2023.
Clarisse, L., Hurtmans, D., Clerbaux, C., Hadji-Lazaro, J., Ngadi, Y., and Coheur, P.-F.: Retrieval of sulphur dioxide from the infrared atmospheric sounding interferometer (IASI), Atmos. Meas. Tech., 5, 581–594, https://doi.org/10.5194/amt-5-581-2012, 2012.
Colombier, M., Ukstins, I. A., Tegtmeier, S., Scheu, B., Cronin, S. J., Thivet, S., Paredes-Mariño, J., Cimarelli, C., Hess, K.-U., Kula, T., Latu'ila, F. H., and Dingwell, D. B.: Atmosphere injection of sea salts during large explosive submarine volcanic eruptions, Sci. Rep.-UK, 13, 14435, https://doi.org/10.1038/s41598-023-41639-8, 2023.
DeLand, M.: Readme document for the Soumi-NPP OPMS LP L2 AER675 Daily product, Goddard Earth Sciences Data and Information Services Center (GES DISC), http://disc.gsfc.nasa.gov (last access: October 2021), 2019.
Duchamp, C., Wrana, F., Legras, B., Sellitto, P., Belhadji, R., and von Savigny, C.: Observation of the Aerosol Plume From the 2022 Hunga Tonga – Hunga Ha'apai Eruption With SAGE III/ISS, Geophys. Res. Lett., 50, e2023GL105076, https://doi.org/10.1029/2023GL105076, 2023.
Friberg, J., Martinsson, B. G., Andersson, S. M., Brenninkmeijer, C. A. M., Hermann, M., Van Velthoven, P. F. J., and Zahn, A.: Sources of increase in lowermost stratospheric sulphurous and carbonaceous aerosol background concentrations during 1999–2008 derived from CARIBIC flights, Tellus B, 66, 23428, https://doi.org/10.3402/tellusb.v66.23428, 2014.
Friberg, J., Martinsson, B. G., Andersson, S. M., and Sandvik, O. S.: Volcanic impact on the climate – the stratospheric aerosol load in the period 2006–2015, Atmos. Chem. Phys., 18, 11149–11169, https://doi.org/10.5194/acp-18-11149-2018, 2018.
Friberg, J., Martinsson, B. G., and Sporre, M. K.: Short- and long-term stratospheric impact of smoke from the 2019–2020 Australian wildfires, Atmos. Chem. Phys., 23, 12557–12570, https://doi.org/10.5194/acp-23-12557-2023, 2023.
Fromm, M., Lindsey, D. T., Servranckx, R., Yue, G., Trickl, T., Sica, R., Doucet, P., and Godin-Beekmann, S.: The untold story of pyrocumulonimbus, B. Am. Meteorol. Soc., 91, 1193–1209, 2010.
Fromm, M., Kablick III, G., Nedoluha, G., Carboni, E., Grainger, R., Campbell, J., and Lewis, L.: Correcting the record of volcanic stratospheric aerosol impact: Nabro and Sarychev Peak, J. Geophys. Res.-Atmos., 119, 1–22, https://doi.org/10.1002/2014JD021507, 2014.
Fueglistaler, S., Dessler, A. E., Dunkerton, T. J., Folkins, I., Fu, Q., and Ote, P. W.: Tropical tropopause layer, Rev, Geophys., 47, RG1004, https://doi.org/10.1029/2008RG000267, 2009.
Garofalo, L. A., Levin, E. J. T., Campos, T., Kreidenweis, S. N., and Farmer, D. K.: Emission and evolution of submicron organic aerosol in smoke from wildfires in the western United States, ACS Space Chem., 3, 1237–1247, 2019.
Gupta, A. K., Bennartz, R., Fauria, K. E., and Mittal, T.: Eruption chronology of the December 2021 to January 2022 Hunga Tonga-Hunga Ha'apai eruption sequence, Comm. Earth Environm., 3, 314, https://doi.org/10.1038/s43247-022-00606-3, 2022.
Haarig, M., Ansmann, A., Gasteiger, J., Kandler, K., Althausen, D., Baars, H., Radenz, M., and Farrell, D. A.: Dry versus wet marine particle optical properties: RH dependence of depolarization ratio, backscatter, and extinction from multiwavelength lidar measurements during SALTRACE, Atmos. Chem. Phys., 17, 14199–14217, https://doi.org/10.5194/acp-17-14199-2017, 2017.
Haarig, M., Ansmann, A., Baars, H., Jimenez, C., Veselovskii, I., Engelmann, R., and Althausen, D.: Depolarization and lidar ratios at 355, 532, and 1064 nm and microphysical properties of aged tropospheric and stratospheric Canadian wildfire smoke, Atmos. Chem. Phys., 18, 11847–11861, https://doi.org/10.5194/acp-18-11847-2018, 2018.
Hoffmann, A., Ritter, C., Stock, M., Maturilli, M., Eckhardt, S., Herber, A., and Neuber, R.: Lidar measurements of the Kasatochi aerosol plume in August and September 2008 in Ny-Ålesund, Spitsbergen, J. Geophys. Res., 115, D00L12, https://doi.org/10.1029/2009JD013039, 2010.
Hu, Q., Goloub, P., Veselovskii, I., Bravo-Aranda, J.-A., Popovici, I. E., Podvin, T., Haeffelin, M., Lopatin, A., Dubovik, O., Pietras, C., Huang, X., Torres, B., and Chen, C.: Long-range-transported Canadian smoke plumes in the lower stratosphere over northern France, Atmos. Chem. Phys., 19, 1173–1193, https://doi.org/10.5194/acp-19-1173-2019, 2019.
Kahn, R. A., Limbacher, J. A., Junghenn Noyes, K. T., Flower, V. J. B., Zamora, L. M., and McKee, K. F.: Evolving particles in the 2022 Hunga Tonga – Hunga Ha'apai volcano eruption plume, J. Geophys. Res., 129, e2023JD039963, https://doi.org/10.1029/2023JD039963, 2024.
Keene, W. C., Maring, H., Maben, J. R., Kieber, D. J., Pszenny, A. A. P., Dahl, E. E., Izaguirre, M. A., Davis, A. J., Long, M. S., Zhou, X., Smoydzin, L., and Sander, R.: Chemical and physical characteristics of nascent aerosols produced by bursting bubbles at a model air-sea interface, J. Geophys. Res., 112, D21202, https://doi.org/10.1029/2007JD008464, 2007.
Khaykin, S., Podglajen, A., Ploeger, F., Grooß, J.-U., Tence, F., Bekki, S., Khlopenkov, K., Bedka, K., Rieger, L., Baron, A., Godin-Beekmann, S., Legras, B., Sellitto, P., Sakai, T., Barnes, J., Uchino, O., Morino, I., Nagai, T., Wing, R., Baumgarten, G., Gerding, M., Duflot, V., Payen, G., Jumelet, J., Querel, R., Liley, B., Bourassa, A., Clouser, B., Feofilov, A., Hauchecorne, A., and Ravetta, F.: Global perturbation of stratospheric water and aerosol burden by Hunga eruption, Comm. Earth Environm., 3, 316, https://doi.org/10.1038/s43247-022-00652-x, 2022.
Klekociuk, A. R., Ottaway, D. J., MacKinnon, A. D., Reid, I. M., Twigger, L. M., and Alexander, S. P.: Australian Lidar Measurements of Aerosol Layers Associated with the 2015 Calbuco Eruption, Atmosphere-Basel, 11, 124, https://doi.org/10.3390/atmos11020124, 2020.
Kloss, C., Berthet, G., Sellitto, P., Ploeger, F., Taha, G., Tidiga, M., Eremenko, M., Bossolasco, A., Jégou, F., Renard, J.-B., and Legras, B.: Stratospheric aerosol layer perturbation caused by the 2019 Raikoke and Ulawun eruptions and their radiative forcing, Atmos. Chem. Phys., 21, 535–560, https://doi.org/10.5194/acp-21-535-2021, 2021.
Kremser, S., Thomason, L. W., von Hobe, M., Hermann, M., Deshler, T., Timmreck, C., Toohey, M., Stenke, A., Schwarz, J. P., Weigel, R., Fueglistaler, S., Prata, F. J., Vernier, J. P., Schlager, H., Barnes, J. E., Antuña-Marrero, J. C., Fairlie, D., Palm, M., Mahieu, E., Notholt, J., Rex, M., Bingen, C., Vanhellemont, F., Bourassa, A., Plane, J. M. C., Klocke, D., Carn, S. A., Clarisse, L., Trickl, T., Neely, R., James, A. D., Rieger, L., Wilson, J. C., and Meland, B.: Stratospheric aerosol – Observations, processes, and impact on climate, Rev. Geophys., 54, 278–335, https://doi.org/10.1002/2015RG000511, 2016.
Lambert, A., Read, W., and Livesey, N.: MLS/Aura Level 2 Water Vapor (H2O) Mixing Ratio V005, Goddard Earth Sciences Data and Information Services Center (GES DISC) [data set], Greenbelt, MD, USA, https://doi.org/10.5067/Aura/MLS/DATA2508, 2020.
Legras, B., Duchamp, C., Sellitto, P., Podglajen, A., Carboni, E., Siddans, R., Grooß, J.-U., Khaykin, S., and Ploeger, F.: The evolution and dynamics of the Hunga Tonga–Hunga Ha'apai sulfate aerosol plume in the stratosphere, Atmos. Chem. Phys., 22, 14957–14970, https://doi.org/10.5194/acp-22-14957-2022, 2022.
Li, C., Krotkov, N. A., Carn, S., Zhang, Y., Spurr, R. J. D., and Joiner, J.: New-generation NASA Aura Ozone Monitoring Instrument (OMI) volcanic SO2 dataset: algorithm description, initial results, and continuation with the Suomi-NPP Ozone Mapping and Profiler Suite (OMPS), Atmos. Meas. Tech., 10, 445–458, https://doi.org/10.5194/amt-10-445-2017, 2017.
Livesey, N. J., Read, W. G., Wagner, P. A., Froidevaux, L., Santee, M. L., Schwartz, M. J., Lambert, A., Manney, G. L., Valle, L. F. M., Pumphrey, H. C., Fuller, R. A., Jarnot, R. F., Knosp, B. W., and Lay, R. R.: EOS MLS Version 5.0x Level2 and 3 data quality and description document, Tech. rep., Jet Propulsion Laboratory D734 105336 Rev. A, https://mls.jpl.nasa.gov/publications (last access: February 2024), 2020.
Martinsson, B. G., Frank, G., Cederfelt, S.-I., Swietlicki, E., Berg, O. H., Zhou, J., Bower, K. N., Bradbury, C., Birmili, W., Stratmann, F., Wendisch, M., Wiedensohler, A., and Yuskiewicz, B. A.: Droplet nucleation and growth in orographic clouds in relation to the aerosol population, Atmos. Res., 50, 289–315, 1999.
Martinsson, B. G., Brenninkmeijer, C. A. M., Cam, S. A., Hermann, M., Heue, K. P., van Velthoven, P. F. J., and Zahn, A.: Influence of the 2008 Kasatochi volcanic eruption on sulfurous and carbona ceous aerosol constituents in the lower stratosphere, Geophys. Res. Lett., 36, 1–5, https://doi.org/10.1029/2009GL038735, 2009.
Martinsson, B. G., Friberg, J., Sandvik, O. S., Hermann, M., van Velthoven, P. F. J., and Zahn, A.: Formation and composition of the UTLS aerosol, npj Climate and Atmospheric Science, 2, 1–6, https://doi.org/10.1038/s41612-019-0097-1, 2019.
Martinsson, B. G., Friberg, J., Sandvik, O. S., and Sporre, M. K.: Five-satellite-sensor study of the rapid decline of wildfire smoke in the stratosphere, Atmos. Chem. Phys., 22, 3967–3984, https://doi.org/10.5194/acp-22-3967-2022, 2022.
Mastin, L. G., Van Eaton, A. R., and Cronin, S. J.: Did steam boost the height and growth rate of the giant Hunga eruption plume?, B. Volcanol., 86, 64, https://doi.org/10.1007/s00445-024-01749-1, 2024.
Millán, L., Santee, M. L., Lambert, A., Livesey, N. J., Werner, F., Schwartz, M. J., Pumphrey, H. C., Manney, G. L., Wang, Y., Su, H., Read, W. G., and Froidevaux, H. C.: The Hunga Tonga-Hunga Ha'apai Hydration of the Stratosphere, Geophys. Res. Lett., 49, e2022GL099381, https://doi.org/10.1029/2022GL099381, 2022.
Murayama, T., Okamoto, H., Kaneyasu, N., Kamataki, H., and Miura, K.: Application of lidar depolarization measurement in the atmospheric boundary layer: Effects of dust and sea-salt particles, J. Geophys. Res., 104, 31781–31792, 1999.
Murphy, D. M. and Koop, T.: Review of the vapour pressures of ice and supercooled water for atmospheric applications, Q. J. Roy. Meteor. Soc., 131, 1539–1565, https://doi.org/10.1256/qj.04.94, 2005.
Murphy, D. M., Cziczo, D. J., Hudson, P. K., and Thomson, D. S.: Carbonaceous material in aerosol particles in the lower stratosphere and tropopause region, J. Geophys. Res., 112, D04203, https://doi.org/10.1029/2006JD007297, 2007.
Myhre, C. E. L., Nielsen, C. J., and Saastad, O. W.: Density and Surface Tension of Aqueous H2SO4 at Low Temperature, J. Chem. Eng. Data, 43, 617–622, 1998.
NASA/LARC/SD/ASDC: CALIPSO Lidar Level 1B profile data, V4-51, NASA Langley Atmospheric Science Data Center DAAC [data set], https://doi.org/10.5067/CALIOP/CALIPSO/CAL_LID_L1-Standard-V4-51, 2024.
Nedoluha, G. E., Gomez, R. M., Boyd, I., Neal, H., Allen, D. R. and Lambert, A.: The spread of the Hunga Tonga H2O plume in the middle atmosphere over the first two years since eruption, J. Geophys. Res.-Atmos., 129, e2024JD040907, https://doi.org/10.1029/2024JD040907, 2024.
O'Neill, N. T., Perro, C., Saha, A., Lesins, G., Duck, T. J., Eloranta, E. W., Nott, G. J., Hoffman, A., Karumudi, M. L., Ritter, C., Bourassa, A., Abboud, I., Carn, S. A., and Savastiouk, V.: Properties of Sarychev sulphate aerosols over the Arctic, J. Geophys. Res., 117, D04203, https://doi.org/10.1029/2011JD016838, 2012.
Pardini, F., Burton, M., Arzilli, F., La Spina, G., and Polacci, M.: SO2 emissions, plume heights and magmatic processes inferred from satellite data: The 2015 Calbuco eruptions, J. Volcanol. Geoth. Res., 361, 12–24, 2018.
Poli, P. and Shapiro, N. M.: Rapid characterization of large volcanic eruptions: measuring the impulse of the Hunga Tonga Ha'apai explosion from teleseismic waves, Geophys. Res. Lett., 49, e2022GL098123, https://doi.org/10.1029/2022GL098123, 2022.
Proud, S. R., Prata, A. T., and Schmauss, S.: The January 2022 eruption of Hunga Tonga-Hunga Ha'apai volcano reached the mesosphere, Science, 378, 554–557, 2022.
Sandvik, O. S., Friberg, J., Sporre, M. K., and Martinsson, B. G.: Methodology to obtain highly resolved SO2 vertical profiles for representation of volcanic emissions in climate models, Atmos. Meas. Tech., 14, 7153–7165, https://doi.org/10.5194/amt-14-7153-2021, 2021.
Schmidt, A., Mills, M. J., Ghan, S., Gregory, J. M., Allan, R. P., Andrews, T., Bardeen, C. G., Conley, A., Forster, P. M., Gettelman, A., Portmann, R. W., Solomon, S., and Toon, O. B.: Volcanic radiative forcing from 1979 to 2015, J. Geophys. Res.-Atmos., 123, 12491–12508, https://doi.org/10.1029/2018JD028776, 2018.
Schoeberl, M. R., Wang, Y., Ueyama, R., Taha, G., Jensen, E., and Yu, W.: Analysis and impact of the Hunga Tonga-Hunga Ha'apai stratospheric water vapor plume, Geophys. Res. Lett., 49, e2022GL100248, https://doi.org/10.1029/2022GL100248, 2022.
Seabrook, S., Mackay, K., Watson, S. J., Clare, M. A., Hunt, J. E., Yeo, I. A., Lane, E. M., Clark, M. R., Wysoczanski, R., Rowden, A. A., Kula, T., Hoffmann, L. J., Armstrong, E., and Williams, M. J. M.: Volcaniclastic density currents explain widespread and diverse seafloor impacts of the 2022 Hunga Volcano eruption, Nat. Commun., 14, 7881, https://doi.org/10.1038/s41467-023-43607-2, 2023.
Sellitto, P., Podglajen, A., Belhadj, R., Boichu, M., Carboni, E., Cuesta, J., Duchamp, C., Kloss, C., Siddans, R., Bègue, N., Blarel, L., Jegou, F., Khaykin, S., Renard, J.-B., and Legras, B.: The unexpected radiative impact of the Hunga Tonga eruption of 15 January 2022, Comm. Earth Environm., 3, 288, https://doi.org/10.1038/s43247-022-00618-z, 2022.
Sellitto, P., Siddans, R., Belhadj, R., Carboni, E., Legras, B., Podglajen A., Duchamp, C., and Kerridge, B.: Observing the SO2 and Sulfate Aerosol Plumes From the 2022 Hunga Eruption With the Infrared Atmospheric Sounding Interferometer (IASI), Geophys. Res. Lett., 51, e2023GL105565, https://doi.org/10.1029/2023GL105565, 2024.
Taha, G.: OMPS-NPP L2 LP Aerosol Extinction Vertical Profile swath daily 3slit V2, Goddard Earth Sciences Data and Information Services Center (GES DISC) [data set], Greenbelt, MD, USA, https://doi.org/10.5067/CX2B9NW6FI27, 2020.
Taha, G., Loughman, R., Colarco, P. R., Zhu, T., Thomason, L. W., and Jaross, G.: Tracking the 2022 Hunga Tonga-Hunga Ha'apai aerosol cloud in the upper and middle stratosphere using space-based observations, Geophys. Res. Lett., 49, e2022GL100091, https://doi.org/10.1029/2022GL100091, 2022.
Taylor, I. A., Grainger, R. G., Prata, A. T., Proud, S. R., Mather, T. A., and Pyle, D. M.: A satellite chronology of plumes from the April 2021 eruption of La Soufrière, St Vincent, Atmos. Chem. Phys., 23, 15209–15234, https://doi.org/10.5194/acp-23-15209-2023, 2023.
Vernier, J.-P., Thomason, L. W., Pommereau, J. P., Bourassa, A., Pelon, J., Garnier, A., Hauchecorne, A., Blanot, L., Trepte, C., Degenstein, D., and Vargas, F.: Major influence of tropical volcanic eruptions on the stratospheric aerosol layer during the last decade, Geophys. Res. Lett., 38, 1–8, https://doi.org/10.1029/2011GL047563, 2011.
Vernier, J.-P., Farlie, D., Deshler, T., Natarajan, M., Knepp, T., Foster, K., Weingold, F. G., Bedka, K. M., Thomason, L., and Trepte, C.: In situ and space-based observations of the Kelud volcanic plume: The persistence of ash in the lower stratosphere, J. Geophys. Res.-Atmos., 121, 11104–11118, https://doi.org/10.1002/2016JD025344, 2016.
Voudouri, K. A., Michailidis, K., Koukouli, M.-E., Rémy, S., Inness, A., Taha, G., Peletidou, G., Siomos, N., Balis, D., and Parrington, M.: Investigating a Persistent Stratospheric Aerosol Layer Observed over Southern Europe during 2019, Remote Sens.-Basel, 15, 5394, https://doi.org/10.3390/rs15225394, 2023.
Waters, J. W., Froidevaux, L., Harwood, R., Jarnot, R., Pickett, H., Read, W., Siegel, P., Cofield, R., Filipiak, M., Flower, D., Holden, J., Lau, G., Livesey, N., Manney, G., Pumphrey, H., Santee, M., Wu, D., Cuddy, D., Lay, R., Loo, M., Perun, V., Schwartz, M., Stek, P., Thurstans, R., Boyles, M., Chandra, S., Chavez, M., Chen, G.-S., Chudasama, B., Dodge, R., Fuller, R., Girard, M., Jiang, J., Jiang, Y., Knosp, B., LaBelle, R., Lam, J., Lee, K., Miller, D., Oswald, J., Patel, N., Pukala, D., Quintero, O., Scaff, D., Snyder, W., Tope, M., Wagner, P., and Walch, M.: The earth observing system microwave limb sounder (EOS MLS) on the Aura satellite, IEEE T. Geosci. Remote, 44, 1106–1121, 2006.
Wilson, J. C., Lee, S.-H., Reeves, J. M., Brock, C. A., Jonsson, H. H., Lafleur, B. G., Loewenstein, M., Podolske, J., Atlas, E., Boering, K., Toon, G., Fahey, D., Bui, T. P., Diskin, G., and Moore, F.: Steady-state aerosol distributions in the extra-tropical, lower stratosphere and the processes that maintain them, Atmos. Chem. Phys., 8, 6617–6626, https://doi.org/10.5194/acp-8-6617-2008, 2008.
Winker, D. M., Hunt, W. H., and McGill, M. J.: Initial performance assessment of CALIOP, Geophys. Res. Lett., 34, 1–5, https://doi.org/10.1029/2007GL030135, 2007.
Winker, D. M., Pelon, J., Coakley, J. A., Ackerman, S. A., Charl son, R. J., Colarco, P. R., Flamant, P., Fu, Q., Hoff, R. M., Kittaka, C., Kubar, T. L., Le Treut, H., McCormick, M. P., Mégie, G., Poole, L., Powell, K., Trepte, K., Vaughan, M. A., and Wielicki, B. A.: The CALIPSO mission – A global 3D view of aerosols and clouds, B. Am. Meteorol. Soc., 91, 1211–1229, https://doi.org/10.1175/2010BAMS3009.1, 2010.
Winkler, P.: The growth of atmospheric aerosol particles as a function of the relative humidity – II Improved concept of mixed nuclei, Aerosol Sci., 4, 373–387, 1973.
Xu, J., Li, D., Bai, Z., Tao, M., and Bian, J.: Large Amounts of Water Vapor Were Injected into the Stratosphere by the Hunga Tonga–Hunga Ha'apai Volcano Eruption, Atmosphere-Basel, 13, 912, https://doi.org/10.3390/atmos13060912, 2022.
Yang, K., Liu, X., Bhartia, P. K., Krotkov, N. A., Carn, S. A., Hughes, E. J., Krueger, A. J., Spurr, R. J. D., and Trahan, S. G.: Direct retrieval of sulfur dioxide amount and altitude from spaceborne hyperspectral UV measurements: Theory and application, J. Geophys. Res., 115, D00L09, https://doi.org/10.1029/2010JD013982, 2010.
Zhu, Y., Bardeen, C. G., Tilmes, S., Mills, M. J., Wang, X., Harvey, V. L., Taha, G., Kinnison, D., Portmann, R. W., Yu, P., Rosenlof, K. H., Avery, M., Kloss, C., Li, C., Glanville, A. S., Millán, L., Deshler, T., Krotkov, N, and Toon, O. B.: Perturbations in stratospheric aerosol evolution due to the water-rich plume of the 2022 Hunga-Tonga eruption, Comm. Earth Environm., 3, 248, https://doi.org/10.1038/s43247-022-00580-w, 2022.
Zhuang, J. and Yi, F.: Nabro aerosol evolution observed jointly by lidars at a mid-latitude site and CALIPSO, Atmos. Environ., 140, 106–116, 2016.