the Creative Commons Attribution 4.0 License.
the Creative Commons Attribution 4.0 License.
 | 15 Sep 2025
Unveiling single-particle composition, size, shape, and mixing state of freshly emitted Icelandic dust via electron microscopy analysis
Agnesh Panta
Konrad Kandler
Kerstin Schepanski
Andres Alastuey
Pavla Dagsson Waldhauserova
Sylvain Dupont
Melanie Eknayan
Cristina González-Flórez
Adolfo González-Romero
Martina Klose
Mara Montag
Xavier Querol
Jesús Yus-Díez
Carlos Pérez García-Pando
Iceland is a significant high-latitude dust source area. Airborne Icelandic dust influences the climate system by interacting with radiation, clouds, and biogeochemical cycles; it also affects snow and ice albedo and air quality. These impacts are sensitive to the dust’s mineralogical, chemical, and physical properties. However, comprehensive measurements and analyses of Icelandic dust particles remain limited. This study examines dust samples collected during a field campaign in the Dyngjusandur desert (August–September 2021) using active and passive aerosol sampling. Over 190 000 individual particles, ranging from 0.1 to 120 µm, were analyzed for their chemical and physical properties using computer-controlled scanning electron microscopy/energy-dispersive X-ray spectroscopy (ccSEM/EDX). Results show heterogeneity in particle size, shape, and composition. The most abundant particle type was medium-Al mixed particles, likely glass-like, comprising 35 %–92 % of the aerosol volume. Sulfate particles, suggesting volcanic contributions, were detected in some samples. Iron (Fe)- and titanium (Ti)-rich particles made up 3.3 % and 6 % of the aerosol volume, respectively, mainly in the size fraction < 1 µm. The median aspect ratio ranged from 1.37 to 1.53, increasing with particle size. Our findings highlight key differences in Icelandic dust compared to Saharan dust, including higher iron and titanium content and a lack of potassium in Icelandic dust. Additionally, Icelandic dust shows a size-dependent increase in aspect ratio, unlike Saharan dust, which remains constant. These observations can improve model simulations that account for the effect of high-latitude dust in the Earth system.
- Article
(4668 KB) - Full-text XML
- Companion paper
-
Supplement
(6426 KB) - BibTeX
- EndNote


Mineral dust is one of the most important and prominent aerosol types. Dust impacts the Earth system via interactions with radiation (Kok et al., 2023), clouds (Shi et al., 2022), atmospheric chemistry (Gaston, 2020), the cryosphere (Dong et al., 2020), and ocean biogeochemistry (Hamilton et al., 2022). The chemical and mineralogical composition, morphology, and size distribution of dust are critical parameters in determining its impact on the atmosphere and environment (Formenti et al., 2011; Mahowald et al., 2014): the elemental composition determines the biogeochemical cycling of minerals (Shi et al., 2012), and the material properties determine the optical properties, in particular with respect to light absorption (Sokolik et al., 1998). Moreover, the distribution of the compounds in and among the particles (i.e., internal or external mixing) is another important factor to consider. For example, the optical properties of aerosols, such as light absorption and scattering, are strongly dependent on their mixing state (Lindqvist et al., 2014; Nousiainen and Kandler, 2015). In addition, chemical transformation processes, such as heterogeneous reactions and secondary aerosol formation, are also considerably affected by whether particles are internally or externally mixed (Ito and Feng, 2010). The mixing state can vary substantially depending on the regional aerosol regime and emission sources, reflecting the diverse and heterogeneous nature of ambient particulate matter (Li et al., 2016). Understanding these mixing structures is essential for assessing aerosol impacts on climate and air quality.
Although hot subtropical deserts are the largest contributors to the global dust cycle (Kok et al., 2021), recent research has identified cold deserts at high latitudes as an important yet neglected dust source (Prospero et al., 2012; Bullard et al., 2016; Meinander et al., 2022). High-latitude dust (HLD) regions are defined as north of ≥ 50° N and south of ≥ 40° S and include the Arctic as a sub-region ≥ 60° N (Meinander et al., 2022). Model simulations indicate that HLD sources contribute an estimated 1 %–5 % of global dust emission (Bullard et al., 2016; Groot Zwaaftink et al., 2016; Meinander et al., 2022), while their impact might be much higher due to their presence in an otherwise pristine but sensitive environment (Schmale et al., 2021). Some studies suggest that HLD sources may become more active in the future as glaciers retreat and expose new sediments (Bullard et al., 2016; Meinander et al., 2022). While factors such as changes in precipitation and vegetation cover could counteract this effect by stabilizing dust source areas (Aryal and Evans, 2023), field observations from Iceland demonstrate that precipitation has limited influence on dust suspension from glacial outwash plains. Dust storms have been observed during high precipitation periods and even with little wind, with dust plumes occurring within hours after rainfall (Waldhauserova et al., 2014). Further work is needed to understand the net effect on HLD emissions due to climate change.
In the Northern Hemisphere, Iceland is a major high-latitude source of dust (Arnalds et al., 2001, 2016). While Iceland as a whole is humid from a climatological point of view, some regions in the interior are semi-arid due to shielding by the surrounding mountains (Arnalds et al., 2016). Therefore, it is one of the most active eolian areas on Earth, consisting of sandy deserts, which undergoes intensive eolian processes (Arnalds et al., 2001, 2016). Glaciers cover about 11 % of Iceland's land surface (Björnsson and Pálsson, 2008). Glacier activity results in the production of glacial sediment of which in particular the fine fraction is transported by glacial meltwater. After drying, these fine sediments are prone to wind erosion (Bullard et al., 2016) and frequently emit dust (Arnalds, 2010; Arnalds et al., 2016). The sandy areas of Iceland have dark surfaces consisting of mostly basaltic volcanic glass (Arnalds et al., 2001). Hence, due to the different geological origin and a different weathering regime compared to lower latitudes with a different climate, the properties of Icelandic dust are significantly different compared to northern African and Asian dust (Baldo et al., 2020, 2023; González-Romero et al., 2024b).
Icelandic dust serves as ice-nucleating particles (INPs) across the North Atlantic and Arctic (Paramonov et al., 2018; Sanchez-Marroquin et al., 2020; Kawai et al., 2023). However, the abundance, sources, and nature of INPs in the high latitudes remain poorly understood (Murray et al., 2021; Xi et al., 2022). Furthermore, Icelandic dust can be strongly light-absorbing due to the presence of magnetite-like particles (Yoshida et al., 2016). In addition, it has different shapes, lower densities, higher porosity, increased roughness, and darker colors compared to other desert dusts (Butwin et al., 2020; Richards-Thomas et al., 2021). Icelandic dust provides a large surface for heterogeneous reactions with SO2 uptake, thus providing a major sink of sulfur in volcanic clouds (Urupina et al., 2019; Lasne et al., 2022). Icelandic dust also has a strong influence on the mass balance of glaciers in Iceland (Wittmann et al., 2017) and thereby has a stronger positive direct radiative forcing on climate (Baldo et al., 2023), as indicated by its optical properties alone. Emitted Icelandic dust can be transported towards the North Atlantic Ocean (Dagsson-Waldhauserova et al., 2013; Moroni et al., 2018) as well as to glaciers in Greenland (Meinander et al., 2016). The transported dust could also potentially influence marine biota within ecosystems in the Arctic Ocean (Dagsson-Waldhauserova et al., 2017).
Information on the physico-chemical differences across dust sources is essential for dust modeling and understanding its climate impact. The mineralogical composition of dust can differ greatly between regions because of geological and climatic influences (Claquin et al., 1999; Journet et al., 2014). However, many Earth models generally assume a globally uniform dust composition, due to the lack of comprehensive global data on the parent soil. Only a few models consider variations in dust mineralogy (Perlwitz et al., 2015; Gonçalves Ageitos et al., 2023; Song et al., 2024) by utilizing global soil type atlases and extrapolating from a small set of analyses. In situ studies, which could provide more accurate data, are often limited by several challenges. For one, source areas are difficult to study due to the remote and harsh nature of source regions, as well as the technical difficulties in sampling during dust storm conditions. Instruments used for measuring dust in these conditions are often prone to saturation or damage, further complicating data collection. Moreover, the large size range, spanning from a few micrometers to hundreds of micrometers, of mineral dust particles adds another layer of complexity. Field measurements often struggle to capture the larger supermicron particles, which constitute a significant fraction of the total mass. Additionally, different sampling methods based on properties such as optical, inertial, or electrical characteristics often yield data that are difficult to compare, as these methods depend on particle composition, size, and shape. Without parallel measurements of physico-chemical properties, the data from different techniques can be difficult to reconcile (Hinds, 1999). These issues underscore the need for more robust in situ studies that can provide high-resolution data on particle composition, size distribution, and source characterization to improve the accuracy of dust–climate interaction models.
To tackle these and other knowledge gaps, we performed a large-scale field experiment in the most prolific dust source region of Iceland, the desert of Dyngjunsandur, in August and September 2021. The campaign was co-organized by two projects: FRontiers in dust minerAloGical coMposition and its Effects upoN climaTe (FRAGMENT) and Iceland as a model for high-latitude dust sources – a combined experimental and modeling approach for characterization of dust emission and transport processes (HiLDA). The goal of the campaign was to improve our fundamental understanding of the emitted-dust size distribution and size-resolved mineralogical composition along with their relationship with the parent soil properties and meteorology. The campaign included a detailed study of the mineralogical composition, particle size distribution, mode of occurrence of Fe, degree of cohesion, and visible–near-infrared (VNIR) reflectance spectra of the dust-emitting sediment (González-Romero et al., 2024b). Additionally, the study focused on the small-scale meteorology and size-resolved fluxes (Dupont et al., 2024). This campaign followed another one performed in Morocco (2019) (Panta et al., 2023; González-Flórez et al., 2023; González-Romero et al., 2023) and preceded two other campaigns in the US (2022) (González-Romero et al., 2024a) and Jordan (2022) (Dupont et al., 2024), all of which were performed within the FRAGMENT project.
This study focuses on the analysis of composition, size, and shape of the freshly emitted dust using electron microscopy. Computer-controlled scanning electron microscopy coupled with energy-dispersive X-ray analysis (ccSEM/EDX) enables the investigation of the elemental and morphological composition of a large number of aerosol particles leading to higher counting statistics that are representative of the major particle type present in the collected sample (Kandler et al., 2007; Scheuvens et al., 2011; Kandler et al., 2020; Panta et al., 2023). We focus on the composition of airborne-sampled freshly emitted mineral dust close to the source as well as in the outflow regions, the average shape parameter (aspect ratio) and its relationship with size and composition, the difference in composition during different dust episodes, and the iron contribution to the single particles. We conclude the paper by comparing high-latitude Icelandic dust and mid-latitude Moroccan dust that were sampled using the same collection technique and analyzed using ccSEM/EDX (Panta et al., 2023).
2.1 Study area and sampling sites
The intensive campaign was carried out in the highlands of Iceland for a period of 6 weeks during August–September 2021. During these weeks, measurements were carried out in Dyngjusandur (DYS) as well as the outflow region (MRS, SRS, HRS, and VFS) as shown in Fig. 1. The coordinates of all the sampling sites are given in Table S1 in the Supplement. Dyngjusandur lies north of the Vatnajökull glacier in the interior of Northeast Iceland and is characterized by various surface pathways of eolian sediments. It has a dry, cold climate with an annual precipitation of less than 400 mm and is known to be one of the most extensive dust source areas in Iceland, with frequent dust events observed during summer (Arnalds et al., 2016). During the campaign, temperatures ranged mostly between 5 and 15 °C. There were only 6 d when temperatures exceeded 15 °C, with the highest 15 min average peak at 2 m height recorded as 21.61 °C on 24 August, breaking the previous maximum temperature record for August. This temperature rise caused the Vatnajökull glacier to experience intensified daily meltwater discharge, leading to complete flooding of the measurement site. The increased wind speed during the following days, with average values exceeding 18 m s−1 at 9.9 m height and gusts above 25 m s−1, resulted in intense dust storms that lasted throughout the day. This was a significant change from the initial period of the campaign, which had weaker winds, more frequent precipitation, and shorter and less intense dust events (Dupont et al., 2024; González-Romero et al., 2024b).
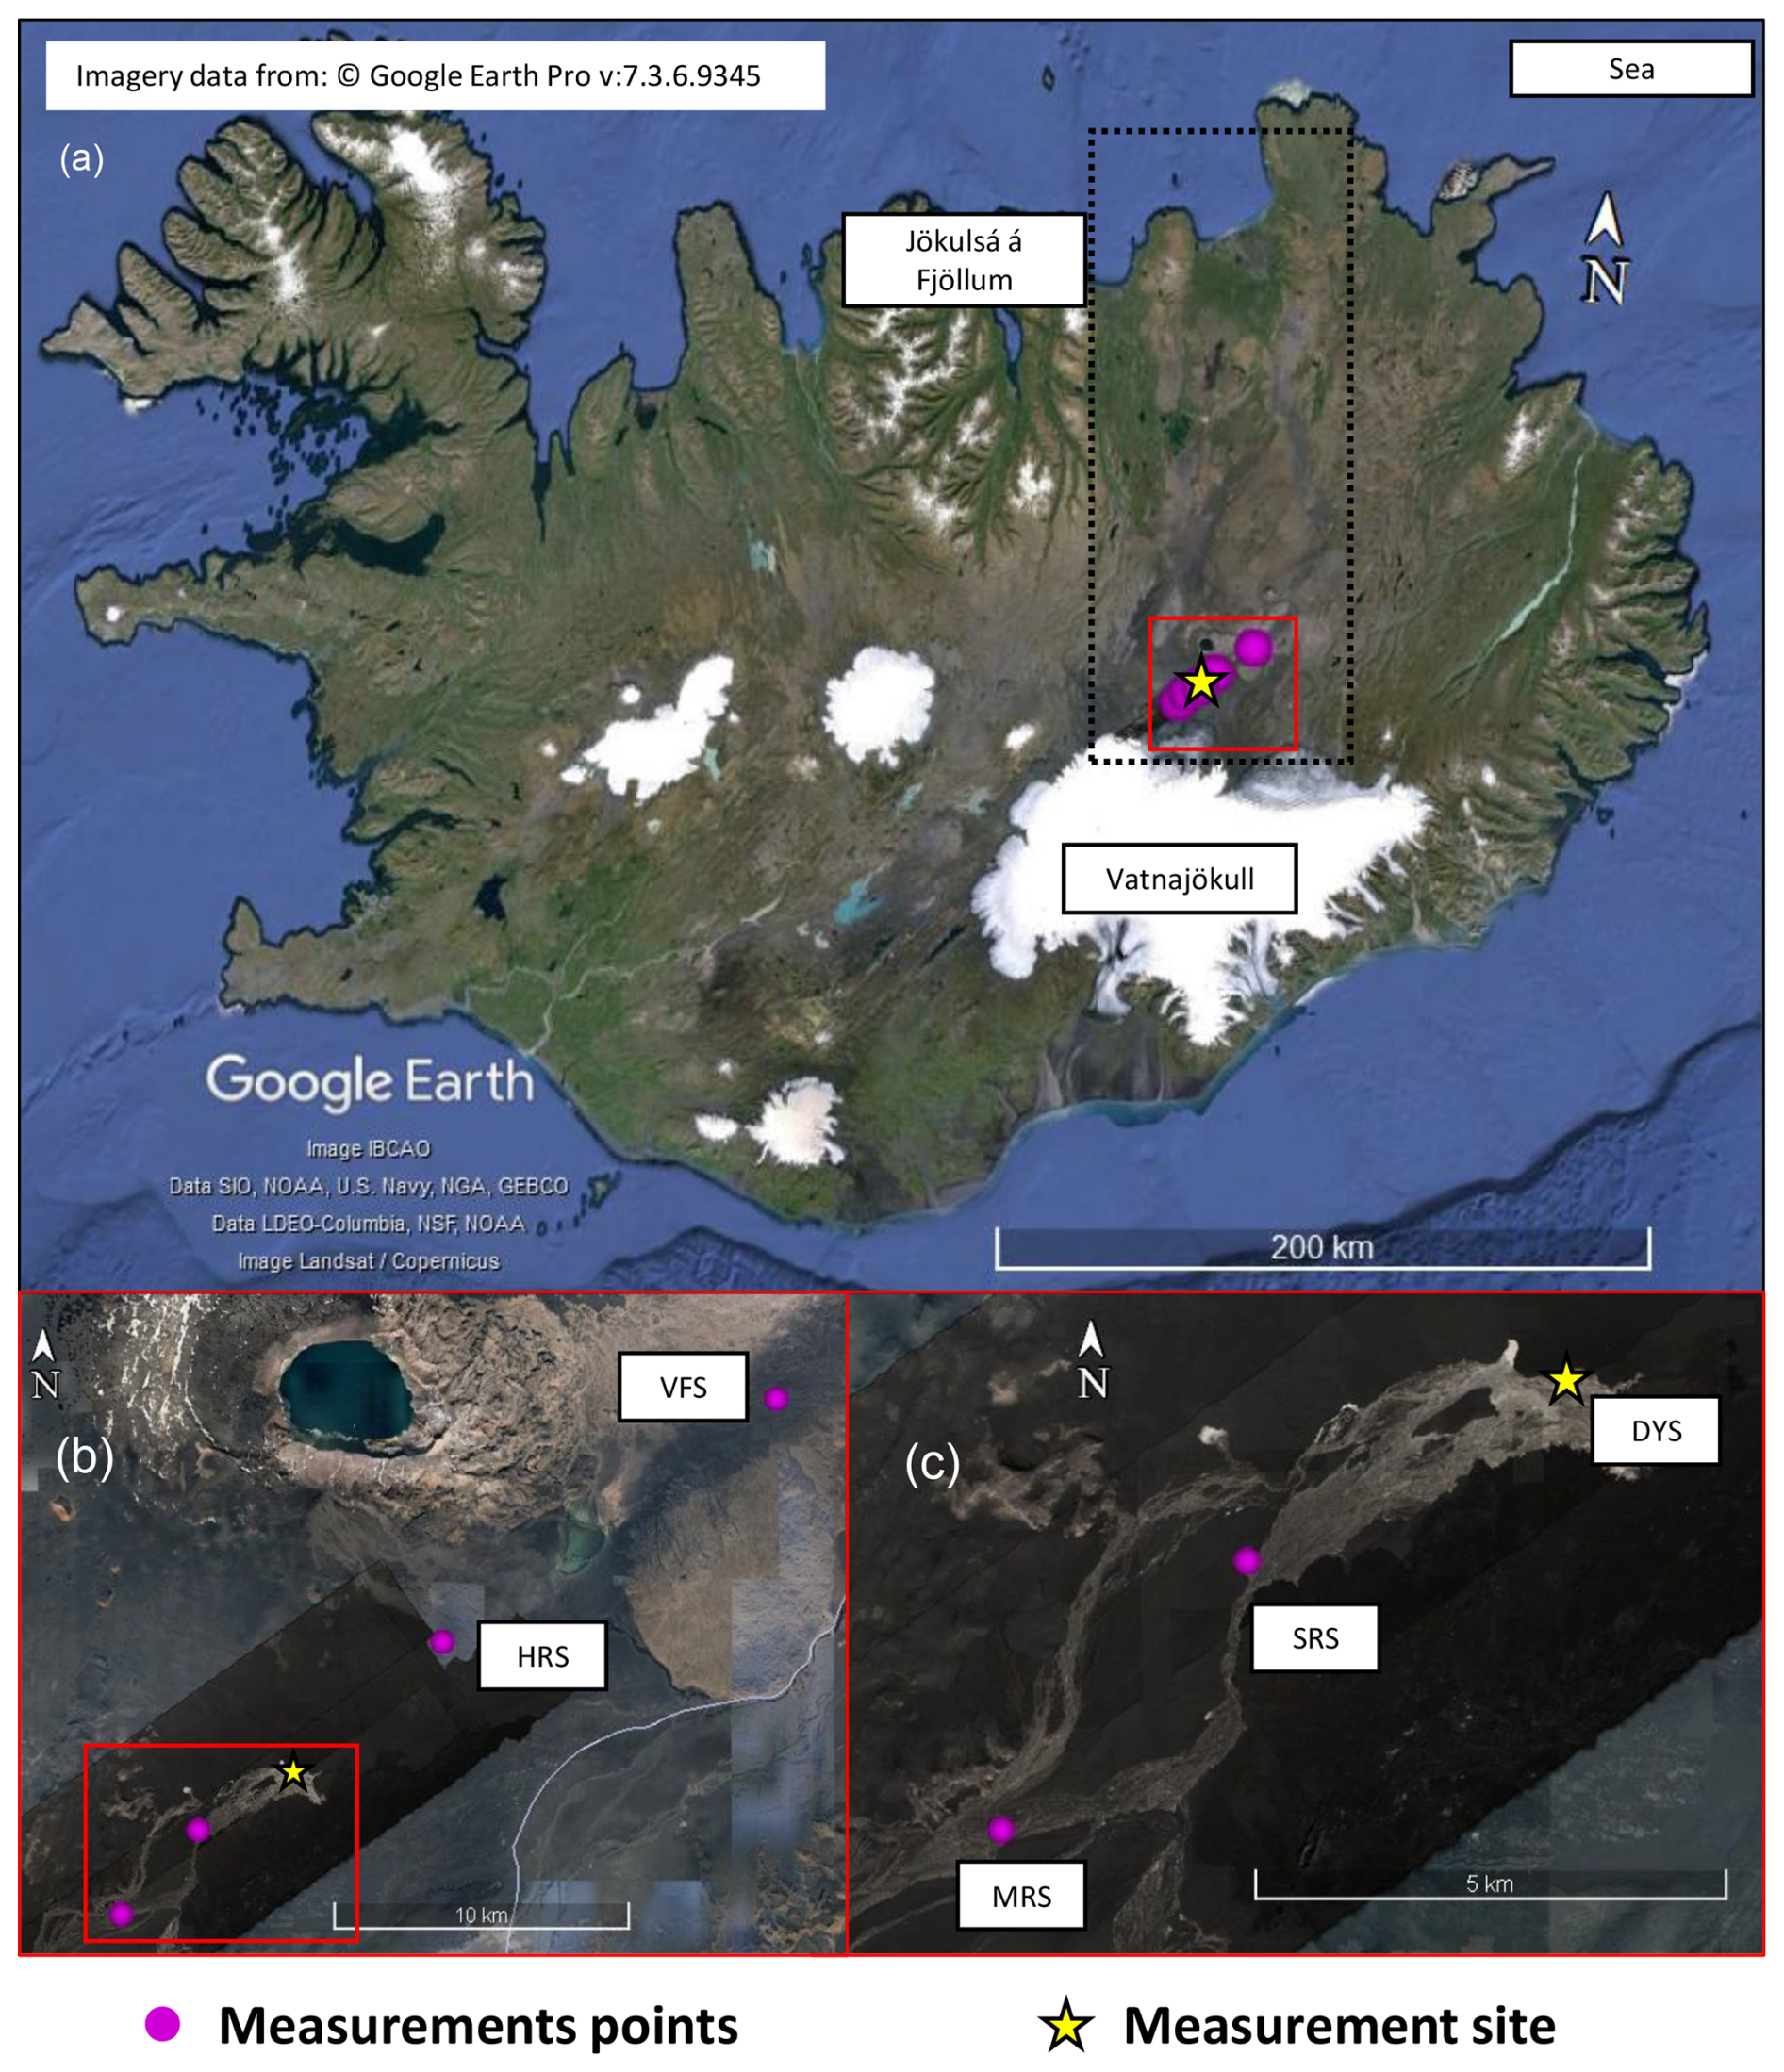
Figure 1(a) Basemap of Iceland showing the hotspot region of Jökulsá á Fjöllum with dotted points. The yellow star indicates the main experimental site “DYS”, and the purple dots mark the locations of deposition samplers in the outflow regions. (b) Zoom-in of the hotspot region showing the samplers “HRS” and “VFS” located northeast of the main site. (c) Zoom-in showing the samplers “SRS” and “MRS” located southwest of the main site.
The main site (DYS) was located in a terminal lake connected to a nearby glacier (64°54′55′′ N, 16°46′35′′ W; 710 m a.s.l.; see Fig. 1). The area is topographically mostly flat and is devoid of vegetation or other obstacles. It has however meltwater channels due to the glacier discharge causing glacio-fluvial sediment to be frequently replenished with finer particles on top that are prone to dust emission under favorable conditions (González-Romero et al., 2024b; Dupont et al., 2024). The main site (DYS) was heavily instrumented with several ground-based monitoring devices for meteorological and airborne dust measurements. In addition to the main measurement site, dust deposition samplers were deployed throughout the region to study the spatial distribution and composition of dust. These auxiliary sites are labeled MRS, SRS, HRS, and VFS (see Fig. 1). MRS and SRS are located near DYS, while HRS and VFS are positioned further downwind, with VFS situated on a hilltop. MRS, SRS, and HRS have surface characteristics similar to the main site and are part of the Jökulsá á Fjöllum river basin. VFS is located approximately 60 m above the riverbed and is well-positioned to monitor airborne dust leaving the riverbed source.
2.2 Particle sampling
Particles were collected using flat-plate samplers (FPSs) and free-wing impactors (FWIs), both of which are briefly described in the section below. A detailed description and methodology of sampling techniques have been described in previous publications (Kandler et al., 2018; Panta et al., 2023). All samples have been collected on top of pure carbon adhesive substrates (Spectro Tabs, Plano GmbH, Wetzlar, Germany) mounted to standard scanning electron microscopy (SEM) aluminum stubs. Pure carbon substrate was chosen because of the low-Z background providing a contrast between particles and background as well as the different elemental composition of the background and the substances of interest. All adhesive samples were stored in standard SEM storage boxes (Ted Pella Inc., Redding, CA, USA) in dry conditions. FWI samples were collected twice per day with a typical sampling duration of a few minutes to an hour, whereas the exposure time was 8–48 h for the FPS. The sample substrate exposure time was dependent on the estimated aerosol concentrations in order to have a statistically significant number of particles on the substrate for individual-particle analysis.
The differences in sampling durations reflect the distinct operational modes of the samplers. Passive samplers (i.e., FPS) require longer integration times (8–48 h) to accumulate sufficient aerosol loading due to their low collection velocities. In contrast, active samplers (i.e., FWI) can operate over much shorter time frames (minutes to an hour), as their high effective deposition velocities ensure adequate particle loading. Matching the durations across all systems would result in either underloading of the passive samples or overloading of active ones. Examples of low-magnification electron micrographs of dust collected by the flat-plate deposition sampler are shown in Sect. S7 of the Supplement, providing an overview of the diversity of the dust grains.
2.2.1 Free-wing impactor (FWI)
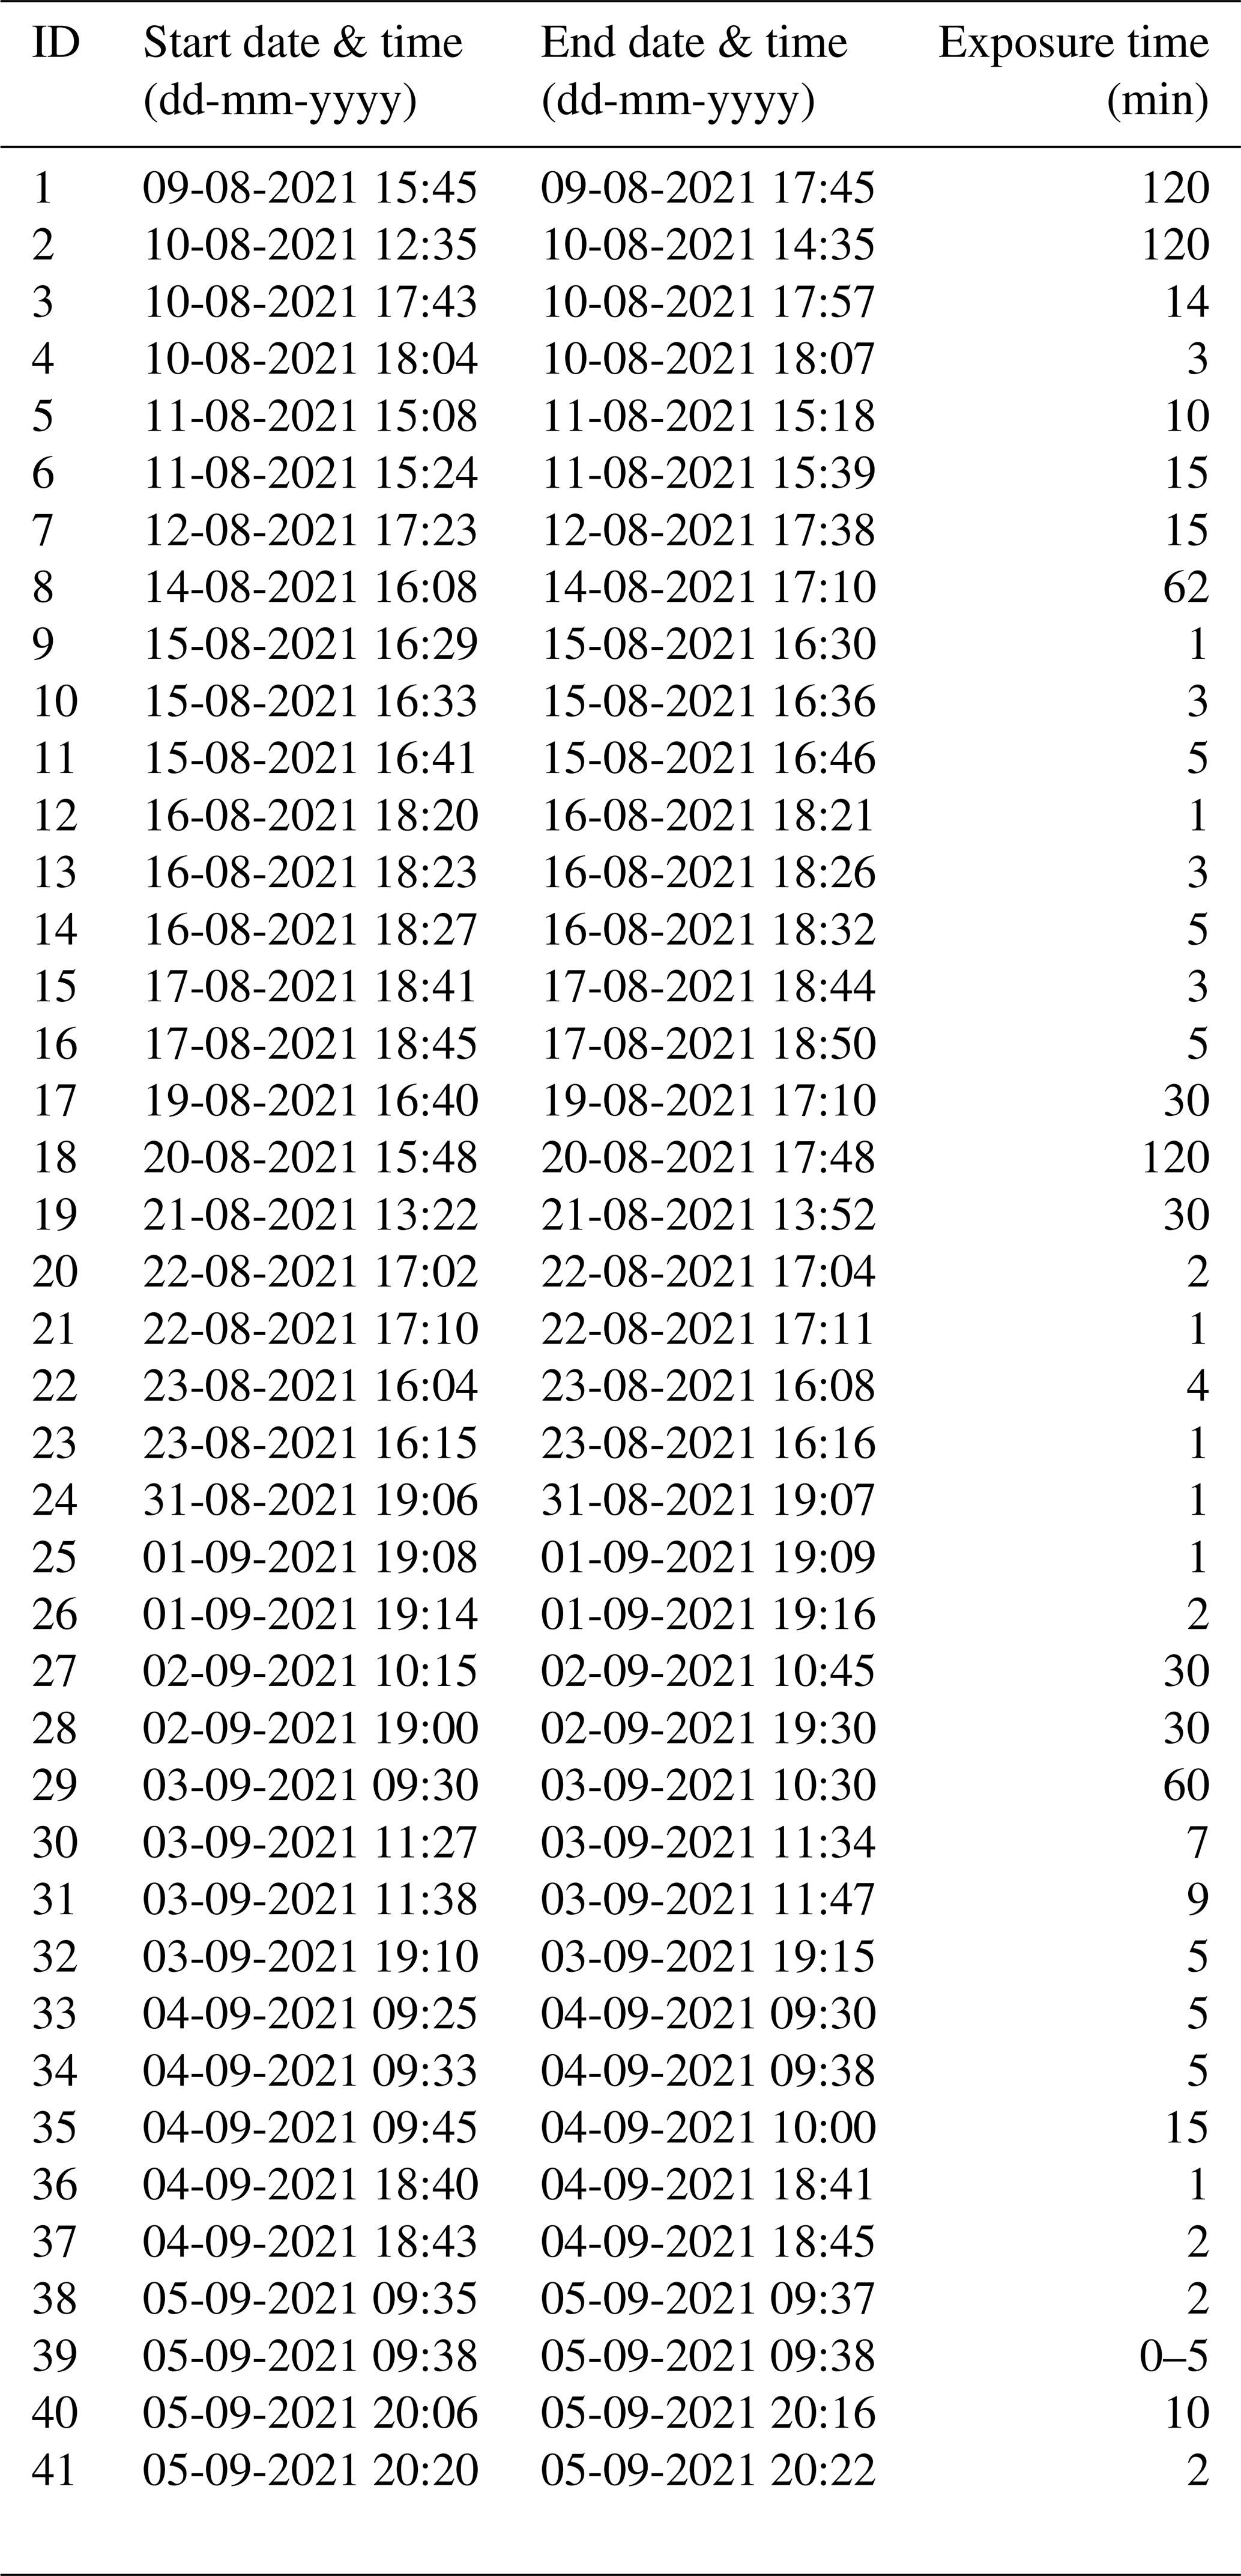
A free-wing impactor (Kandler et al., 2018; Panta et al., 2023) was used to collect particles larger than approximately 3 µm (projected diameter). The FWI has a carbon adhesive impaction surface on the aluminum stub attached to a rotating arm that moves through the air; particles deposit on the moving plate due to their inertia. The rotating arm is moved at a constant speed by a stepper motor, which is fixed on a wind vane, aligning the FWI to the wind direction. The substrate itself is oriented perpendicular to the airstream vector (resulting from wind and rotation speeds), which is maintained by a small wind vane attached to the rotating arm. The particle size cutoff is defined by the impaction parameter, i.e., by rotation speed, wind speed, and sample substrate geometry. Table 1 gives an overview of the FWI sampling times. The reported time is in UTC, which is also local time for Iceland.
Table 1Sampling times for free-wing impactor samplers at Dyngjusandur (DYS).
2.2.2 Flat-plate sampler
The dry-deposition flat-plate sampler (FPS) used in this work is similar to the original FPS used in Ott and Peters (2008), except for a retraction of the deposition surface to the level of the lower plate (Waza et al., 2019). It consists of two round brass plates (top-plate diameter of 203 mm, bottom-plate diameter of 127 mm, thickness of 1 mm each) mounted 16 mm apart. The plates protect the substrate from precipitation and reduce the effects of wind speed by reducing the smallest turbulence to the distance between the parallel plates. This design prevents larger droplets (> 1 mm) from reaching the surface of the SEM stub at low wind speeds (Ott and Peters, 2008). The main triggers for particle deposition on the substrate are diffusion, settling by gravity, and turbulent inertial forces.
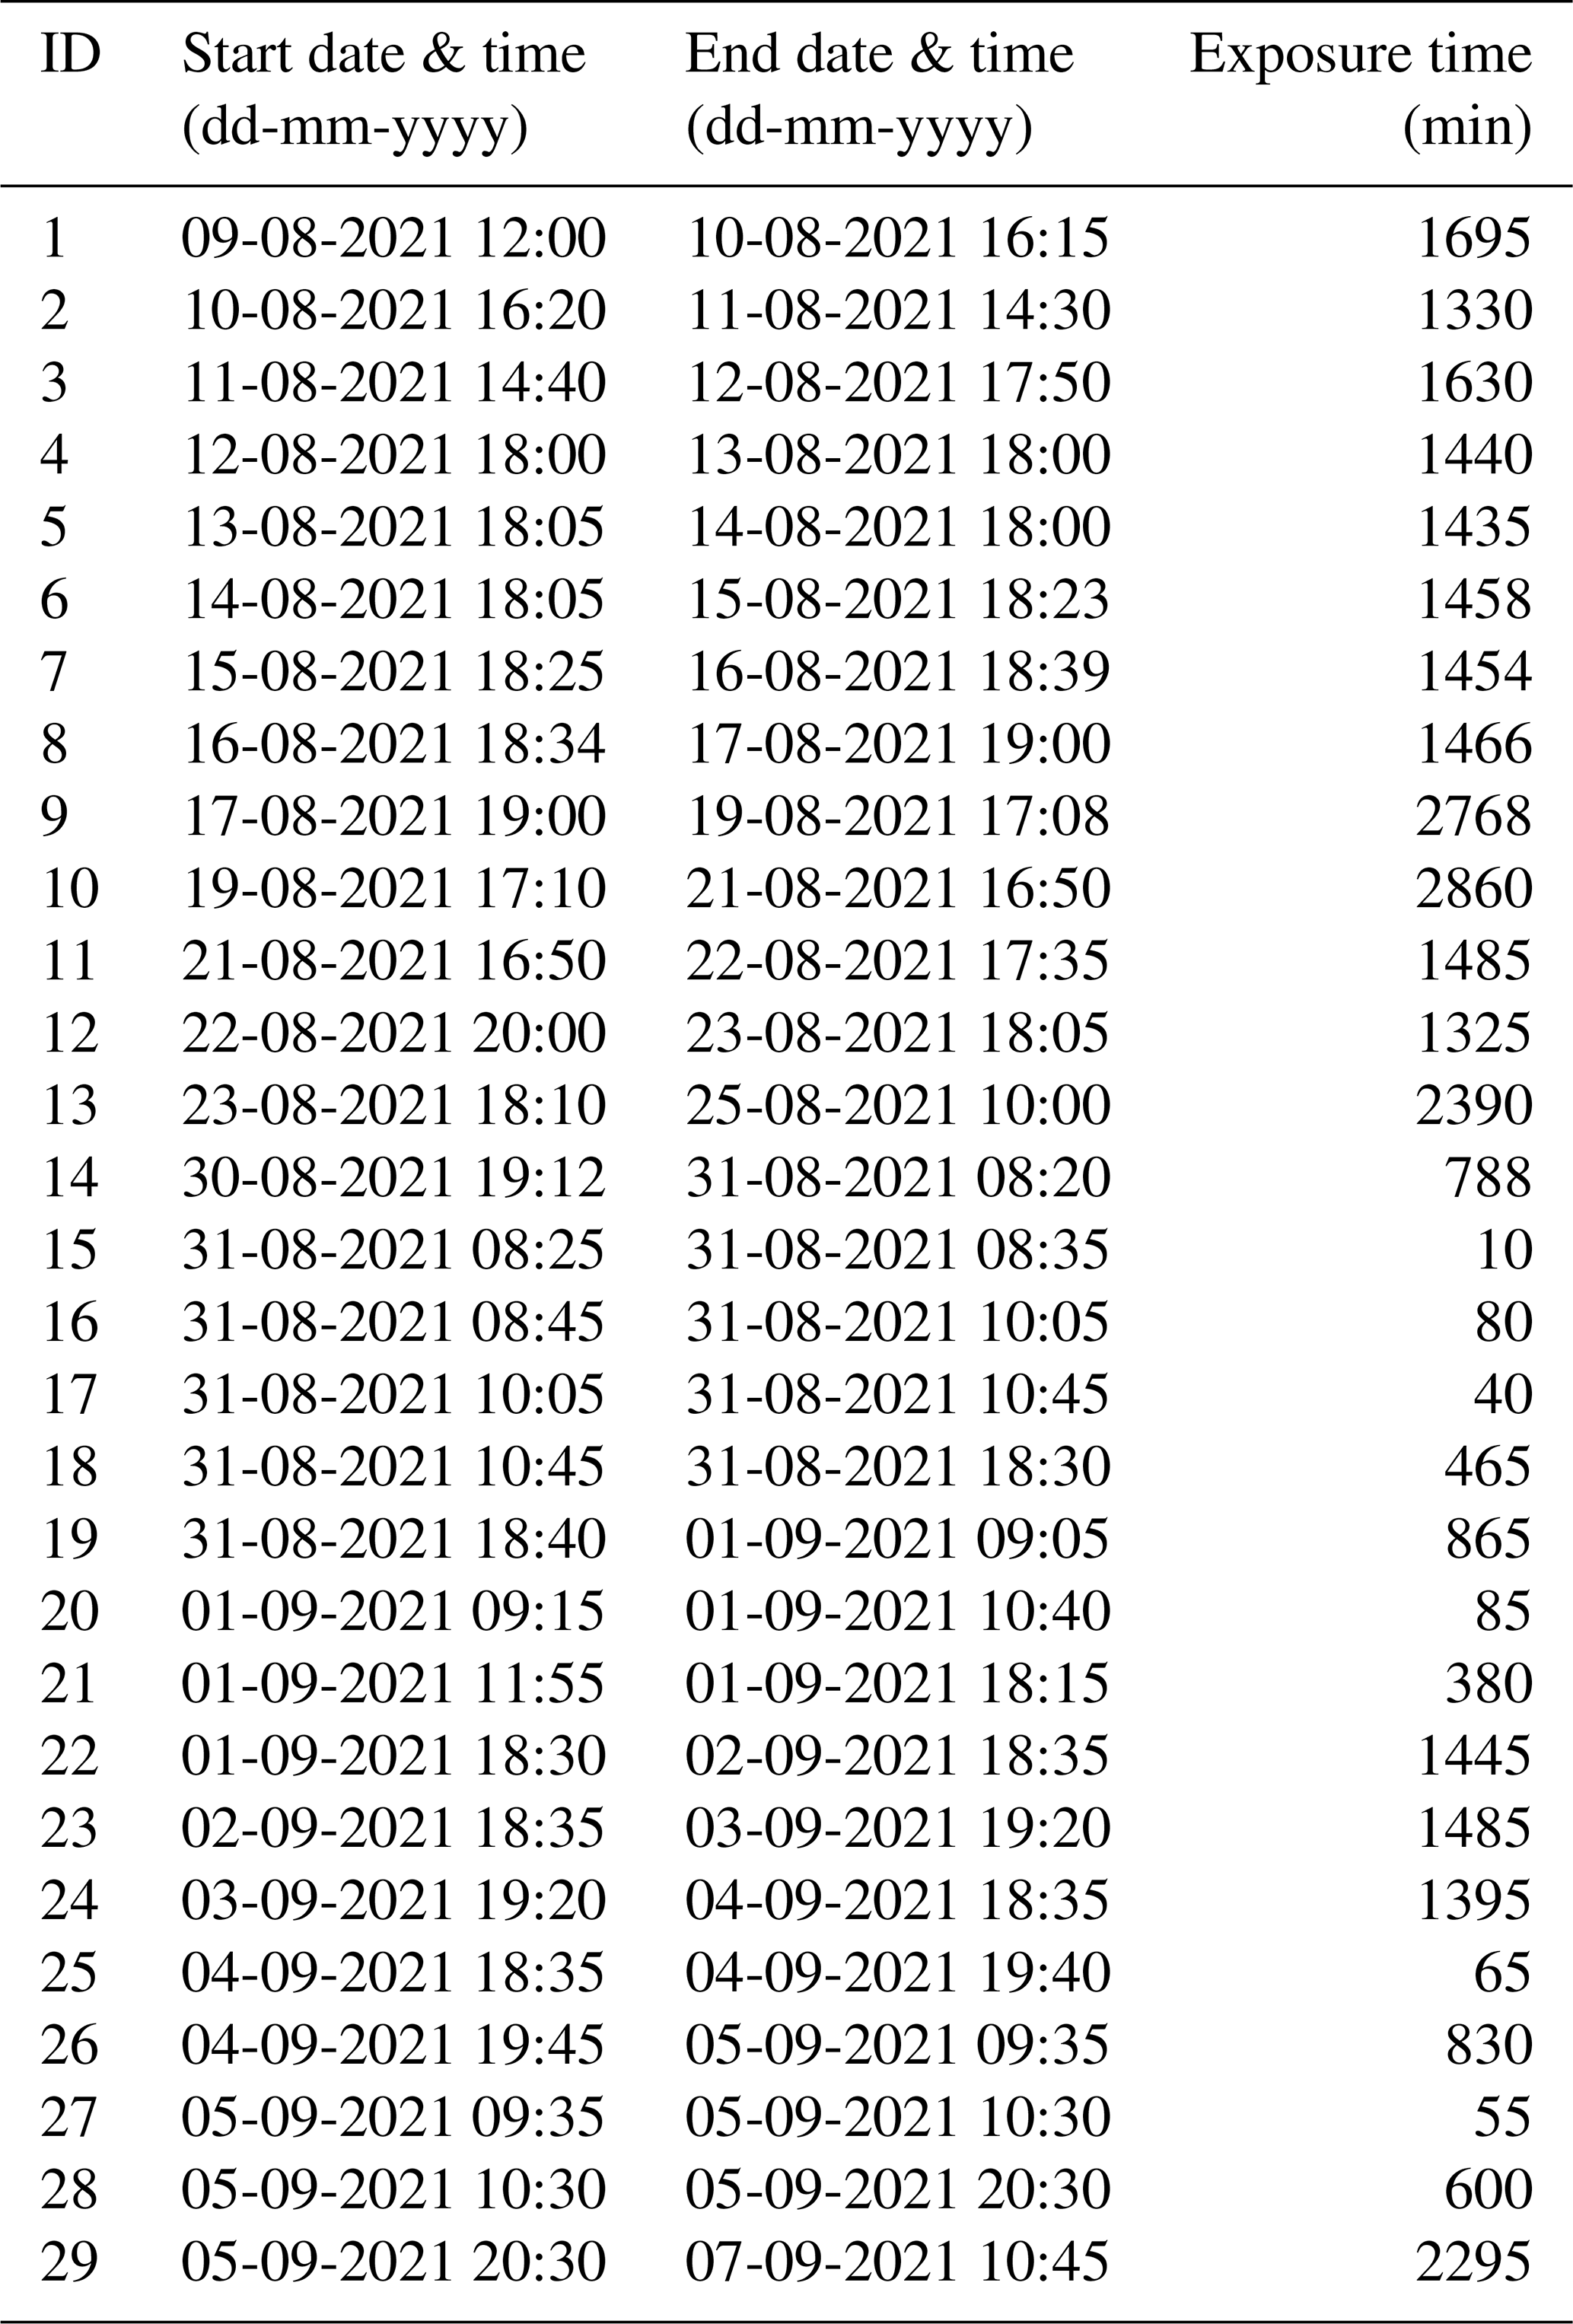
A total of 29 sample substrates for electron microscopy were analyzed. There were a few samples that could not be analyzed because of overloading of the substrate. Table 2 gives an overview of the sampling times. The reported time is in UTC, which is also local time for Iceland. The sampling time for samples collected at surrounding locations is given in Tables S2–S5.
Table 2Sampling times for flat-plate samplers at Dyngjusandur (DYS).
2.3 Scanning electron microscopy (SEM)
2.3.1 Composition
The elemental composition and morphology of individual particles were analyzed using computer-controlled scanning electron microscopy (ccSEM; FEI ESEM Quanta 400 FEG, Eindhoven, the Netherlands) coupled with energy-dispersive X-ray spectroscopy (EDX; EDAX Phoenix, EDAX, Tilburg, the Netherlands; Oxford X-Max 150, Oxford Instruments, Abingdon, United Kingdom). The samples were examined in the high vacuum mode of the instrument (∼ 5 × 10⁻⁶ Pa chamber pressure) without any pre-treatment. Prior to automated analysis, samples were checked for possible surface defects and particle coverage patterns. Areas with surface defects (for example, bubbles in the substrate) and overloaded samples were excluded from further data processing. Sample analysis was automated by the software-controlled electron microscope (Oxford Aztec 4.4). Automated particle segmentation from the background was performed based on the backscatter electron signal. An acceleration voltage of 12.5 kV, beam current of 18 nA, spot size of 5 (beam diameter of ∼ 3 nm), and a working distance of approximately 10 mm were used to produce the optimum number of input counts in the EDX detector. The scanning resolution was tuned to the particle size. For the FPS, 160 nm per pixel were used to identify particles up to 0.5 µm (equivalent projected-area diameter), and for the FWI, 360 nm per pixel was used to identify the largest particles (mainly particles larger than 2.5 µm). The X-ray signal was collected for each particle for a duration of 15 to 20 s (EDAX) and 2 s (Oxford), resulting in a total of 40 000 to 100 000 counts. During this time, the beam scanned over the particle's cross-sectional area. Chemistry information is derived by EDX. The internal ZAF correction (Z – atomic number, A – absorption, F – fluorescence; accounting for material-dependent efficiencies) of the detector/software system – based on inter-peak background radiation absorption measurements for correction – was used for obtaining quantitative results.
In numerous places in the present work, relative elemental concentrations and ratios thereof are reported by the corresponding element symbols. These concentrations always refer to atomic percentage (at. %; not weight percentage, wt %).
2.3.2 Aspect ratio
The two-dimensional (2D) shape of individual dust particles is presented here as the aspect ratio (AR) and was calculated by the image analysis integrated into the SEM/EDX software AZtec. The AZtec software manual defines AR as the ratio of the major to the minor axis of the elliptical fit on the projected particle area such that features with shapes similar to spheres have an AR that is approximately 1, whereas ovals or needles have an AR that is greater than 1. A caveat of 2D imaging is that it can yield different shapes of 3D particles depending on their orientation on the sampling substrate (Huang et al., 2020).
2.3.3 Projected-area and volume-equivalent diameters
In this study, the image analysis integrated into the SEM/EDX software AZtec is used to determine the size of particles in terms of the projected-area diameter. The projected-area diameter (dp) is the diameter of a circle having the same area as the dust particle projected in a two-dimensional image and is calculated as
in which A is the area covered by the particle on the sample substrate.
Following Ott and Peters (2008), the volume-equivalent diameter (sphere with the same volume as an irregularly shaped particle), also called the geometric diameter (dv), is estimated from the projected-area diameter via a volumetric shape factor expressed by the particle projected area and perimeter (P) as follows:
In the literature there are several definitions for “fine”, “coarse”, “super-coarse”, and “giant” aerosol particles. In this paper we use the size terminology defined in terms of the volume-equivalent (geometric) diameter (D) as described in Adebiyi et al. (2023) for fine dust (D < 2.5 µm), coarse dust (2.5 ≤ D < 10 µm), super-coarse dust (10 ≤ D < 62.5 µm), and giant dust (D > 62.5 µm). Furthermore, all particle diameters presented here are converted from the equivalent projected-area diameter to the volume-equivalent (geometric) diameter (unless stated otherwise). The reason for this conversion is that geometric diameter is used in global aerosol models to quantify dust size (Mahowald et al., 2014).
The particle volume was then computed as
2.4 Mineral identification
The mineralogical identification in this study is based on the elemental composition of each individual particle. Previous studies have used SEM/EDX analysis to semi-quantitatively identify the mineralogical composition of individual dust particles (Kandler et al., 2007; Scheuvens et al., 2011; Kandler et al., 2020; Panta et al., 2023). Although SEM/EDX detects the elemental composition of particles, this alone is not enough to accurately identify their mineral phase. However, since the elemental composition of many common minerals is known, the elemental ratio provided by EDX can be used as an approach for the mineralogical identification of the aerosol particles, as long as each particle is assumed to be composed of a single mineral type. There are some minerals (e.g., quartz, sea salt) that can be identified more reliably, while others are generally indistinguishable (e.g., gypsum/anhydrite, hematite/magnetite) and some may contain ambiguous compositions and therefore are prone to a potential classification error (e.g., micas, smectites) using SEM/EDX. Additionally, although individual particles are typically chosen for EDX analysis, some mixtures may be present and could lead to discrepancies between EDX results and the true mineral composition.
Based on the single-particle composition quantification, an elemental index () for the element X is defined as the atomic ratio of the concentration of the element considered and the sum of the concentrations of the element quantified (Kandler et al., 2007, 2018):
where the element symbols represent the relative contribution in at. % measured for each particle. The chemical composition of each particle, including the major elements F, Na, Mg, Al, Si, P, S, Cl, K, Ca, Ti, V, Cr, Mn, Fe, Zn, and Pb, was determined using EDX and is reported as normalized atomic percentages. Since the substrate is composed of carbon, the element C was excluded from the quantification. N and O were disregarded as well due to their high measurement error.
3.1 Particle type characterization and their relative abundances
Chemical compositions of more than 128 000 particles were measured from the samples collected at Dyngjusandur. Additionally 62 400 particles were analyzed from surrounding locations. Based on the chemical composition derived from EDX, the particles were classified into different particle groups. The full classification can be found in Sect. S3 in the Supplement.
The classification scheme is primarily based on our previous work (Kandler et al., 2007, 2018; Panta et al., 2023). However, as the geology of Iceland is different than that of low- and mid-latitude dust sources, other mineralogical particle groups are required, and, therefore, new boundary conditions were developed. Dyngjusandur is mainly characterized by basaltic volcanic glasses formed below the Vatnajökull glacier during subglacial eruptions with pyroxene, olivine, and plagioclase as other significant phases (Baratoux et al., 2011). Dust resuspension of surface sediment samples from five major Icelandic dust hotspots including Dyngjusandur also showed amorphous basaltic materials were dominant with around 70 wt % observed for the Dyngjusandur sample (Baldo et al., 2020). In the following, the major particle groups found are described.
3.1.1 Medium-Al mixed silicates
The most frequent particles in Dyngjusandur are classified as medium-Al mixed-silicate (MAS) particles based on our elemental classification scheme. The name is chosen to be generic and descriptive, as they most probably do not represent a mineral but instead a glassy substance. Figure 2 presents the size-resolved average elemental composition and a 2D histogram of MAS particles. It is characterized by the presence of elements such as Si, Al, Fe, Ca, Mg, and Na in EDX spectra with ratios of Al Si of 0.34 ± 0.04 (mean ± standard deviation), Ca Si of 0.21 ± 0.05, and Mg Si of 0.17 ± 0.05. The Fe Si ratio is slightly higher in the fine mode (0.28 ± 0.07) and decreases in the coarse (0.22 ± 0.05) and super-coarse (0.20 ± 0.05) mode. In addition, Si, Al, Ca, and Mg exhibit consistent trends across the size range, whereas Fe decreases and Na increases as size increases.
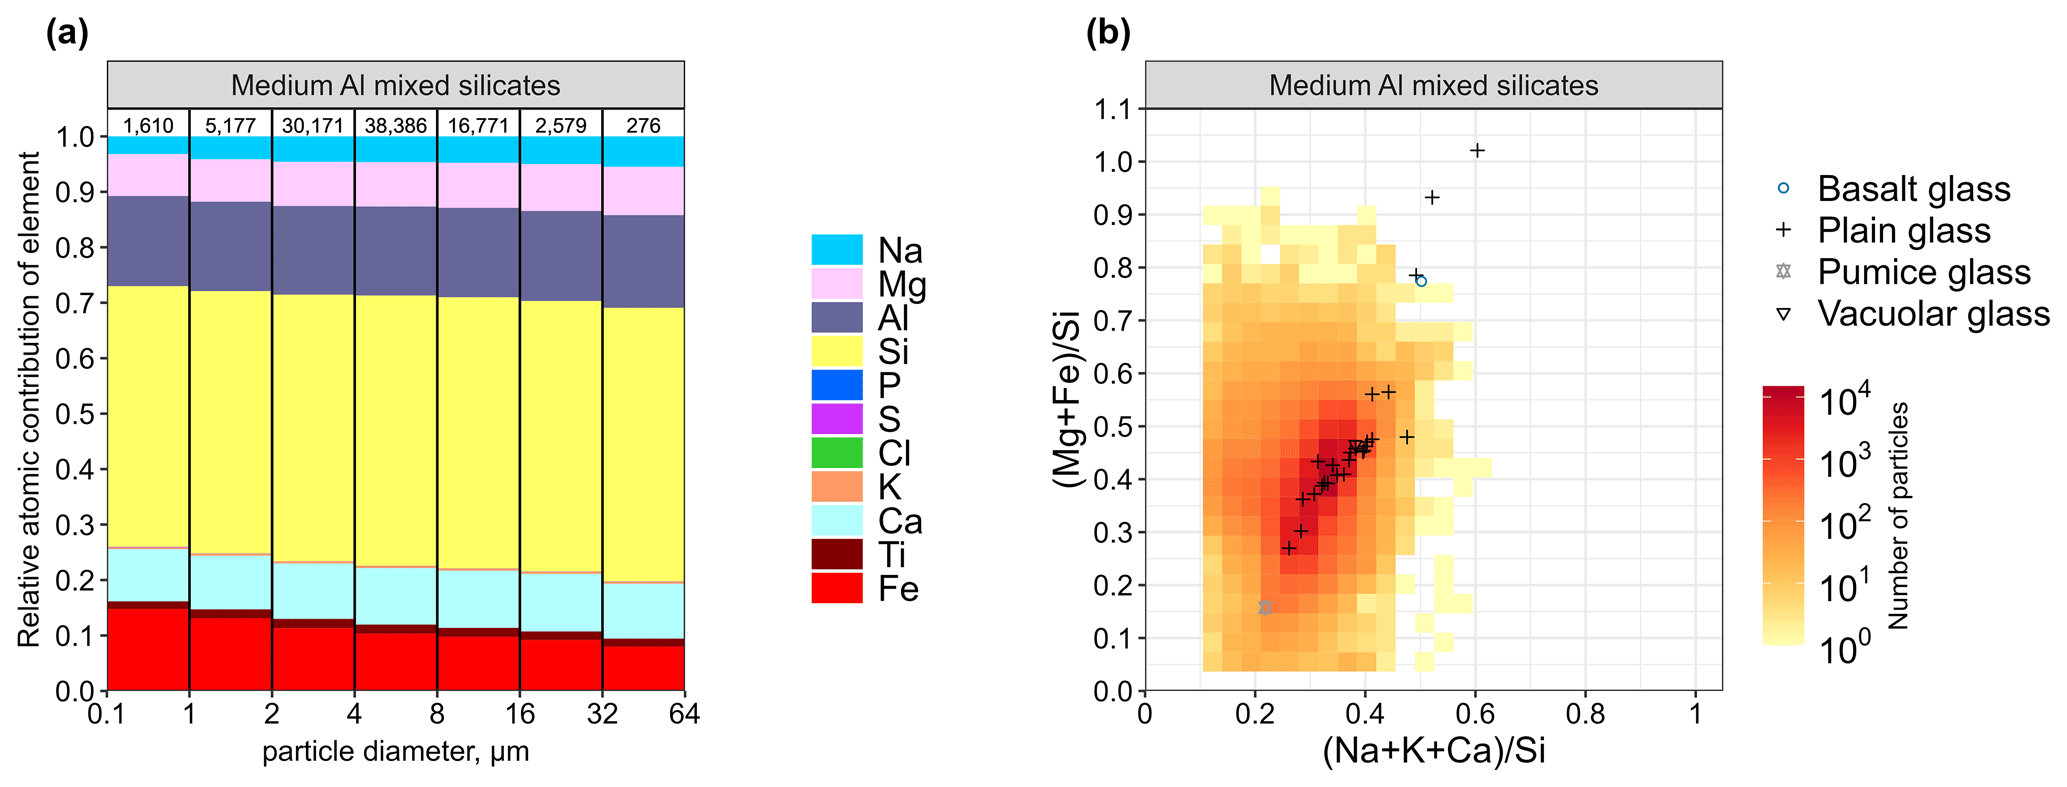
Figure 2(a) Average elemental composition (atomic fraction) as a function of particle size for the medium-Al mixed-silicate (MAS) particles at Dyngjusandur from deposition plate and free-wing impactor samples. The numbers on top represent total particle counts in the given size bin. (b) Two-dimensional histogram with respect to element atomic concentration ratios for MAS particles. Colors indicate particle count density. Symbols show classification of glass particles identified manually by composition and morphology.
As using chemistry alone is not sufficient to classify particles into glass, additional analysis was performed. A select number of particles was manually analyzed using SEM and classified as glass. Figure 2b shows the derived elemental ratios for these glass particles (with each dot representing one particle) together with the two-dimensional histogram for the particles classified as MAS particles using ccSEM. For illustration, images and elemental mappings of the MAS particles are given in the Supplement (Sects. S8 and S9). The glassy structure becomes clearly visible from the river line fractures and the smooth surfaces. In some cases, a pumice structure is recognizable. While small variations in composition are detected, in general this group is homogeneous with respect to composition.
Furthermore, X-ray diffraction (XRD) analysis was performed on the surface sediments (González-Romero et al., 2024b). The XRD analysis revealed that a significant component (79 ± 11 wt%) of the sediment consists of an amorphous phase, most probably volcanic glass and its nano-sized weathering product (hydrated amorphous Si-bearing). This observation aligns with the anticipated composition, given the predominantly basaltic nature of the magma coming from the Grímsvötn volcanic systems, which serve as the primary source for the Dyngjusandur dust hotspot (Vogel et al., 2017).
Considering the XRD analysis results, which indicate the presence of amorphous basaltic material (volcanic glass) in the Icelandic sediments, it can be inferred that the particles classified as MAS are likely to be glassy particles based on the elemental ratios derived from the manual SEM analysis and the composition of the parent sediment.
3.1.2 Pyroxene- amphibole-like
Pyroxenes are rock-forming inosilicate minerals and have the general formula XY(Si,Al)2O6, where X and Y are most commonly sodium, magnesium, calcium, or iron. Pyroxene minerals usually have volcanic origin and are typically not present in low-latitude mineral dust. Previous studies have reported pyroxene (augite) to be the dominant mineral phases present in Dyngjusandur (Baratoux et al., 2011; Baldo et al., 2020). These particles can potentially act as an ice-nucleating particle as recent work with volcanic tephra samples (volcanic ash) indicates that some pyroxene phases can onset freezing at temperatures near −10 °C (Maters et al., 2019).
3.1.3 Interm.-plag.-like
The interm.-plag.-like (intermediate-plagioclase-like) class consists of particles whose compositions fall between those of pyroxene and plagioclase. This intermediate composition reflects a balance between calcium and sodium. Like pyroxene, plagioclase minerals are of volcanic origin and are typically absent in mineral dust from low-latitude regions. Studies of sediment mineralogy as well as mineral dust from Dyngjusandur have identified the presence of plagioclase (González-Romero et al., 2024b; Moroni et al., 2018; Baratoux et al., 2011).
3.1.4 Silicate mixtures
The groups “other silicates”, “complex silicate (high Al)”, and “complex silicate (moderate Al–low alkali)” show no matches with the common mineral phases. Nevertheless, they form distinct point clusters. This indicates that they have a specific chemical composition depending on the group but cannot be assigned to any mineral phase. Their position between compositions of mineral phases indicates that the particles are structurally still in the process of fractionation from the igneous melt glass.
3.1.5 Iron-rich particles
Iron-rich particles were characterized by the high relative fraction of Fe, with varying amounts of mainly Si, Ca, and Ti present, and can be divided into two main categories: (a) Fe-oxide- Fe-hydroxide-like and (b) titanomagnetite-like. These were also observed in previous studies of surface sediment samples from Dyngjusandur (Baldo et al., 2020). Hematite occurs mostly as a secondary product of weathering in soils (Deer et al., 2013). As the sediments from Dyngjusandur show a low degree of chemical weathering (Arnalds et al., 2016; Baldo et al., 2020), the Fe-oxide- Fe-hydroxide-like group is more likely to be magnetite-like than hematite-like. This was also observed in the sediment analysis of Dyngjusandur, where the average bulk Fe content is 9.5 ± 0.4 wt % (González-Romero et al., 2024b). Furthermore, with increasing particle size in the Fe-oxide- Fe-hydroxide group, the contribution of Fe is slightly reduced and some elements (mainly Ca) are enhanced, suggesting that these particles are increasingly internally mixed with other phases as particle size increases. The titanomagnetite-like group is characterized by a relatively high concentration of Ti in magnetite. Both of these particle types are observed mainly in diameters smaller than 4 µm and are generally mixtures of different minerals rather than a pure component.
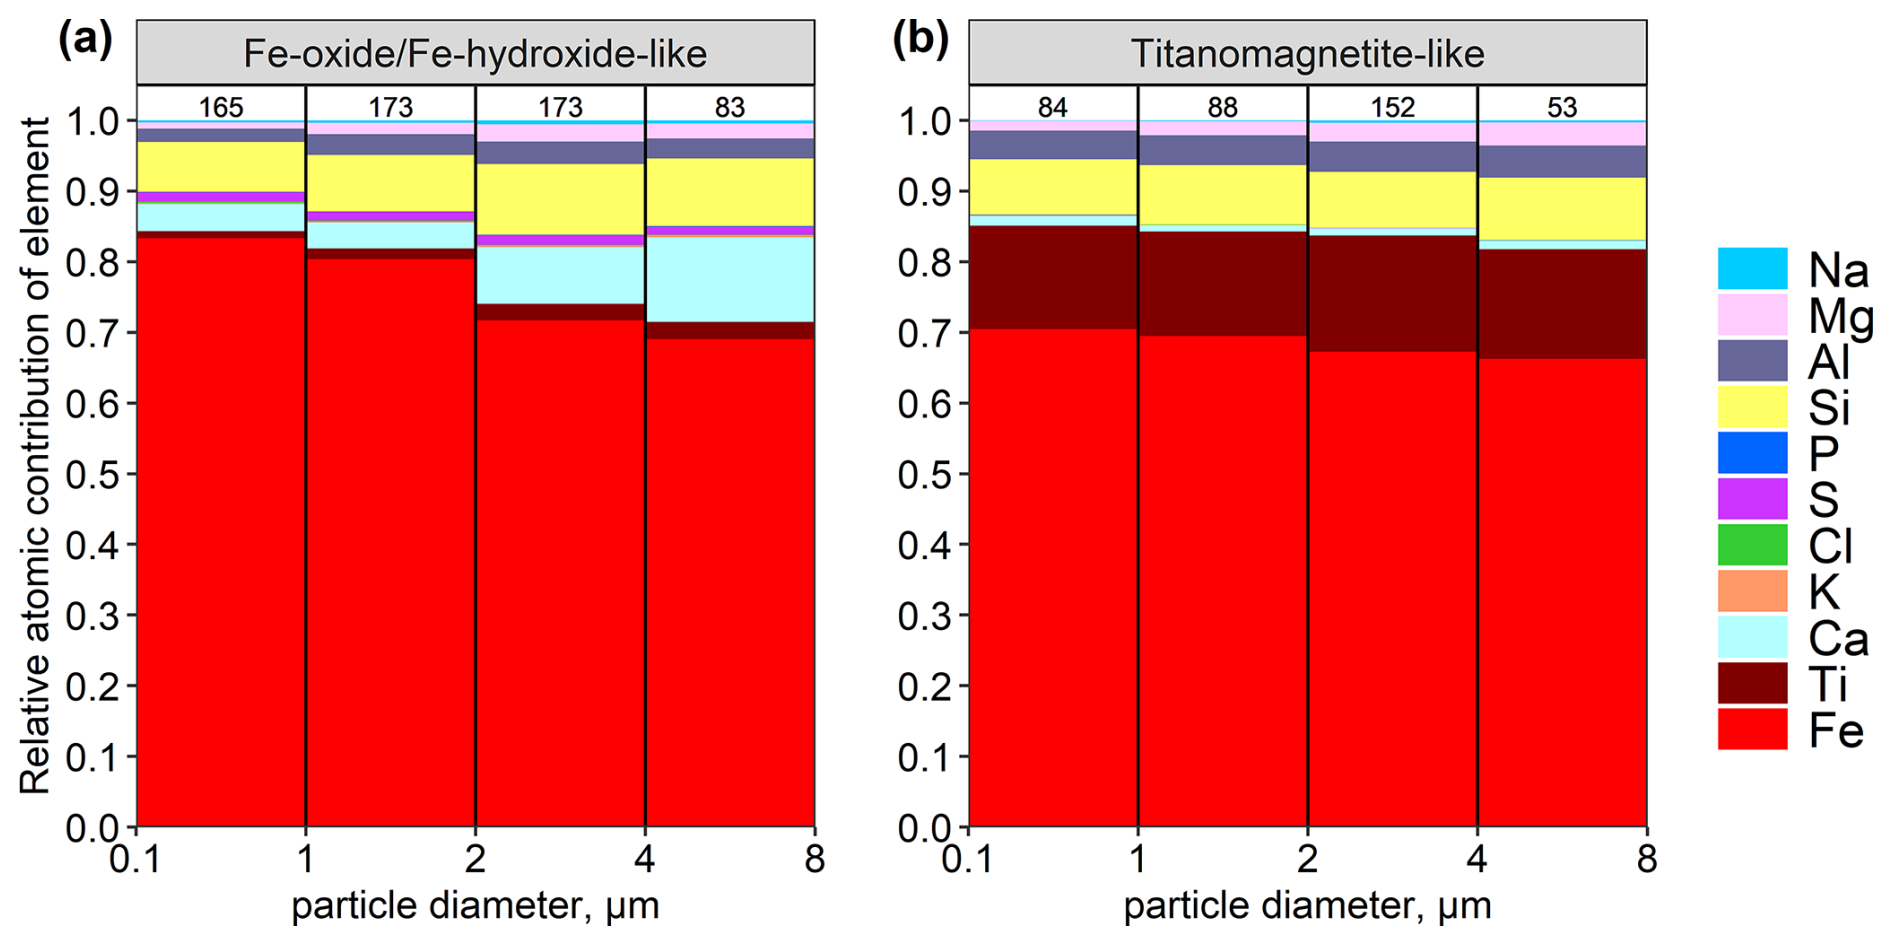
Figure 3Average elemental composition as a function of particle size for (a) Fe-oxide- Fe-hydroxide-like and (b) titanomagnetite-like. The legend shows the element index for each respective element. The numbers on top represent total particle counts in the given size bin.
3.1.6 Sulfate
Sulfate aerosol particles are produced in the atmosphere through the oxidation of sulfur dioxide emitted by various sources. Volcanic emissions are the primary natural source of sulfur dioxide (SO2) (Carn et al., 2017), accounting for about 25 % of the tropospheric sulfate aerosol burden (Lamotte et al., 2021). The emitted SO2 undergoes oxidation in the atmosphere to form gaseous sulfuric acid, which then converts to sulfate aerosol particles. Furthermore, some mineral dust particles (e.g., calcite) can transform into other particle types through heterogeneous reactions with SO2 (Li et al., 2014). The measurement period coincided with the basaltic eruption at Fagradalsfjall (March–September 2021) which released volcanic sulfur dioxide (SO2) (Esse et al., 2023). Sulfate particles typically appeared to be spherical (see Fig. S6), although some extreme aspect ratios were also observed due to the needle-like structure of these particles. Most of the sulfate observed falls into the group of ammonium-sulfate-like particles due to the lack of the common cations like Na, Mg, K or Ca, which is consistent with its formation by gas-to-particle conversion from the volcanic plume (Boulon et al., 2011).
3.2 Relative abundances of various types of particles
Figure 4 shows the relative volume abundance of the various particle types observed in the Dyngjusandur samples. During the measurement campaign, the composition of the aerosol particles in each sample did not exhibit a large sample-to-sample variability except for few sulfate intrusion events (see Fig. S1 and S2 for individual samples collected on a deposition plate and free wing, respectively). Therefore, for further comparison, all dust sample compositions are merged and separated by sulfate intrusion periods. This was done primarily because the collection efficiency by size is less relevant to the fractional contribution of each mineral type per size, and therefore integrating all the techniques together improves the statistics for each size with a higher number of particles analyzed.
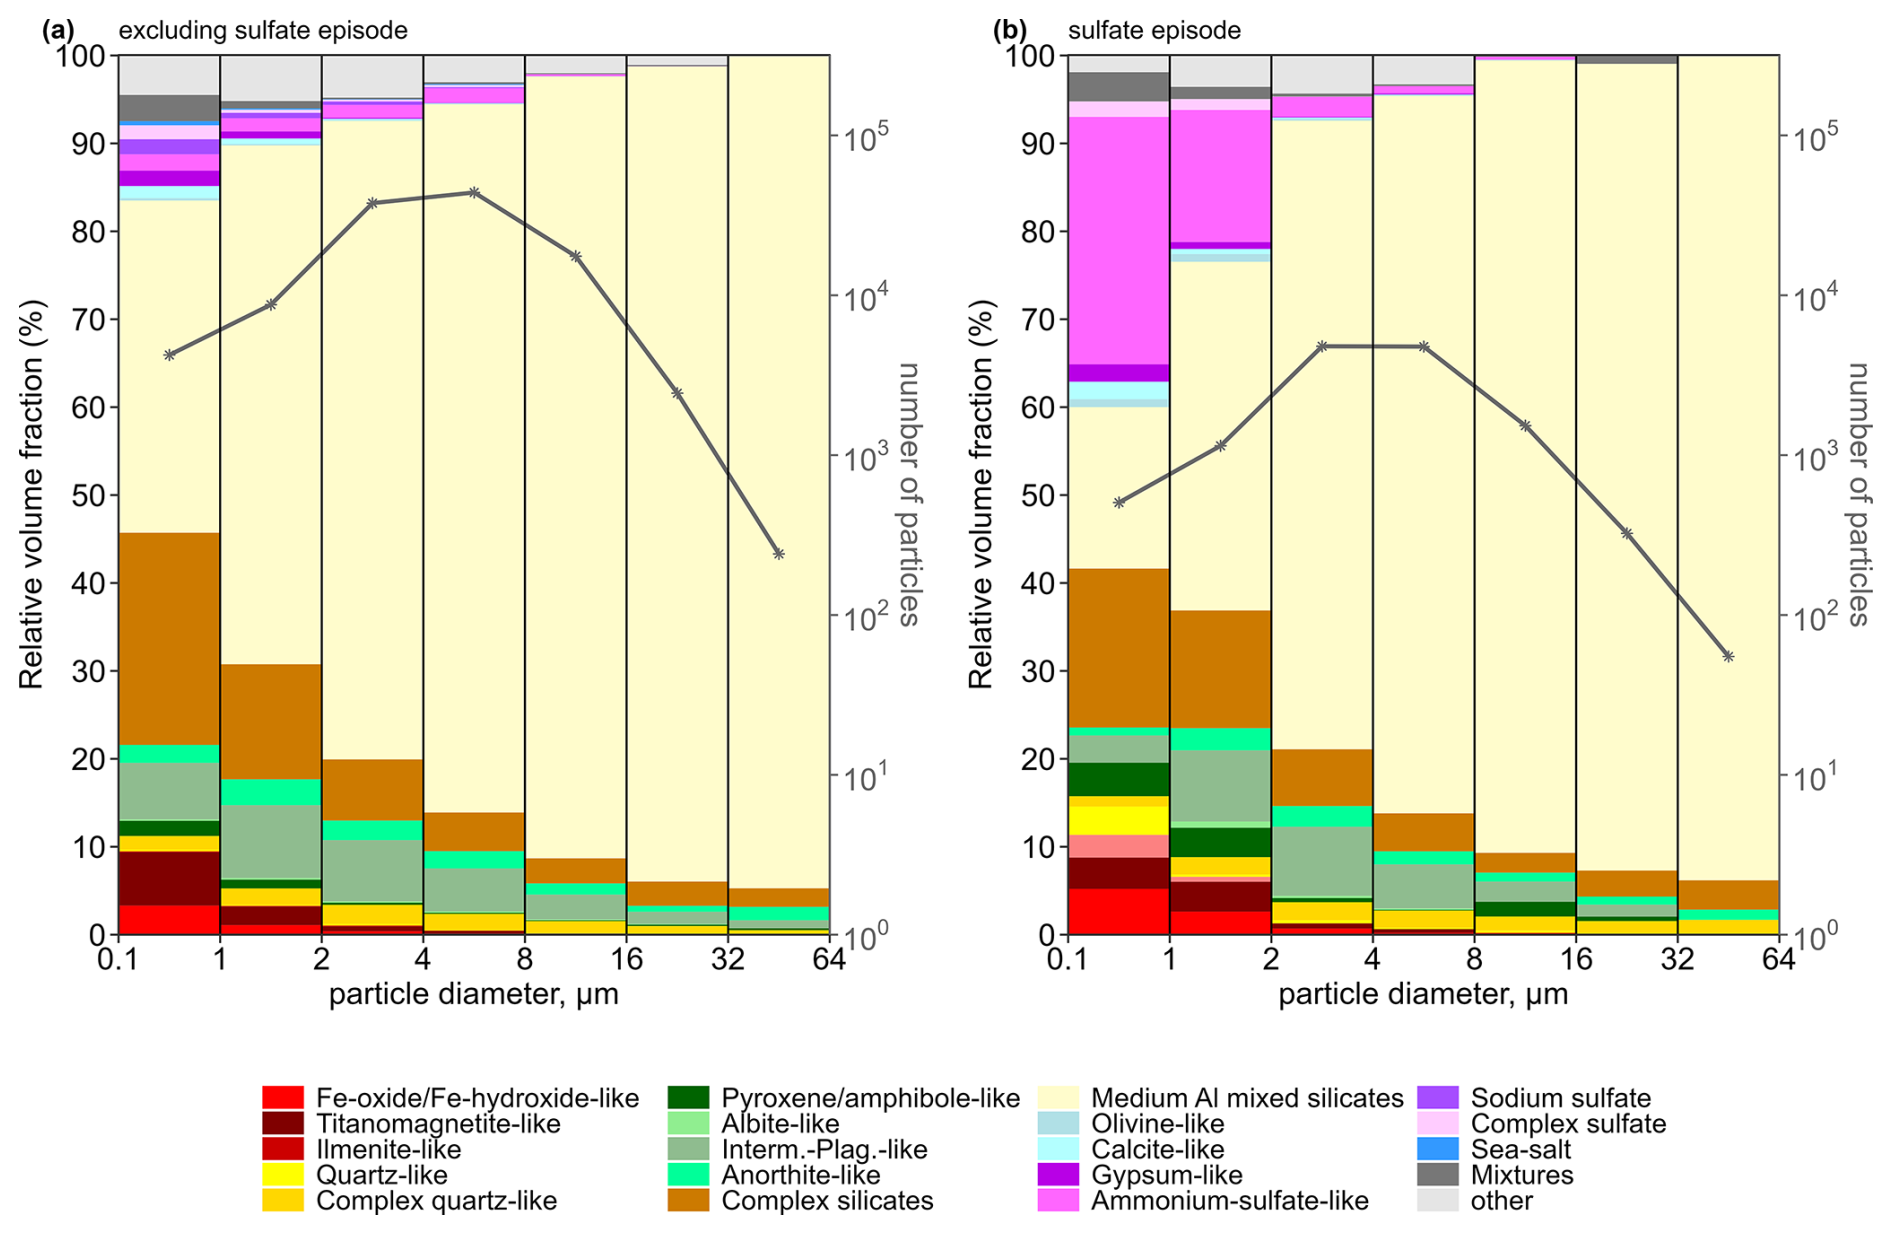
Figure 4Size-resolved relative volume fraction of different particle groups at Dyngjusandur, Iceland, in 2021. The curve shows the number of particles analyzed for each size bin. For simplification of display, several composition groups have been combined in this plot. “Complex silicates” consist of the following groups: complex silicate (high Al), complex silicate (moderate Al–low alkali), Al-rich clay mineral, other silicate, and Ca-rich silicate Ca–Si mixture. “Mixtures” comprise the following groups: sea-salt silicate mixture, aged-sea-salt silicate mixture, sodium sulfate silicate mixture, sulfate silicate mixture, and complex mixture. For details on the classification scheme, refer to Supplement Sect. S3.
Excluding the sulfate episodic samples, in the 0.1–1 µm size, the dominant particle class are, by volume, MAS particles (38 %) and complex silicate (24 %) followed by interm-plag.-like (6 %), titanomagnetite-like (4 %), and Fe-oxide- Fe-hydroxide-like (3 %) occurring mostly in this size interval. In addition, trace amounts of salt and sulfate mixtures were also observed. In the 1–2 µm size, the relative volume fractions of MAS, complex silicate, and interm-plag.-like are 59 %, 13 %, and 8 %, respectively, with Fe-oxide- Fe-hydroxide-like at 1 %. In general, MAS is a major composition present in all size ranges and displays an increasing contribution with particle size, while Fe-rich particle contributions are mostly limited to diameters below 2 µm. A decrease in the relative volume fraction is also observed for titanomagnetite-like particles (1.5 %) in this size range. From particle diameters between 2 and 8 µm 72 %–80 % of the particles fall under MAS particles, with interm-plag.-like and complex silicates being the other two main particle types at around 6 % and 5 %, respectively. The contribution of Fe-rich particles is < 0.5 %, while that of titanomagnetite-like particles is < 0.4 %. Finally, for particle sizes greater than 8 µm, more than 90 % of the particles are MAS particles, with Fe-rich and titanomagnetite-like particles being virtually absent.
The major compositional variability between sampling days is due to the presence of sulfate particles. Especially the number abundance of the ammonium-sulfate-like particles exhibits large differences. Ammonium sulfate particles are present in a significant proportion during the periods 16 to 21 August, as well as on 2, 3, and 5 September mainly in particles with dv< 4 µm. On other days, they are almost absent or occur in minor amounts. As all of the collected particles are freshly emitted and of local origin, the observation of a high content of ammonium sulfate particles in a few of the samples highlights the influence of volcanic emission in aerosol load as sulfur is a notable indicator of volcanic emission (Carn et al., 2009).
3.3 Iron distribution in Icelandic dust
Icelandic dust is rich in iron (Fe) (Arnalds et al., 2014), which is a key mineral affecting climatic, environmental, and biological processes (Schulz et al., 2012). Fe in Icelandic volcanic rocks (andesite and basalts) varies between 6.5 and 12.5 wt % (Jakobsson et al., 2008). For Dyngjusandur, the reported Fe content is ∼ 10 wt %, consisting primarily of volcanic glass (Baratoux et al., 2011; Baldo et al., 2020). Fe in Icelandic dust can be broadly classified into structural Fe (typically contained in pyroxene and amorphous glass) and Fe oxide-hydroxide (derived via sequential extractions), mainly magnetite (Baldo et al., 2020). Furthermore, the majority of the Fe content in Icelandic dust is attributed to structural Fe found in volcanic glass and certain iron-bearing crystalline species (González-Romero et al., 2024b). This structural Fe accounts for approximately 80 % of the total Fe content, with magnetite comprising a smaller proportion, and even less hematite and goethite (González-Romero et al., 2024b). While SEM alone cannot differentiate between free and structural Fe, by providing the total Fe content on a particle-by-particle basis, it provides a detailed Fe size distribution and some useful clues on the mixing state of Fe oxide-hydroxides.
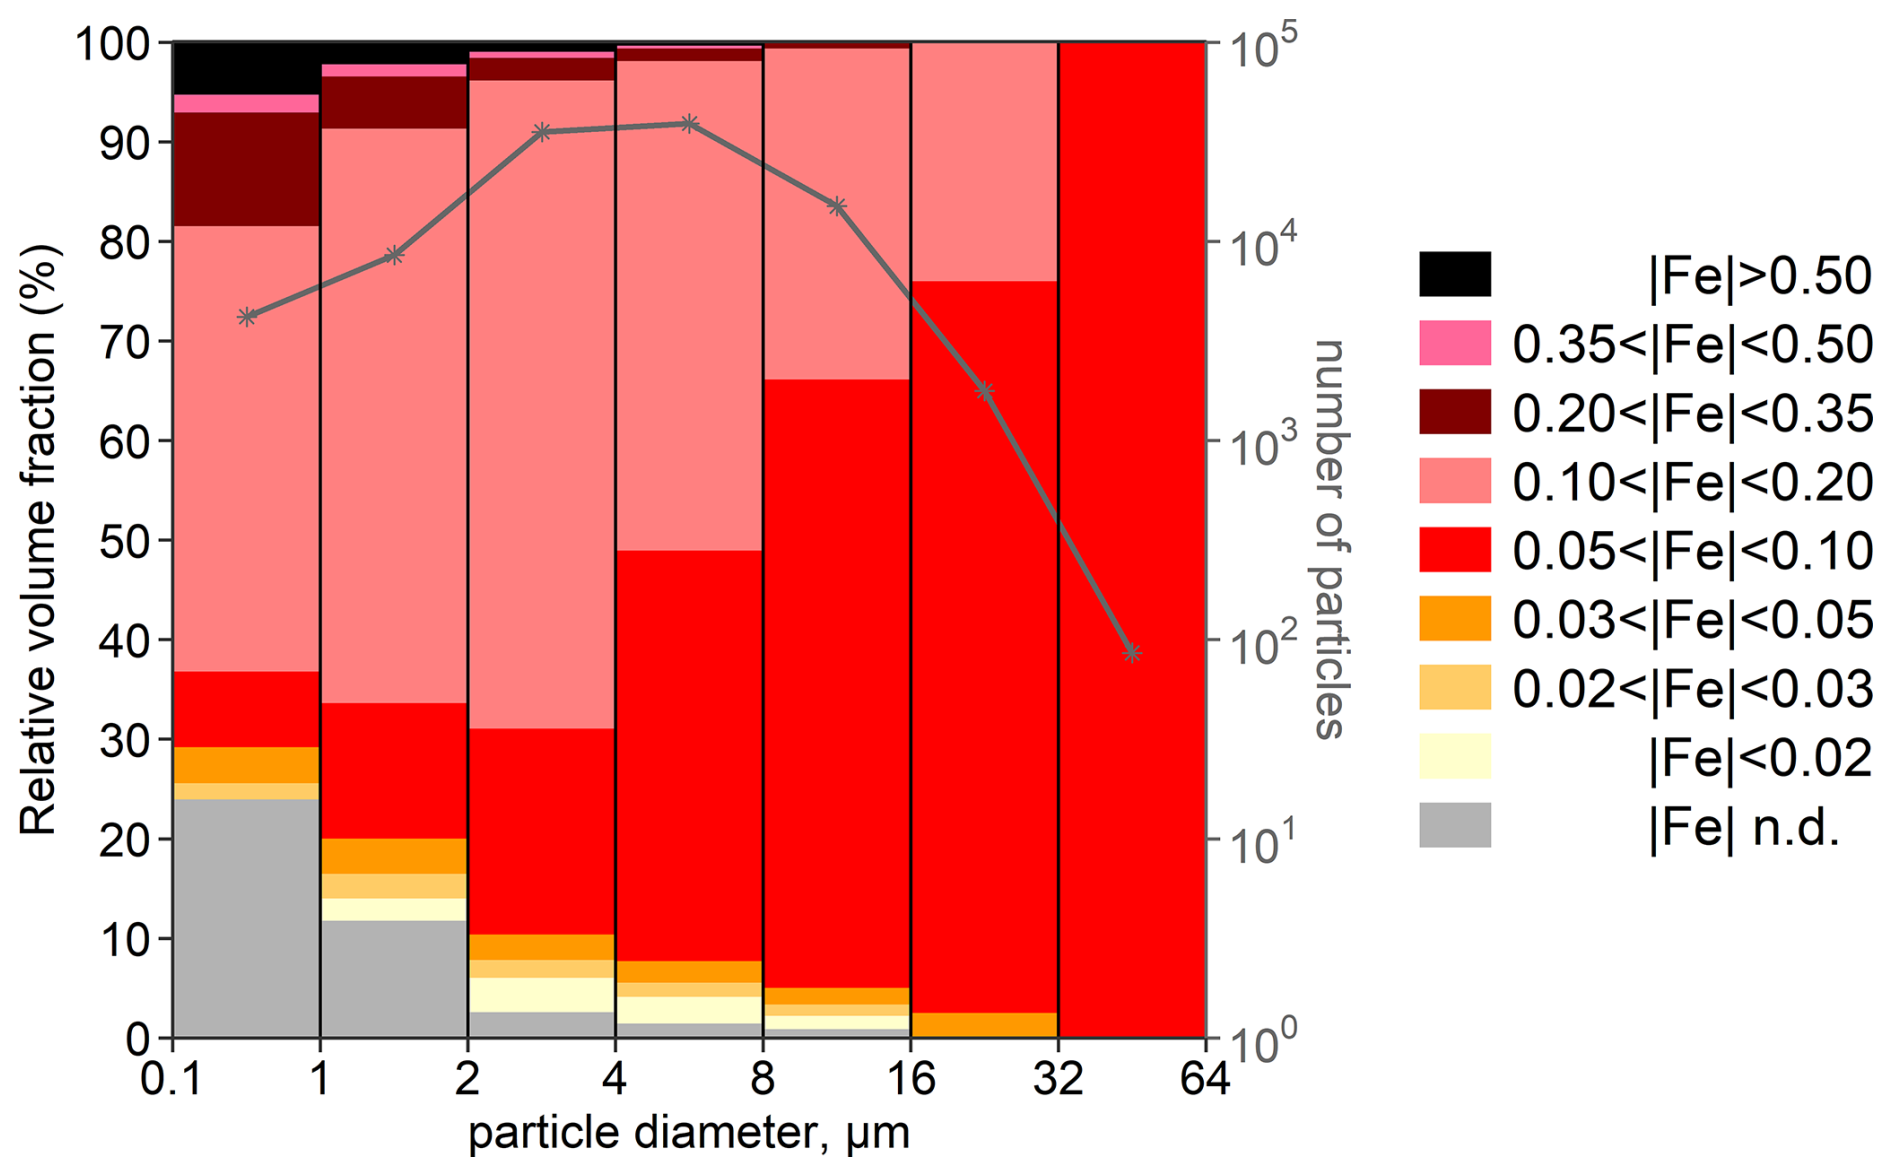
Figure 5Size-resolved iron indices for silicate particles. “n.d.” means Fe not detected. The curve shows the number of particles analyzed for each size bin.
To quantitatively evaluate the Fe distribution for a large number of particles, Fig. 5 shows the size-resolved abundance of “silicate” particles classified by their Fe content (ratio of Fe atomic concentration to all other major elements except H, C, N, and O) in Dyngjusandur. Here “non-silicates” are mainly sulfate- (apart from gypsum) and sea-salt-like compositions which are excluded. Four main particle types can be distinguished in the plot: (a) particles with high Fe content (|Fe| > 0.5), (b) particles with intermediate Fe content (0.1 < |Fe| < 0.5), (c) particles with low Fe content (|Fe| < 0.1), and (d) particles without detectable Fe. High Fe content is mainly associated with particles of diameters less than 1 µm. In general, most particles have Fe content between 0.05 and 0.2, which implies that Fe is either embedded in the lattice structure of the particle itself or present as small Fe (hydr)oxide accretions. Supplement Sect. S9 (g) shows an example of a Fe-rich grain attached to a MAS particle, and Supplement Sect. S9 (c) shows a Fe–Ti grain. This is also corroborated by the detailed study on the Fe mode of occurrence in sediments of Dyngjusandur in González-Romero et al. (2024b). Fe is found in glass particles in different forms and proportions. It occurs primarily within glass and other silicate structures. Additionally, iron can be present as exsolutions within glass particles, resulting in the formation of magnetite, hematite, and goethite as well as nano-sized Fe oxides that are relatively more bio-accessible (González-Romero et al., 2024b).
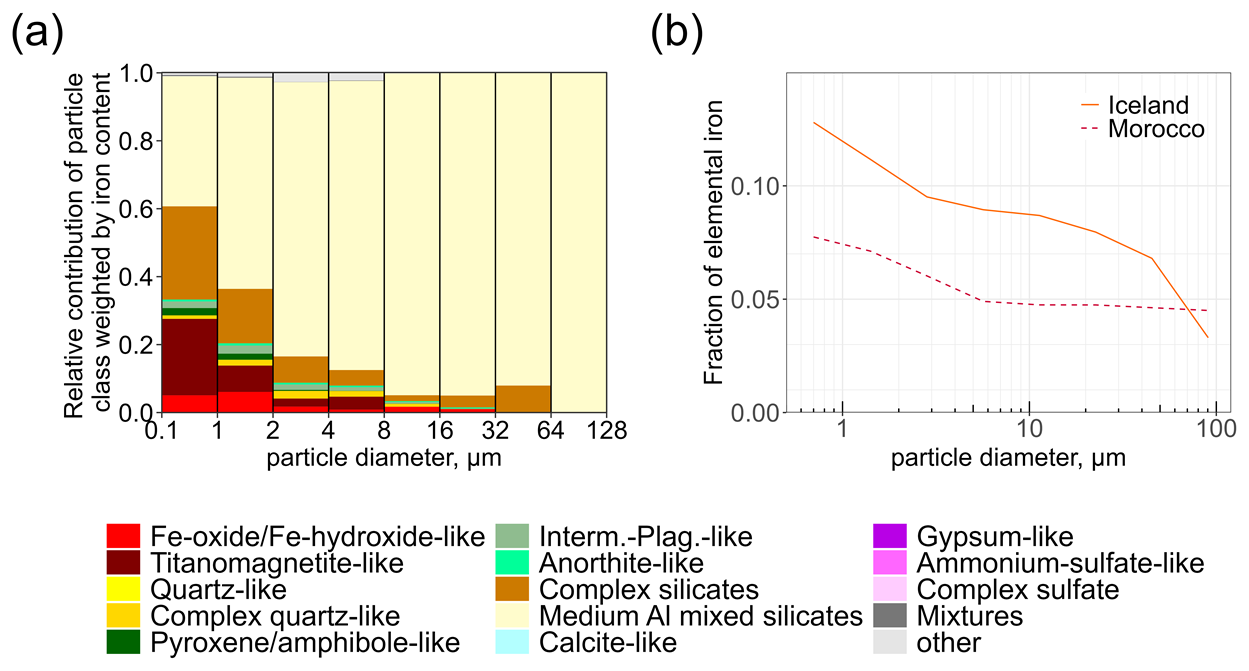
Figure 6(a) Relative contribution of each particle class weighted by their iron content. “Complex silicates” consist of the following groups: complex silicate (high Al), complex silicate (moderate Al–low alkali), Al-rich clay mineral, other silicate, and Ca-rich silicate Ca–Si mixture. “Mixtures” comprise the following groups: sea-salt silicate mixture, aged-sea-salt silicate mixture, sodium sulfate silicate mixture, sulfate silicate mixture, and complex mixture. For details on the classification scheme, refer to Supplement Sect. S3. (b) Fraction of elemental iron by mass with respect to all the other elements. For comparison, the iron fraction from Saharan dust is also shown from Panta et al. (2023).
Figure 6a shows the relative contribution of each particle type to Fe in every particle class. A notable contrast is evident when compared to the particle type fractions depicted in Fig. 4. Specifically, the Fe-oxide- Fe-hydroxide-like and titanomagnetite-like particles exhibit an increased proportion due to their higher Fe content, while the fractions of sulfates, quartz, and other particle types significantly diminish, owing their lack of Fe. The Fe contribution from MAS particles follows a trend similar to that observed in its size-resolved composition, indicating that these primarily glassy particles contain a substantial amount of Fe. Figure 6b provides a comparison of the mass fraction of elemental Fe as a function of particle size between Icelandic and Moroccan dust. Notably, Icelandic dust exhibits a higher total Fe content and a more pronounced decrease in Fe content with increasing particle size compared to Moroccan dust (Panta et al., 2023). Specifically, the Fe content in Icelandic dust starts at around 13 % for particles below 1 µm and gradually decreases to less than 5 % for the largest particles. In contrast, Moroccan dust displays a less pronounced reduction in Fe content with particle size, starting from approximately 8 % for particles below 1 µm to around 4 %–5 % for particles larger than 5 µm. The gradual decrease in Fe content in Moroccan dust above 5 µm can be partly attributed to the presence of clay aggregates at large particle sizes. Conversely, Icelandic dust experiences a steep reduction in fractional elemental iron with increasing particle size by up to a factor of 2.
3.4 Particle shape
The size-resolved aspect ratio (AR) distribution, defined as the ratio of the major to minor axis of the elliptical fit, is shown in Fig. 7a and listed in Table 3. The results highlight an increase in AR with increasing particle size. The collected aerosol particles in this study had AR ranging from 1.03 to 19.65. However, the majority (∼ 99 %) of particles had AR < 3 (see also Fig. S3).
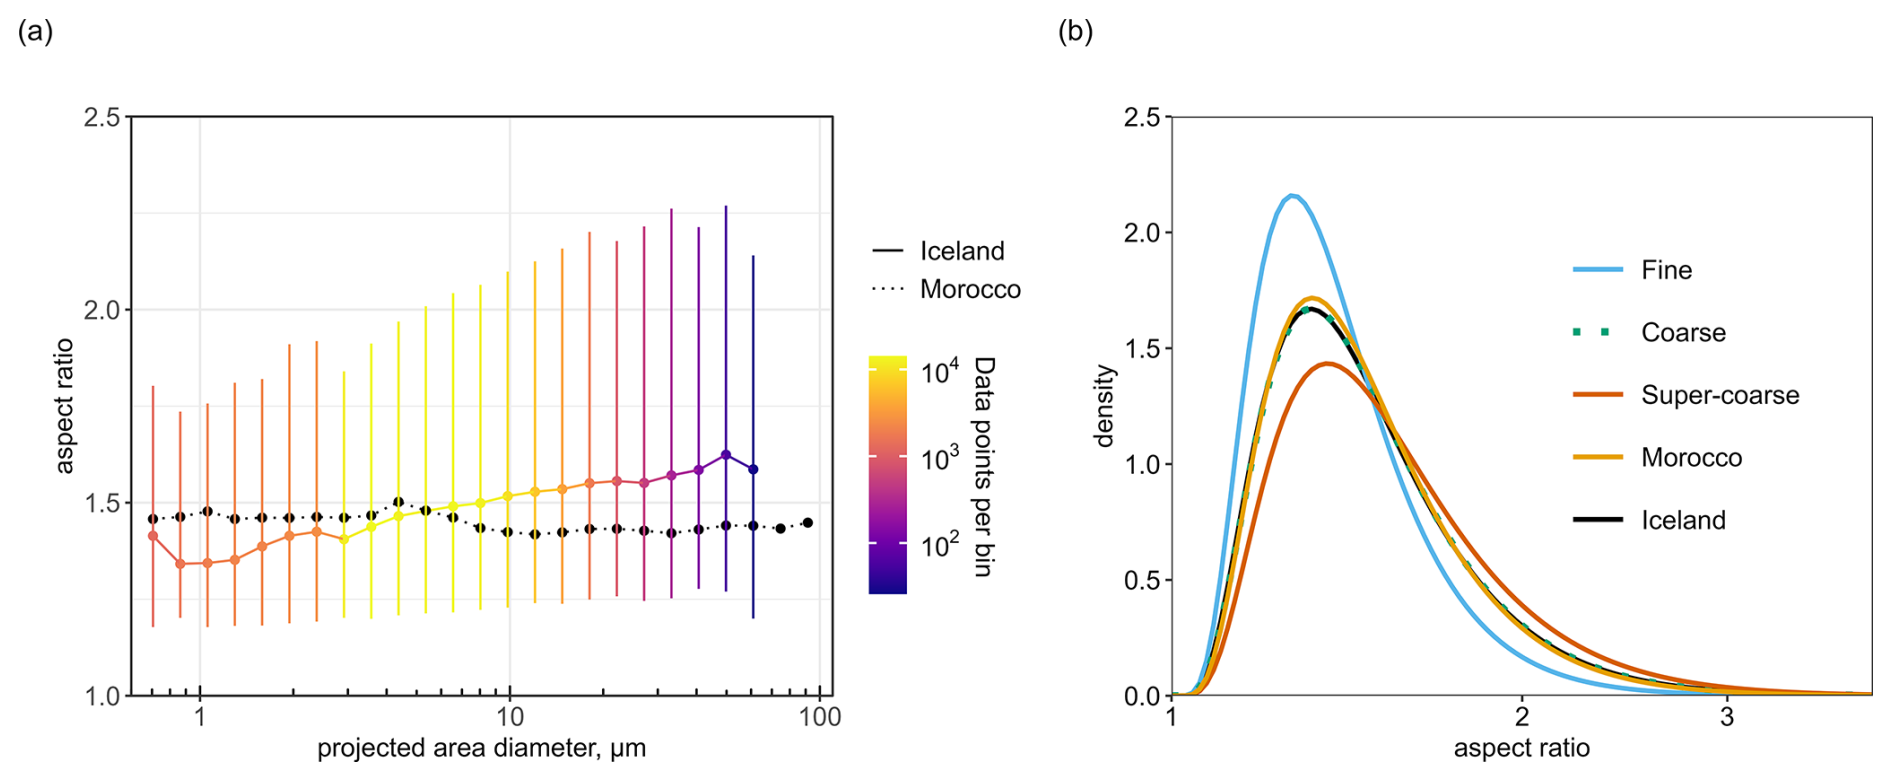
Figure 7(a) Size-resolved particle AR. The bar range represents the range between 0.1 and 0.9 quantiles, with the dot being the median, and the bins are color-coded by the number of data points within each bin. For comparison the median AR of freshly emitted Saharan dust (Panta et al., 2023) is shown by filled black dots. (b) Parameterized aspect ratio density distributions of Icelandic dust as well as the distribution of Moroccan dust (Panta et al., 2023). Furthermore, the density distribution of Icelandic dust classified as fine, coarse, and super-coarse is also shown (see Sect. 2.3.3 for definition).
Table 3Aspect ratio mean, median, and standard deviation (SD) for particle groups in the fine, coarse, and super-coarse dust mode. Values are not shown for size intervals with less than 40 particles.
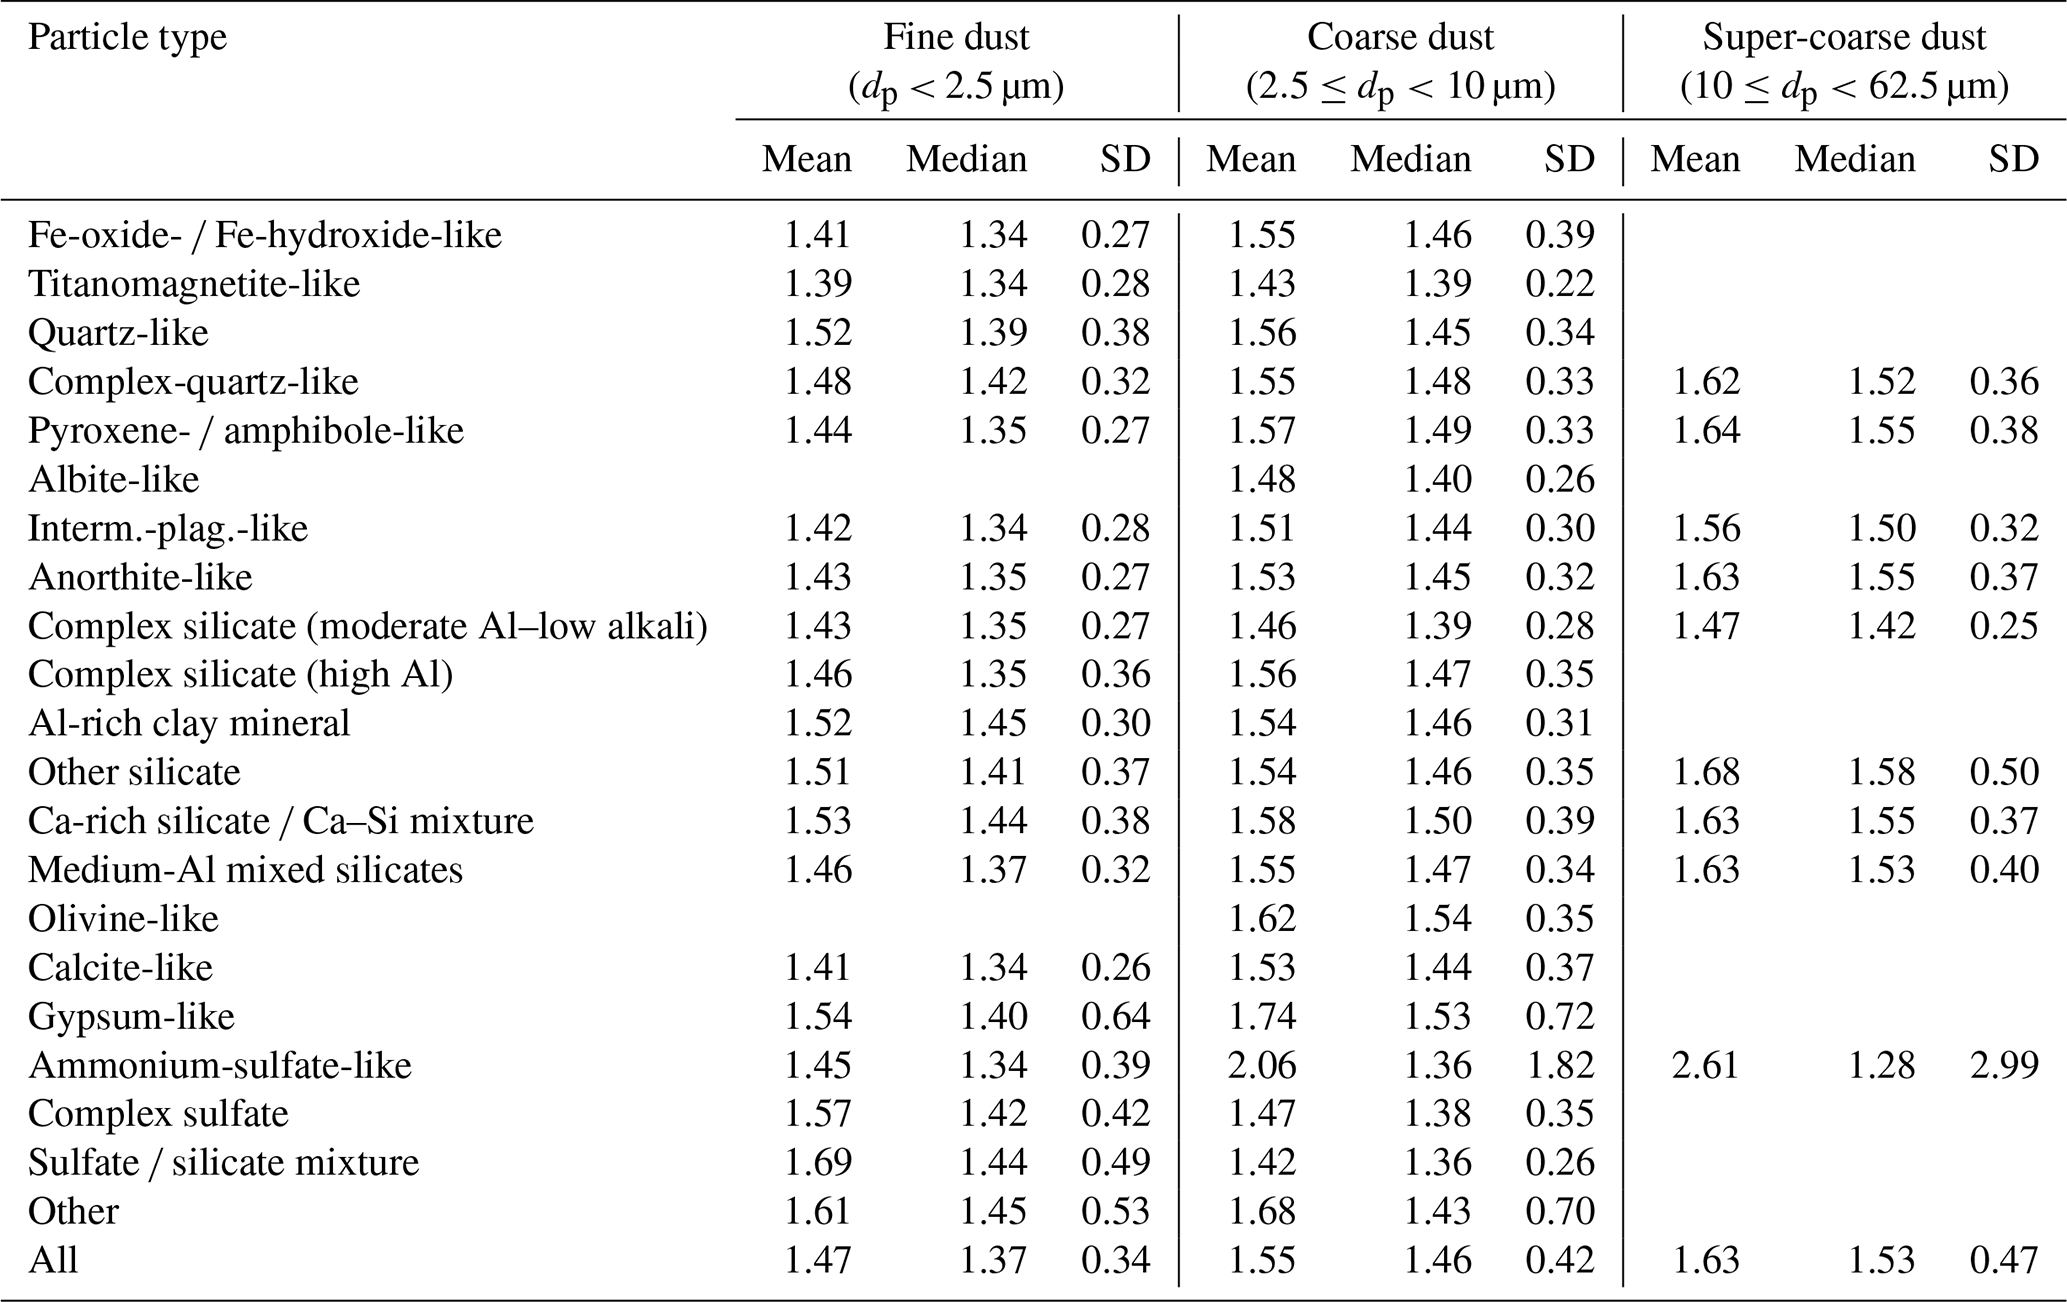
The AR values among different particle groups have a median ranging from 1.34 to 1.45 for fine dust, 1.36 to 1.50 for coarse dust, and 1.28 to 1.58 for super-coarse dust. Notably, ammonium-sulfate-like and gypsum-like particles had some extreme shapes as indicated by their high standard deviation in aspect ratio. The most abundant particle type, MAS, has median values ranging from 1.37 in fine dust to 1.53 in super-coarse dust. The size dependence of the median AR as well as its variability (0.1–0.9 quantiles) is shown in Fig. 7a. For comparison, the size-resolved median AR for Moroccan dust (Panta et al., 2023) is also shown. It can be seen that for Moroccan dust, the median AR is 1.46 and is relatively constant up to 5 µm and is only slightly lower for larger particles. However, for Icelandic dust the AR consistently increases with particle size. Note that the number of particles available in size bins greater than 60 µm is low, leading to high uncertainty.
The distribution of the AR of Icelandic dust can be described by a modified log-normal function (Kandler et al., 2007) with high accuracy:
where σ and μ are the distribution parameters. The AR distribution is shown in Fig. 7b for different size fractions. For comparison, the distribution of dust emitted from the Moroccan Sahara (Panta et al., 2023) is also shown. The variability in AR across different particle types is generally limited, except for ammonium-sulfate-like particles, which show a broader range of AR values – particularly in the coarse and super-coarse size fractions. This increased variability likely reflects the more irregular and diverse morphologies of these particles at larger sizes. Overall, AR tends to increase with particle size across all particle types, suggesting that size has a stronger influence on particle morphology than mineralogical composition. This size-dependent trend implies that larger particles, regardless of mineral type, are more likely to exhibit elongated or irregular shapes. The AR distribution is slightly narrower in the fine size range, with a median of 1.37, whereas the coarse and super-coarse ranges show broader distributions, with medians of 1.46 and 1.53, respectively. This broader AR spread at larger sizes is mainly driven by the high variability observed in MAS particles. Despite these differences, the overall shape of the AR distribution is relatively consistent with that observed in Morocco (Panta et al., 2023).
3.5 Composition at outflow regions
We placed flat-plate samplers at 4 different outflow regions to gain insights into the local/regional transport of dust aerosols and understand its diverse chemical compositions (Fig. 8). The designations HRS, MRS, SRS, and VFS are given to the different outflow regions, with DYS representing the main site where enhanced dust emission occurs; the sites are shown in Fig. 1. Sampling coordinates as well as sampling dates are summarized in Tables S1–S5. The average substrate exposure in the outflow regions was ∼ 48 h. Overall, the chemical composition of the collected aerosol particles in locations HRS, MRS, and SRS does not show significant variability and is relatively similar to the aerosol composition at the main site. Similar to the aerosol composition at the main site, we also see episodes of sulfate intrusions at HRS (17–21 August), MRS (17–19 August), SRS (17–21 August), and VFS (18–20 August).
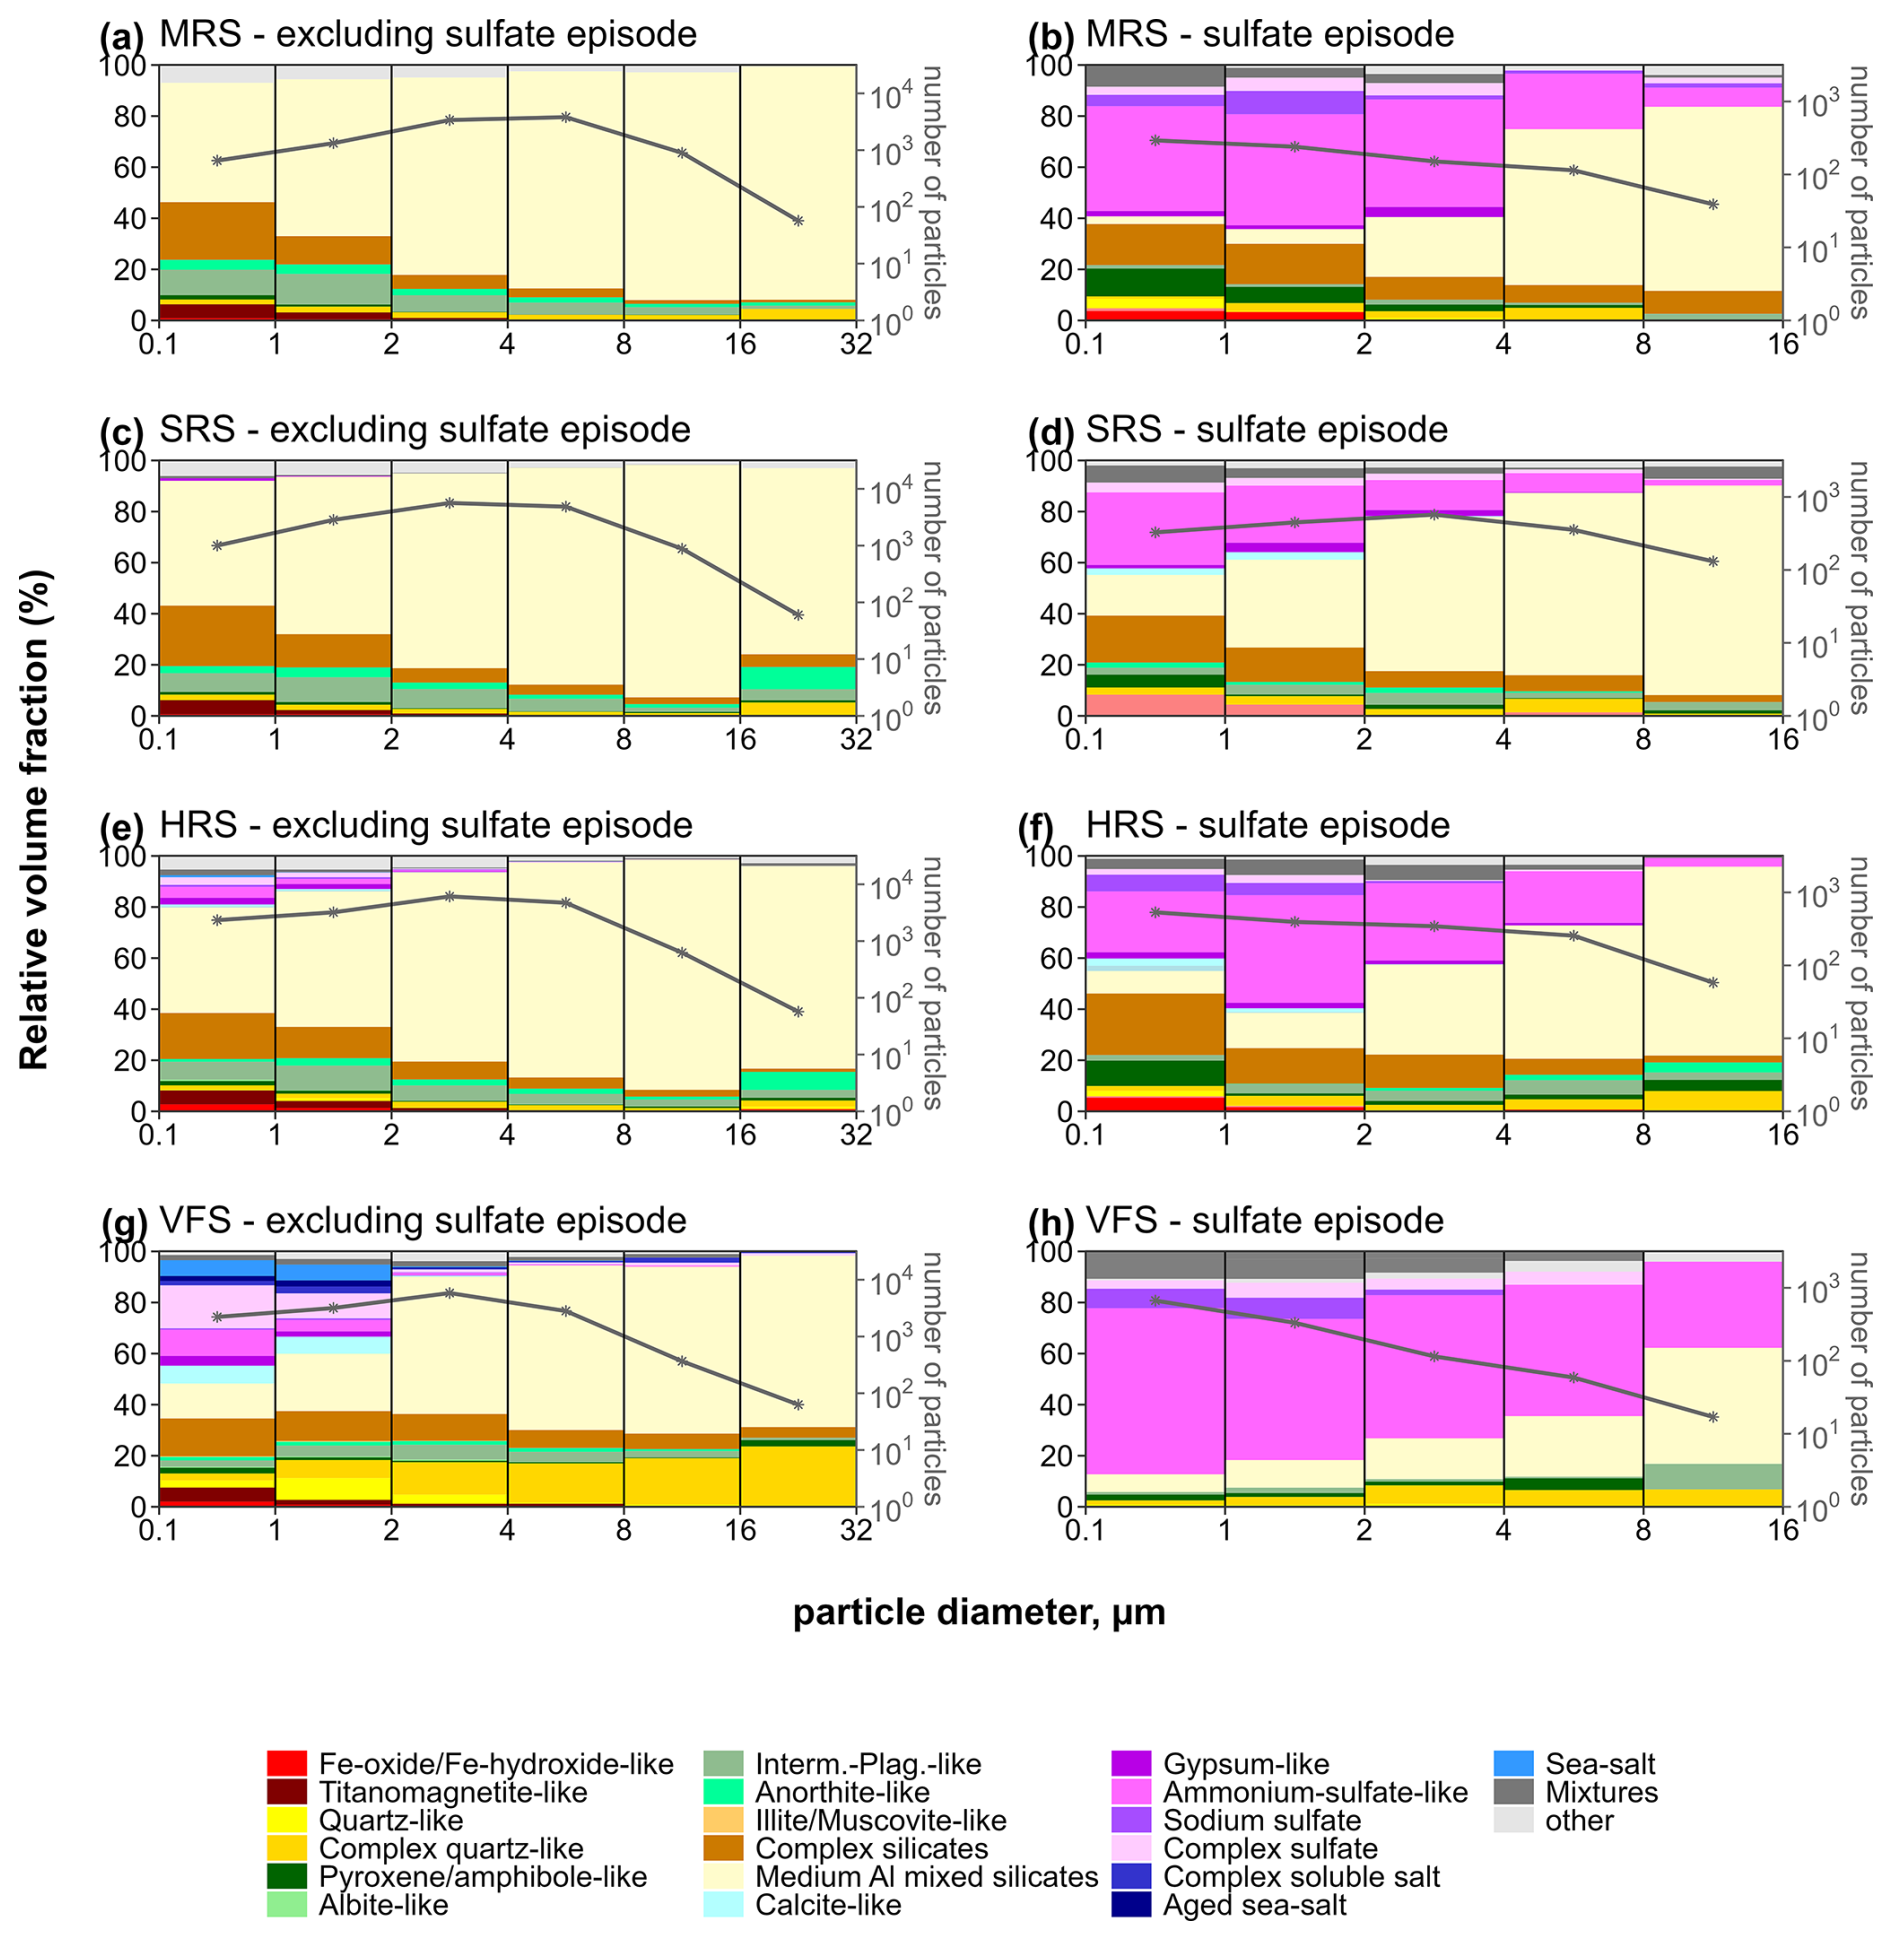
Figure 8Size-resolved volume-averaged composition of aerosol at different outflow regions during sulfate intrusion periods. “Complex silicates” consist of the following groups: complex silicate (high Al), complex silicate (moderate Al–low alkali), Al-rich clay mineral, other silicate, and Ca-rich silicate Ca–Si mixture. “Mixtures” comprise the following groups: sea-salt silicate mixture, aged-sea-salt silicate mixture, sodium sulfate silicate mixture, sulfate silicate mixture, and complex mixture. For details on the classification scheme, refer to Supplement Sect. S3.
4.1 Aerosol composition
Using the elemental-ratio-based classification analysis from the single-particle analysis, we derived an empirical mineralogical classification scheme. With the exception of few sulfate intrusion events (discussed below), aerosol composition at Dyngjusandur was remarkably stable.
Around 20 % (> 20 000 km2) of Iceland is covered by volcaniclastic sandy deserts, with active eolian processes containing sediments from both volcanic systems and eroded glacio-fluvial soils (Arnalds et al., 2001, 2016). Therefore, glass, a main constituent of abraded hyaloclastite, is expected as a signature compound. In hot deserts, soils undergo mineralogical fractionation due to weathering and size segregation due to dust emission and transport. For instance, the emitted dust from the Saharan desert typically consists of illite and kaolinite, alongside non-clay minerals including feldspar, quartz, calcite, and iron oxides (Panta et al., 2023). The segregation of minerals during dust emission and transport is influenced by variations in particle sizes and densities, leading heavier and larger grains to settle closer to the emission source. Conversely, mineralogical fractionation is less likely in Icelandic dust due to the limited degree of weathering, which restricts the formation of minerals from glassy compounds. Additionally, Icelandic dust lacks coarse and super-coarse mineral grains such as quartz, feldspar, and clay aggregates (Baldo et al., 2020). This can be attributed to the relatively young geological age of Icelandic volcanic rocks, which limits the extent of weathering and alteration processes, resulting in a reduced diversity of mineral compositions in the emitted dust.
Previous analyses of Icelandic dust conducted at Dyngjusandur (e.g., Baratoux et al., 2011; Baldo et al., 2020) showed that the dust aerosols predominantly consist of basaltic glass. In our companion article (González-Romero et al., 2024b), a comprehensive analysis of sediments reveals that the primary components of the dust-emitting sediments in Iceland are primarily composed of black volcanic glass, constituting approximately 70 % to 85 % of the total weight. Following this, plagioclase and pyroxenes account for approximately 10 % to 15 % and 4 % to 8 %, respectively. Additionally, there are trace amounts of zeolites and iron oxides present in small quantities (González-Romero et al., 2024b). This is consistent with the elemental data and the corresponding classification obtained in this study.
Approximately 53 % of the aerosol population in terms of number and 65 % in terms of volume can be attributed to MAS – most likely glass particles – in the fine size range. Furthermore, around 77 % (number) and 82 % (volume) of the particles fall into the MAS category in the coarse size range, while approximately 90 % (number) and 92 % (volume) fall into the MAS category in the super-coarse size range. Iron content analysis conducted by Baratoux et al. (2011) revealed high iron concentrations of up to 10 % in Dyngjusandur, which was further confirmed by Baldo et al. (2020) with an iron content of 15 %. Titanomagnetite-like particles, similar to those observed in previous studies on dust and sediments (Baratoux et al., 2011; Dagsson-Waldhauserova et al., 2015; Moroni et al., 2018; Baldo et al., 2020) were primarily present in the fine mode, constituting approximately 1 % of the volume.
The increase in sulfate particles observed on specific days can be attributed to the influence of volcanic emissions from Fagradalsfjall. Volcanoes release various gases and aerosols during volcanic activity. These emissions often include sulfur dioxide (SO2) (Esse et al., 2023), which can undergo chemical reactions in the atmosphere to form sulfate particles. The sulfate enrichment occurs on 16–17 August, 19–20 August, 2–3 September, and 5 September as seen from deposition sampler and free-wing impactor measurements. The air mass provenance during sulfur enrichment periods corroborates air masses originating from the Fagradalsfjall eruption (Fig. S7a–d).
Out of all four sampling sites in outflow regions, the VFS site showed the most diverse composition. As shown in Fig. 8, in the fine mode, sea salt and calcium-rich particles along with their mixtures were present, whereas they were not observed at other sites. As sea salt and Ca-rich particles can be from the ocean, samples collected at VFS indicate the influence of transport rather than local emission. In addition, considerable amounts of complex-quartz-like particles were observed in the coarse and super-coarse fractions. Nevertheless, MAS particles contributed most to the coarse and super-coarse fractions.
4.2 Iron distribution
The mineralogy of Icelandic soil surfaces of several active erosion regions including Dyngjusandur is documented to have basaltic composition (Baratoux et al., 2011; Baldo et al., 2020; González-Romero et al., 2024b). At Dyngjusandur, the sediments have an average total Fe content of 9.3 %, with the majority (79 %) existing in a structural form, while 15 % is magnetite and 5 % is composed of hematite and goethite (González-Romero et al., 2024b). Figure 5 shows the Fe distribution among the individual particles as a function of particle size. The relative fraction of Fe-rich (|Fe| > 0.2) particles is higher in fine-mode particles, which get transported easily over long distances and could potentially influence ocean biogeochemistry.
On average, externally mixed Fe-rich particles are predominately found in size fractions below 1 µm at about 3.5 % by volume. The aspect ratio associated with these Fe-rich particles is slightly influenced by particle size (Table 3), with lower AR for fine fractions compared to coarse fractions, indicating coarse fractions are more irregular. Furthermore, Fe is detected in virtually all (> 99.9 %) of the MAS particles, which account for the highest relative fraction of particles observed by ccSEM and ∼ 88 % of the total aerosol population in Dyngjusandur. This indicates that a majority of the particles in Icelandic dust are associated with some level of iron content in them.
The comparison of iron distribution in particles between Icelandic and Saharan dust reveals both similarities and differences in the trends of the Fe index. In both Icelandic dust and Saharan dust, most of the Fe-rich particles (|Fe| > 0.5) are concentrated in particles smaller than 1 µm, accounting for approximately 5 % and 4 % volume fraction, respectively, in that particle range (Kandler et al., 2011, 2020; Panta et al., 2023). The relative fractions of particles for which iron is not detected show similar patterns as well. However, the in-between range exhibits significant differences. At Dyngjusandur, there is a considerably higher fraction of particles with 0.1 < |Fe| < 0.2, with an increase of up to 4 µm and a decrease for larger diameters. On the other hand, in Morocco, this fraction decreases with increasing particle size. Similarly, the index range of 0.05 < |Fe| < 0.10 increases with particle size at Dyngjusandur, while it remains relatively constant in Morocco. In contrast, the higher Fe contribution to single particles at Dyngjusandur indicates a low weathering regime of Icelandic soils (Baldo et al., 2020), resulting in higher Fe content compared to Moroccan soil. This higher iron content in the emitted dust at Dyngjusandur has the potential to serve as a source of micronutrients for marine biota in the Arctic Ocean (Dagsson-Waldhauserova et al., 2013), as Fe from the glass particles is relatively mobile and therefore potentially bio-available (Baldo et al., 2020).
4.3 Particle shape
In Sect. 3.4, we demonstrated that Icelandic dust exhibits an increased level of asphericity with increasing size. This observation aligns with the findings of Richards-Thomas et al. (2021) regarding volcaniclastic dust particles, although their study utilized sphericity as a shape descriptor rather than AR. Nevertheless, the observed trend implies a similar relationship, where fine particles tend to possess a more regular shape compared to coarse particles. This has potential implications for the atmospheric lifetime of dust, as aspherical particles experience higher drag forces, thereby reducing their settling velocity (Yang et al., 2013; Huang et al., 2020; Mallios et al., 2020). Numerous observational studies have shown the presence of coarse dust particles far from their emitted source region (Weinzierl et al., 2017; van der Does et al., 2018; Varga et al., 2021), and particle shape has been proposed as a contributing factor to this phenomenon. However, understanding of the factors driving the transport mechanisms remains limited. Huang et al. (2020) compared settling velocities by approximating dust particles as randomly oriented tri‐axial ellipsoids. Their findings suggest an approximate 20 % increase in the dust's atmospheric lifetime when considering non-spherical shape effects. Therefore, the enhanced asphericity observed with increasing size in Icelandic dust could lead to a longer atmospheric lifetime of coarse dust as approximately 10 % of these particles have AR greater than 2.
When comparing the particle shape obtained in this study to that of Moroccan dust (Panta et al., 2023), we observed a distinct pattern: the median shape factor of Icelandic dust increases with size, while in Moroccan dust, it remains relatively constant. This difference in shape behavior can be attributed to several factors related to the age and mechanical history of the parent sediments.
In the case of Moroccan dust, the sediments are typically transported downstream from rivers and contain a high number of clay minerals, which are absent in Icelandic dust. These clay minerals have the potential to aggregate into larger soil mineral grains during transport (including fluvial water cycles), resulting in particles that are already relatively rounded and exhibit a lower shape factor. Additionally, lower-latitude dust sediments are often relatively older in comparison to the Icelandic ones, which might be as young as 1 d, counted from the time of glacier outflow. Therefore, the Moroccan sediments might have undergone extensive chemical weathering compared to the more mechanical processing in Iceland. Also, the rocks ground down by the glacier have probably had a considerable number of vacuoles in the size range of 50 µm and up. Breaking these into pieces might yield shard-like-shaped particles in the size range of several tens of micrometers, which on further disintegration below the typical vacuole size then become less elongated. The presence of these edges suggests that the particles have undergone less rounding or rounding has occurred to a lesser extent compared to low-latitude dust particles.
Overall, the observed differences in particle shape between high- and mid- to low-latitude dust can be attributed to variations in the mechanical weathering processes, age of sediments, and sources of the parent materials. These factors contribute to the distinct shape characteristics exhibited by dust particles.
4.4 Elemental vs. mineralogical composition
Figure 9 shows the average size-resolved mineralogical and elemental composition for Icelandic and Moroccan dust, respectively. The median elemental mass ratios in our work – 3.15 (Si Al), 1.38 (Fe Al), and 1.41 (Fe Ca) – are in good agreement with results with the X-ray fluorescence (XRF) analysis reported by Baldo et al. (2020) for their Dyngjusandur (D3) sample (3.26, 1.42, and 1.41, respectively).
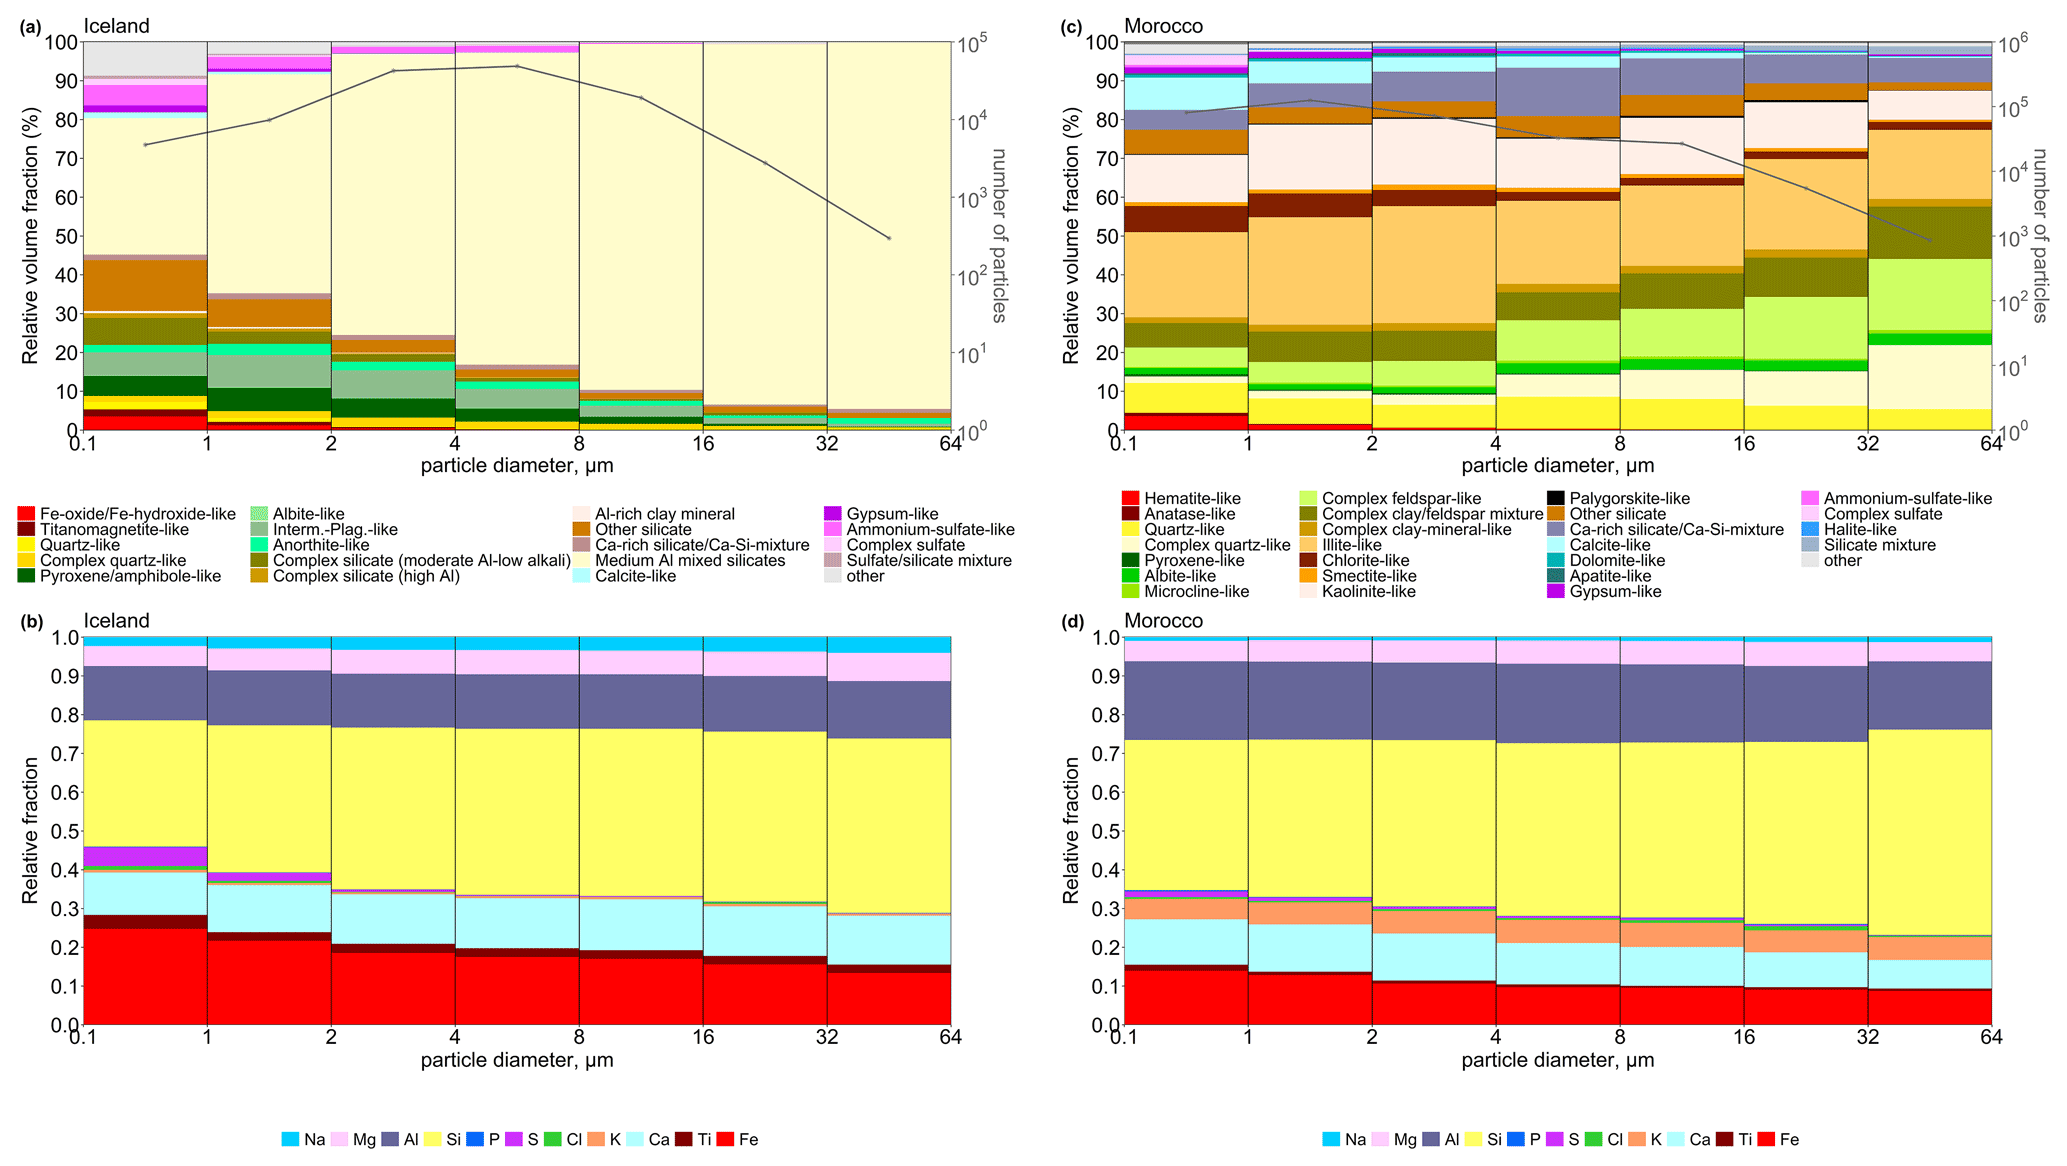
Figure 9Size-resolved elemental and mineralogical composition for (a, b) Icelandic and (c, d) Moroccan dust, respectively.
When comparing particle type classifications between Icelandic and Moroccan dust, it is important to consider that the identification scheme relies solely on the elemental composition of the single particles derived from EDX. Elemental composition alone is insufficient to accurately identify mineral phases since different mineral phases can have the same elemental composition. Furthermore, the parent sediments of Icelandic and Moroccan dust differ (Baldo et al., 2020; González-Romero et al., 2024b), which necessarily leads to differences in the classification scheme despite using the same rules. For example, Fe-oxide- Fe-hydroxide-like in Icelandic dust is named hematite-like in Moroccan dust based on the regional mineralogical composition. Comparing the elemental composition of Icelandic dust at Dyngjusandur with that of Moroccan dust at L'Bour (Panta et al., 2023), Icelandic dust exhibited lower Al Si and higher Fe Al ratios. This difference is primarily attributed to the higher iron content observed in Icelandic dust compared to northern African dust (Baldo et al., 2020). Figure 9b and d present the bulk elemental composition of Icelandic and Moroccan dust, representing all individual particles without classification into distinct groups. A notable disparity between the two is observed in the Fe fraction, where Icelandic dust exhibits an approximately 2-fold higher concentration compared to Moroccan dust. Additionally, there is a slight increase in Ca content and a decrease in Al content in Icelandic dust. Moreover, K is nearly absent in Icelandic dust particles across various size classes. In contrast, Ti is predominantly present in the fine fraction of Moroccan dust, particularly in approximately 18 % of silicate particles. Conversely, in Icelandic dust, Ti is detected throughout the entire size range, with over 86 % of silicate particles containing Ti. These findings align with the outcomes of the Sanchez-Marroquin et al. (2020) study on Icelandic dust collected from an aircraft, suggesting that Ti could potentially serve as a tracer for identifying Icelandic mineral dust particles.
However, when comparing the mineralogical composition, notable differences emerge. Icelandic dust primarily consists of MAS particles, which are highly likely to be glass, intermediate plagioclase, and pyroxene. In contrast, Moroccan dust is predominantly composed of clays, feldspar, quartz, and calcite. These distinctions can be attributed to the differing compositions of the parent sediments (Baldo et al., 2020; González-Romero et al., 2024b).
In this paper, we determined the chemistry and morphology data of freshly emitted Icelandic dust particles identified by ccSEM/EDX at Dyngjusandur and surrounding outflow locations in Iceland. We discussed the different particle types observed and explored their properties.
Electron microscopy showed that the most abundant particle class was medium-Al mixed particles (glassy) at all of the locations. Sulfate intrusion periods were observed on selected days, with a higher abundance of ammonium sulfate particles in both the fine and coarse size range. The composition at regional outflow regions was also found to be similar to that observed in Dyngjusandur except for a hilltop site which was influenced by transported rather than locally emitted aerosol.
We observed that the particles solely dominated by Fe are found mainly in fine fractions. Furthermore, a higher total Fe content within individual particles is observed in Icelandic dust compared to Saharan dust, which can affect the modeled dust–radiation interaction as well as the supply of nutrients to terrestrial and marine ecosystems. The high Fe content in Icelandic dust is associated with the composition of the parent sediments, which are mainly iron-bearing glass. Baldo et al. (2020) estimated Fe solubility of 0.6 % for Dyngjusandur, which supplies Fe to the North Atlantic Ocean.
The 2D imaging measurements revealed a systematic dependence of particle morphology on size (0.5–62.5 µm), consistent across the entire sample set. Particle elongation, represented by aspect ratio, increased with size. Median aspect ratios for fine, coarse, and super-coarse particles were 1.37, 1.46, and 1.53, respectively. Density distributions were narrower for fine- compared to coarse- and super-coarse-mode particles, indicating a wider range of aspect ratio values in the latter. These patterns in aspect ratio distribution can inform the parameterization of particle shape in models of dust transport, dispersion, or climate.
Our results highlight that on an individual-particle level Icelandic dust and Saharan dust have a relatively similar elemental composition but fundamentally different mineralogy due to the different geological parent sediment. These significant compositional differences have important consequences for ice nucleation, radiative forcing, and nutrient deposition. As shown in Baldo et al. (2023), the complex refractive index (between 660–950 nm) of Icelandic dust from Dyngjusandur is 2–5 times higher than that of Moroccan Saharan dust, likely due to its higher magnetite content. This indicates that Icelandic dust is more absorbing in the near-IR band and may exert a stronger positive direct radiative effect. The exact role of black volcanic glass in dust–cloud interactions is not fully understood, which hampers a comprehensive understanding of its effects on climate.
We observed differences in the distribution of Fe between Icelandic and Saharan dust particles, with a higher Fe contribution in Icelandic dust. The overall shape distribution between Icelandic and Saharan dust is observed to be rather similar, although a size dependency is observed for Icelandic dust but not for Saharan dust.
Characterization of aerosol composition in highly sensitive regions such as Iceland is important for understanding the potential climate effects. With retreating glaciers due to increased climate warming, dust emissions are expected to increase, which will likely have an impact on the Earth system in general and on the regional environment in particular. In addition to the detailed characterization in this work, our measurements of the aerosol optical properties together with the particle size distribution (PSD) will provide further insight into the absorption and scattering properties and PSD variability in Icelandic dust, which is essential to determine the radiative impact of Icelandic dust and its contribution to Arctic amplification.
The data are publicly available in the Zenodo data repository at https://doi.org/10.5281/zenodo.15769744 (Panta et al., 2025).
The supplement related to this article is available online at https://doi.org/10.5194/acp-25-10457-2025-supplement.
CPG-P proposed and designed the measurement campaign with contributions from AA, PDW, SD, KK, MK, XQ, and KS. AP, KK, KS, AA, PDW, SD, CGF, AGR, MK, MM, XQ, JYD, and CPGP participated in the field measurement campaign. ME contributed to electron microscopy analysis. MM contributed to sample collection. AP collected the samples, analyzed them by electron microscopy, performed the formal analysis and visualization, and wrote the original draft manuscript. KK and CPG-P supervised the work. CPG-P and KK re-edited the manuscript, and all authors discussed the data, reviewed the study, and finalized the manuscript.
At least one of the (co-)authors is a member of the editorial board of Atmospheric Chemistry and Physics. The peer-review process was guided by an independent editor, and the authors also have no other competing interests to declare.
Publisher’s note: Copernicus Publications remains neutral with regard to jurisdictional claims made in the text, published maps, institutional affiliations, or any other geographical representation in this paper. While Copernicus Publications makes every effort to include appropriate place names, the final responsibility lies with the authors.
We acknowledge the EMIT project, which is supported by the NASA Earth Venture Instrument program, under the Earth Science Division of the Science Mission Directorate. We thank Paul Ginoux for providing high-resolution global dust source maps, which were very helpful for the identification of the FRAGMENT experimental sites. We thank the staff from the ranger station at Dreki as well as the wardens of the Dreki campsite and the Dreki mountain rescue service for their valuable support and advice. We also thank Vilhjalmur Vernharðsson and his crew from Fjalladýrð for their permanent logistic help. Without all of them, the measurement campaign would not have been successfully feasible.
The field campaign and its associated research, including this work, was funded by the European Research Council under the Horizon 2020 research and innovation program through the ERC Consolidator Grant FRAGMENT (grant agreement no. 773051) and the AXA Research Fund through the AXA Chair on Sand and Dust Storms at BSC. Cristina González-Flórez was supported by a PhD fellowship from the Agència de Gestió d’Ajuts Universitaris i de Recerca (AGAUR; grant no. 2020_FI B 00678). Konrad Kandler was funded by the Deutsche Forschungsgemeinschaft (DFG, German Research Foundation; grant nos. 264907654 and 416816480). Kerstin Schepanski was funded by the Deutsche Forschungsgemeinschaft (DFG, German Research Foundation; grant no. 417012665). Martina Klose has received funding through the Helmholtz Association’s Initiative and Networking Fund (grant agreement no. VH-NG-1533). The work was partly funded by the Orkurannsóknasjóður (National Power Agency of Iceland). Jesús Yus-Díez is supported by the European Union's Horizon Europe research and innovation program under the Marie Skłodowska-Curie Postdoctoral Fellowship program “SMASH”, co-funded under grant agreement no. 101081355. The SMASH project is co-funded by the Republic of Slovenia and the European Union through the European Regional Development Fund.
We acknowledge support from the Open Access Publishing Fund of the Technical University of Darmstadt.
This paper was edited by Alexander Laskin and reviewed by four anonymous referees.
Adebiyi, A., Kok, J. F., Murray, B. J., Ryder, C. L., Stuut, J.-B. W., Kahn, R. A., Knippertz, P., Formenti, P., Mahowald, N. M., Pérez García-Pando, C., Klose, M., Ansmann, A., Samset, B. H., Ito, A., Balkanski, Y., Di Biagio, C., Romanias, M. N., Huang, Y., and Meng, J.: A review of coarse mineral dust in the Earth system, Aeolian Res., 60, 100849, https://doi.org/10.1016/j.aeolia.2022.100849, 2023. a
Arnalds, O.: Dust sources and deposition of aeolian materials in Iceland, Icelandic Agricultural Sciences, 3–21, https://skemman.is/bitstream/1946/19921/1/IAS10_OlafurArnalds.pdf (last access: 28 August 2025), 2010. a
Arnalds, O., Gisladottir, F., and Sigurjonsson, H.: Sandy deserts of Iceland: an overview, J. Arid Environ., 47, 359–371, https://doi.org/10.1006/jare.2000.0680, 2001. a, b, c, d
Arnalds, O., Olafsson, H., and Dagsson-Waldhauserova, P.: Quantification of iron-rich volcanogenic dust emissions and deposition over the ocean from Icelandic dust sources, Biogeosciences, 11, 6623–6632, https://doi.org/10.5194/bg-11-6623-2014, 2014. a
Arnalds, O., Dagsson-Waldhauserova, P., and Olafsson, H.: The Icelandic volcanic aeolian environment: Processes and impacts – A review, Aeolian Res., 20, 176–195, https://doi.org/10.1016/j.aeolia.2016.01.004, 2016. a, b, c, d, e, f, g
Aryal, Y. and Evans, S.: Dust emission response to precipitation and temperature anomalies under different climatic conditions, Sci. Total Environ., 874, 162335, https://doi.org/10.1016/j.scitotenv.2023.162335, 2023. a
Baldo, C., Formenti, P., Nowak, S., Chevaillier, S., Cazaunau, M., Pangui, E., Di Biagio, C., Doussin, J.-F., Ignatyev, K., Dagsson-Waldhauserova, P., Arnalds, O., MacKenzie, A. R., and Shi, Z.: Distinct chemical and mineralogical composition of Icelandic dust compared to northern African and Asian dust, Atmos. Chem. Phys., 20, 13521–13539, https://doi.org/10.5194/acp-20-13521-2020, 2020. a, b, c, d, e, f, g, h, i, j, k, l, m, n, o, p, q, r, s
Baldo, C., Formenti, P., Di Biagio, C., Lu, G., Song, C., Cazaunau, M., Pangui, E., Doussin, J.-F., Dagsson-Waldhauserova, P., Arnalds, O., Beddows, D., MacKenzie, A. R., and Shi, Z.: Complex refractive index and single scattering albedo of Icelandic dust in the shortwave part of the spectrum, Atmos. Chem. Phys., 23, 7975–8000, https://doi.org/10.5194/acp-23-7975-2023, 2023. a, b, c
Baratoux, D., Mangold, N., Arnalds, O., Bardintzeff, J.-M., Platevoët, B., Grégoire, M., and Pinet, P.: Volcanic sands of Iceland - Diverse origins of aeolian sand deposits revealed at Dyngjusandur and Lambahraun, Earth Surf. Proc. Land., 36, 1789–1808, https://doi.org/10.1002/esp.2201, 2011. a, b, c, d, e, f, g, h
Björnsson, H. and Pálsson, F.: Icelandic glaciers, Jökull, 58, 2008. a
Boulon, J., Sellegri, K., Hervo, M., and Laj, P.: Observations of nucleation of new particles in a volcanic plume, P. Natl. Acad. Sci. USA, 108, 12223–12226, https://doi.org/10.1073/pnas.1104923108, 2011. a
Bullard, J. E., Baddock, M., Bradwell, T., Crusius, J., Darlington, E., Gaiero, D., Gassó, S., Gisladottir, G., Hodgkins, R., McCulloch, R., McKenna-Neuman, C., Mockford, T., Stewart, H., and Thorsteinsson, T.: High-latitude dust in the Earth system, Rev. Geophys., 54, 447–485, https://doi.org/10.1002/2016RG000518, 2016. a, b, c, d
Butwin, M. K., Pfeffer, M. A., von Löwis, S., Støren, E. W. N., Bali, E., and Thorsteinsson, T.: Properties of dust source material and volcanic ash in Iceland, Sedimentology, 67, 3067–3087, https://doi.org/10.1111/sed.12734, 2020. a
Carn, S., Fioletov, V., McLinden, C., Li, C., and Krotkov, N.: A decade of global volcanic SO2 emissions measured from space, Sci. Rep., 7, https://doi.org/10.1038/srep44095, 2017. a
Carn, S. A., Krueger, A. J., Krotkov, N. A., Yang, K., and Evans, K.: Tracking volcanic sulfur dioxide clouds for aviation hazard mitigation, Nat. Hazards, 51, 325–343, https://doi.org/10.1007/s11069-008-9228-4, 2009. a
Claquin, T., Schulz, M., and Balkanski, Y. J.: Modeling the mineralogy of atmospheric dust sources, J. Geophys. Res.-Atmos., 104, 22243–22256, https://doi.org/10.1029/1999JD900416, 1999. a
Dagsson-Waldhauserova, P., Arnalds, O., and Olafsson, H.: Long-term frequency and characteristics of dust storm events in Northeast Iceland (1949–2011), Atmos. Environ., 77, 117–127, https://doi.org/10.1016/j.atmosenv.2013.04.075, 2013. a, b
Dagsson-Waldhauserova, P., Arnalds, O., Olafsson, H., Hladil, J., Skala, R., Navratil, T., Chadimova, L., and Meinander, O.: Snow–Dust Storm: Unique case study from Iceland, March 6–7, 2013, Aeolian Res., 16, 69–74, https://doi.org/10.1016/j.aeolia.2014.11.001, 2015. a
Dagsson-Waldhauserova, P., Arnalds, O., and Olafsson, H.: Long-term dust aerosol production from natural sources in Iceland, J. Air Waste Ma., 67, 173–181, https://doi.org/10.1080/10962247.2013.805703, pMID: 28102779, 2017. a
Deer, W. A., F., Howie, R. A., and Zussman, J.: An Introduction to the Rock-Forming Minerals, Mineralogical Society of Great Britain and Ireland, ISBN 9780903056274, https://doi.org/10.1180/DHZ, 2013. a
Dong, Z., Brahney, J., Kang, S., Elser, J., Wei, T., Jiao, X., and Shao, Y.: Aeolian dust transport, cycle and influences in high-elevation cryosphere of the Tibetan Plateau region: New evidences from alpine snow and ice, Earth-Sci. Rev., 211, 103408, https://doi.org/10.1016/j.earscirev.2020.103408, 2020. a
Dupont, S., Klose, M., Irvine, M. R., González-Flórez, C., Alastuey, A., Bonnefond, J.-M., Dagsson-Waldhauserova, P., Gonzalez-Romero, A., Hussein, T., Lamaud, E., Meyer, H., Panta, A., Querol, X., Schepanski, K., Vergara Palacio, S., Wieser, A., Yus-Díez, J., Kandler, K., and Pérez García-Pando, C.: Impact of Dust Source Patchiness on the Existence of a Constant Dust Flux Layer During Aeolian Erosion Events, J. Geophys. Res.-Atmos., 129, e2023JD040657, https://doi.org/10.1029/2023JD040657, 2024. a, b, c, d
Esse, B., Burton, M., Hayer, C., Pfeffer, M. A., Barsotti, S., Theys, N., Barnie, T., and Titos, M.: Satellite derived SO2 emissions from the relatively low-intensity, effusive 2021 eruption of Fagradalsfjall, Iceland, Earth Planet. Sc. Lett., 619, 118325, https://doi.org/10.1016/j.epsl.2023.118325, 2023. a, b
Formenti, P., Schütz, L., Balkanski, Y., Desboeufs, K., Ebert, M., Kandler, K., Petzold, A., Scheuvens, D., Weinbruch, S., and Zhang, D.: Recent progress in understanding physical and chemical properties of African and Asian mineral dust, Atmos. Chem. Phys., 11, 8231–8256, https://doi.org/10.5194/acp-11-8231-2011, 2011. a
Gaston, C. J.: Re-examining Dust Chemical Aging and Its Impacts on Earth’s Climate, Accounts Chem. Res., 53, 1005–1013, https://doi.org/10.1021/acs.accounts.0c00102, 2020. a
Gonçalves Ageitos, M., Obiso, V., Miller, R. L., Jorba, O., Klose, M., Dawson, M., Balkanski, Y., Perlwitz, J., Basart, S., Di Tomaso, E., Escribano, J., Macchia, F., Montané, G., Mahowald, N. M., Green, R. O., Thompson, D. R., and Pérez García-Pando, C.: Modeling dust mineralogical composition: sensitivity to soil mineralogy atlases and their expected climate impacts, Atmos. Chem. Phys., 23, 8623–8657, https://doi.org/10.5194/acp-23-8623-2023, 2023. a
González-Flórez, C., Klose, M., Alastuey, A., Dupont, S., Escribano, J., Etyemezian, V., Gonzalez-Romero, A., Huang, Y., Kandler, K., Nikolich, G., Panta, A., Querol, X., Reche, C., Yus-Díez, J., and Pérez García-Pando, C.: Insights into the size-resolved dust emission from field measurements in the Moroccan Sahara, Atmos. Chem. Phys., 23, 7177–7212, https://doi.org/10.5194/acp-23-7177-2023, 2023. a
González-Romero, A., González-Flórez, C., Panta, A., Yus-Díez, J., Reche, C., Córdoba, P., Moreno, N., Alastuey, A., Kandler, K., Klose, M., Baldo, C., Clark, R. N., Shi, Z., Querol, X., and Pérez García-Pando, C.: Variability in sediment particle size, mineralogy, and Fe mode of occurrence across dust-source inland drainage basins: the case of the lower Drâa Valley, Morocco, Atmos. Chem. Phys., 23, 15815–15834, https://doi.org/10.5194/acp-23-15815-2023, 2023. a
González-Romero, A., González-Flórez, C., Panta, A., Yus-Díez, J., Córdoba, P., Alastuey, A., Moreno, N., Hernández-Chiriboga, M., Kandler, K., Klose, M., Clark, R. N., Ehlmann, B. L., Greenberger, R. N., Keebler, A. M., Brodrick, P., Green, R., Ginoux, P., Querol, X., and Pérez García-Pando, C.: Characterization of the particle size distribution, mineralogy, and Fe mode of occurrence of dust-emitting sediments from the Mojave Desert, California, USA, Atmos. Chem. Phys., 24, 9155–9176, https://doi.org/10.5194/acp-24-9155-2024, 2024a. a
González-Romero, A., González-Flórez, C., Panta, A., Yus-Díez, J., Córdoba, P., Alastuey, A., Moreno, N., Kandler, K., Klose, M., Clark, R. N., Ehlmann, B. L., Greenberger, R. N., Keebler, A. M., Brodrick, P., Green, R. O., Querol, X., and Pérez García-Pando, C.: Probing Iceland's dust-emitting sediments: particle size distribution, mineralogy, cohesion, Fe mode of occurrence, and reflectance spectra signatures, Atmos. Chem. Phys., 24, 6883–6910, https://doi.org/10.5194/acp-24-6883-2024, 2024b. a, b, c, d, e, f, g, h, i, j, k, l, m, n, o, p, q
Groot Zwaaftink, C. D., Grythe, H., Skov, H., and Stohl, A.: Substantial contribution of northern high-latitude sources to mineral dust in the Arctic, J. Geophys. Res.-Atmos., 121, 13678–13697, https://doi.org/10.1002/2016JD025482, 2016. a
Hamilton, D. S., Perron, M. M., Bond, T. C., Bowie, A. R., Buchholz, R. R., Guieu, C., Ito, A., Maenhaut, W., Myriokefalitakis, S., Olgun, N., Rathod, S. D., Schepanski, K., Tagliabue, A., Wagner, R., and Mahowald, N. M.: Earth, Wind, Fire, and Pollution: Aerosol Nutrient Sources and Impacts on Ocean Biogeochemistry, Annu. Rev. Mar. Sci., 14, 303–330, https://doi.org/10.1146/annurev-marine-031921-013612, 2022. a
Hinds, W.: Aerosol Technology : Properties, Behavior, and Measurement of Airborne Particles, Wiley Interscience, ISBN 0-471-19410-7, 1999. a
Huang, Y., Kok, J. F., Kandler, K., Lindqvist, H., Nousiainen, T., Sakai, T., Adebiyi, A., and Jokinen, O.: Climate Models and Remote Sensing Retrievals Neglect Substantial Desert Dust Asphericity, Geophys. Res. Lett., 47, e2019GL086592, https://doi.org/10.1029/2019GL086592, 2020. a, b, c
Ito, A. and Feng, Y.: Role of dust alkalinity in acid mobilization of iron, Atmos. Chem. Phys., 10, 9237–9250, https://doi.org/10.5194/acp-10-9237-2010, 2010. a
Jakobsson, S. P., Jónasson, K., and Sigurdsson, I. A.: The three igneous rock series of Iceland, Jökull, 58, 117–138, https://doi.org/10.33799/jokull2008.58.117, 2008. a
Journet, E., Balkanski, Y., and Harrison, S. P.: A new data set of soil mineralogy for dust-cycle modeling, Atmos. Chem. Phys., 14, 3801–3816, https://doi.org/10.5194/acp-14-3801-2014, 2014. a
Kandler, K., Benker, N., Bundke, U., Cuevas, E., Ebert, M., Knippertz, P., Rodríguez, S., Schütz, L., and Weinbruch, S.: Chemical composition and complex refractive index of Saharan Mineral Dust at Izaña, Tenerife (Spain) derived by electron microscopy, Atmos. Environ., 41, 8058–8074, https://doi.org/10.1016/j.atmosenv.2007.06.047, 2007. a, b, c, d, e
Kandler, K., Lieke, K., Benker, N., Emmel, C., Küpper, M., Müller-Ebert, D., Ebert, M., Scheuvens, D., Schladitz, A., Schütz, L., and Weinbruch, S.: Electron microscopy of particles collected at Praia, Cape Verde, during the Saharan Mineral Dust Experiment: particle chemistry, shape, mixing state and complex refractive index, Tellus B, 63, 475–496, https://doi.org/10.1111/j.1600-0889.2011.00550.x, 2011. a
Kandler, K., Schneiders, K., Ebert, M., Hartmann, M., Weinbruch, S., Prass, M., and Pöhlker, C.: Composition and mixing state of atmospheric aerosols determined by electron microscopy: method development and application to aged Saharan dust deposition in the Caribbean boundary layer, Atmos. Chem. Phys., 18, 13429–13455, https://doi.org/10.5194/acp-18-13429-2018, 2018. a, b, c, d
Kandler, K., Schneiders, K., Heuser, J., Waza, A., Aryasree, S., Althausen, D., Hofer, J., Abdullaev, S. F., and Makhmudov, A. N.: Differences and Similarities of Central Asian, African, and Arctic Dust Composition from a Single Particle Perspective, Atmosphere, 11, https://doi.org/10.3390/atmos11030269, 2020. a, b, c
Kawai, K., Matsui, H., and Tobo, Y.: Dominant Role of Arctic Dust With High Ice Nucleating Ability in the Arctic Lower Troposphere, Geophys. Res. Lett., 50, e2022GL102470, https://doi.org/10.1029/2022GL102470, 2023. a
Kok, J. F., Adebiyi, A. A., Albani, S., Balkanski, Y., Checa-Garcia, R., Chin, M., Colarco, P. R., Hamilton, D. S., Huang, Y., Ito, A., Klose, M., Li, L., Mahowald, N. M., Miller, R. L., Obiso, V., Pérez García-Pando, C., Rocha-Lima, A., and Wan, J. S.: Contribution of the world's main dust source regions to the global cycle of desert dust, Atmos. Chem. Phys., 21, 8169–8193, https://doi.org/10.5194/acp-21-8169-2021, 2021. a
Kok, J. F., Storelvmo, T., Karydis, V. A., Adebiyi, A. A., Mahowald, N. M., Evan, A. T., He, C., and Leung, D. M.: Mineral dust aerosol impacts on global climate and climate change, Nat. Rev. Earth Environ., 4, 71–86, https://doi.org/10.1038/s43017-022-00379-5, 2023. a
amotte, C., Guth, J., Marécal, V., Cussac, M., Hamer, P. D., Theys, N., and Schneider, P.: Modeling study of the impact of SO2 volcanic passive emissions on the tropospheric sulfur budget, Atmos. Chem. Phys., 21, 11379–11404, https://doi.org/10.5194/acp-21-11379-2021, 2021. a
Lasne, J., Urupina, D., Maters, E. C., Delmelle, P., Romanias, M. N., and Thevenet, F.: Photo-enhanced uptake of SO2 on Icelandic volcanic dusts, Environ. Sci. Atmos., 2, 375–387, https://doi.org/10.1039/D1EA00094B, 2022. a
Li, W., Shao, L., Shi, Z., Chen, J., Yang, L., Yuan, Q., Yan, C., Zhang, X., Wang, Y., Sun, J., Zhang, Y., Shen, X., Wang, Z., and Wang, W.: Mixing state and hygroscopicity of dust and haze particles before leaving Asian continent, J. Geophys. Res.-Atmos., 119, 1044–1059, https://doi.org/10.1002/2013JD021003, 2014. a
Li, W., Shao, L., Zhang, D., Ro, C.-U., Hu, M., Bi, X., Geng, H., Matsuki, A., Niu, H., and Chen, J.: A review of single aerosol particle studies in the atmosphere of East Asia: morphology, mixing state, source, and heterogeneous reactions, J. Clean. Prod., 112, 1330–1349, https://doi.org/10.1016/j.jclepro.2015.04.050, 2016. a
indqvist, H., Jokinen, O., Kandler, K., Scheuvens, D., and Nousiainen, T.: Single scattering by realistic, inhomogeneous mineral dust particles with stereogrammetric shapes, Atmos. Chem. Phys., 14, 143–157, https://doi.org/10.5194/acp-14-143-2014, 2014. a
Mahowald, N., Albani, S., Kok, J. F., Engelstaeder, S., Scanza, R., Ward, D. S., and Flanner, M. G.: The size distribution of desert dust aerosols and its impact on the Earth system, Aeolian Res., 15, 53–71, https://doi.org/10.1016/j.aeolia.2013.09.002, 2014. a, b
Mallios, S. A., Drakaki, E., and Amiridis, V.: Effects of dust particle sphericity and orientation on their gravitational settling in the earth’s atmosphere, J. Aerosol Sci., 150, 105634, https://doi.org/10.1016/j.jaerosci.2020.105634, 2020. a
Maters, E. C., Dingwell, D. B., Cimarelli, C., Müller, D., Whale, T. F., and Murray, B. J.: The importance of crystalline phases in ice nucleation by volcanic ash, Atmos. Chem. Phys., 19, 5451–5465, https://doi.org/10.5194/acp-19-5451-2019, 2019. a
Meinander, O., Dagsson-Waldhauserova, P., and Arnalds, O.: Icelandic volcanic dust can have a significant influence on the cryosphere in Greenland and elsewhere, Polar Research, 35, https://doi.org/10.3402/polar.v35.31313, 2016. a
Meinander, O., Dagsson-Waldhauserova, P., Amosov, P., Aseyeva, E., Atkins, C., Baklanov, A., Baldo, C., Barr, S. L., Barzycka, B., Benning, L. G., Cvetkovic, B., Enchilik, P., Frolov, D., Gassó, S., Kandler, K., Kasimov, N., Kavan, J., King, J., Koroleva, T., Krupskaya, V., Kulmala, M., Kusiak, M., Lappalainen, H. K., Laska, M., Lasne, J., Lewandowski, M., Luks, B., McQuaid, J. B., Moroni, B., Murray, B., Möhler, O., Nawrot, A., Nickovic, S., O’Neill, N. T., Pejanovic, G., Popovicheva, O., Ranjbar, K., Romanias, M., Samonova, O., Sanchez-Marroquin, A., Schepanski, K., Semenkov, I., Sharapova, A., Shevnina, E., Shi, Z., Sofiev, M., Thevenet, F., Thorsteinsson, T., Timofeev, M., Umo, N. S., Uppstu, A., Urupina, D., Varga, G., Werner, T., Arnalds, O., and Vukovic Vimic, A.: Newly identified climatically and environmentally significant high-latitude dust sources, Atmos. Chem. Phys., 22, 11889–11930, https://doi.org/10.5194/acp-22-11889-2022, 2022. a, b, c, d
Moroni, B., Arnalds, O., Dagsson-Waldhauserová, P., Crocchianti, S., Vivani, R., and Cappelletti, D.: Mineralogical and Chemical Records of Icelandic Dust Sources Upon Ny-Ålesund (Svalbard Islands), Front. Earth Sci., 6, https://doi.org/10.3389/feart.2018.00187, 2018. a, b, c
Murray, B. J., Carslaw, K. S., and Field, P. R.: Opinion: Cloud-phase climate feedback and the importance of ice-nucleating particles, Atmos. Chem. Phys., 21, 665–679, https://doi.org/10.5194/acp-21-665-2021, 2021. a
Nousiainen, T. and Kandler, K.: Light scattering by atmospheric mineral dust particles, pp. 3–52, Springer Berlin Heidelberg, Berlin, Heidelberg, ISBN 978-3-642-37985-7, https://doi.org/10.1007/978-3-642-37985-7_1, 2015. a
Ott, D. K. and Peters, T. M.: A Shelter to Protect a Passive Sampler for Coarse Particulate Matter, PM10−2.5, Aerosol Sci. Tech., 42, 299–309, https://doi.org/10.1080/02786820802054236, 2008. a, b, c
Panta, A., Kandler, K., Alastuey, A., González-Flórez, C., González-Romero, A., Klose, M., Querol, X., Reche, C., Yus-Díez, J., and Pérez García-Pando, C.: Insights into the single-particle composition, size, mixing state, and aspect ratio of freshly emitted mineral dust from field measurements in the Moroccan Sahara using electron microscopy, Atmos. Chem. Phys., 23, 3861–3885, https://doi.org/10.5194/acp-23-3861-2023, 2023. a, b, c, d, e, f, g, h, i, j, k, l, m, n, o, p, q, r
Panta, A., Kandler, K., Schepanski, K., Alastuey, A., Waldhauserova, P. D., Dupont, S., Eknayan, M., González-Flórez, C., González-Romero, A., Klose, M., Montag, M., Querol, X., Yus-Díez, J., and García-Pando, C. P.: Unveiling single-particle composition, size, shape, and mixing state of freshly emitted Icelandic dust via electron microscopy analysis, Zenodo [data set], https://doi.org/10.5281/zenodo.15769744, 2025. a
Paramonov, M., David, R. O., Kretzschmar, R., and Kanji, Z. A.: A laboratory investigation of the ice nucleation efficiency of three types of mineral and soil dust, Atmos. Chem. Phys., 18, 16515–16536, https://doi.org/10.5194/acp-18-16515-2018, 2018. a
Perlwitz, J. P., Pérez García-Pando, C., and Miller, R. L.: Predicting the mineral composition of dust aerosols – Part 2: Model evaluation and identification of key processes with observations, Atmos. Chem. Phys., 15, 11629–11652, https://doi.org/10.5194/acp-15-11629-2015, 2015. a
Prospero, J. M., Bullard, J. E., and Hodgkins, R.: High-Latitude Dust Over the North Atlantic: Inputs from Icelandic Proglacial Dust Storms, Science, 335, 1078–1082, https://doi.org/10.1126/science.1217447, 2012. a
Richards-Thomas, T., McKenna-Neuman, C., and Power, I. M.: Particle-scale characterization of volcaniclastic dust sources within Iceland, Sedimentology, 68, 1137–1158, https://doi.org/10.1111/sed.12821, 2021. a, b
Sanchez-Marroquin, A., Arnalds, O., Baustian-Dorsi, K. J., Browse, J., Dagsson-Waldhauserova, P., Harrison, A. D., Maters, E. C., Pringle, K. J., Vergara-Temprado, J., Burke, I. T., McQuaid, J. B., Carslaw, K. S., and Murray, B. J.: Iceland is an episodic source of atmospheric ice-nucleating particles relevant for mixed-phase clouds, Science Advances, 6, eaba8137, https://doi.org/10.1126/sciadv.aba8137, 2020. a, b
Scheuvens, D., Kandler, K., Küpper, M., Lieke, K., Zorn, R., Ebert, M., Schütz, L., and Weinbruch, S.: Individual-particle analysis of airborne dust samples collected over Morocco in 2006 during SAMUM 1, Tellus B, 63, 512–530, https://doi.org/10.1111/j.1600-0889.2011.00554.x, 2011. a, b
Schmale, J., Zieger, P., and Ekman, A. M.: Aerosols in current and future Arctic climate, Nat. Clim. Change, 11, 95–105, https://doi.org/10.1038/s41558-020-00969-5, 2021. a
Schulz, M., Prospero, J. M., Baker, A. R., Dentener, F., Ickes, L., Liss, P. S., Mahowald, N. M., Nickovic, S., García-Pando, C. P., Rodríguez, S., Sarin, M., Tegen, I., and Duce, R. A.: Atmospheric Transport and Deposition of Mineral Dust to the Ocean: Implications for Research Needs, Environ. Sci. Technol., 46, 10390–10404, https://doi.org/10.1021/es300073u, 2012. a
Shi, Y., Liu, X., Wu, M., Zhao, X., Ke, Z., and Brown, H.: Relative importance of high-latitude local and long-range-transported dust for Arctic ice-nucleating particles and impacts on Arctic mixed-phase clouds, Atmos. Chem. Phys., 22, 2909–2935, https://doi.org/10.5194/acp-22-2909-2022, 2022. a
Shi, Z., Krom, M. D., Jickells, T. D., Bonneville, S., Carslaw, K. S., Mihalopoulos, N., Baker, A. R., and Benning, L. G.: Impacts on iron solubility in the mineral dust by processes in the source region and the atmosphere: A review, Aeolian Res., 5, 21–42, https://doi.org/10.1016/j.aeolia.2012.03.001, 2012. a
Sokolik, I. N., Toon, O. B., and Bergstrom, R. W.: Modeling the radiative characteristics of airborne mineral aerosols at infrared wavelengths, J. Geophys. Res.-Atmos., 103, 8813–8826, https://doi.org/10.1029/98JD00049, 1998. a
Song, Q., Ginoux, P., Gonçalves Ageitos, M., Miller, R. L., Obiso, V., and Pérez García-Pando, C.: Modeling impacts of dust mineralogy on fast climate response, Atmos. Chem. Phys., 24, 7421–7446, https://doi.org/10.5194/acp-24-7421-2024, 2024. a
Urupina, D., Lasne, J., Romanias, M., Thiery, V., Dagsson-Waldhauserova, P., and Thevenet, F.: Uptake and surface chemistry of SO2 on natural volcanic dusts, Atmos. Environ., 217, 116942, https://doi.org/10.1016/j.atmosenv.2019.116942, 2019. a
van der Does, M., Knippertz, P., Zschenderlein, P., Harrison, R. G., and Stuut, J.-B. W.: The mysterious long-range transport of giant mineral dust particles, Science Advances, 4, eaau2768, https://doi.org/10.1126/sciadv.aau2768, 2018. a
Varga, G., Dagsson-Waldhauserová, P., Gresina, F., and Helgadottir, A.: Saharan dust and giant quartz particle transport towards Iceland, Sci. Rep., 11, 1–12, https://doi.org/10.1038/s41598-021-91481-z, 2021. a
Vogel, A., Diplas, S., Durant, A. J., Azar, A. S., Sunding, M. F., Rose, W. I., Sytchkova, A., Bonadonna, C., Krüger, K., and Stohl, A.: Reference data set of volcanic ash physicochemical and optical properties, J. Geophys. Res.-Atmos., 122, 9485–9514, https://doi.org/10.1002/2016JD026328, 2017. a
Waldhauserova, P., Arnalds, O., Ólafsson, H., Skrabalova, L., Sigurðardóttir, G., Branis, M., Hladil, J., Skala, R., Navratil, T., Chadimova, L., Löwis, S., Thorsteinsson, T., Carlsen, H., and Jónsdóttir, I.: Physical properties of suspended dust during moist and low wind conditions in Iceland, Iceland Agr. Sci., 27, 25–39, 2014. a
Waza, A., Schneiders, K., May, J., Rodríguez, S., Epple, B., and Kandler, K.: Field comparison of dry deposition samplers for collection of atmospheric mineral dust: results from single-particle characterization, Atmos. Meas. Tech., 12, 6647–6665, https://doi.org/10.5194/amt-12-6647-2019, 2019. a
Weinzierl, B., Ansmann, A., Prospero, J. M., Althausen, D., Benker, N., Chouza, F., Dollner, M., Farrell, D., Fomba, W. K., Freudenthaler, V., Gasteiger, J., Groß, S., Haarig, M., Heinold, B., Kandler, K., Kristensen, T. B., Mayol-Bracero, O. L., Müller, T., Reitebuch, O., Sauer, D., Schäfler, A., Schepanski, K., Spanu, A., Tegen, I., Toledano, C., and Walser, A.: The Saharan Aerosol Long-Range Transport and Aerosol–Cloud-Interaction Experiment: Overview and Selected Highlights, B. Am. Meteorol. Soc., 98, 1427–1451, https://doi.org/10.1175/BAMS-D-15-00142.1, 2017. a
Wittmann, M., Groot Zwaaftink, C. D., Steffensen Schmidt, L., Guðmundsson, S., Pálsson, F., Arnalds, O., Björnsson, H., Thorsteinsson, T., and Stohl, A.: Impact of dust deposition on the albedo of Vatnajökull ice cap, Iceland, The Cryosphere, 11, 741–754, https://doi.org/10.5194/tc-11-741-2017, 2017. a
Xi, Y., Xu, C., Downey, A., Stevens, R., Bachelder, J. O., King, J., Hayes, P. L., and Bertram, A. K.: Ice nucleating properties of airborne dust from an actively retreating glacier in Yukon, Canada, Environ. Sci. Atmos., 2, 714–726, https://doi.org/10.1039/D1EA00101A, 2022. a
Yang, W., Marshak, A., Kostinski, A. B., and Várnai, T.: Shape-induced gravitational sorting of Saharan dust during transatlantic voyage: Evidence from CALIOP lidar depolarization measurements, Geophys. Res. Lett., 40, 3281–3286, https://doi.org/10.1002/grl.50603, 2013. a
Yoshida, A., Moteki, N., Ohata, S., Mori, T., Tada, R., Dagsson-Waldhauserová, P., and Kondo, Y.: Detection of light-absorbing iron oxide particles using a modified single-particle soot photometer, Aerosol Sci. Techn., 50, 1–4, https://doi.org/10.1080/02786826.2016.1146402, 2016. a