the Creative Commons Attribution 4.0 License.
the Creative Commons Attribution 4.0 License.
 | 15 Sep 2025
Wildfires heat the middle troposphere over the Himalayas and Tibetan Plateau during the peak of fire season
Qiaomin Pei
Yikun Yang
Annan Chen
Zhiyuan Cong
Haotian Zhang
Guangming Wu
Atmospheric pollution from biomass burning contributes to climatic and cryospheric changes by influencing solar radiation and the albedos of snow and ice surfaces over the Himalayas and Tibetan Plateau (HTP). We utilize long-term Moderate Resolution Imaging Spectroradiometer (MODIS) fire products together with ground-based and satellite-derived aerosol datasets to assess the primary effect of wildfires originating from the southern slopes of the Himalayas on aerosol loading in the HTP. Results reveal consistent interannual and seasonal variation patterns, accompanied by statistically significant correlations between aerosol optical depth (AOD) at 500 nm from AErosol RObotic NETwork (AERONET) stations (Pokhara, Qomolangma (Mt. Everest) Station for Atmospheric and Environmental Observation and Research, Chinese Academy of Sciences (QOMS), Nam Co) and Himalayan fires. Cloud-Aerosol Lidar and Infrared Pathfinder Satellite Observation (CALIPSO) data further indicate elevated smoke aerosol extinction coefficients at altitudes of 6 to 8 km (middle troposphere) in the southern HTP during the peak fire season (March–April) in 2021. The intense wildfire activity in 2021 likely induced mid-tropospheric warming and alterations in the vertical temperature structure, evidenced by a pronounced reduction in the absolute lapse rate, representing the rate of temperature decrease with altitude. This reduction was observed at QOMS, South-East Tibetan plateau Station for integrated observation and research of alpine environment, Chinese Academy of Sciences (SETS), and Naqu stations compared to 2022. Santa Barbara DISORT Atmospheric Radiative Transfer (SBDART) simulations estimated increased heating rates (0.38–1.32 K d−1) and atmospheric warming (15.03–22.43 W m−2) in the mid-troposphere due to smoke aerosols. Such warming affects regional atmospheric stability and modulates surface temperatures (∼0.04 K). It is crucial to conduct further research into the heating/cooling processes induced by aerosols and their influence on the vertical temperature structure to comprehensively understand the impacts of aerosols on regional climate and the hydrological cycle.
- Article
(6953 KB) - Full-text XML
-
Supplement
(1281 KB) - BibTeX
- EndNote


Continued global warming is driving widespread and rapid changes in the atmosphere, oceans, cryosphere, and biosphere (IPCC, 2023a). Aerosols in the atmosphere play one of the main roles in global climate change. Aerosols can impact the Earth's radiative energy budget by altering the scattering and absorption of incoming solar radiation, as well as by affecting cloud properties, including both cloud microphysics and macrophysics (IPCC, 2023b). Specifically, these aerosol effects can lead to large reductions in the amount of solar irradiance reaching Earth's surface, a corresponding increase in solar heating of the atmosphere, and changes in the atmospheric temperature structure (Ramanathan et al., 2001a; Koren et al., 2004). The annual mean aerosol-induced atmospheric heating was observed to be considerable, exceeding 0.5 K d−1 over Asia (Ramachandran et al., 2020), with values ranging from 0.5 to 0.8 K d−1 over the Hindu Kush–Himalaya–Tibetan Plateau region (Ramachandran et al., 2023). This significant aerosol-induced warming has profound implications for both the climate system and the hydrological cycle (Ramachandran et al., 2020).
The Tibetan Plateau and adjacent mountain ranges (including Himalayan, Hindu Kush, and Karakoram) are named the Third Pole because they comprise the largest global store of frozen water outside the polar regions (Yao et al., 2022). It functions as a water distribution system termed the Asian Water Tower (AWT), providing a reliable water supply to almost 2 billion people (Yao et al., 2022; Immerzeel et al., 2010). Snow and glacier melting are crucial hydrologic processes and primary sources of headwaters in these areas, which are highly affected by temperature and precipitation changes linked to climate change (Immerzeel et al., 2010). However, the Himalayas and Tibetan Plateau region (HTP) is sensitive and prone to climate change, experiencing amplified warming at twice the rate of the global average (Krishnan et al., 2019; Chen, 2015). Marked atmospheric warming is leading to strong cryosphere melt and intensification of the water cycle, which are accompanied by a changing environment and ecosystem (Yao et al., 2019). Meanwhile, black carbon (BC) dominates the aerosol absorption over this region (Ramachandran et al., 2020), along with the dust aerosols (Zhao et al., 2020), and its records show a continuous increase since the 1850s in the Tibetan Plateau (Kang et al., 2020). The elevated levels of BC can further enhance regional warming and contribute to an increase in snowmelt and ice discharge (Kang et al., 2020; Ramachandran et al., 2020).
The high BC concentrations over the HTP region were attributed to air pollution transported from South Asia in the previous studies (Li et al., 2016; Lüthi et al., 2015). The northern part of South Asia is known to be the regional hotspot of atmospheric brown clouds (ABCs) (Ramanathan et al., 2007), characterized by high aerosol optical depth (AOD) (Fig. S1 in the Supplement), which are mostly the result of biomass burning and fossil fuel combustion (Ramanathan et al., 2001b). These polluted air masses on the southern side of the Himalayas can be cross-border transported to the Tibetan Plateau via the combination of the westerlies and Indian monsoon (Lüthi et al., 2015; Kang et al., 2019). This phenomenon is substantiated by the presence of elevated concentrations of nitrogenous aerosols (Bhattarai et al., 2023) and carbonaceous aerosols (Cong et al., 2015) on the southern edge of the Tibetan Plateau in the pre-monsoon period (March–May). In particular, biomass burning emissions from South Asia contributed up to 90 % of BC mass over the Tibetan Plateau during the pre-monsoon season (Yang et al., 2021). The biomass burning mainly includes forest fires on the southern slopes of the Himalayas (along the Himalayas in India and Nepal) and agricultural residue burning in the Indo-Gangetic Plain (Fig. 1), both of which are generally pronounced in April every year (Vadrevu et al., 2012; Venkataraman et al., 2006). Aerosols emitted from vegetation burning sources are concentrated in the fire season (October/November to May) along the Himalayas in India and Nepal (Vadrevu et al., 2012; Venkataraman et al., 2006), with more than 80 % of the wildfires occurring from March to May (Bhardwaj et al., 2016; You et al., 2018).
More frequent wildland fires over the Indian and Nepal Himalayas were observed in recent years as a result of climate and land use changes (You and Xu, 2022; Vadrevu et al., 2012; You et al., 2018). The enhanced BC concentrations from more frequent wildfires in the region may further affect meteorological elements (Yang et al., 2021) and destabilize the atmosphere over the Himalayas (You and Xu, 2022). The reduction in net radiation at the near-surface layer caused by BC was reported to range from 8 to 16 W m−2 over the Tibetan Plateau (Yang et al., 2021). Aerosols originating from South Asian biomass burning were estimated using WRF-Chem (Weather Research and Forecasting model coupled with Chemistry), resulting in a surface temperature decrease of 0.06° over the Tibetan Plateau during the pre-monsoon season (Yang et al., 2023). Aerosol effects characterized by high aerosol radiative forcing efficiency and high atmospheric heating rates have also been observed, accounting for >50 % of total warming (aerosols + greenhouse gases) of the lower atmosphere and surface over the HTP region (Ramachandran et al., 2023). Aerosol-induced atmospheric warming can modify regional atmospheric stability and vertical motions, influence large-scale circulation patterns, and disrupt the hydrological cycle, leading to substantial regional climate effects and subsequent impacts (Menon et al., 2002). The “heat-pump” effect of the Tibetan Plateau (Wu et al., 2007) could be enhanced by this warming, potentially intensifying convection and precipitation in the Tibetan Plateau and downstream regions (Lau and Kim, 2018; Zhao et al., 2020). Therefore, it is essential to further evaluate the implications of vertical temperature profiles induced by biomass burning aerosols from South Asia. This is a key factor driving climate change and shaping the hydrological cycle and precipitation patterns over the HTP region (Ramachandran et al., 2023).
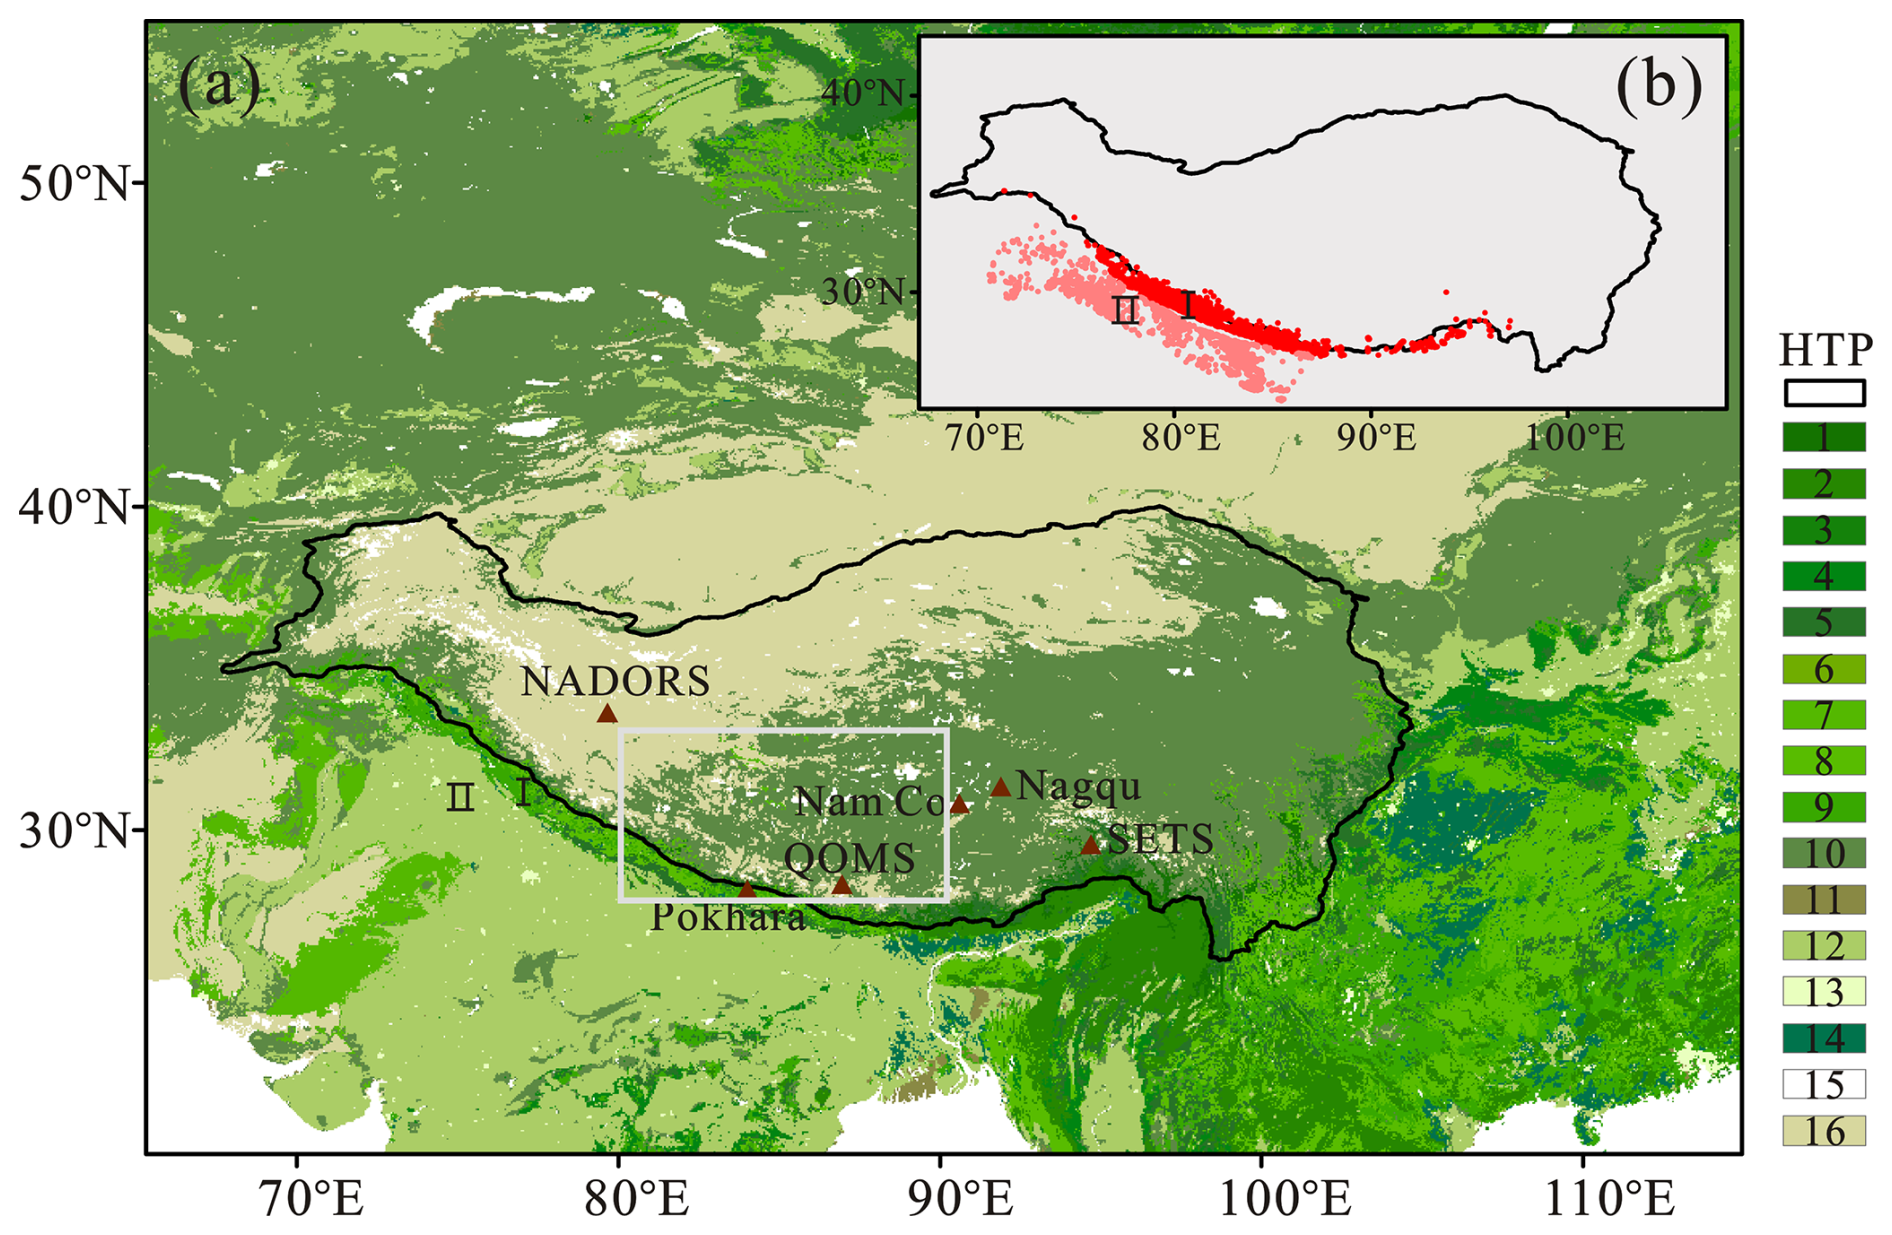
Figure 1Locations of AERONET and MWR stations (Table S1) overlaid with vegetation distribution (a) and fire pixel counts on 16 April 2021, in the two primary biomass burning regions: forest fires in the Himalayas (region I) and agricultural residue burning in the Indo-Gangetic Plain (region II) (b). Vegetation categories: 1–5, Forest; 6–7, Shrublands; 8–9, Savannas; 10, Grasslands; 11, Permanent Wetlands; 12, Croplands; 13, Urban and Built-up Lands; 14, Cropland/Natural Vegetation; 15, Permanent Snow and Ice; 16, Barren.
Most studies have focused on observing the influence of biomass burning from South Asia on the HTP in the last decade. However, there have been limited detailed investigations into distinguishing between the different biomass burning sources, such as agricultural residue burning and wild forest fires, as well as their potential impacts on atmospheric heating over the HTP. This study utilizes multi-year aerosol products from ground-based observations (AErosol RObotic NETwork, AERONET), fire point information from satellite data (Moderate Resolution Imaging Spectroradiometer, MODIS), and the HYSPLIT (HYbrid Single-Particle Lagrangian Integrated Trajectory) model to investigate the primary biomass burning sources influencing the HTP. In addition, this paper provides observational evidence for biomass burning aerosol-induced atmospheric warming in the middle troposphere during fire events over the HTP, using a combination of ground-based measurements (microwave radiometer instrument), satellite-based data (e.g., Cloud-Aerosol Lidar and Infrared Pathfinder Satellite Observation, CALIPSO; Clouds and the Earth's Radiant Energy System, CERES), and modeling tool (Santa Barbara DISORT Atmospheric Radiative Transfer, SBDART). This study presents a pioneering, state-of-the-art analysis of the vertical profile of atmospheric warming associated with the transport of biomass burning aerosols, a crucial aspect for understanding aerosol–atmosphere interactions and aerosol–climate implications over the HTP region.
2.1 Measurement stations
The Nam Co Station for Multisphere Observation and Research, Chinese Academy of Sciences (Nam Co) is located on the southeastern banks of the Nam Co Lake and in the central part of the Tibetan Plateau. The geographic characteristics of the Nam Co region include mountains, glaciers, lakes, rivers, and grasslands and thus can be considered representative of the diversity of the Tibetan Plateau (Wu et al., 2018). The Qomolangma (Mt. Everest) Station for Atmospheric and Environmental Observation and Research, Chinese Academy of Sciences (QOMS) is located at the southern edge of the Tibetan Plateau and at the foot of Mount Everest. Glaciers and high mountain peaks are close to this region (Li et al., 2020). The Pokhara Valley (Pokhara) in the central Himalayas is one of the major metropolitan regions at the foothills of the Hindu Kush Himalaya mountains in Nepal (Ramachandran et al., 2023). QOMS and Pokhara can be taken as representative sites for the Himalayas. Additionally, stations with a microwave radiometer (MWR) installed include the Ngari Desert Observation and Research Station, Chinese Academy of Sciences (NADOR); QOMS; the Naqu Station of Plateau Climate and Environment, Chinese Academy of Sciences (Naqu); and the South-East Tibetan plateau Station for integrated observation and research of alpine environment, Chinese Academy of Sciences (SETS). These stations are distributed across various regions of the Tibetan Plateau, primarily covering the southern and central areas (Fig. 1 and Table S1).
2.2 Ground-based data
The level 2.0 quality-controlled and cloud-screened data of the aerosol spectral deconvolution algorithm (SDA) AOD, particle volume size distribution (dV(r)/dlnr), single-scattering albedo (SSA), and aerosol radiative forcing (ARF) from AERONET version 3 are used in this study. The NASA AERONET is a worldwide ground-based observation network providing long-term and high-quality datasets of aerosol optical, microphysical, and radiative properties. An automatic sun/sky scanning radiometer (CIMEL) measured the solar radiation with a 1.2° full field of view every 15 min at 340, 380, 440, 500, 675, 870, and 1020 nm channels plus a 940 nm water vapor band (Holben et al., 1998). The AERONET retrieved aerosol properties have the highest accuracy for observations when the solar zenith angle is between 50 and 80° (Dubovik et al., 2000), and only the data points in a day that are within this solar zenith angle range are chosen for analyses in the study. The uncertainty of AERONET direct measurement AOD is less than ±0.01 for wavelengths >0.44 µm and is less than ±0.02 for shorter wavelengths (Holben et al., 2001). The error in single-scattering albedo (SSA) is ±0.03 when the AOD at 0.44 µm is >0.2, and errors in the estimates of particle volume size distribution (dV(r)/dlnr) are less than 1/10 of the maximum dV(r)/dlnr values (Dubovik et al., 2000). AERONET ARF values derived for the broadband solar spectrum (0.2–4 µm) are quality controlled, cloud screened, calibrated, and retrieved for a clear-sky atmosphere and for aerosols present in the column (Ramachandran et al., 2023). To ensure that the effect of surface albedo on ARF can be neglected, the spectral average of the surface albedo in the wavelength range of 0.44–1.02 µm is selected to be less than 0.3 for all the sites in the study. Data from all available AERONET sites in the study area (Fig. 1 and Table S1) are used for validation. These datasets are available for free from the AERONET website. Level 1.5 data are used for the period from June 2022 to June 2024 at Pokhara and from September 2017 to May 2024 at Nam Co, due to the unavailability of Level 2.0 data.
The temperature profiles at QOMS, SETS, Naqu, and NADOR in 2021 and 2022 were measured by MWR operating in the K- and V-bands (20–60 GHz) (Ma Yaoming, 2024), which are sensitive to the lower part of the atmosphere. The microwave radiometer instrument used was an MWP967KV temperature, humidity, and liquid profiler, which operates with 8 K-band (22.235, 22.50, 23.035, 23.835, 25.00, 26.235, 28.0, and 30.0 GHz) and 14 V-band (51.25, 51.760, 52.28, 52.8, 53.34, 53.85, 54.4, 54.94, 55.50, 56.02, 56.66, 57.29, 57.96, and 58.80 GHz) microwave channels. It measures the radiation intensity of the sky in 22 different frequency channels. Only the zenith scan data are used to retrieve the thermodynamic profiles of the troposphere up to 10 km, which are normally available every 2 min. The details of data information and quality can be found in Chen et al. (2024).
2.3 Satellite data
The MODIS active fire products are determined using thermal anomalies at 1 km pixels that are burning at the time of overpass under relatively cloud-free conditions using a contextual algorithm. The fire pixel counts and fire radiative power (FRP) covering the Himalayas and Indo-Gangetic Plain regions from NASA, with a confidence level greater than 50 % from January 2011 to June 2024, are used to explore their relationship with AOD.
The Cloud-Aerosol Lidar and Infrared Pathfinder Satellite Observation (CALIPSO) was launched in April 2006, equipped with the Cloud-Aerosol Lidar with Orthogonal Polarization (CALIOP). It observes global aerosol and cloud vertical distributions at 532 and 1064 nm during both day and night (Winker et al., 2010), which provides the aerosol classification from backscatter and depolarization measurements plus some geographical constraints (Omar et al., 2009). The CALIOP level 2 aerosol classification and lidar ratio selection algorithm define six aerosol types: clean marine, dust, polluted continental, clean continental, polluted dust, and smoke (Omar et al., 2009). In this study, the vertical feature mask (VFM) data and Aerosol Profile data from Level 2 profile product Version 4 are used to obtain information about the aerosol/cloud features and aerosol types over the HTP region. Owing to the availability of CALIPSO data through June 2023, our analysis covers the period from 2011 to 2023.
The Clouds and the Earth's Radiant Energy System (CERES) Synoptic Radiative Fluxes product (SYN1deg, edition 4.1) is used to derive the change in the aerosol radiative effect. In the CERES SYN product, radiative transfer calculations are performed using aerosol properties from the Model for Atmospheric Transport and CHemistry (MATCH), which are constrained by observations from MODIS and CERES. Two flux modes are employed: pristine (clear, no aerosols) and clear-sky (clear, with aerosols and cloud-free skies) conditions, both at the surface (SFC) and the top of the atmosphere (TOA) (Ramachandran et al., 2023). ARF is defined as the perturbation of the radiative flux caused by atmospheric aerosols (Dumka et al., 2016). The ARFtoa is estimated by calculating the difference between the net clear-sky and net pristine-sky fluxes at the top of atmosphere. Variations in the shortwave clear-sky outgoing radiation within the CERES dataset are primarily attributed to changes in aerosol conditions (Paulot et al., 2018; Chen et al., 2024), and the ARFatm (atmospheric forcing) is determined as the difference between ARFtoa and ARFsfc (Ramachandran et al., 2023).
2.4 SBDART model and HYSPLIT
SBDART is based on the discrete ordinate approach developed by the University of California, Santa Barbara (Ricchiazzi et al., 1998). The discrete ordinate method is employed to solve the radiative transfer equation for monochromatic, unpolarized radiation within a plane-parallel medium that exhibits scattering, absorption, and emission properties, with a defined bidirectional reflectance at the lower boundary (Stamnes et al., 2000). The SBDART model enables the simulation of plane-parallel radiative transfer for both clear and cloudy atmospheric conditions, spanning the region between the Earth's surface and the top of the atmosphere, including the vertical distribution of aerosols and the heating rates (Rai et al., 2019; Kedia et al., 2010; Dumka et al., 2016; Moorthy et al., 2009). In the present case, the model is run for clear-sky conditions determined in the wavelength range of 0.25–4.0 µm. The mid-latitude winter atmospheric standard profile is selected with input parameters including solar zenith angle, surface temperature, and surface albedo. The average values of SSA, asymmetry parameter, extinction, and AOD at QOMS in April 2021 (Table S2), derived from AERONET, are utilized as inputs for the SBDART model. Building on the methodology of Moorthy et al. (2009) to estimate the uncertainty in ARF and heating rate, we quantified the uncertainties associated with AOD, SSA, and asymmetry parameters. The uncertainties in AOD values, SSA, and asymmetry factor were determined to be ±0.02, ±0.01, and ±0.01, based on empirical data and error analysis. The overall uncertainties in ARF and heating rate calculations using SBDART were approximately 15 % and varied between 5 % and 15 %, respectively, as reported in previous studies on the Central Himalayas and the urban areas of South Asia (Pant et al., 2006; Panicker et al., 2010).
To track the transport of biomass burning aerosols emitted from the Himalayas and the Indo-Gangetic Plain (IGP), we used the HYSPLIT (Version 5.3.0) model to calculate the forward trajectories of the air masses (Stein et al., 2015). The model is driven by the 1° × 1° horizontal resolution meteorological fields from the Global Data Assimilation System operated by NOAA. The 72 h forward trajectories are generated for each source region during the fire events in April and May 2021, with a time resolution of 1 h and a starting altitude of 500 m above ground level.
2.5 Heating rate
The aerosol-induced atmospheric solar heating rate (K d−1) is derived from the aerosol radiative forcing in the atmosphere (ARFatm) (Ramachandran et al., 2023; Chen et al., 2022), which can be defined as the change between the atmospheric forcing with and without aerosols as:
where ARFtoa and ARFsfc are aerosol forcing at the top of atmosphere (TOA) and surface (SFC), F denotes net short-wave radiative flux. Subscripts “aerosol” and “no aerosol” refer to conditions with and without aerosol. This study also employs clear-sky ARF values retrieved from AERONET measurements at both surface and TOA.
ARFatm in W m−2 indicates the amount of radiative flux (energy) due to the presence of aerosols within the atmospheric layers, where positive forcing indicates the warming potential of the atmosphere (Kedia et al., 2010; Rai et al., 2019; Moorthy et al., 2009). The energy that is converted into heat is calculated as heating rate using the following equation:
where is the heating rate (K d−1), g is the acceleration due to gravity (9.8 m s−2), Cp is the specific heat capacity of the air (1006 J kg−1 K−1), and ΔP is the pressure difference between the elevation of the observation site and 10 km above sea level (a.s.l.). This calculation takes into account the mountain peaks in the HTP region, which can reach approximately 9 km a.s.l. (Ramachandran et al., 2023).
3.1 Effect of wildfires on aerosol load over HTP
The AOD represents the vertical integral of aerosol concentration weighted by the effective cross-sectional area of the particles intercepting (by scattering and absorption) the solar radiation at the specific wavelength (Ramanathan et al., 2001a). A long-term record of AOD at 500 nm from AERONET is available for Pokhara (2011–2024), QOMS (2011–2024), and Nam Co (2011–2024), located on the southern slope of the Himalayas, the northern slope of the Himalayas, and within the interior of the Tibetan Plateau, respectively (Fig. 1). Despite some missing days and months in the AOD records for certain years, distinct seasonal variations are clearly observed at three sites, with a pronounced annual peak during the period March–May (Fig. 2). Meanwhile, a spectral deconvolution algorithm was applied to separate AOD into fine- and coarse-mode AOD (O'Neill et al., 2003). Similar annual peaks in fine-mode AOD were observed from March to May; however, no consistent seasonality was found in coarse-mode AOD at any site. Previous studies have demonstrated a similar annual seasonality of total AOD and fine-mode AOD at Nam Co, QOMS, and Pokhara (Li et al., 2020; Ramachandran and Rupakheti, 2021), along with background aerosol loading characterized by annually low baseline AOD values of 0.029 at Nam Co and 0.027 at QOMS (Pokharel et al., 2019). Notably, the peaks of AOD and fine-mode AOD vary among the three sites: Nam Co experienced its peak in 2016, QOMS in 2021 and 2024, and Pokhara in 2016 and 2024, with no data available for Pokhara in 2021. During these extreme peaks, the monthly mean AOD increased by 5 to 10 times relative to the baseline values at Nam Co and QOMS and by up to 50 times at the Pokhara site. This suggests that exogenous aerosols have a more significant influence on the southern slopes of the Himalayas compared to the Tibetan Plateau and the northern slopes of Himalayas.
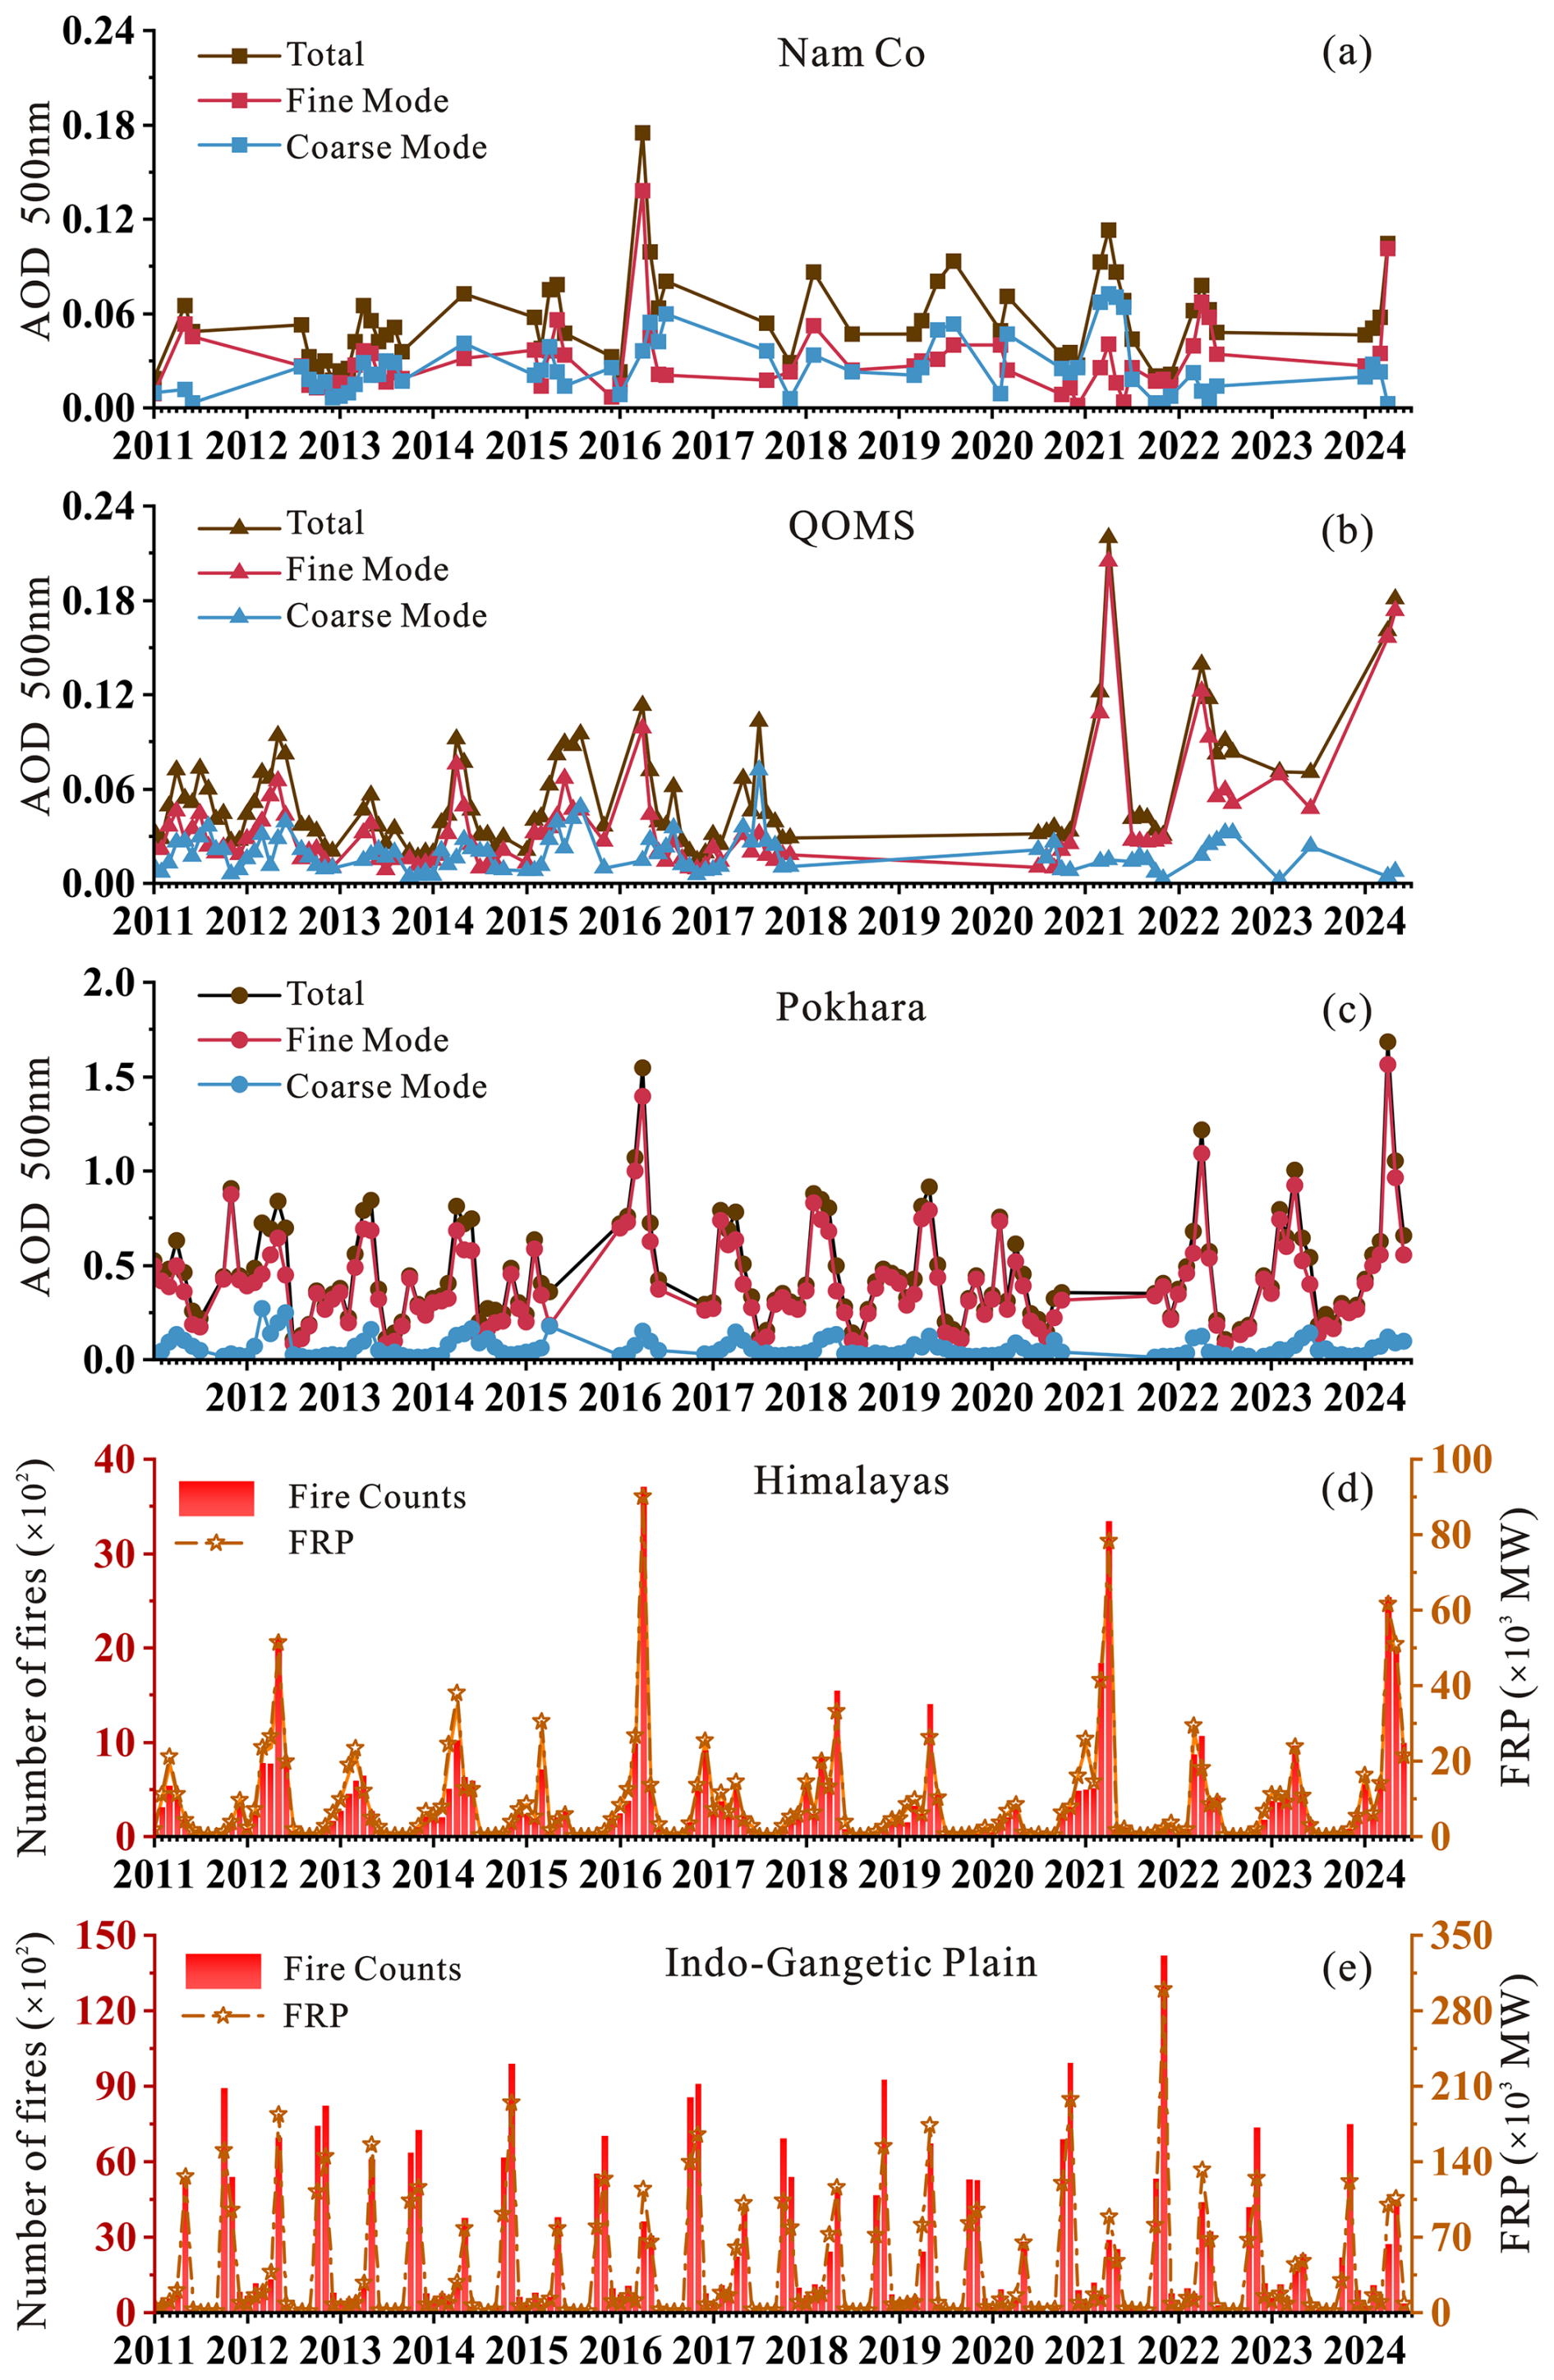
Figure 2Temporal variations of monthly mean AERONET AOD at 500 nm, fine-mode AOD at 500 nm, and coarse-mode AOD at 500 nm at Nam Co (a), QOMS (b), and Pokhara (c); and time series of the monthly average number of fires and FRP from the MODIS Active Fire Product over the Himalayas (d) and the Indo-Gangetic Plain (e).
The fire pixel counts and FRP values provide information about the fire frequencies and emissions. The monthly total fire pixel counts and FRP from January 2011 to June 2024 over the Himalayas and Indo-Gangetic Plain were detected by MODIS with a confidence level exceeding 50 %, exhibiting similar interannual and seasonal patterns in both regions (Fig. 2). In the Himalayas, fire activity exhibits a single annual peak occurring between March and May, whereas the Indo-Gangetic Plain demonstrates a bimodal pattern with two distinct peaks, one in April/May and the other in October/November, corresponding to the two major harvest seasons (Venkataraman et al., 2006). The fire pixel counts showed notable occurrences during the fire seasons of 2016, 2021, and 2024 in the Himalayas, with total numbers of 5427, 5700, and 5534, respectively. The three peaks in fire pixel counts are consistent with the high concentrations of fine-mode aerosols observed in April at QOMS. In contrast, a relatively high value of fire pixel counts and FRP was observed in November 2021 in the Indo-Gangetic Plain region. The wildfires in the Himalayas exhibit pronounced interannual variability, whereas the interannual fluctuations in the Indo-Gangetic Plain are relatively stable, primarily influenced by anthropogenic agricultural activities (Vadrevu et al., 2012; Kaskaoutis et al., 2014).
The long-term temporal variations in the number of active fires and FRP over the Himalayas present a distinct consistency with the temporal variations in total AOD and fine-mode AOD, at the Nam Co, QOMS, and Pokhara sites (Fig. 2). There are significant positive correlations between the fire pixel counts over the Himalayas and AOD at Pokhara (r=0.76, p<0.001), QOMS (r=0.71, p<0.001), and Nam Co (r=0.69, p<0.001) for the whole study period (2011–2024). Additionally, the fine-mode AOD variations at these three sites are also well correlated with fire pixel counts over the Himalayas (Pokhara: r=0.73, p<0.001; QOMS: r=0.80, p<0.001; and Nam Co: r=0.68, p<0.001; Fig. 3). However, a weak relationship exists between the fine-mode AOD at Pokhara and fire pixel counts over the IGP (r=0.23, p<0.001), and no correlation was observed between fire pixel counts over the IGP and fine-mode AOD at both Nam Co and QOMS (Fig. 3). Similar influences of forest fires and agricultural residue fires on aerosol properties at Pokhara were investigated by Ramachandran and Rupakheti (2021). In our study, these relationships suggest that the aerosol loading in the HTP region, particularly fine particles, is primarily influenced by wildfires occurring on the southern slopes of the Himalayas. Moreover, the monthly average aerosol volume size distributions for April from 2011 to 2024 at QOMS are presented in Fig. S2. In general, the aerosol particle size distributions show a bimodal lognormal pattern with a radius smaller than 0.6 µm as fine-mode aerosol and with a radius larger than 0.6 µm as coarse-mode aerosol (X. Yang et al., 2021; Zheng et al., 2017). It is clear that the volume sizes with peak volume concentrations for fine-mode aerosols in April were higher in 2016, 2021, and 2024 than in other years at QOMS (Fig. S2). The years characterized by elevated fine-mode aerosol levels correspond to the periods with maximum AOD and fine-mode AOD values discussed in the preceding paragraph. The peak volume concentrations of fine-mode aerosols were the highest in 2021, with values of 0.024 µm3 µm−2. The result is consistent with the previous study of biomass burning events at Nam Co and QOMS stations (Pokharel et al., 2019), which supports the prevalence of high fine-mode AOD and fine particles associated with biomass burning during the pre-monsoon. There were also maximum values of fine-mode AOD which were attributed to fine particles generated by biomass burning during extreme fire events in Australia (Yang et al., 2021). Therefore, this indicates that fine-mode volume concentrations significantly increased during wildfire seasons.
Additionally, 72-h forward trajectories were obtained via the HYSPLIT model for each of the 30 d in April and May, with starting points at sites located on the southern slopes of the Himalayas and within the IGP region. The results indicate that the Tibetan Plateau predominately receives air masses originating from the southern slopes of the Himalayas in April (accounting for 26 to 28 out of 30 d) and May (approximately 29 out of 30 d), rather than from the IGP region (Fig. S3). Additionally, an increase in levoglucosan recorded in the Zangsegangri (ZSGR) ice core from the Tibetan Plateau was also attributed to wildfires, which are associated with the higher FRP levels compared to those from anthropogenic burning (You et al., 2018). In our study, monthly mean FRP values on the southern slopes of the Himalayas are significantly higher than those from the IGP over the period from 2011 to 2024 (Fig. S4). Thus, wildfires occurring on the southern slopes of the Himalayas act as the principal driver of aerosol loading over the HTP region. Various types of biomass sources could exert distinct effects on atmospheric heating over the HTP. We analyze the impacts of wildfires on the HTP during the fire season, whereas the influence of biomass burning from the IGP warrants further detailed investigation in future research.
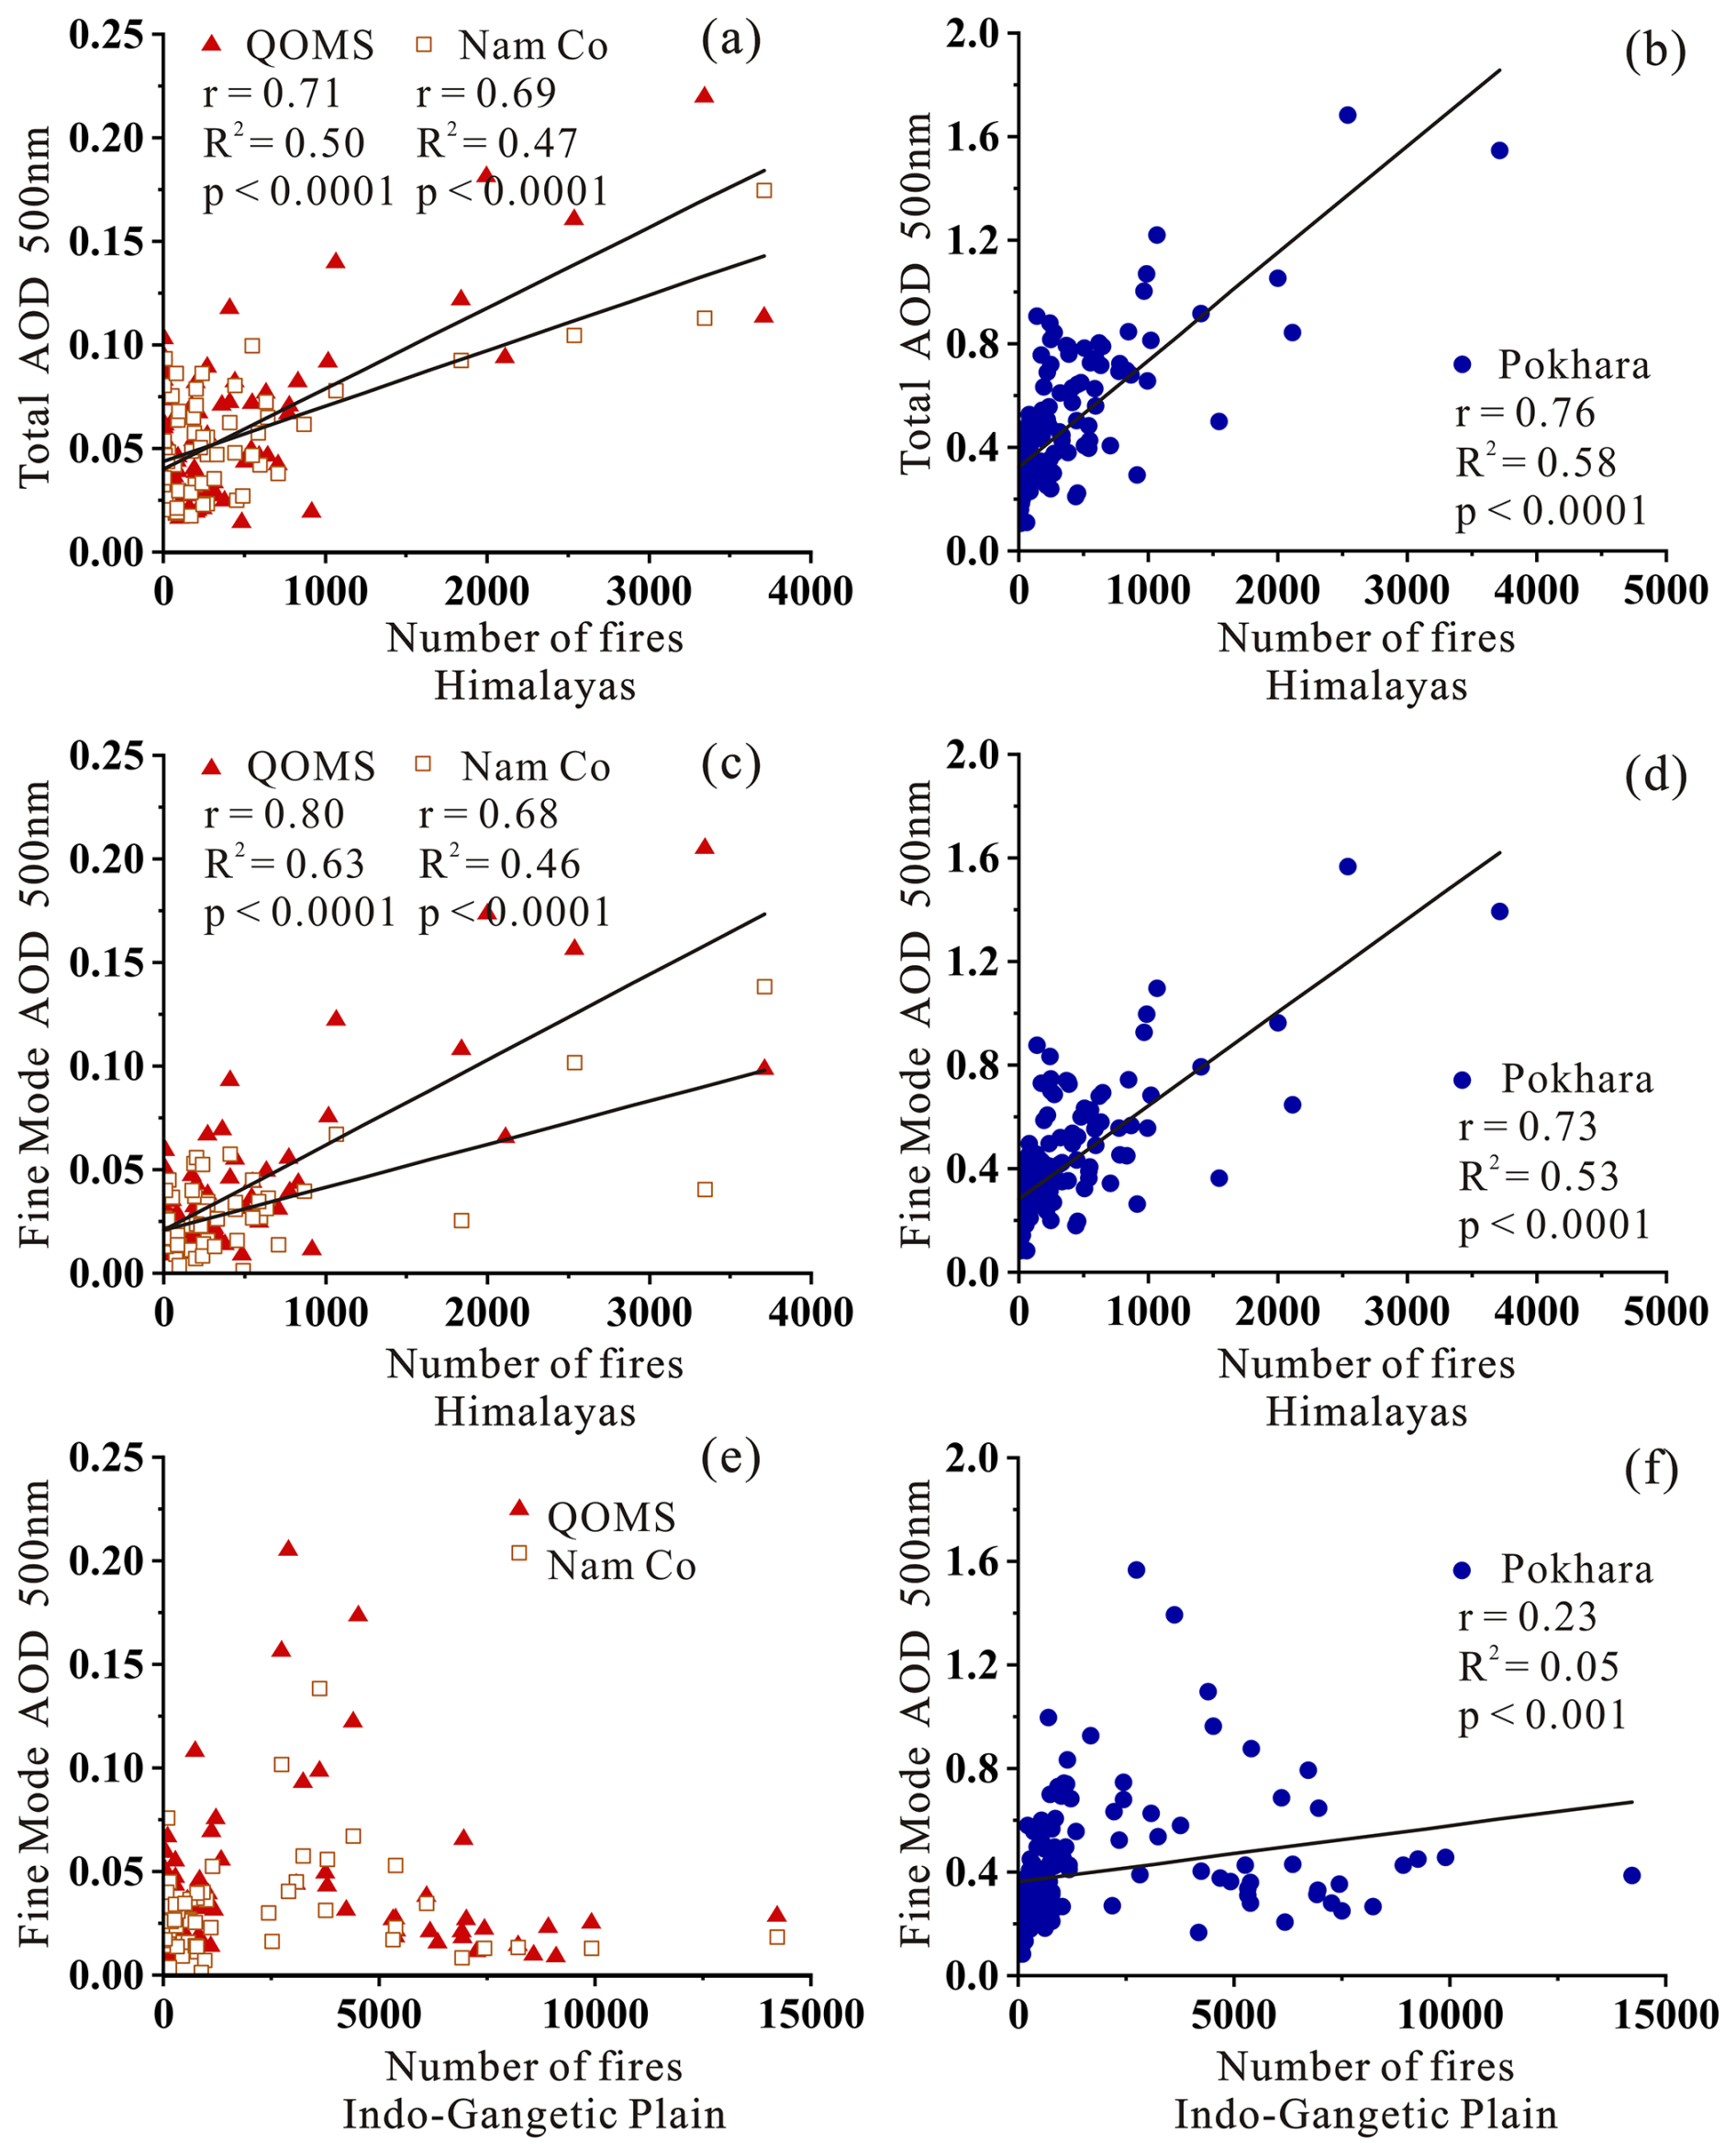
Figure 3Correlations between monthly AOD at 500 nm at QOMS, Nam Co, and Pokhara and monthly fire pixel counts over the Himalayas (a–d) and the Indo-Gangetic Plain (e–f).
3.2 The increasing temperature in the middle troposphere associated with smoke
The extinction properties of the five aerosol types (dust, smoke, clean continental, polluted dust, and polluted continental), along with the annual mean extinction values for all aerosol types from 2011 to 2023 during peak fire season (March and April), were extracted from the CALIPSO L2 aerosol profile product for the selected study domain in the HTP (gray rectangle in Fig. 1). The extinction coefficient of smoke aerosols in 2021 was significantly larger than that in other years (Fig. 4), which corresponds to the interannual variations in fires across the Himalayas. Figure 5 shows the extinction coefficient and occurrence frequency of each aerosol type in March and April from 2021 to 2023 for the same selected region. During the peak of fire season, smoke was abundant at heights from roughly 6 to 8 km and showed a similarly larger extinction coefficient at these heights in 2021 compared to other years. However, the occurrence frequencies of smoke are distinct in different years, which may be correlated with the classes and intensity of wildfires in the Himalayas. Meanwhile, CALIPSO observations taken on 12, 15, and 28 April 2021 over the HTP region revealed the cloud/aerosol mask and distribution of the aerosol types (Figs. 6 and S5). During these observations, smoke was the dominant aerosol type at altitudes between 6 and 10 km in the mid-troposphere over the Himalayas and the southern Tibetan Plateau. In specific conditions, mixtures of dust and smoke were frequently classified as polluted dust (Kim et al., 2018; Omar et al., 2009), which verifies the significant similarity between polluted dust layers and smoke layers on 28 April 2021. The similar vertical distribution of smoke aerosol was also reported, suggesting that wildfire emissions from crown fires in the forest canopy can reach altitudes exceeding 5 km and up to 8–9 km in the mid-troposphere and can sometimes even be uplifted to the free troposphere and lower stratosphere under strong thermal convection in the Himalayas (Vadrevu et al., 2012). Additionally, dust aerosols, as another major aerosol type in the HTP, are identified in Figs. 4 and 5. These aerosols are mainly influenced by dust emissions originating from Northwest India, Pakistan, and the plateau itself (Kang et al., 2019; Liu et al., 2008). The temporal variations of dust aerosols are linked to dust events, which are primarily governed by complex factors including surface wind fields, vegetation cover, and the westerly jet (Kang et al., 2016).
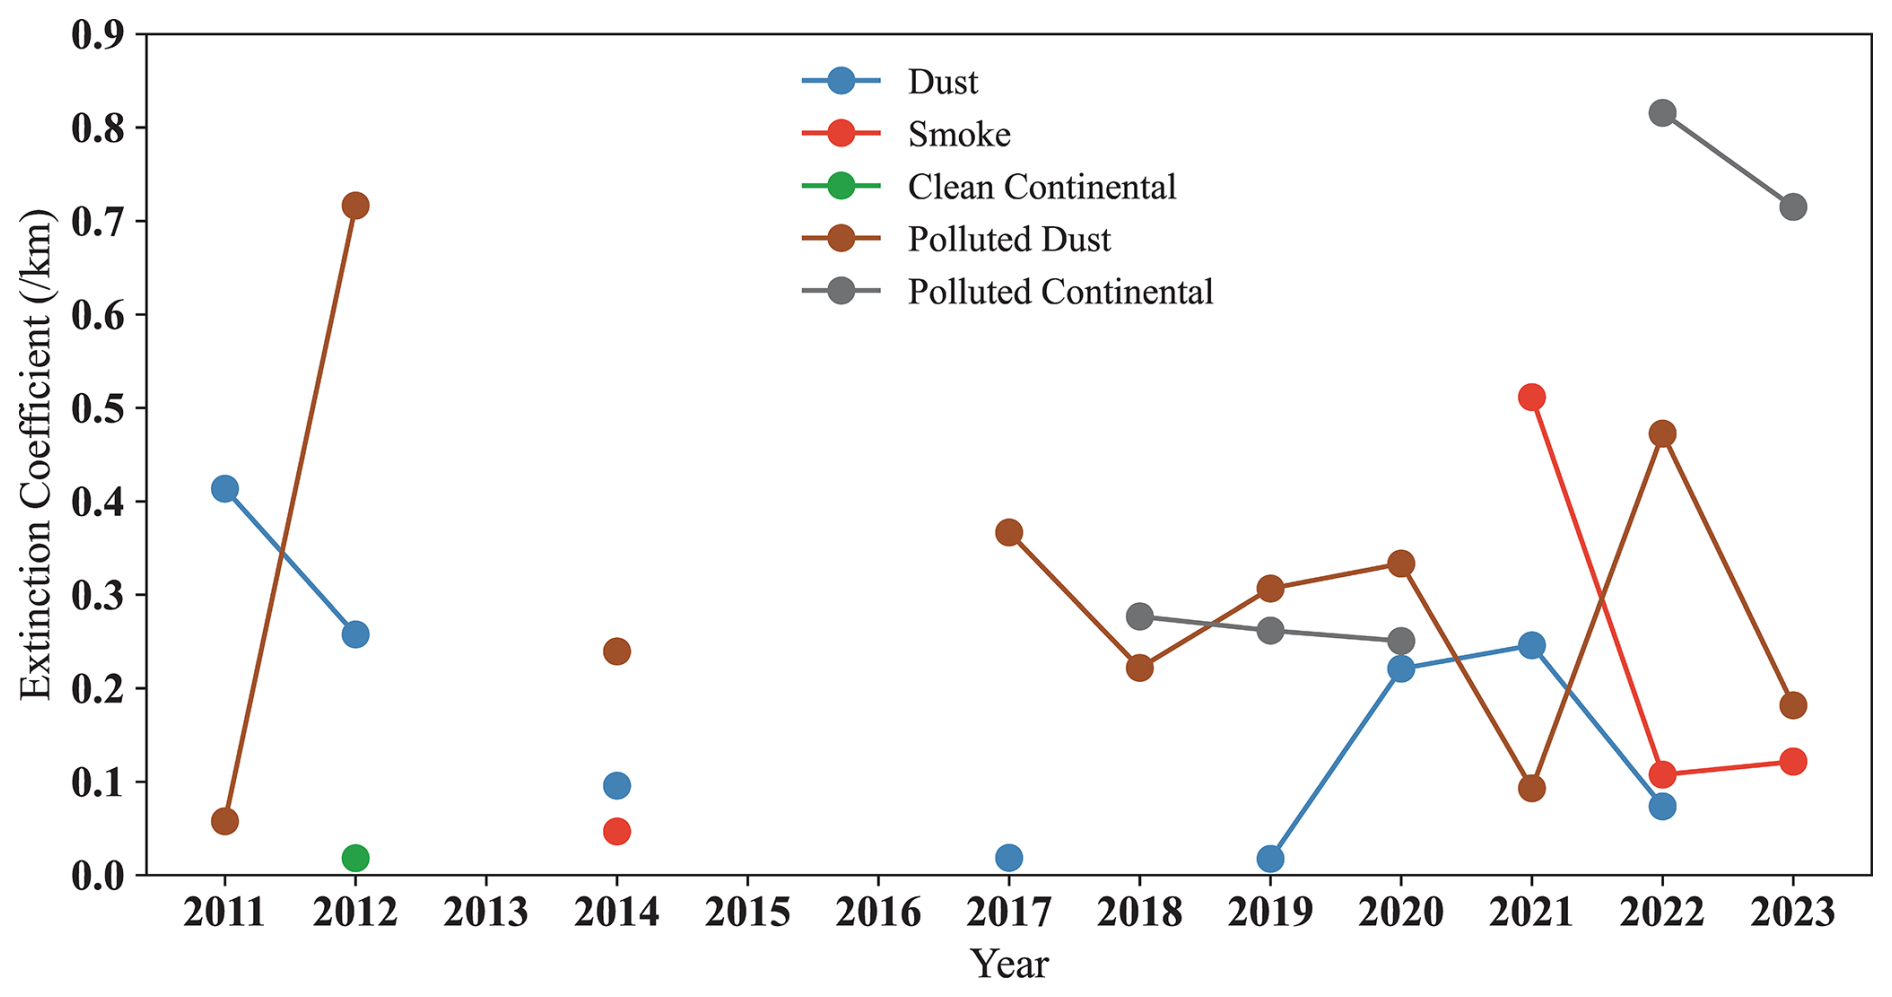
Figure 4Averaged aerosol extinction coefficient at 532 nm for March and April from 2011 to 2023 over the southern HTP (gray rectangle in Fig. 1).
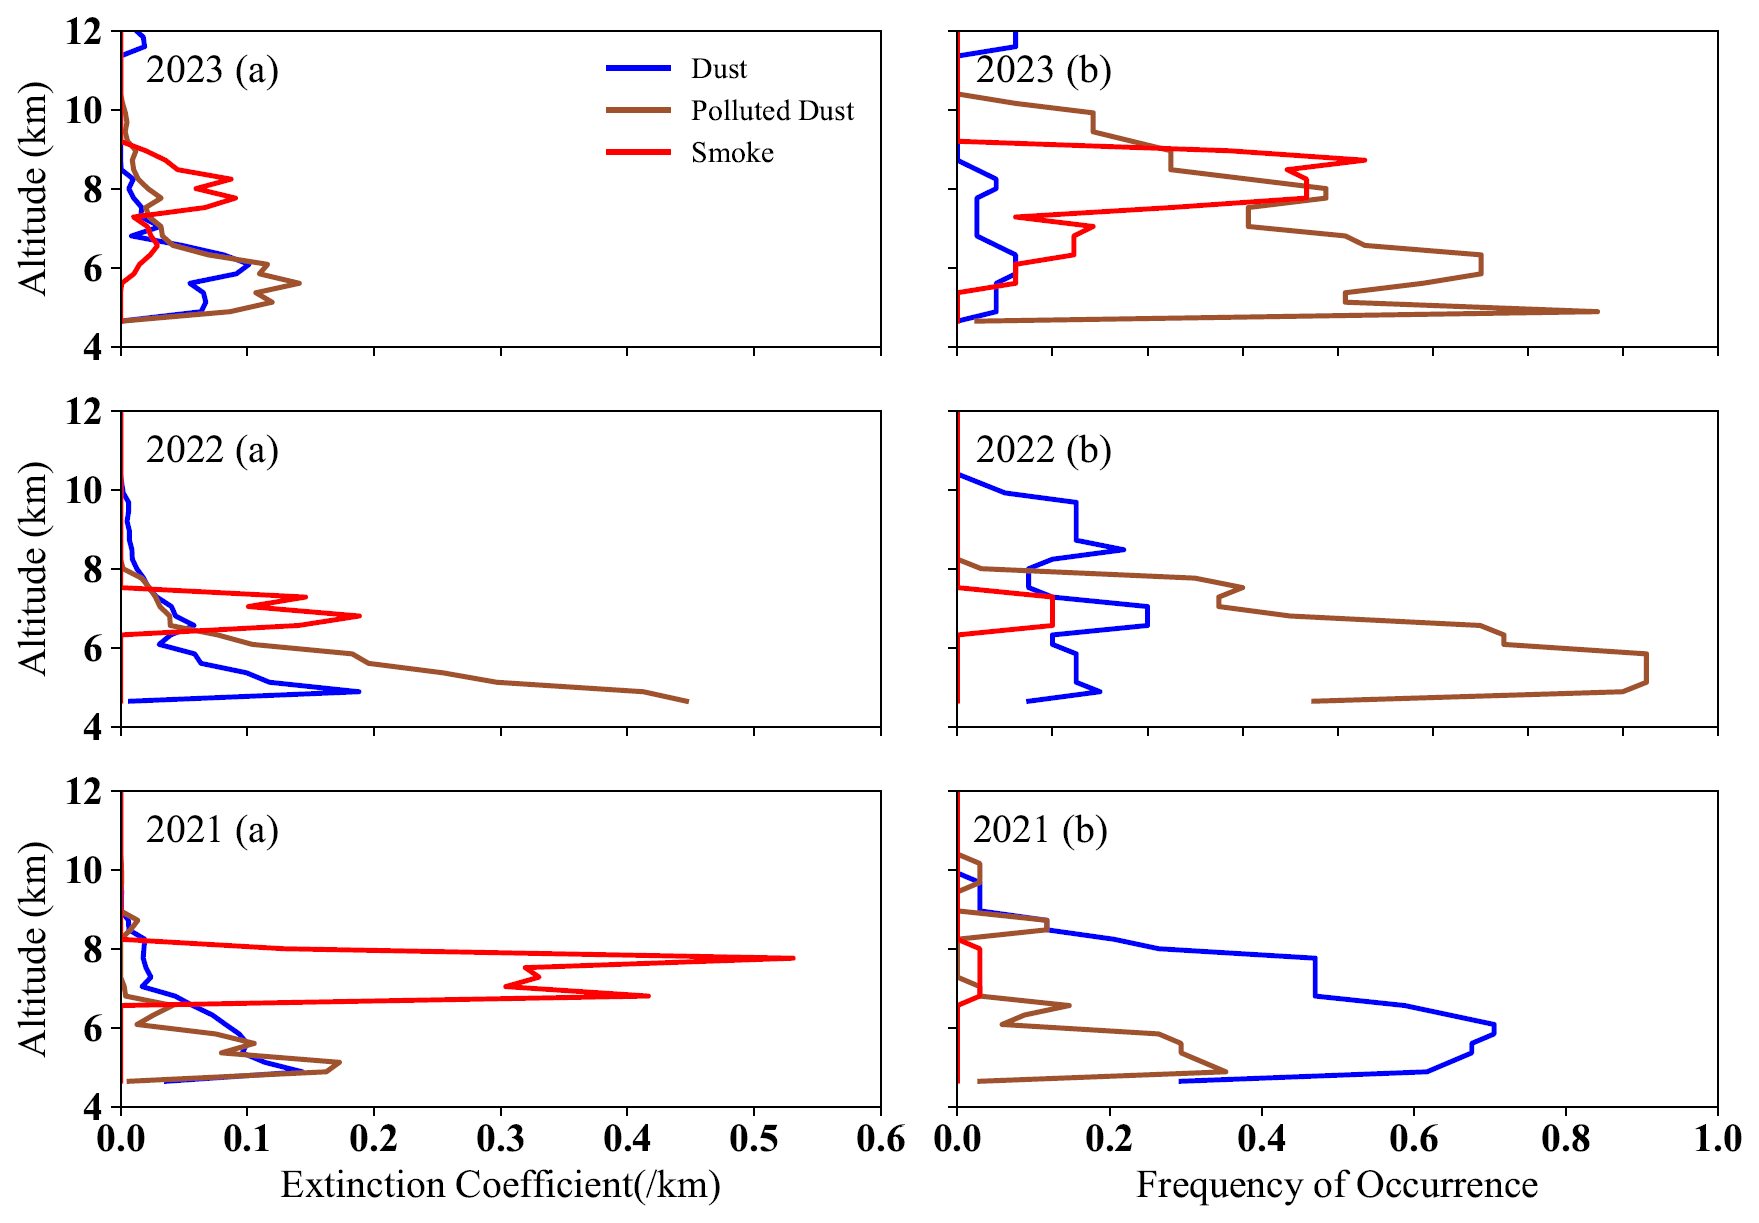
Figure 5The vertical distribution of averaged aerosol extinction coefficient at 532 nm (a) and occurrence frequency profile of each aerosol type (b) during the peak of the fire season (March and April) from 2021 to 2023 over the southern HTP (gray rectangle in Fig. 1).
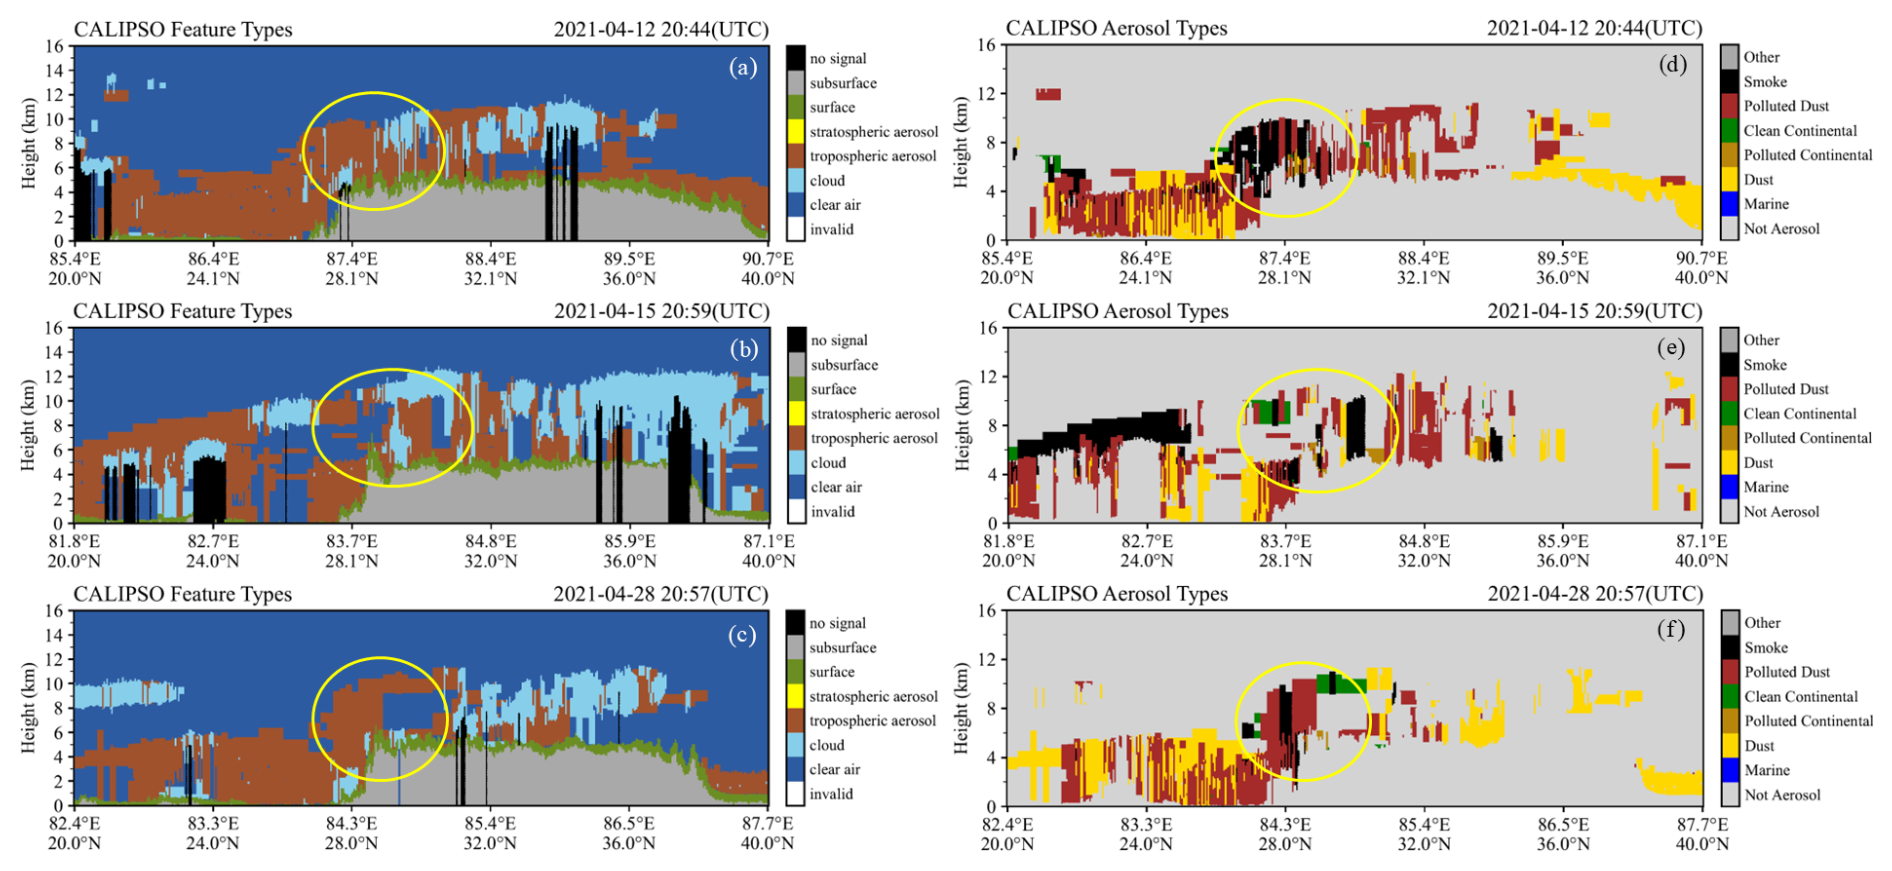
Figure 6(a–c) Vertical feature mask (VFM) indicating the primary layer type (aerosol or cloud) and (d–f) VFM for aerosol layers indicating aerosol subtypes (CALIPSO observations over the HTP region on 12, 15, and 28 April 2021 are shown in Fig. S5).
Wildfire smoke particles, mainly consisting of organic carbon (OC) and black carbon (BC) (Andreae, 2019), have the capacity to absorb solar radiation and contribute to stratospheric warming when injected into the stratosphere (Yu et al., 2021; Stocker et al., 2021). Observations and modeling of absorbing aerosols originating from smoke or urban air pollution have revealed their ability to warm the atmosphere while reducing the amount of sunlight reaching the Earth's surface (Satheesh and Ramanathan, 2000; Koren et al., 2004). At QOMS, the mean SSA values in April are 0.87, 0.87, 0.85, and 0.83 at wavelengths of 0.44, 0.675, 0.87, and 1.02 µm (Table S2), respectively. Low SSA values were also detected at Pokhara, with most values around 0.9 (Fig. S6), which may be attributed to high BC concentrations (Ramachandran et al., 2020), indicating a tendency toward a warming effect (Li et al., 2022; Liu, 2005). In addition, the lower SSA values (<0.8) were measured at observation sites located in the Tibetan Plateau (Wang et al., 2024; Tian et al., 2023), suggesting stronger aerosol absorption and a significant aerosol warming effect. In the study, smoke aerosols were predominantly observed at altitudes between 6 and 8 km in the middle troposphere over the southern HTP area during the peak fire season. We investigated the vertical temperature structure by assessing the rate of decrease in temperature with increasing altitude during March and April for 2021 (a year marked by intense wildfires) and 2022 (a year with relatively weak wildfires). The temperature profiles at QOMS, SETS, and Naqu stations exhibit smaller absolute values of slope K in 2021 compared to those in 2022, excluding the NADOR data (Fig. 7). This suggests that the intense wildfire activity influences the temperature structure, resulting in a reduced vertical temperature lapse rate, likely due to the warming effect of smoke in the middle troposphere. As a result of restricted transport pathways (Fig. S3), the impact of smoke on the thermal structure is reduced at the NADOR site, which is situated in the southwest of the HTP (Fig. 1).
To elucidate the effect of smoke layers on the aerosol radiative forcing, we used the realistic CALIPSO smoke extinction profiles (Fig. 5) and calculated the heating rates using the SBDART model in both cases, with and without measured vertical profiles (Rai et al., 2019; Kedia et al., 2010; Dumka et al., 2016; Moorthy et al., 2009). The heating rates obtained by including smoke aerosol vertical profiles exhibit structures consistent with aerosol extinction at different altitudes observed and present higher values than those in the case without aerosol vertical profiles (Fig. 8). In the 2021 case, the presence of smoke aerosols results in an enhanced atmospheric absorption, leading to layer warming, with heating rate reaching up to 1.66±0.09 K d−1 at the 6 to 8 km level (in the middle troposphere) (Fig. 8a). Especially, these heating rates at the smoke layer with different aerosol extinctions exhibit differences, with increases of 0.61–1.32 K d−1 in the 2021 case, 0.38–0.67 K d−1 in the 2022 case, and 0.51–0.74 K d−1 in the 2023 case in the middle troposphere, compared to the scenario without smoke aerosols. The results demonstrate a substantial absorption of solar shortwave radiation by smoke aerosols, which is consistent with the heating rate values (∼0.5 to 1.9 K d−1) reported in previous studies (Dumka et al., 2016), where a significant contribution of the BC fraction was identified. This is also comparable to previously reported values ranging from 0.45 to 0.7 K d−1 due to BC within the so-called “atmospheric brown clouds” (ABCs) between 500 and 3000 m a.s.l. over the Indian Ocean in March 2006 (Ramanathan et al., 2007). The average heating rate of smoke aerosols, modeled by SBDART, is 0.64±0.25 K d−1, which is slightly higher than the mean value for March and April (0.41±0.49 K d−1) from 2011 to 2023 at QOMS, but lower than the corresponding average for March and April (1.13±0.57 K d−1) at Pokhara (Table S3), both of which were retrieved from AERONET. Indeed, the solar heating rates associated with smoke are elevated over the HTP region, as evidenced by both model simulations and observational measurements.
However, the heating rate near the surface (∼1.12 K d−1) is less than that (∼1.16 K d−1) in the case without smoke aerosol (Fig. 8a), indicating a potential cooling of ∼0.04 K near the ground. This may be attributed to the reduction in solar radiation reaching the surface due to solar absorption by the smoke layer (Ramanathan et al., 2001a) in the middle troposphere, which subsequently alters air temperature near the ground (Liu, 2005). Here, the net shortwave radiation flux at the surface is notably reduced with the smoke layer compared to the net radiation flux simulated in the absence of smoke aerosol vertical profiles (Fig. 8b). The ARF profiles are influenced by the vertical distribution of aerosols, presenting a markedly different pattern in the 2021 case due to the high AOD of the smoke layer (Fig. 8c). The ARF above the smoke layer is approximately −14.05, −8.94, and −9.52 W m−2 in the 2021, 2022, and 2023 cases, respectively. The ARF values below the smoke layer are found to be −36.48, −23.97, and −24.86 W m−2 for the same cases, respectively. The average atmospheric warming of the smoke layer is about 15.03 to 22.43 W m−2, suggesting a reduction in solar flux at the surface caused by the absorption of smoke aerosols. The observed atmospheric warming and heating rates of the smoke aerosols are consistent with the radiative effects (5.85–21.56 W m−2) and heating rates (0.37–1.71 K d−1) of BC from in situ aircraft observations (Lu et al., 2020).
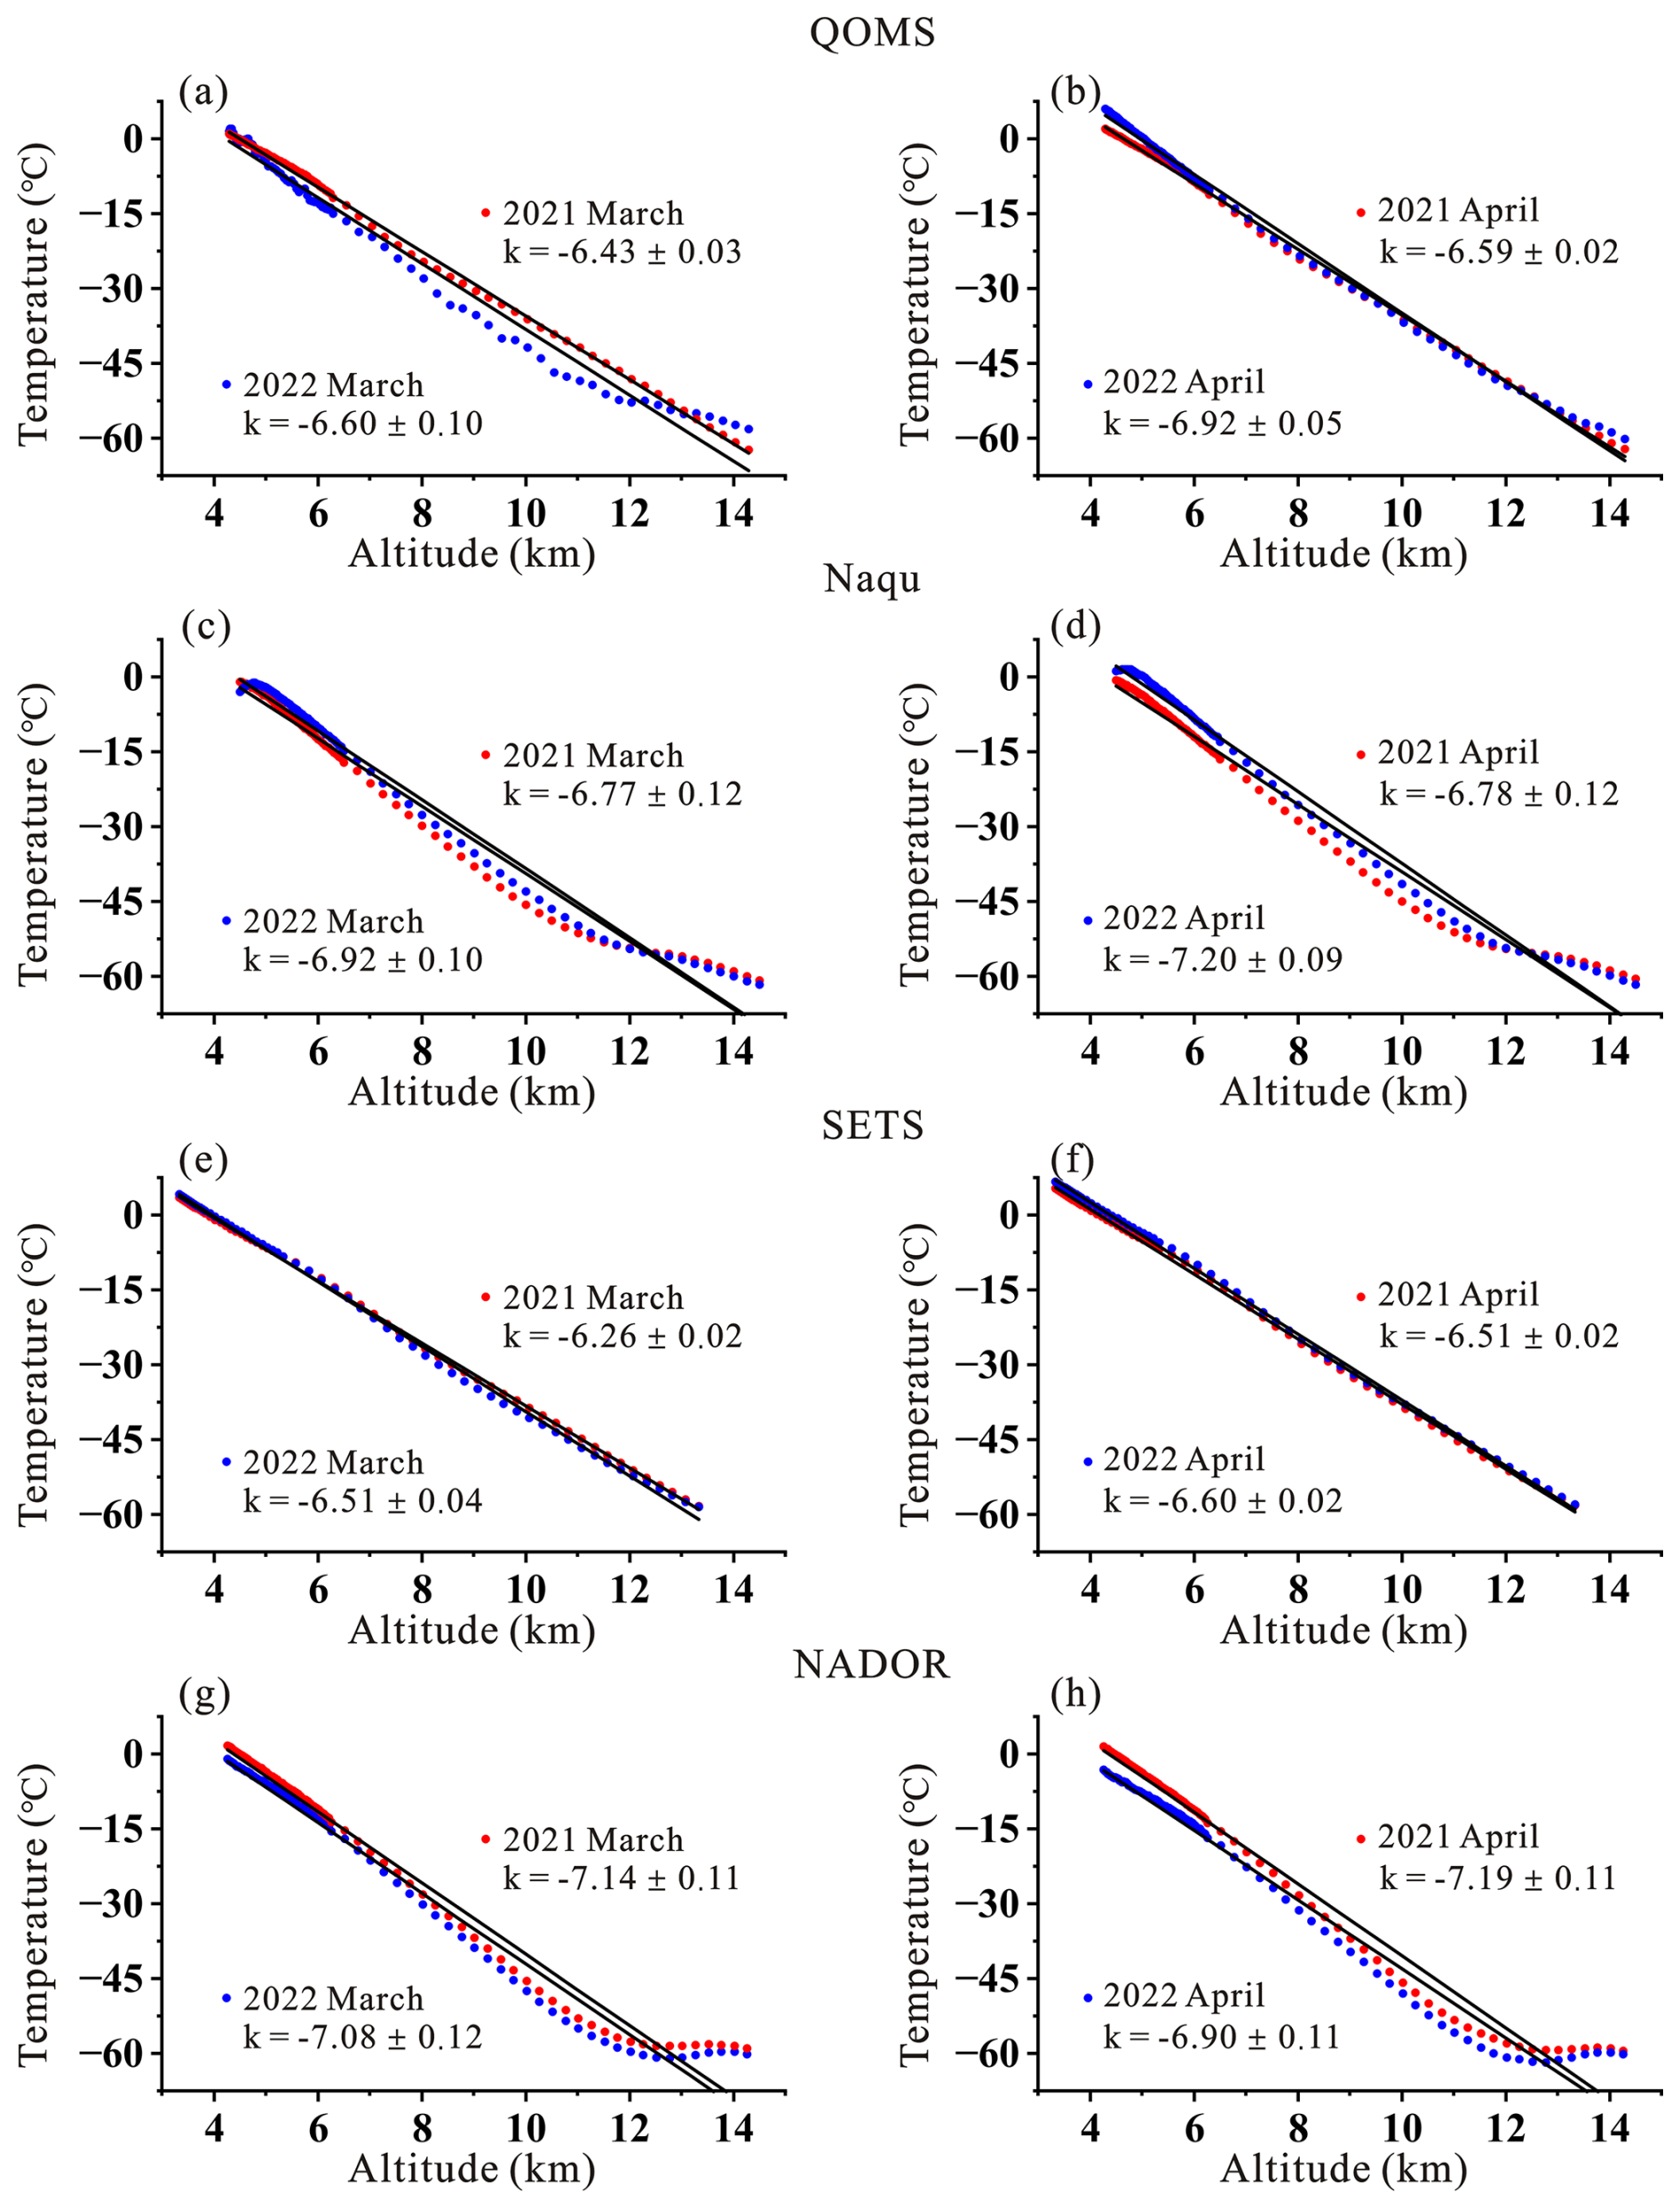
Figure 7Temperature lapse rates with increasing altitude observed at the QOMS, SETS, Naqu, and NADOR stations during March and April of 2021 and 2022.
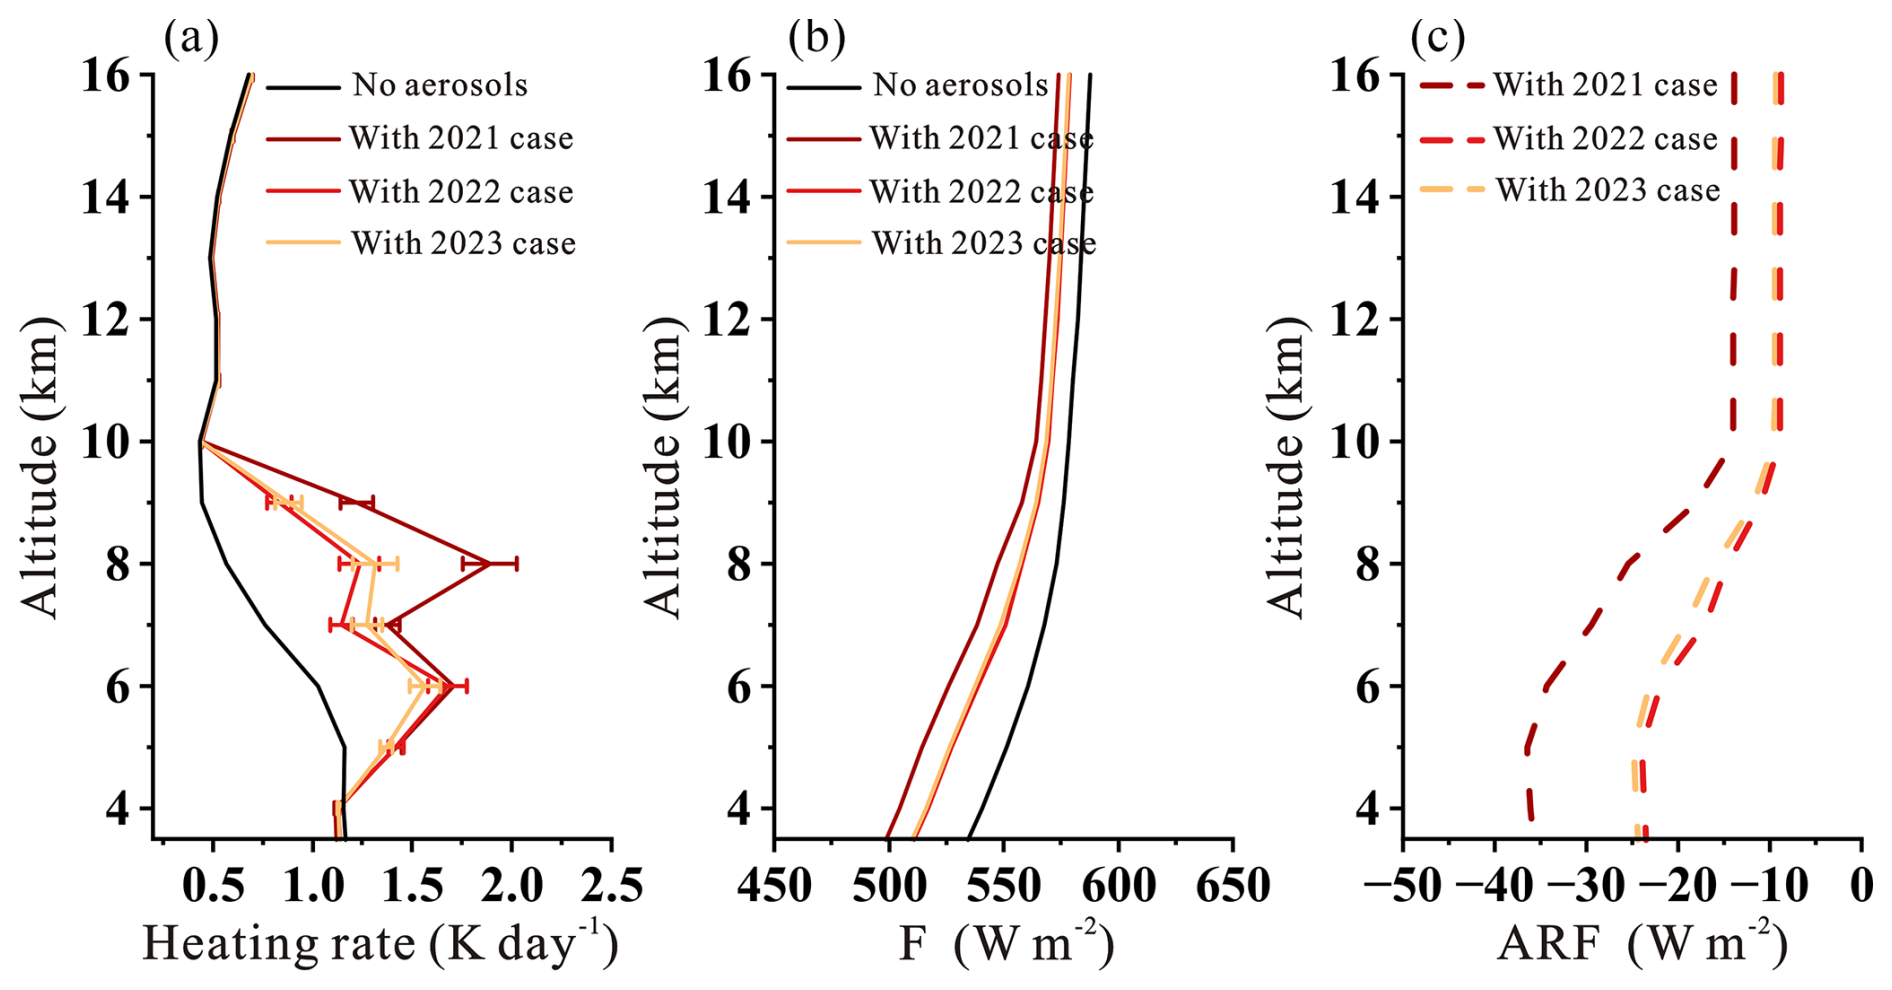
Figure 8Vertical profiles of heating rate (a), net downward radiation flux F (b), and ARF (c) without and with aerosol vertical profiles (2021 case, 2022 case, and 2023 case), simulated with the SBDART model.
Meanwhile, CERES satellite-derived ARF in the atmosphere was studied by Ramachandran et al. (2023), showing positive forcing of atmospheric aerosols over the IGP and Himalayas. In this study, we focus on extreme wildfire events and calculate the anomaly in ARFatm values during the peak of the fire season. The anomaly is determined by subtracting the monthly mean ARFatm for April across all other years (2011 to 2024) from the monthly mean ARFatm values in the wildfire event years. Positive anomalies in ARFatm values are observed over the southern part of the HTP region (Fig. 9), indicating that the intense smoke emitted by wildfires on the southern slopes of the Himalayas exerts positive radiative forcing on the atmosphere, potentially contributing to atmospheric warming. It should be noted that the aerosol radiative forcing data from CERES represent the radiative characteristics of all aerosols in the atmosphere, which are not limited to smoke aerosol but also encompass the effects of other aerosol types. As a result, the values exhibit a broad range of variability.
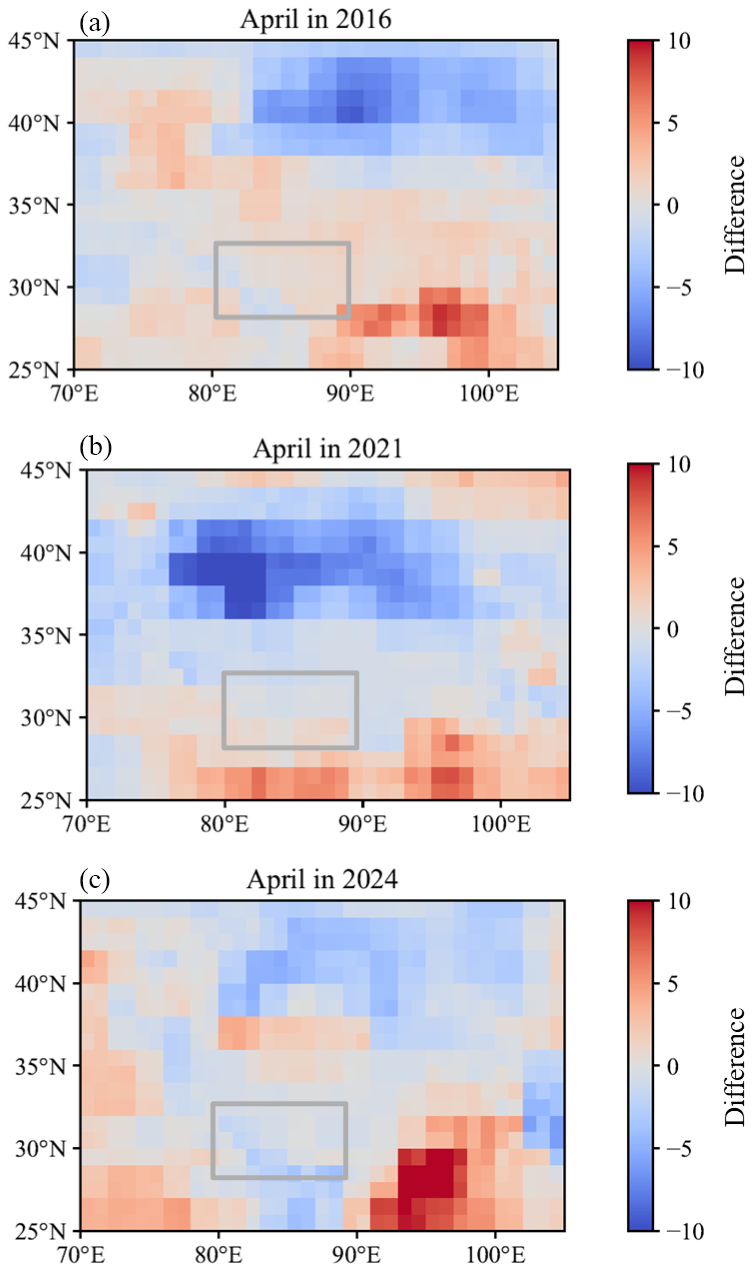
Figure 9CERES satellite-derived differences in ARF (W m−2) between intense wildfire events (2016 (a), 2021 (b), and 2024 (c)) and the April monthly averages for the other years from 2011 to 2024.
Incorporating long-term MODIS fire products, ground-based and satellite-derived aerosol datasets, and model simulations, this study investigates the predominant biomass burning species affecting the HTP region and their potential impact on atmospheric warming. The AOD at 500 nm from AERONET sites in Pokhara, QOMS, and Nam Co displayed distinct interannual and seasonal patterns, correlating with fire pixel counts and FRP, particularly peaking from March to May with notable fire events in 2016, 2021, and 2024. Strong positive correlations were observed between the Himalayas' fire pixel counts and both total AOD and fine-mode AOD at Pokhara (r=0.76 and r=0.73, respectively; p<0.001) and Nam Co (r=0.69 and r=0.68, respectively; p<0.001) throughout the 2011–2024 period. Conversely, no consistent trends or significant correlations were detected over the IGP. Combined with forward trajectory analyses, these findings indicate that wildfires on the southern slopes of the Himalayas are the primary driver of aerosol loading over the HTP region.
For the southern HTP region, multi-year-average extinction values of various aerosol types during peak fire seasons (March and April, 2011–2023) were derived from the CALIPSO L2 aerosol profile product. The extinction coefficient of smoke aerosol was markedly higher in 2021, corresponding with the interannual variability in fire pixel counts. During the peak fire season, smoke was especially abundant at altitudes of 6–8 km in the mid-troposphere, with elevated extinction coefficients in 2021. CALIPSO observations during specific wildfire events indicated that smoke aerosols were the major aerosol type at altitudes of 6–10 km. The intense wildfire activity in 2021 likely raised the mid-tropospheric temperatures and altered the vertical temperature structure, as reflected in reduced absolute temperature lapse rate values (slope K), the rate at which temperature decreases with increasing altitude, observed at the QOMS, SETS, and Naqu stations compared to 2022. Utilizing realistic CALIPSO-derived smoke extinction profiles, heating rates were calculated with the SBDART model under scenarios with and without smoke aerosols. The presence of smoke aerosols enhanced atmospheric absorption, leading to layer warming with the heating rate increasing by 0.38 to 1.32 K d−1 (mean = 0.64±0.25 K d−1) in the middle troposphere compared to the scenario without smoke aerosols. Additionally, average warming within the smoke layer was approximately 15.03–22.43 W m−2, supported by the low SSA values observed at QOMS and Pokhara sites, highlighting the warming effect of smoke aerosols.
The impact of aerosols is important for climate change, the hydrological cycle, and the cryosphere in the HTP region. The mid-troposphere warming induced by smoke aerosols, as observed in our study, is a significant factor contributing to changes in regional atmospheric stability and modulating surface temperatures. This warming is also expected to influence the melting dynamics of snowpacks and glaciers, as well as precipitation patterns, thereby impacting water availability and quality in the AWT to some extent. A more comprehensive investigation into the atmospheric heating and cooling processes induced by various aerosol types, along with the corresponding vertical temperature structure in the HTP, is crucial for advancing our understanding of how the climate responds to aerosol effects in the context of global warming.
The AERONET dataset is accessible at https://aeronet.gsfc.nasa.gov/ (NASA, 2016). The MODIS Collection 6 Hotspot/Active Fire Detections MCD14ML is distributed by NASA Fire Information for Resource Management System (FIRMS) and can be accessed at https://earthdata.nasa.gov/firms (LANCEMODIS, 2021; NASA, 2021). CALIPSO's Level 2 Lidar Vertical Feature Mask (CAL_LID_L2_VFM-Standard-V4-51) and 5 km Aerosol Profile products (CAL_LID_L2_05kmAPro-Standard-V4-51) are provided by ASA/LARC/SD/ASDC, and available at: 10.5067/CALIOP/CALIPSO/ and 10.5067/CALIOP/CALIPSO/ (last access: 3 September 2025). The CERES SYN1deg-Day Terra-Aqua-MODIS Edition 4A (SYN1deg Level 3) dataset can be obtained from https://ceres.larc.nasa.gov/data/ (NASA/LARC/SD/ASDC, 2017). The elevation data from GEneral Bathymetric Chart of the Ocean (GEBCO) current gridded bathymetric dataset, developed by the Nippon Foundation-GEBCO Seabed 2030 Project and published in July 2024, is available for download from the General Bathymetric Chart of the Oceans (GEBCO) website (https://www.gebco.net/; last access: 3 September 2025). The MODIS Land Cover Type Yearly Climate Modeling Grid (CMG), including 10 the dominant land cover type product (MCD12C1), is available through the Level-1 and Atmosphere Archive & Distribution System Distributed Active Archive Center (LAADS DAAC) at https://ladsweb.modaps.eosdis.nasa.gov/search/order/1 (Friedl and Summla-Menashe, 2015). Ground-based microwave radiometers for temperature over Tibetan Plateau (https://doi.org/10.11888/Atmos.tpdc.272995; Ma Yaoming, 2024), along with the Tibetan Plateau boundary dataset (https://doi.org/10.11888/Geogra.tpdc.270099; Yili, 2019), are provided by the National Tibetan Plateau Data Center (http://data.tpdc.ac.cn, last access: 3 September 2025). The HYSPLIT model is available via NOAA's Air Resources Laboratory (ARL) website (https://www.ready.noaa.gov/HYSPLIT.php, last access: 3 September 2025) (Stein et al., 2015).
The supplement related to this article is available online at https://doi.org/10.5194/acp-25-10443-2025-supplement.
CZ designed and conceived the research. QP drafted the initial manuscript. YY and AC contributed to the SBDART method. ZC provided a portion of the data. CZ, QP, YY, AC, XW, HZ, and GW reviewed and edited the manuscript.
The contact author has declared that none of the authors has any competing interests.
Publisher's note: Copernicus Publications remains neutral with regard to jurisdictional claims made in the text, published maps, institutional affiliations, or any other geographical representation in this paper. While Copernicus Publications makes every effort to include appropriate place names, the final responsibility lies with the authors.
We are grateful to the AERONET team for providing validation data and thankful to Pawan Gupta, Elena S. Lind, and their staff for establishing and maintaining the Pokhara site in this investigation. We are deeply appreciative of the MODIS, CALIPSO, CERES, and NASA's FIRMS teams for granting access to their valuable data. Additionally, we acknowledge the NOAA ARL for providing the HYSPLIT transport model and the Data Archive of Tracer Experiments and Meteorology, which were essential to this study. Finally, we would like to acknowledge the sources of the GEBCO Grid and the National Tibetan Plateau Data Center for their invaluable contributions.
This research has been supported by the National Key Research and Development Program of China (grant nos. 24YFF0809402 and 202302AP370003).
This paper was edited by Suvarna Fadnavis and reviewed by two anonymous referees.
Andreae, M. O.: Emission of trace gases and aerosols from biomass burning – an updated assessment, Atmos. Chem. Phys., 19, 8523–8546, https://doi.org/10.5194/acp-19-8523-2019, 2019.
Bhardwaj, P., Naja, M., Kumar, R., and Chandola, H. C.: Seasonal, interannual, and long-term variabilities in biomass burning activity over South Asia, Environ. Sci. Pollut. Res., 23, 4397–4410, https://doi.org/10.1007/s11356-015-5629-6, 2016.
Bhattarai, H., Wu, G., Zheng, X., Zhu, H., Gao, S., Zhang, Y.-L., Widory, D., Ram, K., Chen, X., Wan, X., Pei, Q., Pan, Y., Kang, S., and Cong, Z.: Wildfire-Derived Nitrogen Aerosols Threaten the Fragile Ecosystem in Himalayas and Tibetan Plateau, Environ. Sci. Technol., 57, 9243–9251, https://doi.org/10.1021/acs.est.3c01541, 2023.
Chen, A., Zhao, C., Zhang, H., Yang, Y., and Li, J.: Surface albedo regulates aerosol direct climate effect, Nat. Commun., 15, https://doi.org/10.1038/s41467-024-52255-z, 2024.
Chen, D.: Assessment of past, present and future environmental changes on the Tibetan Plateau (in Chinese with English abstract), Chin. Sci. Bull., 60, 3025–3035, https://doi.org/10.1360/N972014-01370, 2015.
Chen, A., Zhao, C., and Fan, T.: Spatio-temporal distribution of aerosol direct radiative forcing over mid-latitude regions in the Northern Hemisphere estimated from satellite observations, Atmos. Res., 266, 105938, https://doi.org/10.1016/j.atmosres.2021.105938, 2022.
Chen, X., Liu, Y., Ma, Y., Ma, W., Xu, X., Cheng, X., Li, L., Xu, X., and Wang, B.: TP-PROFILE: Monitoring the Thermodynamic Structure of the Troposphere over the Third Pole, Adv. Atmos. Sci., 41, 1264-1277, https://doi.org/10.1007/s00376-023-3199-y, 2024.
Cong, Z., Kang, S., Kawamura, K., Liu, B., Wan, X., Wang, Z., Gao, S., and Fu, P.: Carbonaceous aerosols on the south edge of the Tibetan Plateau: concentrations, seasonality and sources, Atmos. Chem. Phys., 15, 1573–1584, https://doi.org/10.5194/acp-15-1573-2015, 2015.
Dubovik, O., Smirnov, A., Holben, B. N., King, M. D., Kaufman, Y. J., Eck, T. F., and Slutsker, I.: Accuracy assessments of aerosol optical properties retrieved from Aerosol Robotic Network (AERONET) Sun and sky radiance measurements, J. Geophys. Res.-Atmos., 105, 9791–9806, https://doi.org/10.1029/2000JD900040, 2000.
Dumka, U. C., Saheb, S. D., Kaskaoutis, D. G., Kant, Y., and Mitra, D.: Columnar aerosol characteristics and radiative forcing over the Doon Valley in the Shivalik range of northwestern Himalayas, Environ. Sci. Pollut. Res. Int., 23, 25467–25484, https://doi.org/10.1007/s11356-016-7766-y, 2016.
Friedl M. and Sulla-Menashe D.: MCD12C1 MODIS/Terra+Aqua Land Cover Type Yearly L3 Global 0.05Deg CMG. NASA Land Processes Distributed Active Archive Center [data set], https://doi.org/10.5067/MODIS/MCD12C1.006 (last access: 3 September 2025), 2015.
Holben, B. N., Eck, T. F., Slutsker, I., Tanré, D., Buis, J. P., Setzer, A., Vermote, E., Reagan, J. A., Kaufman, Y. J., Nakajima, T., Lavenu, F., Jankowiak, I., and Smirnov, A.: AERONET – A Federated Instrument Network and Data Archive for Aerosol Characterization, Remote Sens. Environ., 66, 1–16, https://doi.org/10.1016/S0034-4257(98)00031-5, 1998.
Holben, B. N., Tanré, D., Smirnov, A., Eck, T. F., Slutsker, I., Abuhassan, N., Newcomb, W. W., Schafer, J. S., Chatenet, B., Lavenu, F., Kaufman, Y. J., Castle, J. V., Setzer, A., Markham, B., Clark, D., Frouin, R., Halthore, R., Karneli, A., O'Neill, N. T., Pietras, C., Pinker, R. T., Voss, K., and Zibordi, G.: An emerging ground-based aerosol climatology: Aerosol optical depth from AERONET, J. Geophys. Res.-Atmos., 106, 12067–12097, https://doi.org/10.1029/2001JD900014, 2001.
Immerzeel, W. W., van Beek, L. P. H., and Bierkens, M. F. P.: Climate Change Will Affect the Asian Water Towers, Science, 328, 1382–1385, https://doi.org/10.1126/science.1183188, 2010.
IPCC: Summary for Policymakers, in: Synthesis Report, Contribution of Working Groups I, II and III to the Sixth Assessment Report of the Intergovernmental Panel on Climate Change, edited by: Core Writing Team, H. Lee and Romero, J., Intergovernmental Panel on Climate, C., Geneva, Switzerland, 1–34, https://doi.org/10.59327/IPCC/AR6-9789291691647.001, 2023a.
IPCC: The Earth's Energy Budget, Climate Feedbacks and Climate Sensitivity, in: Climate Change 2021 – The Physical Science Basis: Working Group I Contribution to the Sixth Assessment Report of the Intergovernmental Panel on Climate Change, edited by: Intergovernmental Panel on Climate, C., Cambridge University Press, Cambridge, 923–1054, https://doi.org/10.1017/9781009157896.009, 2023b.
Kang, L., Huang, J., Chen, S., and Wang, X.: Long-term trends of dust events over Tibetan Plateau during 1961–2010, Atmos. Environ., 125, 188–198, https://doi.org/10.1016/j.atmosenv.2015.10.085, 2016.
Kang, S., Zhang, Q., Qian, Y., Ji, Z., Li, C., Cong, Z., Zhang, Y., Guo, J., Du, W., Huang, J., You, Q., Panday, A. K., Rupakheti, M., Chen, D., Gustafsson, Ö., Thiemens, M. H., and Qin, D.: Linking atmospheric pollution to cryospheric change in the Third Pole region: current progress and future prospects, Nat. Sci. Rev., 6, 796–809, https://doi.org/10.1093/nsr/nwz031, 2019.
Kang, S., Zhang, Y., Qian, Y., and Wang, H.: A review of black carbon in snow and ice and its impact on the cryosphere, Earth-Sci. Rev., 210, 103346, https://doi.org/10.1016/j.earscirev.2020.103346, 2020.
Kaskaoutis, D. G., Kumar, S., Sharma, D., Singh, R. P., Kharol, S. K., Sharma, M., Singh, A. K., Singh, S., Singh, A., and Singh, D.: Effects of crop residue burning on aerosol properties, plume characteristics, and long-range transport over northern India, J. Geophys. Res.-Atmos., 119, 5424–5444, https://doi.org/10.1002/2013jd021357, 2014.
Kedia, S., Ramachandran, S., Kumar, A., and Sarin, M. M.: Spatiotemporal gradients in aerosol radiative forcing and heating rate over Bay of Bengal and Arabian Sea derived on the basis of optical, physical, and chemical properties, J. Geophys. Res.-Atmos., 115, https://doi.org/10.1029/2009JD013136, 2010.
Kim, M.-H., Omar, A. H., Tackett, J. L., Vaughan, M. A., Winker, D. M., Trepte, C. R., Hu, Y., Liu, Z., Poole, L. R., Pitts, M. C., Kar, J., and Magill, B. E.: The CALIPSO version 4 automated aerosol classification and lidar ratio selection algorithm, Atmos. Meas. Tech., 11, 6107–6135, https://doi.org/10.5194/amt-11-6107-2018, 2018.
Koren, I., Kaufman, Y. J., Remer, L. A., and Martins, J. V.: Measurement of the effect of Amazon smoke on inhibition of cloud formation, Science, 303, 1342–1345, https://doi.org/10.1126/science.1089424, 2004.
Krishnan, R., Shrestha, A. B., Ren, G., Rajbhandari, R., Saeed, S., Sanjay, J., Syed, M. A., Vellore, R., Xu, Y., You, Q., and Ren, Y.: Unravelling Climate Change in the Hindu Kush Himalaya: Rapid Warming in the Mountains and Increasing Extremes, in: The Hindu Kush Himalaya Assessment: Mountains, Climate Change, Sustainability and People, edited by: Wester, P., Mishra, A., Mukherji, A., and Shrestha, A. B., Springer International Publishing, Cham, 57–97, https://doi.org/10.1007/978-3-319-92288-1_3, 2019.
LANCEMODIS: MODIS/Aqua Terra Thermal Anomalies/Fire locations 1km FIRMS NRT (Vector data), MODAPS at NASA/GSFC: The Land, Atmosphere Near real-time Capability for EOS (LANCE) [data set], https://earthdata.nasa.gov/earth-observation-data/near-real-time/firms/active-fire-data, (last access: 3 September 2025), 2021.
Lau, W. K. M. and Kim, K. M.: Impact of snow-darkening by deposition of light-absorbing aerosols on snow cover in the Himalaya-Tibetan-Plateau and influence on the Asian Summer monsoon: A possible mechanism for the Blanford Hypothesis, Atmosphere (Basel), 9, 438, https://doi.org/10.3390/atmos9110438, 2018.
Li, C., Bosch, C., Kang, S., Andersson, A., Chen, P., Zhang, Q., Cong, Z., Chen, B., Qin, D., and Gustafsson, Ö.: Sources of black carbon to the Himalayan–Tibetan Plateau glaciers, Nat. Commun., 7, 12574, https://doi.org/10.1038/ncomms12574, 2016.
Li, F., Wan, X., Wang, H., Orsolini, Y. J., Cong, Z., Gao, Y., and Kang, S.: Arctic sea-ice loss intensifies aerosol transport to the Tibetan Plateau, Nat. Clim. Change, 10, 1037–1044, https://doi.org/10.1038/s41558-020-0881-2, 2020.
Li, J., Carlson, B. E., Yung, Y. L., Lv, D., Hansen, J., Penner, J. E., Liao, H., Ramaswamy, V., Kahn, R. A., Zhang, P., Dubovik, O., Ding, A., Lacis, A. A., Zhang, L., and Dong, Y.: Scattering and absorbing aerosols in the climate system, Nat. Rev. Earth Environ., 3, 363–379, https://doi.org/10.1038/s43017-022-00296-7, 2022.
Liu, Y.: Atmospheric response and feedback to radiative forcing from biomass burning in tropical South America, Agr. Forest Meteorol., 133, 40–53, https://doi.org/10.1016/j.agrformet.2005.03.011, 2005.
Liu, Z., Liu, D., Huang, J., Vaughan, M., Uno, I., Sugimoto, N., Kittaka, C., Trepte, C., Wang, Z., Hostetler, C., and Winker, D.: Airborne dust distributions over the Tibetan Plateau and surrounding areas derived from the first year of CALIPSO lidar observations, Atmos. Chem. Phys., 8, 5045–5060, https://doi.org/10.5194/acp-8-5045-2008, 2008.
Lu, Q., Liu, C., Zhao, D., Zeng, C., Li, J., Lu, C., Wang, J., and Zhu, B.: Atmospheric heating rate due to black carbon aerosols: Uncertainties and impact factors, Atmos. Res., 240, 104891, https://doi.org/10.1016/j.atmosres.2020.104891, 2020.
Lüthi, Z. L., Škerlak, B., Kim, S.-W., Lauer, A., Mues, A., Rupakheti, M., and Kang, S.: Atmospheric brown clouds reach the Tibetan Plateau by crossing the Himalayas, Atmos. Chem. Phys., 15, 6007–6021, https://doi.org/10.5194/acp-15-6007-2015, 2015.
Ma Yaoming, C. X.: TP-PROFILE monitoring of the troposphere over the Tibetan Plateau (2021–2022), National Tibetan Plateau Data Center [data set], https://doi.org/10.11888/Atmos.tpdc.272995, 2024.
Menon, S., Hansen, J., Nazarenko, L., and Luo, Y.: Climate Effects of Black Carbon Aerosols in China and India, Science, 297, 2250–2253, https://doi.org/10.1126/science.1075159, 2002.
Moorthy, K. K., Nair, V. S., Babu, S. S., and Satheesh, S. K.: Spatial and vertical heterogeneities in aerosol properties over oceanic regions around India: Implications for radiative forcing, Q. J. Roy. Meteorol. Soc., 135, 2131–2145, https://doi.org/10.1002/qj.525, 2009.
NASA: AEROSOL OPTICAL DEPTH (V3) – SOLAR and AEROSOL INVERSIONS (V3), Goddard Space Flight Center, USA [data set], https://aeronet.gsfc.nasa.gov/ (last access: 3 September 2025), 2016.
NASA: VIIRS (NOAA-21/JPSS-2) I Band 375 m Active Fire Product NRT (Vector data), NASA LANCE MODIS at the MODAPS [data set], https://doi.org/10.5067/FIRMS/MODIS/MCD14DL.NRT.0061, 2021.
NASA/LARC/SD/ASDC: CERES and GEO-Enhanced TOA, Within-Atmosphere and Surface Fluxes, Clouds and Aerosols Daily Terra-Aqua Edition4A [data set], https://ceres.larc.nasa.gov/data/, (last access: 3 September 2025), 2017.
Omar, A. H., Winker, D. M., Kittaka, C., Vaughan, M. A., Liu, Z. Y., Hu, Y. X., Trepte, C. R., Rogers, R. R., Ferrare, R. A., Lee, K. P., Kuehn, R. E., and Hostetler, C. A.: The CALIPSO Automated Aerosol Classification and Lidar Ratio Selection Algorithm, J. Atmos. Ocean. Technol., 26, 1994–2014, https://doi.org/10.1175/2009jtecha1231.1, 2009.
O'Neill, N. T., Eck, T. F., Smirnov, A., Holben, B. N., and Thulasiraman, S.: Spectral discrimination of coarse and fine mode optical depth, J. Geophys. Res.-Atmos., 108, https://doi.org/10.1029/2002JD002975, 2003.
Panicker, A. S., Pandithurai, G., Safai, P. D., Dipu, S., and Lee, D.-I.: On the contribution of black carbon to the composite aerosol radiative forcing over an urban environment, Atmos. Environ., 44, 3066–3070, https://doi.org/10.1016/j.atmosenv.2010.04.047, 2010.
Pant, P., Hegde, P., Dumka, U. C., Sagar, R., Satheesh, S. K., Moorthy, K. K., Saha, A., and Srivastava, M. K.: Aerosol characteristics at a high-altitude location in central Himalayas: Optical properties and radiative forcing, J. Geophys. Res.-Atmos., 111, https://doi.org/10.1029/2005JD006768, 2006.
Paulot, F., Paynter, D., Ginoux, P., Naik, V., and Horowitz, L. W.: Changes in the aerosol direct radiative forcing from 2001 to 2015: observational constraints and regional mechanisms, Atmos. Chem. Phys., 18, 13265–13281, https://doi.org/10.5194/acp-18-13265-2018, 2018.
Pokharel, M., Guang, J., Liu, B., Kang, S., Ma, Y., Holben, B. N., Xia, X. a., Xin, J., Ram, K., Rupakheti, D., Wan, X., Wu, G., Bhattarai, H., Zhao, C., and Cong, Z.: Aerosol Properties Over Tibetan Plateau From a Decade of AERONET Measurements: Baseline, Types, and Influencing Factors, J. Geophys. Res.-Atmos., 124, 13357–13374, https://doi.org/10.1029/2019jd031293, 2019.
Rai, M., Mahapatra, P. S., Gul, C., Kayastha, R. B., Panday, A. K., and Puppala, S. P.: Aerosol Radiative Forcing Estimation over a Remote High-altitude Location (∼4900 masl) near Yala Glacier, Nepal, Aerosol Air Qual. Res., 19, 1872–1891, https://doi.org/10.4209/aaqr.2018.09.0342, 2019.
Ramachandran, S. and Rupakheti, M.: Inter-annual and seasonal variations in optical and physical characteristics of columnar aerosols over the Pokhara Valley in the Himalayan foothills, Atmos. Res., 248, 105254, https://doi.org/10.1016/j.atmosres.2020.105254, 2021.
Ramachandran, S., Rupakheti, M., and Lawrence, M. G.: Black carbon dominates the aerosol absorption over the Indo-Gangetic Plain and the Himalayan foothills, Environ. Int., 142, 105814, https://doi.org/10.1016/j.envint.2020.105814, 2020.
Ramachandran, S., Rupakheti, M., Cherian, R., and Lawrence, M. G.: Aerosols heat up the Himalayan climate, Sci. Total Environ., 894, 164733, https://doi.org/10.1016/j.scitotenv.2023.164733, 2023.
Ramanathan, V., Crutzen, P. J., Kiehl, J. T., and Rosenfeld, D.: Atmosphere – Aerosols, climate, and the hydrological cycle, Science, 294, 2119–2124, https://doi.org/10.1126/science.1064034, 2001a.
Ramanathan, V., Ramana, M. V., Roberts, G., Kim, D., Corrigan, C., Chung, C., and Winker, D.: Warming trends in Asia amplified by brown cloud solar absorption, Nature, 448, 575–578, https://doi.org/10.1038/nature06019, 2007.
Ramanathan, V., Crutzen, P. J., Lelieveld, J., Mitra, A. P., Althausen, D., Anderson, J., Andreae, M. O., Cantrell, W., Cass, G. R., Chung, C. E., Clarke, A. D., Coakley, J. A., Collins, W. D., Conant, W. C., Dulac, F., Heintzenberg, J., Heymsfield, A. J., Holben, B., Howell, S., Hudson, J., Jayaraman, A., Kiehl, J. T., Krishnamurti, T. N., Lubin, D., McFarquhar, G., Novakov, T., Ogren, J. A., Podgorny, I. A., Prather, K., Priestley, K., Prospero, J. M., Quinn, P. K., Rajeev, K., Rasch, P., Rupert, S., Sadourny, R., Satheesh, S. K., Shaw, G. E., Sheridan, P., and Valero, F. P. J.: Indian Ocean Experiment: An integrated analysis of the climate forcing and effects of the great Indo-Asian haze, J. Geophys. Res.-Atmos., 106, 28371–28398, https://doi.org/10.1029/2001JD900133, 2001b.
Ricchiazzi, P., Yang, S., Gautier, C., and Sowle, D.: SBDART: A Research and Teaching Software Tool for Plane-Parallel Radiative Transfer in the Earth's Atmosphere, B. Am. Meteorol. Soc., 79, 2101–2114, https://doi.org/10.1175/1520-0477(1998)079<2101:SARATS>2.0.CO;2, 1998.
Satheesh, S. K. and Ramanathan, V.: Large differences in tropical aerosol forcing at the top of the atmosphere and Earth's surface, Nature, 405, 60–63, https://doi.org/10.1038/35011039, 2000.
Stamnes, K., Tsay, S. C., and Laszlo, I.: DISORT, a General-Purpose Fortran Program for Discrete-Ordinate-Method Radiative Transfer in Scattering and Emitting Layered Media: Documentations of Methodology, NASA Technical Report Version 1.1, 6–112, https://www.libradtran.org/lib/exe/fetch.php?media=disortreport1.1.pdf (last access: 3 September 2025), 2000.
Stein, A. F., Draxler, R. R., Rolph, G. D., Stunder, B. J. B., Cohen, M. D., and Ngan, F.: NOAA's HYSPLIT Atmospheric Transport and Dispersion Modeling System, B. Am. Meteorol. Soc., 96, 2059–2077, https://doi.org/10.1175/BAMS-D-14-00110.1, 2015.
Stocker, M., Ladstädter, F., and Steiner, A. K.: Observing the climate impact of large wildfires on stratospheric temperature, Sci. Rep., 11, 22994, https://doi.org/10.1038/s41598-021-02335-7, 2021.
Tian, P., Yu, Z., Cui, C., Huang, J., Kang, C., Shi, J., Cao, X., and Zhang, L.: Atmospheric aerosol size distribution impacts radiative effects over the Himalayas via modulating aerosol single-scattering albedo, npj Clim. Atmos. Sci., 6, 54, https://doi.org/10.1038/s41612-023-00368-5, 2023.
Vadrevu, K. P., Ellicott, E., Giglio, L., Badarinath, K. V. S., Vermote, E., Justice, C., and Lau, W. K. M.: Vegetation fires in the himalayan region – Aerosol load, black carbon emissions and smoke plume heights, Atmos. Environ., 47, 241–251, https://doi.org/10.1016/j.atmosenv.2011.11.009, 2012.
Venkataraman, C., Habib, G., Kadamba, D., Shrivastava, M., Leon, J. F., Crouzille, B., Boucher, O., and Streets, D. G.: Emissions from open biomass burning in India: Integrating the inventory approach with high-resolution Moderate Resolution Imaging Spectroradiometer (MODIS) active-fire and land cover data, Global Biogeochem. Cy., 20, https://doi.org/10.1029/2005GB002547, 2006.
Wang, S., Zhao, W., Liu, Q., Zhou, J., Crumeyrolle, S., Xu, X., Zhang, C., Ye, C., Zheng, Y., Che, H., and Zhang, W.: Strong Aerosol Absorption and Its Radiative Effects in Lhasa on the Tibetan Plateau, Geophys. Res. Lett., 51, e2023GL107833, https://doi.org/10.1029/2023gl107833, 2024.
Winker, D. M., Pelon, J., Coakley, J. A., Ackerman, S. A., Charlson, R. J., Colarco, P. R., Flamant, P. H., Fu, Q., Hoff, R. M., Kittaka, C., Kubar, T. L., Treut, H. L., McCormick, M. P., Mégie, G., Poole, L. R., Powell, K., Trepte, C. R., Vaughan, M. A., and Wielicki, B. A.: THE CALIPSO MISSION: A Global 3D View of Aerosols and Clouds, B. Am. Meteorol. Soc., 91, 1211–1229, https://doi.org/10.1175/2010BAMS3009.1, 2010.
Wu, G., Liu, Y., Wang, T., Wan, R., Liu, X., Li, W., Wang, Z., Zhang, Q., Duan, A., and Liang, X.: The Influence of Mechanical and Thermal Forcing by the Tibetan Plateau on Asian Climate, J. Hydrometeorol., 8, 770–789, https://doi.org/10.1175/JHM609.1, 2007.
Wu, G., Wan, X., Gao, S., Fu, P., Yin, Y., Li, G., Zhang, G., Kang, S., Ram, K., and Cong, Z.: Humic-Like Substances (HULIS) in Aerosols of Central Tibetan Plateau (Nam Co, 4730 m asl): Abundance, Light Absorption Properties, and Sources, Environ. Sci. Technol., 52, 7203–7211, https://doi.org/10.1021/acs.est.8b01251, 2018.
Yang, J., Ji, Z., Kang, S., and Tripathee, L.: Contribution of South Asian biomass burning to black carbon over the Tibetan Plateau and its climatic impact, Environ. Pollut., 270, 116195, https://doi.org/10.1016/j.envpol.2020.116195, 2021.
Yang, J., Kang, S., Hu, Y., Chen, X., and Rai, M.: Springtime biomass burning impacts air quality and climate over the Tibetan Plateau, Atmos. Environ., 313, 120068, https://doi.org/10.1016/j.atmosenv.2023.120068, 2023.
Yang, X., Zhao, C., Yang, Y., Yan, X., and Fan, H.: Statistical aerosol properties associated with fire events from 2002 to 2019 and a case analysis in 2019 over Australia, Atmos. Chem. Phys., 21, 3833–3853, https://doi.org/10.5194/acp-21-3833-2021, 2021.
Yao, T., Xue, Y., Chen, D., Chen, F., Thompson, L., Cui, P., Koike, T., Lau, W. K. M., Lettenmaier, D., Mosbrugger, V., Zhang, R., Xu, B., Dozier, J., Gillespie, T., Gu, Y., Kang, S., Piao, S., Sugimoto, S., Ueno, K., Wang, L., Wang, W., Zhang, F., Sheng, Y., Guo, W., Ailikun, Yang, X., Ma, Y., Shen, S. S. P., Su, Z., Chen, F., Liang, S., Liu, Y., Singh, V. P., Yang, K., Yang, D., Zhao, X., Qian, Y., Zhang, Y., and Li, Q.: Recent Third Pole's Rapid Warming Accompanies Cryospheric Melt and Water Cycle Intensification and Interactions between Monsoon and Environment: Multidisciplinary Approach with Observations, Modeling, and Analysis, B. Am. Meteorol. Soc., 100, 423–444, https://doi.org/10.1175/bams-d-17-0057.1, 2019.
Yao, T., Bolch, T., Chen, D., Gao, J., Immerzeel, W., Piao, S., Su, F., Thompson, L., Wada, Y., Wang, L., Wang, T., Wu, G., Xu, B., Yang, W., Zhang, G., and Zhao, P.: The imbalance of the Asian water tower, Nat. Rev. Earth Environ., 3, 618–632, https://doi.org/10.1038/s43017-022-00299-4, 2022.
Yili, Z.: Integration dataset of Tibet Plateau boundary, National Tibetan Plateau Data Center [data set], https://doi.org/10.11888/Geogra.tpdc.270099, 2019.
You, C. and Xu, C.: Himalayan glaciers threatened by frequent wildfires, Nat. Geosci., 15, 956–957, https://doi.org/10.1038/s41561-022-01076-0, 2022.
You, C., Yao, T., and Xu, C.: Recent Increases in Wildfires in the Himalayas and Surrounding Regions Detected in Central Tibetan Ice Core Records, J. Geophys. Res.-Atmos., 123, 3285–3291, https://doi.org/10.1002/2017jd027929, 2018.
Yu, P., Davis, S. M., Toon, O. B., Portmann, R. W., Bardeen, C. G., Barnes, J. E., Telg, H., Maloney, C., and Rosenlof, K. H.: Persistent Stratospheric Warming Due to 2019–2020 Australian Wildfire Smoke, Geophys. Res. Lett., 48, e2021GL092609, https://doi.org/10.1029/2021gl092609, 2021.
Zhao, C. F., Yang, Y. K., Fan, H., Huang, J. P., Fu, Y. F., Zhang, X. Y., Kang, S. C., Cong, Z. Y., Letu, H., and Menenti, M.: Aerosol characteristics and impacts on weather and climate over the Tibetan Plateau, Nat. Sci. Rev., 7, 492-+, https://doi.org/10.1093/nsr/nwz184, 2020.
Zheng, C., Zhao, C., Zhu, Y., Wang, Y., Shi, X., Wu, X., Chen, T., Wu, F., and Qiu, Y.: Analysis of influential factors for the relationship between PM2.5 and AOD in Beijing, Atmos. Chem. Phys., 17, 13473–13489, https://doi.org/10.5194/acp-17-13473-2017, 2017.