the Creative Commons Attribution 4.0 License.
the Creative Commons Attribution 4.0 License.
 | 10 Sep 2025
Aerosol composition trends during 2000–2020: in-depth insights from model predictions and multiple worldwide near-surface observation datasets
Alexandra P. Tsimpidi
Susanne M. C. Scholz
Alexandros Milousis
Nikolaos Mihalopoulos
Vlassis A. Karydis
Atmospheric aerosols significantly impact Earth's climate and air quality. In addition to their number and mass concentrations, chemical composition influences their environmental effects. This study examines global trends in aerosol composition from 2000 to 2020, using the EMAC atmospheric chemistry–climate model and a variety of observational datasets. These include PM2.5 surface data from regional networks and 744 PM1 datasets from 169 aerosol mass spectrometer (AMS) field campaigns worldwide. Organic aerosol (OA) is the dominant fine aerosol component across all continents, particularly in areas with significant biomass burning and biogenic volatile organic compound (VOC) emissions. EMAC reproduces the prevalence of secondary OA but underestimates OA aging, revealing uncertainties in distinguishing fresh versus aged secondary organic aerosol (SOA). Although sulfate remains a major component in filter-based observations, both AMS measurements and model simulations reveal that nitrate has emerged as the dominant aerosol species in Europe and Eastern Asia over the past decade, except in summer. Mineral dust also contributes significantly to specific regions, as highlighted by EMAC. The study identifies substantial declines in sulfate, nitrate, and ammonium in Europe and North America, attributed to emission controls, though EMAC underestimates these reductions, especially sulfate, due to discrepancies in early 2000s levels. In Eastern Asia, sulfate reductions due to SO2 controls are partially captured. OA trends differ between methodologies, with filter data showing slight decreases, while AMS and model results suggest slight increases in PM1 OA across Europe, North America, and Eastern Asia. These findings underscore the need for integrating advanced models and diverse datasets to better understand aerosol trends and guide environmental policy.
- Article
(8248 KB) - Full-text XML
-
Supplement
(1549 KB) - BibTeX
- EndNote


Atmospheric aerosols are tiny solid or liquid particulate matter (PM) suspended in the air, ranging in size from a few nanometers to several micrometers. Atmospheric aerosols, especially fine particles with aerodynamic diameters less than 2.5 µm (PM2.5), pose health risks as they can penetrate deep into the respiratory system (WHO, 2003). Long-term exposure to high levels of PM has been associated with respiratory and cardiovascular diseases (Brook et al., 2010; George et al., 2017). Dominici et al. (2006) and Pope et al. (2009) highlight the impact of PM on mortality and morbidity, while more recent studies have determined that air pollution by PM2.5 is responsible for more than 3 million premature deaths per year worldwide (Lelieveld et al., 2015; WHO, 2024). As a result, air pollution is recognized as the largest environmental threat to human health in the recent WHO report (WHO, 2021). Furthermore, aerosols can directly influence the Earth's climate by scattering and absorbing sunlight, leading to changes in the radiation balance (Haywood and Boucher, 2000; IPCC, 2014). Aerosols can also affect the Earth's energy balance indirectly through interactions with clouds, i.e., by serving as cloud condensation nuclei (CCN) and ice nuclei (IN), affecting cloud formation, cloud properties, and precipitation patterns (Andreae and Rosenfeld, 2008). Besides the number and mass concentrations of atmospheric aerosols, their chemical composition determines their aerosol-related climatic (Klingmüller et al., 2019, 2020; Kok et al., 2023) and health impacts (Lelieveld et al., 2015; Fang et al., 2017; Karydis et al., 2021).
Atmospheric aerosols have various precursors, and they can be categorized into primary and secondary aerosols based on their origin. Primary sources include natural ones such as volcanic eruptions, wildfires, windblown desert dust, and sea spray, as well as human activities like industrial emissions and transportation. Secondary aerosols are formed through the oxidation of gas-phase pollutants in the atmosphere and the thermodynamic partitioning of their products in the aerosol phase. Sulfuric acid (H2SO4) is produced by the oxidation of sulfur dioxide (SO2), which is primarily released from fossil fuel combustion, particularly coal, and from natural sources like volcanoes and oceanic dimethyl sulfide (DMS). Nitric acid (HNO3) is formed by the atmospheric oxidation of nitrogen oxides (NOx) emitted from combustion processes, such as those in vehicles and power plants. The formation of particulate sulfate and nitrate depends on thermodynamic partitioning, which governs the equilibrium between the gaseous acids (H2SO4 and HNO3) and their aerosol-phase counterparts. This equilibrium is influenced by factors such as temperature, relative humidity, and the availability of a base, particularly ammonia (NH3), which is emitted from agricultural activities and waste treatment. Secondary organic aerosols (SOAs) can be formed by the oxidation of volatile organic compounds (VOCs), which are emitted from vegetation, wildfires, agricultural burning, industrial processes, vehicle exhaust, and volatile chemical products (VCPs) such as personal care products, coatings, and cleaning agents.
Several measures have been discussed and implemented to mitigate pollutants emitted from specific source sectors, including transport, energy (power generation, industries, etc.), waste management, urban planning, and agriculture. A few of the most prominent global conferences that have taken place for the purpose of combating climate change and air pollution are the Conferences of the Parties (COP) since the early 1990s and the supreme decision-making body of the United Nations Framework Convention on Climate Change (UNFCCC). Their agreements binding the parties to individual emission targets are, for instance, the Agenda 21 of 1992, the Kyoto Protocol of 1997, and its successor, the Paris Agreement of 2015. Besides these global agreements, the single parties had to implement national or continental plans to meet air quality requirements. The resulting emission trends have been so drastic that aerosol composition has been unevenly altered in different parts of the world. Most European countries are bound by the Gothenburg Protocol targets from 1999 and its amendment from 2012 and have in majority successfully reduced pollutant levels (EMEP, 2021). SO2 emissions have declined the most, by more than 80 % in the last two decades. NOx emissions have declined significantly as well (by 50 %), but for NH3, only very small reductions have been achieved (∼ 10 %) (Hoesly et al., 2018; EMEP, 2021). Non-methane volatile organic compounds (NMVOCs) have also been significantly decreased due to emission controls in the transportation and the solvents sector (Hoesly et al., 2018). In the US, pollutant levels are controlled through regulations imposed by the National Ambient Air Quality Standards (NAAQS), the Regional Haze Rule, and the US Clean Air Act of 1970. Over the past two decades, SO2 emissions have declined the most, by almost 90 %, while NOx emissions have decreased by 65 %. However, NMVOC emissions have only decreased slightly (∼ 5 %), and NH3 emissions have increased by 12 % (EPA, 2025). The US and Canada are also part of the Gothenburg protocol, which has contributed to significant reductions in SO2 and NOx emissions. In Asia, South Korea and China, as newly industrialized and high-growth economies, experienced rapid growth in pollutant emissions, especially from 1980 to the mid-2000s (Hoesly et al., 2018; Zhai et al., 2019). However, following the Beijing Olympic Games in 2008, there have been drastic efforts to control air pollution in Beijing and neighboring administrative regions (Huang et al., 2010). In 2013, the first consistent and aggressive emission controls started under the Clean Air Action (Zhai et al., 2019). The Clean Air Action has identified three target regions: the megacity clusters of Beijing–Tianjin–Hebei, the Yangtze River Delta, and the Pearl River Delta, while in 2018, the latter was replaced by the Fenwei Plain (Zhai et al., 2019). These efforts resulted in a national reduction of 60 % for SO2, 20 % for NOx, and only 3 % for NH3, although NMVOCs increased by 2 % (Zheng et al., 2018). In other parts of the world, including Asia, Africa, and Latin America, emissions from residential biomass burning and agriculture have continued to rise, driven by population growth (Hoesly et al., 2018).
Air pollution concentration levels can vary by time of day, season, across large spans of time, based on meteorological factors, and in connection with climate change. Trend analysis of air pollution concentrations (Guerreiro et al., 2014; Lang et al., 2019) can allow the assessment of the impact of various factors on air quality, including changes in industrial activities, traffic patterns, or energy production. Analyzing trends in air pollutants enables comparisons between different regions or countries (Anttila and Tuovinen, 2010; Chow et al., 2022; Kyllönen et al., 2020) as well as between different datasets that provide information for the same pollutant. This can highlight areas that are successfully addressing air quality issues and provide benchmarks for others to follow but also highlight any kind of inability of each method to reproduce the concentration levels of the pollutants.
In this study, we combine model results with a global observational aerosol composition dataset to provide insights into the large spatiotemporal changes in aerosol composition over the past two decades, driven by changes in aerosol precursor emissions. The dataset includes observations from regional filter-based monitoring networks that routinely collect PM2.5 (see Sect. 2.2), as well as a unique comprehensive compilation of 744 individual aerosol mass spectrometer (AMS) field campaigns worldwide that provide in situ measurements of PM1 composition. To analyze these trends, we use the comprehensive atmospheric chemistry–climate model EMAC, which presents 21-year global trends in the composition of fine aerosols in different regions of the planet. Here, for the first time, EMAC uses a computationally lite version of the organic aerosol module ORACLE (Tsimpidi et al., 2014) and the new highly computationally efficient module ISORROPIA-lite (Kakavas et al., 2022; Milousis et al., 2024). The large emission trends in our model are considered by employing the Copernicus Atmosphere Monitoring Service (CAMS) inventory for anthropogenic emissions (Granier et al., 2019).
2.1 PM1 dataset
Since the year 2000, the quadrupole-based Aerodyne aerosol mass spectrometer (Q-AMS) and its successors have enjoyed great popularity as a method for atmospheric aerosol sampling. A great advantage of the AMS is its ability to deliver highly resolved real-time quantitative data on the mass concentration of particles with dry aerodynamic diameters between ∼ 0.05 and 1 µm (Canagaratna et al., 2007) as a function of their non-refractory (NR) chemical composition (i.e., OA and inorganic SO, NO, NH, and Cl−) (Jayne et al., 2000). Over the years and during numerous field campaigns, a lot of valuable chemical and microphysical information about ambient aerosols has been obtained (Ng et al., 2011). During the 2000s, these campaigns did not last more than a month; however, the development of the Aerosol Chemical Speciation Monitor (ACSM), a small and cost-efficient version of AMS, allowed the long-term monitoring of the PM1 composition over several locations during the 2010s.
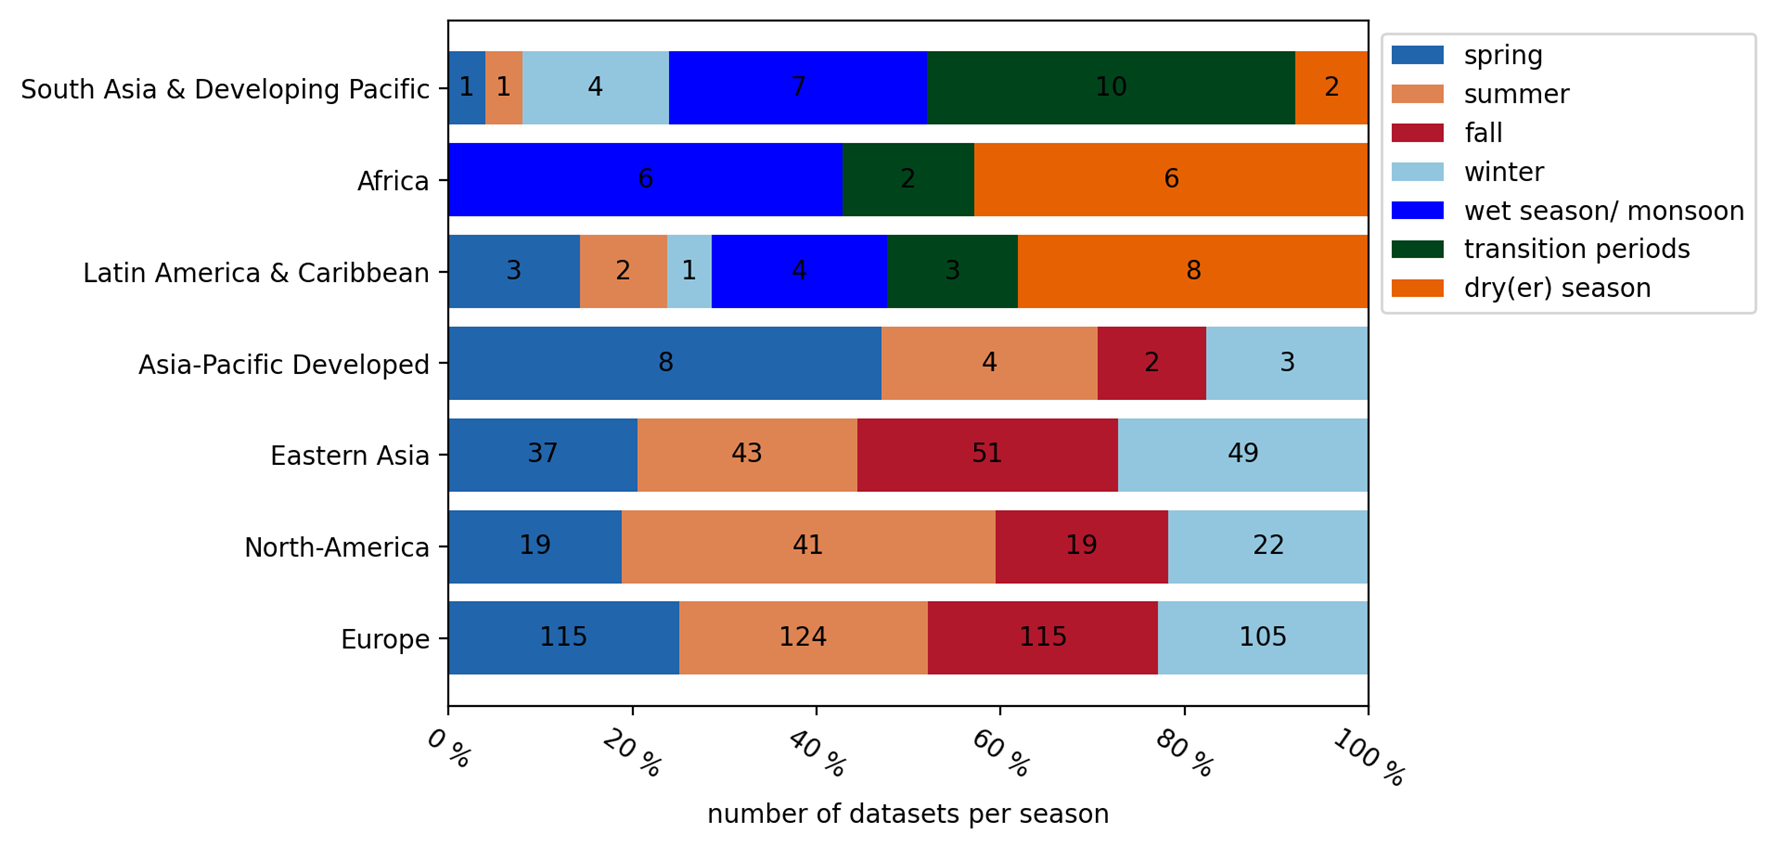
Figure 1Seasonal distribution of AMS datasets per subcontinent. The colored bars indicate the relative proportions by season. The numbers in the colored boxes indicate the absolute number of field campaigns that occurred in each season.
2.1.1 AMS factor analysis techniques
The AMS spectra of OA are often further analyzed via factor analysis techniques in order to extract detailed information about the OA composition as well. Among factor analysis techniques (e.g., ME-2 (Paatero, 1999); PCA (Zhang et al., 2013); MCA (Zhang et al., 2007; Cottrell et al., 2008)), the PMF (Paatero and Tapper, 1994; Paatero, 1997) is the most popular technique, occasionally in combination with the ME-2. Overall, a mass spectrum that peaks at (or f44) and (or f43) is mostly dominated by the CO and C2H3O+ ions, respectively. The first is mostly linked to acidic groups (i.e, -COOH), typically associated with chemically aged and oxygenated organic aerosols (OOAs), while the latter is dominated by non-acid oxygenates. OOA can be further categorized into different levels of aging and volatility stages. Most commonly, a less oxidized (semi-volatile) OA (L-OOA; Bougiatioti et al., 2014) and a more oxidized (low-volatile) OA (M-OOA; Bozzetti et al., 2017) are distinguished (Jimenez et al., 2009; Ng et al., 2010; Crippa et al., 2014; Stavroulas et al., 2019). The two OOA factors could be identified based on the f44 to f43 ratio: M-OOA component spectra have a higher f44, while L-OOA component spectra have slightly higher f43. Besides these general factors, other oxygenated OA compounds have been resolved in some campaigns. One of the most important is the isoprene-epoxydiol-derived OA (IEPOX-OA) with abundant ions at , 75, or 82. This “isoprene” factor correlates strongly with molecular tracers of SOA that are derived from isoprene epoxydiols (Xu et al., 2015; Budisulistiorini et al., 2013; Budisulistiorini et al., 2016). Several campaigns in North America have found IEPOX-OA, as have campaigns in South America and Australia. Furthermore, methane-sulfonic acid (MSA) is often retrieved from datasets of marine sites (Crippa et al., 2014; Mallet et al., 2019). Some studies have identified a nitrogen-enriched OA factor (NOA) mainly composed of amino compounds formed from industrial or marine emissions. A more local SOA factor that is related to humic-like substances, termed HULIS OA, was found in the Netherlands (Schlag et al., 2016) and in Crete (Crippa et al., 2014). In Greece (Bougiatioti et al., 2014; Stavroulas et al., 2019; Vasilakopoulou et al., 2023), in the Amazonian (De Sá et al., 2019), and often in Asia (Zhang et al., 2015b; Chakraborty et al., 2015; Du et al., 2015), OOA factors directly associated with biomass burning were found that are processed from fresh biomass burning emissions. Furthermore, OOA compounds that are verifiable only as biogenically oxygenated were also derived (Kostenidou et al., 2015).
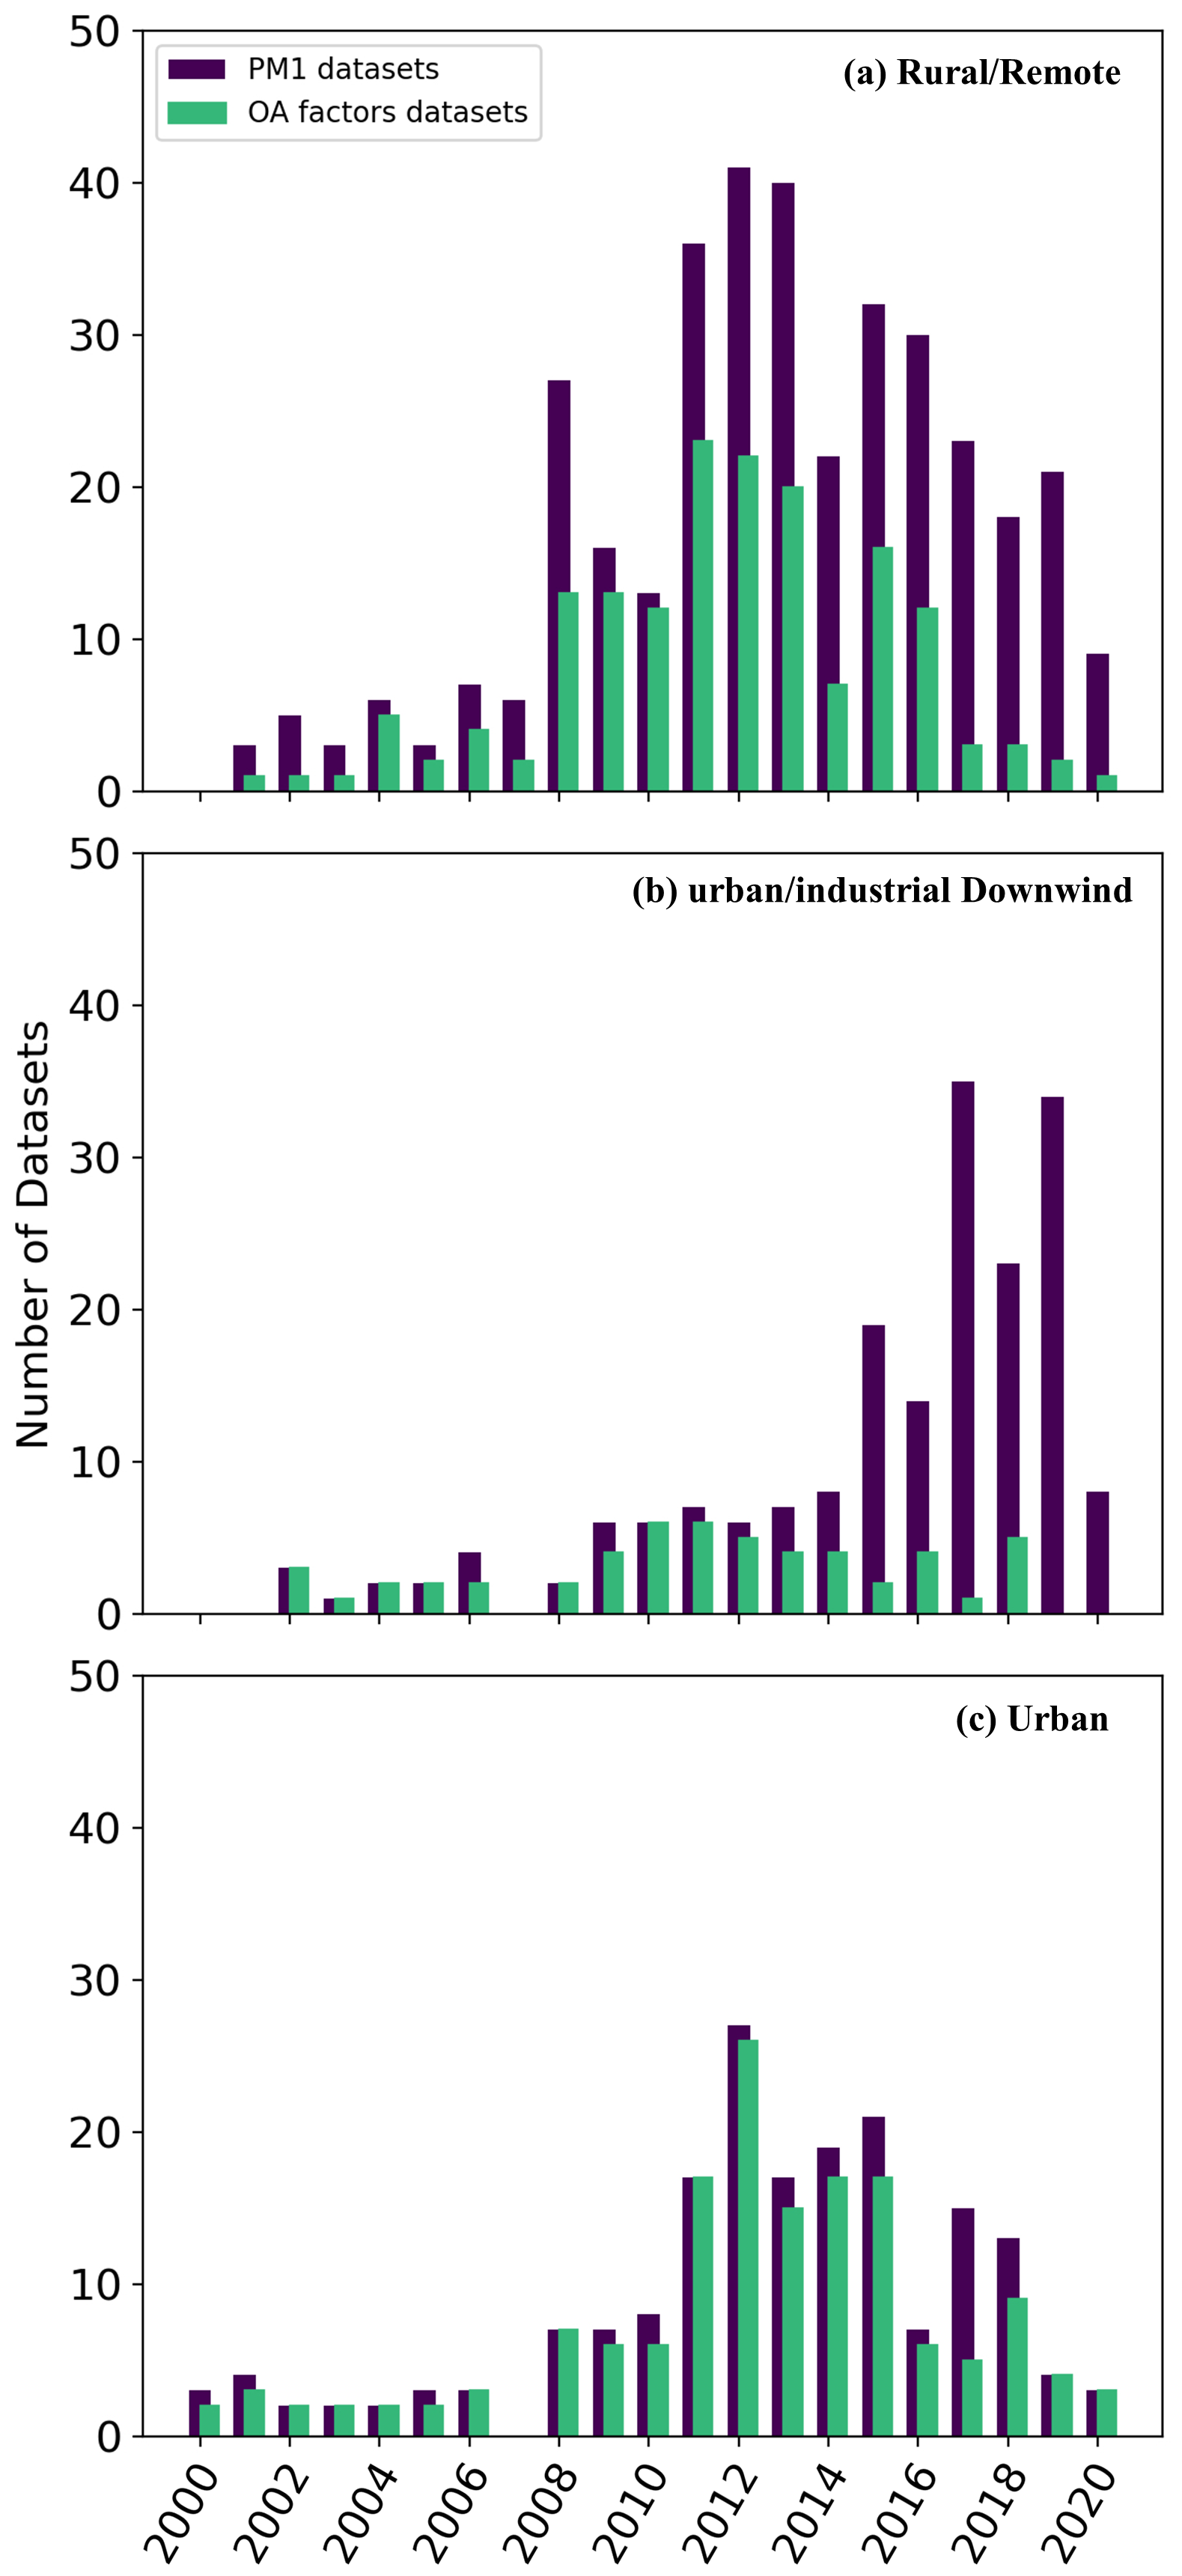
Figure 2Total AMS (dark purple) and factor analysis (green) datasets per year in (a) rural, (b) urban-downwind, and (c) urban regions.
Apart from the mass spectrum, OA types can also be distinguished by their oxygen to carbon ratio (O:C), which is an indicator of photochemical aging. Fresh primary organic aerosol (POA) has a lower oxygen content than OOA; therefore, it has lower O:C ratios. Yet, it sometimes has the same dominant m/z peaks. Some of the most commonly resolved POA factors are the hydrocarbon-like (HOA) and biomass burning (BBOA) OA. HOA has spectra that are distinguished by clear hydrocarbon signatures, dominated by the ion series CnH and CnH (Ng et al., 2010). HOA correlates with fossil fuel combustion tracers like NOx, CO, and elemental carbon (Lanz et al., 2008; Tsimpidi et al., 2016); therefore, it is very often observed to be traffic-related and a rather dominant POA factor in urban areas (Crippa et al., 2014; Xu et al., 2015; Budisulistiorini et al., 2016). On the other hand, BBOA typically originates from forest and savanna fires as well as from anthropogenically induced agricultural fires (Hoesly et al., 2018) and residential wood burning for heating. This makes the contribution of BBOA to total OA highly episodic (Zhang et al., 2007) and seasonal; in several cases, underestimated due to the rapid physicochemical transformation of these emissions to OOA (Stavroulas et al., 2019; Vasilakopoulou et al., 2023). Typical tracers to identify BBOA in the spectra are gas-phase acetonitrile, particle-phase levoglucosan, and potassium (K+) (Lanz et al., 2010; Crippa et al., 2014). However, its mass spectra are also highly variable since they can be affected by different types of wood and burning conditions (Crippa et al., 2014).
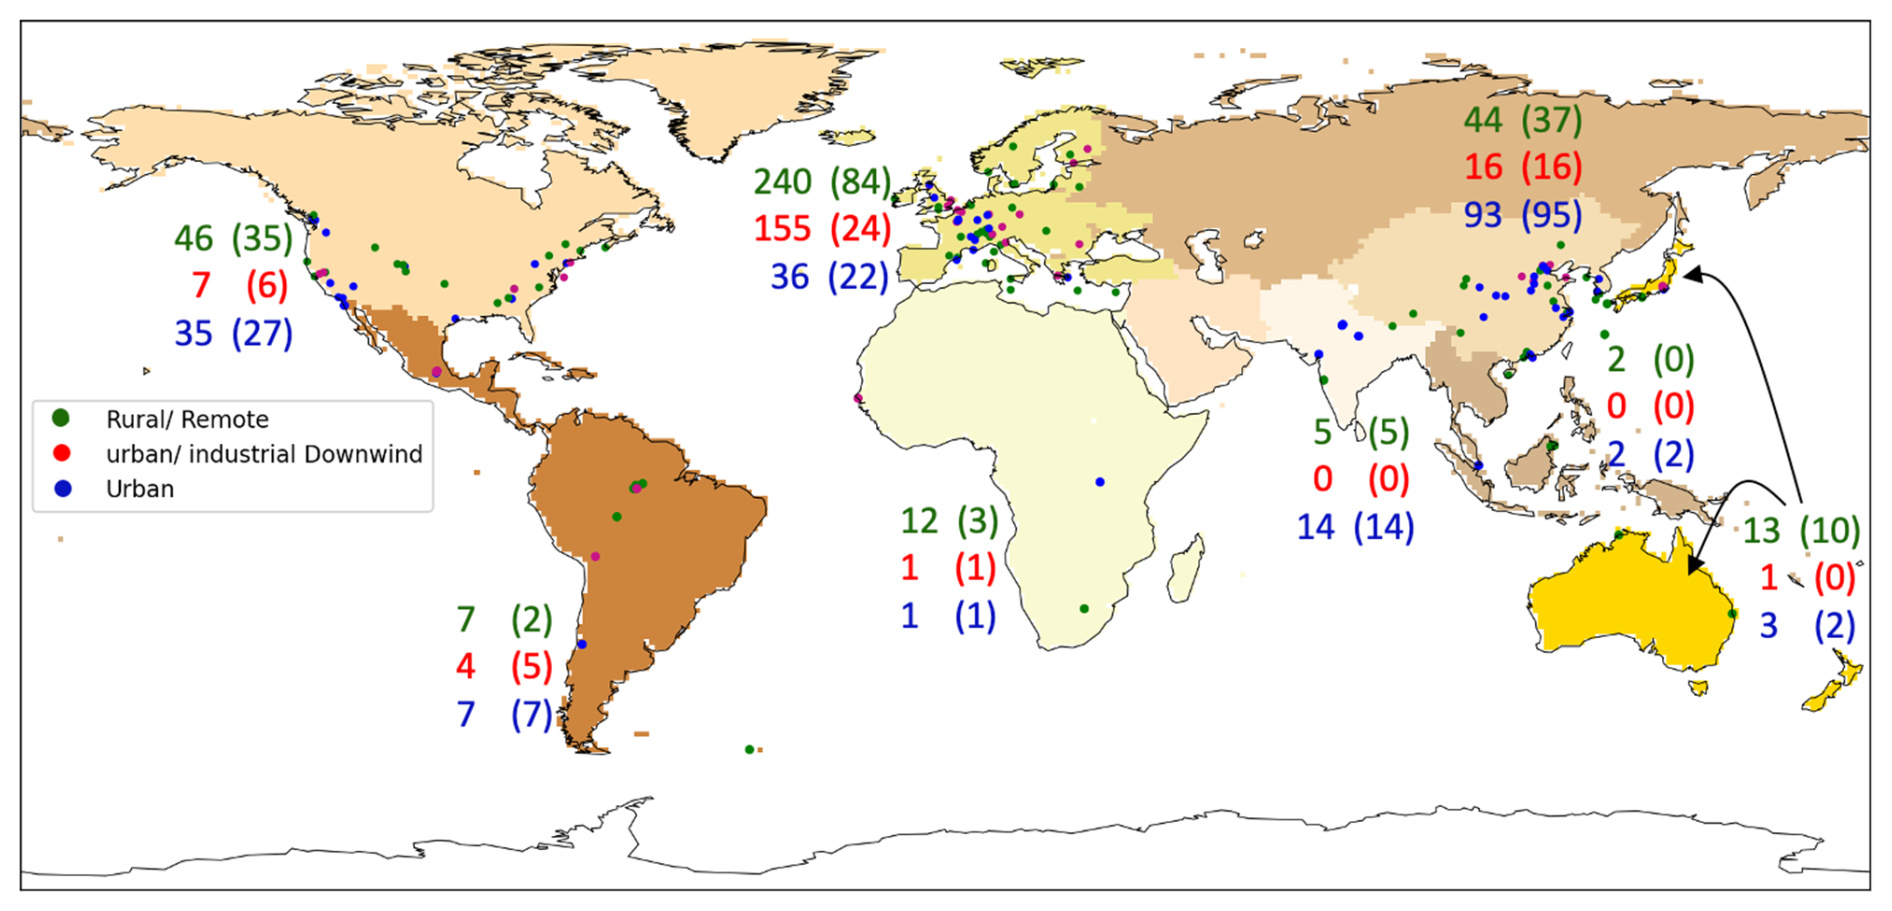
Figure 3Worldwide distribution of AMS and ACSM datasets for the period 2000–2020. The world map is colored according to the intermediate-level regional breakdown of the sixth assessment report of IPCC Working Group III (IPCC, 2023). The rural (green), downwind (red), and urban (blue) campaign locations and the total number of PM1 composition (and OA factor analysis in parentheses) datasets for each region are also shown.
Furthermore, a coal combustion factor (CCOA) is often identified, which presents a dominant contribution to POA during the heating season, mostly in Eastern Asia (Sun et al., 2013; Zhang et al., 2014). In many cases, HOA shows remarkably similar spectral patterns to CCOA, so that these two factors could not be separated and, instead, are combined in a fossil fuel-related OA factor (FFOA) (Sun et al., 2018; Xu et al., 2019). Another relatively frequent primary type resolved by the factor analysis is the cooking-related OA (COA) (Mohr et al., 2012). Its spectral pattern is governed by OA from fresh cooking emissions; fittingly, the spectral profiles have a distinct diurnal cycle, which corresponds to typical (local) meal hours (Mohr et al., 2012; Sun et al., 2013; Stavroulas et al., 2019). Occasionally, special types of COA are also resolved, including coffee roastery OA (Timonen et al., 2013) and OA related to charbroiling (Lanz et al., 2007).
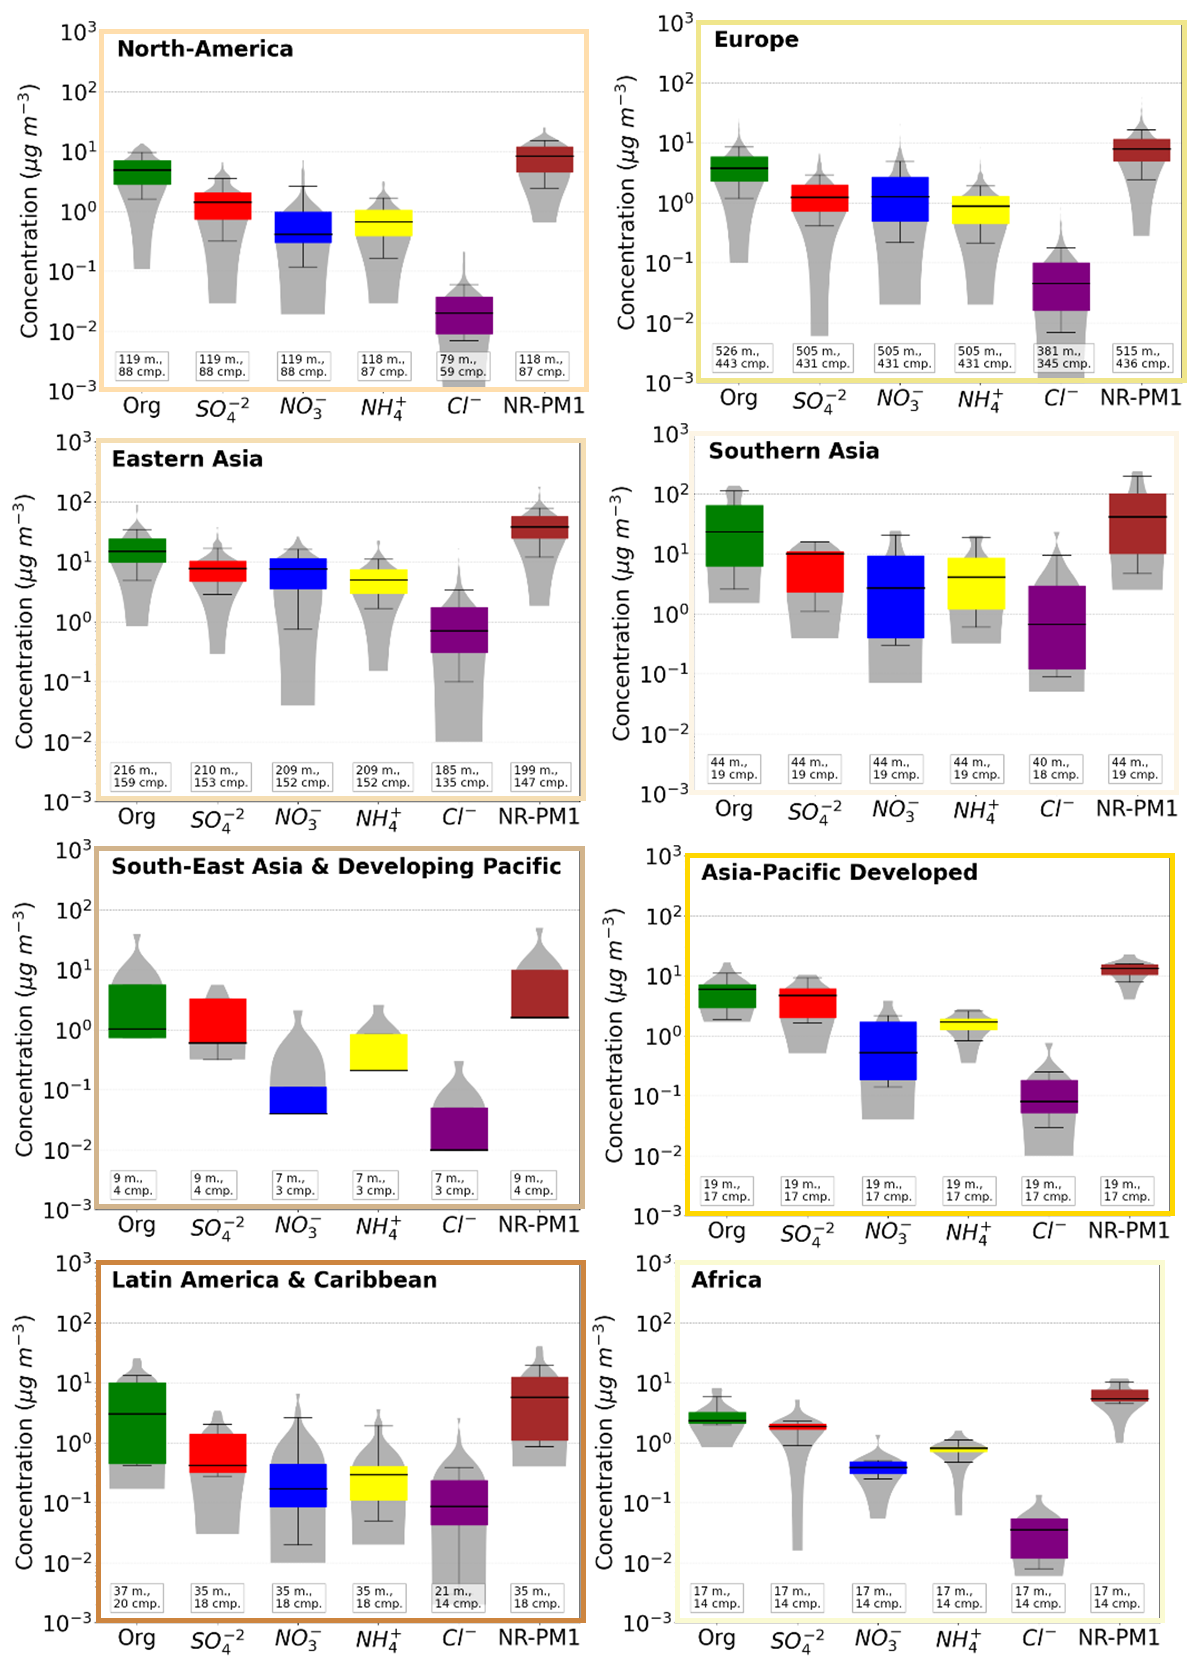
Figure 4Bar chart plots depicting the distribution (violin) and the 25th, 50th, and 75th percentiles (box) of the mass concentration (in µg m−3) for the major PM1 aerosol components, i.e., organic aerosol (green), sulfate (red), nitrate (blue), ammonium (yellow), chloride (purple), and the total non-refractive PM1 (dark red). The 10th and 90th percentiles (whiskers) for each aerosol component are also shown. The number of total months (m.) with AMS data and the number of campaigns (cmp.) are written in small boxes under the violins.
2.1.2 AMS dataset
Here, a collection of AMS and ACSM field campaign datasets during the period 2000–2020 has been compiled (Tables S4–S17). The dataset covers a wide range of environments and seasons from almost every continental region worldwide (Fig. 1), characterized by a variety of atmospheric and climatological conditions as well as sources of pollutants. The selected field campaigns lasted from at least one full week to several months. Individual campaigns lasting more than one month are divided into shorter periods of preferably only one month. All these individual periods of campaign data (thus covering a maximum of one month) are hereafter referred to as individual datasets.
The number of both PM1 and OA composition datasets found for each year is increasing significantly for all regions through the years (Fig. 2) due to the growing popularity of the AMS devices and the continuous improvement of the analysis techniques. Especially during the second decade, the number of field campaigns increases drastically, supported by the use of ACSM devices since 2010. The long-term campaigns in South Africa (2010–2011; Tiitta et al., 2014) and the Southern Great Plains (2010–2012; Parworth et al., 2015) belong to the very first where the ACSM has been utilized. Furthermore, campaigns in regions downwind of urban environments have gained growing attention, mostly after 2014, primarily in Europe. However, usually these datasets are not factor analyzed and lack information on the OA composition. It is worth mentioning that the small number of downwind datasets available can be partially attributed to the ambiguous definition of downwind sites, which might have led instead to the more conventional classifications of rural or urban locations in some cases.
Overall, the compiled dataset includes dry NR-PM1 aerosol composition from 744 AMS field campaign datasets at 169 ground-level observational sites around the world, while factor analysis has been used to estimate the OA composition in 398 cases at 140 different observational sites (Table S1). The dataset includes an intermediate-level regional breakdown following the sixth assessment report of IPCC Working Group III (IPCC, 2023), as shown in Fig. 3. The most represented subcontinents are Europe, Eastern Asia, and North America. Datasets from these three Northern Hemisphere continents are evenly distributed over the seasons, with only a little imbalance for North America, which is overrepresented during summer (Fig. 1). The rest of the regions include a significantly lower number of datasets; therefore, the seasonal distribution is often very uneven. As an example, 50 % of the data in the Asia-Pacific Developed region have been collected during spring. On the contrary, the changes between the wet and dry seasons are well represented at one site in Africa, where the ACSM has been employed for year-long campaigns (Tiitta et al., 2014).
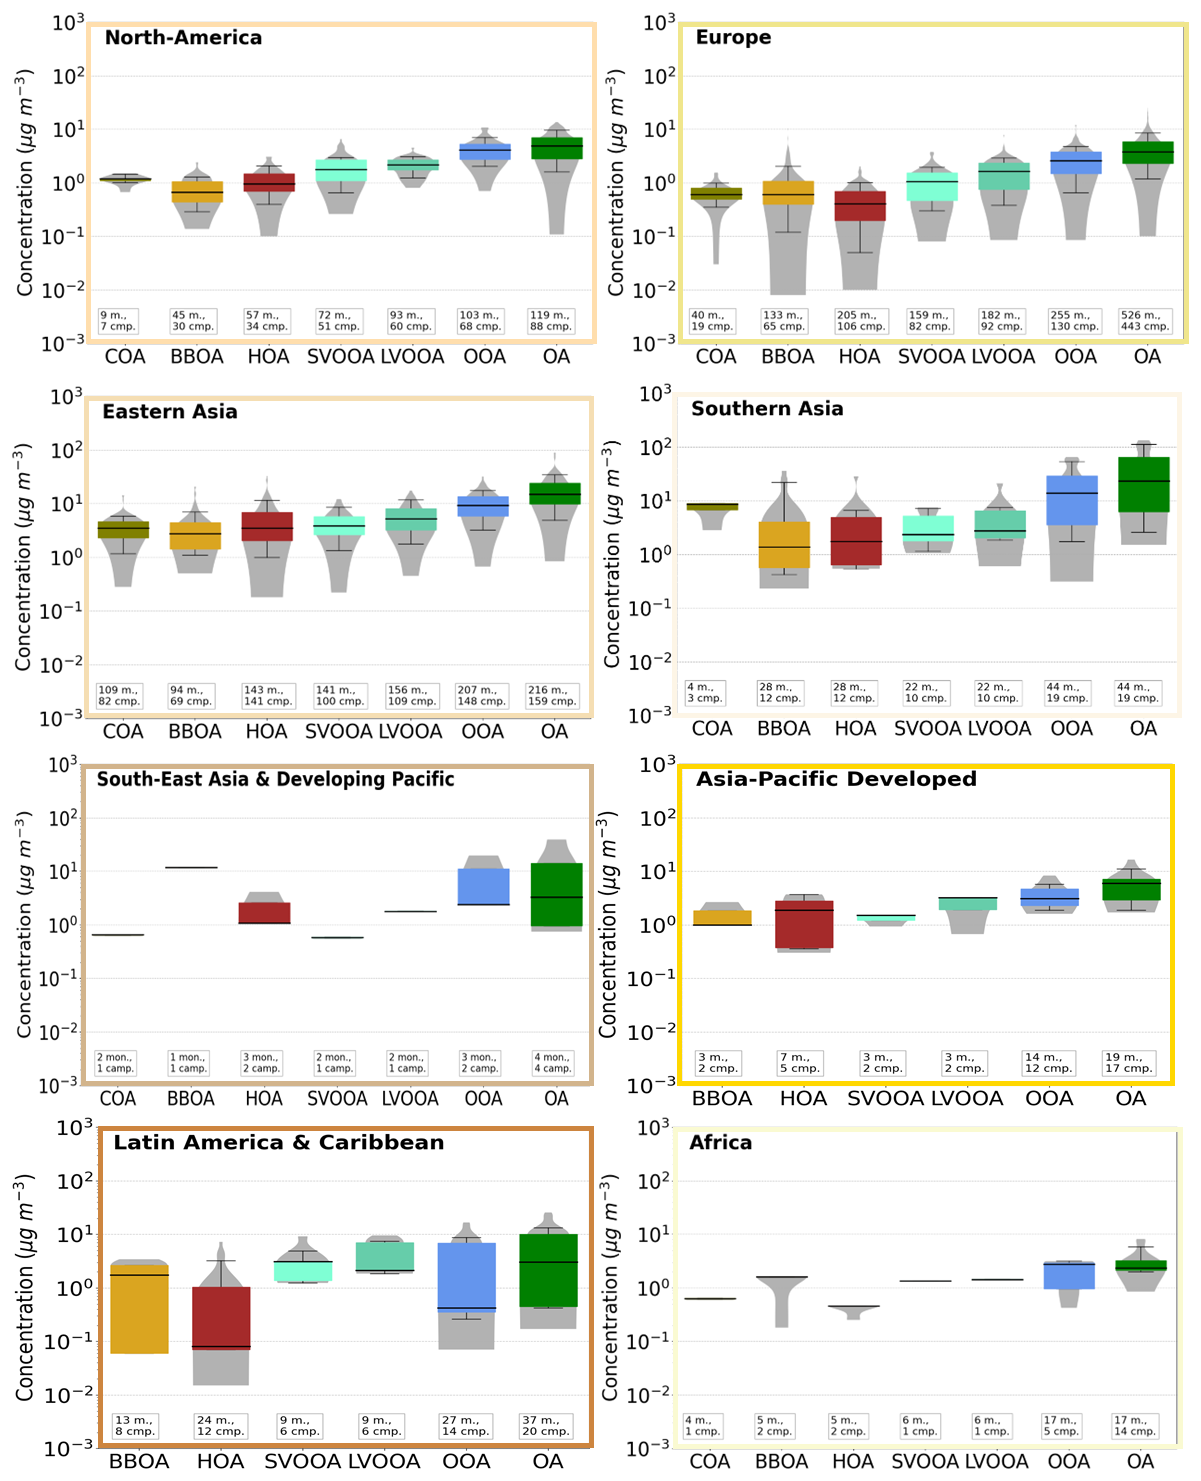
Figure 5Bar chart plots depicting the distribution (violin) and the 25th, 50th, and 75th percentiles (box) of the mass concentration (in µg m−3) for the major PM1 OA components calculated from the collected factor analysis datasets, i.e., COA (olive green), BBOA (orange), HOA (dark red), L-OOA (light turquoise), M-OOA (dark turquoise), OOA (blue), and total OA (green). The 10th and 90th percentiles (whiskers) for each aerosol component are also shown. The number of datasets (m.) and the number of campaigns (cmp.) are written in small boxes under the violins.
2.1.3 Observed PM1 aerosol composition
The NR-PM1 aerosol composition derived from AMS field campaigns at eight regions around the world is depicted in Fig. 4. The analysis of the AMS dataset reveals that OA is the dominant component of PM1 in all continental regions. Campaign data from tropical and subtropical regions (e.g., Latin America and Southern/Southeast Asia) are strongly influenced by biomass burning and biogenic VOC emissions, resulting in notably large OA fractions in aerosol composition, with regional averages around 65 % and a peak of 92 % in the Amazon. However, OA concentration shares up to 90 % are also found over the Northern Hemisphere regions, where the regional average OA contribution to PM1 concentrations is around 50 %. Overall, OA contributes between 17 % and 92 % (50 % on average) to total NR-PM1. This agrees very well with the ranges reported by Kanakidou et al. (2005) (20 %–90 %) and Zhang et al. (2007) (18 %–70 % or 45 % on average). Sulfate has been the dominant inorganic compound in the aerosol composition in most regions (Fig. 4). The highest regional average share of sulfate is found in Asia-Pacific Developed (37 %), while the lowest is over Europe (17 %), where SO2 has been drastically reduced due to strict air pollution mitigation strategies. Nitrate dominates over sulfate in Europe and Eastern Asia. However, it is surprising that the PM1 nitrate concentrations are significantly lower in North America, despite similar mitigation strategies and reductions in SO2 and NOx. This effect is probably due to an overrepresentation of summer data in North America (Fig. 1), which results in lower nitrate concentrations since higher temperatures hinder the condensation of nitric acid in the aerosol phase. At the same time, sulfate concentrations remain relatively stable and even higher during summer due to the increased photochemical production of H2SO4. Overall, nitrate concentrations are the highest in winter in Europe and North America, accounting for roughly a quarter of total PM1 (Figs. S2 and S3). A similar proportion is observed in spring, although the absolute concentration is lower. The lowest average nitrate concentrations and shares occur in summer, when sulfate peaks dominate the inorganic composition. Although both sulfate and nitrate are generated through photochemical reactions, this seasonal shift is due to nitric acid partitioning in the gas phase at higher temperatures. Additionally, the increased production of sulfuric acid reduces the amount of free ammonia available for ammonium nitrate formation, further contributing to the summer nitrate decline (Seinfeld and Pandis, 2006). Ammonium concentrations remain relatively stable throughout the seasons, presenting similar shares of PM1 (Figs. S2 and S3). However, in contrast to Europe and North America, sulfate concentrations in Eastern Asia are the highest in winter, closely followed by summer (Fig. S4). While photochemical reactions still dominate during warmer, sunnier seasons, aqueous phase reactions are more influential in East Asian winter, particularly under high relative humidity (RH) and severe haze conditions. These factors are often present in Chinese winters and likely explain this regional pattern (Zhang et al., 2015a; Zhou et al., 2020b). Over the southern regions, ammonium follows sulfate in the inorganic aerosol composition due to the high agricultural activities. Overall, the global average contribution of the inorganic compounds to total PM1 concentration is 20 %, 18 %, 11 %, and 1 % by sulfate, nitrate, ammonium, and chloride, respectively. Zhang et al. (2007) reported a much stronger contribution by sulfate (32 %), less by nitrate (10 %), and similar values of ammonium (13 %) and chloride (1 %), using AMS observations from the early 2000s, indicating that the inorganic aerosol composition has been altered during the last 20 years.
2.1.4 Observed PM1 organic aerosol composition
HOA concentrations are observed to be higher over North America and Eastern Asia in comparison to Europe (Fig. 5). This could be explained by the significant influence of traffic emissions on HOA in the vicinity of urban areas. While urban locations are equally represented with rural sites in the dataset collection of North America and Eastern Asia, in Europe, rural sites are immensely overrepresented (3 times more than urban sites), diminishing the importance of HOA. On the other hand, the overrepresentation of rural sites in the European dataset resulted in high concentrations of BBOA, which is found to be the dominant primary source of OA in the region (Lanz et al., 2010). Here, BBOA originates mostly from domestic wood burning during the colder seasons in central Europe, including the Alps, rather than from open biomass burning. Even though a few campaigns took place in the European boreal forests, only very few factor analyses have distinguished BBOA as an individual component. Thus, the contribution of European boreal forests to the total European BBOA is unfortunately not yet clear. Similarly, biomass burning is an important source of OA in North America and Eastern Asia (Rattanavaraha et al., 2017; Zhou et al., 2020a) but is less important than HOA (Fig. 5). Biomass burning is an especially important source in tropical and subtropical regions (i.e., South Asia and the Developing Pacific, Africa, and Latin America and the Caribbean) due to episodic wildfires and harvest-related burning (Budisulistiorini et al., 2018; Cash et al., 2021). Overall, the concentration range of BBOA is very high since it varies a lot with seasons. However, it should be emphasized that the availability of factor analysis datasets in equatorial and Southern Hemisphere continents is very low; therefore, there is not enough data available for statistically profound statements. The last primary type of OA, COA, is population-dependent and, therefore, is mainly found in urban areas and highly populated regions (Zhou et al., 2020a). Cooking is a very constant and local source throughout the year with low variability and high contributions over Eastern Asia, Europe, North America, and South Asia and the Developing Pacific, especially in urban campaign sites.
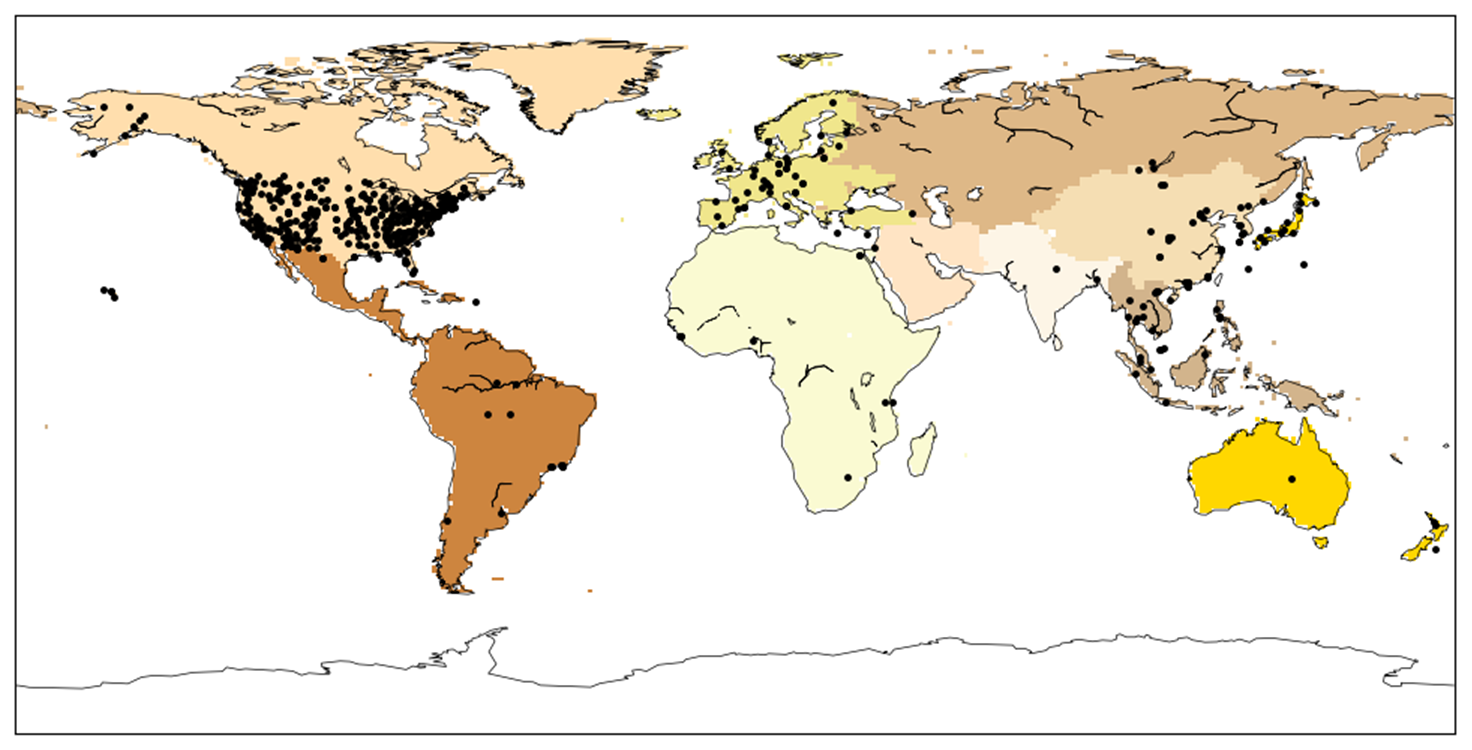
Figure 6Worldwide distribution of filter-based observations for the period 2000–2020. The world map is colored following the intermediate-level regional breakdown of the sixth assessment report of IPCC Working Group III (IPCC, 2023). The black dots correspond to the location of the monitor stations.
OOA is unequivocally the dominant contributor to total OA, with a mean share of 60 % in urban and 75 % in rural regions. Overall, the OOA contribution ranges from 19 % (urban minimum) to 99 % (rural maximum). The extreme shares were both found during European campaigns. The mean OOA share in Europe, however, lies roughly in the same magnitude as the global mean (∼ 70 %). The dominant OOA subfactors resolved are L-OOA and M-OOA, while the more aged M-OOA dominates in the OA composition of all examined regions (∼ 60 % of total OOA). This agrees with the findings of Ng et al. (2010), who stated that OOA component spectra become increasingly similar to each other with atmospheric oxidation, indicating that ambient OA converges toward highly aged M-OOA.
2.2 PM2.5 dataset
Routine filter measurement PM2.5 data from large observational networks in East Asia, Europe, and North America are used. The filter samplers have three modules that independently collect dry PM2.5 species on a Teflon, a nylon, and a quartz filter. The aerosol chemical composition is determined by further analysis of the filters in the laboratory via ion chromatography (inorganic ions), thermal-optical analysis (organic and elemental carbon, OC and EC), and X-ray fluorescence or inductively coupled plasma (ICP) paired with both optical emission spectrometry (OES) and mass spectrometry (MS) (trace elements) (Solomon et al., 2014). Potential difficulties that could arise when comparing online AMS and ACSM PM1 composition to offline filter-based PM2.5 composition are discussed in Sect. 5. The Environmental Protection Agency (EPA) network includes 211 monitoring sites primarily in urban areas of North America. The data used here cover monthly averaged PM2.5 aerosol component measurements during 2000–2018 (https://aqs.epa.gov/aqsweb/airdata/download_files.html, last access: 25 August 2025). The Interagency Monitoring of Protected Visual Environments (IMPROVE) network includes 198 monitoring sites that are representative of the regional haze conditions over North America. IMPROVE samplers collect 24 h samples every three days. The data used here covers monthly averaged PM2.5 aerosol component measurements during 2000–2018 (http://views.cira.colostate.edu/fed/QueryWizard/Default.aspx, last access: 25 August 2025). It is worth mentioning that ammonium measurements by IMPROVE are only available until the year 2006. The European Monitoring and Evaluation Programme (EMEP) network monitors the long-range transmission of air pollutants in Europe and Eastern Eurasia (Fig. 6). This network includes 70 monitoring sites. The data used here cover monthly averaged PM2.5 aerosol component measurements during 2000–2018 (https://www.emep.int/, last access: 25 August 2025). Finally, the Acid Deposition Monitoring Network in East Asia (EANET) network includes 39 (18 remote, 10 rural, and 11 urban) air concentration monitoring sites in Eurasia, Eastern Asia, South-East Asia and the Developing Pacific, and Asia-Pacific Developed. The data used here cover monthly averaged PM2.5 aerosol component measurements during 2001–2017 (https://www.eanet.asia/, last access: 25 August 2025). The global Surface Particulate Matter Network (SPARTAN; Snider et al., 2015, 2016) includes a global federation of ground-level PM2.5 monitors from 16 sites situated primarily in highly populated regions around the world (i.e., North America, Latin America and the Caribbean, Africa, the Middle East, Southern Asia, Eastern Asia, South-Eastern Asia, and the Developing Pacific) (Fig. 6). The data used here cover monthly averaged PM2.5 aerosol component measurements of sulfate, nitrate, ammonium, and sodium during 2013–2019 (https://www.spartan-network.org/, last access: 25 August 2025). Finally, PM2.5 aerosol component measurements from individual observational field campaigns over Latin America and the Caribbean, Africa, Europe, Eastern Asia, and Asia-Pacific Developed reported as campaign averages in the literature are used (Wang et al., 2019; Radhi et al., 2010; Favez et al., 2008; Mkoma et al., 2009; Weinstein et al., 2010; Celis et al., 2004; Bourotte et al., 2007; Fuzzi et al., 2007; Mariani and de Mello, 2007; Martin et al., 2010; Souza et al., 2010; Gioda et al., 2011; Molina et al., 2010, 2007; Kuzu et al., 2020; Aggarwal and Kawamura, 2009; Batmunkh et al., 2011; Cho and Park, 2013; Feng et al., 2006; Li et al., 2010; Pathak et al., 2011; Zhang et al., 2012; Zhao et al., 2013).
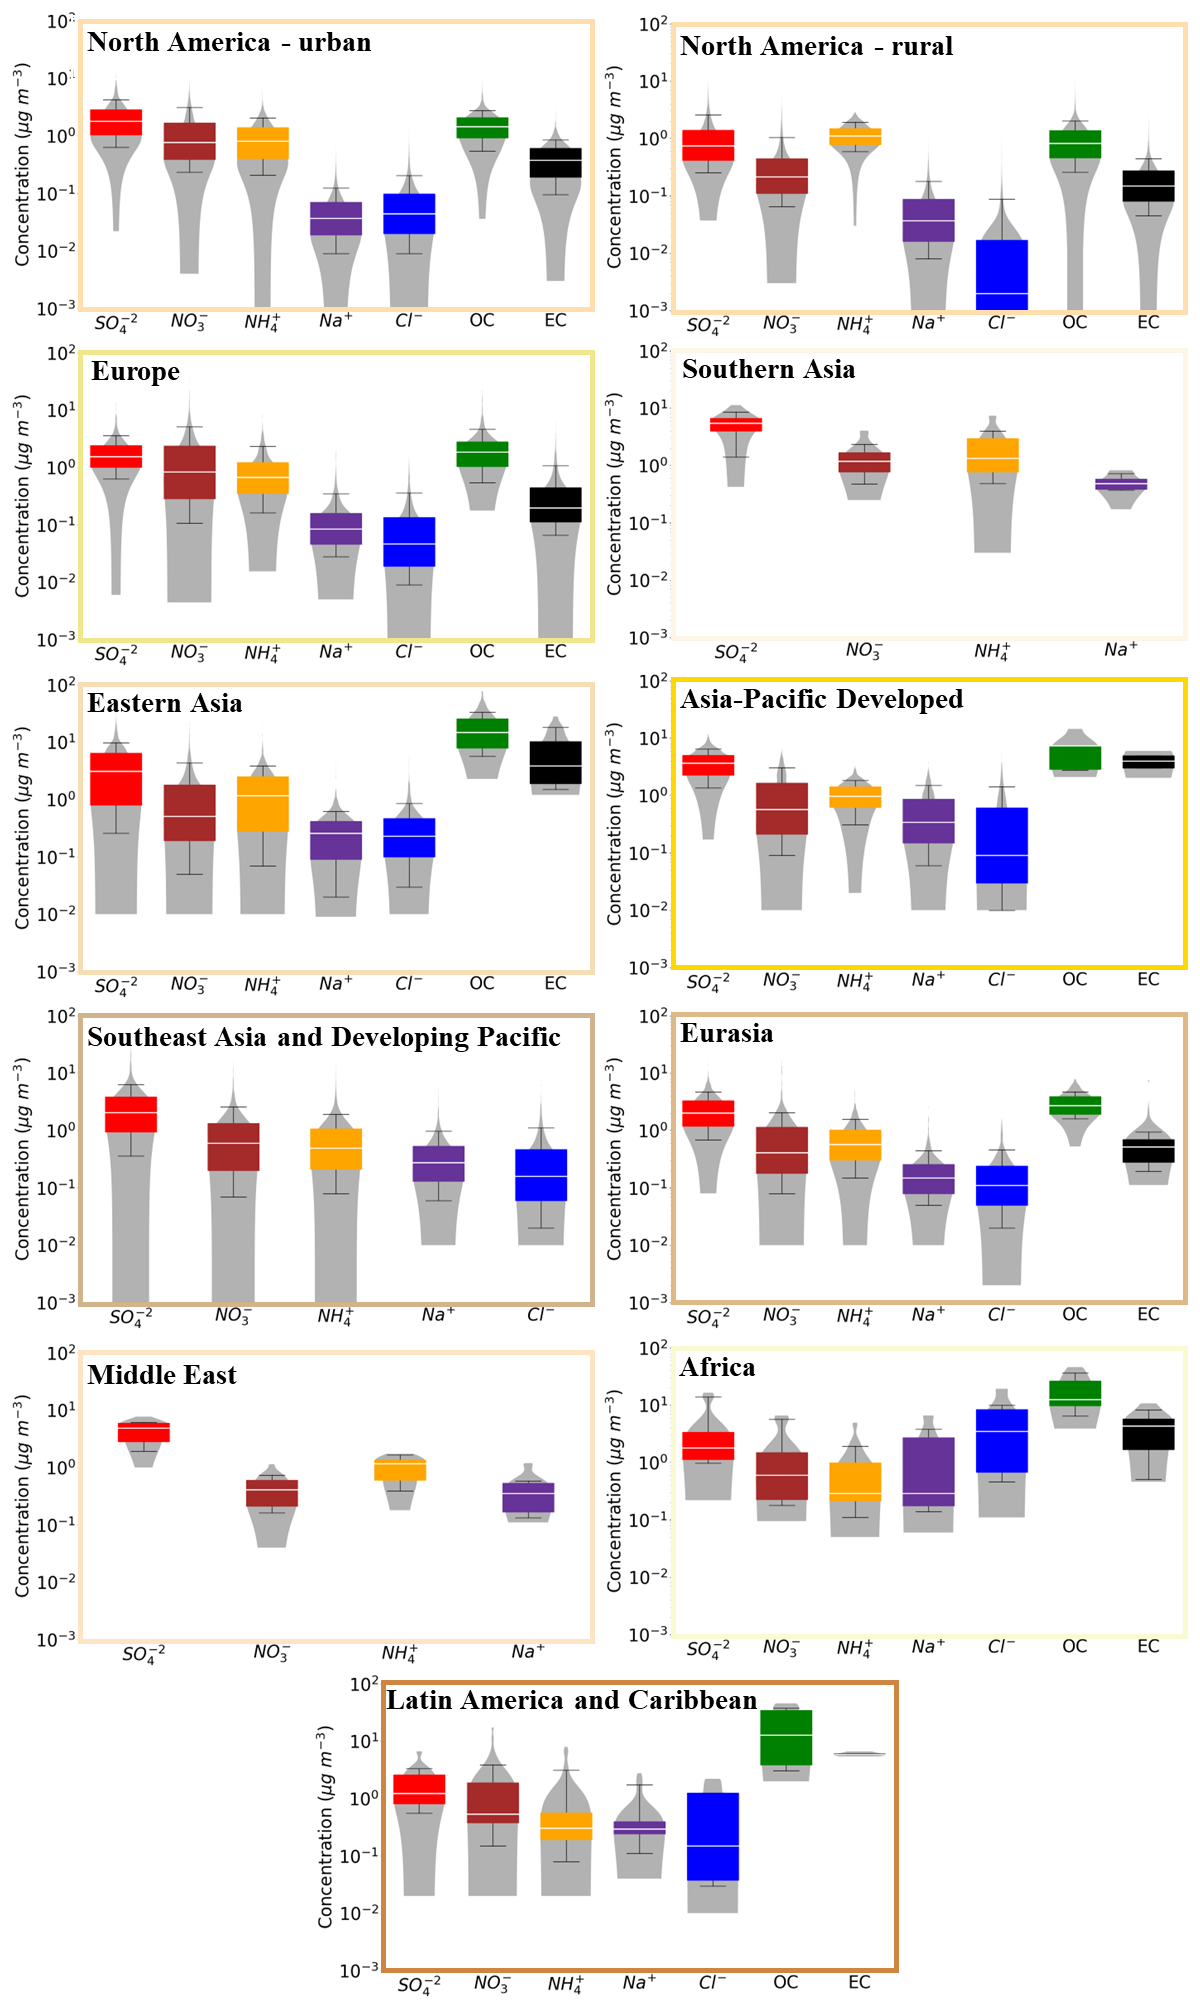
Figure 7Bar chart plots depicting the distribution (violin) and the 25th, 50th, and 75th percentiles (box) of the mass concentration (in µg m−3) for the major PM2.5 aerosol components, i.e., sulfate (red), nitrate (dark red), ammonium (orange), sodium (purple), chloride (blue), organic carbon (green), and elemental carbon (black). The 10th and 90th percentiles (whiskers) for each aerosol component are also shown.
2.2.1 PM2.5 aerosol composition
The PM2.5 aerosol composition derived from filter observations around the world is depicted in Fig. 7. The measured organic carbon (OC) has been converted to organic mass (OM) using an appropriate OM:OC ratio, depending on the expected degree of chemical aging of the OA for each monitoring network. For the EPA network, which includes monitoring sites mainly in urban areas, a multiplier of 1.6 is applied to convert the measured OC to OM. The IMPROVE network, which includes sites representative of regional haze conditions, uses a higher OM:OC ratio of 1.8 to account for the more aged OA particles expected in remote areas. EMEP stations in Europe are a mix of urban and rural locations, so measured OC concentrations are typically multiplied by a median OM:OC value of 1.7. OA is the dominant component of PM2.5 in most regions, especially over regions affected by the tropical forests of the Southern Hemisphere (e.g., Latin America and the Caribbean and Africa). Over the Northern Hemisphere, OA and EC dominate the aerosol composition in Eastern Asia (54 % and 22 % of total PM2.5) and contribute significantly to PM2.5 over Europe (30 % and 5 % of total PM2.5). On the other hand, over North America, OA share is equally important to sulfate over rural areas (28 % of total PM2.5 each) and less important over urban areas (24 % versus 33 % of sulfate). Indeed, sulfate is the most important inorganic component of PM2.5 around the world (∼ 50 % of the inorganic PM2.5 mass on average), followed by nitrate and ammonium (∼ 20 % each). This contradicts the results from AMS campaigns showing that ammonium nitrate surpasses ammonium sulfate in the aerosol composition, especially in Europe and North America. However, filter measurements are prone to negative sampling artifacts due to evaporation losses of the semi-volatile ammonium nitrate under warm and dry conditions (Ames and Malm, 2001), in contrast to the non-volatile sulfate aerosols (Docherty et al., 2011). The contribution of sulfate to the measured inorganic PM2.5 aerosol composition is the highest over the Middle East, while nitrate contributes significantly over Europe (Fig. 7). The dominant inorganic ion varies with the season (Figs. S2–S4). Nitrate is most important in winter, accounting for about a quarter of total PM2.5, while sulfate is the dominant PM2.5 component in summer and spring. Over the eight regions where all seven components are measured, the average contribution of each species to total PM2.5 concentration is 21 %, 12 %, 10 %, 2 %, 3 %, 40 %, and 12 % by sulfate, nitrate, ammonium, sodium, chloride, OA, and EC, respectively.
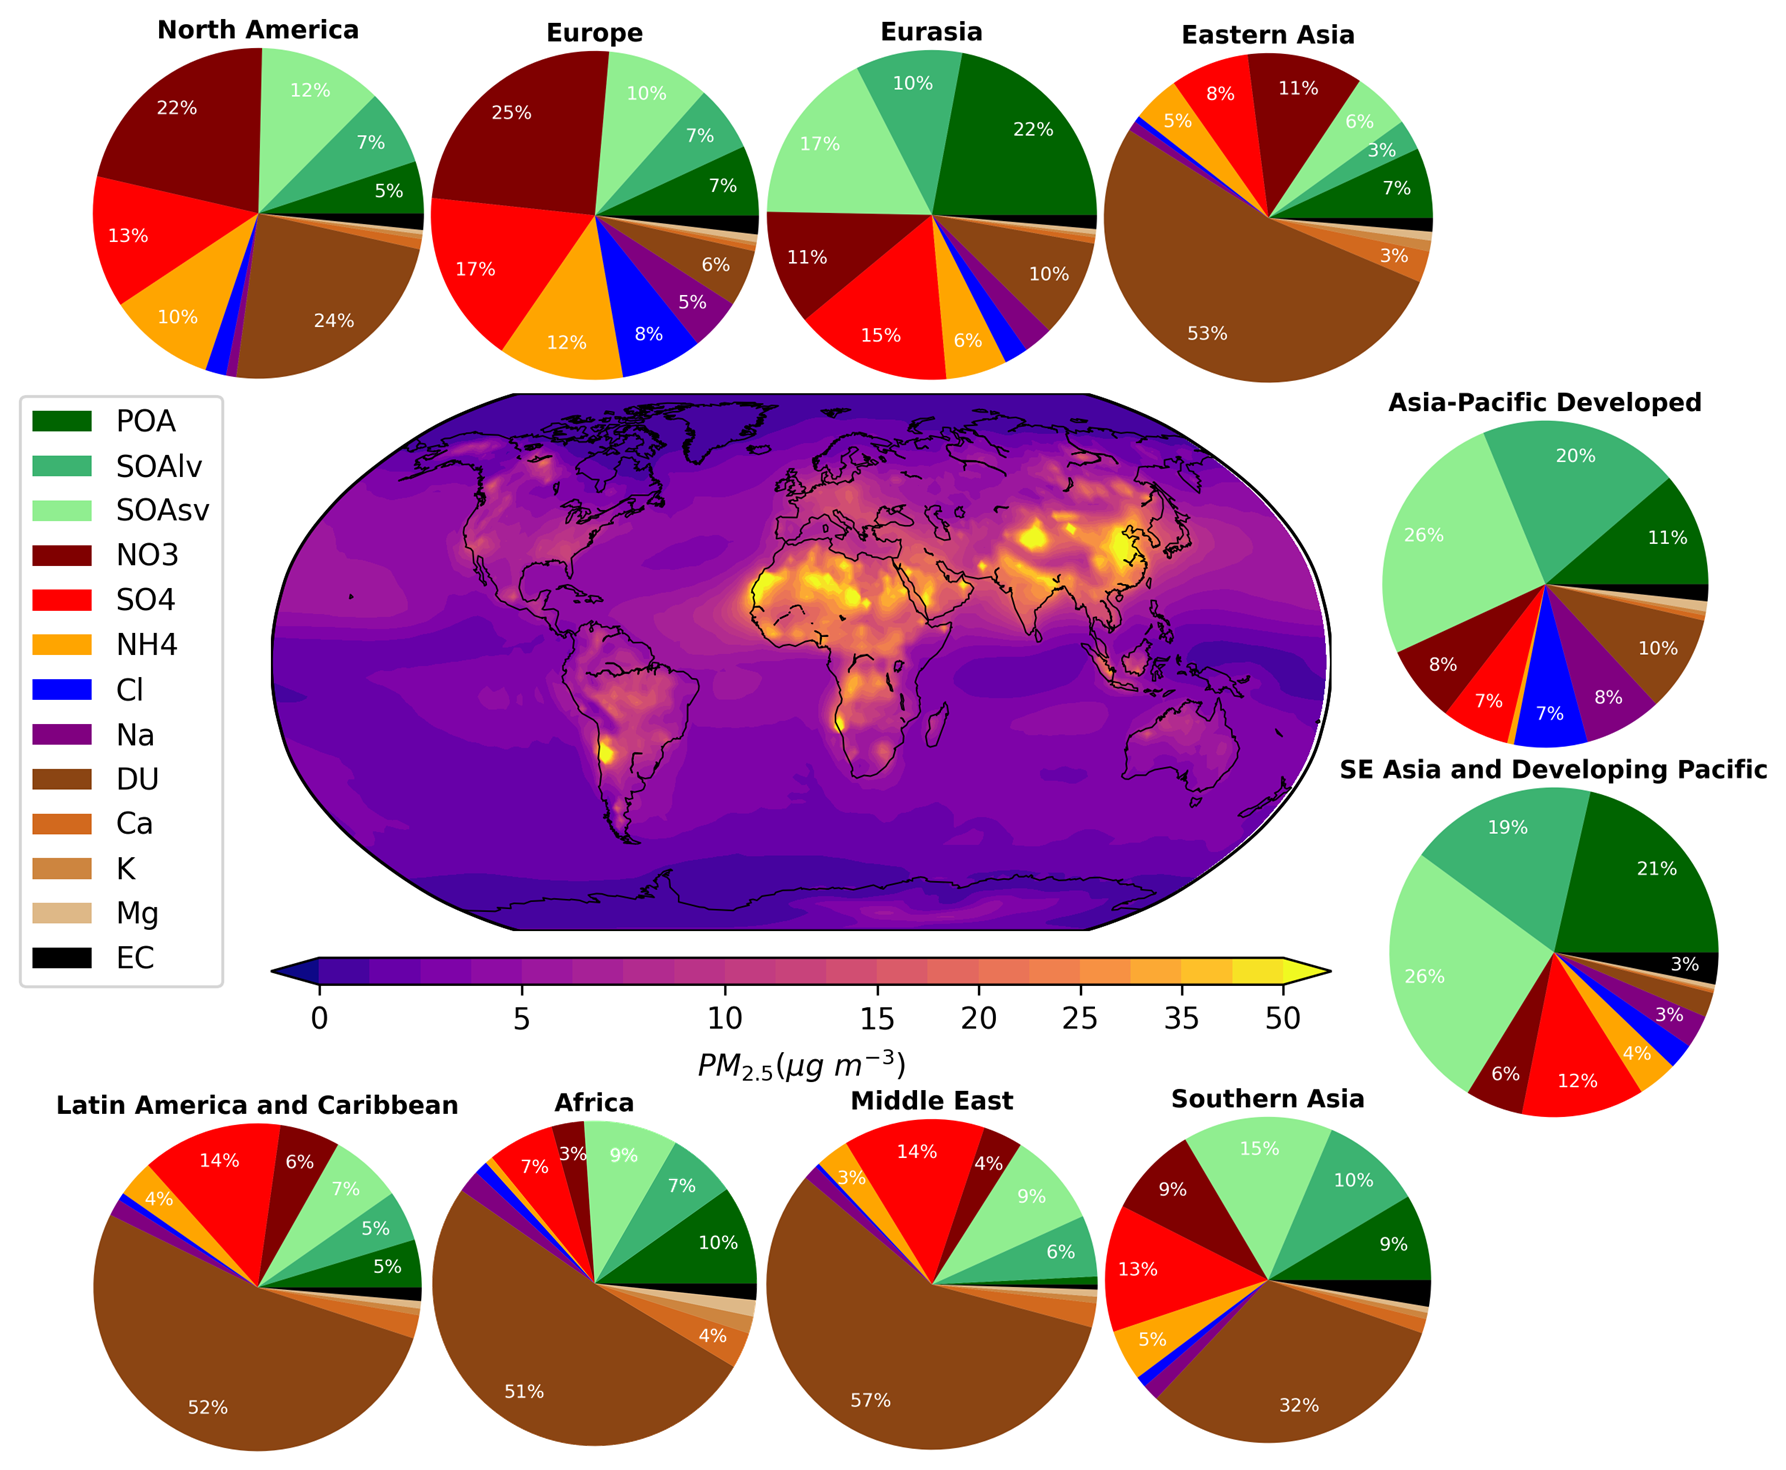
Figure 8Pie charts showing the simulated 21-year average chemical composition of PM2.5 in the 10 regions considered as defined by the intermediate-level regional breakdown of the IPCC Sixth Assessment Report (AR6), Working Group III (IPCC, 2023). The central world map shows the simulated average near-surface concentration of PM2.5 (in µg m−3) during the period 2000–2020. The spatial domains of the 10 regions are illustrated in Figs. 3 and 6.
3.1 Aerosol chemistry–climate model description
The ECHAM/MESSy Atmospheric Chemistry (EMAC) model is used; it is a numerical chemistry and climate simulation system that includes sub-models describing atmospheric processes from the troposphere to the mesosphere and their interaction with oceans, land, and human influences (Jöckel et al., 2006). EMAC uses the Modular Earth Submodel System (MESSy2) (Jöckel et al., 2010) to link the different sub-models with an atmospheric dynamical core, being an updated version of the 5th generation European Centre – Hamburg general circulation model (ECHAM5) (Roeckner et al., 2006). The EMAC model has been extensively described and evaluated against observations and satellite measurements and can be applied to a range of spatial resolutions (Tsimpidi et al., 2016; Karydis et al., 2016; Janssen et al., 2017; Tsimpidi et al., 2018; Pozzer et al., 2022; Milousis et al., 2024; Wang et al., 2025). The spectral resolution used in this study is T63L31, corresponding to a horizontal grid resolution of 1.875° × 1.875° and 31 vertical layers extending to 10 hPa at about 25 km from the surface. The presented model simulations cover the period 2000–2020.
In the model configuration used, EMAC calculates fields of gas-phase species online through the Module Efficiently Calculating the Chemistry of the Atmosphere (MECCA) submodel (Sander et al., 2019). Aerosol microphysics and gas/aerosol partitioning are calculated by the Global Modal-aerosol eXtension (GMXe) module (Pringle et al., 2010). Cloud properties and microphysics are calculated by the CLOUD submodel utilizing the detailed two-moment microphysical scheme of Lohmann and Ferrachat (2010) and considering a physically based treatment of the processes of liquid (Karydis et al., 2017) and ice crystal (Bacer et al., 2018) activation. The inorganic aerosol composition is computed with the ISORROPIA-lite thermodynamic equilibrium model (Kakavas et al., 2022), as implemented in EMAC by Milousis et al. (2024). ISORROPIA-lite is an accelerated and simplified version of the widely used ISORROPIA-II aerosol thermodynamics model, which calculates the gas/liquid/solid equilibrium partitioning of the K+–Ca2+–Mg2+–NH–Na+–SO–NO–Cl−–H2O aerosol system. The organic aerosol composition and evolution in the atmosphere are calculated by a computationally lite version of the ORACLE module (Tsimpidi et al., 2014), which simulates a wide variety of semi-volatile organic products, separating them into bins of logarithmically spaced effective saturation concentrations (Fig. S1). Further details on the EMAC submodels and aerosol modules utilized can be found in the Supplement.
3.2 Emissions
Fuel combustion and agriculture-related emissions are based on the high-resolution (0.1° × 0.1°) Copernicus Atmosphere Monitoring Service global anthropogenic emission inventory, CAMSv4.2, which is applied at monthly intervals and varies between years (Granier et al., 2019). As our objective is to analyze decadal trends under business-as-usual conditions, the CAMS v4.2 inventory used in this study does not account for the temporary emission reductions associated with the COVID-19 lockdowns. The emission factors used for the distribution of traditional POA emissions from fuel combustion and open biomass burning sources into the three volatility bins considered by ORACLE are based on the work of Tsimpidi et al. (2014). These emission factors additionally account for intermediate volatile organic compound (IVOC) emissions that are not included in the original emission inventories. We assume that the missing IVOC emissions from anthropogenic combustion are 1.5 times the traditional OA emissions included in the inventory. Low-volatility organic compounds (LVOCs) and semivolatile organic compounds (SVOCs) are assumed to be emitted in the aerosol phase, while IVOCs are emitted in the gas phase. Then, they are allowed to partition between the gas and particle phases. Figure S5 shows the temporal evolution of anthropogenic emissions of inorganic (SO2, NH3, and NOx) and organic (LVOC, SVOC, IVOC, and VOC) aerosol precursors over the last 20 years, while Table S2 shows their decadal percentage change between the 2000s and 2010s. Open biomass burning emissions are calculated online based on the dry matter burned from observations (Kaiser et al., 2012) and the fire type that affects the emission factors for the different tracers (Akagi et al., 2011). Similar to POA emissions from fuel combustion, POA from biomass burning is distributed to LVOC, SVOC, and IVOC emissions; however, no additional IVOC emissions are assumed for open biomass burning, and therefore, the sum of the biomass burning emission factors is unity (Tsimpidi et al., 2016).
Biogenic emissions of isoprene and terpenes are calculated online using the Model of Emissions of Gases and Aerosols from Nature (MEGANv2.04; Guenther et al., 2012) and vary across years with an average emission flux of 454 and 81.7 Tg yr−1, respectively. The natural emissions of NH3 are based on the GEIA database (Bouwman et al., 1997) and are constant over the years but vary seasonally. The database includes excreta from domestic animals, wild animals, synthetic nitrogen fertilizers, oceans, biomass burning, and emissions from soils under natural vegetation. NOx produced by lightning is calculated online and distributed vertically based on the parameterization of Price and Rind (1992). The emissions of NO from soils are calculated online based on the algorithm of Yienger and Levy (1995). Eruptive and non-eruptive volcanic degassing emissions of SO2 are based on the AEROCOM dataset (Dentener et al., 2006). The oceanic DMS emissions are calculated online by the AIRSEA submodel (Pozzer et al., 2006). Emission fluxes of sea spray aerosols are calculated online (Guelle et al., 2001) and vary between years, assuming a constant composition of 55 % Cl−, 30.6 % Na+, 7.7 % SO, 3.7 % Mg2+, 1.2 % Ca2+, and 1.1 % K+ (Seinfeld and Pandis, 2006). The average global emission flux of sea spray aerosols is 5910 Tg yr−1. These emissions are introduced into the accumulation and coarse aerosol modes, consistent with the typical size distribution of sea spray particles. Dust emission fluxes are also calculated online using the meteorological fields calculated by the EMAC model (temperature, pressure, relative humidity, soil moisture, and surface friction velocity), together with specific input fields for soil properties (i.e., the geographical location of the dust sources, the clay fraction of the soils, the rooting depth, and the monthly vegetation area index), producing emissions that vary between years (Astitha et al., 2012). The average global emission flux of dust particles is 5684 Tg yr−1. Emissions of individual crustal species (Ca2+, Mg2+, K+, and Na+) are estimated as a constant fraction of mineral dust emissions. This fraction is determined based on the geological information that exists for the different dust source regions of the planet (Karydis et al., 2016) and is applied online to the calculated mineral dust emission fluxes based on the location of the grid cell (Klingmüller et al., 2018). Similar to sea spray, dust emissions are allocated to the accumulation and coarse modes, reflecting their observed size distribution in the atmosphere.
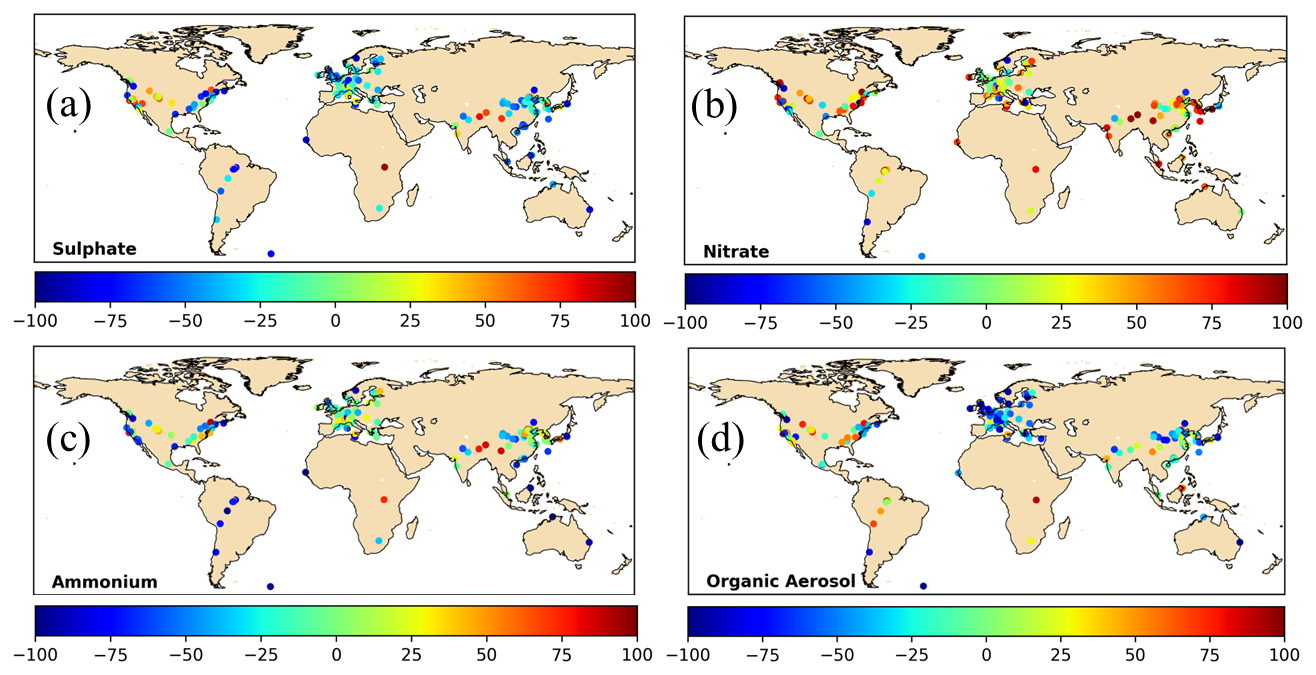
Figure 9Deviations (in %) between EMAC results and the AMS and ACSM datasets over the period 2000–2020 for PM1 (a) sulfate, (b) nitrate, (c) ammonium, and (d) organic aerosol. Negative values (blue colors) correspond to underprediction of the PM1 aerosol concentrations by the model.
3.3 Model calculated aerosol composition
The EMAC simulation corroborates the findings based on filters and AMS observations that OA is the dominant component of fine atmospheric aerosols in all continental regions, excluding contributions from windblown mineral dust, which are not captured by the observational datasets used here (Fig. 8). The strongest OA contribution to total PM2.5 (more than 50 %) is calculated over regions affected by biomass burning and biogenic VOC emissions: the tropical forests and savannas of Africa, Latin America and the Caribbean, Southern Asia, and Southeast Asia and the Developing Pacific, as well as the boreal forests of Eurasia. Considerable OA shares (30 %–35 %) are also calculated over the industrialized regions of the Northern Hemisphere (i.e., North America, Europe, Eastern Asia) and the Middle East, where strong fossil and biofuel combustion-related sources are located. OA shares peak in the summer over Europe and North America and in the winter over Eastern Asia (Figs. S2–S4). EMAC is also able to reproduce the dominance of SOA (resolved by the AMS as OOA) in all regions, even in regions with strong primary emissions, e.g., close to tropical forests or industrial areas. However, EMAC cannot reproduce the dominance of aged SOA in many cases (resolved as M-OOA by the AMS), especially over Eastern Asia, revealing weaknesses in the oxidation scheme of its organic module (e.g., missing sources and formation pathways). POA has the strongest contribution (more than 20 %) over heavily forested areas (e.g., Africa and Eurasia) and the lowest (less than 10 %) over highly industrialized regions (e.g., Europe and the Middle East). Regarding the inorganic aerosol composition, the EMAC model is not always consistent with filter-based observations, since in many regions it reveals that nitrate surpasses sulfate in the aerosol composition, which is also supported by the AMS results. These regions are Europe, North America, and Eastern Asia, where nitrate accounts for ∼ 30 % of total PM2.5 (excluding contributions from windblown mineral dust), with higher contributions in winter and lower contributions in summer (Figs. S2–S4). Sulfate becomes the dominant inorganic aerosol component only during winter over North America (Figs. S2–S4). On the other hand, sulfate contribution is stronger over the Middle East and Latin America and the Caribbean (∼ 30 %). Ammonium follows the spatial distribution of sulfate and nitrate with high contributions to PM2.5 composition (∼ 10 %–15 %) over the highly populated and agriculturally intensive regions of North America, Europe, Eastern Asia, and Southern Asia. Mineral dust is simulated to be a significant natural contributor to aerosol composition in some regions (Fig. 8), accompanied by chemically active crustal cations such as calcium, potassium, sodium, and magnesium. Their total share of PM2.5 ionic composition is around 15 % in regions affected by desert emissions (e.g., Africa, the Middle East, and Eastern Asia), while in other areas their contribution is limited (∼ 1 %). Finally, sodium and chloride from sea salt emissions are found to be high over regions with long coastlines per land area. Most notably, chloride consists of 7 % of the total PM2.5 over the Asia-Pacific Developed region, while sodium is the dominant inorganic component in the same region, with a share of 8 %.
3.4 Model evaluation
In this study, we compare the model results with PM1 observational datasets, where each observational dataset typically represents a monthly average. The model output is sampled for the grid cell containing the location of the field campaign for the corresponding month and year. The statistical evaluation of EMAC PM1 concentrations against AMS and ACSM datasets over Europe, North America, Eastern Asia, and other tropical and subtropical regions can be found in Table S3.
The EMAC model generally underpredicts sulfate concentrations, with performance varying by region. Over North America, it performs best in rural areas (NMB = −8 %; NMB denotes normalized mean bias) but underestimates urban concentrations (NMB = −40 %) due to low spatial resolution and possible errors in the assumed injection height of SO2 (Yang et al., 2019). It overestimates sulfate in the Midwest and underestimates it in the Eastern states, resulting in a narrower concentration range than observations (Fig. 9a). In Europe, sulfate is underpredicted by ∼ 40 % across all environments, except for some overestimations in Italy and Greece, due to errors in emissions and an underestimation of the oxidation capacity of the atmosphere (EMEP, 2021) (Fig. 9a). Around 65 % of simulated concentrations are within a factor of 2 compared to measurements. Over Asia, sulfate concentrations are higher than in Europe or North America, but the model still underpredicts (Table S3). The simulated concentration range is narrower than observed, covering little more than 1 order of magnitude compared to 2 orders of magnitude reported by the AMS. In tropical and subtropical regions, sulfate is underestimated, particularly in Asia (NMB %), with smaller underpredictions in Africa, Latin America, and the Caribbean (NMB = −30 %).
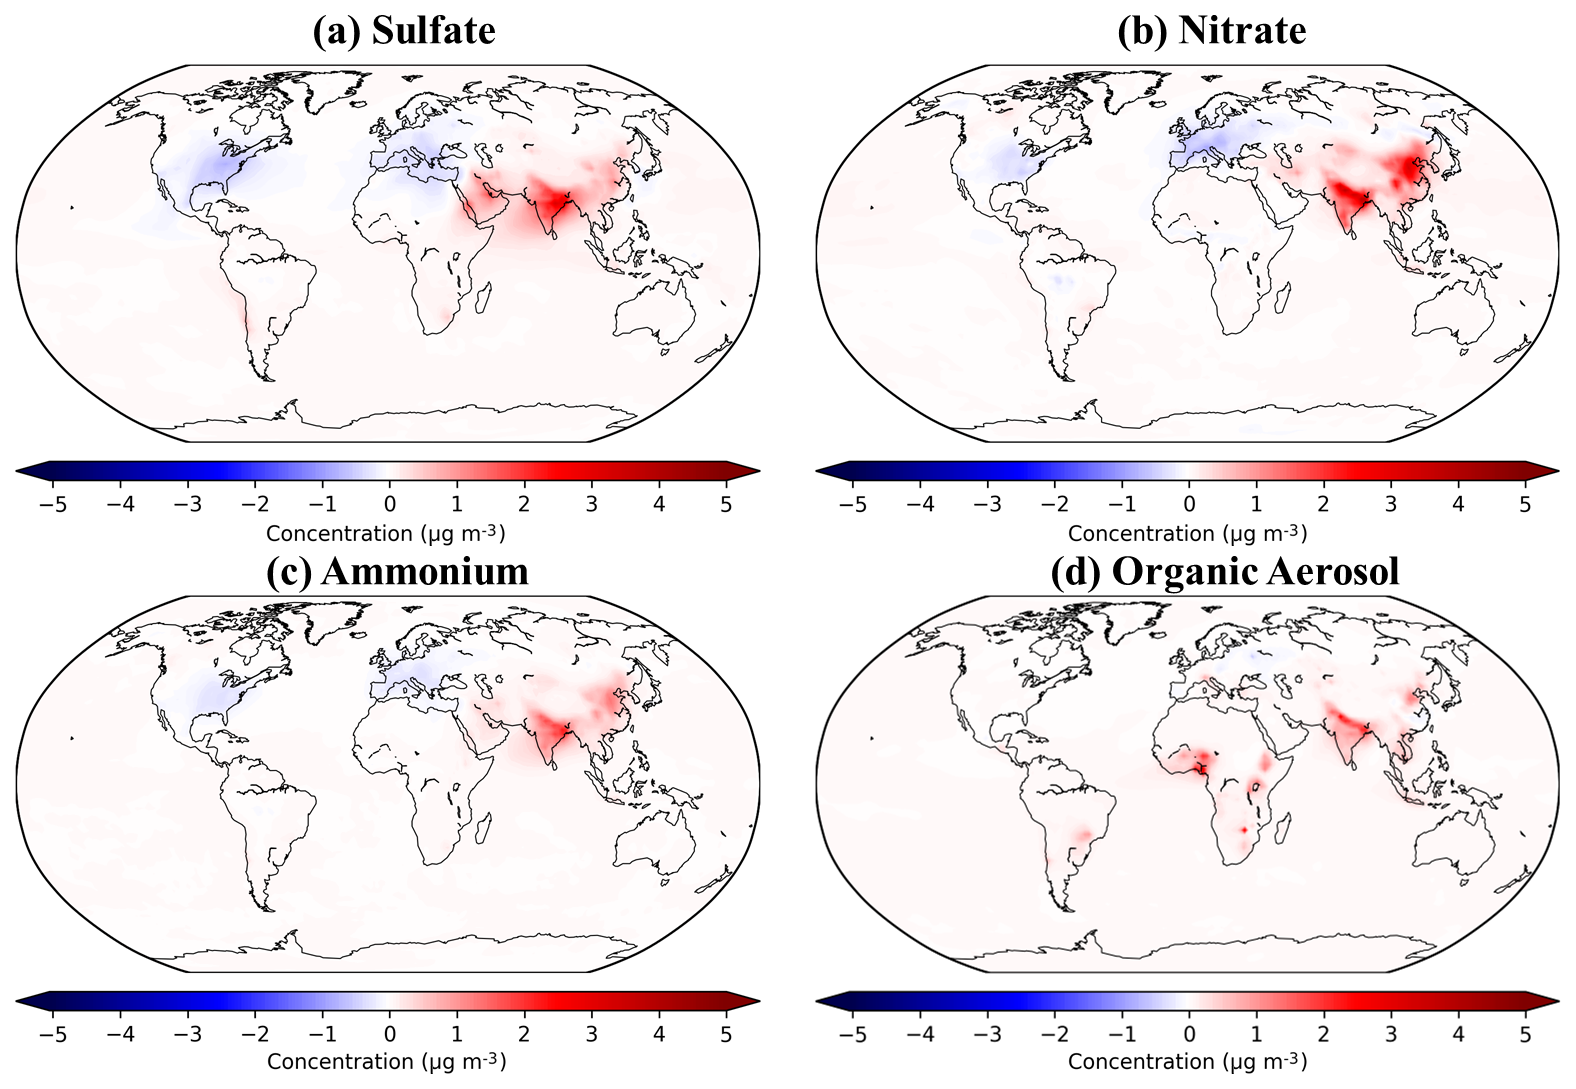
Figure 10Simulated decadal change in (a) sulfate, (b) nitrate, (c) ammonium, and (d) anthropogenic organic aerosol concentrations between the 2000s and 2010s.
Average nitrate concentrations are well captured by the model across regions (NMB <10 %), but high scatter (NME of 40 %–80 %; NME denotes normalized mean error) indicates discrepancies are not systematic. The scatter is more intense over North America (NME = 88 %), while in Europe, performance is better (NMB = −4 %, NME = 53 %), with 70 % of data within a factor of 2 compared to observations. In Eastern Asia, nitrate is generally overestimated (NMB = 8 %), especially over the west coast of South Korea and the Chinese inland (Fig. 9b). However, Eastern China and especially the coastal regions are well described by the model. The contribution of sea salt to nitrate formation is important in these coastal regions due to their proximity to the Pacific Ocean (Bian et al., 2017). Therefore, the overestimation of nitrate levels on the west coast of South Korea, in contrast to the well-captured east coast, could be caused by the dominant west–east winds in the Yellow Sea simulated by the model, leading to an overestimation of sea salt content that can contribute to nitrate formation. In tropical and subtropical regions, the model tends to overpredict, except in Latin America and the Caribbean, where it underpredicts (NMB = −50 %). The model strongly overpredicts nitrate in industrialized Japan and Australia but performs well over Southeast Asia and the Developing Pacific (NMB = −3 %).
The EMAC model generally underpredicts ammonium across the Northern Hemisphere but performs satisfactorily with low bias and scatter. The largest discrepancies occur in North America (NME = 63 %), where 50 % of sites fall outside a factor of 2 from observations. In Europe, performance is best (NMB = −9 %), with 75 % of results within a factor of 2 compared to measurements. The model performs particularly well in the high-emission Benelux region (Fig. 9c), indicating an accurate emission inventory for agricultural and livestock NH3. However, it may overestimate the ammonium nitrate formation (rather than ammonium sulfate) due to errors in nitrate and sulfate predictions. Over Asia, ammonium is strongly underestimated (NMB = −30 %), especially in Eastern China, indicating NH3 emission inventory errors. However, it is overpredicted in inland deserts (e.g., Tibet) and South Korea, aligning with nitrate overpredictions, suggesting excessive NH3 condensation into aerosols, leading to unrealistic ammonium nitrate formation. In tropical and southern regions, ammonium underpredictions are more severe (NMB = −40 % to −60 %), particularly in Africa and the Asia-Pacific Developed region. The largest underprediction occurs in Latin America, though both EMAC and AMS agree that ammonium contributes the smallest fraction to PM1. Overall, discrepancies are linked to uncertainties in global livestock NH3 emissions as criticized by Hoesly et al. (2018).
The model performance in simulating OA concentrations varies across continents. Over North America, the model captures mean OA levels well (NMB = −4 %) but shows significant scatter (NME = 64 %). It overpredicts OA in rural areas (NMB = 37 %) while underpredicting it in urban and downwind locations (NMB = −28 %). Over Europe, OA is generally underestimated (Fig. 9d), while over Eastern Asia, model performance is best (NMB = −29 %, NME = 49 %). The model does well in rural and downwind locations, with 75 % of data points within a factor of 2 compared to observations. However, as with many global models (Tsigaridis et al., 2014), it fails to capture extremely high OA concentrations in large cities due to spatial resolution limitations. For other regions, OA underpredictions occur mainly in South Asia and the Developing Pacific, especially in urban areas, while overpredictions occur over Africa.
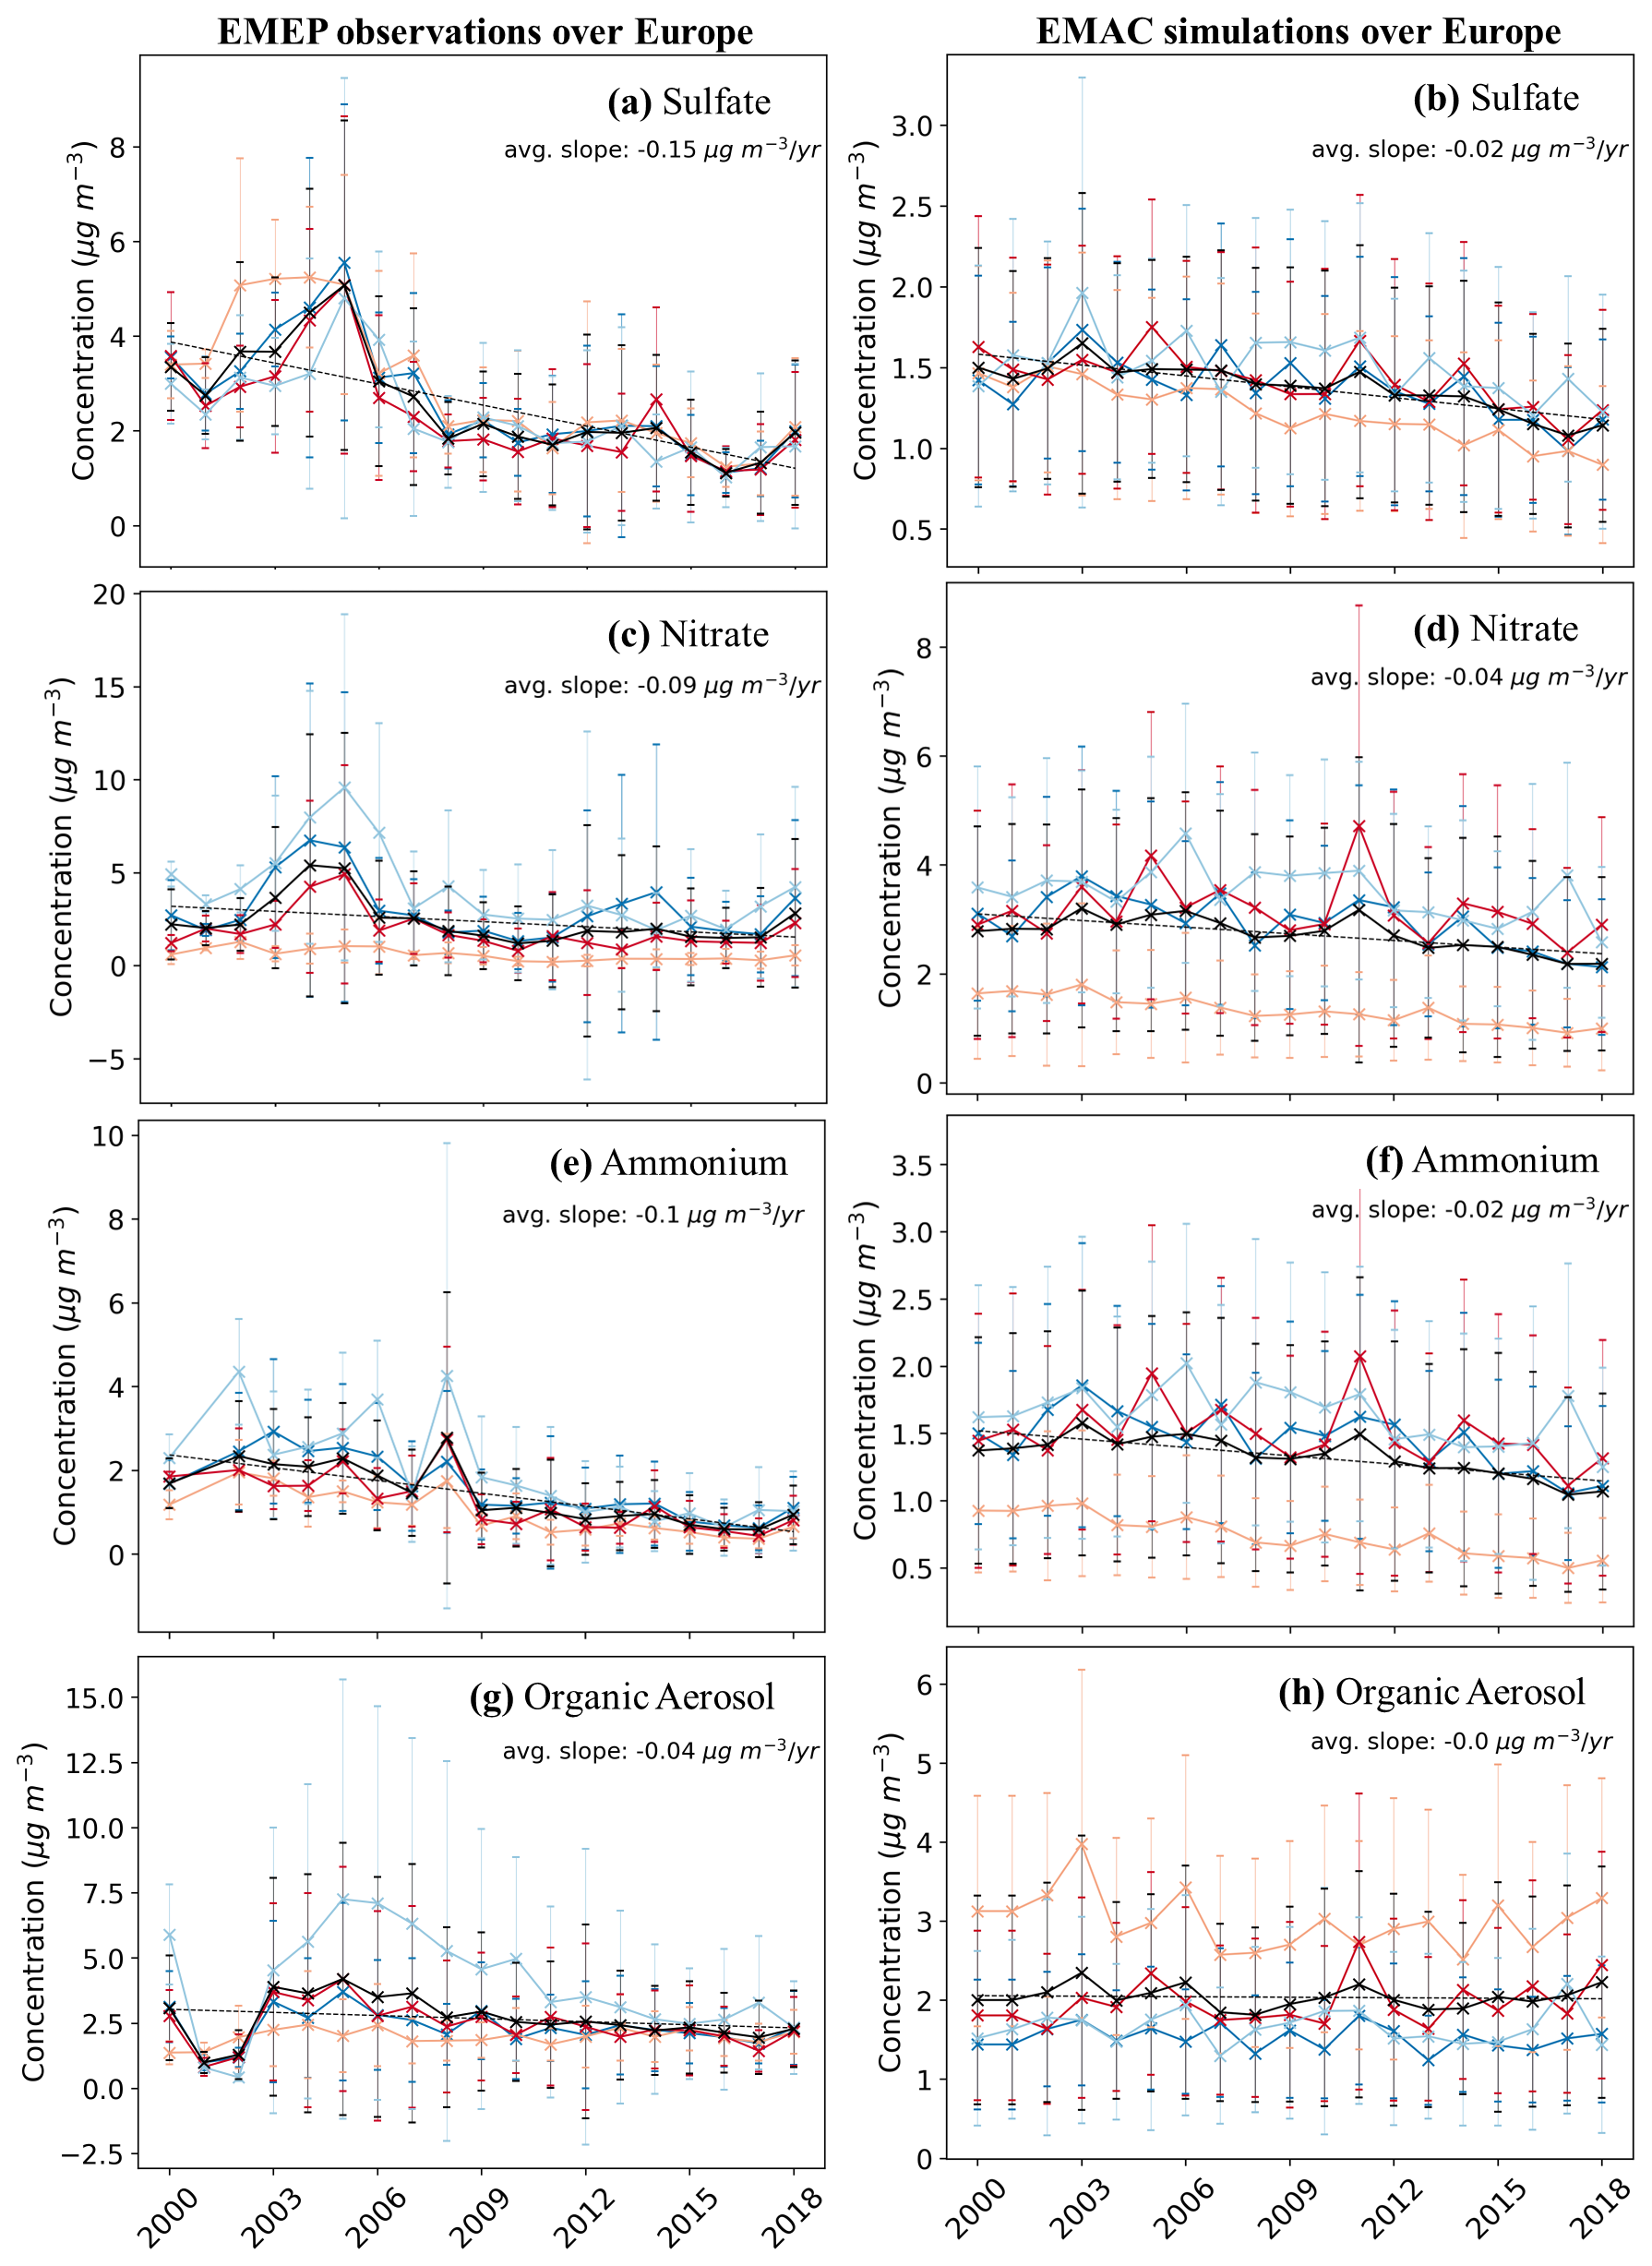
Figure 11Temporal evolution of the filter-based observed (a, c, e, and g subplots on the left) and simulated (b, d, f, and h subplots on the right) concentrations of PM2.5 sulfate (a, b), nitrate (c, d), ammonium (e, f), and organic aerosol (g, h) during the period 2000–2018 over Europe. Black lines show the annual trend, while the dark blue, light blue, orange, and red lines represent the seasonal trends during winter, spring, summer, and autumn, respectively. Ranges represent the 1σ SD (standard deviation).
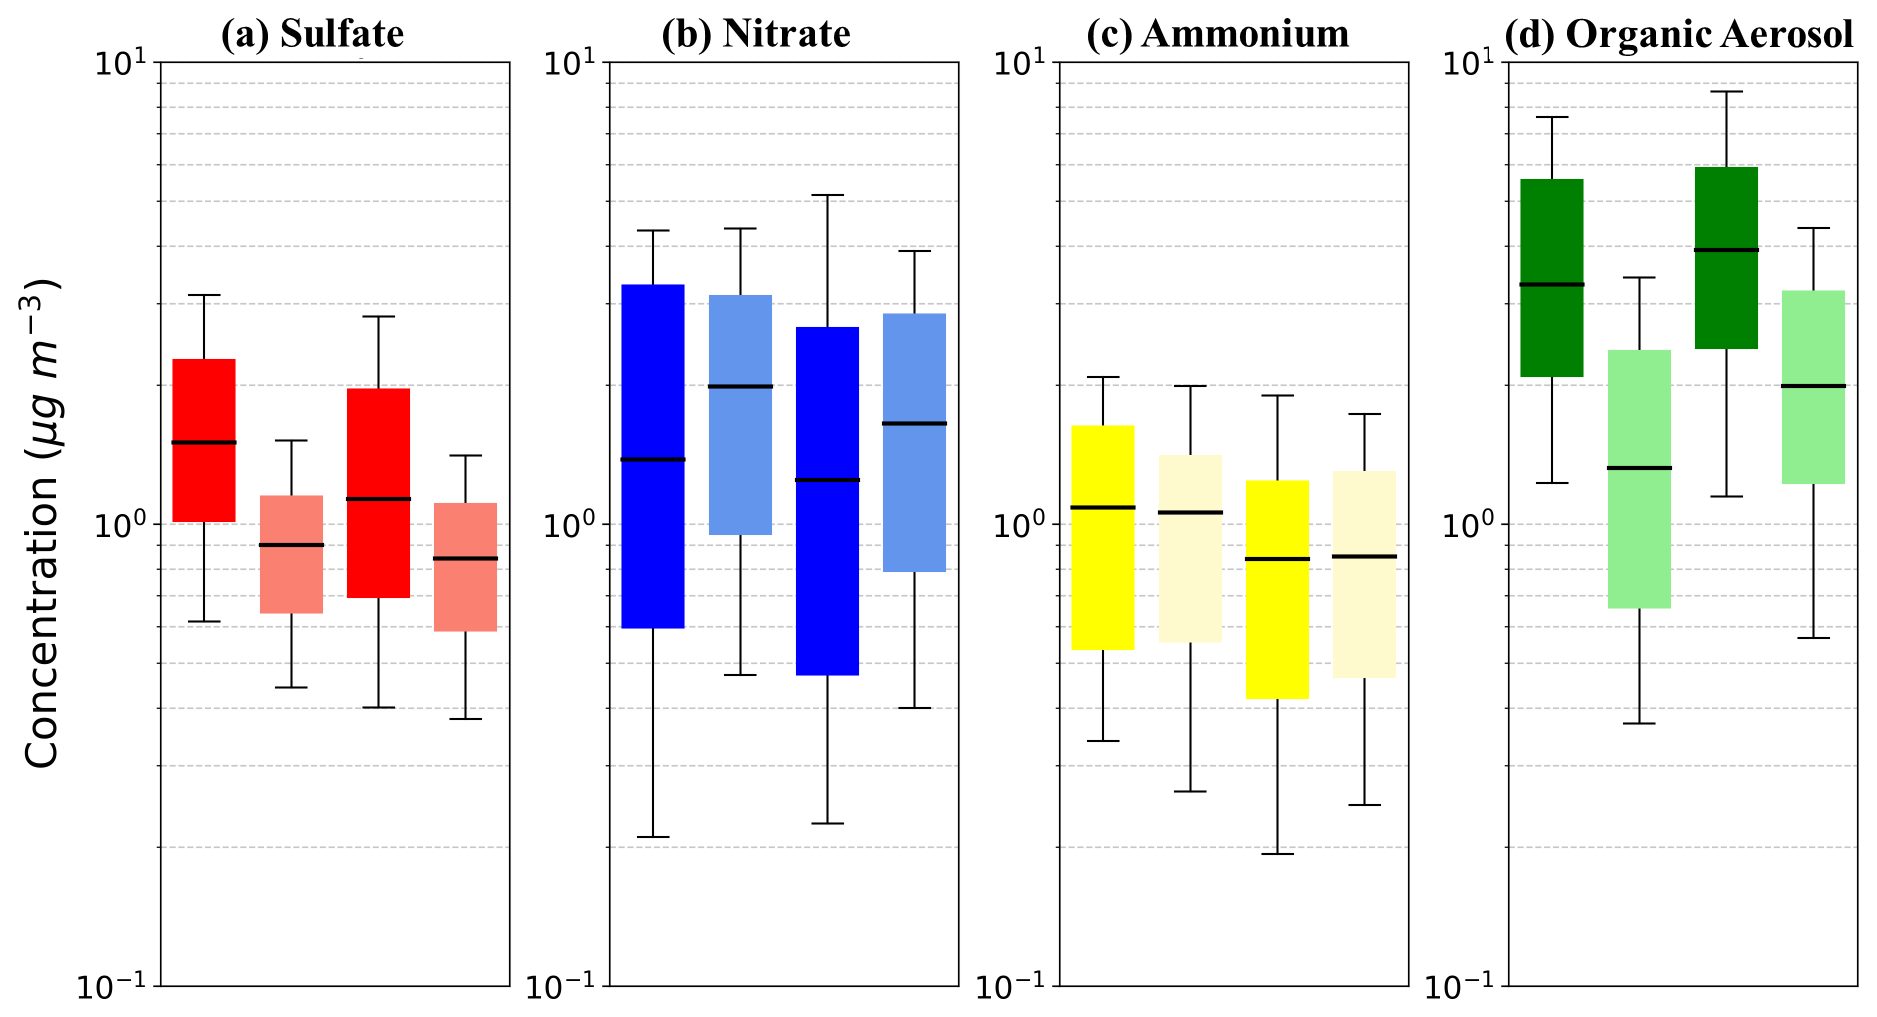
Figure 12Decadal PM1 concentration trends in Europe expressed by the bar plots of the mass concentration (in µg m−3) for (a) sulfate, (b) nitrate, (c) ammonium, and (d) OA during the periods 2000–2010 (left) and 2011–2020 (right) as calculated from the AMS observational dataset (dark colors) and the corresponding simulation values (light colors). The upper and lower whiskers range from 10 % to 90 % of the dataset, and the quartiles range from 25 % to 75 % of the dataset. The black line is the median.
Here, the simulated 21-year global aerosol composition trends of fine aerosols are presented and discussed against trends calculated based on observational data. For this, it is vital to have data well distributed spatially and measured consistently in a comparable way at all observational sites within a region (Tørseth et al., 2012; Hand et al., 2011). These conditions, unfortunately, cannot be satisfied by the available PM1 datasets (Fig. 2). Instead, here we summarize the available observational data from each region for the first versus the second decade of the examined period. This allows a rough statistical comparison between the two decades and can give insights into the overall tendency of the observed aerosol composition trends for each region. These trends are compared against the simulated PM1 trends based on the respective spatiotemporal model data, as well as on all the available model data for the entire model domain over the complete 21-year period (Fig. 10). As the spatial and temporal AMS campaign distribution is much higher for regions in the Northern Hemisphere than the Southern Hemisphere, only PM1 data from the former are plotted here. PM2.5 data from the large monitoring networks are also used to calculate the aerosol composition trends within the regions of North America, Europe, and Eastern Asia. These networks present cooperative measurement efforts that, among others, provide routinely filter-based measured data of aerosol composition. Even though not every element is always measured at all sites and despite data gaps for some places, collectively, the networks' datasets provide the consistency and duration requirements mentioned above. It is important to note that the end year of the observational datasets varies by region, depending on data availability (see Sect. 2.2). The calculated trends are compared against PM2.5 simulated results based on the respective spatiotemporal model data. It is worth noting that a comparison of filter PM2.5 to AMS-detected PM1 is not completely straightforward. First, as seen in Sect. 2.1.3 and 2.2.1, there are expected compositional differences between the two size ranges, especially in polluted regions (Sun et al., 2020; Petit et al., 2015). Second, instrumental differences between the real-time online AMS (DeCarlo et al., 2006) versus the non-real-time offline filter instruments (Docherty et al., 2011; Hand et al., 2011) can impact the measurements in different ways, as discussed in the following sections.
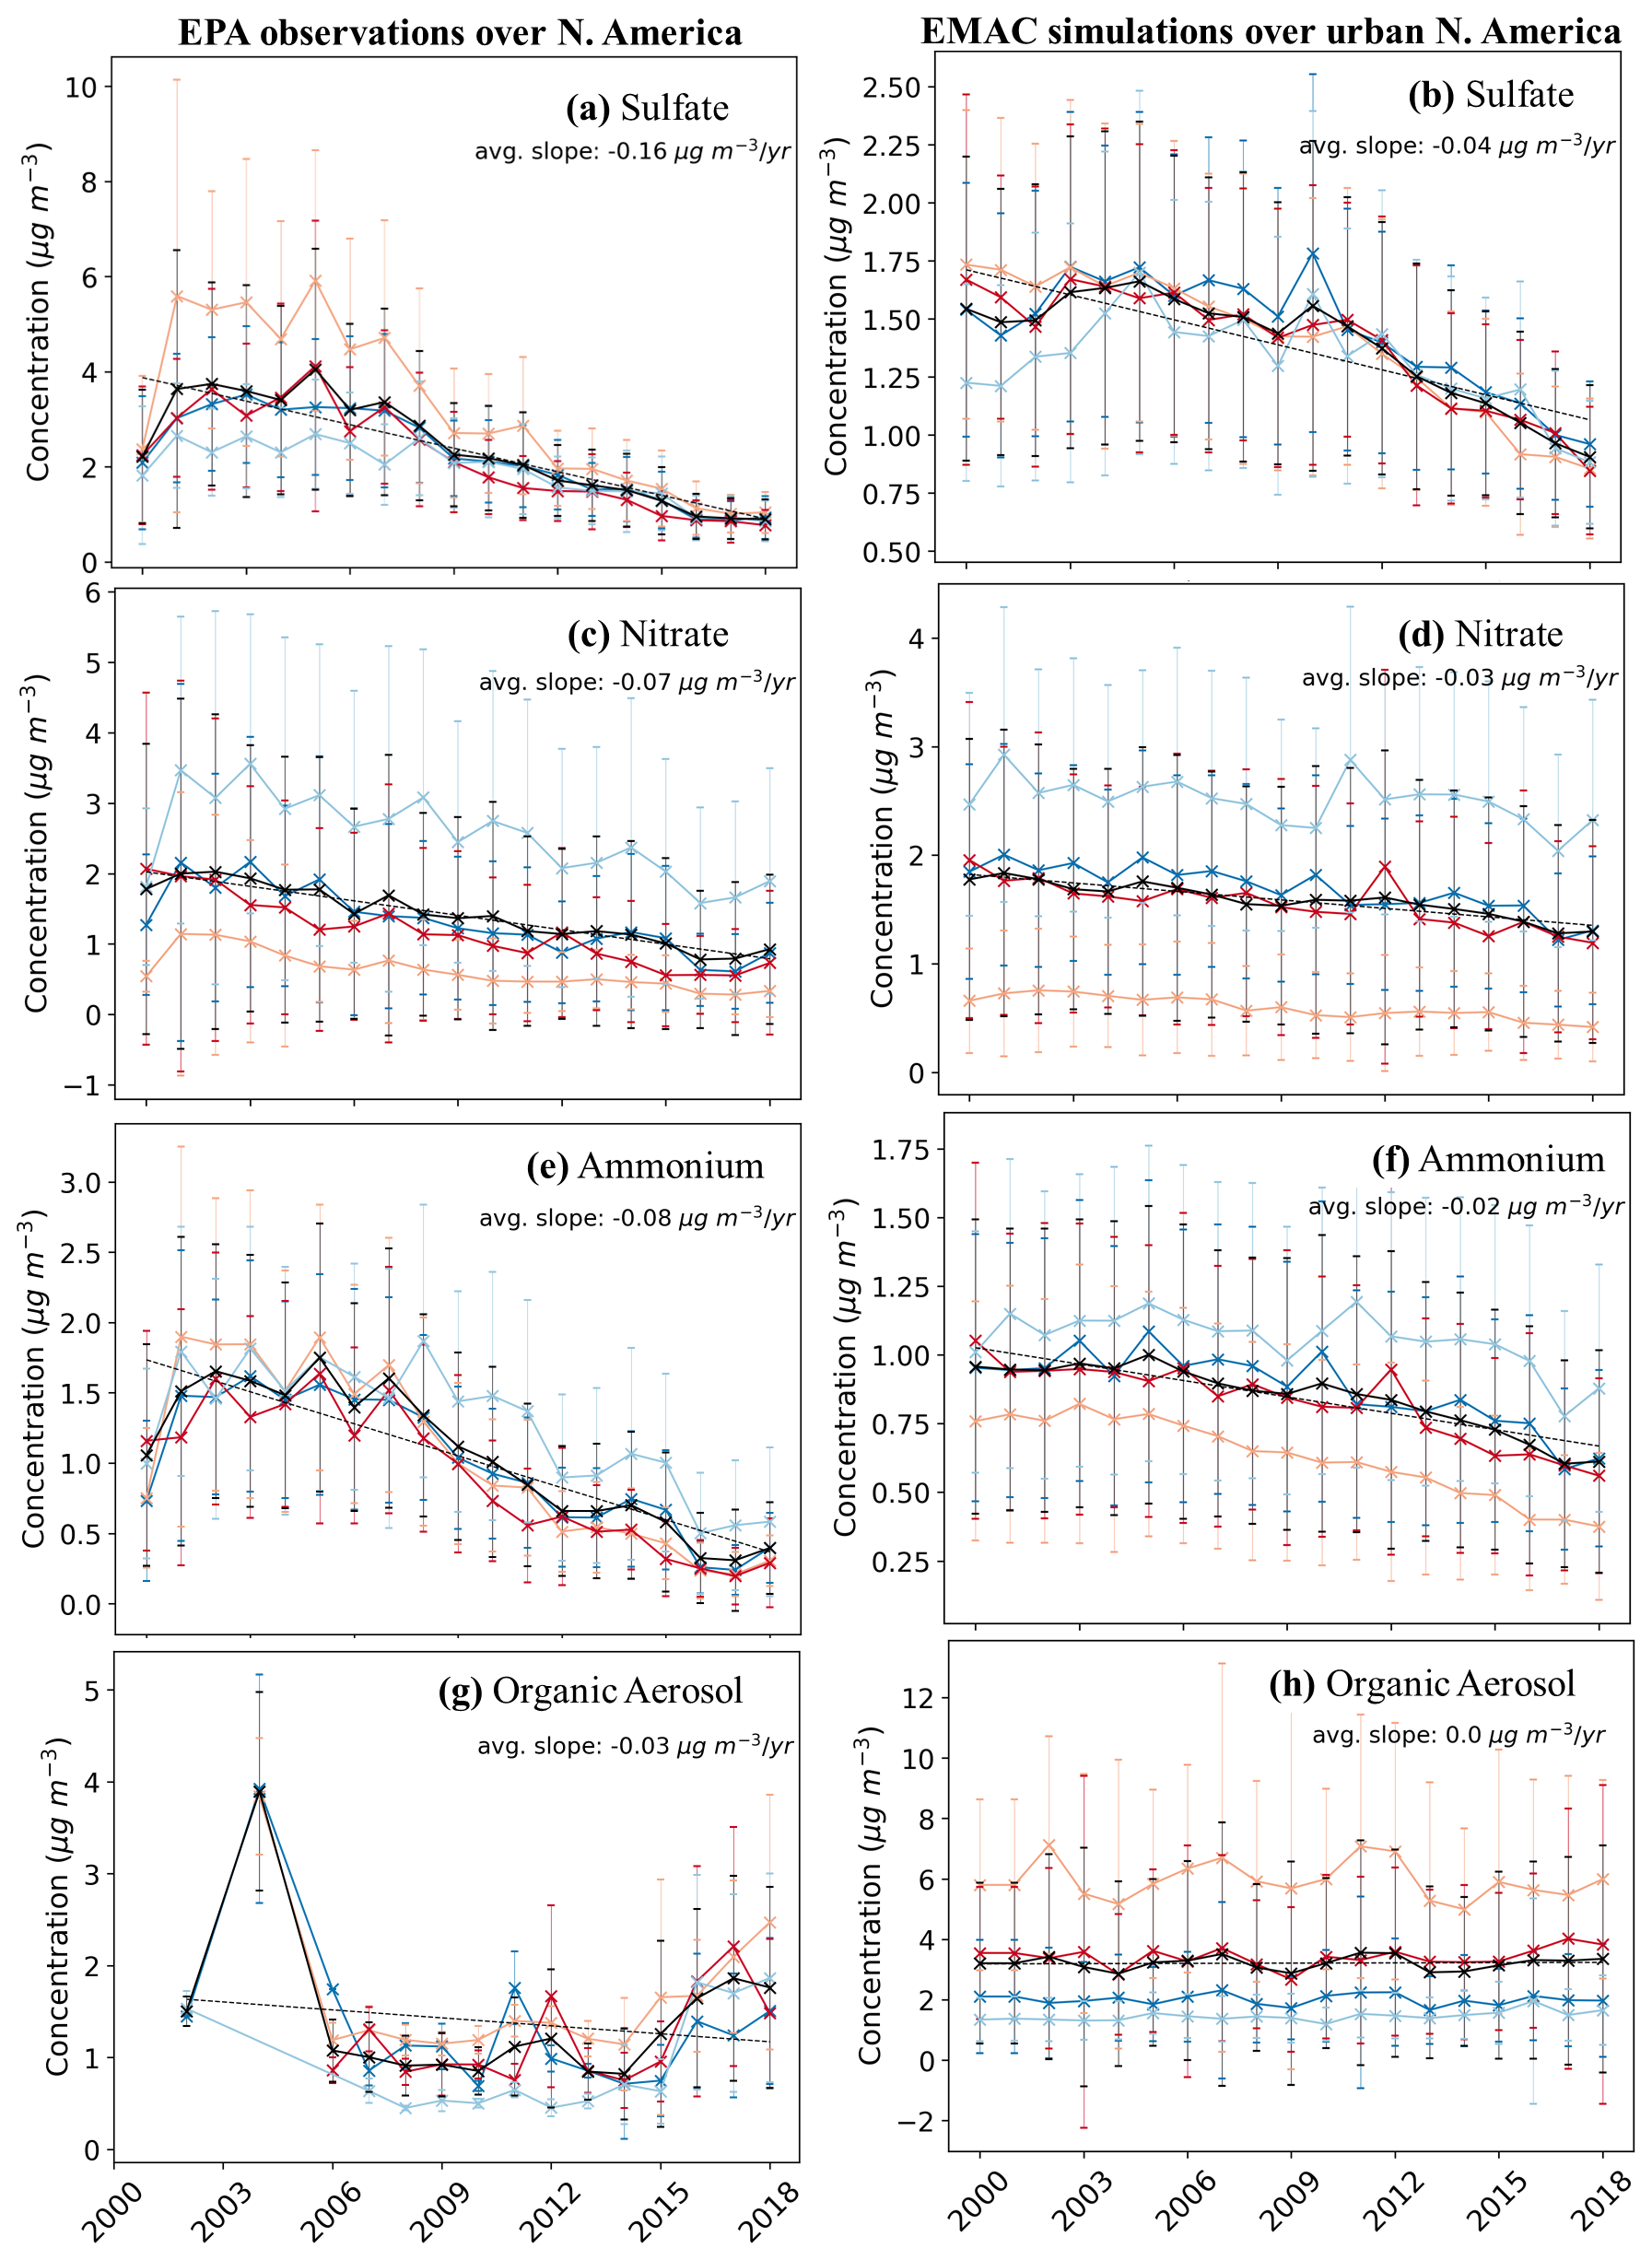
Figure 13Temporal evolution of the filter-based observed (a, c, e, and g subplots on the left) and simulated (b, d, f, h subplots on the right) concentrations of PM2.5 sulfate (a, b), nitrate (c, d), ammonium (e, f), and organic aerosol (g, h) during the period 2000–2018 over urban locations in North America. Black lines show the annual trend, while the dark blue, light blue, orange, and red lines represent the seasonal trends during winter, spring, summer, and autumn, respectively. Ranges represent the 1σ SD (standard deviation).
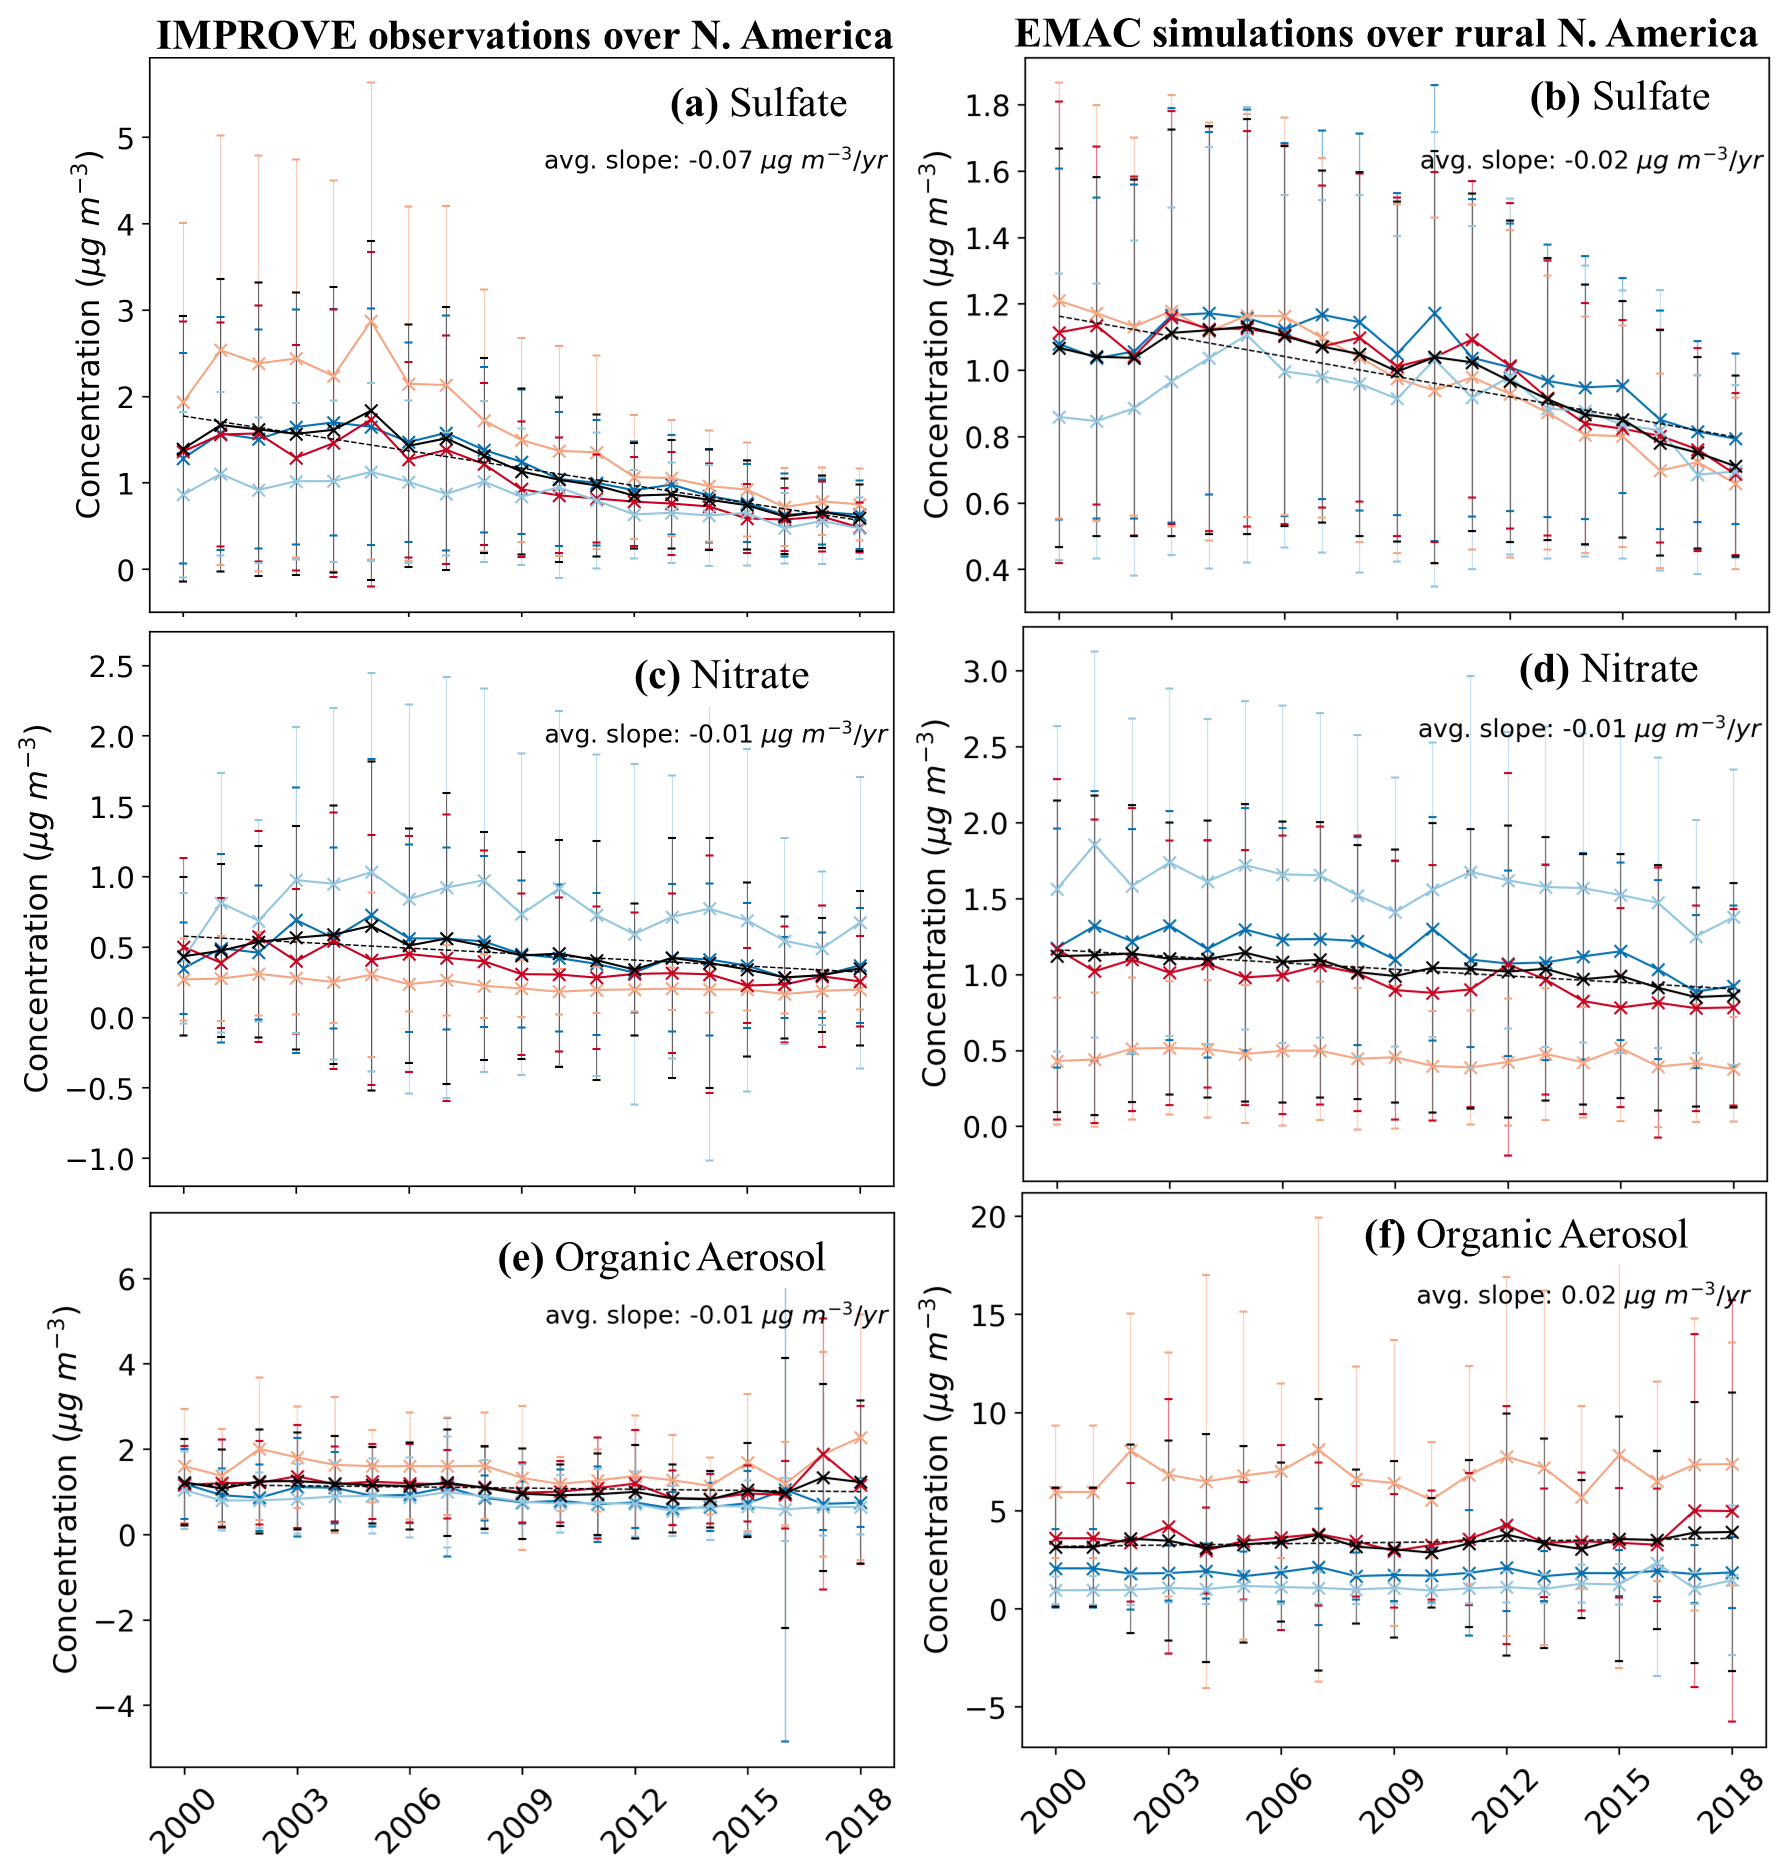
Figure 14Temporal evolution of the filter-based observed (a, c, and e subplots on the left) and simulated (b, d, and f subplots on the right) concentrations of PM2.5 sulfate (a, b), nitrate (c, d), and organic aerosol (e, f) during the period 2000–2018 over rural locations in North America. Black lines show the annual trend, while the dark blue, light blue, orange, and red lines represent the seasonal trends during winter, spring, summer, and autumn, respectively. Ranges represent the 1σ SD (standard deviation).
4.1 Europe
Figure 11 depicts the interannual and seasonal concentration change of filter-measured PM2.5 components with a polynomial fitted trend line, in comparison to the corresponding concentration trends calculated by the EMAC model. Both observations and the model reveal a concentration decrease for the three main inorganic components of PM2.5, following the emission reductions during the last 20 years. Sulfate concentrations have decreased drastically during the last decade (i.e., −46 % compared to the 2000s). However, the simulated reduction is not so apparent, mainly because filter observations show much higher concentrations during the first half of the 2000s than model simulations. Until 2005, the observed sulfate concentrations rose during all seasons; however, they rapidly dropped below the 2000 levels in the following years. The CAMS emission inventory used by the model assumes much lower emissions of pollutants such as SO2 over Europe compared to more detailed regional emission inventories such as the CEDS (Hoesly et al., 2018). This discrepancy leads to an underestimation of sulfate trends in the region due to inconsistencies in the concentrations observed by the EMEP network filters in the early 2000s. The average decline rate is −0.15 µg m−3 yr−1, compared to the simulated rate of −0.02 µg m−3 yr−1. AMS measurements (Fig. 12) corroborate the findings of filter observations, revealing a drastic decrease in PM1 sulfate concentrations during the decade of the 2010s (i.e., −18 % compared to the 2000s). EMAC underestimates European PM1 sulfate (Fig. 9a), resulting in a less pronounced negative trend in its concentrations (i.e., −11 %) since the model underestimation is more pronounced during the 2000s. The average simulated decadal change in sulfate PM1 concentrations for the entire European domain is −15 % (Fig. 10). Similar to sulfate, filter-measured nitrate concentrations rose until 2005 (except during summer when they remain at low levels) and then quickly dropped again with an average rate of −0.09 µg m−3 yr−1 (Fig. 11c). The high observed nitrate concentrations during the first half of the 2000s result in an average decrease of −35 % between the two decades. On the other hand, the calculated change of AMS-PM1 nitrate concentrations between the 2000s and 2010s is −10 %, which is similar to the simulated drop of −12 %. However, it is worth mentioning that the model significantly overestimates the nitrate concentrations both in comparison to AMS measurements (Fig. 9b) and filter observations, especially during summer (Milousis et al., 2024). The analysis of model simulation and observations (both by AMS and filters) reveals that ammonium concentrations exhibit strong reductions between the decades of the 2000s and 2010s. The average concentration reduction between the two decades is −21 % based on the AMS observations, −13 % based on the EMAC results for PM1 (or −16 % for the entire European domain), and −56 % for the PM2.5 filter observations. Therefore, the reduction of ammonium is much stronger based on the filter observations (i.e., −0.1 µg m−3 yr−1) than based on AMS measurements or modeled data (i.e., −0.02 µg m−3 yr−1). However, the overprediction of nitrate and underprediction of sulfate by the model suggest that the model overpredicts the fraction of ammonium that exists as ammonium nitrate rather than ammonium sulfate. It is worth emphasizing that the ammonium is clearly declining, even though NH3 emissions have only been slightly reduced. This apparent inconsistency can be attributed to the strong reductions of SO2 and NOx. This results in reduced availability of acids (i.e., H2SO4 and HNO3), preventing the formation of ammonium and allowing NH3 to reside in the gas phase. This is also verified by NH3 observations, where no significant trends and even statistical increases have been observed despite reported reductions in NH3 emissions (Fagerli et al., 2016; Liu et al., 2024).
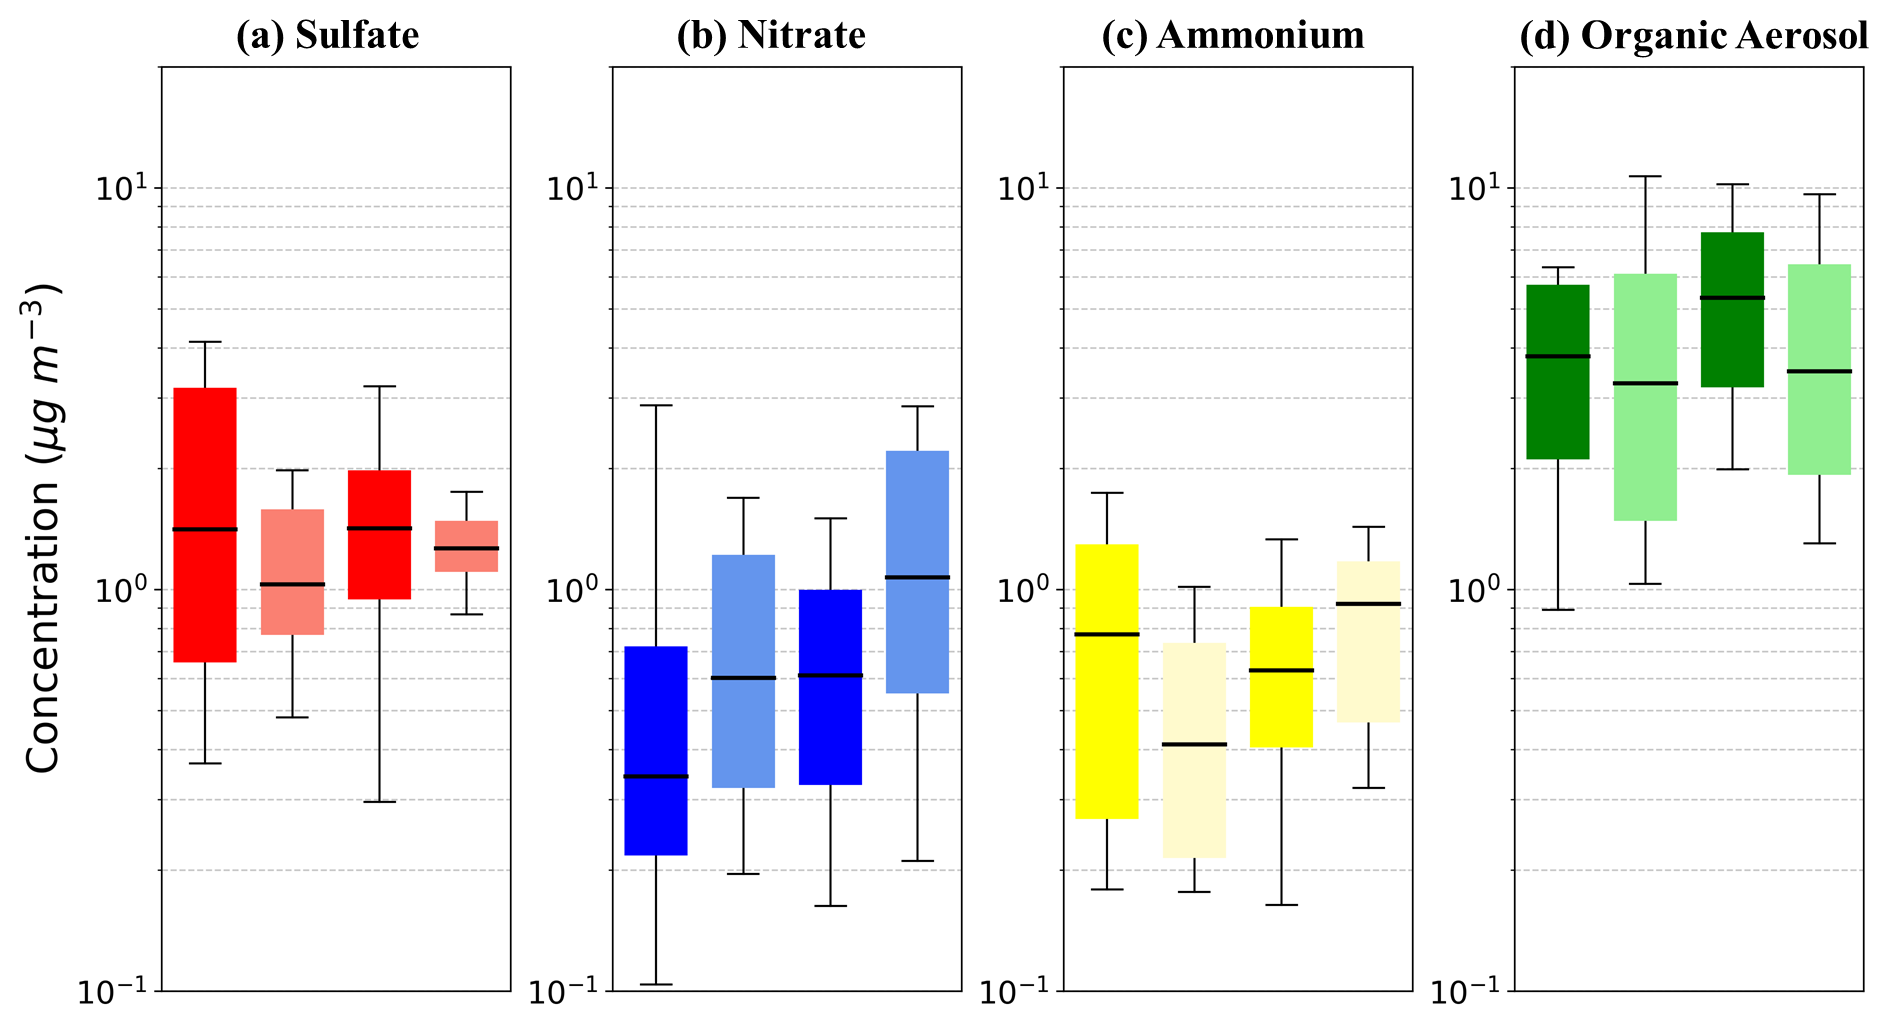
Figure 15Decadal PM1 concentration trends in North America expressed by the bar plots of the mass concentration (in µg m−3) for (a) sulfate, (b) nitrate, (c) ammonium, and (d) OA during the periods 2000–2010 (left) and 2011–2020 (right) as calculated from the AMS observational dataset (dark colors) and the corresponding simulation values (light colors). The upper and lower whiskers range from 10 % to 90 % of the dataset, and the quartiles range from 25 % to 75 % of the dataset. The black line is the median.
The downward trend of organic aerosol calculated based on the filter observations (−0.04 µg m−3 yr−1) is less than half as steep as that of inorganic components and differs between seasons (Fig. 11e). During summer, there is no clear trend observed, while in winter, OC concentration soars from 2003 to 2005, when it starts to gradually drop until it reaches the concentration levels of the other seasons during the second half of the 2010s. Irregularities in the early first decade could be owed to a lack of OC data (Fagerli et al., 2016). OC data during spring and autumn show a mild downward trend after 2005 as well. Overall, the average difference of OC concentration between the two decades is −22 %. However, model data do not corroborate this reduction; on the contrary, a slight increase is calculated by the model during the last five years (Fig. 11h). This agrees with the AMS observations, which predict a positive OA trend (Fig. 12d) with an average increase of +0.44 µg m−3 (or 10 %) from the first to the second decade. Despite the prominent underestimation of PM1 OA by the model, the simulated PM1 OA trend is also positive with an average decadal increase of +0.55 µg m−3 (or 31 %). Overall, inconsistencies between AMS and filter observations can be attributed to instrumental differences. First, it is the size of particulate matter observed, which is 2.5 µm for filters and up to 1 µm for the AMS. The size distribution of OA can be affected by multiple factors, including RH and chemical composition. Sun et al. (2020) have shown that the SOA ratio increases when RH is below 60 % and the contribution of inorganic components in the aerosol decreases. This increase is related to differences in aerosol water content due to changes in aerosol hygroscopicity and phase state. Simulated data reveal that the frequency of RH dropping below 60 % over European locations has marginally increased (by 1 %) during the 2010s. However, the drastic reduction of sulfate and nitrate levels during the same period can explain the increase in PM1 OA, as measured by the AMS, as opposed to the decrease in PM2.5 OA observed by filters. Another important difference between the AMS and the filters is that the latter, in contrast to the AMS, only detects the carbonaceous fraction (OC) of OA. Then, the ratio of the total organic mass (OM) to OC must be considered when comparing the measured OC to AMS or simulated OA. However, the OM:OC is broadly debated in literature. OM:OC is closely correlated to the oxygen to carbon ratio (O:C), and therefore, it is dependent on the chemical aging degree of OA. For the range of SOA found in the atmosphere, Aiken et al. (2008) calculated the OM:OC ratios to be between 1.9 and 2.5. Similarly, the ratio for POA varies depending on the source and composition between 1.3 and 1.5 (Aiken et al., 2008). As the EMEP stations in Europe are a mix of urban and rural locations, the measured OC concentrations are typically multiplied by a median OM:OC value of 1.7. However, the oxidation capacity of the atmosphere has increased as anthropogenic emissions such as SO2 have decreased (Dalsøren et al., 2016), leading to an increased oxidation rate of organic compounds and the formation of SOA. Consequently, a growing SOA fraction over the last 20 years would have been accompanied by a rising OM:OC ratio. It can be assumed that while the OC measured by the filters showed a slight downward trend (Fig. 11g), a conversion into OA via gradually increasing adapted OM:OC ratios could have compensated for the OC reduction and shown a better matching trend compared to the AMS and EMAC OA.
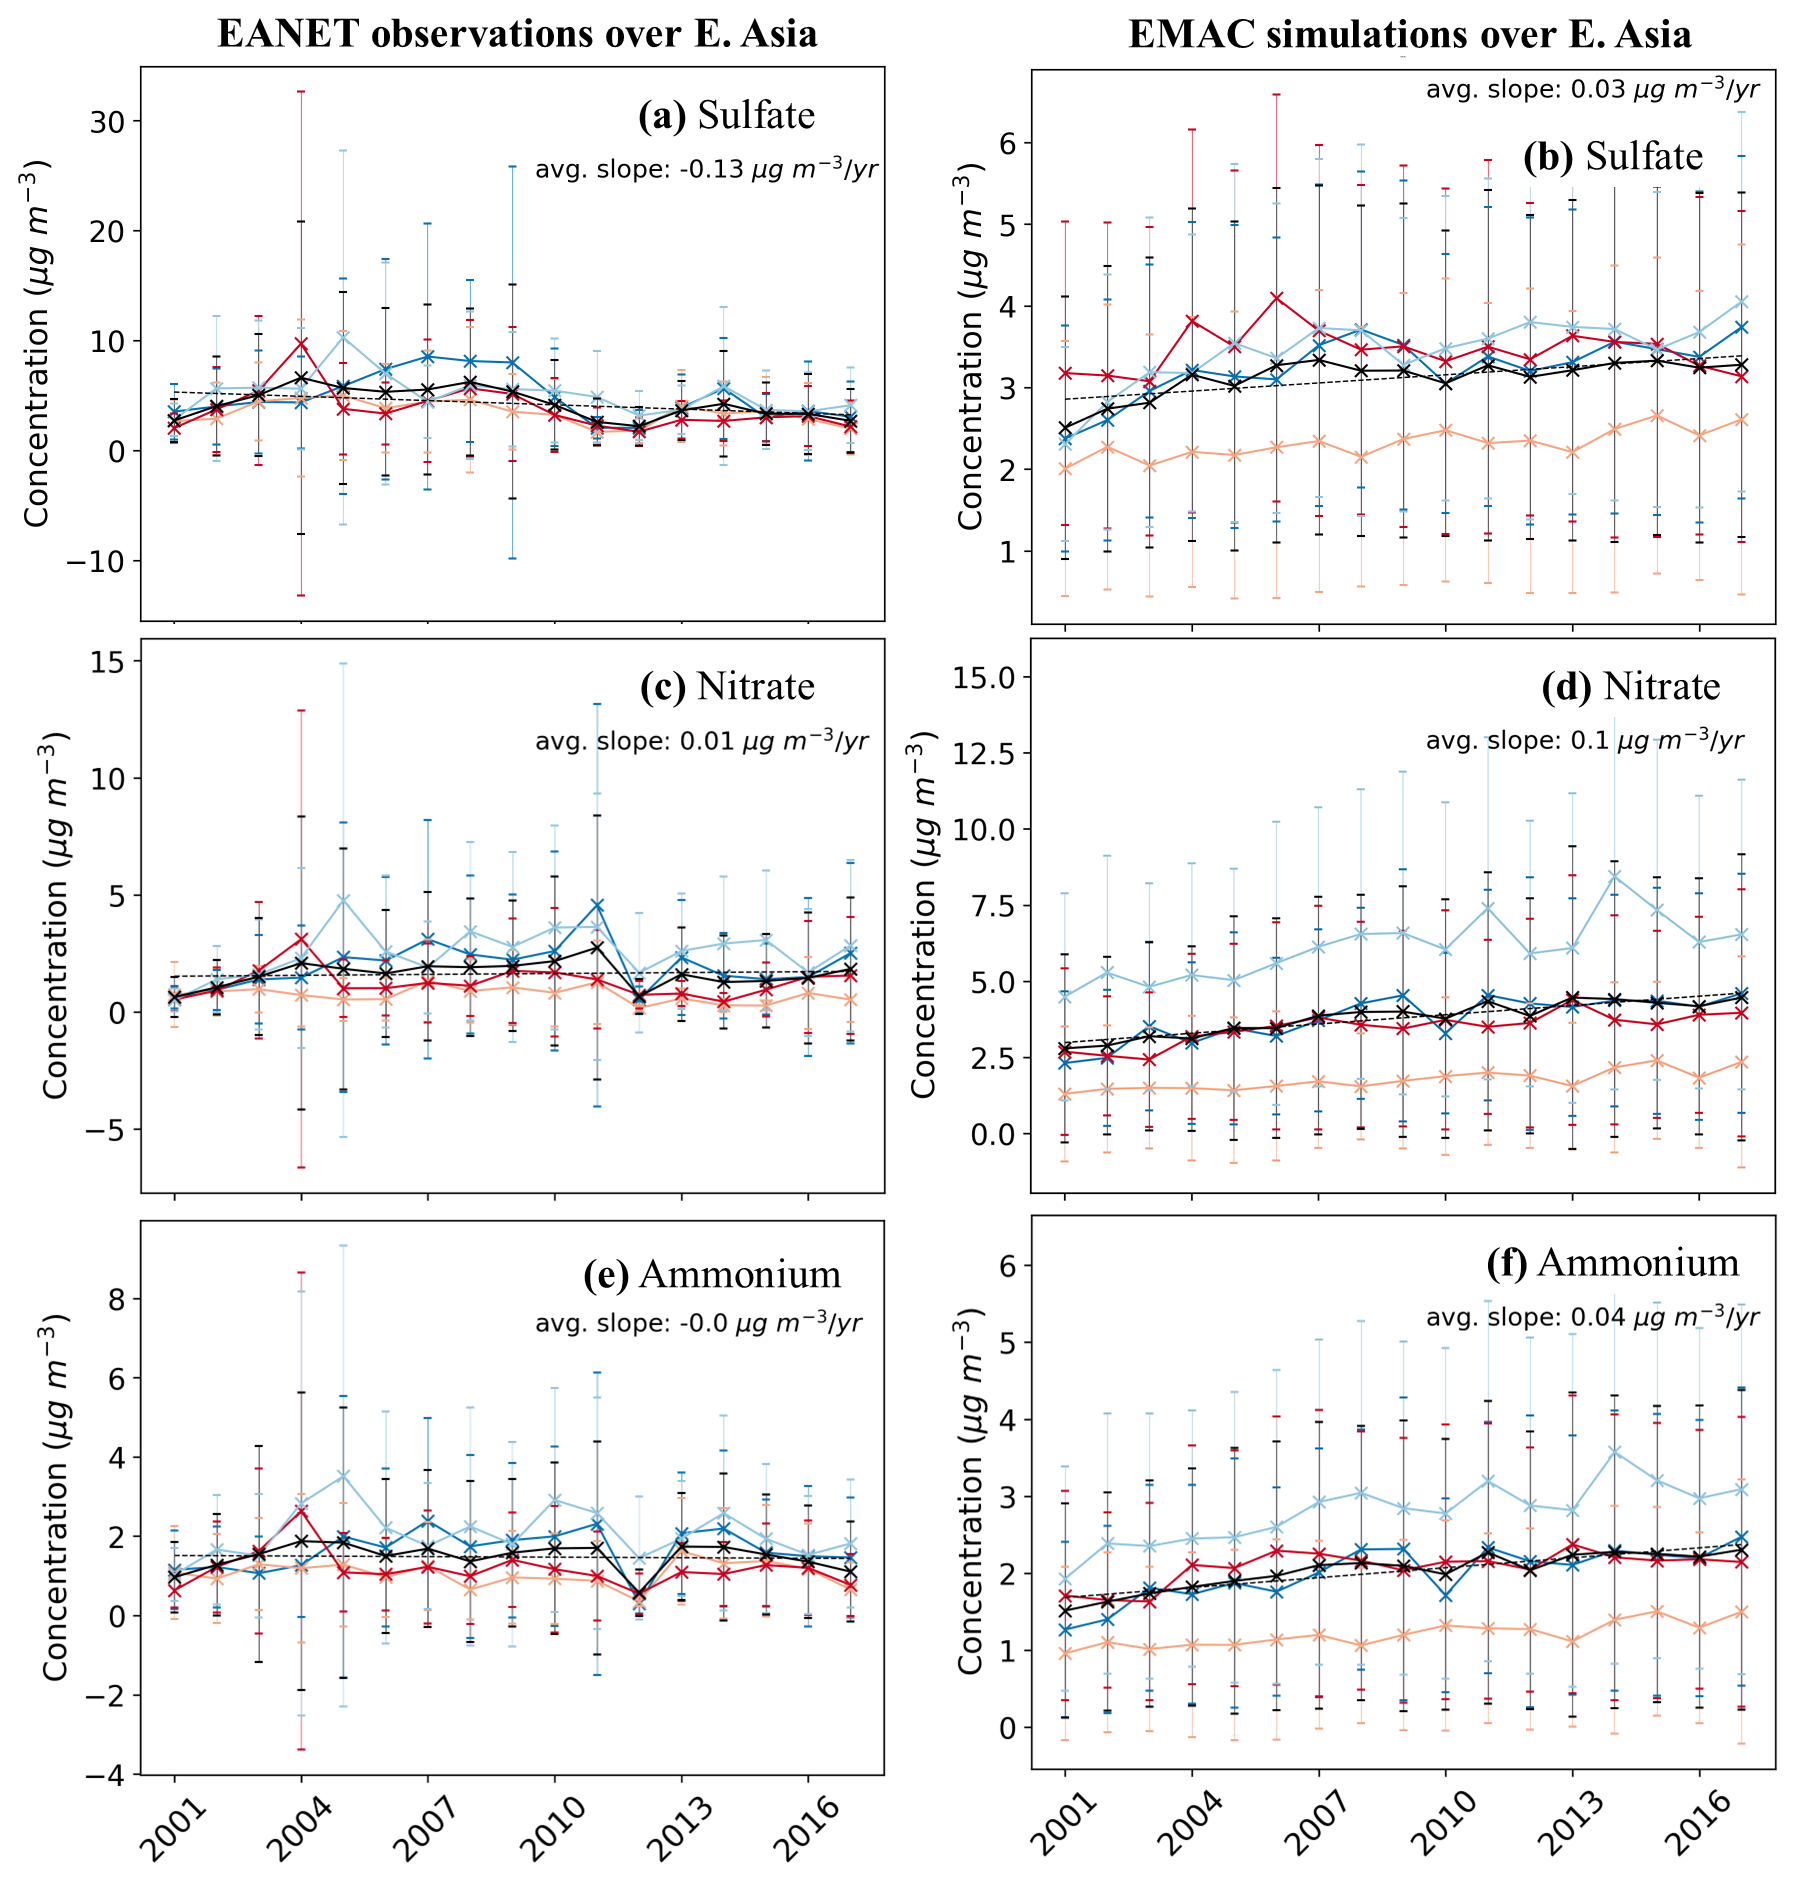
Figure 16Temporal evolution of the filter-based observed (a, c, and e subplots on the left) and simulated (b, d, and f subplots on the right) concentrations of PM2.5 sulfate (a, b), nitrate (c, d), and ammonium (e, f) during the period 2001–2017 over Eastern Asia. Black lines show the annual trend, while the dark blue, light blue, orange, and red lines represent the seasonal trends during winter, spring, summer, and autumn, respectively. Ranges represent the 1σ SD (standard deviation).
4.2 North America
Over North America, the filter-measured inorganic aerosol compound concentrations declined strongly during the last 20 years, following their precursor emission reductions, with higher reductions over urban locations (Fig. 13) and less over rural regions (Fig. 14). Nitrate reductions are more pronounced over urban regions (−0.07 µg m−3 yr−1), especially during winter, while over rural locations, the decline is imperceptible (−0.01 µg m−3 yr−1) since the abundance of NH3 has decelerated the decrease of NH4NO3. On the other hand, the drastic decrease of SO2 emissions (Table S2, Fig. S5) resulted in strong reductions of sulfate concentrations primarily over urban areas (−0.16 µg m−3 yr−1) but also over remote regions (−0.07 µg m−3 yr−1), especially during the summer season. Following the reductions of sulfate and nitrate, ammonium decreased strongly over urban locations by −0.08 µg m−3 yr−1, especially during the 2010s (Fig. 13), even though NH3 emissions remain practically unchanged (Fig. S5). Similarly, across Canada, strong reductions in sulfate and nitrate concentrations were observed by the Canadian Air and Precipitation Monitoring Network (CAPMoN), driven by significant decreases in SO2 and NOx emissions (Cheng et al., 2022). While PM2.5 concentrations decreased in eastern Canada, as observed by the National Air Pollution Surveillance (NAPS), emission reductions were less effective in the west, where large-scale wildfires overwhelmed these improvements and even led to occasional increases in PM2.5 concentrations (Yao and Zhang, 2024). These regional differences over Canada are also captured by the EMAC model (Fig. 10). Furthermore, EMAC simulates a weaker decline of sulfate concentrations over both rural and urban locations (Figs. 13 and 14), mainly due to its tendency to underestimate sulfate concentrations during the 2000s and especially during summer. Reductions in the simulated nitrate and ammonium concentrations are also noticeable but to a lesser extent than in the filter observations (Figs. 13 and 14). The observed OA concentrations over urban regions decreased until 2009; however, they gradually increased during the 2010s by 0.11 µg m−3 yr−1. On the other hand, the model calculated OA concentration levels remain practically unchanged during the simulated period. Both the simulated and the observed OA concentration trends are also very weak over the rural and remote regions (Fig. 14).
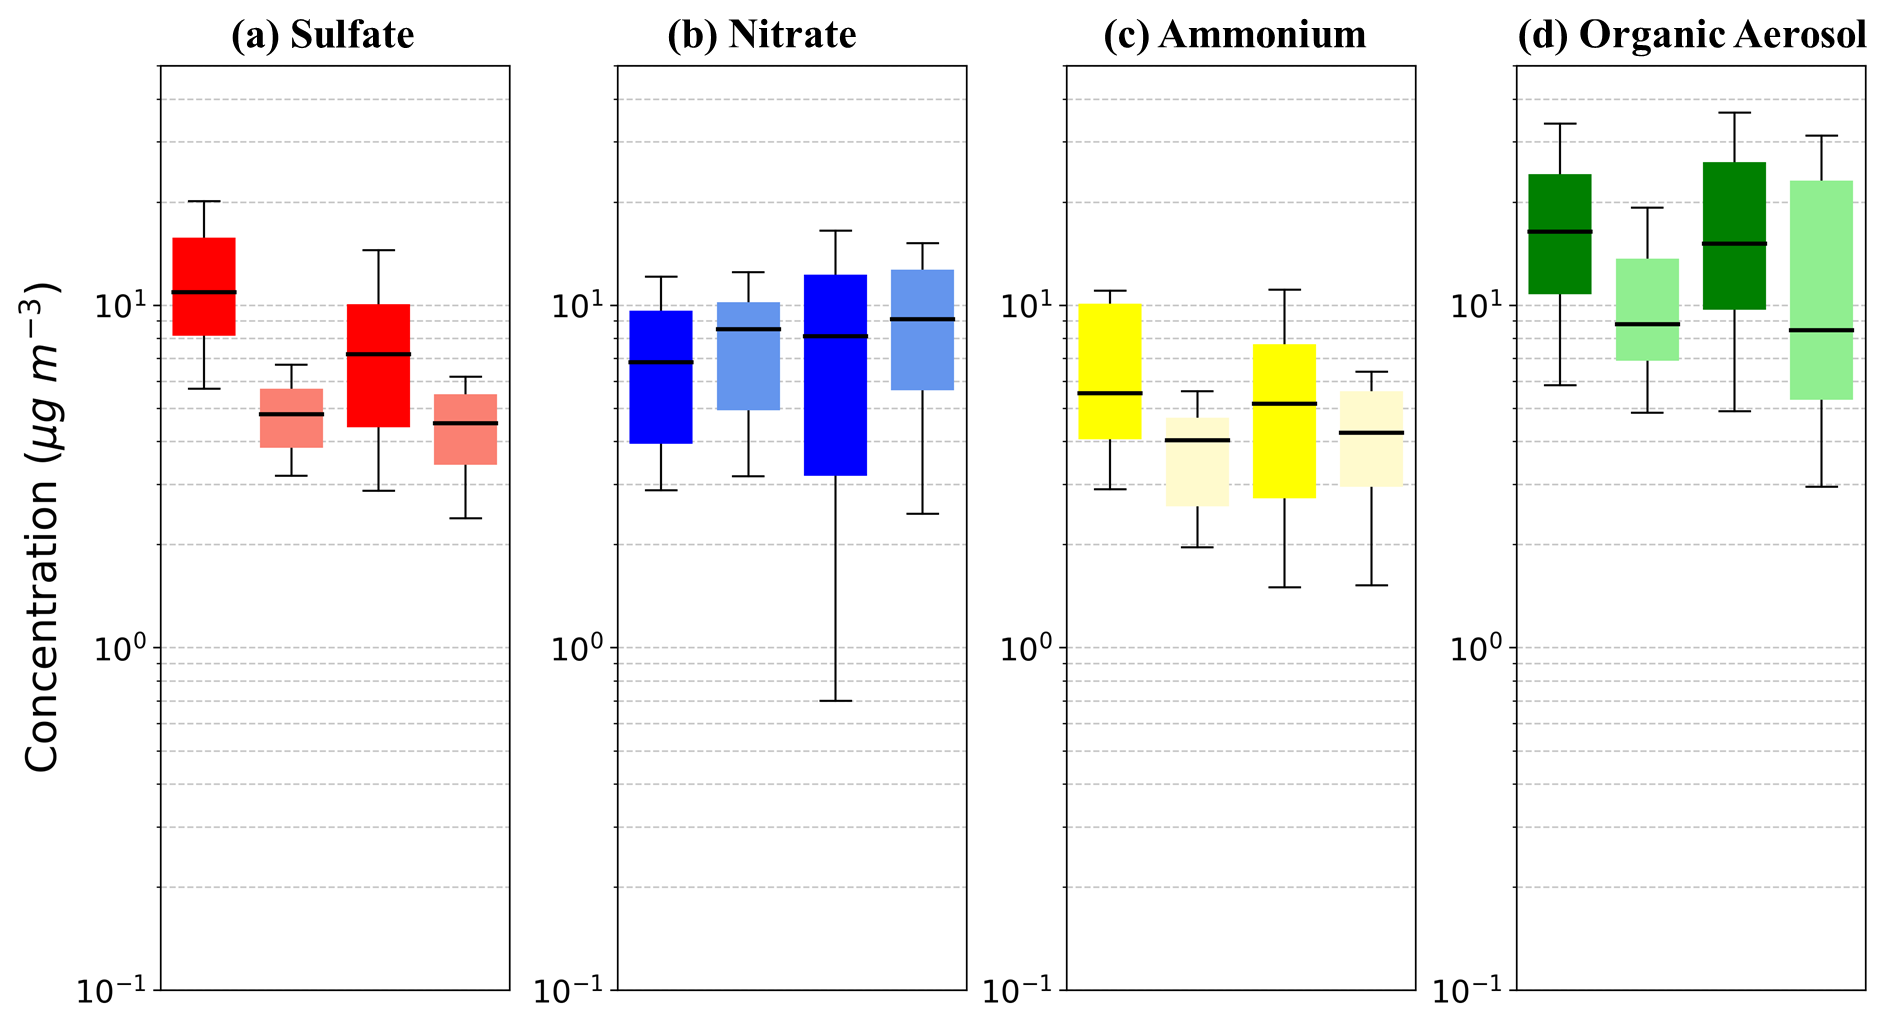
Figure 17Decadal PM1 concentration trends in Eastern Asia expressed by the bar plots of the mass concentration (in µg m−3) for (a) sulfate, (b) nitrate, (c) ammonium, and (d) OA during the periods 2006–2012 (left) and 2013–2020 (right) as calculated from the AMS observational dataset (dark colors) and the corresponding simulation values (light colors). The upper and lower whiskers range from 10 % to 90 % of the dataset, and the quartiles from 25 % to 75 % of the dataset. The black line is the median.
Figure 15 depicts the decadal PM1 concentration trends in North America between the 2000s and the 2010s. The AMS data for PM1 aerosol composition are composed of observational datasets from 30 field campaigns during the 2000s and 58 field campaigns during the 2010s (Fig. 2). This uneven distribution can statistically impact the calculations and hinder the extraction of valid statements for trends over North America. Sulfate concentrations exhibit a tighter distribution during the second decade (Fig. 15); however, the mean concentration remains unchanged between the two decades. On the other hand, the simulated sulfate concentrations increase during the 2010s, mainly due to the larger proportion of urban field campaigns during the second decade. Indeed, the model simulates a reduction of the continental average sulfate concentrations by 20 %, with maximum differences exceeding 1 µg m−3 over the Southeast US (Fig. 10). This contradictory behavior is also mirrored in nitrate concentrations, where both the AMS dataset and the corresponding simulated results produce a positive trend between the two decades, while the simulated continental average nitrate concentrations decrease (Fig. 10). Furthermore, compared to AMS observations, the model tends to underpredict sulfate concentrations and overpredict nitrate. This results in a strong correlation of the simulated ammonium with nitrate, exhibiting a significant positive trend, which is not observed in the AMS dataset (Fig. 15). In addition, current emission inventories offer reasonable estimates of total annual NH3 emissions, but significant uncertainties remain regarding their seasonal distribution. Since animal husbandry and fertilizer application are the primary sources, seasonal variations are difficult to quantify (Paulot et al., 2014). Studies in the US suggest NH3 emissions may be underestimated in summer and overestimated in other seasons, while estimates for spring and fall remain uncertain due to biases in precipitation predictions. Finally, as for PM2.5 OA, the observed and, to a lesser extent, the simulated PM1 OA concentrations increase slightly during the 2010s.
4.3 Eastern Asia
EANET observations of PM2.5 sulfate reveal a significant increase in its concentrations until 2007 (Fig. 16). However, in view of the upcoming Beijing Olympic Games in 2008, the first SO2 emission controls were implemented, and sulfate gradually reduced by −0.27 µg m−3 yr−1. By the end of 2017, SO2 emissions had declined by 59 % following the Clean Air Action (Zhai et al., 2019); however, observed sulfate concentrations had decreased by only 23 % due to an increased dry deposition and oxidation rate of SO2 during the same period (Fagerli et al., 2016). EMAC fails to reproduce the reduction of sulfate concentrations after 2008, since the CAMS emission inventory assumes only a stabilization of SO2 emissions after the year 2013 (Fig. S5), instead of a strong decline reported by regional emission inventories such as the CEDS (Hoesly et al., 2018). At the same period, NOx was reduced by 21 % and NH3 by just 3 % (Zhai et al., 2019). This, however, is not mirrored in the observed nitrate trends (Fig. 16), where nitrate reduces by only −0.05 µg m−3 yr−1 after 2007. The strong SO2 reduction hinders the decline of nitrate since reductions in (NH4)2SO4 release NH3 to react with HNO3 and form NH4NO3. Unlike observations, the simulated nitrate and ammonium continue to increase until the end of the 2010s, following the trends in NOx emissions used as input in the model (Fig. S5), in contrast to the emission trends reported by the CEDS (Hoesly et al., 2018).
The frequency of AMS field campaigns started to grow significantly in Eastern Asia only after 2008, while after 2013, the first consistent and aggressive emission controls started in China under the Clean Air Action (Zhai et al., 2019). Thus, since 2013 marks a significant year for Eastern Asia and due to the lack of AMS campaigns prior to 2006 in the region, the decade comparison for Eastern Asia is made for the periods of 2006–2012 and 2013–2020. Between these two periods, AMS observations reveal a −17 % decline for sulfate, while the corresponding simulated sulfate concentrations reduce by just −5 % (Fig. 17). The model tends to underpredict sulfate concentrations during all seasons; however, its performance is the worst in winter when sulfate exhibits its annual peak concentrations due to its multiphase formation during haze events, a pathway not accurately resolved or simulated by the model. Similar to PM2.5, the average PM1 nitrate concentrations remain the same between the two periods with a marginal decline observed by the AMS and a marginal increase simulated by EMAC, while the observed ammonium reduces by 18 % following the reduction in sulfate concentrations (Fig. 17). In contrast to inorganic aerosol precursors, the anthropogenic VOC emissions over Eastern Asia continue to increase even after 2013, mostly due to the use of solvents but also due to the energy transformation and industrial sector (Hoesly et al., 2018). Thus, both the observed and the simulated PM1 OA concentrations increase between the two examined periods by 15 % and 33 %, respectively (Fig. 17).
This study examines observed global trends in surface atmospheric aerosol composition over the past two decades and evaluates the ability of the EMAC chemistry–climate model, driven by the CAMS anthropogenic emissions inventory, to reproduce these trends. Results integrate model outputs with global observational data from 2000 to 2020, covering surface PM2.5 composition from regional monitoring networks (e.g., EMEP in Europe) and NR-PM1 composition from 744 AMS observational datasets at 169 ground-level sites worldwide. Findings reveal substantial regional variations in aerosol composition driven by industrial activities, energy production, and air quality regulations, highlighting the complexity of air pollution dynamics and its management.
AMS field campaign data show that OA is the dominant NR-PM1 component globally, especially in tropical and subtropical regions affected by biomass burning and biogenic VOC emissions. Sulfate is the primary inorganic compound across most areas, though nitrate predominates in Europe and Eastern Asia. Notably, North America shows unexpected sulfate dominance, likely due to seasonal sampling bias. HOA levels are higher in North America and Eastern Asia, while BBOA is prominent in rural Europe and tropical regions. OOA, particularly aged M-OOA, is the largest OA contributor in rural regions across all studied areas.
For PM2.5 composition, global filter observations indicate OA as the primary component in most regions, notably in Southern Hemisphere tropical forests. OA is the dominant component in Eastern Asia, while OA and sulfate have similar importance in rural North America. Globally, sulfate constitutes roughly 50 % of the inorganic PM2.5 mass, followed by nitrate and ammonium. However, sulfate dominance observed in filter samples contrasts with AMS findings, likely due to sampling artifacts. Regionally, sulfate is the highest in the Middle East, while nitrate plays a significant role in Europe. Across eight regions, PM2.5 averages are 21 % sulfate, 12 % nitrate, 10 % ammonium, 2 % sodium, 3 % chloride, 40 % OA, and 12 % EC.
The EMAC model confirms OA as the dominant component of fine aerosols globally, with the highest concentrations in regions influenced by biomass burning, such as tropical forests and savannas. Northern industrialized regions exhibit substantial OA levels (30 %–35 %) from fossil and biofuel combustion. While EMAC successfully reproduces the prominence of SOA, it struggles to accurately simulate aged SOA in areas like Eastern Asia. The model further suggests that nitrate surpasses sulfate in PM2.5 composition in Europe, North America, and Eastern Asia, consistent with AMS findings but different from some filter observations. Ammonium mirrors sulfate and nitrate distribution, with significant contributions in populated and agricultural regions. Mineral dust and sea salt emissions also play key roles regionally. Overall, EMAC provides valuable insights into global fine aerosol composition, while indicating areas for model refinement.
This study presents a 21-year analysis of global trends in fine aerosol composition, comparing EMAC model simulations with observed trends. Given limited and inconsistent PM1 datasets, the analysis focuses on broad regional trends across the first and second decades, using primarily Northern Hemisphere AMS campaign data and PM2.5 data from major monitoring networks in North America, Europe, and Eastern Asia. While these comparisons offer insights, they are complicated by compositional differences between PM1 and PM2.5 and by differences between real-time AMS and non-real-time filter-based methods.
Both filter-based data and EMAC simulations show a decline in key inorganic components over Europe. In particular, sulfate is observed to have dropped by 46 % in the last decade. However, the EMAC model underestimates the sulfate reduction due to initial discrepancies in the early 2000s concentrations. Nitrate and ammonium also declined significantly, though the model overestimates nitrate levels. Organic aerosol (OA) trends vary by method: filter data indicate a downward trend with a slope of −0.04 µg m−3 yr−1, while AMS data and simulations suggest an OA increase in PM1 by approximately 0.5 µg m−3 from the first to the second decade. This discrepancy is likely due to differences in particle size (PM2.5 vs. PM1) and instrument detection capabilities (filter-based OC vs. AMS OA).
In North America, filter-based measurements reveal sharp declines in inorganic aerosol compounds, particularly in urban areas. Nitrate and sulfate concentrations decreased significantly due to lower SO2 and NOx precursor emissions, with ammonium levels following this trend, although NH3 itself remained stable in the 2010s. The EMAC model, however, simulates a weaker sulfate and nitrate decline, underestimating sulfate in the early 2000s while overestimating nitrate. Observed OA concentrations in urban North America decreased until 2009, then rose in the 2010s, a trend only partially captured by the model. PM1 sulfate and nitrate levels from AMS data show inconsistent trends, with the model generally underestimating sulfate and overestimating nitrate, leading to a positive ammonium trend in the model that is not observed in AMS data.
In Eastern Asia, EANET PM2.5 data show rising sulfate concentrations until 2007, followed by a decline as SO2 emission controls were implemented prior to the 2008 Beijing Olympics. Despite a 59 % reduction in SO2 emissions by 2017, sulfate concentrations fell by only 23 %, likely due to increased dry deposition and oxidation rates of SO2. The EMAC model does not fully capture this trend, as it assumes stable SO2 emissions post-2013 rather than a steep decline. Similarly, while observed nitrate and ammonium levels show minimal reductions after 2007, the model inaccurately projects continued increases, reflecting discrepancies in NOx emission trends. AMS data indicate a 17 % reduction in PM1 sulfate from 2006–2012 to 2013–2020, compared to a 5 % reduction in the model, with observed PM1 OA concentrations increasing by 15 % and model predictions showing a 33 % rise, driven by sustained VOC emissions from solvents and industrial sources.
Overall, despite the complexities and inconsistencies in long-term aerosol trend analysis due to instrumental and methodological differences, this study highlights the importance of consistent, long-term global aerosol trend analysis. By integrating model results and observational data over 20 years, the study reveals significant spatiotemporal changes in atmospheric aerosol composition over different regions of the planet, largely driven by recent changes in aerosol precursor emissions.
The usage of MESSy (Modular Earth Submodel System) and access to the source code are licensed to all affiliates of institutions that are members of the MESSy Consortium. Institutions can become a member of the MESSy Consortium by signing the “MESSy Memorandum of Understanding”. More information can be found on the MESSy Consortium website: http://www.messy-interface.org (last access: 8 November 2024). The data produced in the study are available from the authors upon request.
The supplement related to this article is available online at https://doi.org/10.5194/acp-25-10183-2025-supplement.
APT designed the research with contributions from VAK. APT and VAK developed ORACLE-lite. AM and VAK implemented ISORROPIA-lite in EMAC. SMCS selected all AMS observations, and NM provided specific observations from sites with emphasis on the Mediterranean. APT performed the simulations. APT and SMCS analyzed the results. APT, SMCS, and VAK wrote the manuscript with contributions from NM and AM. All of the co-authors made revisions and corrections.
The contact author has declared that none of the authors has any competing interests.
Publisher’s note: Copernicus Publications remains neutral with regard to jurisdictional claims made in the text, published maps, institutional affiliations, or any other geographical representation in this paper. While Copernicus Publications makes every effort to include appropriate place names, the final responsibility lies with the authors.
This article is part of the special issue “The Modular Earth Submodel System (MESSy) (ACP/GMD inter-journal SI)”. It is not associated with a conference.
This work was supported by the project FORCeS funded from the European Union's Horizon 2020 research and innovation program under grant agreement no. 821205. The work described in this paper has received funding from the Initiative and Networking Fund of the Helmholtz Association through the project “Advanced Earth System Modelling Capacity (ESM)”. The authors gratefully acknowledge the Earth System Modelling Project (ESM) for funding this work by providing computing time on the ESM partition of the supercomputer JUWELS (Alvarez, 2021) at the Jülich Supercomputing Centre (JSC).
This research has been supported by the EU Horizon 2020 (grant no. 821205).
The article processing charges for this open-access publication were covered by the Forschungszentrum Jülich.
This paper was edited by Leiming Zhang and reviewed by four anonymous referees.
Aggarwal, S. G. and Kawamura, K.: Carbonaceous and inorganic composition in long-range transported aerosols over northern Japan: Implication for aging of water-soluble organic fraction, Atmos. Environ., 43, 2532–2540, https://doi.org/10.1016/j.atmosenv.2009.02.032, 2009.
Aiken, A. C., DeCarlo, P. F., Kroll, J. H., Worsnop, D. R., Huffman, J. A., Docherty, K. S., Ulbrich, I. M., Mohr, C., Kimmel, J. R., Sueper, D., Sun, Y., Zhang, Q., Trimborn, A., Northway, M., Ziemann, P. J., Canagaratna, M. R., Onasch, T. B., Alfarra, M. R., Prevot, A. S. H., Dommen, J., Duplissy, J., Metzger, A., Baltensperger, U., and Jimenez, J. L.: and ratios of primary, secondary, and ambient organic aerosols with high-resolution time-of-flight aerosol mass spectrometry, Environ. Sci. Technol., 42, 4478–4485, 2008.
Akagi, S. K., Yokelson, R. J., Wiedinmyer, C., Alvarado, M. J., Reid, J. S., Karl, T., Crounse, J. D., and Wennberg, P. O.: Emission factors for open and domestic biomass burning for use in atmospheric models, Atmos. Chem. Phys., 11, 4039–4072, https://doi.org/10.5194/acp-11-4039-2011, 2011.
Alvarez, D.: JUWELS Cluster and Booster: Exascale Pathfinder with Modular Supercomputing Architecture at Juelich Supercomputing Centre, Journal of large-scale research facilities JLSRF, 7, https://doi.org/10.17815/jlsrf-7-183, 2021.
Ames, R. B. and Malm, W. C.: Comparison of sulfate and nitrate particle mass concentrations measured by IMPROVE and the CDN, Atmos. Environ., 35, 905-916, https://doi.org/10.1016/s1352-2310(00)00369-1, 2001.
Andreae, M. O. and Rosenfeld, D.: Aerosol-cloud-precipitation interactions. Part 1. The nature and sources of cloud-active aerosols, Earth-Sci. Rev., 89, 13–41, https://doi.org/10.1016/j.earscirev.2008.03.001, 2008.
Anttila, P. and Tuovinen, J. P.: Trends of primary and secondary pollutant concentrations in Finland in 1994–2007, Atmos. Environ., 44, 30–41, https://doi.org/10.1016/j.atmosenv.2009.09.041, 2010.
Astitha, M., Lelieveld, J., Abdel Kader, M., Pozzer, A., and de Meij, A.: Parameterization of dust emissions in the global atmospheric chemistry-climate model EMAC: impact of nudging and soil properties, Atmos. Chem. Phys., 12, 11057–11083, https://doi.org/10.5194/acp-12-11057-2012, 2012.
Bacer, S., Sullivan, S. C., Karydis, V. A., Barahona, D., Krämer, M., Nenes, A., Tost, H., Tsimpidi, A. P., Lelieveld, J., and Pozzer, A.: Implementation of a comprehensive ice crystal formation parameterization for cirrus and mixed-phase clouds in the EMAC model (based on MESSy 2.53), Geosci. Model Dev., 11, 4021–4041, https://doi.org/10.5194/gmd-11-4021-2018, 2018.
Batmunkh, T., Kim, Y. J., Lee, K. Y., Cayetano, M. G., Jung, J. S., Kim, S. Y., Kim, K. C., Lee, S. J., Kim, J. S., Chang, L. S., and An, J. Y.: Time-Resolved Measurements of PM2.5 Carbonaceous Aerosols at Gosan, Korea, J. Air Waste Manage. Assoc., 61, 1174–1182, https://doi.org/10.1080/10473289.2011.609761, 2011.
Bian, H., Chin, M., Hauglustaine, D. A., Schulz, M., Myhre, G., Bauer, S. E., Lund, M. T., Karydis, V. A., Kucsera, T. L., Pan, X., Pozzer, A., Skeie, R. B., Steenrod, S. D., Sudo, K., Tsigaridis, K., Tsimpidi, A. P., and Tsyro, S. G.: Investigation of global particulate nitrate from the AeroCom phase III experiment, Atmos. Chem. Phys., 17, 12911–12940, https://doi.org/10.5194/acp-17-12911-2017, 2017.
Bougiatioti, A., Stavroulas, I., Kostenidou, E., Zarmpas, P., Theodosi, C., Kouvarakis, G., Canonaco, F., Prévôt, A. S. H., Nenes, A., Pandis, S. N., and Mihalopoulos, N.: Processing of biomass-burning aerosol in the eastern Mediterranean during summertime, Atmos. Chem. Phys., 14, 4793–4807, https://doi.org/10.5194/acp-14-4793-2014, 2014.
Bourotte, C., Curl-Amarante, A. P., Forti, M. C., Pereira, L. A. A., Braga, A. L., and Lotufo, P. A.: Association between ionic composition of fine and coarse aerosol soluble fraction and peak expiratory flow of asthmatic patients in Sao Paulo city (Brazil), Atmos. Environ., 41, 2036–2048, https://doi.org/10.1016/j.atmosenv.2006.11.004, 2007.
Bouwman, A. F., Lee, D. S., Asman, W. A. H., Dentener, F. J., VanderHoek, K. W., and Olivier, J. G. J.: A global high-resolution emission inventory for ammonia, Global Biogeochem. Cy., 11, 561–587, https://doi.org/10.1029/97gb02266, 1997.
Bozzetti, C., El Haddad, I., Salameh, D., Daellenbach, K. R., Fermo, P., Gonzalez, R., Minguillón, M. C., Iinuma, Y., Poulain, L., Elser, M., Müller, E., Slowik, J. G., Jaffrezo, J.-L., Baltensperger, U., Marchand, N., and Prévôt, A. S. H.: Organic aerosol source apportionment by offline-AMS over a full year in Marseille, Atmos. Chem. Phys., 17, 8247–8268, https://doi.org/10.5194/acp-17-8247-2017, 2017.
Brook, R. D., Rajagopalan, S., Pope, C. A., 3rd, Brook, J. R., Bhatnagar, A., Diez-Roux, A. V., Holguin, F., Hong, Y., Luepker, R. V., Mittleman, M. A., Peters, A., Siscovick, D., Smith, S. C., Jr., Whitsel, L., and Kaufman, J. D.: Particulate matter air pollution and cardiovascular disease: An update to the scientific statement from the American Heart Association, Circulation, 121, 2331–2378, https://doi.org/10.1161/CIR.0b013e3181dbece1, 2010.
Budisulistiorini, S. H., Canagaratna, M. R., Croteau, P. L., Marth, W. J., Baumann, K., Edgerton, E. S., Shaw, S. L., Knipping, E. M., Worsnop, D. R., Jayne, J. T., Gold, A., and Surratt, J. D.: Real-Time Continuous Characterization of Secondary Organic Aerosol Derived from Isoprene Epoxydiols in Downtown Atlanta, Georgia, Using the Aerodyne Aerosol Chemical Speciation Monitor, Environ. Sci. Technol., 47, 5686–5694, https://doi.org/10.1021/es400023n, 2013.
Budisulistiorini, S. H., Baumann, K., Edgerton, E. S., Bairai, S. T., Mueller, S., Shaw, S. L., Knipping, E. M., Gold, A., and Surratt, J. D.: Seasonal characterization of submicron aerosol chemical composition and organic aerosol sources in the southeastern United States: Atlanta, Georgia,and Look Rock, Tennessee, Atmos. Chem. Phys., 16, 5171–5189, https://doi.org/10.5194/acp-16-5171-2016, 2016.
Budisulistiorini, S. H., Riva, M., Williams, M., Miyakawa, T., Chen, J., Itoh, M., Surratt, J. D., and Kuwata, M.: Dominant contribution of oxygenated organic aerosol to haze particles from real-time observation in Singapore during an Indonesian wildfire event in 2015, Atmos. Chem. Phys., 18, 16481–16498, https://doi.org/10.5194/acp-18-16481-2018, 2018.
Canagaratna, M. R., Jayne, J. T., Jimenez, J. L., Allan, J. D., Alfarra, M. R., Zhang, Q., Onasch, T. B., Drewnick, F., Coe, H., Middlebrook, A., Delia, A., Williams, L. R., Trimborn, A. M., Northway, M. J., DeCarlo, P. F., Kolb, C. E., Davidovits, P., and Worsnop, D. R.: Chemical and microphysical characterization of ambient aerosols with the aerodyne aerosol mass spectrometer, Mass Spectrom. Rev., 26, 185–222, https://doi.org/10.1002/mas.20115, 2007.
Cash, J. M., Langford, B., Di Marco, C., Mullinger, N. J., Allan, J., Reyes-Villegas, E., Joshi, R., Heal, M. R., Acton, W. J. F., Hewitt, C. N., Misztal, P. K., Drysdale, W., Mandal, T. K., Shivani, Gadi, R., Gurjar, B. R., and Nemitz, E.: Seasonal analysis of submicron aerosol in Old Delhi using high-resolution aerosol mass spectrometry: chemical characterisation, source apportionment and new marker identification, Atmos. Chem. Phys., 21, 10133–10158, https://doi.org/10.5194/acp-21-10133-2021, 2021.
Celis, J. E., Morales, J. R., Zaror, C. A., and Inzunza, J. C.: A study of the particulate matter PM10 composition in the atmosphere of Chillan, Chile, Chemosphere, 54, 541–550, https://doi.org/10.1016/s0045-6535(03)00711-2, 2004.
Chakraborty, A., Bhattu, D., Gupta, T., Tripathi, S. N., and Canagaratna, M. R.: Real-time measurements of ambient aerosols in a polluted Indian city: Sources, characteristics, and processing of organic aerosols during foggy and nonfoggy periods, J. Geophys. Res.-Atmos., 120, 9006–9019, https://doi.org/10.1002/2015JD023419, 2015.
Cheng, I., Zhang, L., He, Z., Cathcart, H., Houle, D., Cole, A., Feng, J., O'Brien, J., Macdonald, A. M., Aherne, J., and Brook, J.: Long-term declines in atmospheric nitrogen and sulfur deposition reduce critical loads exceedances at multiple Canadian rural sites, 2000–-2018, Atmos. Chem. Phys., 22, 14631–14656, https://doi.org/10.5194/acp-22-14631-2022, 2022
Cho, S. Y. and Park, S. S.: Resolving sources of water-soluble organic carbon in fine particulate matter measured at an urban site during winter, Environ. Sci.-Proc. Imp., 15, 524–534, https://doi.org/10.1039/c2em30730h, 2013.
Chow, W. S., Liao, K., Huang, X. H. H., Leung, K. F., Lau, A. K. H., and Yu, J. Z.: Measurement report: The 10-year trend of PM2.5 major components and source tracers from 2008 to 2017 in an urban site of Hong Kong, China, Atmos. Chem. Phys., 22, 11557–11577, https://doi.org/10.5194/acp-22-11557-2022, 2022.
Cottrell, L. D., Griffin, R. J., Jimenez, J. L., Zhang, Q., Ulbrich, I., Ziemba, L. D., Beckman, P. J., Sive, B. C., and Talbot, R. W.: Submicron particles at Thompson Farm during ICARTT measured using aerosol mass spectrometry, J. Geophys. Res.-Atmos., 113, D08212, https://doi.org/10.1029/2007jd009192, 2008.
Crippa, M., Canonaco, F., Lanz, V. A., Äijälä, M., Allan, J. D., Carbone, S., Capes, G., Ceburnis, D., Dall'Osto, M., Day, D. A., DeCarlo, P. F., Ehn, M., Eriksson, A., Freney, E., Hildebrandt Ruiz, L., Hillamo, R., Jimenez, J. L., Junninen, H., Kiendler-Scharr, A., Kortelainen, A.-M., Kulmala, M., Laaksonen, A., Mensah, A. A., Mohr, C., Nemitz, E., O'Dowd, C., Ovadnevaite, J., Pandis, S. N., Petäjä, T., Poulain, L., Saarikoski, S., Sellegri, K., Swietlicki, E., Tiitta, P., Worsnop, D. R., Baltensperger, U., and Prévôt, A. S. H.: Organic aerosol components derived from 25 AMS data sets across Europe using a consistent ME-2 based source apportionment approach, Atmos. Chem. Phys., 14, 6159–6176, https://doi.org/10.5194/acp-14-6159-2014, 2014.
Dalsøren, S. B., Myhre, C. L., Myhre, G., Gomez-Pelaez, A. J., Søvde, O. A., Isaksen, I. S. A., Weiss, R. F., and Harth, C. M.: Atmospheric methane evolution the last 40 years, Atmos. Chem. Phys., 16, 3099–3126, https://doi.org/10.5194/acp-16-3099-2016, 2016.
DeCarlo, P. F., Kimmel, J. R., Trimborn, A., Northway, M. J., Jayne, J. T., Aiken, A. C., Gonin, M., Fuhrer, K., Horvath, T., Docherty, K. S., Worsnop, D. R., and Jimenez, J. L.: Field-deployable, high-resolution, time-of-flight aerosol mass spectrometer, Anal. Chem., 78, 8281–8289, https://doi.org/10.1021/ac061249n, 2006.
Dentener, F., Kinne, S., Bond, T., Boucher, O., Cofala, J., Generoso, S., Ginoux, P., Gong, S., Hoelzemann, J. J., Ito, A., Marelli, L., Penner, J. E., Putaud, J.-P., Textor, C., Schulz, M., van der Werf, G. R., and Wilson, J.: Emissions of primary aerosol and precursor gases in the years 2000 and 1750 prescribed data-sets for AeroCom, Atmos. Chem. Phys., 6, 4321–4344, https://doi.org/10.5194/acp-6-4321-2006, 2006.
de Sá, S. S., Rizzo, L. V., Palm, B. B., Campuzano-Jost, P., Day, D. A., Yee, L. D., Wernis, R., Isaacman-VanWertz, G., Brito, J., Carbone, S., Liu, Y. J., Sedlacek, A., Springston, S., Goldstein, A. H., Barbosa, H. M. J., Alexander, M. L., Artaxo, P., Jimenez, J. L., and Martin, S. T.: Contributions of biomass-burning, urban, and biogenic emissions to the concentrations and light-absorbing properties of particulate matter in central Amazonia during the dry season, Atmos. Chem. Phys., 19, 7973–8001, https://doi.org/10.5194/acp-19-7973-2019, 2019.
Docherty, K. S., Aiken, A. C., Huffman, J. A., Ulbrich, I. M., DeCarlo, P. F., Sueper, D., Worsnop, D. R., Snyder, D. C., Peltier, R. E., Weber, R. J., Grover, B. D., Eatough, D. J., Williams, B. J., Goldstein, A. H., Ziemann, P. J., and Jimenez, J. L.: The 2005 Study of Organic Aerosols at Riverside (SOAR-1): instrumental intercomparisons and fine particle composition, Atmos. Chem. Phys., 11, 12387–12420, https://doi.org/10.5194/acp-11-12387-2011, 2011.
Dominici, F., Peng, R. D., Bell, M. L., Pham, L., McDermott, A., Zeger, S. L., and Samet, J. M.: Fine particulate air pollution and hospital admission for cardiovascular and respiratory diseases, JAMA, 295, 1127–1134, https://doi.org/10.1001/jama.295.10.1127, 2006.
Du, W., Sun, Y. L., Xu, Y. S., Jiang, Q., Wang, Q. Q., Yang, W., Wang, F., Bai, Z. P., Zhao, X. D., and Yang, Y. C.: Chemical characterization of submicron aerosol and particle growth events at a national background site (3295 m a.s.l.) on the Tibetan Plateau, Atmos. Chem. Phys., 15, 10811–10824, https://doi.org/10.5194/acp-15-10811-2015, 2015.
EMEP: EMEP Status Report: Transboundary particulate matter, photo-oxidants, acidifying and eutrophying components, Norwegian Meterological Institute, https://emep.int/publ/reports/2021/EMEP_Status_Report_1_2021.pdf (last access: 25 August 2025), 2021.
EPA: U.S. Environmental Protection Agency (EPA), Air Pollutant Emissions Trends Data, https://www.epa.gov/air-emissions-inventories/air-pollutant-emissions-trends-data (last access: 25 August 2025), 2025.
Fagerli, H., Tsyro, S., Denby, B., Olivie, D., Nyiri, A., Gauss, M., Simpson, D., Wind, P., Benedictow, A., Mortier, A., Jonson, J., Schulz, M., Kirkevåg, A., Valdebenito, A., Iversen, T., Seland, Ø., Aas, W., Hjellbrekke, A.-G., Solberg, S., and Varma, V.: Transboundary particulate matter, photo-oxidants, acidifying and eutrophying components, EMEP Status Report 2016, https://doi.org/10.13140/RG.2.2.27632.46088, 2016.
Fang, T., Guo, H. Y., Zeng, L. H., Verma, V., Nenes, A., and Weber, R. J.: Highly Acidic Ambient Particles, Soluble Metals, and Oxidative Potential: A Link between Sulfate and Aerosol Toxicity, Environ. Sci. Technol., 51, 2611–2620, https://doi.org/10.1021/acs.est.6b06151, 2017.
Favez, O., Cachler, H., Sciare, J., Alfaro, S. C., El-Araby, T. M., Harhash, M. A., and Abdelwahab, M. M.: Seasonality of major aerosol species and their transformations in Cairo megacity, Atmos. Environ., 42, 1503–1516, https://doi.org/10.1016/j.atmosenv.2007.10.081, 2008.
Feng, J., Hu, M., Chan, C. K., Lau, P. S., Fang, M., He, L., and Tang, X.: A comparative study of the organic matter in PM2.5 from three Chinese megacities in three different climatic zones, Atmos. Environ., 40, 3983–3994, https://doi.org/10.1016/j.atmosenv.2006.02.017, 2006.
Fuzzi, S., Decesari, S., Facchini, M. C., Cavalli, F., Emblico, L., Mircea, M., Andreae, M. O., Trebs, I., Hoffer, A., Guyon, P., Artaxo, P., Rizzo, L. V., Lara, L. L., Pauliquevis, T., Maenhaut, W., Raes, N., Chi, X. G., Mayol-Bracero, O. L., Soto-Garcia, L. L., Claeys, M., Kourtchev, I., Rissler, J., Swietlicki, E., Tagliavini, E., Schkolnik, G., Falkovich, A. H., Rudich, Y., Fisch, G., and Gatti, L. V.: Overview of the inorganic and organic composition of size-segregated aerosol in Rondonia, Brazil, from the biomass-burning period to the onset of the wet season, J. Geophys. Res.-Atmos., 112, D01201, https://doi.org/10.1029/2005jd006741, 2007.
George, D. T., Howard, K., Isabella, A.-M., John, B., Robert, D. B., Kevin, C., Sara De, M., Francesco, F., Bertil, F., Mark, W. F., Jonathan, G., Dick, H., Frank, J. K., Nino, K., Robert, L., Annette, P., Sanjay, T. R., David, R., Beate, R., Jonathan, M. S., Thomas, S., Torben, S., Jordi, S., and Bert, B.: A joint ERS/ATS policy statement: what constitutes an adverse health effect of air pollution? An analytical framework, Eur. Respir. J., 49, 1600419, https://doi.org/10.1183/13993003.00419-2016, 2017.
Gioda, A., Amaral, B. S., Monteiro, I. L. G., and Saint'Pierre, T. D.: Chemical composition, sources, solubility, and transport of aerosol trace elements in a tropical region, J. Environ. Monitor., 13, 2134–2142, https://doi.org/10.1039/c1em10240k, 2011.
Granier, C., Darras, S., Denier van der Gon, H., Doubalova, J., Elguindi, N., Galle, B., Gauss, M., Guevara, M., Jalkanen, J.-P., Kuenen, J., Liousse, C., Quack, B., Simpson, D., and Sindelarova, K.: The Copernicus Atmosphere Monitoring Service global and regional emissions (April 2019 version), Copernicus Atmosphere Monitoring Service (CAMS), Laboratoire d'Aérologie/Claire Granier, https://doi.org/10.24380/d0bn-kx16, 2019.
Guelle, W., Schulz, M., Balkanski, Y., and Dentener, F.: Influence of the source formulation on modeling the atmospheric global distribution of sea salt aerosol, J. Geophys. Res.-Atmos., 106, 27509–27524, https://doi.org/10.1029/2001JD900249, 2001.
Guenther, A. B., Jiang, X., Heald, C. L., Sakulyanontvittaya, T., Duhl, T., Emmons, L. K., and Wang, X.: The Model of Emissions of Gases and Aerosols from Nature version 2.1 (MEGAN2.1): an extended and updated framework for modeling biogenic emissions, Geosci. Model Dev., 5, 1471–1492, https://doi.org/10.5194/gmd-5-1471-2012, 2012.
Guerreiro, C. B. B., Foltescu, V., and de Leeuw, F.: Air quality status and trends in Europe, Atmos. Environ., 98, 376–384, https://doi.org/10.1016/j.atmosenv.2014.09.017, 2014.
Hand, J., Copeland, S. A., McDade, C., Day, D., Moore, Jr., Dillner, A., Pitchford, M., Indresand, H., Schichtel, B., Malm, W., and Watson, J.: Spatial and seasonal patterns and temporal variability of haze and its constituents in the United States, IMPROVE Report V, https://vista.cira.colostate.edu/improve/wp-content/uploads/2016/08/IMPROVE_V_FullReport.pdf (last access: 25 August 2025), 2011.
Haywood, J. and Boucher, O.: Estimates of the direct and indirect radiative forcing due to tropospheric aerosols: A review, Rev. Geophys., 38, 513–543, https://doi.org/10.1029/1999rg000078, 2000.
Hoesly, R. M., Smith, S. J., Feng, L., Klimont, Z., Janssens-Maenhout, G., Pitkanen, T., Seibert, J. J., Vu, L., Andres, R. J., Bolt, R. M., Bond, T. C., Dawidowski, L., Kholod, N., Kurokawa, J.-I., Li, M., Liu, L., Lu, Z., Moura, M. C. P., O'Rourke, P. R., and Zhang, Q.: Historical (1750–2014) anthropogenic emissions of reactive gases and aerosols from the Community Emissions Data System (CEDS), Geosci. Model Dev., 11, 369–408, https://doi.org/10.5194/gmd-11-369-2018, 2018.
Huang, X.-F., He, L.-Y., Hu, M., Canagaratna, M. R., Sun, Y., Zhang, Q., Zhu, T., Xue, L., Zeng, L.-W., Liu, X.-G., Zhang, Y.-H., Jayne, J. T., Ng, N. L., and Worsnop, D. R.: Highly time-resolved chemical characterization of atmospheric submicron particles during 2008 Beijing Olympic Games using an Aerodyne High-Resolution Aerosol Mass Spectrometer, Atmos. Chem. Phys., 10, 8933–8945, https://doi.org/10.5194/acp-10-8933-2010, 2010.
IPCC: Climate Change 2013 – The physical science basis. Working Group I Contribution to the Fifth Assessment Report of the Intergovernmental Panel on Climate Change, Cambridge University Press, Cambridge, https://doi.org/10.1017/CBO9781107415324, 2014.
IPCC: Climate Change 2022: Mitigation of Climate Change. Contribution of Working Group III to the Sixth Assessment Report of the Intergovernmental Panel on Climate Change, Cambridge University Press, Cambridge, UK and New York, NY, USA, https://doi.org/10.1017/9781009157926, 2023.
Janssen, R. H. H., Tsimpidi, A. P., Karydis, V. A., Pozzer, A., Lelieveld, J., Crippa, M., Prévôt, A. S. H., Ait-Helal, W., Borbon, A., Sauvage, S., and Locoge, N.: Influence of local production and vertical transport on the organic aerosol budget over Paris, J. Geophys. Res.-Atmos., 122, 8276–8296, https://doi.org/10.1002/2016JD026402, 2017.
Jayne, J. T., Leard, D. C., Zhang, X., Davidovits, P., Smith, K. A., Kolb, C. E., and Worsnop, D. R.: Development of an Aerosol Mass Spectrometer for Size and Composition Analysis of Submicron Particles, Aerosol Sci. Tech., 33, 49–70, https://doi.org/10.1080/027868200410840, 2000.
Jimenez, J. L., Canagaratna, M. R., Donahue, N. M., Prevot, A. S. H., Zhang, Q., Kroll, J. H., DeCarlo, P. F., Allan, J. D., Coe, H., Ng, N. L., Aiken, A. C., Docherty, K. S., Ulbrich, I. M., Grieshop, A. P., Robinson, A. L., Duplissy, J., Smith, J. D., Wilson, K. R., Lanz, V. A., Hueglin, C., Sun, Y. L., Tian, J., Laaksonen, A., Raatikainen, T., Rautiainen, J., Vaattovaara, P., Ehn, M., Kulmala, M., Tomlinson, J. M., Collins, D. R., Cubison, M. J., Dunlea, E. J., Huffman, J. A., Onasch, T. B., Alfarra, M. R., Williams, P. I., Bower, K., Kondo, Y., Schneider, J., Drewnick, F., Borrmann, S., Weimer, S., Demerjian, K., Salcedo, D., Cottrell, L., Griffin, R., Takami, A., Miyoshi, T., Hatakeyama, S., Shimono, A., Sun, J. Y., Zhang, Y. M., Dzepina, K., Kimmel, J. R., Sueper, D., Jayne, J. T., Herndon, S. C., Trimborn, A. M., Williams, L. R., Wood, E. C., Middlebrook, A. M., Kolb, C. E., Baltensperger, U., and Worsnop, D. R.: Evolution of organic aerosols in the atmosphere, Science, 326, 1525–1529, 2009.
Jöckel, P., Tost, H., Pozzer, A., Brühl, C., Buchholz, J., Ganzeveld, L., Hoor, P., Kerkweg, A., Lawrence, M. G., Sander, R., Steil, B., Stiller, G., Tanarhte, M., Taraborrelli, D., van Aardenne, J., and Lelieveld, J.: The atmospheric chemistry general circulation model ECHAM5/MESSy1: consistent simulation of ozone from the surface to the mesosphere, Atmos. Chem. Phys., 6, 5067–5104, https://doi.org/10.5194/acp-6-5067-2006, 2006.
Jöckel, P., Kerkweg, A., Pozzer, A., Sander, R., Tost, H., Riede, H., Baumgaertner, A., Gromov, S., and Kern, B.: Development cycle 2 of the Modular Earth Submodel System (MESSy2), Geosci. Model Dev., 3, 717–752, https://doi.org/10.5194/gmd-3-717-2010, 2010.
Kaiser, J. W., Heil, A., Andreae, M. O., Benedetti, A., Chubarova, N., Jones, L., Morcrette, J.-J., Razinger, M., Schultz, M. G., Suttie, M., and van der Werf, G. R.: Biomass burning emissions estimated with a global fire assimilation system based on observed fire radiative power, Biogeosciences, 9, 527–554, https://doi.org/10.5194/bg-9-527-2012, 2012.
Kakavas, S., Pandis, S. N., and Nenes, A.: ISORROPIA-Lite: A Comprehensive Atmospheric Aerosol Thermodynamics Module for Earth System Models, Tellus B, 74, 1–23, https://doi.org/10.16993/tellusb.33, 2022.
Kanakidou, M., Seinfeld, J. H., Pandis, S. N., Barnes, I., Dentener, F. J., Facchini, M. C., Van Dingenen, R., Ervens, B., Nenes, A., Nielsen, C. J., Swietlicki, E., Putaud, J. P., Balkanski, Y., Fuzzi, S., Horth, J., Moortgat, G. K., Winterhalter, R., Myhre, C. E. L., Tsigaridis, K., Vignati, E., Stephanou, E. G., and Wilson, J.: Organic aerosol and global climate modelling: a review, Atmos. Chem. Phys., 5, 1053–1123, https://doi.org/10.5194/acp-5-1053-2005, 2005.
Karydis, V. A., Tsimpidi, A. P., Pozzer, A., Astitha, M., and Lelieveld, J.: Effects of mineral dust on global atmospheric nitrate concentrations, Atmos. Chem. Phys., 16, 1491–1509, https://doi.org/10.5194/acp-16-1491-2016, 2016.
Karydis, V. A., Tsimpidi, A. P., Bacer, S., Pozzer, A., Nenes, A., and Lelieveld, J.: Global impact of mineral dust on cloud droplet number concentration, Atmos. Chem. Phys., 17, 5601–5621, https://doi.org/10.5194/acp-17-5601-2017, 2017.
Karydis, V. A., Tsimpidi, A. P., Pozzer, A., and Lelieveld, J.: How alkaline compounds control atmospheric aerosol particle acidity, Atmos. Chem. Phys., 21, 14983–15001, https://doi.org/10.5194/acp-21-14983-2021, 2021.
Klingmüller, K., Metzger, S., Abdelkader, M., Karydis, V. A., Stenchikov, G. L., Pozzer, A., and Lelieveld, J.: Revised mineral dust emissions in the atmospheric chemistry–climate model EMAC (MESSy 2.52 DU_Astitha1 KKDU2017 patch), Geosci. Model Dev., 11, 989–1008, https://doi.org/10.5194/gmd-11-989-2018, 2018.
Klingmüller, K., Lelieveld, J., Karydis, V. A., and Stenchikov, G. L.: Direct radiative effect of dust–pollution interactions, Atmos. Chem. Phys., 19, 7397–7408, https://doi.org/10.5194/acp-19-7397-2019, 2019.
Klingmüller, K., Karydis, V. A., Bacer, S., Stenchikov, G. L., and Lelieveld, J.: Weaker cooling by aerosols due to dust–pollution interactions, Atmos. Chem. Phys., 20, 15285–15295, https://doi.org/10.5194/acp-20-15285-2020, 2020.
Kok, J. F., Storelvmo, T., Karydis, V. A., Adebiyi, A. A., Mahowald, N. M., Evan, A. T., He, C. L., and Leung, D. M.: Mineral dust aerosol impacts on global climate and climate change, Nature Reviews Earth & Environment, 4, 71–86, https://doi.org/10.1038/s43017-022-00379-5, 2023.
Kostenidou, E., Florou, K., Kaltsonoudis, C., Tsiflikiotou, M., Vratolis, S., Eleftheriadis, K., and Pandis, S. N.: Sources and chemical characterization of organic aerosol during the summer in the eastern Mediterranean, Atmos. Chem. Phys., 15, 11355–11371, https://doi.org/10.5194/acp-15-11355-2015, 2015.
Kuzu, S. L., Yavuz, E., Akyüz, E., Saral, A., Akkoyunlu, B. O., Özdemir, H., Demir, G., and Ünal, A.: Black carbon and size-segregated elemental carbon, organic carbon compositions in a megacity: a case study for Istanbul, Air Quality, Atmosphere & Health, 13, 827–837, https://doi.org/10.1007/s11869-020-00839-1, 2020.
Kyllönen, K., Vestenius, M., Anttila, P., Makkonen, U., Aurela, M., Wängberg, I., Mastromonaco, M. N., and Hakola, H.: Trends and source apportionment of atmospheric heavy metals at a subarctic site during 1996–2018, Atmos. Environ., 236, 117644, https://doi.org/10.1016/j.atmosenv.2020.117644, 2020.
Lang, P. E., Carslaw, D. C., and Moller, S. J.: A trend analysis approach for air quality network data, Atmos. Environ.-X, 2, 100030, https://doi.org/10.1016/j.aeaoa.2019.100030, 2019.
Lanz, V. A., Alfarra, M. R., Baltensperger, U., Buchmann, B., Hueglin, C., and Prévôt, A. S. H.: Source apportionment of submicron organic aerosols at an urban site by factor analytical modelling of aerosol mass spectra, Atmos. Chem. Phys., 7, 1503–1522, https://doi.org/10.5194/acp-7-1503-2007, 2007.
Lanz, V. A., Alfarra, M. R., Baltensperger, U., Buchmann, B., Hueglin, C., Szidat, S., Wehrli, M. N., Wacker, L., Weimer, S., Caseiro, A., Puxbaum, H., and Prevot, A. S. H.: Source attribution of submicron organic aerosols during wintertime inversions by advanced factor analysis of aerosol mass spectra, Environ. Sci. Technol., 42, 214–220, https://doi.org/10.1021/es0707207, 2008.
Lanz, V. A., Prévôt, A. S. H., Alfarra, M. R., Weimer, S., Mohr, C., DeCarlo, P. F., Gianini, M. F. D., Hueglin, C., Schneider, J., Favez, O., D'Anna, B., George, C., and Baltensperger, U.: Characterization of aerosol chemical composition with aerosol mass spectrometry in Central Europe: an overview, Atmos. Chem. Phys., 10, 10453–10471, https://doi.org/10.5194/acp-10-10453-2010, 2010.
Lelieveld, J., Evans, J. S., Fnais, M., Giannadaki, D., and Pozzer, A.: The contribution of outdoor air pollution sources to premature mortality on a global scale, Nature, 525, 367–371, https://doi.org/10.1038/nature15371, 2015.
Li, L., Wang, W., Feng, J., Zhang, D., Li, H., Gu, Z., Wang, B., Sheng, G., and Fu, J.: Composition, source, mass closure of PM2.5 aerosols for four forests in eastern China, J. Environ. Sci., 22, 405–412, https://doi.org/10.1016/s1001-0742(09)60122-4, 2010.
Liu, X., Lara, R., Dufresne, M., Wu, L., Zhang, X., Wang, T., Monge, M., Reche, C., Di Leo, A., Lanzani, G., Colombi, C., Font, A., Sheehan, A., Green, D. C., Makkonen, U., Sauvage, S., Salameh, T., Petit, J.-E., Chatain, M., Coe, H., Hou, S., Harrison, R., Hopke, P. K., Petäjä, T., Alastuey, A., and Querol, X.: Variability of ambient air ammonia in urban Europe (Finland, France, Italy, Spain, and the UK), Environ. Int., 185, 108519, https://doi.org/10.1016/j.envint.2024.108519, 2024.
Lohmann, U. and Ferrachat, S.: Impact of parametric uncertainties on the present-day climate and on the anthropogenic aerosol effect, Atmos. Chem. Phys., 10, 11373–11383, https://doi.org/10.5194/acp-10-11373-2010, 2010.
Mallet, M. D., D'Anna, B., Même, A., Bove, M. C., Cassola, F., Pace, G., Desboeufs, K., Di Biagio, C., Doussin, J.-F., Maille, M., Massabò, D., Sciare, J., Zapf, P., di Sarra, A. G., and Formenti, P.: Summertime surface PM1 aerosol composition and size by source region at the Lampedusa island in the central Mediterranean Sea, Atmos. Chem. Phys., 19, 11123–11142, https://doi.org/10.5194/acp-19-11123-2019, 2019.
Mariani, R. L. and de Mello, W. Z.: PM2.5-10, PM2.5 and associated water-soluble inorganic species at a coastal urban site in the metropolitan region of Rio de Janeiro, Atmos. Environ., 41, 2887–2892, https://doi.org/10.1016/j.atmosenv.2006.12.009, 2007.
Martin, S. T., Andreae, M. O., Artaxo, P., Baumgardner, D., Chen, Q., Goldstein, A. H., Guenther, A., Heald, C. L., Mayol-Bracero, O. L., McMurry, P. H., Pauliquevis, T., Poschl, U., Prather, K. A., Roberts, G. C., Saleska, S. R., Dias, M. A. S., Spracklen, D. V., Swietlicki, E., and Trebs, I.: Sources and Properties of Amazonian Aerosol Particles, Rev. Geophys., 48, RG2002, https://doi.org/10.1029/2008rg000280, 2010.
Milousis, A., Tsimpidi, A. P., Tost, H., Pandis, S. N., Nenes, A., Kiendler-Scharr, A., and Karydis, V. A.: Implementation of the ISORROPIA-lite aerosol thermodynamics model into the EMAC chemistry climate model (based on MESSy v2.55): implications for aerosol composition and acidity, Geosci. Model Dev., 17, 1111–1131, https://doi.org/10.5194/gmd-17-1111-2024, 2024.
Mkoma, S. L., Maenhaut, W., Chi, X. G., Wang, W., and Raes, N.: Characterisation of PM10 atmospheric aerosols for the wet season 2005 at two sites in East Africa, Atmos. Environ., 43, 631–639, https://doi.org/10.1016/j.atmosenv.2008.10.008, 2009.
Mohr, C., DeCarlo, P. F., Heringa, M. F., Chirico, R., Slowik, J. G., Richter, R., Reche, C., Alastuey, A., Querol, X., Seco, R., Peñuelas, J., Jiménez, J. L., Crippa, M., Zimmermann, R., Baltensperger, U., and Prévôt, A. S. H.: Identification and quantification of organic aerosol from cooking and other sources in Barcelona using aerosol mass spectrometer data, Atmos. Chem. Phys., 12, 1649–1665, https://doi.org/10.5194/acp-12-1649-2012, 2012.
Molina, L. T., Kolb, C. E., de Foy, B., Lamb, B. K., Brune, W. H., Jimenez, J. L., Ramos-Villegas, R., Sarmiento, J., Paramo-Figueroa, V. H., Cardenas, B., Gutierrez-Avedoy, V., and Molina, M. J.: Air quality in North America's most populous city – overview of the MCMA-2003 campaign, Atmos. Chem. Phys., 7, 2447–2473, https://doi.org/10.5194/acp-7-2447-2007, 2007.
Molina, L. T., Madronich, S., Gaffney, J. S., Apel, E., de Foy, B., Fast, J., Ferrare, R., Herndon, S., Jimenez, J. L., Lamb, B., Osornio-Vargas, A. R., Russell, P., Schauer, J. J., Stevens, P. S., Volkamer, R., and Zavala, M.: An overview of the MILAGRO 2006 Campaign: Mexico City emissions and their transport and transformation, Atmos. Chem. Phys., 10, 8697–8760, https://doi.org/10.5194/acp-10-8697-2010, 2010.
Ng, N. L., Canagaratna, M. R., Zhang, Q., Jimenez, J. L., Tian, J., Ulbrich, I. M., Kroll, J. H., Docherty, K. S., Chhabra, P. S., Bahreini, R., Murphy, S. M., Seinfeld, J. H., Hildebrandt, L., Donahue, N. M., DeCarlo, P. F., Lanz, V. A., Prévôt, A. S. H., Dinar, E., Rudich, Y., and Worsnop, D. R.: Organic aerosol components observed in Northern Hemispheric datasets from Aerosol Mass Spectrometry, Atmos. Chem. Phys., 10, 4625–4641, https://doi.org/10.5194/acp-10-4625-2010, 2010.
Ng, N. L., Canagaratna, M. R., Jimenez, J. L., Zhang, Q., Ulbrich, I. M., and Worsnop, D. R.: Real-Time Methods for Estimating Organic Component Mass Concentrations from Aerosol Mass Spectrometer Data, Environ. Sci. Technol., 45, 910–916, https://doi.org/10.1021/es102951k, 2011.
Paatero, P.: Least squares formulation of robust non-negative factor analysis, Chemometr. Intell. Lab., 37, 23–35, https://doi.org/10.1016/s0169-7439(96)00044-5, 1997.
Paatero, P.: The Multilinear Engine – A Table-Driven, Least Squares Program for Solving Multilinear Problems, Including the n-Way Parallel Factor Analysis Model, J. Comput. Graph. Stat., 8, 854–888, https://doi.org/10.1080/10618600.1999.10474853, 1999.
Paatero, P. and Tapper, U.: Positive matrix factorization-A nonnegative factor model with optimal utilization of error-estimates of data values, Environmetrics, 5, 111–126, https://doi.org/10.1002/env.3170050203, 1994.
Parworth, C., Fast, J., Mei, F., Shippert, T., Sivaraman, C., Tilp, A., Watson, T., and Zhang, Q.: Long-term measurements of submicrometer aerosol chemistry at the Southern Great Plains (SGP) using an Aerosol Chemical Speciation Monitor (ACSM), Atmos. Environ., 106, 43–55, https://doi.org/10.1016/j.atmosenv.2015.01.060, 2015.
Pathak, R. K., Wang, T., Ho, K. F., and Lee, S. C.: Characteristics of summertime PM2.5 organic and elemental carbon in four major Chinese cities: Implications of high acidity for water-soluble organic carbon (WSOC), Atmos. Environ., 45, 318–325, https://doi.org/10.1016/j.atmosenv.2010.10.021, 2011.
Paulot, F., Jacob, D. J., Pinder, R. W., Bash, J. O., Travis, K., and Henze, D. K.: Ammonia emissions in the United States, European Union, and China derived by high-resolution inversion of ammonium wet deposition data: Interpretation with a new agricultural emissions inventory (MASAGE_NH3), J. Geophys. Res.-Atmos., 119, 4343–4364, https://doi.org/10.1002/2013JD021130, 2014.
Petit, J.-E., Favez, O., Sciare, J., Crenn, V., Sarda-Estève, R., Bonnaire, N., Močnik, G., Dupont, J.-C., Haeffelin, M., and Leoz-Garziandia, E.: Two years of near real-time chemical composition of submicron aerosols in the region of Paris using an Aerosol Chemical Speciation Monitor (ACSM) and a multi-wavelength Aethalometer, Atmos. Chem. Phys., 15, 2985–3005, https://doi.org/10.5194/acp-15-2985-2015, 2015.
Pope, C. A., Ezzati, M., and Dockery, D. W.: Fine-Particulate Air Pollution and Life Expectancy in the United States, New Engl. J. Med., 360, 376–386, https://doi.org/10.1056/NEJMsa0805646, 2009.
Pozzer, A., Jöckel, P., Sander, R., Williams, J., Ganzeveld, L., and Lelieveld, J.: Technical Note: The MESSy-submodel AIRSEA calculating the air-sea exchange of chemical species, Atmos. Chem. Phys., 6, 5435–5444, https://doi.org/10.5194/acp-6-5435-2006, 2006.
Pozzer, A., Reifenberg, S. F., Kumar, V., Franco, B., Kohl, M., Taraborrelli, D., Gromov, S., Ehrhart, S., Jöckel, P., Sander, R., Fall, V., Rosanka, S., Karydis, V., Akritidis, D., Emmerichs, T., Crippa, M., Guizzardi, D., Kaiser, J. W., Clarisse, L., Kiendler-Scharr, A., Tost, H., and Tsimpidi, A.: Simulation of organics in the atmosphere: evaluation of EMACv2.54 with the Mainz Organic Mechanism (MOM) coupled to the ORACLE (v1.0) submodel, Geosci. Model Dev., 15, 2673–2710, https://doi.org/10.5194/gmd-15-2673-2022, 2022.
Price, C. and Rind, D.: A Simple Lightning Parameterization for Calculating Global Lightning Distributions, J. Geophys. Res.-Atmos., 97, 9919–9933, 1992.
Pringle, K. J., Tost, H., Message, S., Steil, B., Giannadaki, D., Nenes, A., Fountoukis, C., Stier, P., Vignati, E., and Lelieveld, J.: Description and evaluation of GMXe: a new aerosol submodel for global simulations (v1), Geosci. Model Dev., 3, 391–412, https://doi.org/10.5194/gmd-3-391-2010, 2010.
Radhi, M., Box, M. A., Box, G. P., Mitchell, R. M., Cohen, D. D., Stelcer, E., and Keywood, M. D.: Optical, physical and chemical characteristics of Australian continental aerosols: results from a field experiment, Atmos. Chem. Phys., 10, 5925–5942, https://doi.org/10.5194/acp-10-5925-2010, 2010.
Rattanavaraha, W., Canagaratna, M. R., Budisulistiorini, S. H., Croteau, P. L., Baumann, K., Canonaco, F., Prevot, A. S. H., Edgerton, E. S., Zhang, Z., Jayne, J. T., Worsnop, D. R., Gold, A., Shaw, S. L., and Surratt, J. D.: Source apportionment of submicron organic aerosol collected from Atlanta, Georgia, during 2014–2015 using the aerosol chemical speciation monitor (ACSM), Atmos. Environ., 167, 389–402, https://doi.org/10.1016/j.atmosenv.2017.07.055, 2017.
Roeckner, E., Brokopf, R., Esch, M., Giorgetta, M., Hagemann, S., Kornblueh, L., Manzini, E., Schlese, U., and Schulzweida, U.: Sensitivity of simulated climate to horizontal and vertical resolution in the ECHAM5 atmosphere model, J. Climate, 19, 3771–3791, https://doi.org/10.1175/jcli3824.1, 2006.
Sander, R., Baumgaertner, A., Cabrera-Perez, D., Frank, F., Gromov, S., Grooß, J.-U., Harder, H., Huijnen, V., Jöckel, P., Karydis, V. A., Niemeyer, K. E., Pozzer, A., Riede, H., Schultz, M. G., Taraborrelli, D., and Tauer, S.: The community atmospheric chemistry box model CAABA/MECCA-4.0, Geosci. Model Dev., 12, 1365–1385, https://doi.org/10.5194/gmd-12-1365-2019, 2019.
Schlag, P., Kiendler-Scharr, A., Blom, M. J., Canonaco, F., Henzing, J. S., Moerman, M., Prévôt, A. S. H., and Holzinger, R.: Aerosol source apportionment from 1-year measurements at the CESAR tower in Cabauw, the Netherlands, Atmos. Chem. Phys., 16, 8831–8847, https://doi.org/10.5194/acp-16-8831-2016, 2016.
Seinfeld, J. H. and Pandis, S. N.: Atmospheric Chemistry and Physics: From Air Pollution to Climate Change, Second, John Wiley & Sons, Inc., Hoboken, New Jersey, ISBN 0471720186, 2006.
Snider, G., Weagle, C. L., Martin, R. V., van Donkelaar, A., Conrad, K., Cunningham, D., Gordon, C., Zwicker, M., Akoshile, C., Artaxo, P., Anh, N. X., Brook, J., Dong, J., Garland, R. M., Greenwald, R., Griffith, D., He, K., Holben, B. N., Kahn, R., Koren, I., Lagrosas, N., Lestari, P., Ma, Z., Vanderlei Martins, J., Quel, E. J., Rudich, Y., Salam, A., Tripathi, S. N., Yu, C., Zhang, Q., Zhang, Y., Brauer, M., Cohen, A., Gibson, M. D., and Liu, Y.: SPARTAN: a global network to evaluate and enhance satellite-based estimates of ground-level particulate matter for global health applications, Atmos. Meas. Tech., 8, 505–521, https://doi.org/10.5194/amt-8-505-2015, 2015.
Snider, G., Weagle, C. L., Murdymootoo, K. K., Ring, A., Ritchie, Y., Stone, E., Walsh, A., Akoshile, C., Anh, N. X., Balasubramanian, R., Brook, J., Qonitan, F. D., Dong, J., Griffith, D., He, K., Holben, B. N., Kahn, R., Lagrosas, N., Lestari, P., Ma, Z., Misra, A., Norford, L. K., Quel, E. J., Salam, A., Schichtel, B., Segev, L., Tripathi, S., Wang, C., Yu, C., Zhang, Q., Zhang, Y., Brauer, M., Cohen, A., Gibson, M. D., Liu, Y., Martins, J. V., Rudich, Y., and Martin, R. V.: Variation in global chemical composition of PM2.5: emerging results from SPARTAN, Atmos. Chem. Phys., 16, 9629–9653, https://doi.org/10.5194/acp-16-9629-2016, 2016.
Solomon, P. A., Crumpler, D., Flanagan, J. B., Jayanty, R. K. M., Rickman, E. E., and McDade, C. E.: US National PM2.5 Chemical Speciation Monitoring Networks-CSN and IMPROVE: Description of networks, J. Air Waste Manage. Assoc., 64, 1410–1438, https://doi.org/10.1080/10962247.2014.956904, 2014.
Souza, P. A. d., Mello, W. Z. d., Mariani, R. L., and Sella, S. M.: Caracterização do material particulado fino e grosso e composição da fração inorgânica solúvel em água em São José dos Campos (SP), Quím. Nova, 33, 1247–1253, 2010.
Stavroulas, I., Bougiatioti, A., Grivas, G., Paraskevopoulou, D., Tsagkaraki, M., Zarmpas, P., Liakakou, E., Gerasopoulos, E., and Mihalopoulos, N.: Sources and processes that control the submicron organic aerosol composition in an urban Mediterranean environment (Athens): a high temporal-resolution chemical composition measurement study, Atmos. Chem. Phys., 19, 901–919, https://doi.org/10.5194/acp-19-901-2019, 2019.
Sun, Y., Xu, W., Zhang, Q., Jiang, Q., Canonaco, F., Prévôt, A. S. H., Fu, P., Li, J., Jayne, J., Worsnop, D. R., and Wang, Z.: Source apportionment of organic aerosol from 2-year highly time-resolved measurements by an aerosol chemical speciation monitor in Beijing, China, Atmos. Chem. Phys., 18, 8469–8489, https://doi.org/10.5194/acp-18-8469-2018, 2018.
Sun, Y., He, Y., Kuang, Y., Xu, W., Song, S., Ma, N., Tao, J., Cheng, P., Wu, C., Su, H., Cheng, Y., Xie, C., Chen, C., Lei, L., Qiu, Y., Fu, P., Croteau, P., and Worsnop, D. R.: Chemical Differences Between PM1 and PM2.5 in Highly Polluted Environment and Implications in Air Pollution Studies, Geophys. Res. Lett., 47, e2019GL086288, https://doi.org/10.1029/2019GL086288, 2020.
Sun, Y. L., Wang, Z. F., Fu, P. Q., Yang, T., Jiang, Q., Dong, H. B., Li, J., and Jia, J. J.: Aerosol composition, sources and processes during wintertime in Beijing, China, Atmos. Chem. Phys., 13, 4577–4592, https://doi.org/10.5194/acp-13-4577-2013, 2013.
Tiitta, P., Vakkari, V., Croteau, P., Beukes, J. P., van Zyl, P. G., Josipovic, M., Venter, A. D., Jaars, K., Pienaar, J. J., Ng, N. L., Canagaratna, M. R., Jayne, J. T., Kerminen, V.-M., Kokkola, H., Kulmala, M., Laaksonen, A., Worsnop, D. R., and Laakso, L.: Chemical composition, main sources and temporal variability of PM1 aerosols in southern African grassland, Atmos. Chem. Phys., 14, 1909–1927, https://doi.org/10.5194/acp-14-1909-2014, 2014.
Timonen, H., Carbone, S., Aurela, M., Saarnio, K., Saarikoski, S., Ng, N. L., Canagaratna, M. R., Kulmala, M., Kerminen, V.-M., Worsnop, D. R., and Hillamo, R.: Characteristics, sources and water-solubility of ambient submicron organic aerosol in springtime in Helsinki, Finland, J. Aerosol Sci., 56, 61–77, https://doi.org/10.1016/j.jaerosci.2012.06.005, 2013.
Tørseth, K., Aas, W., Breivik, K., Fjæraa, A. M., Fiebig, M., Hjellbrekke, A. G., Lund Myhre, C., Solberg, S., and Yttri, K. E.: Introduction to the European Monitoring and Evaluation Programme (EMEP) and observed atmospheric composition change during 1972–2009, Atmos. Chem. Phys., 12, 5447–5481, https://doi.org/10.5194/acp-12-5447-2012, 2012.
Tsigaridis, K., Daskalakis, N., Kanakidou, M., Adams, P. J., Artaxo, P., Bahadur, R., Balkanski, Y., Bauer, S. E., Bellouin, N., Benedetti, A., Bergman, T., Berntsen, T. K., Beukes, J. P., Bian, H., Carslaw, K. S., Chin, M., Curci, G., Diehl, T., Easter, R. C., Ghan, S. J., Gong, S. L., Hodzic, A., Hoyle, C. R., Iversen, T., Jathar, S., Jimenez, J. L., Kaiser, J. W., Kirkevåg, A., Koch, D., Kokkola, H., Lee, Y. H., Lin, G., Liu, X., Luo, G., Ma, X., Mann, G. W., Mihalopoulos, N., Morcrette, J.-J., Müller, J.-F., Myhre, G., Myriokefalitakis, S., Ng, N. L., O'Donnell, D., Penner, J. E., Pozzoli, L., Pringle, K. J., Russell, L. M., Schulz, M., Sciare, J., Seland, Ø., Shindell, D. T., Sillman, S., Skeie, R. B., Spracklen, D., Stavrakou, T., Steenrod, S. D., Takemura, T., Tiitta, P., Tilmes, S., Tost, H., van Noije, T., van Zyl, P. G., von Salzen, K., Yu, F., Wang, Z., Wang, Z., Zaveri, R. A., Zhang, H., Zhang, K., Zhang, Q., and Zhang, X.: The AeroCom evaluation and intercomparison of organic aerosol in global models, Atmos. Chem. Phys., 14, 10845–10895, https://doi.org/10.5194/acp-14-10845-2014, 2014.
Tsimpidi, A. P., Karydis, V. A., Pozzer, A., Pandis, S. N., and Lelieveld, J.: ORACLE (v1.0): module to simulate the organic aerosol composition and evolution in the atmosphere, Geosci. Model Dev., 7, 3153–3172, https://doi.org/10.5194/gmd-7-3153-2014, 2014.
Tsimpidi, A. P., Karydis, V. A., Pandis, S. N., and Lelieveld, J.: Global combustion sources of organic aerosols: model comparison with 84 AMS factor-analysis data sets, Atmos. Chem. Phys., 16, 8939–8962, https://doi.org/10.5194/acp-16-8939-2016, 2016.
Tsimpidi, A. P., Karydis, V. A., Pozzer, A., Pandis, S. N., and Lelieveld, J.: ORACLE 2-D (v2.0): an efficient module to compute the volatility and oxygen content of organic aerosol with a global chemistry–climate model, Geosci. Model Dev., 11, 3369–3389, https://doi.org/10.5194/gmd-11-3369-2018, 2018.
Vasilakopoulou, C. N., Matrali, A., Skyllakou, K., Georgopoulou, M., Aktypis, A., Florou, K., Kaltsonoudis, C., Siouti, E., Kostenidou, E., Błaziak, A., Nenes, A., Papagiannis, S., Eleftheriadis, K., Patoulias, D., Kioutsioukis, I., and Pandis, S. N.: Rapid transformation of wildfire emissions to harmful background aerosol, npj Climate and Atmospheric Science, 6, 218, https://doi.org/10.1038/s41612-023-00544-7, 2023.
Wang, Y., Li, W., Gao, W., Liu, Z., Tian, S., Shen, R., Ji, D., Wang, S., Wang, L., Tang, G., Song, T., Cheng, M., Wang, G., Gong, Z., Hao, J., and Zhang, Y.: Trends in particulate matter and its chemical compositions in China from 2013–2017, Science China Earth Sciences, 62, 1857–1871, https://doi.org/10.1007/s11430-018-9373-1, 2019.
Wang, X., Tsimpidi, A. P., Luo, Z., Steil, B., Pozzer, A., Lelieveld, J., and Karydis, V. A.: The influence of ammonia emissions on the size-resolved global atmospheric aerosol composition and acidity, EGUsphere [preprint], https://doi.org/10.5194/egusphere-2025-527, 2025.
Weinstein, J. P., Hedges, S. R., and Kimbrough, S.: Characterization and aerosol mass balance of PM2.5 and PM10 collected in Conakry, Guinea during the 2004 Harmattan period, Chemosphere, 78, 980–988, https://doi.org/10.1016/j.chemosphere.2009.12.022, 2010.
WHO: Health aspects of air pollution with particulate matter, ozone and nitrogen dioxide: report on a WHO working group, Bonn, Germany, 13–15 January 2003, https://iris.who.int/handle/10665/107478 (last access: 25 August 2025), 2003.
WHO: WHO global air quality guidelines: Particulate matter (PM2.5 and PM10), ozone, nitrogen dioxide, sulfur dioxide and carbon monoxide, https://iris.who.int/bitstream/handle/10665/345329/9789240034228-eng.pdf (last access: 25 August 2025), 2021.
WHO: Ambient (outdoor) air pollution, https://www.who.int/news-room/fact-sheets/detail/ambient-(outdoor)-air-quality-and-health, last access: 15 September 2024.
Xu, L., Suresh, S., Guo, H., Weber, R. J., and Ng, N. L.: Aerosol characterization over the southeastern United States using high-resolution aerosol mass spectrometry: spatial and seasonal variation of aerosol composition and sources with a focus on organic nitrates, Atmos. Chem. Phys., 15, 7307–7336, https://doi.org/10.5194/acp-15-7307-2015, 2015.
Xu, W., Sun, Y., Wang, Q., Zhao, J., Wang, J., Ge, X., Xie, C., Zhou, W., Du, W., Li, J., Fu, P., Wang, Z., Worsnop, D. R., and Coe, H.: Changes in Aerosol Chemistry From 2014 to 2016 in Winter in Beijing: Insights From High-Resolution Aerosol Mass Spectrometry, J. Geophys. Res.-Atmos., 124, 1132–1147, https://doi.org/10.1029/2018JD029245, 2019.
Yang, Y., Smith, S. J., Wang, H., Lou, S., and Rasch, P. J.: Impact of Anthropogenic Emission Injection Height Uncertainty on Global Sulfur Dioxide and Aerosol Distribution, J. Geophys. Res.-Atmos., 124, 4812–4826, https://doi.org/10.1029/2018JD030001, 2019.
Yao, X. and Zhang, L.: Identifying decadal trends in deweathered concentrations of criteria air pollutants in Canadian urban atmospheres with machine learning approaches, Atmos. Chem. Phys., 24, 7773–7791, https://doi.org/10.5194/acp-24-7773-2024, 2024.
Yienger, J. J. and Levy, H.: Empirical-model of global soil-biogenic NOx emissions, J. Geophys. Res.-Atmos., 100, 11447–11464, https://doi.org/10.1029/95jd00370, 1995.
Zhai, S., Jacob, D. J., Wang, X., Shen, L., Li, K., Zhang, Y., Gui, K., Zhao, T., and Liao, H.: Fine particulate matter (PM2.5) trends in China, 2013–2018: separating contributions from anthropogenic emissions and meteorology, Atmos. Chem. Phys., 19, 11031–11041, https://doi.org/10.5194/acp-19-11031-2019, 2019.
Zhang, F., Xu, L., Chen, J., Yu, Y., Niu, Z., and Yin, L.: Chemical compositions and extinction coefficients of PM2.5 in peri-urban of Xiamen, China, during June 2009–May 2010, Atmos. Res., 106, 150–158, https://doi.org/10.1016/j.atmosres.2011.12.005, 2012.
Zhang, Q., Jimenez, J. L., Canagaratna, M. R., Allan, J. D., Coe, H., Ulbrich, I., Alfarra, M. R., Takami, A., Middlebrook, A. M., Sun, Y. L., Dzepina, K., Dunlea, E., Docherty, K., DeCarlo, P. F., Salcedo, D., Onasch, T., Jayne, J. T., Miyoshi, T., Shimono, A., Hatakeyama, S., Takegawa, N., Kondo, Y., Schneider, J., Drewnick, F., Borrmann, S., Weimer, S., Demerjian, K., Williams, P., Bower, K., Bahreini, R., Cottrell, L., Griffin, R. J., Rautiainen, J., Sun, J. Y., Zhang, Y. M., and Worsnop, D. R.: Ubiquity and dominance of oxygenated species in organic aerosols in anthropogenically-influenced Northern Hemisphere midlatitudes, Geophys. Res. Lett., 34, L13801, https://doi.org/10.1029/2007gl029979, 2007.
Zhang, Y., Sun, J., Zhang, X., Shen, X., Wang, T., and Qin, M.: Seasonal characterization of components and size distributions for submicron aerosols in Beijing, Science China Earth Sciences, 56, 890–900, https://doi.org/10.1007/s11430-012-4515-z, 2013.
Zhang, Y., Tang, L., Yu, H., Wang, Z., Sun, Y., Qin, W., Chen, W., Chen, C., Ding, A., Wu, J., Ge, S., Chen, C., and Zhou, H.-C.: Chemical composition, sources and evolution processes of aerosol at an urban site in Yangtze River Delta, China during wintertime, Atmos. Environ., 123, 339–349, https://doi.org/10.1016/j.atmosenv.2015.08.017, 2015a.
Zhang, Y. J., Tang, L. L., Wang, Z., Yu, H. X., Sun, Y. L., Liu, D., Qin, W., Canonaco, F., Prévôt, A. S. H., Zhang, H. L., and Zhou, H. C.: Insights into characteristics, sources, and evolution of submicron aerosols during harvest seasons in the Yangtze River delta region, China, Atmos. Chem. Phys., 15, 1331–1349, https://doi.org/10.5194/acp-15-1331-2015, 2015b.
Zhang, Y. M., Zhang, X. Y., Sun, J. Y., Hu, G. Y., Shen, X. J., Wang, Y. Q., Wang, T. T., Wang, D. Z., and Zhao, Y.: Chemical composition and mass size distribution of PM1 at an elevated site in central east China, Atmos. Chem. Phys., 14, 12237–12249, https://doi.org/10.5194/acp-14-12237-2014, 2014.
Zhao, P. S., Dong, F., He, D., Zhao, X. J., Zhang, X. L., Zhang, W. Z., Yao, Q., and Liu, H. Y.: Characteristics of concentrations and chemical compositions for PM2.5 in the region of Beijing, Tianjin, and Hebei, China, Atmos. Chem. Phys., 13, 4631–4644, https://doi.org/10.5194/acp-13-4631-2013, 2013.
Zheng, B., Tong, D., Li, M., Liu, F., Hong, C., Geng, G., Li, H., Li, X., Peng, L., Qi, J., Yan, L., Zhang, Y., Zhao, H., Zheng, Y., He, K., and Zhang, Q.: Trends in China's anthropogenic emissions since 2010 as the consequence of clean air actions, Atmos. Chem. Phys., 18, 14095–14111, https://doi.org/10.5194/acp-18-14095-2018, 2018.
Zhou, W., Xu, W., Kim, H., Zhang, Q., Fu, P., Worsnop, D. R., and Sun, Y.: A review of aerosol chemistry in Asia: insights from aerosol mass spectrometer measurements, Environ. Sci.-Proc. Imp., 22, 1616–1653, https://doi.org/10.1039/D0EM00212G, 2020a.
Zhou, W., Xu, W., Kim, H., Zhang, Q., Fu, P., Worsnop, D. R., and Sun, Y.: A review of aerosol chemistry in Asia: insights from aerosol mass spectrometer measurements, Environ. Sci.-Proc. Imp., 22, 1616–1653, https://doi.org/10.1039/d0em00212g, 2020b.