the Creative Commons Attribution 4.0 License.
the Creative Commons Attribution 4.0 License.
 | 09 Sep 2024
Biological and dust aerosols as sources of ice-nucleating particles in the eastern Mediterranean: source apportionment, atmospheric processing and parameterization
Franziska Vogel
Romanos Foskinis
Stergios Vratolis
Maria I. Gini
Konstantinos Granakis
Anne-Claire Billault-Roux
Paraskevi Georgakaki
Olga Zografou
Prodromos Fetfatzis
Alexis Berne
Alexandros Papayannis
Konstantinos Eleftheridadis
Ottmar Möhler
Athanasios Nenes
Aerosol–cloud interactions in mixed-phase clouds (MPCs) are one of the most uncertain drivers of the hydrological cycle and climate change. A synergy of in situ, remote-sensing and modelling experiments were used to determine the source of ice-nucleating particles (INPs) for MPCs at Mount Helmos in the eastern Mediterranean. The influences of boundary layer turbulence, vertical aerosol distributions and meteorological conditions were also examined. When the observation site is in the free troposphere (FT), approximately 1 in ×106 aerosol particles serve as INPs around −25 °C. The INP abundance spans 3 orders of magnitude and increases in the following order: marine aerosols; continental aerosols; and, finally, dust plumes. Biological particles are important INPs observed in continental and marine aerosols, whereas they play a secondary, although important, role during Saharan dust events. Air masses in the planetary boundary layer (PBL) show both enriched INP concentrations and a higher proportion of INPs to total aerosol particles, compared with cases in the FT. The presence of precipitation/clouds enriches INPs in the FT but decreases INPs in the PBL. Additionally, new INP parameterizations are developed that incorporate the ratio of fluorescent-to-nonfluorescent or coarse-to-fine particles and predict >90 % of the observed INPs within an uncertainty range of a factor of 10; these new parameterizations exhibit better performance than current widely used parameterizations and allow ice formation in models to respond to variations in dust and biological particles. The improved parameterizations can help MPC formation simulations in regions with various INP sources or different regions with prevailing INP sources.
- Article
(11082 KB) - Full-text XML
-
Supplement
(12589 KB) - BibTeX
- EndNote


Clouds in the atmosphere can be composed solely of liquid-water droplets, ice crystals or a mixture of both (mixed-phase clouds; MPCs). The cloud phase regulates the optical properties and microphysical characteristics of clouds, further influencing their impacts on the hydrological cycle and climate (Tan et al., 2016; Lohmann and Neubauer, 2018; Zhou et al., 2022). Modulation of cloud properties by anthropogenic particles is one of the leading sources of uncertainty in anthropogenic climate change (e.g. Seinfeld et al., 2016). MPCs are ubiquitous (D'Alessandro et al., 2019) but have a much more uncertain impact on climate compared with single-phase clouds (Bjordal et al., 2020). This uncertainty stems from the large number of interactions that can take place among liquid droplets, ice crystals and water vapour – each of which can cool or warm the climate. Furthermore, MPCs exhibit considerable dynamic variability over time and space, as they are thermodynamically unstable. Under supercooled conditions, the saturation vapour pressure with respect to ice (Si) is higher than that with respect to water (Sw), which favours the mass transfer – through deposition from the vapour phase – of liquid water from particles onto ice existing in MPCs, i.e. the growth of the latter at the expense of the former. This process is known as the Wegener–Bergeron–Findeisen (WBF) process (Wegener, 1912; Bergeron, 1935; Findeisen, 1938; Findeisen et al., 2015). The number of ice crystals in MPCs is also regulated by the abundance of aerosol particles capable of initiating ice formation, i.e. ice-nucleating particles (INPs). INPs can trigger primary ice formation in the MPC regime (Kanji et al., 2017; Burrows et al., 2022; Knopf and Alpert, 2023) with the absence of spontaneous ice formation via the homogeneous freezing of solution droplets, which requires temperatures (T) lower than the homogeneous nucleation temperature (Barahona and Nenes, 2009; Lohmann et al., 2016). Thus, the heterogeneous ice nucleation of INPs can lead to MPC glaciation. An added complexity is ice multiplication (or secondary ice processes, SIPs) occurring in warmer MPCs, which can multiply ice crystal numbers by orders of magnitude above the primary ice levels generated by INPs (Field et al., 2017; Sullivan et al., 2018; Georgakaki et al., 2022; Pasquier et al., 2022). Therefore, constraining the abundance and origin of INPs is critical for understanding MPC formation and the effects of MPCs on the hydrological cycle and climate.
MPCs persistently exist in mountainous terrain where local and remote air masses may be present (Pousse-Nottelmann et al., 2015; Lohmann et al., 2016; Henneberg et al., 2017). Different air masses (e.g. continental pollution, dust plumes and sea spray aerosols from remote marine areas) may contain distinct INP populations with a characteristic abundance and ice formation ability (DeMott et al., 2010; Tobo et al., 2013; McCluskey et al., 2018; Brunner et al., 2021). The INP type, which depends on its air mass source, is crucial for determining MPC formation. Different types of INPs nucleate ice in different T regimes. Biological particles, as effective INPs, are active at T values warmer than −15 °C, whereas dust particles generally form ice at T values lower than −15 °C (Murray et al., 2012). In addition, the formation and evolution of MPCs over orographic terrain are influenced by the planetary boundary layer height (PBLH) (Miltenberger et al., 2020), which regulates the aerosol sources depending on whether the observation site is inside or outside of the planetary boundary layer (PBL) (Conen et al., 2015; Wieder et al., 2022). In situ observations at high altitudes in mountainous terrain provide the possibility to specifically investigate INP populations relevant for MPCs under different atmospheric conditions, given that the relative position of a mountaintop in the atmosphere can vary with a changing PBLH (Foskinis et al., 2024).
We study the source of INPs and the characteristics of different INP sources relevant for orographic MPCs in the eastern Mediterranean region. A field campaign, the Cloud-AerosoL InteractionS in the Helmos background TropOsphere (CALISHTO), was conducted at the Helmos Hellenic Atmospheric Aerosol and Climate Change (“(HAC)2” hereafter) station (37.9843° N, 22.1963° E; 2314 m a.s.l., metres above sea level) close to the summit of Mount Helmos. It is reported that (HAC)2 is a station among 12 in Europe with the lowest impacts from the PBL (Collaud Coen et al., 2018), suggesting that it is an appropriate station to study INPs from remote sources and to evaluate the characteristics of INPs under background conditions, e.g. in the free troposphere (FT).
This study presents the observations of INPs and aerosol properties at (HAC)2 during the CALISHTO campaign from a period between 12 October and 27 November 2021. The objectives of this study are twofold. First, we aimed to identify different INP sources at Mount Helmos and evaluate the characteristics of these INP sources. To this end, a synergy of in situ aerosol property measurements, remote-sensing measurements and model simulations of air mass trajectories were used to identify different INP sources. In addition, the influence of precipitation and/or clouds on the INP characteristics was also investigated, considering that precipitation or clouds may serve as sinks or sources of aerosol particles (Isokääntä et al., 2022; Khadir et al., 2023), thereby impacting the INP abundance of the source. Second, we aimed to use the data and analysis carried out to evaluate existing INP parameterizations and propose new ones that more successfully capture the INP number concentration (NINP) for the wide diversity of particle types encountered at Mount Helmos during CALISHTO. Compared with different parameterizations reported in the literature (DeMott et al., 2010, 2015; Niemand et al., 2012; Tobo et al., 2013; Ullrich et al., 2017; McCluskey et al., 2018), the improvement provided by new INP parameterizations is based on the advantage provided by the inclusion of source characteristics, i.e. the partitioning of fluorescent and non-fluorescent (or coarse and fine) particles, yielding important implications for modelling studies aimed at quantifying climate effects of cloud–aerosol interactions in MPCs.
2.1 Overview of field campaign
(HAC)2 is an atmospheric monitoring station that has been contributing data to the Global Atmosphere Watch (GAW) and Aerosols, Clouds and Trace gases Research Infrastructure (ACTRIS) since 2016 (Laj et al., 2020); it is located near the summit of Mount Helmos, at the heart of the Peloponnese, in Greece. (HAC)2 is frequently situated in the FT or at the FT–PBL interface (Foskinis et al., 2024), and it is also frequently covered by clouds in the fall and springtime. These conditions allow for the in situ study of aerosol–cloud interactions for warm and MPC clouds. (HAC)2 is also located at a crossroads of different air masses, including continental pollution, Saharan dust events, long-range-transported biomass burning and marine sea spray aerosols. This allows one to explore the effects of different aerosol types on cloud formation, as is done here. The experimental set-up of the CALISHTO observations is presented in Fig. 1, including in situ ice nucleation (IN) experiments; observations of aerosol properties (size distribution, chemical composition, fluorescent and optical properties) at (HAC)2; remote-sensing measurements conducted at Vathia Lakka (VL), a site 500 m lower than (HAC)2; and back-trajectory analysis to calculate the origin of air masses sampled at (HAC)2. Furthermore, meteorological standard parameters recorded at (HAC)2 were used to correct the measured INP and aerosol particle number concentrations to values under the equivalent atmospheric standard conditions (i.e. per standard volume of sampled air, hereafter denoted using “std”).
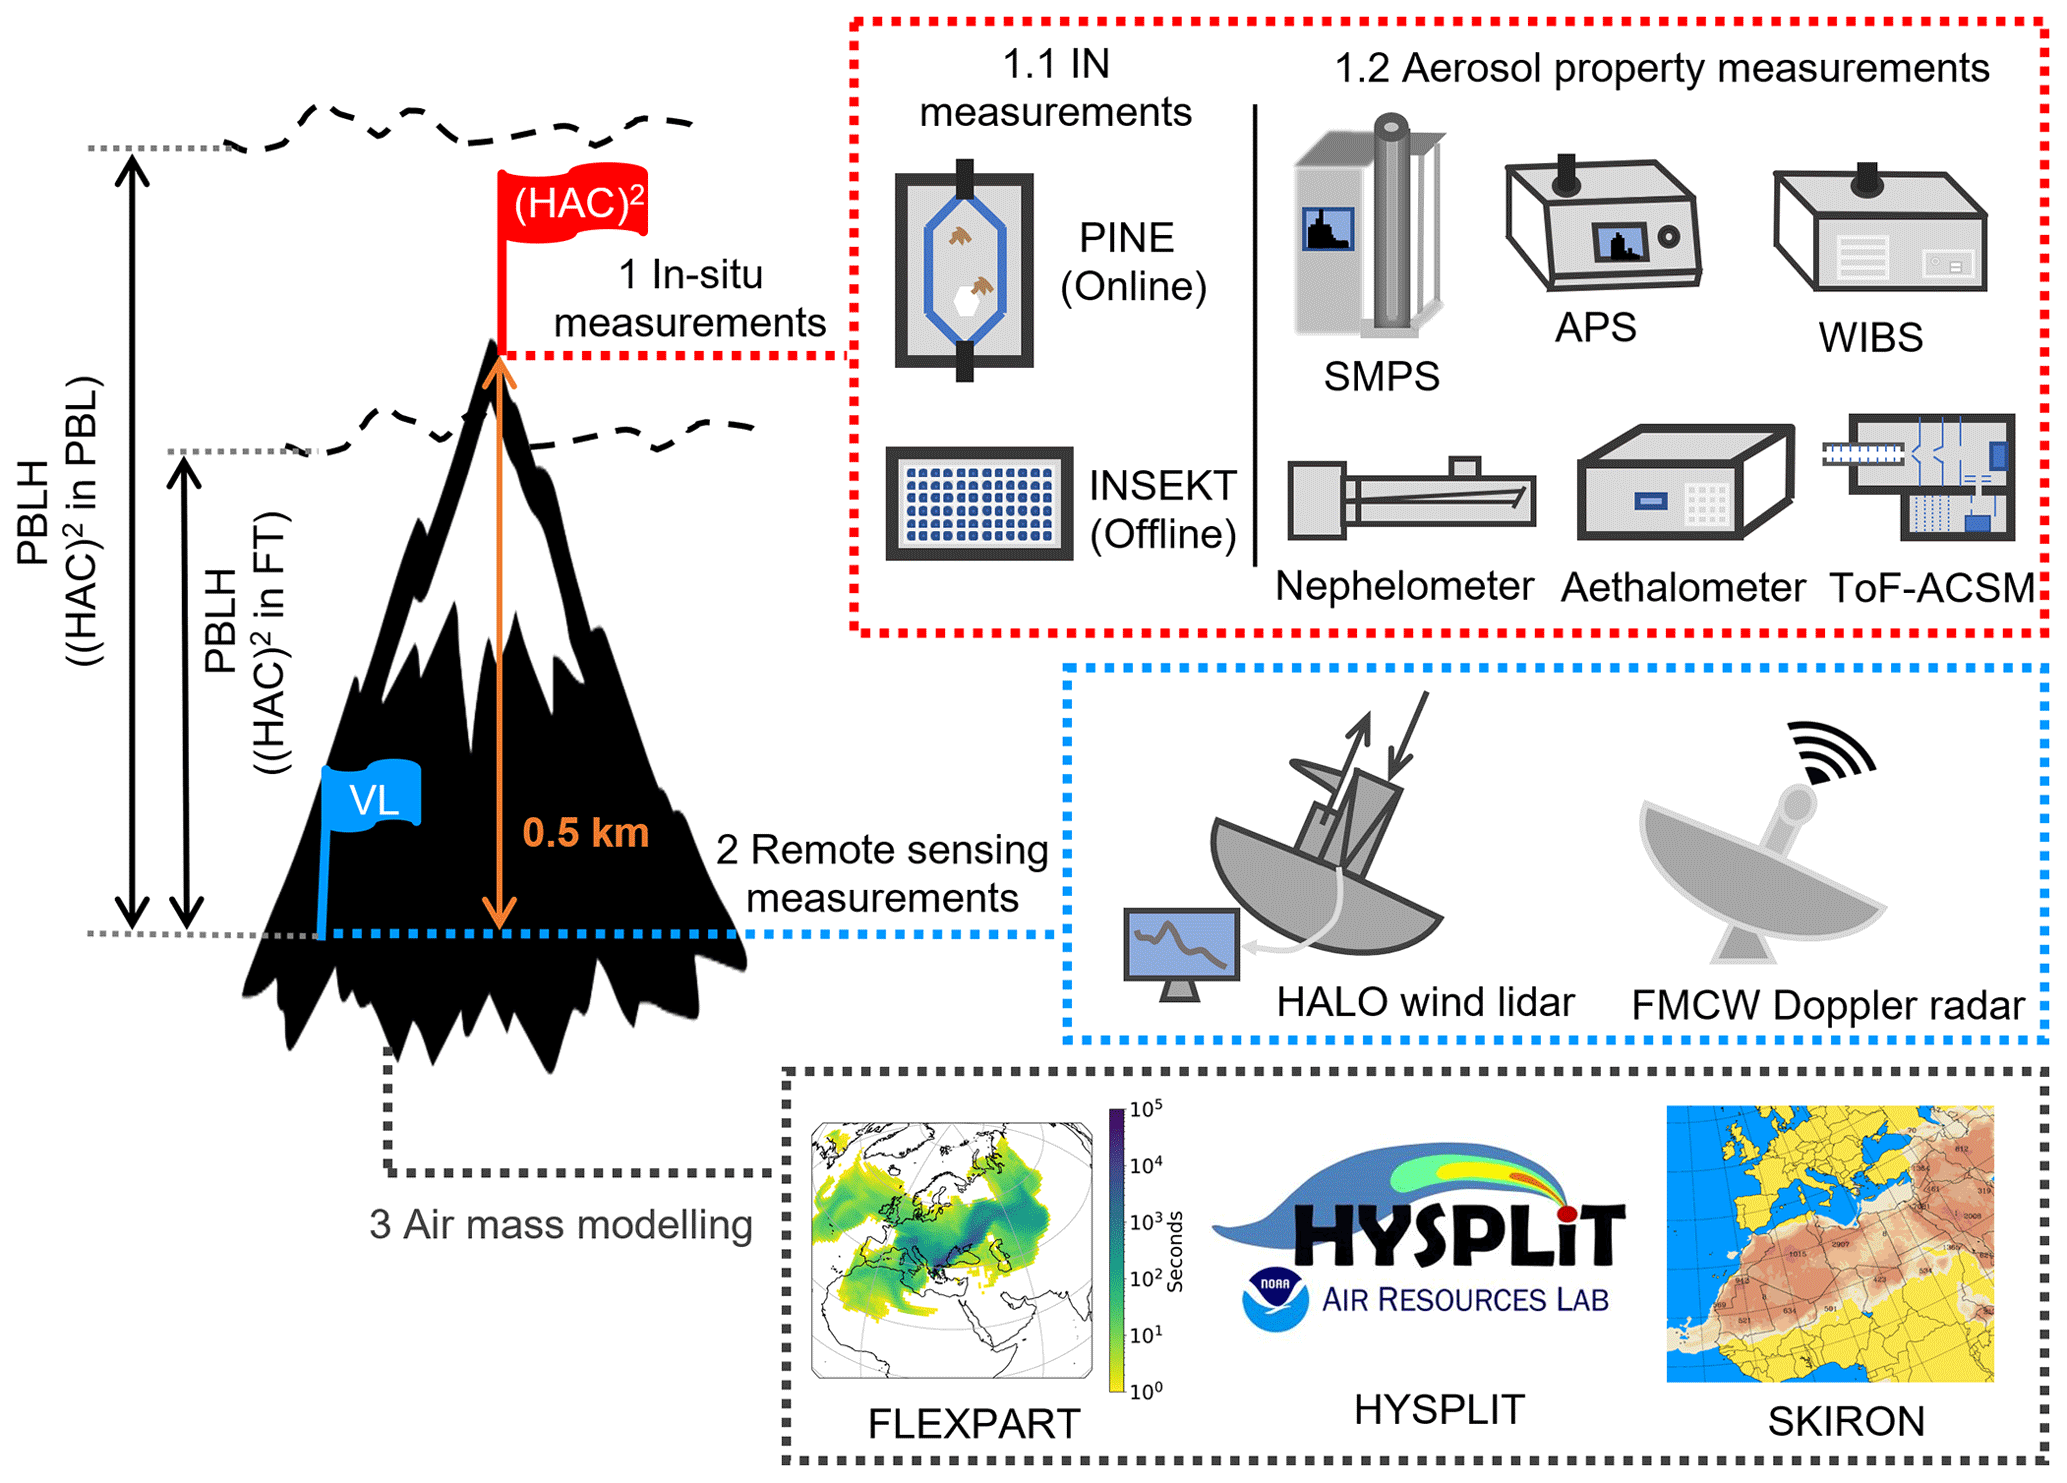
Figure 1Overview of the instrumentation set-up for the CALISHTO campaign. 1: (HAC)2 represents the mountaintop station where in situ measurements were performed, including ice nucleation measurements and aerosol property measurements using a portable ice nucleation experiment (PINE) instrument, a scanning mobility particle sizer (SMPS), an aerodynamic particle sizer (APS), a wideband integrated bioaerosol sensor (WIBS), a nephelometer, an Aethalometer, and a time-of-flight aerosol chemical speciation monitor (ToF-ACSM). Filters were collected for offline analysis using the Ice Nucleation Spectrometer of the Karlsruhe Institute of Technology (INSEKT). 2: VL represents the Vathia Lakka site at the base of Mount Helmos, at an altitude of ∼1.8 km, at which a HALO wind lidar and a frequency-modulated continuous wave (FMCW) Doppler radar (working at 94 GHz) were placed for remote sensing of wind fields, aerosols and clouds. 3: Modelling products include the FLEXible PARTicle dispersion model (FLEXPART) to determine the source regions of aerosol particles reaching the site, the Hybrid Single-Particle Lagrangian Integrated Trajectory (HYSPLIT) model to acquire air mass atmospheric trajectories and the SKIRON model to obtain dust forecasts. PBL is the planetary boundary layer, FT is the free troposphere and PBLH stands for PBL height relative to VL.
2.2 INP observations
2.2.1 Offline INP observation
The Ice Nucleation Spectrometer of the Karlsruhe Institute of Technology (INSEKT) freezing assay (Schiebel, 2017; Schneider et al., 2021) was used to measure the immersion freezing of INPs from 0 to −25 °C (Fig. 1). INSEKT measures the freezing T of small water volumes (50 µL) that contain aerosol suspended in them. To prepare the freezing aliquots, aerosol particles were first sampled onto filters (0.2 µm Whatman Nuclepore track-etched polycarbonate membranes, 47 mm, with a flow rate of 9 L min−1) from an omnidirectional total inlet at (HAC)2. They were then extracted in Nanopure water that had been filtered beforehand through a 0.1 µm Whatman syringe filter. The aerosol suspension was diluted using two different ratios, 15:1 and 225:1, and pipetted into two 96-well polymerase chain reaction (PCR) plates. In addition to the original solution and the dilutions, some of the wells (∼32) were filled with Nanopure water for freezing background tests. The PCR plates were then placed in an aluminium block cooled by an ethanol chiller to perform freezing experiments, and the frozen fraction of the prepared aliquots was recorded as a function of T. Following the analysis protocol reported in Vali (1971) and Vali (2019), the INP concentration of aerosol samples (in particles L−1) as a function of T can be calculated using the tested frozen fraction, the sampled aerosol volume, the suspended liquid volume and the dilution ratio. The sampling time of each filter sample was approximately 24 h, although a few filter samples had a longer sampling time. Detailed information on each INSEKT filter will be provided in a follow-up overview paper for the CALISHTO campaign.
2.2.2 Online INP observations
A portable ice nucleation experiment (PINE) (Möhler et al., 2021) chamber was used for automated real-time observations of INPs at (HAC)2 (Fig. 1). The PINE chamber is designed on the basis of the expansion cooling of air parcels (Möhler et al., 2003), where ambient air (10 L) is sampled into a pre-cooled cloud chamber after passing through Nafion dryers to remove excess moisture and avoid chamber frosting. The air is then expanded and cools down until supersaturation is reached, causing the aerosol particles in the sample to form supercooled droplets and/or ice crystals. Both the number concentration and phase of aerosol particles are monitored, so INPs that activate to ice crystals can be differentiated from droplets and counted. The PINE instrument can be operated in repeated cycles by refilling the cloud chamber with fresh aerosol at the end of an expansion. In this study, the PINE chamber was operated in a T range from −23 to −28 °C and at a saturation ratio with respect to water (Sw) >1.0 to measure INPs activating as ice in all freezing mechanisms. A single PINE expansion cycle has a time resolution of 6 min, and the INP number concentration detection limit for a single experiment is approximately 0.5 particles L−1; averaging over an hour of samples reduces the detection limit to approximately 0.05 particles L−1 (Möhler et al., 2021). The same sampling inlet was used for both the PINE and INSEKT instruments.
2.3 Aerosol property measurements
2.3.1 In situ aerosol property monitoring
Ambient air was sampled through a total inlet for in situ aerosol property measurements at (HAC)2 (Fig. 1). A downstream inlet with an impaction stage supplies particulate matter (aerosol) with an aerodynamic diameter of less than 10 µm (PM10) to a scanning mobility particle sizer (SMPS; Vienna-type differential mobility analyser, DMA, and condensation particle counter, CPC; model 3772, TSI Inc., USA) and an aerodynamic particle sizer (APS; model 3321, TSI Inc., USA) to measure the aerosol particle size distribution range from 10 to 800 nm (electrical mobility diameter) and from 0.5 to 20 µm (aerodynamic diameter), respectively. The number concentration of aerosol particles larger than 95 nm (SMPS N>95 nm) was calculated from the SMPS data and used with a threshold value (100 std cm−3) to determine if (HAC)2 is inside or outside of the PBL (Herrmann et al., 2015; Brunner et al., 2021), given that large aerosol particles are much rarer outside of the PBL. This threshold is confirmed by other methods determining the PBLH using wind lidar and other data (Foskinis et al., 2024). The number concentrations of total, coarse (>1.0 µm, aerodynamic diameter) and fine (<1.0 µm) particles were also calculated based on APS data, termed TotalAPS, CoarseAPS and FineAPS, respectively. In addition, the combined aerosol particle distribution observed by both SMPS and APS was calculated using the method reported in Khlystov et al. (2004). Accordingly, the number concentrations of total particles (TotalSMPS+APS) and total fine particles ( µm, aerodynamic diameter) observed by both SMPS and APS were also calculated.
A wideband integrated bioaerosol sensor–new electronics option (WIBS-5–NEO, Droplet Measurement Technologies, LLC., USA) was used at (HAC)2, sampling aerosols with a PM10 impactor, to measure the size distribution of aerosol particles with optical sizes larger than 0.5 µm. The WIBS also measures the fluorescence of aerosols on a single-particle basis using ultraviolet light to trigger the excitation of the particle and then detecting the fluorescence at three fluorescent channels: FL1 (excitation wavelength at 280 nm and emission detection at the 310–400 nm waveband), FL2 and FL3 (emission detection waveband of 420–650 nm probing particles excited at 280 and 370 nm, respectively). These three channels target different biologic fluorophores: tryptophan-containing proteins, nicotinamide adenine dinucleotide phosphate (NAD(P)H) co-enzymes and riboflavin, respectively (Kaye et al., 2005; Savage et al., 2017), which are ubiquitous in microbes (Pöhlker et al., 2012). Particles showing fluorescence exclusively in any one of the three channels are attributed to a type of AWIBS (FL1 only), BWIBS (FL2 only) or CWIBS (FL3 only), respectively. Particles carrying two types of fluorophores and simultaneously detected by two channels are termed ABWIBS (FL1 and FL2), ACWIBS (FL1 and FL3) or BCWIBS (FL2 and FL3). Particles showing fluorescence in any one of the three channels are termed FluoWIBS. Particles detected in all three channels are attributed to a type of ABCWIBS, which are much more likely to be of biological origin compared with the other types (Hernandez et al., 2016; Savage et al., 2017). Note that non-biological particles may also present in BWIBS, CWIBS and BCWIBS channels, behaving as interfering particles, such as some black carbon and dust particles associated with fluorescent materials (Toprak and Schnaiter, 2013; Savage et al., 2017). The fluorescence detection limit was determined by subtracting the mean background signal plus 9 times the standard deviation measured from routinely forced trigger tests. The WIBS data can be resampled to a customized time span because of their 15 µs high time resolution for single-particle detection. The measurement rates of WIBS-5–NEO are up to 9500 cm−3 for all particles irrespective of fluorescence and up to 466 cm−3 for fluorescent particles.
The hourly mean light-scattering coefficient of dry PM10 aerosols at (HAC)2 was measured using an integrating nephelometer (model 3563, TSI Inc., USA) at three wavelengths (450, 550 and 700 nm, termed Scatt450 nm, Scatt550 nm and Scatt700 nm, respectively) (Laj et al., 2020). Using light-scattering coefficients measured at wavelengths of 450 and 700 nm, the Ångström exponent (α) can be calculated as follows:
The wavelength pair of 450 and 700 nm was used because the larger difference in the measured scattering coefficients gives more accurate α values (Mordas et al., 2015). A lower α value suggests the dominance of coarse particles in the sampled aerosols, whereas a larger α value indicates the dominance of fine particles (Pereira et al., 2008); this helps to differentiate continental aerosols mainly containing fine particles from dust plumes dominated by coarse particles. In addition, the mass concentration of refractory and carbonaceous aerosol particles, i.e. elemental black carbon (eBC), sampled through a PM10 cut-off inlet was monitored by an Aethalometer (AE31, Magee Scientific, USA) at 880 nm with a minimum time base of 2 min. The chemical composition of non-refractory species of submicron ambient aerosols, including organics (Org), sulfate (), nitrate (), ammonium () and chloride (Cl−), was monitored by a time-of-flight aerosol chemical speciation monitor (ToF-ACSM, Aerodyne Research Inc., USA) with a time resolution of 10 min (Zografou et al., 2024).
2.3.2 Air mass remote-sensing measurements
Figure 1 shows that remote-sensing measurements were performed at VL at an altitude 500 m lower than (HAC)2 to measure the PBLH, radar equivalent reflectivity factor (Ze) and mean Doppler velocity (MDV). The PBLH was calculated using the Doppler velocity of aerosols measured by a pulsed Doppler scanning lidar system (StreamLine Wind Pro model, HALO Photonics, UK). The lidar was operated in the vertical stare azimuth display mode at a wavelength of 1.5 µm with a time resolution of 10 min and a vertical spatial resolution of 30 m. The vertical wind speed distribution at a certain distance from the lidar was calculated (Barlow et al., 2011; Schween et al., 2014). The PBL top boundary is defined at a position where the standard deviation of the wind vertical velocity, σw, drops below 0.1 m2 s−2 (Foskinis et al., 2024). The vertical distance between VL and the PBL top boundary is then the PBLH. Note that the PBLH may be undetermined during cloudy periods, as the lidar signal is quickly attenuated in clouds; moreover, when too few particles are present, an insufficient backscattering signal will inhibit PBLH determination. When PBLH results were unavailable, SMPS N>95 nm results were compared to the threshold value (100 std cm−3) to define the (HAC)2 position with respect to the PBL (Herrmann et al., 2015; Brunner et al., 2021). In addition, a frequency-modulated continuous wave (FMCW) wideband Doppler spectral zenith profiler (WProf) was deployed to measure the radar reflectivity at a wavelength of 3.2 mm (corresponding to 94 GHz) up to 10 km a.g.l. (above ground level; Küchler et al., 2017; Billault-Roux et al., 2023; Ferrone and Berne, 2023). The Doppler radar results at the (HAC)2 level (500 m above VL) were used to evaluate the presence of precipitation and clouds.
2.3.3 Air mass modelling
As shown in Fig. 1, the footprint and trajectory of air masses arriving at (HAC)2 were calculated by the FLEXible PARTicle dispersion Model (FLEXPART) (Stohl et al., 2005; Pisso et al., 2019; Vratolis et al., 2023) and the Hybrid Single-Particle Lagrangian Integrated Trajectory (HYSPLIT) model (Draxler and Hess, 1998; Stein et al., 2015). FLEXPART was used to calculate the residence time of aerosol particles with a geometric mean diameter of 400 nm (10 nm–10 µm; Fig. S1 in the Supplement) and a standard deviation of 3.3 in defined locations in the prior 10 d. The spatial resolution of the model corresponds to a grid cell size of 1°×1°. Note that more than 90 % of the aerosol particles used in FLEXPART simulations have diameters larger than 100 nm, and particles of this size range (>100 nm) are mainly responsible for the observed INPs. The 24 h aerosol footprint simulation for each calendar day was run every 3 h (from 00:00 to 24:00 LT, local time, UTC+2) by releasing 40 000 air parcels from (HAC)2. Local wind, local turbulence and mesoscale wind fluctuations were considered in the dispersion and transport calculations. Dry and wet aerosol deposition processes were also included in the model. The residence time of aerosol particles in each location was integrated from a height of 0 to 500 m a.g.l.
The HYSPLIT model was run to calculate the 7 d back trajectories of air masses arriving at (HAC)2. Input meteorological data from the Global Data Assimilation System (GDAS, 1°×1° resolution) (Stein et al., 2015; Kostrykin et al., 2021) were used for the back-trajectory calculations. The source height was set at three height levels of 100, 1000 and 2000 m a.g.l. The model was launched every 6 h backward from the start time. The start time of back trajectories on a day was decided depending on the need to specify if there was an aerosol source change during the day.
Finally, the SKIRON model (Kallos et al., 2006; Spyrou et al., 2010) was used to calculate the time series of dust mass concentration at (HAC)2 at different height levels of 1250, 1614, 1881 and 2170 m a.s.l. Along with the with the CoarseAPS particle concentration and the aerosol footprints from FLEXPART, dust mass concentrations below (HAC)2 predicted by SKIRON help to determine the occurrence and intensity of dust plumes and their source region.
2.4 Aerosol source apportionment and type classification
In general, transported aerosol particles from remote regions showed trajectories from the north in early October, at the beginning of the campaign, but changed in a counter-clockwise direction during the campaign. Figure 2 presents exemplary FLEXPART results throughout the campaign to show major aerosol sources from remote regions. Aerosol particles arriving at (HAC)2 on 12 October (Fig. 2a) were seen to come from the north and the northeast, which can be attributed to continental aerosols, whereas later, on 3 November, marine aerosols from the Atlantic Ocean and the Mediterranean Sea might have made up a large fraction of aerosols transported to (HAC)2 (Fig. 2b). On 4 November and later, dust from the Sahara, possibly mixed with marine aerosols, reaches the station (Fig. 2c and d). Notably, the Saharan dust event increases the aerosol content (Fig. 2c) by more than 1 order of magnitude compared with the marine aerosols (Fig. 2b). At the beginning of the Saharan dust event, the case in Fig. 2c spanned ∼3 h and was possibly a transition period with a lower mixture of local aerosols. After that, Saharan dust (Fig. 2d) persisted for about 1 week. Later on, dust mixed with continental particles reached the site (Fig. 2e), followed by primarily continental aerosols from the north of (HAC)2, e.g. the Balkans (Fig. 2f). Note that FLEXPART results provide an overview of aerosol sources on a daily basis, but the further identification of particle sources at (HAC)2 relies on both in situ and remote-sensing results with a time resolution of 1 h. For example, the synergy of in situ and remote-sensing results enables one to differentiate between the distinct characters of the sources in Fig. 2b and c.
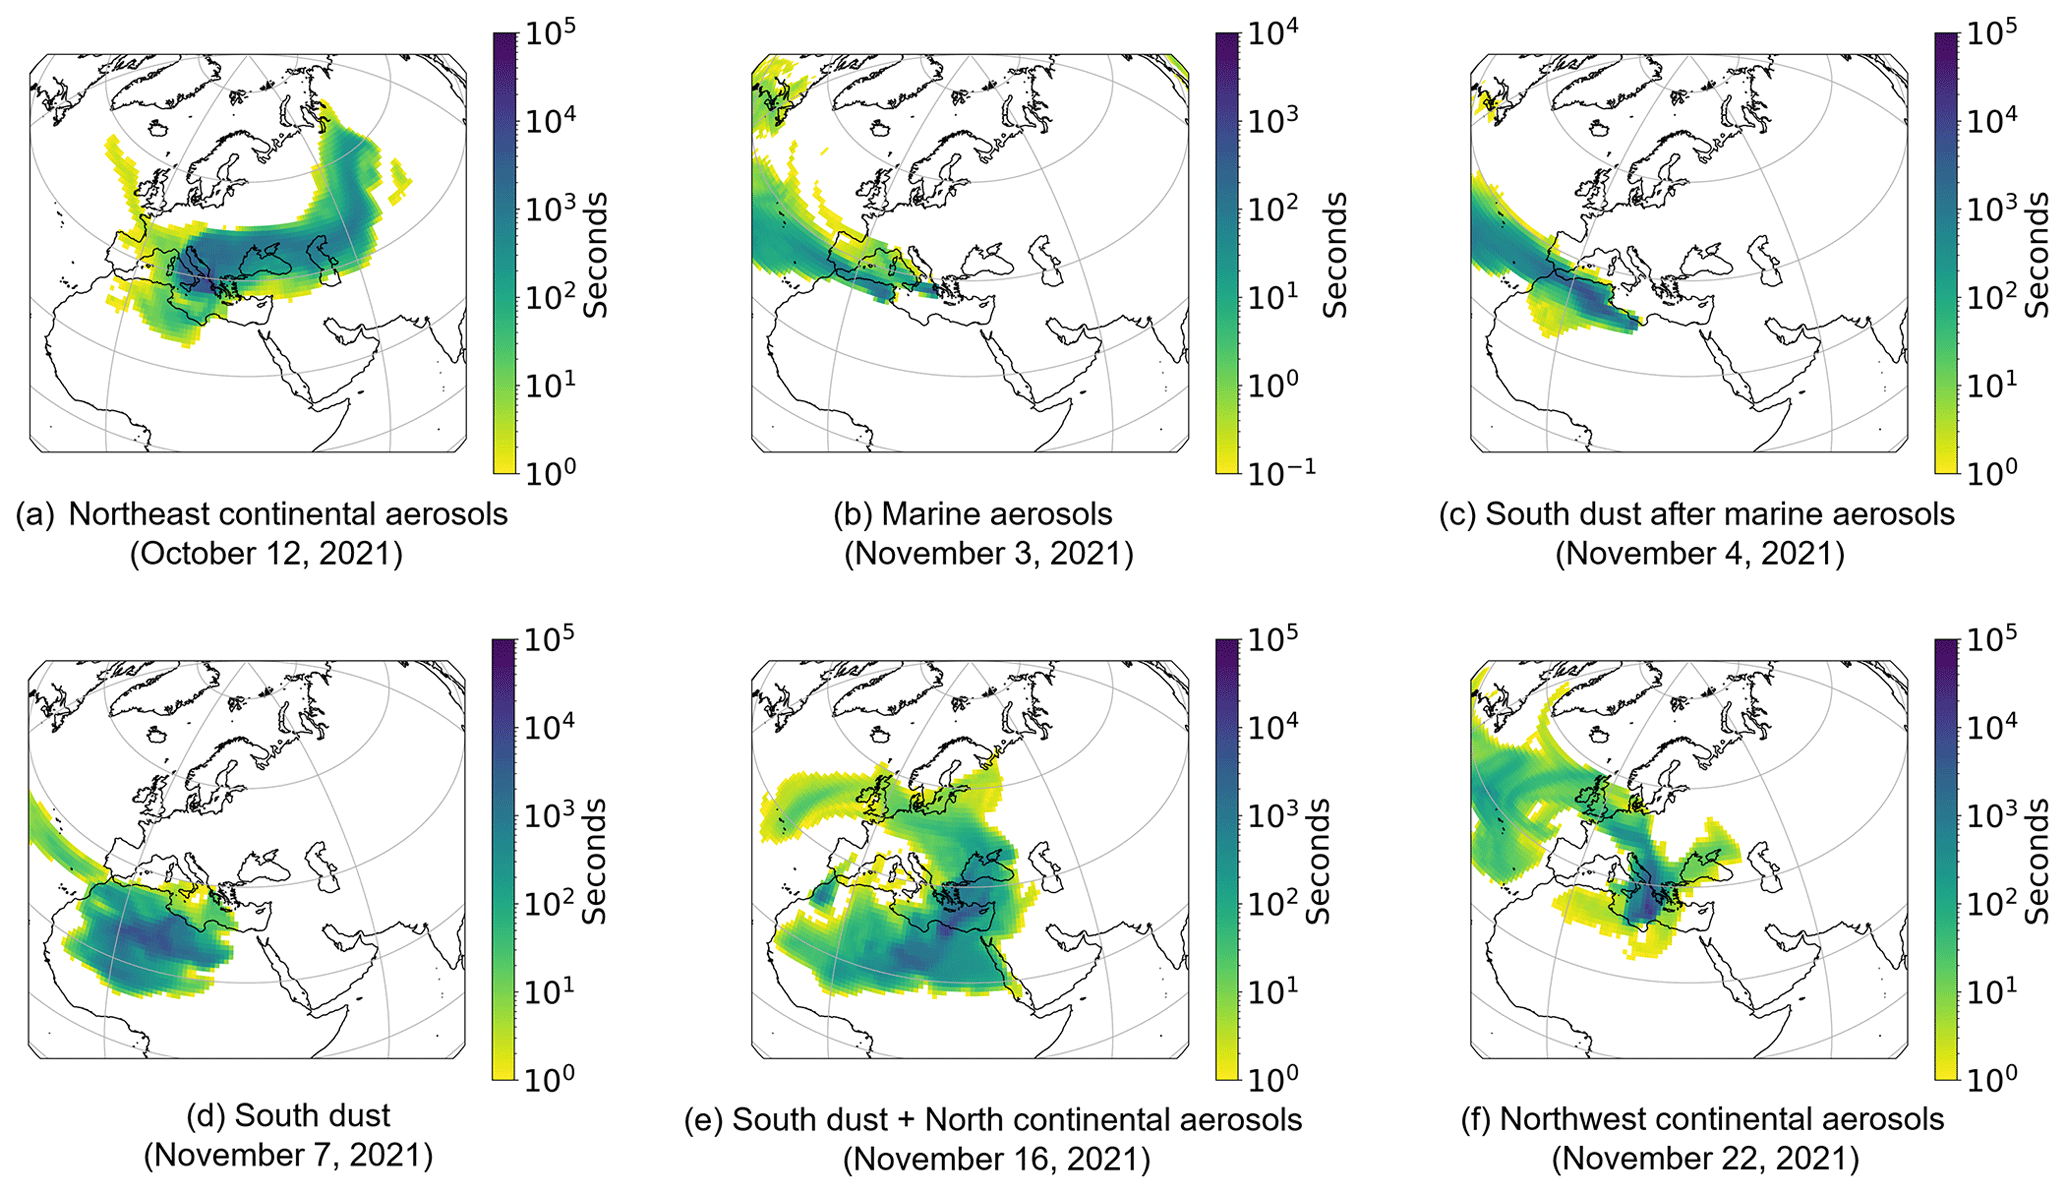
Figure 2Overview of aerosol sources as seen from exemplary FLEXPART 10 d backward residence time maps: (a) Northeast continental air masses on 12 October 2021; (b) Marine air masses on 3 November 2021; (c) South dust after marine air masses on 4 November 2021; (d) South dust on 7 November 2021; (e) South dust and North continental air masses on 16 November 2021; (f) Northwest continental air masses on 22 November 2021. The colour map scales the residence time of the particles from a height between 0 and 500 m a.g.l. in the 10 d backward trajectories.
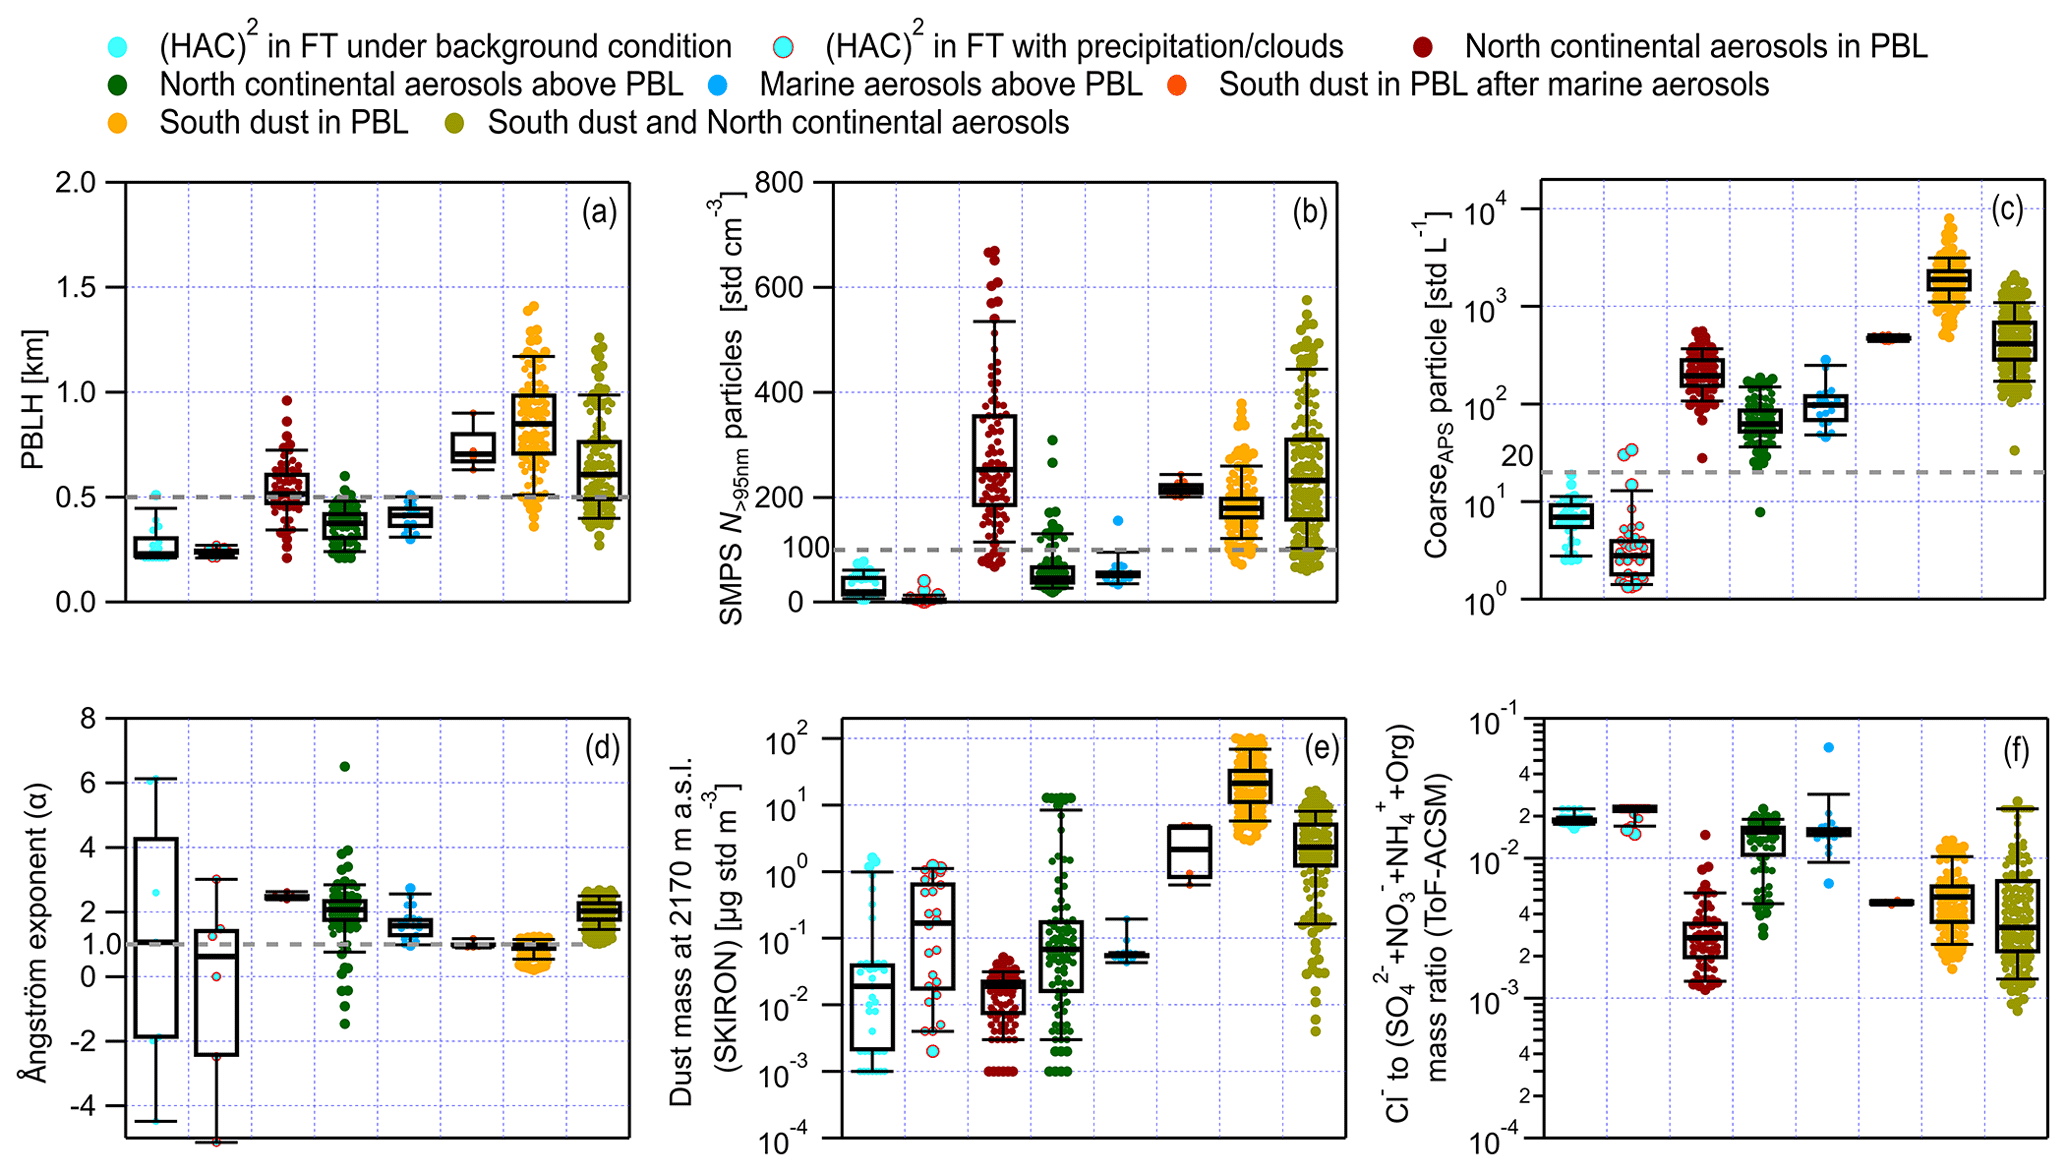
Figure 3Box plots for the characteristics of identified aerosol sources: (a) PBLH with respect to VL; (b) number concentration of particles larger than 95 nm measured by SMPS (SMPS N>95 nm) at (HAC)2; (c) coarse-particle (>1.0 µm) number concentration measured by APS (CoarseAPS) at (HAC)2; (d) Ångström exponent (α) at the wavelength pair of 450 and 700 nm calculated using nephelometer data recorded at (HAC)2; (e) dust mass concentration at 2170 m a.s.l. (∼140 m below (HAC)2) calculated by the SKIRON model; (f) the mass ratio of Cl− to other species measured by ToF-ACSM at (HAC)2. The box shows the median line and the range between 25th and 75th quartiles; the lower and upper caps of the box indicate the 9th and 91th percentiles, respectively.
In addition to aerosol footprints, we consider following criteria to specifically classify the sources of air masses at (HAC)2:
-
comparing the PBLH (SMPS N>95 nm) with a threshold value of 0.5 km (100 std cm−3) to examine the relative position of (HAC)2 with respect to the PBL;
-
comparing CoarseAPS with a threshold value of 20 particles std L−1 to judge the presence of remotely transported air masses in the FT;
-
comparing Ze (MDV) with a threshold value of 10 dBZ (−0.5 m s−1) to evaluate the presence of precipitation/clouds;
-
comparing α with a threshold value of 1.0 to diagnose the occurrence of Saharan dust events.
Figure 3 summarizes the classified aerosol sources and presents their characteristics to demonstrate their distinct nature. Hourly averaged data are presented in Fig. 3; however, the presented data for the source of “South dust in the PBL after marine aerosols” (in Fig. 3 and following figures) are resampled every 15 min due to the short period of observation (<3 h). First, a PBLH of less than 0.5 km or an SMPS N>95 nm of less than 100 std cm−3 (if no PBLH results are available) means that (HAC)2 is above the PBL (Fig. 3a or b). Moreover, if CoarseAPS is less than 20 std L−1, the period will be attributed to (HAC)2 in the FT (Fig. 3c). Furthermore, periods of Ze values larger than 10 dBZ (Hagen and Yuter, 2006) and MDV values less than −0.5 m s−1 are classified as periods influenced by precipitation. For periods with slightly lower Ze values, (HAC)2 is likely in cloud or fog. During the campaign, periods of precipitation frequently alternated with cloudy periods. Therefore, we consider such periods jointly. If there is no influence from remotely transported air masses (CoarseAPS<20 particles std L−1), depending on the presence of precipitation/clouds, the condition is classified as “(HAC)2 in the FT under background conditions” and “(HAC)2 in the FT with precipitation/clouds”, respectively. For periods of CoarseAPS>20 particles std L−1, the influence of remotely transported aerosols was considered. Continental aerosols have α values larger than 2.0 (Fig. 3d) when (HAC)2 is in the PBL. The distinct particle properties of continental aerosols also include high SMPS N>95 nm values (median value of >200 std cm−3 in Fig. 3b), moderate CoarseAPS values (median value of ∼200 particles std L−1 in Fig. 3c) and very low dust particle abundance values (<0.1 µg std m−3 in Fig. 3e). Such an aerosol source is termed “North continental aerosols in the PBL”. When continental aerosols are sources of particles at (HAC)2 but the site is above the PBL (Fig. 3a and b), the 75th quartile for the CoarseAPS of the aerosols decreases to 91 particles std L−1 (Fig. 3c) and becomes lower than the 9th percentile for the CoarseAPS of North continental aerosols in the PBL. Moreover, the α value of the source termed “North continental aerosols above the PBL” decreases (25th quartile >1.67), but the median value is still higher than 2.0 (Fig. 3d). Therefore, North continental aerosols above the PBL are distinctly different from the aerosols in the PBL. In addition, the distinction of marine aerosols above the PBL is indicated by the highest Cl− fraction range compared with the other scenarios not under FT conditions (Fig. 3f), given that a high Cl− concentration is reported to be a character of marine aerosols (Xiao et al., 2018). Khan et al. (2015) reported that the particle number concentration of coarse-mode sea spray aerosols is approximately 100 times less than that of dust aerosols, which is consistent with the observations in this study (Fig. 3c). Hence, a “Marine aerosols above the PBL” scenario can be classified. Followed by marine aerosols, a distinct period of several hours (on 4 November) at the beginning of a dust event (from 4 to 10 November) was observed for (HAC)2 in the PBL. It shows high CoarseAPS particle concentrations (>450 particles std L−1 in Fig. 3c), low α values (close to 1.0 in Fig. 3d) and the presence of dust particles (Fig. 3e). Thus, such a source is classified as South dust in the PBL after marine aerosols. Afterwards, the dust event period is termed “South dust in the PBL” which shows the highest CoarseAPS particle concentration (9th percentile >1000 particles std L−1 in Fig. 3c), low α values (close to 1.0, Fig. 3d) and the largest dust mass concentration (25th quartile >10 µg std m−3 in Fig. 3e). Lastly, periods of aerosol footprints similar to Fig. 2e and showing aerosol properties in Fig. 3 between those of South dust and North continental aerosols are classified as “South dust with North continental aerosols”, i.e. a mixture of both aerosols. Hereafter, we use the remotely transported aerosols identified in Fig. 3 to name the aerosol sources at (HAC)2. However, we note that particles from local sources may also be relevant for aerosol particles reaching (HAC)2, depending on the (HAC)2 position with respect to the PBL.
2.5 INP parameterization methods
INP parameterization is critically important for climate models to express cloud–aerosol interactions in both ice clouds and MPCs. As a minor subset of total aerosol particles, NINP exponentially increases with decreasing T, as supported by both theory (Kampe and Weickmann, 1951) and observations (reviewed in Kanji et al., 2017). NINP also shows dependence on the concentration of available aerosol particles (Burrows et al., 2022) and their surface characteristics (e.g. IN active site density), to trigger the activation (Vali et al., 2015; Knopf and Alpert, 2023). DeMott et al. (2010) developed a parameterization (termed “DeMott2010” in Table 1) to predict NINP using T and the number concentration of aerosol particles larger than 0.5 µm (TotalAPS), based on a suite of INP measurements at various locations globally. Tobo et al. (2013) augmented the DeMott2010 formulation and developed a new parameterization (termed “Tobo2013FBAP” in Table 1) to calculate NINP using the number concentration of fluorescent aerosol particles monitored by a UV-APS (ultraviolet APS, nFBAPs), to consider the explicit contributions from biological and dust particles to the coarse-mode population. Compared with DeMott2010, Tobo2013FBAP shows increased predictability with respect to calculating NINP from aerosol sources containing biological particles (Tobo et al., 2013). DeMott et al. (2015) used TotalAPS and augmented Tobo2013FBAP by introducing a calibration factor (cf); they then calculated a new suite of parameters for the formulation by fitting it to integrated laboratory and field data (termed “DeMott2015” in Table 1). However, the NINP of different aerosol sources may not scale to the total aerosol particle number concentration (e.g. TotalAPS or nFBAPs) following the same rule as used in the above-mentioned parameterizations. This is because the IN ability of potential INPs from different sources varies, and different types of INPs dominate the NINP in different T regimes (Murray et al., 2012; Kanji et al., 2017).
Table 1INP parameterizations from the literature.
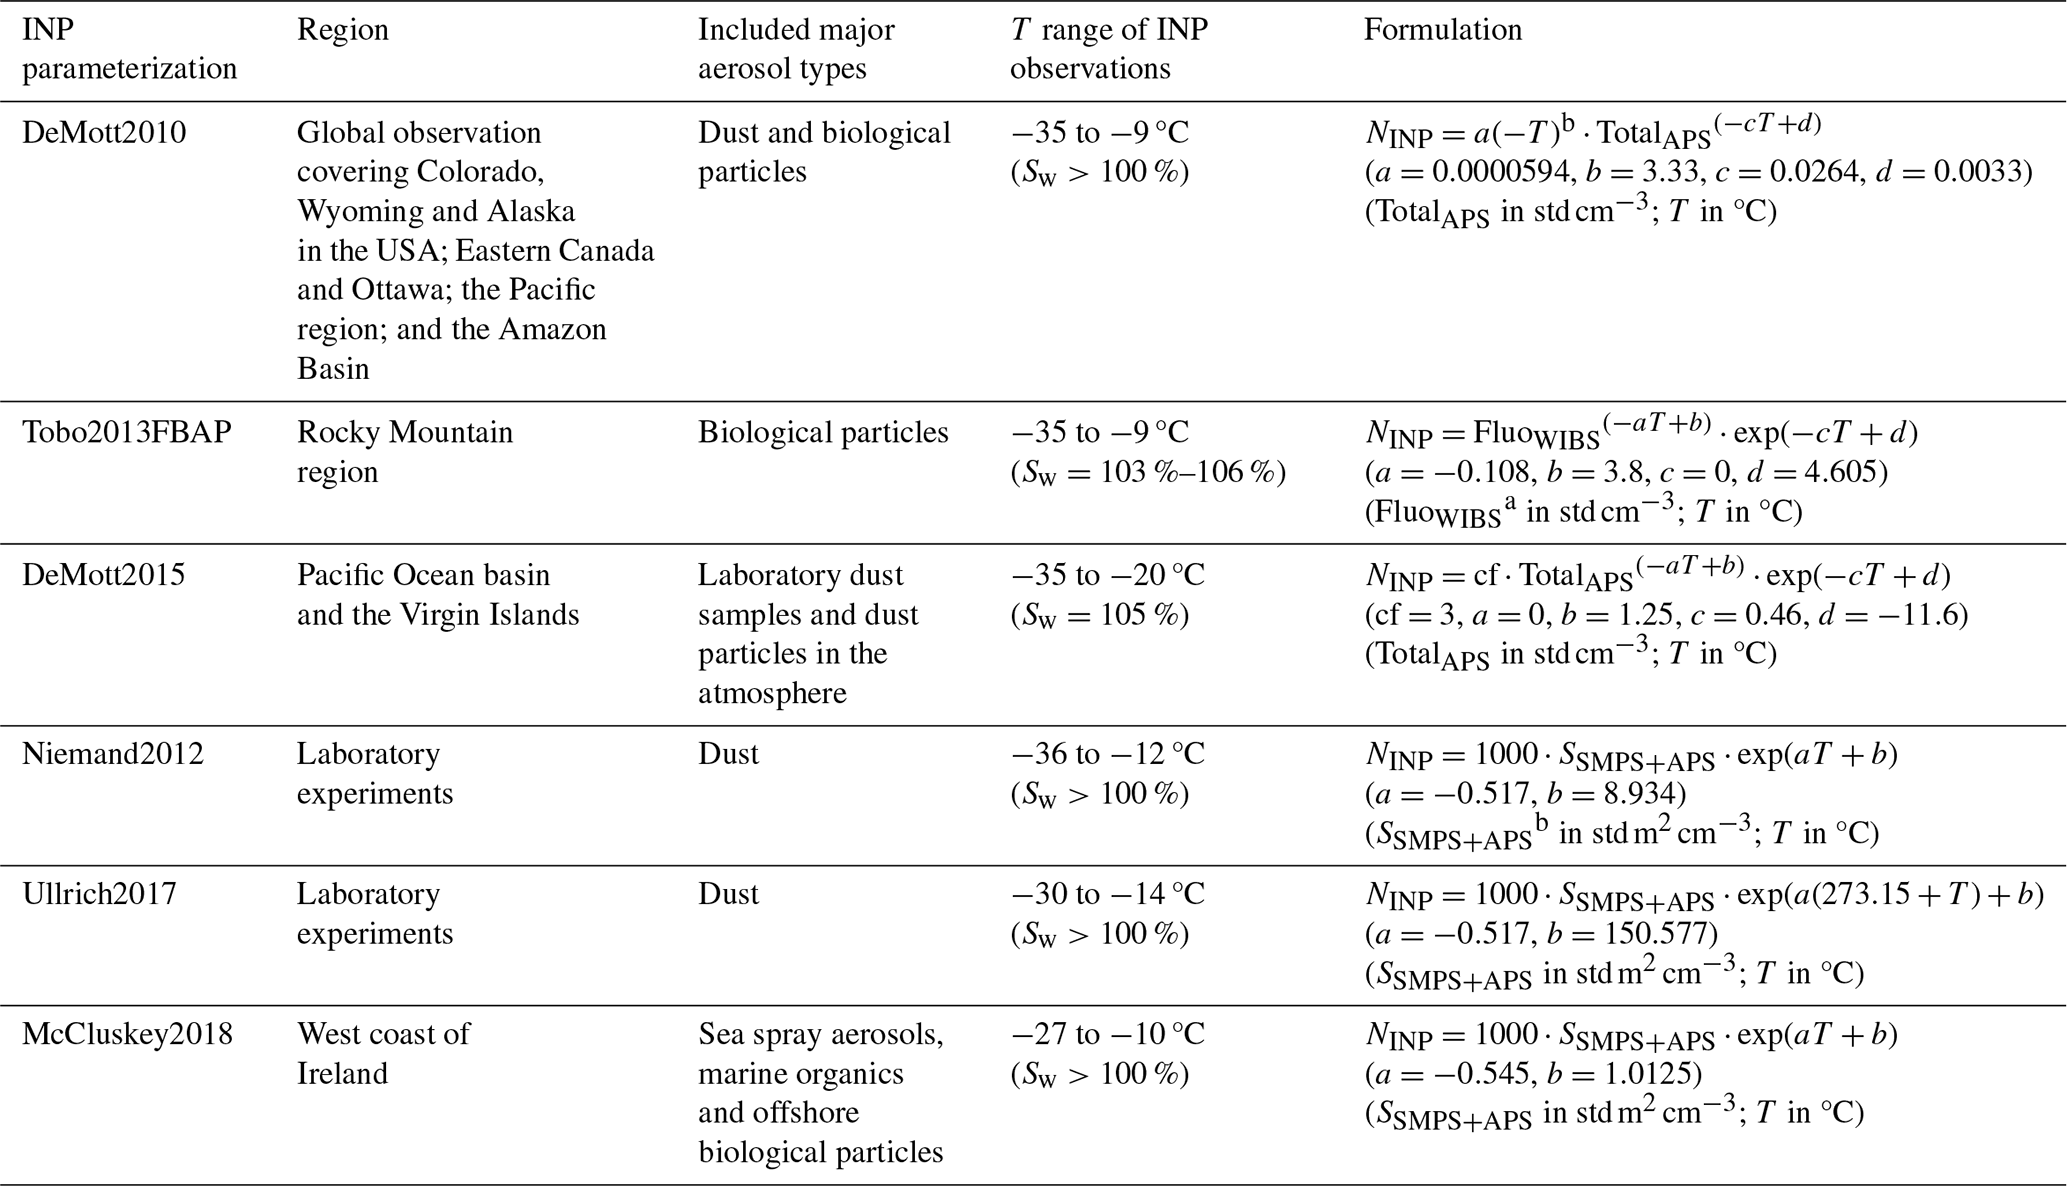
a FluoWIBS represents the number concentration of fluorescent particles larger than 0.5 µm measured by WIBS. Note that Tobo et al. (2013) used UV-APS to measure fluorescent particles showing fluorescence signals in the wavelength range of 400–575 nm after being excited at 355 nm. b SSMPS+APS total particle surface area was measured by SMPS and APS.
Particle-surface-area-based approaches have also been reported in the literature, such as the approaches termed “Niemand2012” (Niemand et al., 2012), “Ullrich2017” (Ullrich et al., 2017) and “McCluskey2018” (McCluskey et al., 2018) in Table 1. Given that different types of INPs originate from different sources and may have different IN active site densities over the particle surface, the INP concentrations calculated from different particle-surface-area-based approaches developed from different aerosol sources can vary by more than 3 orders of magnitude (Niemand et al., 2012; McCluskey et al., 2018). Further improvements to INP prediction may require parameterizations to explicitly consider additional characteristics of resolved aerosol properties to point to their sources. Mignani et al. (2021) reported that the ratio of large aerosol particles (>2.0 µm) recorded by APS can be used as an identity to characterize INPs from Saharan dust and that the implementation of the ratio into the INP parameterization improves its predictability. We expand upon this and use the detailed INP source apportionment and type classification (Sect. 2.4) to incorporate INP source characteristics into the INP parameterizations developed here. The new parameterizations proposed for INPs at Mount Helmos are expressed as a function of T, aerosol particle concentration recorded by APS or WIBS, and the ratio of the particle number concentration recorded in different channels of the APS or WIBS. We demonstrate (1) the feasibility of predicting INPs from different sources using one suite of parameters for the proposed parameterizations (see Sect. 3.4) and (2) the superior performance of the new parameterizations compared with the approaches reported in the literature (Table 1).
In this section, we first provide evidence of the distinct characteristics of individual sources (Sect. 3.1) classified in Sect. 2.4. An overview of INPs observed at Mount Helmos is presented as a function of T, and the results are contrasted against literature observations, for both the global area and (specifically) the Mediterranean region (Sect. 3.2). The INP abundance and its correlation with the aerosol properties of each INP source are then examined. We also focus on a case study in which precipitation effects on INPs in the PBL are explicitly studied (Sect. 3.3). Finally, the ability of published parameterizations to reproduce observed INPs at Mount Helmos is examined, followed by the introduction of new parameterizations that we develop which explicitly consider the characteristics of different INP sources and display superior performance (Sect. 3.4).
3.1 Properties of identified aerosol sources
3.1.1 The particle size distribution for different aerosol types and air mass classifications
Figure 4a shows the combined particle size distribution of different INP sources measured by both SMPS and APS. Scatter plots in Fig. 4b and c present the apportionment of fine (<1.0 µm, FineSMPS+APS in Fig. 4b and FineAPS in Fig. 4c) and coarse (>1.0 µm, CoarseAPS) particles for different aerosol sources. The results of the concentration of aerosol particles in different size ranges are provided in Fig. S2. Based on all observations, we summarize that aerosols at (HAC)2 during CALISHTO generally exhibit four size modes: an ultrafine mode (Da<0.04 µm), an Aitken mode ( µm), an accumulation mode ( µm) and a coarse mode (Da>1.0 µm). When (HAC)2 is in the FT, aerosol particles in the size range Da>0.1 µm (Fig. 4a), with and without the influence of precipitation/clouds, exhibit a similar size distribution, with a characteristic decrease in number with increasing size, resembling a power law (Kim et al., 1992). Particles larger than 4.0 µm in the FT show negligible abundance. Precipitation/clouds decrease the number of particles smaller than 0.4 µm, while the absence of a distinct accumulation mode may suggest inappreciable influences from anthropogenic surface emissions on FT aerosols (Ran et al., 2022).
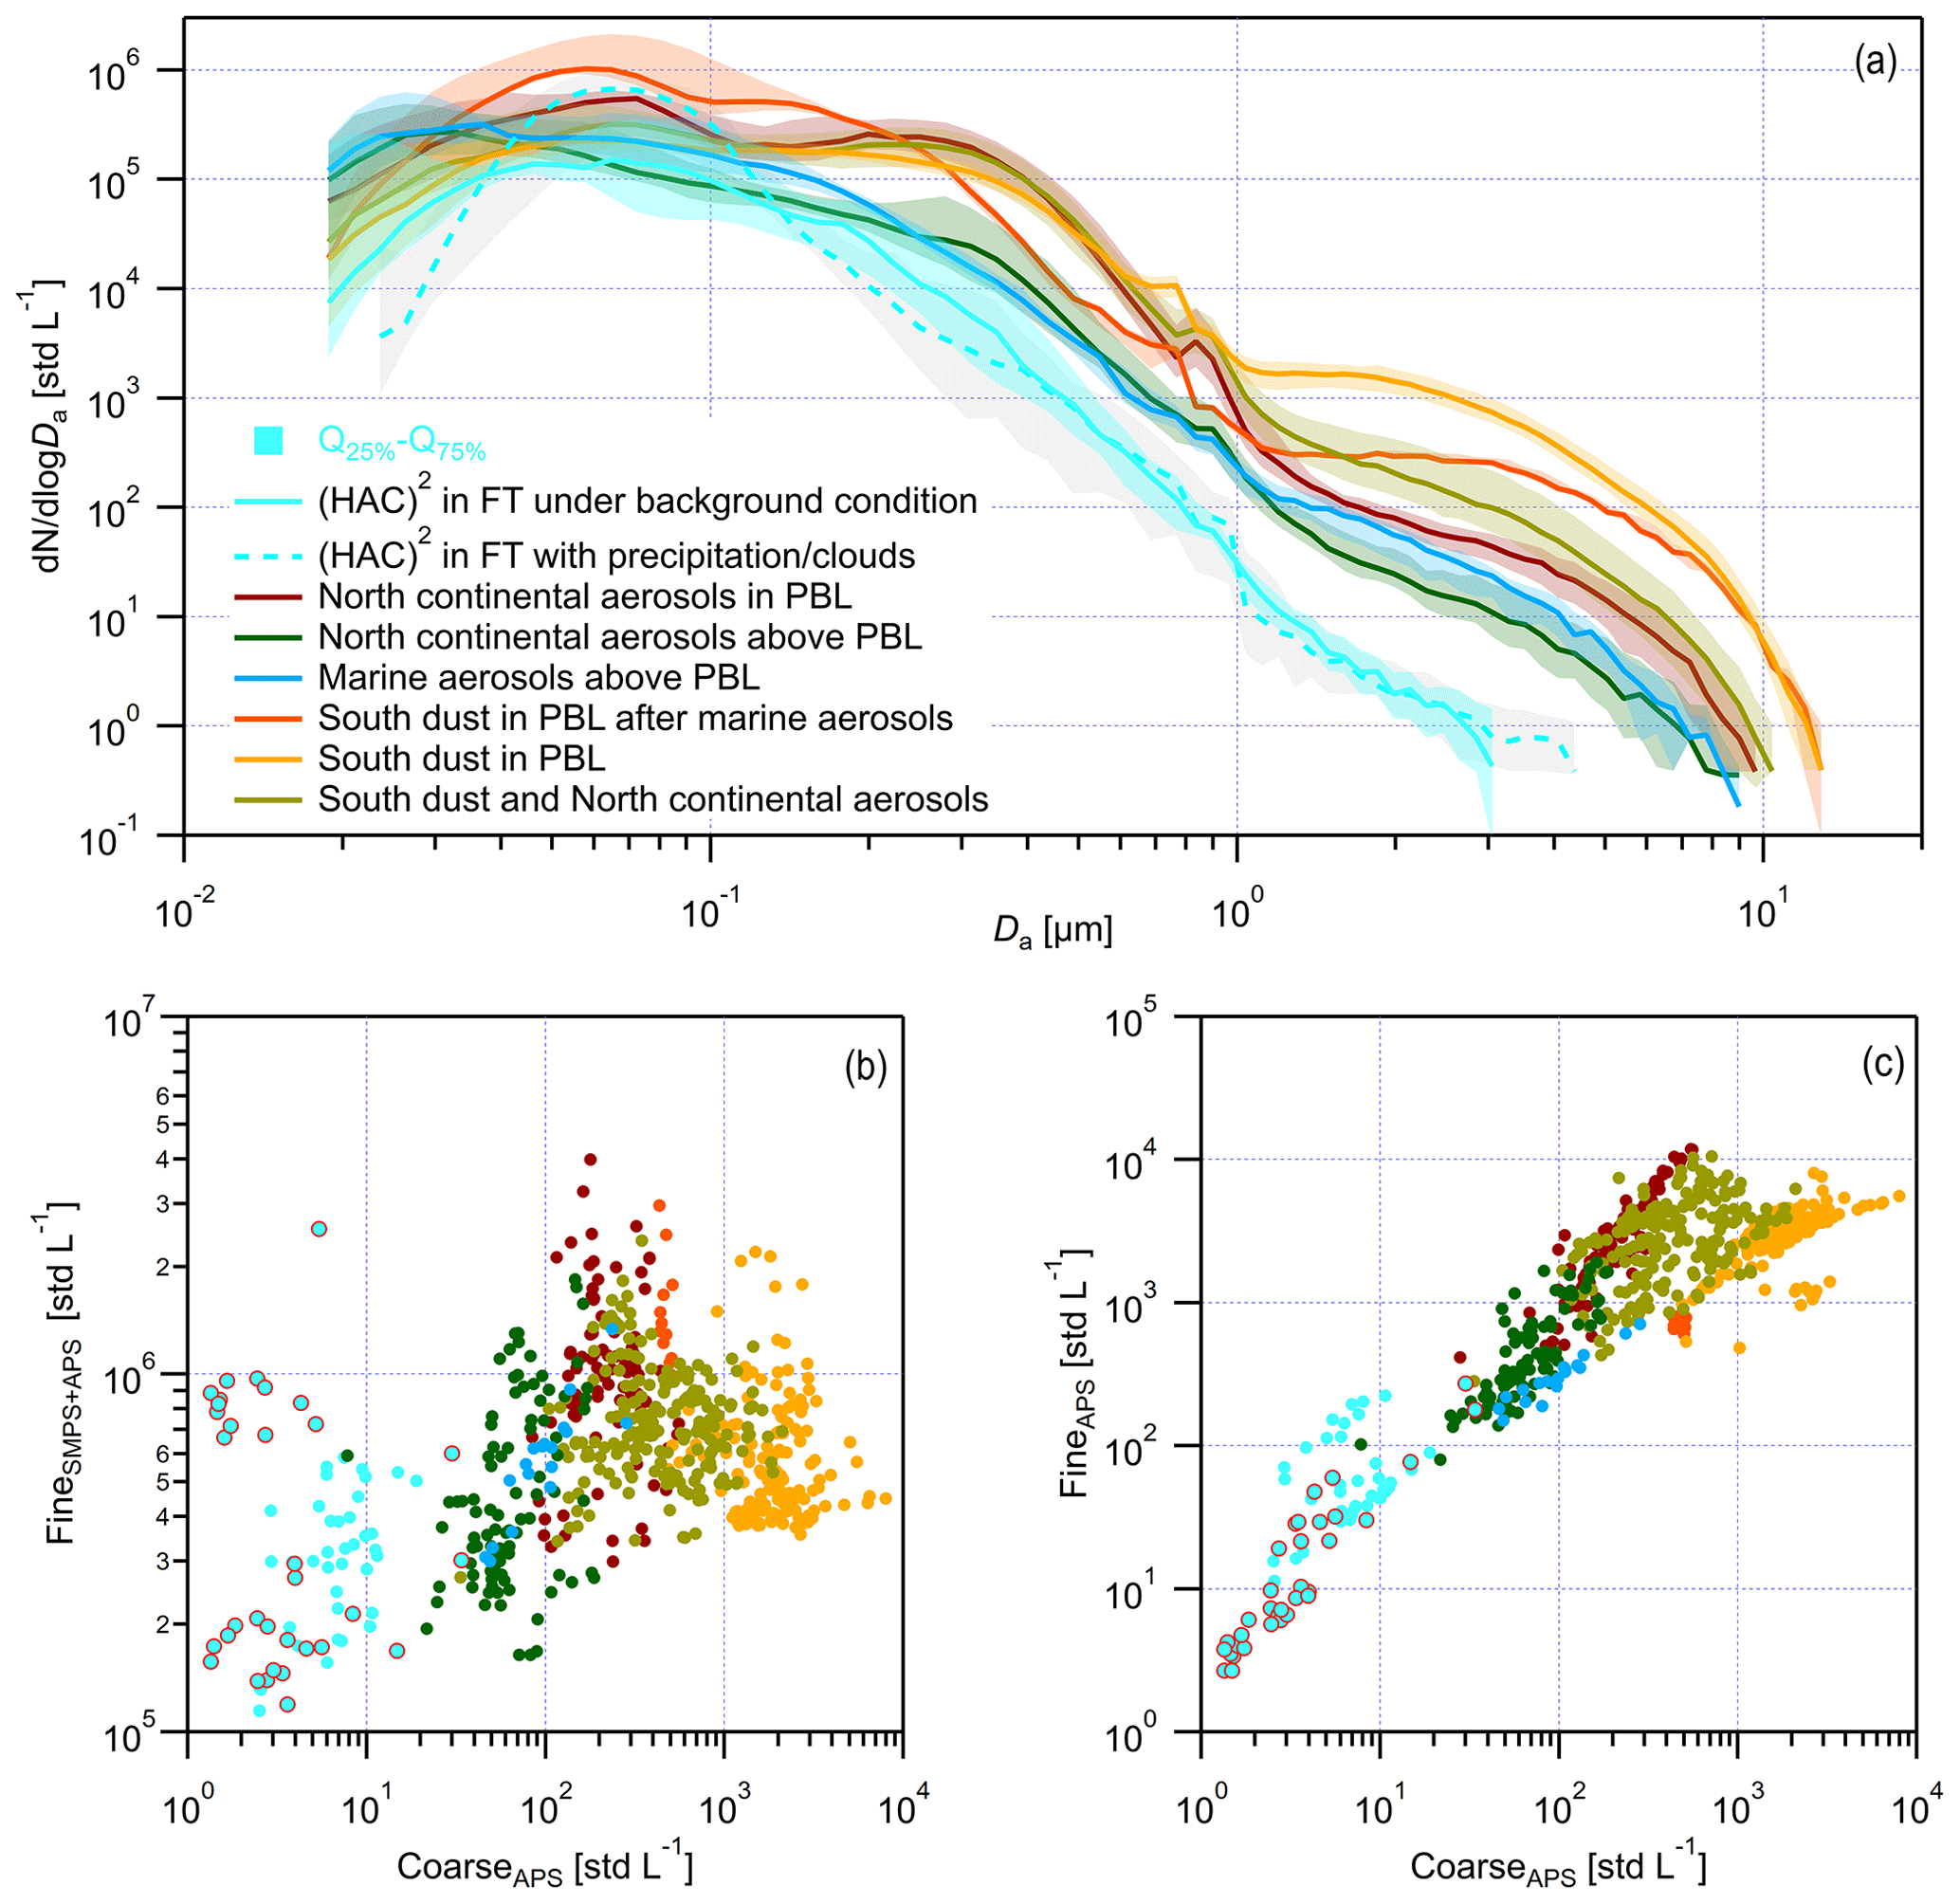
Figure 4Particle size distribution of different aerosol sources. (a) Combined size distribution of particles measured by SMPS (10–800 nm in mobility diameter) and APS (0.5–20 µm in aerodynamic diameter). The solid line is the median of the particle size distribution. The shaded area shows the 25th to 75th percentiles of the particle size distribution of each aerosol source. (b) Scatter plots of the CoarseAPS particle (>1.0 µm, on the x axis) number concentration and FineSMPS+APS particle (particles <1.0 µm measured by both SMPS and APS, on the y axis) number concentration. (c) Scatter plots of the CoarseAPS particle (>1.0 µm, on the x axis) number concentration and FineAPS particle (particles <1.0 µm measured by APS, on the y axis) number concentration. The aerosol sources are indicated in the legend of panel (a).
FT aerosols with Da<0.1 µm show a broad Aitken mode under both background and precipitation/cloudy conditions, but the latter conditions tend to suppress the ultrafine and accumulation modes (Fig. 4a). Such size growth for Aitken-mode particles and a number concentration decrease in ultrafine particles may be facilitated by the larger temperature and relative humidity gradients during precipitation/cloudy periods, both of which promote particle growth and gas-to-particle conversion processes (Schroder and Strom, 1997; Bates et al., 1998; Kamra et al., 2003; Peter et al., 2010). Such processes are also promoted by particle decreases in the accumulation mode, leading to decreased sinks for ultrafine particles and gas-phase materials (Khadir et al., 2023). As shown in Fig. 4b, the increase in FineSMPS+APS particles may not always happen in the FT with the presence of precipitation/clouds. Nonetheless, while new particle formation and particle growth are often reported under PBL conditions, we show that these processes may also occur under FT conditions (Kerminen et al., 2018).
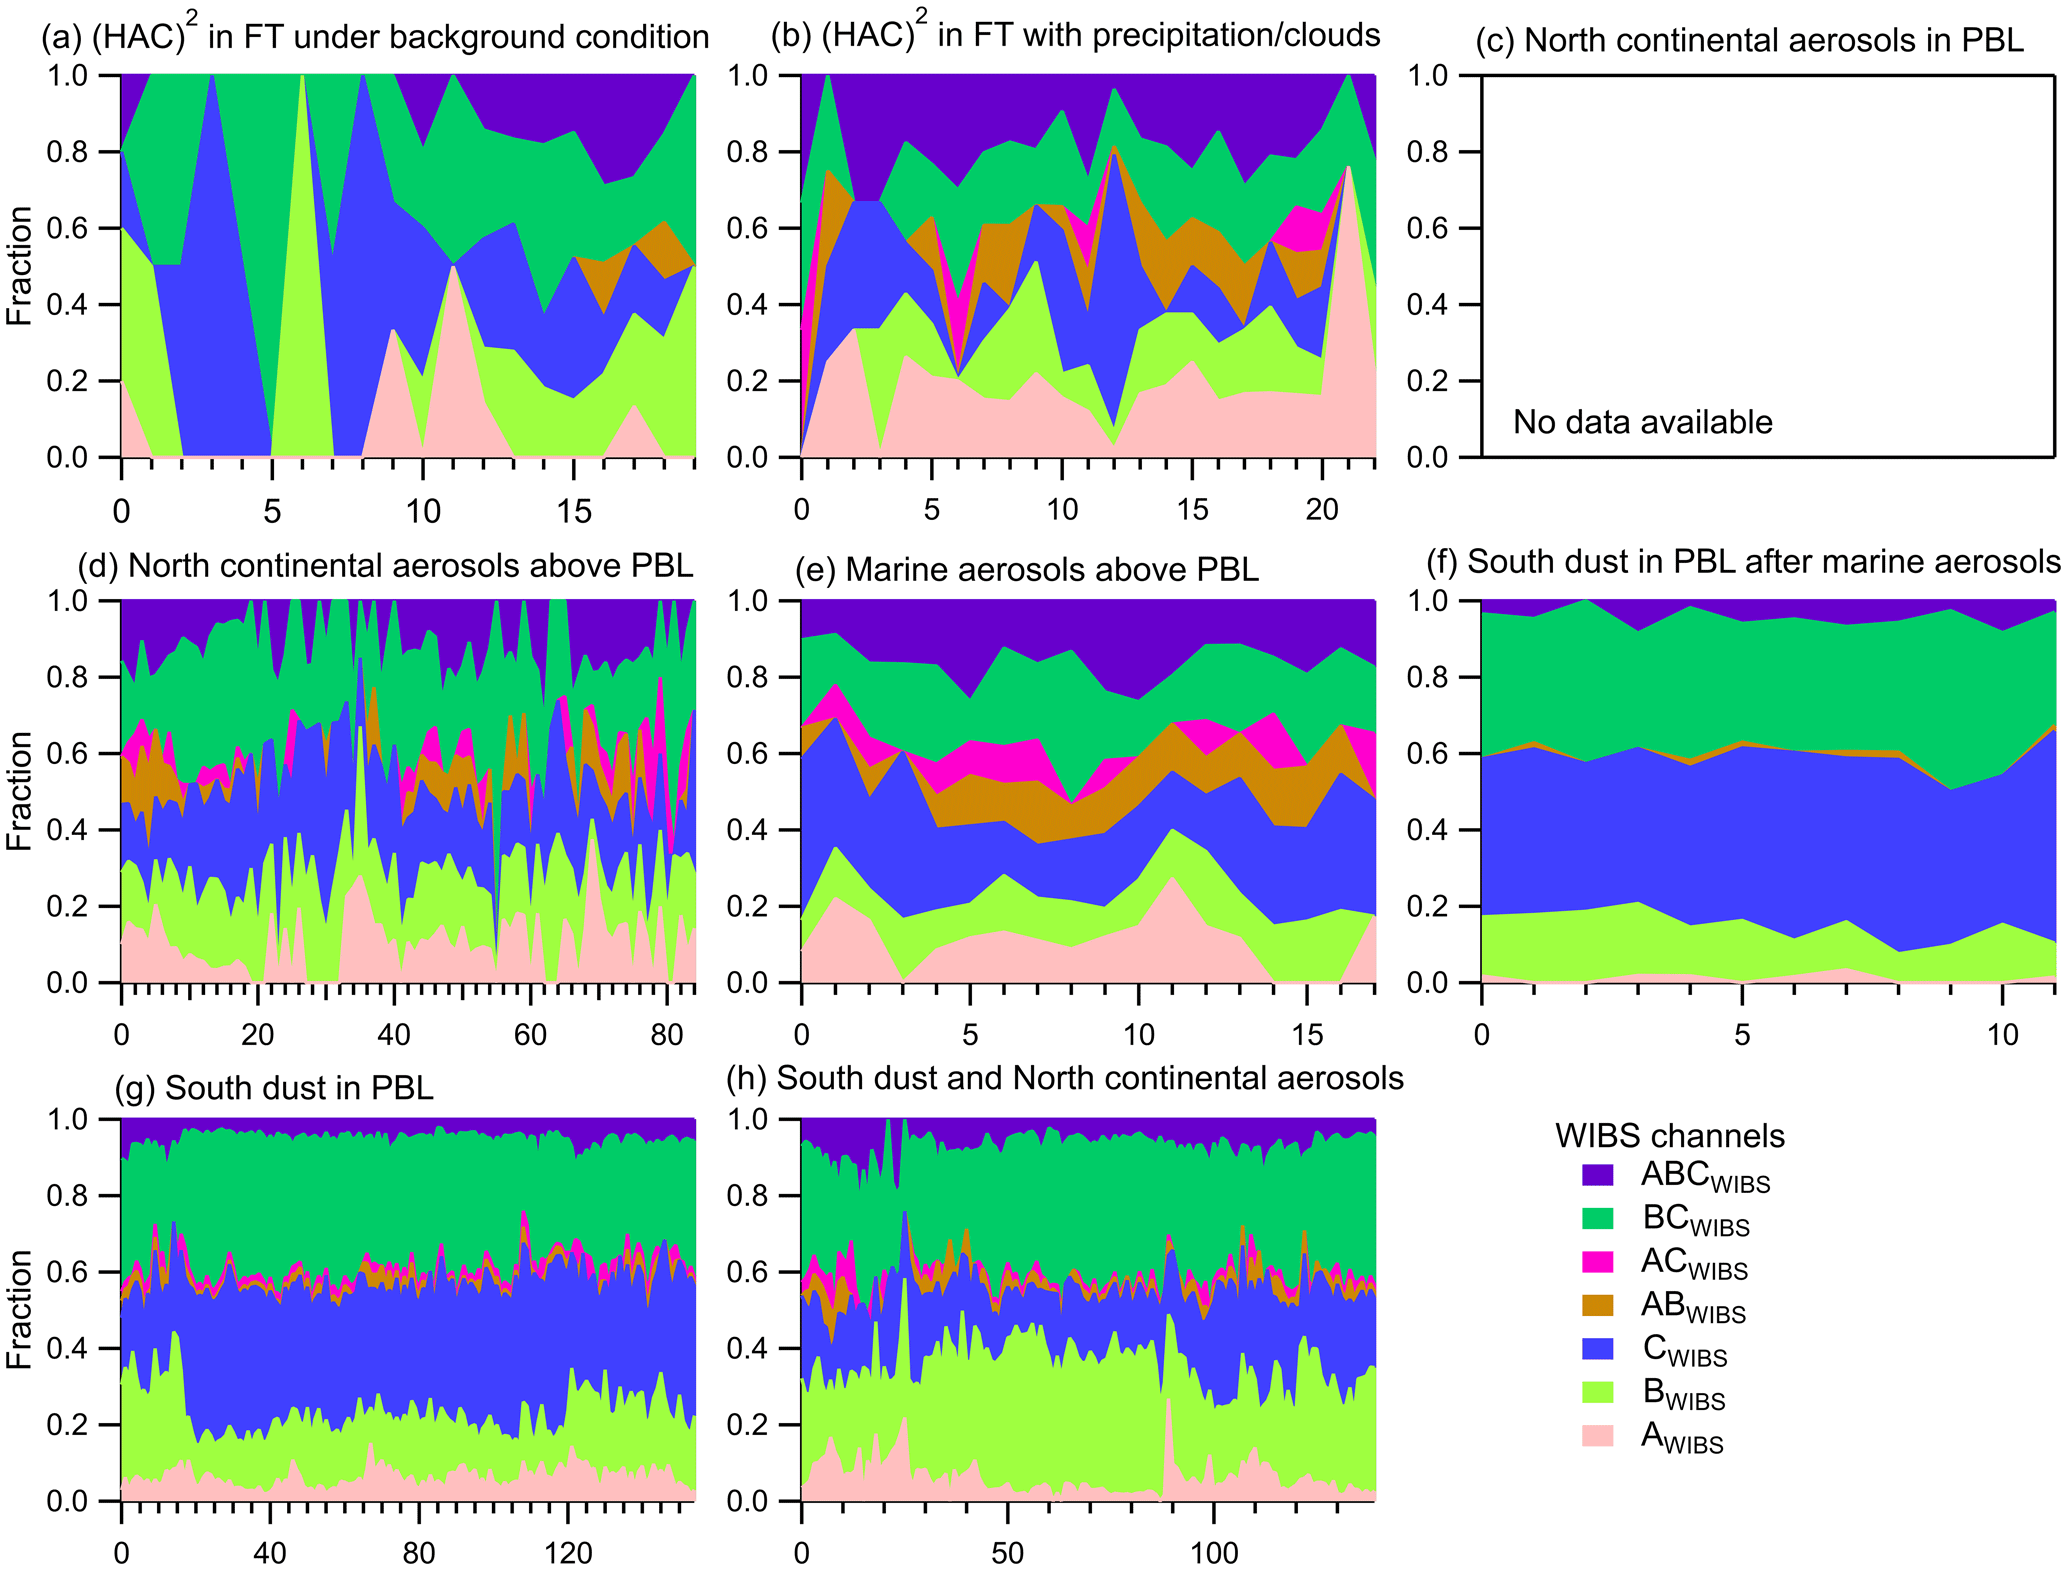
Figure 5The fractional pattern of different types of fluorescent particles classified by WIBS. Different particle types are indicated in the legend. The x axis indicates the number of observations, while the y axis scales the fraction of each type of particle from an identified aerosol source. WIBS data were resampled every 15 min for the source of South dust in the PBL after marine aerosols due to the short period of observation (<3 h), whereas hourly averaged results were presented for the rest of the aerosol sources.
Among all aerosol sources, the North continental aerosols in the PBL source shows the largest particle concentration in the accumulation mode, indicating substantial influences from anthropogenic particles (Zaizen et al., 2004). The North continental aerosols in the PBL source also contains some Aitken- and coarse-mode particles. Above the PBL, an overall particle number decrease in the Aitken, accumulation and coarse modes can be observed for North continental aerosols, whereas this source shows an increase in ultrafine-mode particles; this is in agreement with Ristovski et al. (2010), who reported that the size distribution of continental aerosols penetrated into the FT. Showing a generally overlapping Q25 %–Q75 % range (Fig. 4a), marine aerosols have a similar particle size distribution to the North continental aerosols when both are above the PBL. Following marine aerosols, a dust plume intrusion period in the PBL (South dust in the PBL after marine aerosols) shows a particle size distribution with substantial increases in the coarse, accumulation and Aitken modes, which agrees with the aerosol content increase presented in Fig. 2c compared to Fig. 2b, but it shows a slight decrease in ultrafine-mode particles. The large increase in coarse-mode particles, especially particles larger than 10 µm (Fig. 4a), suggests the concurrent presence of dust particles (Brunner et al., 2021). The increase in accumulation- and Aitken-mode particles may be attributed to the diurnal cycling of (HAC)2 in and out of the PBL. Gini et al. (2022) noted that Saharan dust events are usually associated with a lower PBLH. The distinct size distribution characteristic of South dust in the PBL is that this source has the highest concentration of coarse-mode particles compared with all aerosol sources, but it contains less finer particles (<1.0 µm; Fig. 4b and c). Lastly, the South dust and North continental aerosols source shows a size distribution with coarse-mode particles between South dust in the PBL and North continental aerosols in the PBL, and the mixed source shows slightly fewer particles in the other modes compared with the North continental aerosol in the PBL source.
3.1.2 Fluorescent properties of particles from different aerosol sources
Figures 5 and 6 present the respective relative fractions and size distributions of different types of fluorescent particles for different aerosols sources. Figure 7 provides the results of the FluoWIBS particle number concentration, the asphericity factor of FluoWIBS particles, and the correlation between FluoWIBS particles and the dust (eBC) mass concentration in different aerosol sources. Figure 5a shows that fluorescent particles are mainly comprised of BWIBS-, CWIBS- and BCWIBS-type particles as well as a few AWIBS and ABCWIBS particles when (HAC)2 is in the FT under background conditions without the influence of remotely transported air masses. The particles detected in the BWIBS, CWIBS and BCWIBS channels may be attributed to non-biological fluorescent particles (Crawford et al., 2016; Ziemba et al., 2016), whereas the signals for the AWIBS and ABCWIBS channels are probably from bioaerosols (Crawford et al., 2015). Despite a low number concentration of fluorescent particles when (HAC)2 is in the FT under background conditions (Figs. 6 and 7a), some of the fluorescent particles with biogenic materials may contribute to INPs. With the influence of precipitation/clouds in the FT, the dominance of AWIBS and ABCWIBS particles and the fractional increase in ABWIBS particles (Fig. 5a) may be attributed to bacteria for small particles (<2.0 µm) and to fungal spores or plant fragments for large particles (>2.0 µm). This is consistent with the release of biological particles during or after precipitation/cloud events (Prenni et al., 2013; Joung et al., 2017; Iwata et al., 2019; Negron et al., 2020; Khadir et al., 2023). Those biological particles are potentially active INPs at warm temperatures.
For North continental aerosols and marine aerosols above the PBL, both aerosol sources contain particles from all WIBS channels; the only difference is that the former has more observation data (Fig. 5d and e). This means that both aerosol sources contain similar types of fluorescent particles that might be in a mixed state of biological particles and interfering particles, such as dust particles carrying biological matter. D. Tang et al. (2022) reported that biological particles in continental aerosols are mainly observed in the AWIBS, ABWIBS and ABCWIBS channels. It has also been reported that biological particles in marine aerosols may show fluorescence in the AWIBS, BWIBS, ABWIBS and ABCWIBS channels (Kawana et al., 2021; Moallemi et al., 2021). Some CWIBS (∼20 %) and BCWIBS (∼20 %) particles in marine and continental aerosols above the PBL may be attributed to residual particles associated with fluorescent materials but may not necessarily be biological particles (Pöhlker et al., 2012).
The major types of fluorescent particles for aerosol sources containing dust particles, i.e. South dust in the PBL after marine aerosols and South dust in the PBL, are BWIBS, CWIBS and BCWIBS (Fig. 5). This is consistent with Longo et al. (2014) and Violaki et al. (2021), who both showed a strong association of bioaerosols with mineral dust plumes. This is also in agreement with Yue et al. (2022), who reported a correlation between dust particles and CWIBS (as well as BCWIBS) particles. Moreover, it is reported that soil dust may be co-emitted with organics (O'Sullivan et al., 2014), which may show fluorescence in the BWIBS and CWIBS channels (Després et al., 2012; Graber and Rudich, 2012). According to the results shown in Fig. 6c–e, BWIBS particles in dust-containing aerosols are generally small (<2.0 µm), whereas both CWIBS and BCWIBS particles are larger (>2.0 µm). This suggests that BWIBS particles might be attributed to small soil dust particles, while both CWIBS and BCWIBS particles may be more relevant for large mineral dust particles that show fluorescence. Furthermore, the results in Fig. 7c and d indicate that fluorescent particles in dust plumes may not be purely bioaerosols, given the weak correlation between ABCWIBS and the dust mass concentration estimated by the SKIRON model (R=0.14 and ρ=0.35). We note that CWIBS and BCWIBS particles might be the most relevant types of fluorescent particles for mineral dust from Saharan dust; this is supported by the strong and significant correlations between the calculated dust mass concentration and CWIBS (or BCWIBS) particles, compared with the other types of fluorescent particles that show insignificant correlations (Fig. S3).
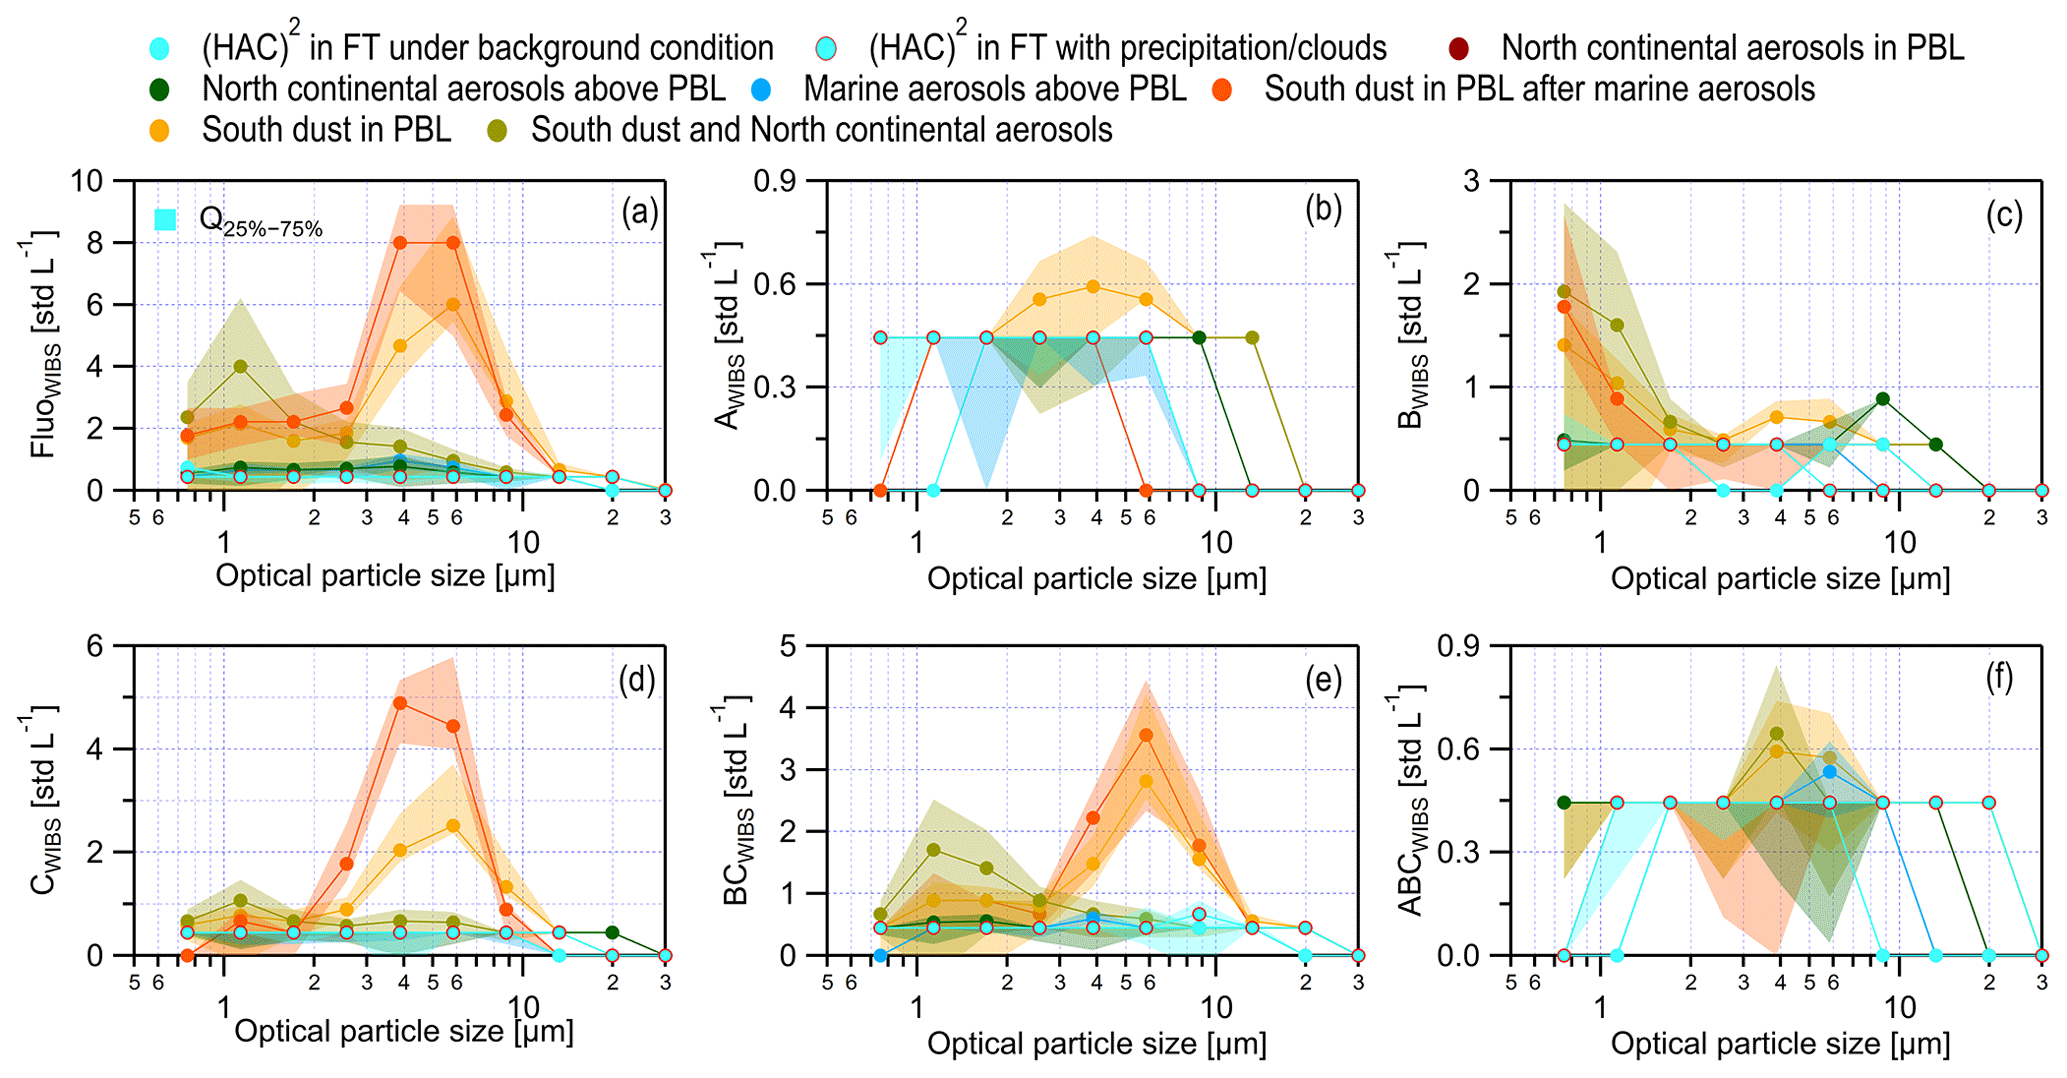
Figure 6Fluorescent particle number concentration in 10 different size bins, including [0.50 0.75 µm], (0.75 1.13 µm], (1.13 1.71 µm], (1.71 2.57 µm], (2.57 3.87 µm], (3.87 5.83 µm], (5.83 8.78 µm], (8.78 13.22 µm], (13.22 19.92 µm] and (19.92 30.00 µm]. Data points represent median values. The uncertainty is the range between the 25th and 75th percentiles, indicated by . Different aerosol sources are indicated in the legend. No WIBS data are available for the source of North continental aerosols in the PBL. Different types of fluorescent particles are presented in different panels, including (a) FluoWIBS, (b) AWIBS, (c) BWIBS, (d) CWIBS, (e) BCWIBS and (f) ABCWIBS. The results for ABWIBS and ACWIBS are not presented, as they are minor in all aerosols sources.
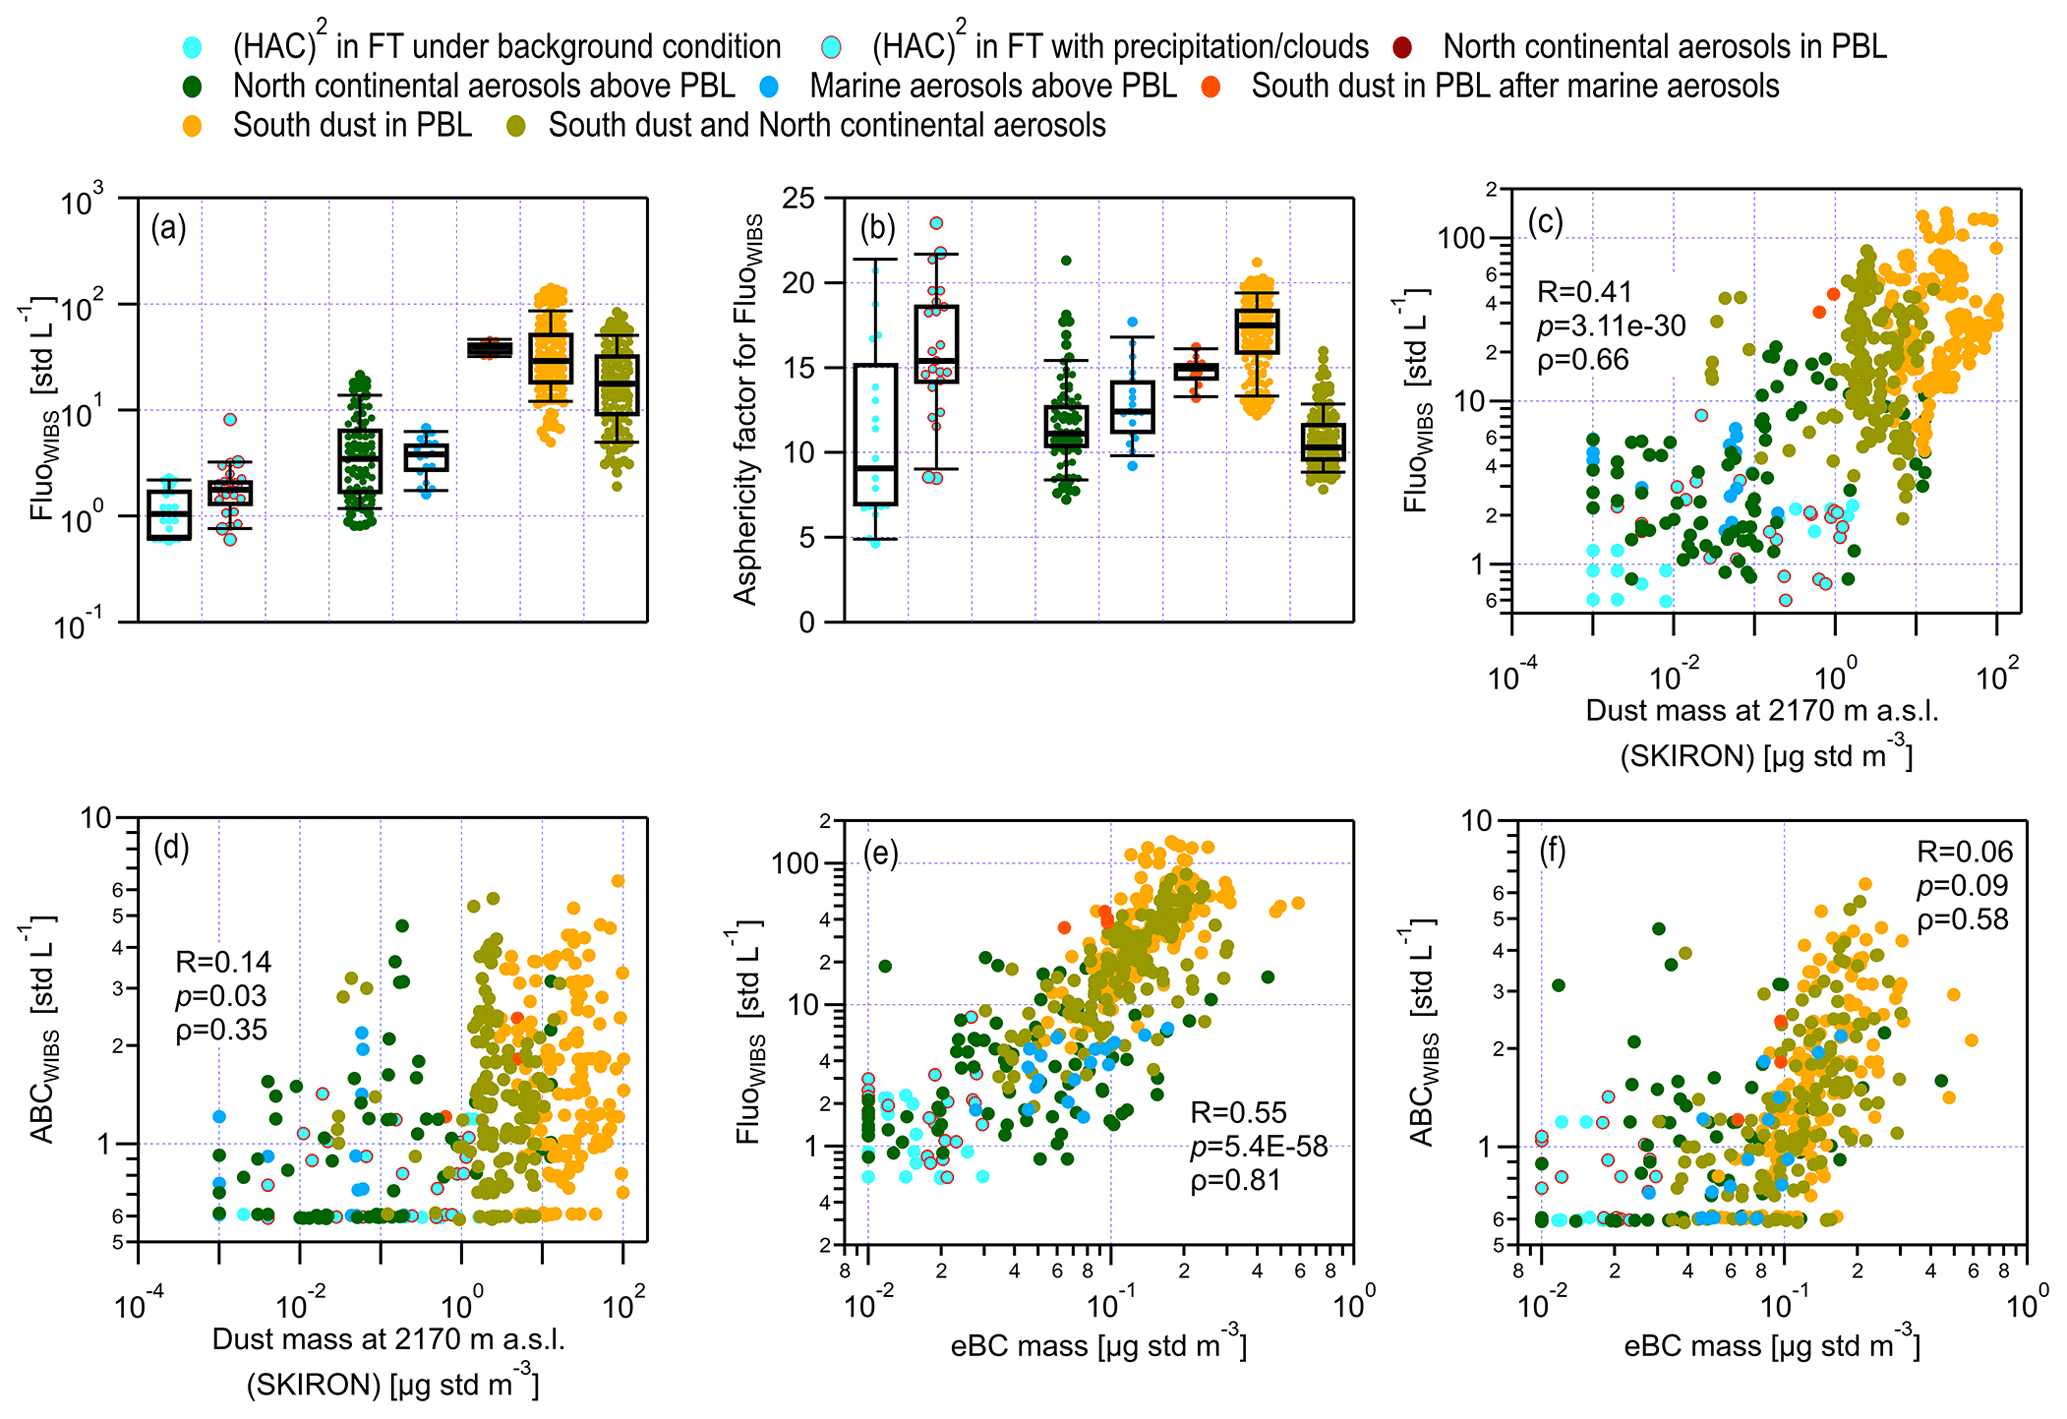
Figure 7Fluorescent properties of aerosol particles from different sources: (a) number concentration of FluoWIBS particles; (b) asphericity factor of FluoWIBS particles; (c) scatter plots of the FluoWIBS particle concentration and dust mass concentration estimated by the SKIRON model at 2170 m a.s.l. (∼140 m lower than (HAC)2); (d) scatter plots of the ABCWIBS particle concentration and dust mass concentration estimated by SKIRON at 2170 m a.s.l.; (e) scatter plots of the FluoWIBS particle concentration and eBC mass concentration; (f) scatter plots of the ABCWIBS particle concentration and eBC mass concentration. The Pearson correlation coefficient (R), the corresponding p value calculated from an F test and the Spearman rank coefficient (ρ) are provided to evaluate the correlation between parameters on the x axis and y axis.
Small carbonaceous (Bond et al., 2013) and combustion-generated particles can carry polycyclic aromatic hydrocarbons (PAHs) or other compounds that fluoresce (Fennelly et al., 2018), and they may contribute to the BWIBS, CWIBS and BCWIBS populations (Fig. 6c–e). This is supported by the significant correlation (p<0.05) between FluoWIBS particles and the eBC mass concentration (Fig. 7e). ABCWIBS, however, is not correlated with the eBC mass concentration (Fig. 7f), suggesting that ABCWIBS is indeed a distinct population – biological particles – which is unaffected by sources that contribute to eBC. Results in Fig. S4 show that eBC particles are generally correlated with BWIBS, CWIBS and BCWIBS populations. Compared with the aerosol source of South dust in the PBL, the mixed source of South dust and North continental aerosols shows a larger fraction in BWIBS but a smaller fraction in CWIBS particles (Fig. 5g and h). The higher content of BWIBS particles may be explained by a larger particle number concentration of small carbonaceous particles (<2.0 µm), such as soot from anthropogenic emissions in continental sources. Furthermore, the small fraction of AWIBS and ABCWIBS particles in dust (Fig. 5g and h) suggests the presence of biological particles from near-ground sources in the PBL. This can be explained by the high PBLH (Fig. 3a) that exceeds the (HAC)2 altitude, meaning that the site is in the PBL and, thus, directly influenced by bioaerosols emitted by the surrounding forested area, such as bacteria, fungi and/or fungal spores.
A comparison of FluoWIBS and ABCWIBS particles in different aerosol sources in and above the PBL (Figs. 6 and 7) shows that sources in the PBL contain more fluorescent particles (by approximately 1 order of magnitude) than sources above the PBL. This suggests that particles from biogenic sources can be significantly reduced when the atmospheric conditions change from the PBL to the FT. In addition, we discuss the impacts of anthropogenic emissions on different aerosol sources by using the observed eBC results. Figure 7e and f show that all identified aerosol sources contain eBC, despite low eBC concentrations under conditions in the FT with and without precipitation/clouds (<0.05 µg std m−3). Thus, anthropogenic pollution may even impact (HAC)2 when it is in the FT (Collaud Coen et al., 2018). Moreover, this shows that the occurrence of precipitation/clouds does not completely remove eBC (Fig. 7e and f), likely due to its hydrophobic properties (Gao et al., 2022). North continental aerosols show a higher eBC concentration in the PBL than above the PBL, also indicating the importance of the atmospheric conditions with respect to determining the impacts of anthropogenic emission. The presence of eBC in long-range-transported marine aerosols above the PBL may suggest a long atmospheric residence time for eBC. The high eBC mass concentration observed in South dust aerosols may be due to air mass exchange between dust plumes and PBL aerosols, given that dust events may suppress PBL air masses and enhance air parcel entrainment (Zhang et al., 2022).
3.2 INPs at Mount Helmos
3.2.1 Overview
INP concentrations at Mount Helmos (Fig. 8) generally increase with decreasing T; the concentration spans from 10−3 to 102 particles std L−1. For °C, the observed INPs may be attributed to biological particles, especially at the warmest temperatures (Murray et al., 2012; Kanji et al., 2017). These bioaerosols may originate from local and/or transported continental biogenic sources, such as vegetation and living organisms, and from the sea surface microlayer, which releases marine diatoms and/or diatom exudates (Després et al., 2012). Soil dust particles emitted from agricultural lands (local and continental), which are reported to be able to nucleate ice at °C (Garcia et al., 2012; Harrison et al., 2016; Hill et al., 2016), and organic material emitted by marine organisms, some of which can freeze at T values close to −10 °C via the immersion freezing mode (Wilson et al., 2015), may also contribute to INPs observed at warm temperatures. The higher median INP concentrations at °C observed at Mount Helmos compared with those at lower temperatures (−11 and −12 °C) are due to the limited observations at such warm temperatures. Furthermore, we note that the INSEKT measurement uncertainty is higher at warmer T values. For °C ( °C), mineral dust and soil dust particles of arid and agricultural origin are more important INPs than bioaerosols (Hoose and Möhler, 2012; Murray et al., 2012; Tobo et al., 2014). Moreover, local and transported ash particles emitted from industrial coal combustion and domestic fuel use may contribute to the observed INPs for °C (Umo et al., 2015). Additionally, we note that INPs observed by the PINE chamber at °C show higher concentrations than those measured by the INSEKT instrument at the same T. This may partly result from the decreased particle collection efficiency of INSEKT filters due to overloading under high-particle-concentration conditions. The INP concentration difference is more pronounced at °C, as this temperature was employed for PINE experiments in order to observe a long-period dust event from 4 to 10 November. More details about the difference between INPs recorded by the PINE and INSEKT instruments are provided in Figs. S5 and S6. Note that the PINE chamber, measuring INPs activated by different IN mechanisms (Möhler et al., 2021), is technically different from the INSEKT instrument, which only detects INPs in the immersion freezing mode. This may also partly explain the higher INP concentrations observed by the PINE chamber compared with the INSEKT instrument. Moreover, some INPs may not be tested by the INSEKT instrument if aerosol particles collected on the filter are not extracted completely. Therefore, the PINE chamber reports higher INP concentrations than the INSEKT instrument, as the PINE chamber tests INPs in total aerosols.
Figure 8 also shows that INPs at Mount Helmos are generally distributed in the global envelope range reported by Petters and Wright (2015), particularly for °C, and are consistent with the results reported for other campaigns in the Mediterranean region (Tarn et al., 2020; Beall et al., 2022; K. Tang et al., 2022). Wieder et al. (2022) observed higher INP concentrations for °C over the Alps in wintertime compared with this study. This may be attributed to higher vegetation coverage (or differences in species, rainfall or season) in the wintertime Alps and, hence, larger bioaerosol sources relevant for INPs compared with Mount Helmos. Also notable is that Wieder et al. (2022) report INPs active at T values as high as −4 °C, which implies the presence of INPs that are more efficient in the Alps than at Mount Helmos.
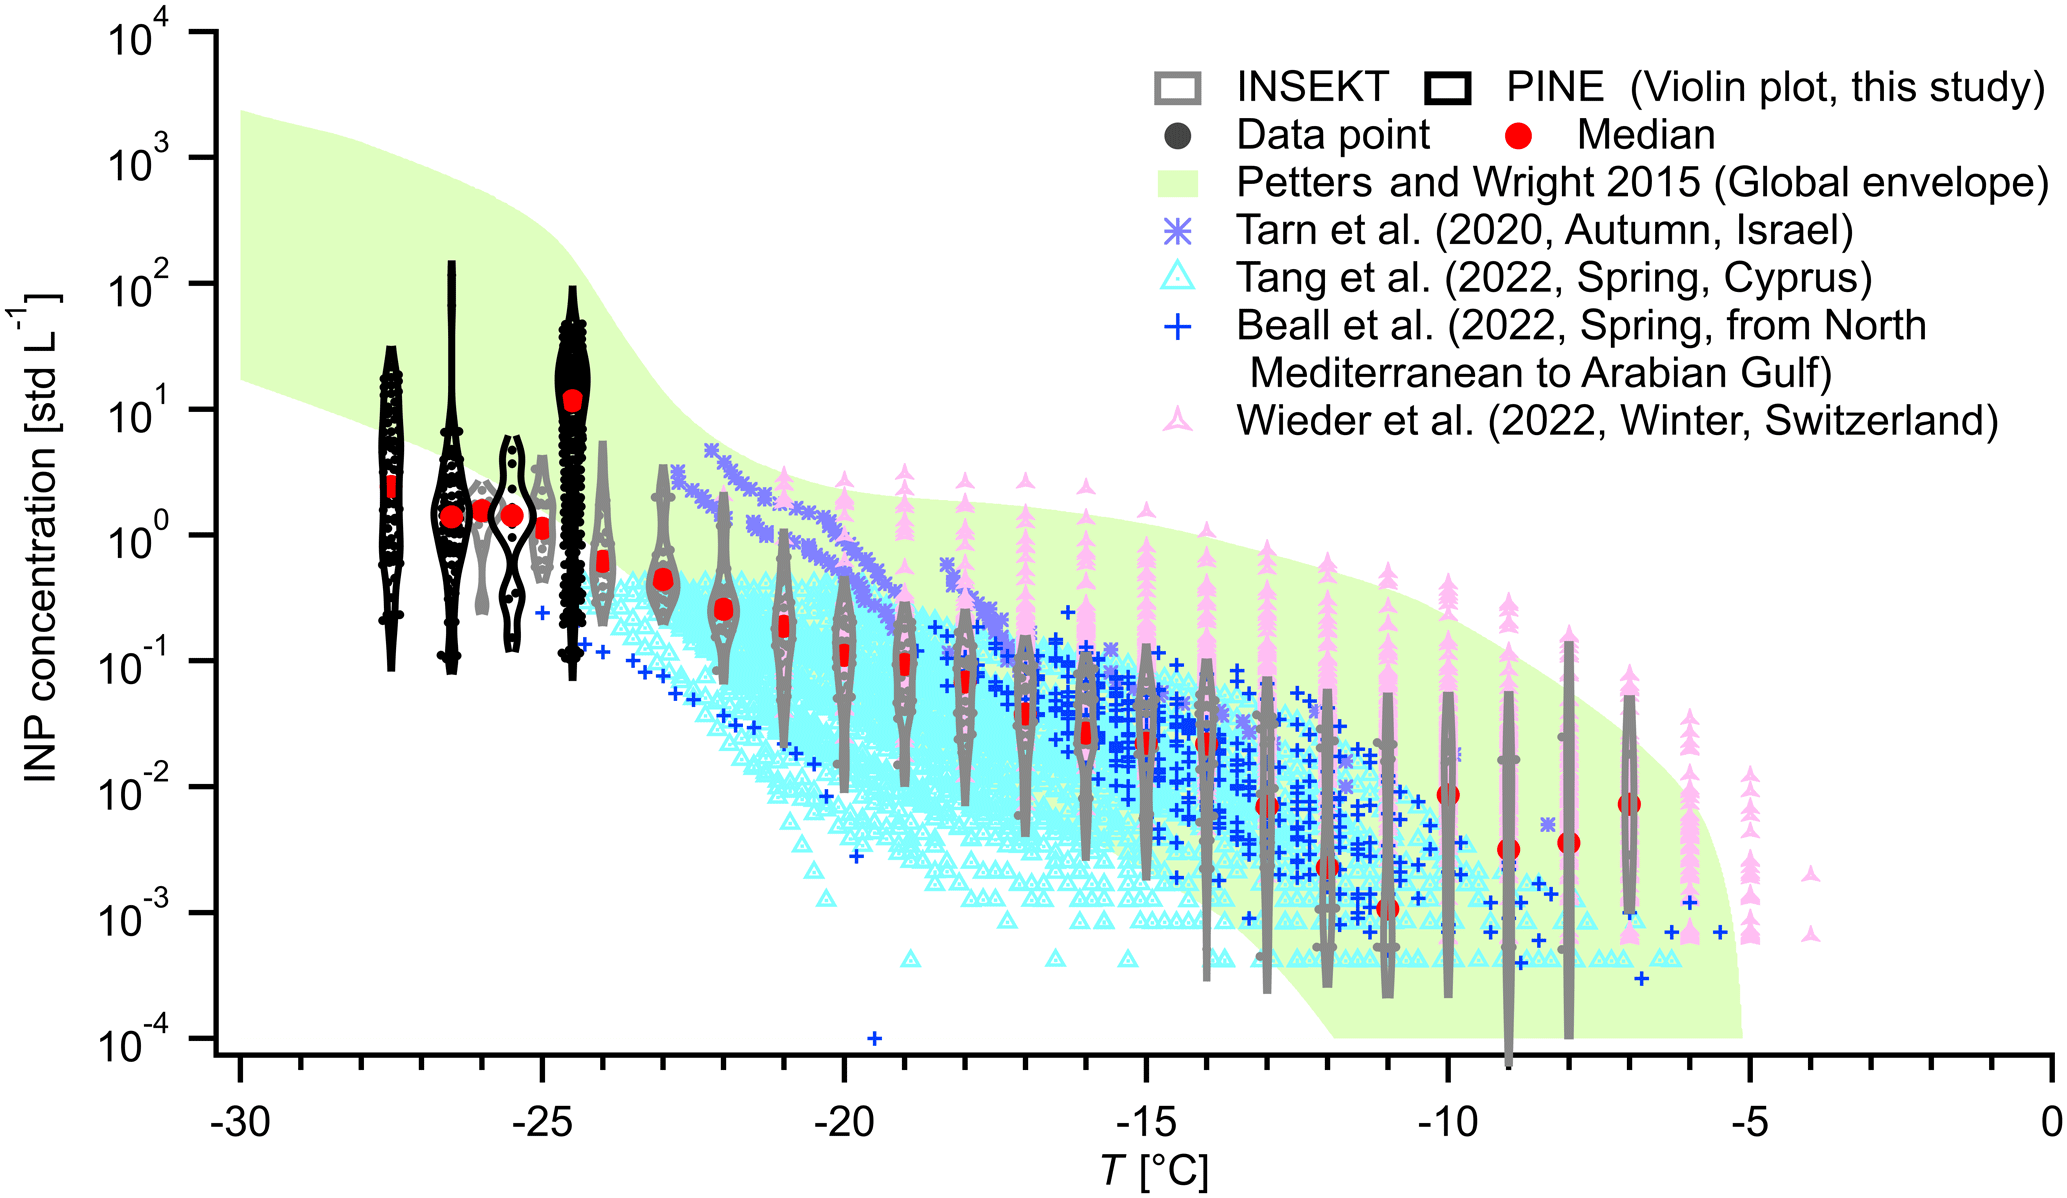
Figure 8INP concentrations observed at Mount Helmos as a function of temperature (T) contrasted against INP levels reported in selected field campaigns in the Mediterranean region (Tarn et al., 2020; Beall et al., 2022; K. Tang et al., 2022; Wieder et al., 2022) and from a global envelope (Petters and Wright, 2015). INP data measured by offline INSEKT and online PINE instruments in this study are presented as violin plots, indicated by a grey or black violin box, respectively. Each violin box presents data points in a T interval of 1 °C. Round red markers in the violin box represent the median value. Symbols for PINE INPs are offset by −0.5 °C for legibility. Higher PINE INP concentrations at −24 °C compared with lower T values are because the PINE instrument was run during the Saharan dust event (i.e. the source of South dust in the PBL, as defined in Fig. 3), whereas INPs at lower T values originate from other aerosol sources with lower IN abilities.
3.2.2 INP concentrations for different sources
The high frequency of PINE measurements allows for the calculation of hourly averaged INP concentrations for different aerosol sources. The small T spread (<4.0 °C) of PINE measurement conditions throughout the campaign also allows for a thorough comparison of the INP abundance from different sources (at similar T values). As shown in Fig. 9, the INP concentration is less than 1.0 particle std L−1 ( °C) when (HAC)2 is in the FT under background conditions without precipitation/clouds. This is in agreement with Lacher et al. (2021), who measured INPs at Jungfraujoch in Switzerland under FT conditions (reported range of 0.01–1.0 particle std L−1 at −25 °C in immersion freezing mode). Note that the lower INP concentrations observed at Jungfraujoch compared with (HAC)2 can be attributed to the much higher altitude of the former. Moreover, the results in Fig. 9a, c and d are consistent with Mignani et al. (2021), who reported decreased TotalAPS and CoarseAPS particles but slightly increased INPs after precipitation events. With the influence of precipitation/clouds, INPs in the FT at (HAC)2 approximately increase to 1.0 particle std L−1 ( °C). The enriched INPs may be attributed to cloud-processed particles (Khadir et al., 2023) and the bioaerosols (likely AWIBS, ABWIBS and ABCWIBS in Fig. 5a) released near the ground that are produced by precipitation splash (Prenni et al., 2013; Joung et al., 2017). Cloud-processed particles, which are a result of evaporated/sublimated hydrometeors, are originally active INPs and show an enhanced IN ability compared with the particles before cloud processing (Jahl et al., 2021). In addition, during precipitation/cloudy periods, PBL air masses containing bioaerosols close to the cloud base may be entrained into the FT close to the cloud top, such that more INPs are measured in the FT at (HAC)2. We also note that the overall lower T conditions (by 1.0 °C) for PINE experiments for (HAC)2 in the FT with precipitation/clouds may also partly contribute to its higher tested INP concentrations.
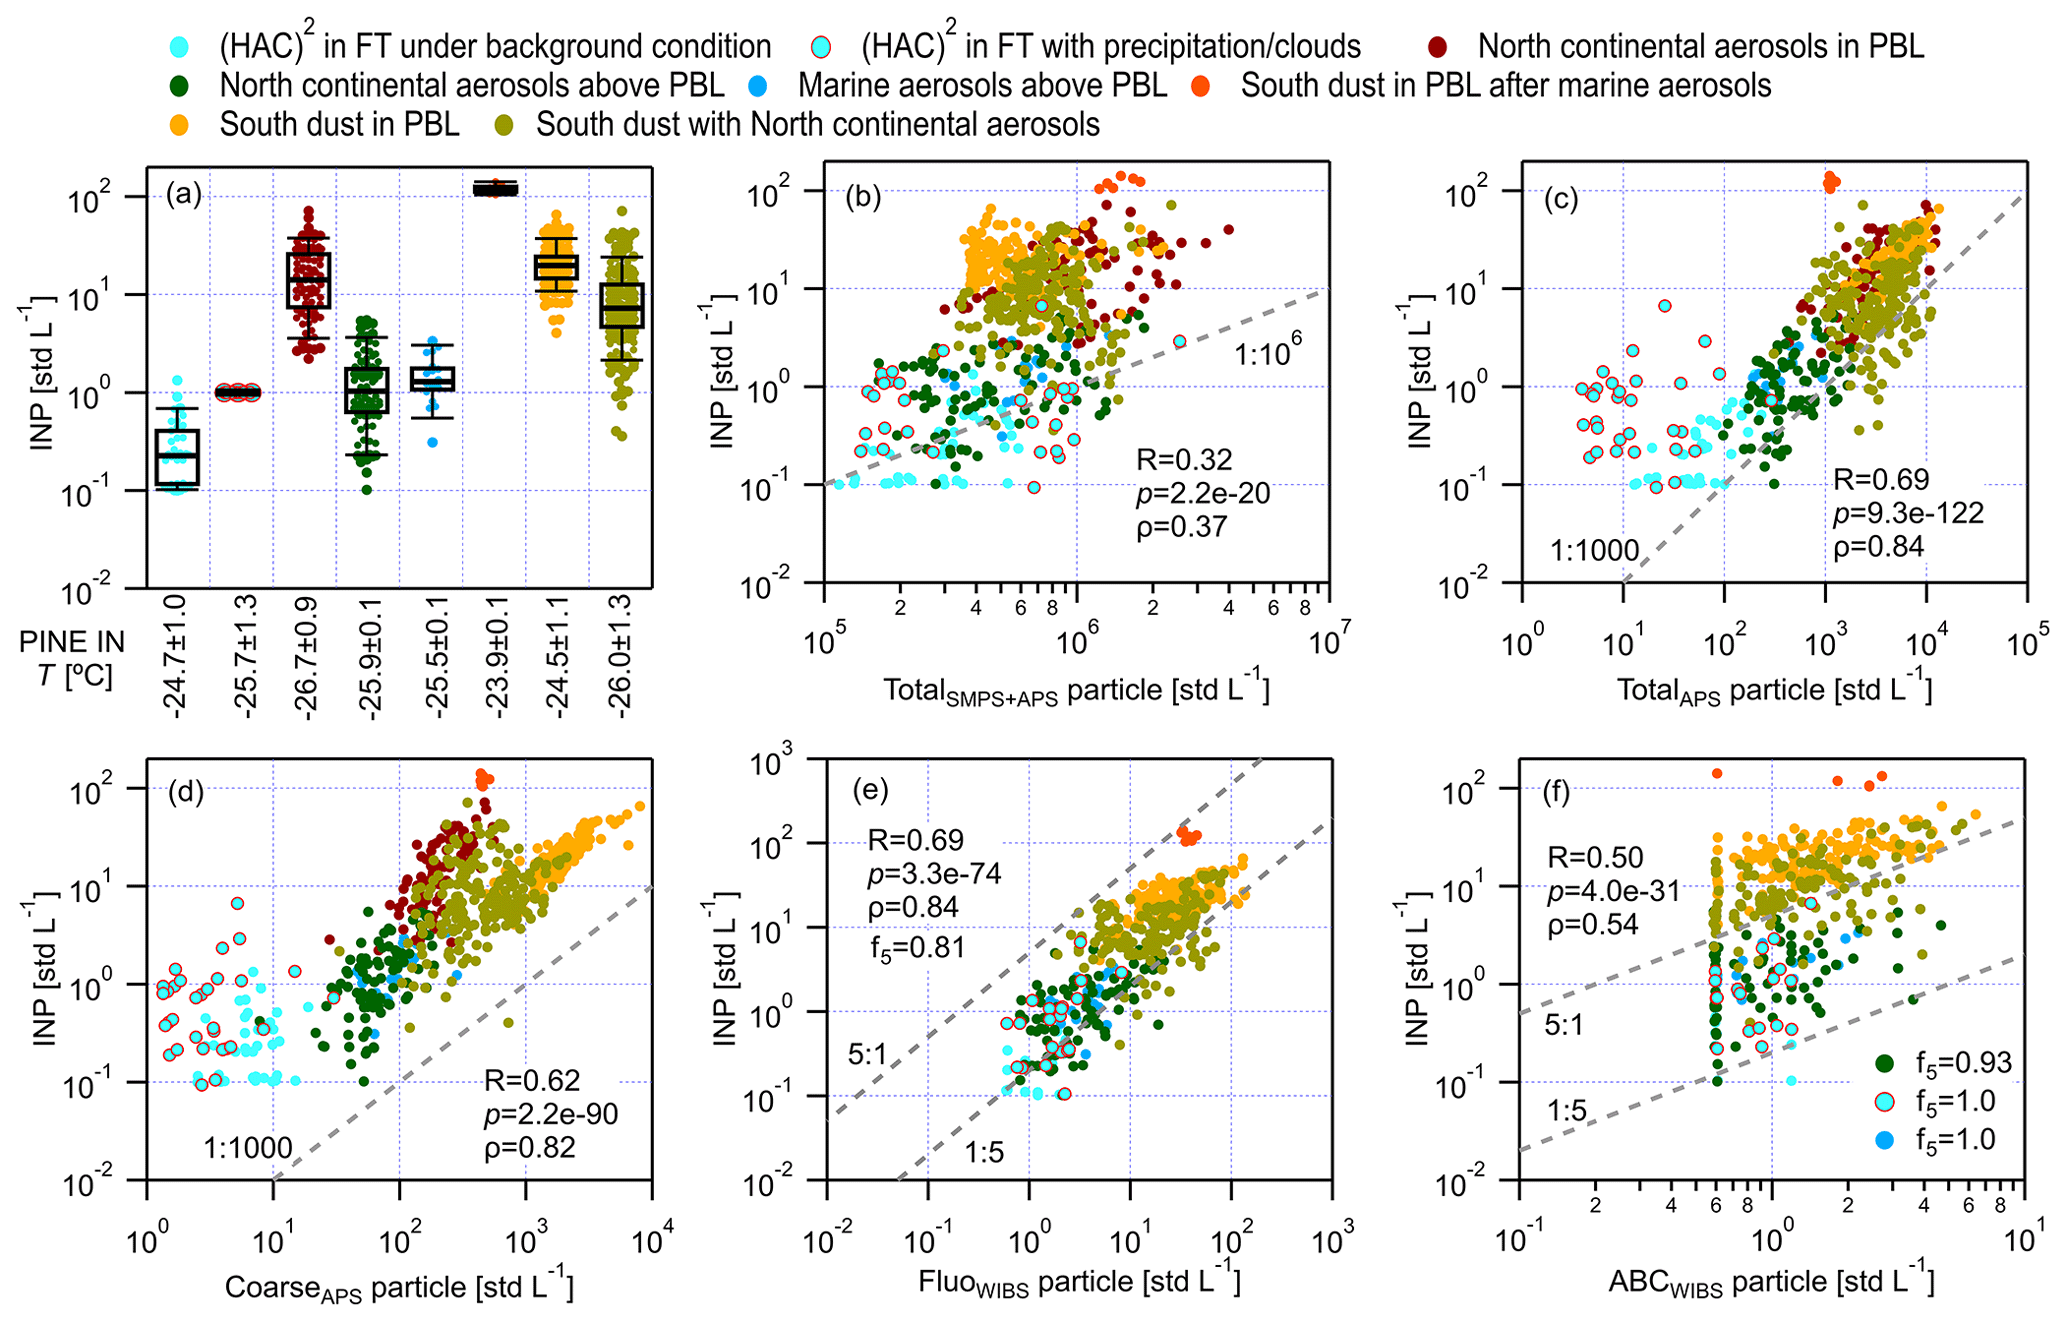
Figure 9The PINE INP concentration for different aerosol sources and the relationship between INP and aerosol particle concentrations. (a) Box plots for the INP concentration from different aerosol sources; the average T for PINE IN experiments for each source is indicated on the bottom axis, and the uncertainty is 1 standard deviation. (b) Scatter plots of INP and TotalSMPS+APS concentrations. (c) Scatter plots of INP and TotalAPS concentrations. (d) Scatter plots of INP and CoarseAPS concentrations. (e) Scatter plots of INP and FluoWIBS concentrations. (f) Scatter plots of INP and ABCWIBS concentrations. The Pearson correlation coefficient (R), the corresponding p value calculated from an F test and the Spearman rank coefficient (ρ) are provided to evaluate the correlation between the INP concentration and different aerosol particle concentrations. The p value is the probability of obtaining an R value no smaller than the true R value if there is no linear correlation between INPs and the given parameter.
The concentration of INPs from North continental aerosols in the PBL is between 2.2 and 71.6 particles std L−1, with a median of 14.1 particles std L−1 ( °C). When North continental aerosols serve as INP sources for (HAC)2 above the PBL, the observed INP concentration decreases substantially (about 10-fold). The results suggest that the INP concentration from a similar continental air mass depends on its relative position in the atmosphere, which is consistent with published studies to date (e.g. Gong et al., 2022). INPs in marine aerosols above the PBL range between 0.3 and 3.4 particles std L−1 (median of 1.3 particles std L−1) at °C, which is higher than the values reported in Lacher et al. (2021) from a source attributed to marine aerosols from the western Mediterranean Sea. It is likely that the lower INP concentrations (even at a lower experimental T) observed by Lacher et al. (2021) at Jungfraujoch in Switzerland are the result of the longer transportation of marine aerosols, during which particle deposition and ageing-induced deactivation may occur (Schrod et al., 2020). The dust plume after marine aerosols shows the highest INP concentration among all sources, with an average of 121.3 ± 14.7 particles std L−1 and a median of 121.1 particles std L−1 ( °C, resampled every 15 min due to the short period of observations <3 h). Such a high INP concentration in Saharan dust was also observed at Jungfraujoch in Switzerland (>200 particles std L−1 for °C; Brunner et al., 2021). Moreover, the observed INP concentration is substantially higher than the ABCWIBS concentration (<10 particles std L−1 in Fig. 9f), suggesting that dust particles – but not any associated biological particles – make the primary contribution to the observed INPs in the dust plume. The median INP concentration decreases to 19.8 particles std L−1 ( °C) when the dust plume is more extensively mixed with local aerosols in the PBL, i.e. the source of South dust in the PBL. Furthermore, the median INP concentration decreases further to 7.3 particles std L−1 ( °C) when the dust plume is also mixed with continental aerosols, i.e. the source of South dust with North continental aerosols. It is likely that the source of South dust in the PBL after marine aerosols may contain more fresh dust particles than the following sources, which comprise more aged and deactivated dust particles (Boose et al., 2019).
Among all of the sources presented in Fig. 9, the INP concentration in the PBL is considerably larger than that in the FT, by approximately more than 1 order of magnitude (median value), although it depends on INP sources. Both continental aerosols from the North and dust from the South are major sources of INPs at Mount Helmos. Fresh dust plume contains a larger number of INPs than the other sources mixed with local emissions and/or continental aerosols. Such a decrease in the INP abundance in the mixed dust-containing sources may result from the dilution of air masses or aerosol-ageing-induced INP deactivation. Furthermore, we note that the INP concentration range in North continental aerosols ( °C) is analogous to that of South dust ( °C) when both are mixed with local emissions in the PBL.
Figure 9 and Table 2 also provide the correlation between the INP concentration and different concentrations of aerosol particles, including TotalSMPS+APS, TotalAPS, CoarseAPS, FluoWIBS and ABCWIBS. The concentration of PINE INPs is approximately higher than 1 per 1×10⁶ of TotalSMPS+APS, 1 per 1×10³ of TotalAPS and 1 per 500 of CoarseAPS, respectively, consistent with the established view that INPs in the atmosphere show a size dependence and that larger aerosol particles have a higher probability of behaving as INPs. Overall, a significant and positive correlation between the INP concentration and aerosol particle concentrations can be found in Fig. 9. A ρ value larger than 0.80 for the relationship of INPs with TotalAPS, CoarseAPS or FluoWIBS (>0.5 µm, optical size) means that the INP concentration increases with those three particle concentrations following a strong monotonic trend. In comparison with TotalAPS, CoarseAPS, FluoWIBS (Fig. 9) or TotalWIBS (Fig. S7), the smaller R and ρ values for the relationship between TotalSMPS+APS and INPs also indicate that small aerosol particles in the SMPS size range may play a minor role with respect to serving as INPs compared with larger particles measured in the APS and WIBS size range. The IN dependence on the size of aerosol particles is more pronounced for the sources of North continental aerosols and South dust when both sources supply potential INPs for (HAC)2 in the PBL, as shown by the fact that the R value for the relationship of INPs with TotalAPS or CoarseAPS for South dust in the PBL does not show a significant difference compared with the R value for the relationship of INPs with TotalSMPS+APS (Table 2). This is because the source of South dust in the PBL contains a much smaller proportion of fine particles with respect to the total than for the source of North continental aerosols in the PBL (Fig. 4). Furthermore, the ρ value of the relationship between INPs and CoarseAPS particles for North continental aerosols is larger than that of South dust in the PBL, suggesting that INPs in North continental aerosols may be more dependent on coarse-mode particles.
Table 2The Pearson correlation coefficient (R) and the Spearman rank coefficient (ρ) for the relationship evaluation between the INP and aerosol particle concentrations from different sources. A critical p value of 0.05 from an F test for R is used to assess the significance level of the relationship. A p value smaller than 0.05 suggests that the probability of obtaining an R value no smaller than the true R value is less than 5 % if there is actually no liner correlation between the INPs and the given parameter; thus, the calculated R is of statistical significance. Evaluated significant relationships are indicated using bold font. Note that the correlation between INPs and TotalWIBS particles is not included in Fig. 9, but it is provided in Fig. S7.
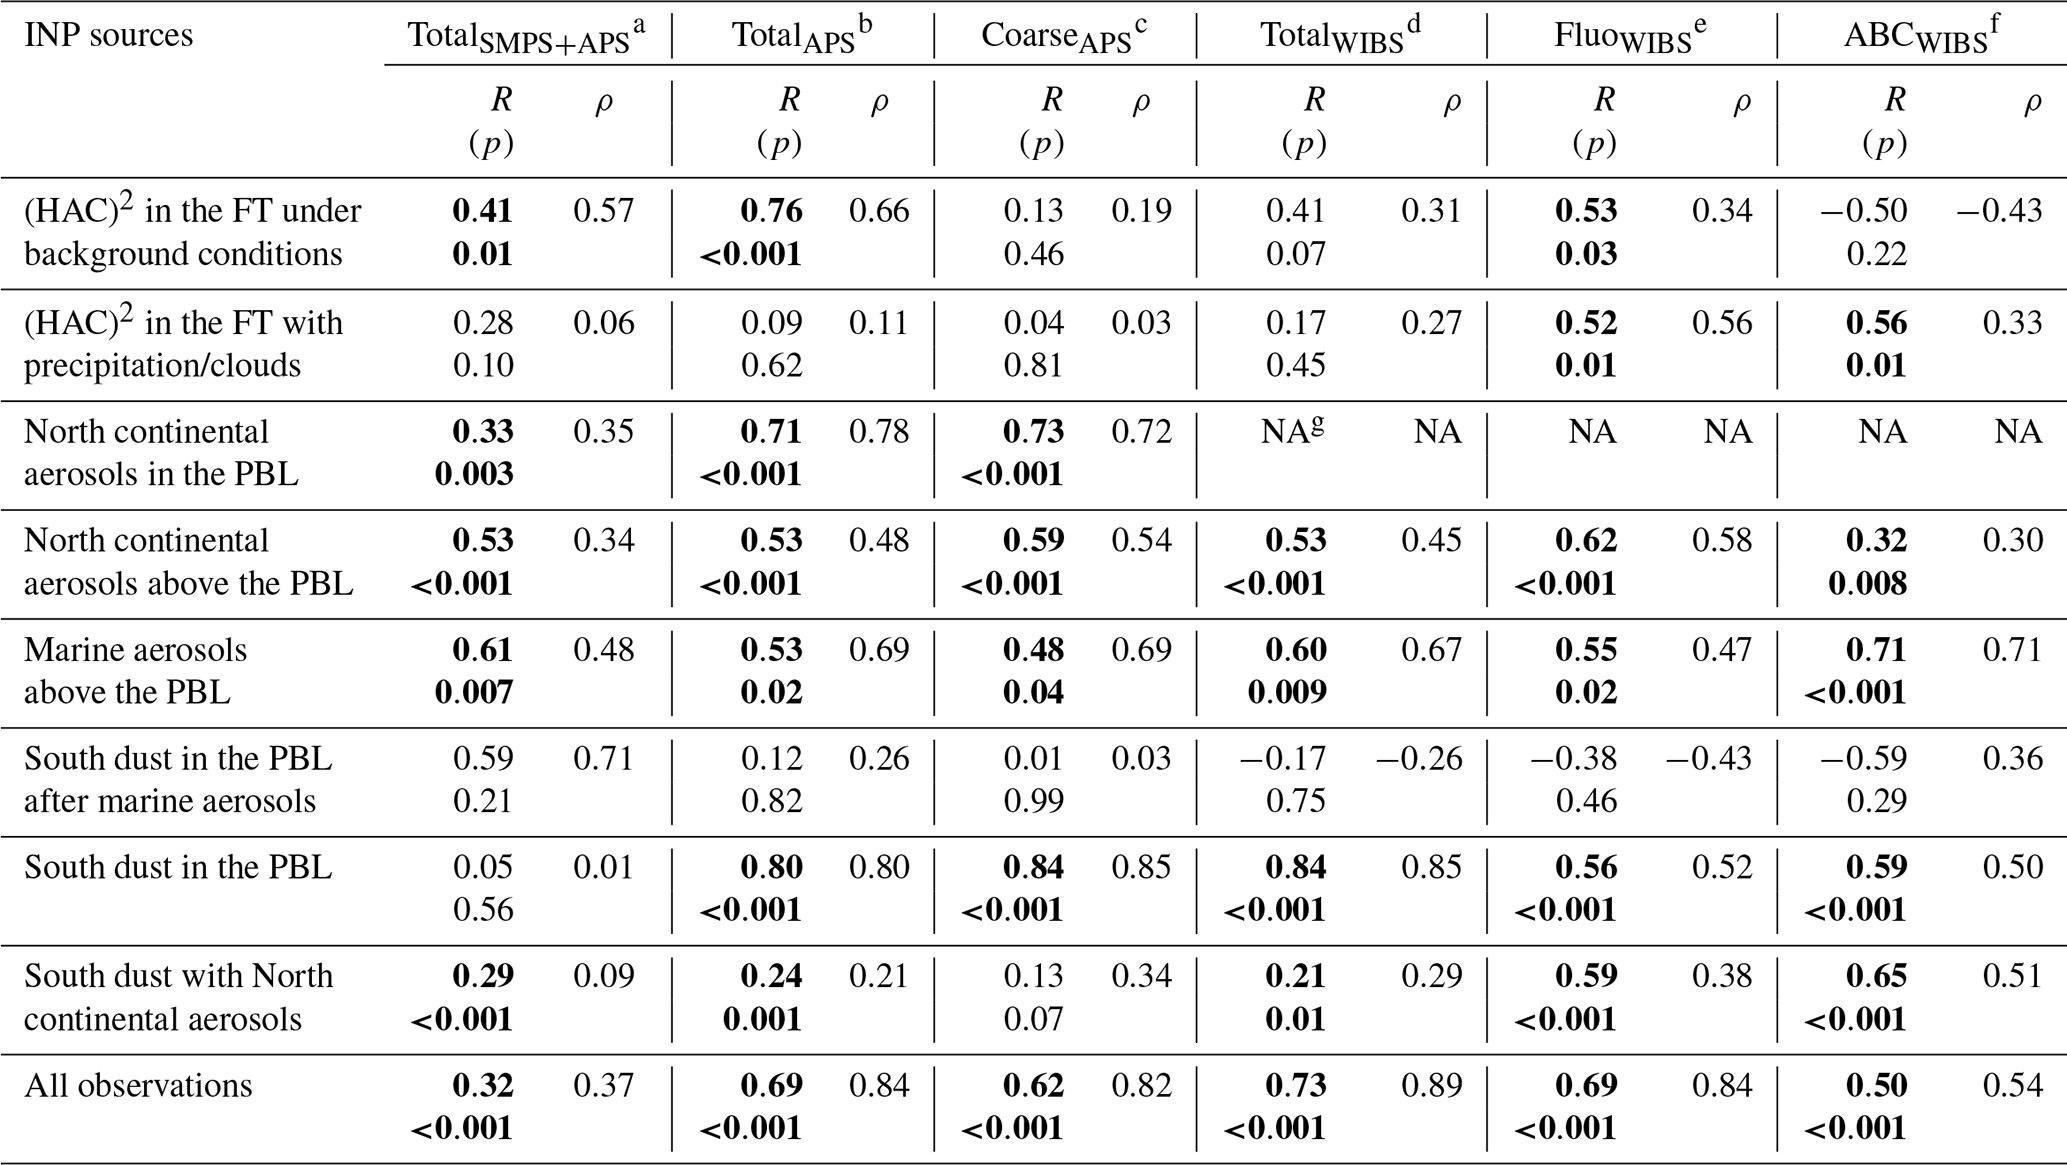
a Total particle (0.01–20.0 µm) number concentration measured by both SMPS and APS. b Total particle (0.5–20.0 µm) number concentration measured by APS. c Coarse-particle (>1.0 µm) number concentration measured by APS. d Total particle (0.5–30.0 µm in optical size) number concentration measured by WIBS. e Number concentration of particles showing fluoresce in any one of the WIBS fluorescent channels. f Number concentration of particles showing fluoresce in all three WIBS fluorescent channels. g Data not available.
In addition to size dependence, we note that the observed INP concentration is close to the concentration of fluorescent particles, as it is shown that more than 80 % of INP data points are within a factor of 5 compared to FluoWIBS data (Fig. 9e). Moreover, INPs from most sources show a significant correlation with FluoWIBS particles (except for the source of South dust in the PBL after marine aerosols, owing to limited number of observations). This suggests that particles showing fluorescence are of significant relevance for INPs observed at Mount Helmos. The results are also in agreement with Mason et al. (2015), who reported that INPs observed between −15 and −25 °C at a coastal site are strongly correlated with fluorescent particles. Furthermore, the results are consistent with Pereira Freitas et al. (2023), who found fluorescent biological aerosol particles to be dominant sources of INPs activating at T values of around −15 °C. ABCWIBS would constitute a subset of the observed total INPs, as the latter is approximately 5 times larger (Fig. 9f) and shows a significant correlation with ABCWIBS particles in the source (Table 2). In particular, more than 90 % of the observed INP data from sources of aerosols in the FT influenced by precipitation/clouds, marine aerosols and continental aerosols above the PBL are within a range of less than a factor of 5 compared to ABCWIBS particles in the source (Fig. 9f). Such a close correlation highlights the importance of biological particles in those INP sources when dust particles are absent. Notably, the correlation between INPs and ABCWIBS particles for aerosols in the FT influenced by precipitation/clouds becomes significant compared to the case without precipitation/cloud effects (Table 2), suggesting that precipitation/clouds may lead to an increase in ABCWIBS (Fig. 7) and contribute to observed INPs. Lastly, Table 2 shows that, of all the sources, ABCWIBS particles from marine aerosols show the strongest correlation with INPs. This is consistent with the important role of marine biogenic aerosols in serving as INPs in the MPC regime (Wilson et al., 2015).
3.2.3 The ice nucleation ability of particles in different aerosol sources
Figure 10a uses the ratio of the INP concentration to the TotalSMPS+APS concentration to estimate the INP proportion in total aerosol particles for different sources, and it uses the ratio as a measure to evaluate the average IN ability of aerosol particles from different sources. To clarify, we note that the ratio statistically refers to the overall ice formation ability of the particle population in the source. However, the ratio is not relevant to the IN ability of single particles, as the IN ability specifically relies on the physiochemical properties of the particle, given that sources containing a low concentration of INPs may have effective INPs activating at warm temperatures. When (HAC)2 is in the FT under background conditions without remotely transported air masses and without precipitation/clouds, the observed INP ratio is approximately 1 per 1×10⁶ aerosol particles and the median ratio value is less than that presented in Rogers et al. (1998), who reported ∼30 INPs out of 1×10⁶ particles at an altitude of 10.6 km in the upper troposphere and at a T range of between −15 and −40 °C. Influenced by precipitation/clouds, the INP ratio in the FT generally increases because of the decrease in total aerosol particles and the increase in INPs (Sects. 3.1 and 3.2.2). Figure 10a also suggests that the (HAC)2 position with respect to the PBL regulates the average IN ability of particles from the North continental aerosol source, as shown by the larger INP ratio when the source is in the PBL than above the PBL. This is because active INPs from the source in the PBL may primarily come from CoarseAPS particles that otherwise take a smaller proportion when the source is above the PBL (Fig. 10b). The INP ratio of marine aerosols above the PBL is analogous to that of North continental aerosols above the PBL (Fig. 10a), suggesting a similar IN ability of particle populations in both aerosol sources. In addition, the INP ratio of aerosol sources containing dust particles decreases if the source is more influenced by the PBL or if it is mixed with North continental aerosols.
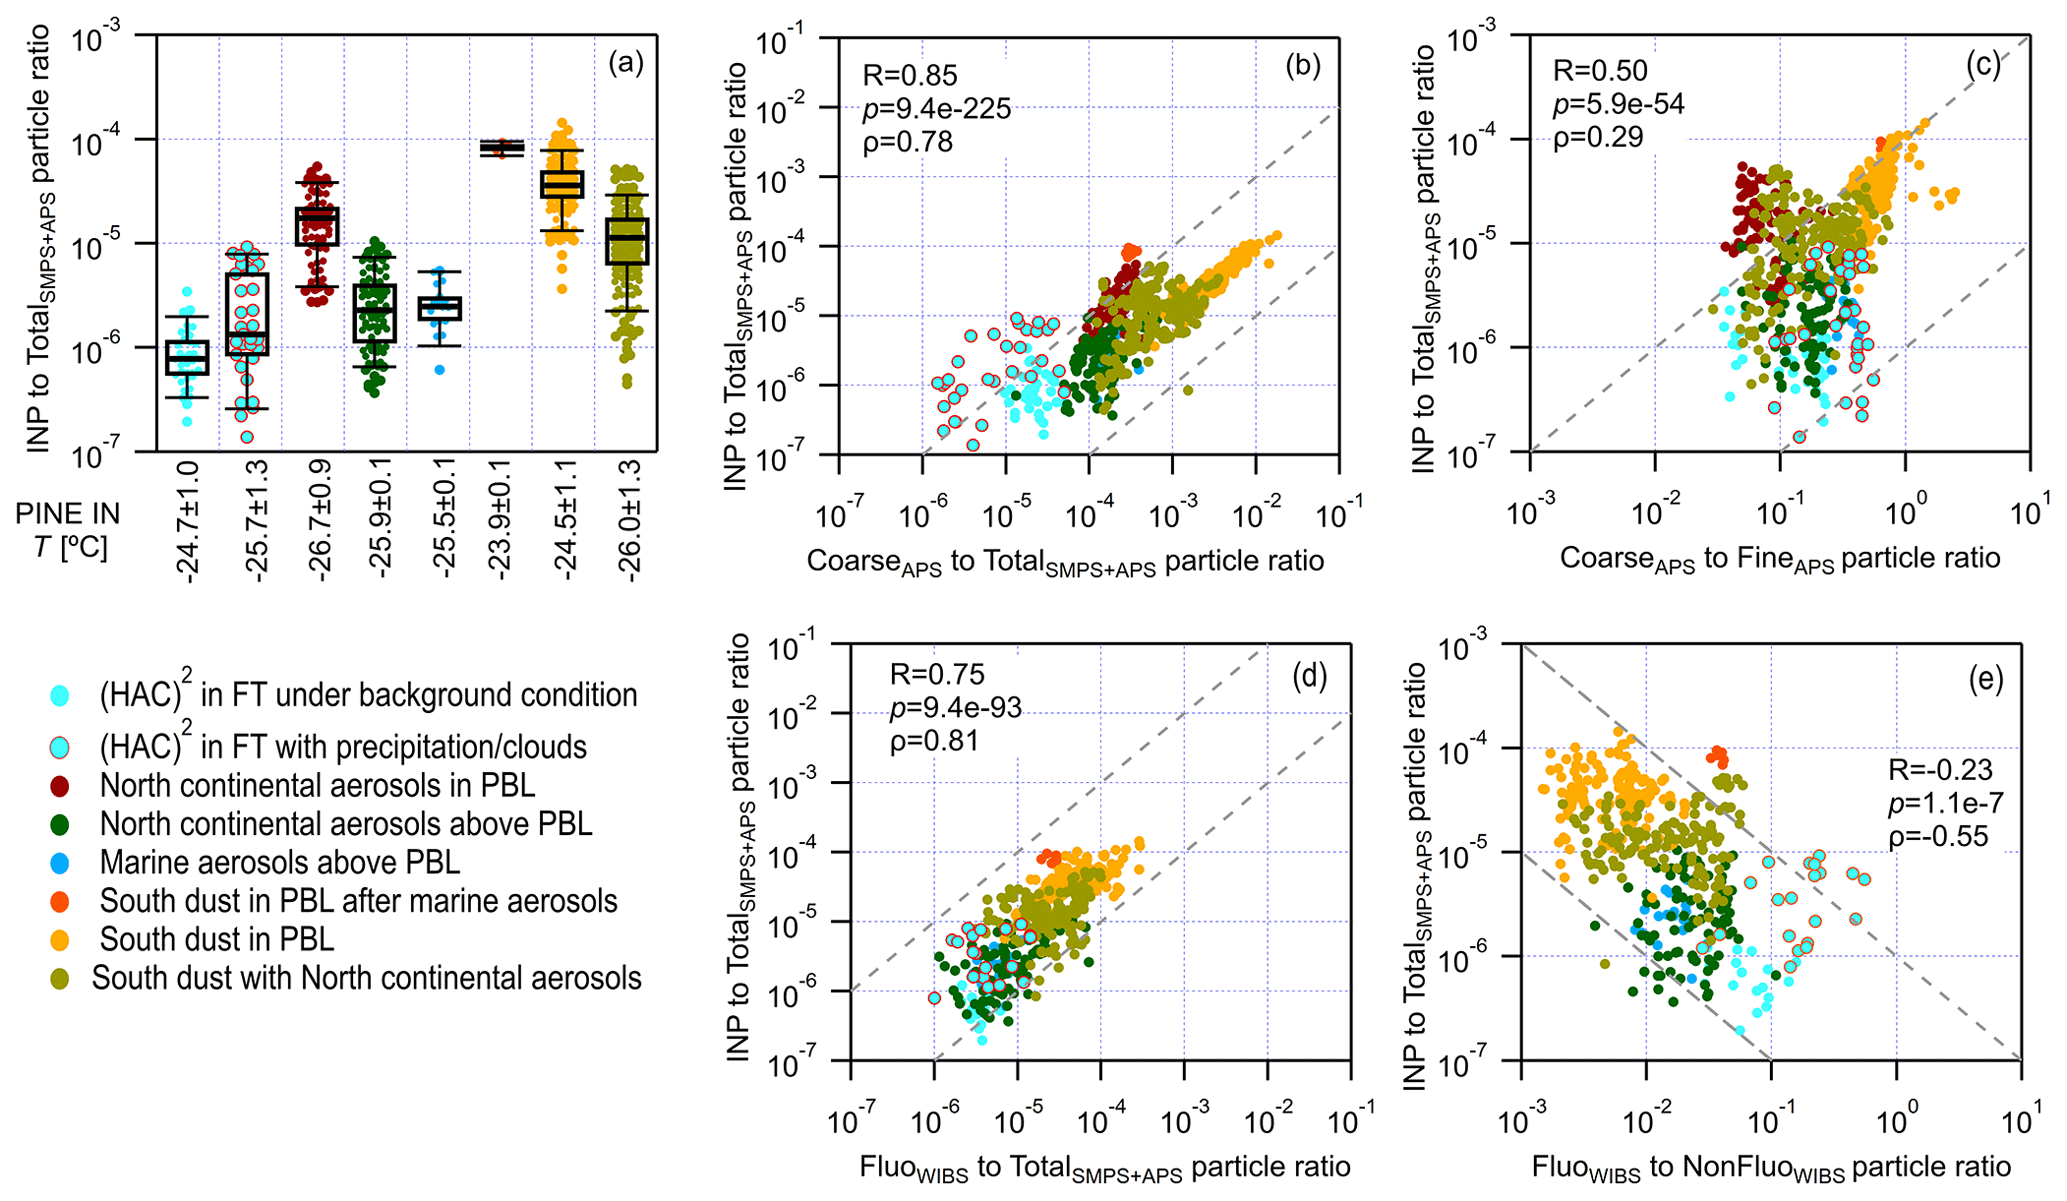
Figure 10(a) Box plots of the ratio of the INP concentration to the TotalSMPS+APS concentration; the average T for the PINE IN experiments for each INP source is indicated on the bottom axis, and the uncertainty is 1 standard deviation. (b) Scatter plots of the ratio of INPs to TotalSMPS+APS particles and the ratio of CoarseAPS to TotalSMPS+APS particles. (c) Scatter plots of the ratio of INPs to TotalSMPS+APS particles and the ratio of CoarseAPS to FineAPS particles. (d) Scatter plots of the ratio of INPs to TotalSMPS+APS particles and the ratio of FluoWIBS to TotalSMPS+APS particles. (e) Scatter plots of the ratio of INPs to TotalSMPS+APS particles and the ratio of FluoWIBS to NonFluoWIBS (the difference between TotalWIBS and FluoWIBS) particles. The Pearson correlation coefficient (R), the corresponding p value calculated from an F test and the Spearman rank coefficient (ρ) are provided to evaluate the correlation between INP abundance and particle partitioning. The p value is the probability of obtaining an R value no smaller than the true R value if there is no liner correlation between INPs and the given parameter. The grey dashed lines in the panel confine a range of 2 orders of magnitude on both the x axis and y axis.
The results in Fig. 10 also evaluate the dependence of the INP ratio on the particle size and fluorescent/nonfluorescent particle partitioning of the source, including the ratio of CoarseAPS to TotalSMPS+APS, CoarseAPS to FineAPS, FluoWIBS to TotalSMPS+APS and FluoWIBS to NonFluoWIBS (the difference between TotalWIBS and FluoWIBS) particles. In general, the average INP ratio of a source increases with an increasing proportion of CoarseAPS (>1.0 µm; Fig. 10b and c) and FluoWIBS (Fig. 10d and e) particles in the source, but such a correlation varies with respect to its strength among individual sources. Figure 10b shows that the INP ratio of North continental aerosols (for both above and in the PBL) has a weaker correlation with CoarseAPS particles (see the R and ρ values in Table S1 in the Supplement) compared with that of South dust in the PBL. Again, this is because North continental aerosols contain more fine-mode particles, which are less effective INPs, than aerosols from South dust in the PBL. A larger slope for North continental aerosols in Fig. 10b compared with South dust in the PBL suggests that INPs in North continental aerosols are more dependent and sensitive to CoarseAPS particles. This may be because individual CoarseAPS particles in continental aerosols of biological origin are generally more effective INPs than those in dusty aerosols. This can be true if those coarse-mode particles in continental aerosols are of biologic origin. Moreover, the insignificant correlation between the INP ratio of sources containing North continental aerosols and the ratio of CoarseAPS to FineAPS particles in the source (Fig. 10c and Table S1) suggests that some particles smaller than the APS size detection range (∼0.5 µm) may contribute to the observed INPs at °C. Figure 10c shows that the correlation between the INP ratio and the CoarseAPS-to-FineAPS ratio is less significant (see Table S1) for the source of South dust in the PBL compared with the correlation between the INP ratio and the CoarseAPS-to-TotalSMPS+APS ratio, also suggesting a contribution of some small particles (<0.5 µm) to observed INPs. This is consistent with a field study in Israel (in the eastern Mediterranean region) that focused on the IN ability of size-resolved Saharan dust particles; the aforementioned study reported that 0.3 µm (aerodynamic diameter) dust particles are effective INPs at the T range from −20 to −30 °C (Reicher et al., 2019). In addition, an increasing FluoWIBS-to-TotalSMPS+APS ratio can generally predict an increasing INP ratio of an aerosol source (Fig. 10d; no data available for the source of North continental aerosols). However, Fig. 10e shows that the INP ratio for different aerosol sources generally decreases with an increasing FluoWIBS-to-NonFluoWIBS ratio. The results on the x axis of Fig. 10e show that the FluoWIBS-to-NonFluoWIBS ratios in different sources are in reverse order compared with the other ratios presented in Fig. 10b–d. Such a difference suggests that the INPs of biological origin become less important when the overall IN ability and INP abundance of the source is higher, such as dust plumes, indicating a less pronounced role of biological particles in dust-containing sources with respect to serving as INPs.
Overall, the scatter patterns of the INP ratio versus different aerosol partitioning indices (presented in Fig. 10) spread over 2 orders of magnitude (confined by grey dashed lines in Fig. 10b–e). Both the CoarseAPS-to-FineAPS ratio and FluoWIBS-to-NonFluoWIBS ratio show significant correlations (p<0.05 in Table S1) with the ratio of INPs to TotalSMPS+APS particles (Fig. 10c and e), although the strengths of these two correlations are weaker compared with the results using TotalSMPS+APS data in Fig. 10b and d. This suggests the proportion of particles with different sizes and fluorescent properties conveys the IN ability of particles from different aerosol sources, which may benefit the prediction of INPs in parameterizations. In Sect. 3.4, these ratios will be incorporated into INP parameterizations to improve their prediction skill.
3.3 The influence of precipitation/clouds on INPs in the PBL
3.3.1 Different scenarios classified during the case study
In addition to the effects of precipitation/clouds on INPs for periods during which (HAC)2 was in the FT, precipitation/cloudy periods were also observed when the site resided in the PBL; however, these periods had different aerosol sources, so we treat them separately. For this, we focus on a case study (23 November) during which (HAC)2 was in the PBL and influenced by continental aerosols. The FLEXPART footprints and the HYSPLIT back trajectories (Figs. S9 and S10, respectively) suggest that a North continental air mass dominated the aerosol source at (HAC)2 during this time (with a possible minor contribution of South dust). The dominance of North continental aerosols is also supported by nephelometer results, as α∼2.0 (Mordas et al., 2015). Following the methodology introduced in Sect. 2.4, the observations during the day are classified based on the presence of precipitation/clouds and the position of (HAC)2 with respect to the PBL, by using Ze and MDV values from radar measurements presented in Fig. 11a and b, respectively. The position of (HAC)2 with respect to the PBL is evaluated using SMPS N>95 nm time series in Fig. 11c, as the PBLH results from lidar are not always available during the day. Thus, observations on 23 November are classified into five periods (“cases”), including (HAC)2 in the FT with precipitation (case 1) from 00:00 to 04:00 LT, (HAC)2 in the FT with precipitation (case 2) from 05:00 to 09:00 LT, (HAC)2 around the PBL and close to the cloud top (case 3) from 10:00 to 15:00 LT, (HAC)2 in the PBL (case 4) from 15:30 to 18:00 LT, and (HAC)2 in the PBL with precipitation/clouds (basically precipitation below (HAC)2, case 5) from 19:00 to 24:00 LT. The box plots of INP abundance observed by the PINE chamber and the correlation between INPs and aerosol particles for different cases are presented in Fig. 12. Additionally, the aerosol property results, including the particle size distribution for different cases (Fig. S11); TotalSMPS+APS, CoarseAPS, SMPS N<95 nm, FluoWIBS and ABCWIBS particle concentrations; and the eBC mass concentration (Fig. S12) are provided in the Supplement and used to understand the changing INP abundance of the different scenarios presented in this section.
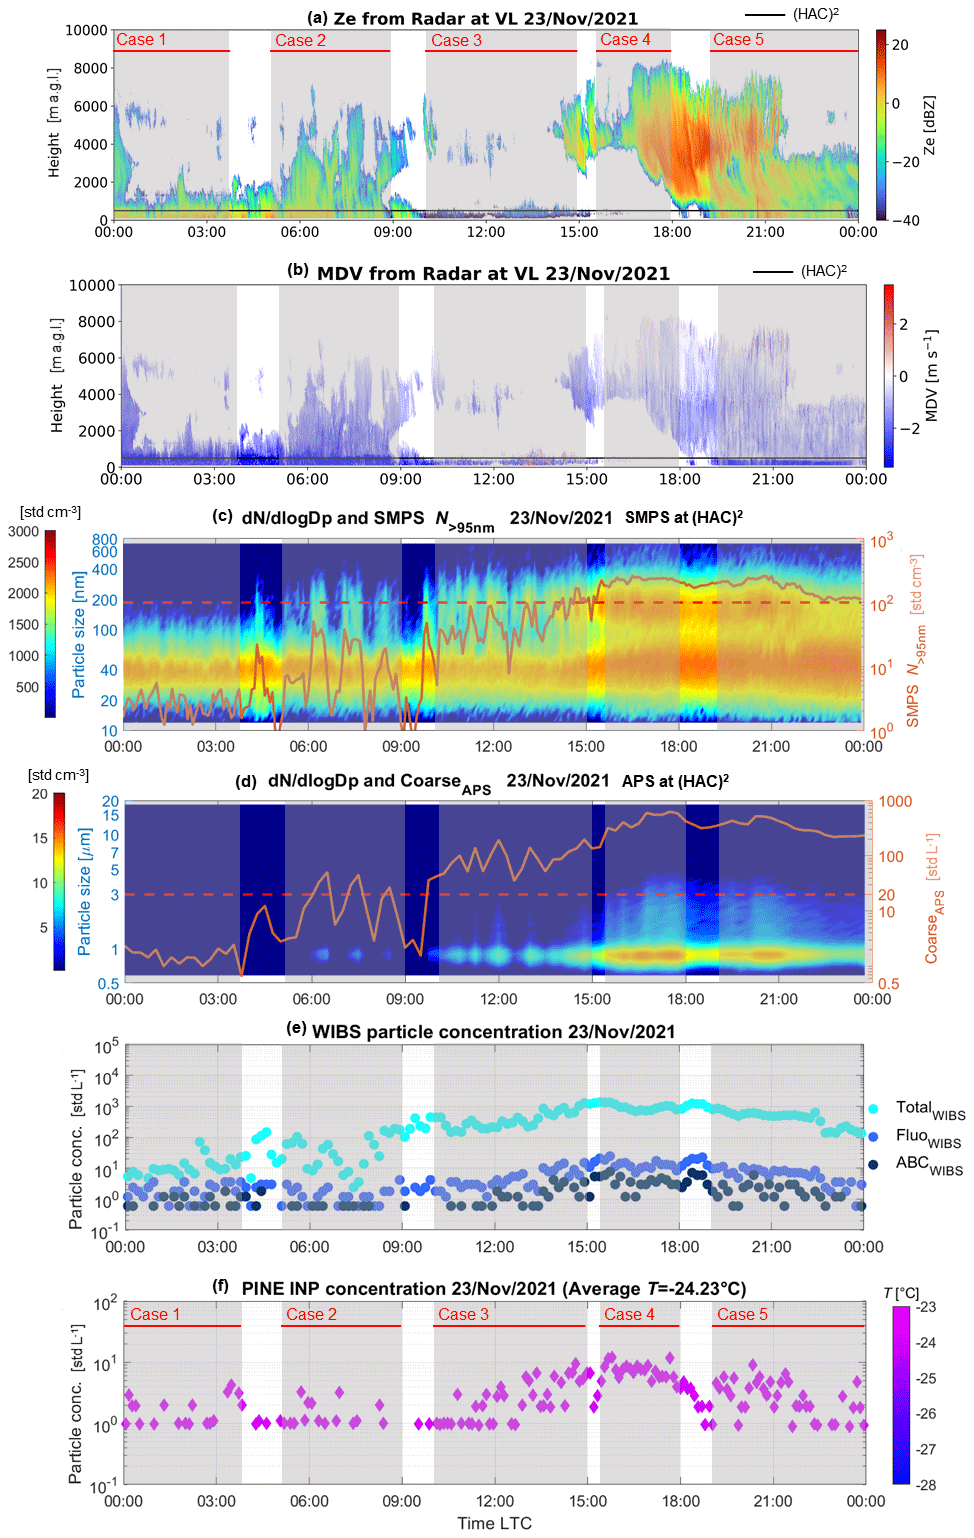
Figure 11Time series of precipitation condition, aerosol particle and INP concentration on 23 November 2021. (a, b) Ze and MDV measured by the radar at VL, respectively. The (HAC)2 level is indicated by the black line in the panels (a) and (b). (c) Particle size distribution measured by SMPS at (HAC)2 for particles smaller than 800 nm (mobility diameter) and the number concentration of SMPS N>95 nm particles used to evaluate the (HAC)2 position with respect to the PBL. The left axis shows the size for the particle size distribution colour map, while the right axis scales SMPS N>95 nm values. (d) Particle size distribution measured by APS at (HAC)2 for particles with a size between 0.5 and 20 µm (aerodynamic diameter) and the number concentration of CoarseAPS particles (>1.0 µm). The left axis shows the size for the particle size distribution colour map, while the right axis scales CoarseAPS values. (e) TotalWIBS, FluoWIBS and ABCWIBS particle number concentrations recorded by WIBS at (HAC)2. (f) The PINE INP concentration measured at (HAC)2 with time resolution of ∼6 min. The temperature T for the PINE IN experiments is indicated by the marker colour scale shown by the colour bar.
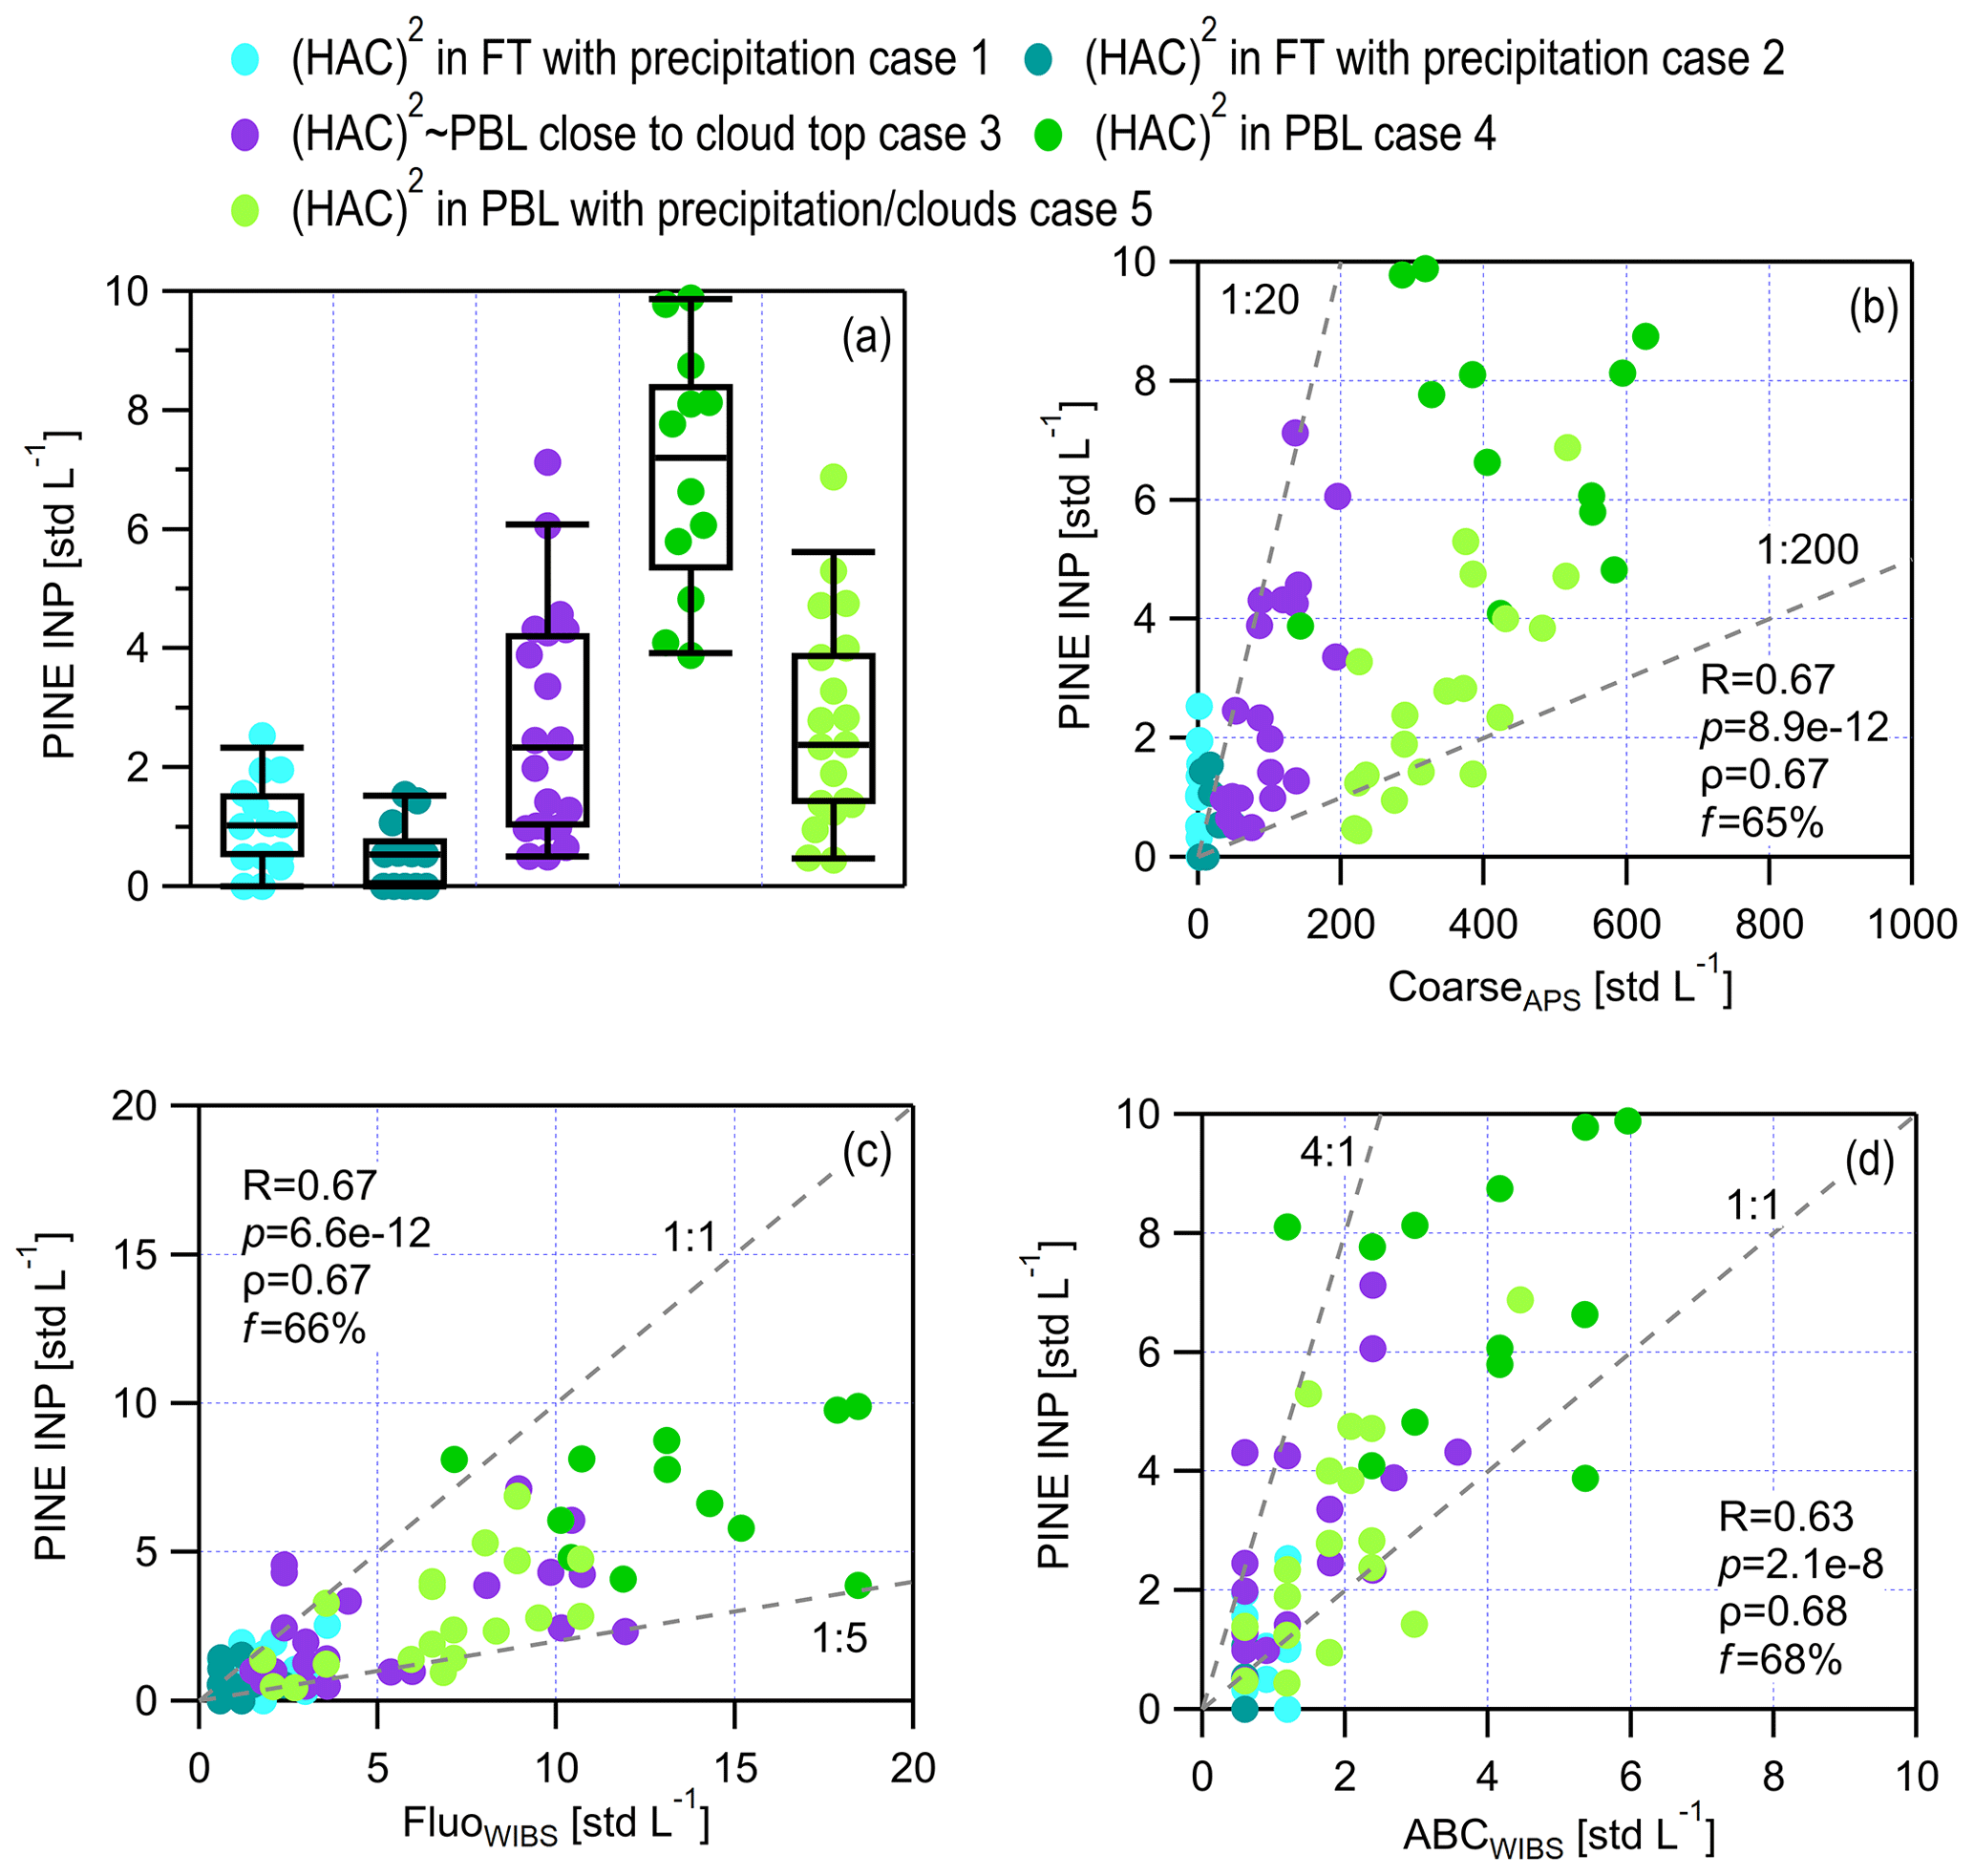
Figure 12The INP concentration and the relationship between INPs and aerosol particles under different scenarios. (a) Box plots of the PINE INP abundance for different scenarios classified on 23 November. (b) Scatter plots of the PINE INP and CoarseAPS particle concentration. (c) Scatter plots of the PINE INP and FluoWIBS particle concentration. (d) Scatter plots of the PINE INP and ABCWIBS particle concentration. The Pearson correlation coefficient (R), the corresponding p value calculated from an F test and the Spearman rank coefficient (ρ) are provided to evaluate the correlation between INP abundance and particle partitioning. The p value is the probability of obtaining an R value no smaller than the true R value if there is no liner correlation between INPs and the given parameter. The value of f represents the percentage of data points within the range confined by the dashed lines in the panel.
3.3.2 Particle properties
The aerosol particle properties for each case are shown in Figs. 11c–e and S11–S13. Figure 11c shows that the PBL boundary generally evolves from a position below (HAC)2 to a position above (HAC)2 throughout the day, as the SMPS N>95 nm increases. The increasing PBLH is also indicated by size distribution shifts to coarse particles in Fig. S11 during the day. When (HAC)2 is in the FT with precipitation (case 1), CoarseAPS particles at (HAC)2 show a median concentration of ∼1.5 particles std L−1 (Fig. S12b). The median value is well below the critical value of 20 particles std L−1 (see Sect. 2.4), suggesting that the site is exposed to clean background conditions at this time with a low probability of influence from remotely transported aerosols above the PBL. This is also supported by the low eBC mass concentration (∼0.01 µg std m−3) shown in Fig. S12f.
When (HAC)2 is in the FT with precipitation (case 2), CoarseAPS particle concentrations at (HAC)2 are occasionally higher than 20 particles std L−1 and show a median of ∼16.7 particles std L−1 (Fig. S12b). This likely suggests that remotely transported continental aerosols exert an influence on aerosols at (HAC)2, although (HAC)2 is still above the PBL with an SMPS N>95 nm smaller than 100 std cm−3. Furthermore, it is possible that precipitation from higher-altitude clouds compared with case 1 results in downdraughts that drive the mass entrainment of remotely transported aerosols. Moreover, compared with case 1, the decrease in ABCWIBS particles in case 2 suggests negligible biological particles in downdraughts from high altitudes (Fig. S12e), whereas the increase in the eBC mass concentration is a result of transportation (Fig. S12f). Additionally, the comparison between case 1 and 2 suggests that a CoarseAPS particle concentration of less than 20 particles std L−1 is a more conservative evaluation standard to diagnose (HAC)2 inside the FT compared with the criterion of an SMPS N>95 nm value of less than 100 std cm−3 (also see Sect. 2.4). In addition to the differences between the vertical particle sources for case 1 and case 2, we note that the average wind speed decreases from ∼13 m s−1 (case 1) to 6 m s−1 (case 2) (not shown), which would decrease the emission rate of ABCWIBS particles from near-ground sources, such as soils and trees.
When (HAC)2 is around the PBL and close to the cloud top (case 3), the CoarseAPS particle concentration increases to a level larger than 20 particles std L−1 (Fig. S12b) due to the increased influence from PBL aerosols. The adoption of aerosols from the PBL is supported by occasional updraughts (as shown in Fig. 11b) and by the increasing SMPS N>95 nm (close to 100 std cm−3). For the two scenarios in which (HAC)2 is in the PBL with and without precipitation/clouds (case 4 and 5 respectively), the CoarseAPS particle concentration is well above 20 particles std L−1. The presence of precipitation/clouds leads to a decrease in the CoarseAPS particle concentration, showing a decreased median value from 414.1 to 330.2 particles std L−1 (Fig. S12b). This suggests the wet removal effects of precipitation on coarse-mode particles in the PBL. However, the presence of precipitation/clouds causes an increase in SMPS N<95 nm particles (Figs. S11, 11c and S12c), suggesting that the effect of precipitation/clouds in the PBL may also include new particle formation (Khadir et al., 2023).
In general, it can be summarized that the CoarseAPS particle concentration increases when (HAC)2 is deeper inside the PBL (indicated by a larger SMPS N>95 nm; Fig. S12b), suggesting that the PBL is the major source of aerosol particles at (HAC)2 on 23 November. With increased influences from the PBL, the increases in both ABCWIBS and eBC particles (Fig. S12e and f) suggest that ABCWIBS particles are related to biological particles and that eBC emissions are mainly from the PBL. However, the occurrence of precipitation/clouds in the PBL leads to a decrease in ABCWIBS particles, which is the inverse of the effect on aerosols in the FT (see Sect. 3.1.2). This may result from the wet removal effects of precipitation/clouds on ABCWIBS particles that may dominate over any production of ABCWIBS from precipitation splash (Khadir et al., 2023). The occurrence of precipitation/clouds in the PBL results in a small decrease in eBC mass (Fig. S12f), from 0.07 to 0.05 µg std m−3 (median), suggesting the slight wet deposition of eBC particles during precipitation/cloudy periods.
3.3.3 INPs observed under different scenarios
The INP concentration for (HAC)2 in the FT with precipitation (case 1) in Fig. 12a shows a median value of 1.0 particle std L−1, consistent with Fig. 9a for the case of (HAC)2 in the FT with precipitation/clouds sampled from the other similar periods during CALISHTO. Compared with case 1 (Fig. 12a), case 2 shows a slightly lower INP concentration (median value of 0.6 particles std L−1), which is attributed to the decreased availability of FluoWIBS and ABCWIBS particles (Figs. 11e, S12d and S12e). The results also show that FluoWIBS and ABCWIBS particles are more important sources of potential INPs than CoarseAPS, given that a 10-fold increase in CoarseAPS particles does not lead to an increase in INPs for case 2.
When (HAC)2 is around the PBL and close to the cloud top (case 3), it shows an increase in INPs compared with both case 1 and case 2 when (HAC)2 is in the FT. The increase in INPs may be attributed to the increased availability of FluoWIBS and ABCWIBS particles (and probably CoarseAPS particles as well). When (HAC)2 is in the PBL (case 4), the INP concentration reaches a peak during the day, with a median of 7.2 particles std L−1. A short period of cloudiness around (HAC)2 after 18:00 LT and the presence of precipitation/clouds at (HAC)2 (in the PBL) around 19:00 LT lead to a decrease in INPs (Fig. 11), likely because of the wet removal effects on aerosols particles. This is different from the results presented in Fig. 9a that show enriched INPs after a period of precipitation/clouds. The different INP changes caused by precipitation in the FT and in the PBL can be attributed to the corresponding increase and decrease in ABCWIBS particles in the FT (Fig. 9f) and in the PBL (Fig. S12e), respectively, highlighting the importance of ABCWIBS particles with respect to regulating the INP abundance under different atmospheric conditions. When (HAC)2 is in the FT (Fig. 9a), where background INPs are rare, ABCWIBS particles produced by precipitation may easily play a pronounced role in influencing INP concentrations. In this case, ABCWIBS particles may come from cloud-processed particles released from hydrometeors in the precipitation/clouds (Prenni et al., 2013), biological particles or soil dust containing biological components produced by precipitation upon impact with the vegetation or soil surface (Conen et al., 2011, 2017). In contrast, precipitation- or cloud-enriched INPs comprise a small proportion of the total INPs when (HAC)2 is in the PBL (Fig. 12). Instead, the wet removal effect of precipitation/clouds for (HAC)2 in the PBL may play the major role and remove some ABCWIBS particles in the coarse mode that might be active INPs. Therefore, the overall effect of precipitation/clouds on INPs observed at (HAC)2 for temperatures around −24.2 °C (Fig. 11f) shows a decrease when (HAC)2 lies within the PBL.
Figure 12 also shows that the INP concentration observed at (HAC)2 on 23 November generally has a significantly positive correlation with the CoarseAPS, FluoWIBS and ABCWIBS particle concentration. The concentration of CoarseAPS particles is generally >20 times (>65 % in Fig. 12b) higher than that of INPs. Moreover, 66 % of INP concentration values are lower than those of FluoWIBS (Fig. 12c), whereas 68 % of INP concentration values are higher than those of ABCWIBS (Fig. 12d). These results mean that INPs are from coarse particles (>1.0 µm) showing fluorescence, and ABCWIBS particles are not the only source of INPs.
3.4 INP parameterization
3.4.1 Predicting INPs observed at Mount Helmos using published parameterizations
A variety of parameterizations, as summarized in Table 1, have been proposed to estimate NINP using aerosol properties, such as particle number concentration and particle surface area. We evaluate their ability to reproduce the observed NINP at Mount Helmos. Here, we note that FluoWIBS is used to substitute the nFBAPs (the number concentration of fluorescent aerosol particles monitored by a UV-APS) used in Tobo et al. (2013). The predictability of those parameterizations is evaluated by comparing NINP observations to the calculated NINP results. The evaluation of the predictability of each INP parameterization (in Table 1) for INPs from different INP sources (discussed in Sect. 2.4) is presented in Figs. S14–S19. In addition, we note that INSEKT INPs evaluated as lower estimations beyond a factor of 5 via comparison with PINE INPs (see Sect. S3) are excluded from the parameterization dataset. The overall consistent trend between INSEKT and PINE data clusters in Figs. 13 and 14 for all INP parameterizations suggests that the filtered INSEKT dataset does not show a discrepancy compared to the PINE dataset and does not influence the INP parameterization development.
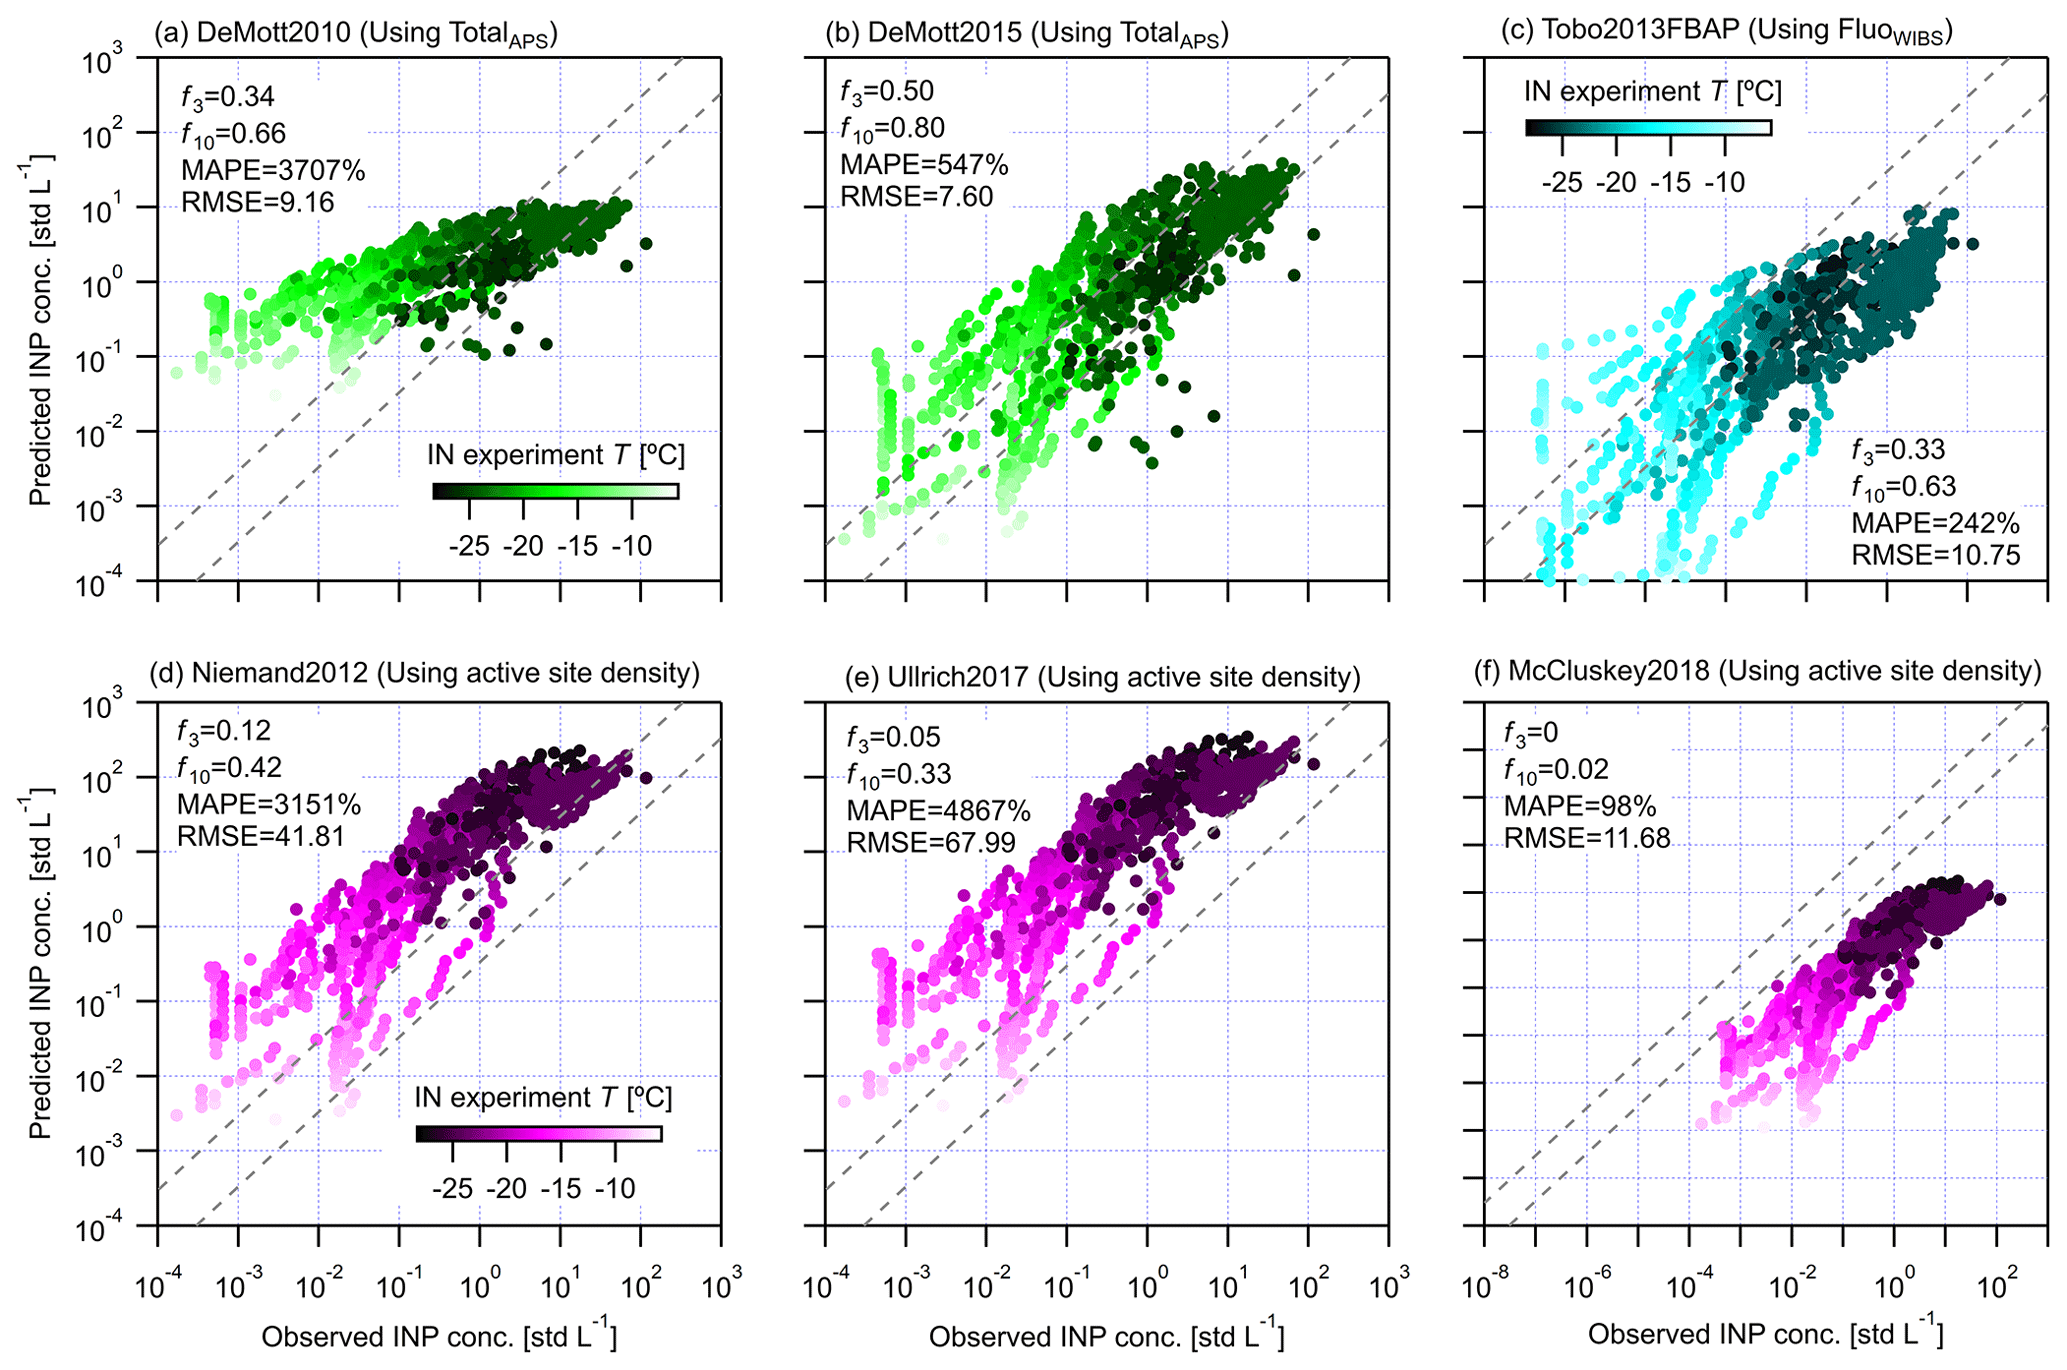
Figure 13Scatter plots of the observed INP concentration and the concentration calculated by parameterizations (in Table 1) from the literature. Panels (a)–(c) show the following parameterizations: (a) DeMott2010, (b) DeMott2015 and (c) Tobo2013FBAP. Here, FluoWIBS is used to substitute nFABPs measured by UV-APS, as used in Tobo et al. (2013). Panels (d)–(f) show the following parameterizations: (d) Niemand2012, (e) Ullrich2017 and (f) McCluskey2018. The temperature condition for INP data is scaled as shown in the colour bar. Parameterizations using the same aerosol properties use the same colour bar. The dashed lines confine the range for observed and predicted data points within a factor of 3. The fractions of observed and predicted data points within a factor of 3 (f3) and 10 (f10) are provided in each panel, respectively. MAPE stands for mean absolute percentage error. RMSE is the root-mean-square error used as a measure of the difference between observed and predicted data.
DeMott2015 can predict 80 % of data points within a factor of 10 compared to observations (Fig. 13b), which is better than DeMott2010 (66 %; Fig. 13a). Generally, more INP data points are overestimated by DeMott2015 than are underestimated (Fig. 13b). For Tobo2013FBAP, we first note that the FluoWIBS particle concentration used in this study is larger than the fluorescent particle concentration measured by UV-APS, as used in Tobo et al. (2013). Such an input difference would have led to an overprediction of INPs if data from Mount Helmos were similar to those observed in Tobo et al. (2013). We find, however, that Tobo2013FBAP generally underestimates INPs at Mount Helmos, especially for temperatures lower than −20 °C when dust particles dominate the INP sources (Fig. S16h and i). This discrepancy may be explained when considering that Tobo2013FBAP was developed based on an INP population of biological particles that activate as ice at warm temperatures ( °C). Thus, given that the abundance of biological particles is lower than that of dust particles, Tobo2013FBAP underestimates INPs originating from dust particles activating ice at lower temperatures. Nevertheless, Tobo2013FBAP is able to agree with 63 % of INP observations in Mount Helmos within 2 orders of magnitude (Fig. 13c).
The results in Fig. 13d–f are based on the subset of data for which both SMPS and APS data (hereafter INPSMPS+APS data) are available. Both Niemand2012 and Ullrich2017 systematically overestimate INPSMPS+APS (Fig. 13d and e); this may be attributed to the database used for the development of both parameterizations (dust samples tested in laboratory studies), which may have exhibited a larger active site density compared with the atmospheric particles investigated in this study. On the contrary, McCluskey2018 systematically underestimates the observed INPSMPS+APS data (Fig. 13f), likely because it is based on sea spray aerosols, which may have a lower active site density compared with the INPs observed in this study.
Of all of the literature parameterizations tested, DeMott2015 is the best with respect to predicting INPs at Mount Helmos. Its comparatively good performance can be attributed to its larger and more inclusive database from both laboratory and field experiments. Therefore, DeMott2015 will be adapted in Sect. 3.4.2 to optimize its applicability for Mount Helmos by proposing new parameters.
3.4.2 Parameterizations for INPs using the CALISHTO data
Nine parameterizations using different aerosol properties are developed (Table 3), including parameterizations adapted from the literature and proposed parameterizations depending on the observed relations between INPs and aerosol properties. We first adapt the DeMott2015 parameterization with a new set of parameters calculated by fitting the formula to the relevant data collected at Mount Helmos (hereafter “Helmos DeMott2015”). Considering that the IN ability of aerosol sources shows a significant correlation with the CoarseAPS-to-FineAPS ratio (Fig. 10c), the ratio, termed “APSratio” hereafter, is included in a new INP parameterization termed “Helmos TotalAPS”. We also adapt Tobo2013FBAP with new parameters, and it will be compared to a new parameterization that we develop (termed “Helmos FluoWIBS”) that predicts INPs as a function of FluoWIBS, WIBSratio (FluoWIBS to NonFluoWIBS) and T. Compared with Tobo2013FBAP, the new factor “(WIBSratio)(eT+f)” in Helmos FluoWIBS is used to capture the contribution of fluorescent particles to the observed INPs at different temperatures. Given that FluoWIBS may not include all potential INPs (especially for °C, where nonbiological particles dominate), we propose two parameterizations (“Helmos TotalWIBS_1” and “Helmos TotalWIBS_2”) using TotalWIBS to represent aerosol particles that may serve as sources of INPs. Both parameterizations depend on TotalWIBS, WIBSratio and T but have different formula forms. Compared with DeMott2015 and DeMott2010, Helmos TotalWIBS_1 and Helmos TotalWIBS_2 also consider the effect of fluorescent particle portioning in different INP sources by using the corresponding factor including WIBSratio. Moreover, TotalSMPS+APS is used as the input for INP source particles to calculate NINP to include potentials in a larger size range, given that particles smaller than 0.5 µm may also be relevant for INPs (Kanji et al., 2017). With and without including the ratio of CoarseAPS to FineSMPS+APS particles (SMPS_APSratio), two parameterizations (“Helmos TotalSMPS+APS_1” and “Helmos TotalSMPS+APS_2”, using a similar formula to that of DeMott2015 and DeMott2010, respectively) are proposed to calculate NINP based on TotalSMPS+APS and T. We also provide parameters for a surface-area-based parameterization (“Helmos SSMPS+APS”) using the concept of surface-active sites. In the following, we discuss the performance of the INP parameterizations introduced above (Fig. 14) and evaluate the predictability of each INP parameterization (Figs. S20–S35) for INPs from different INP sources discussed in Sect. 2.4.
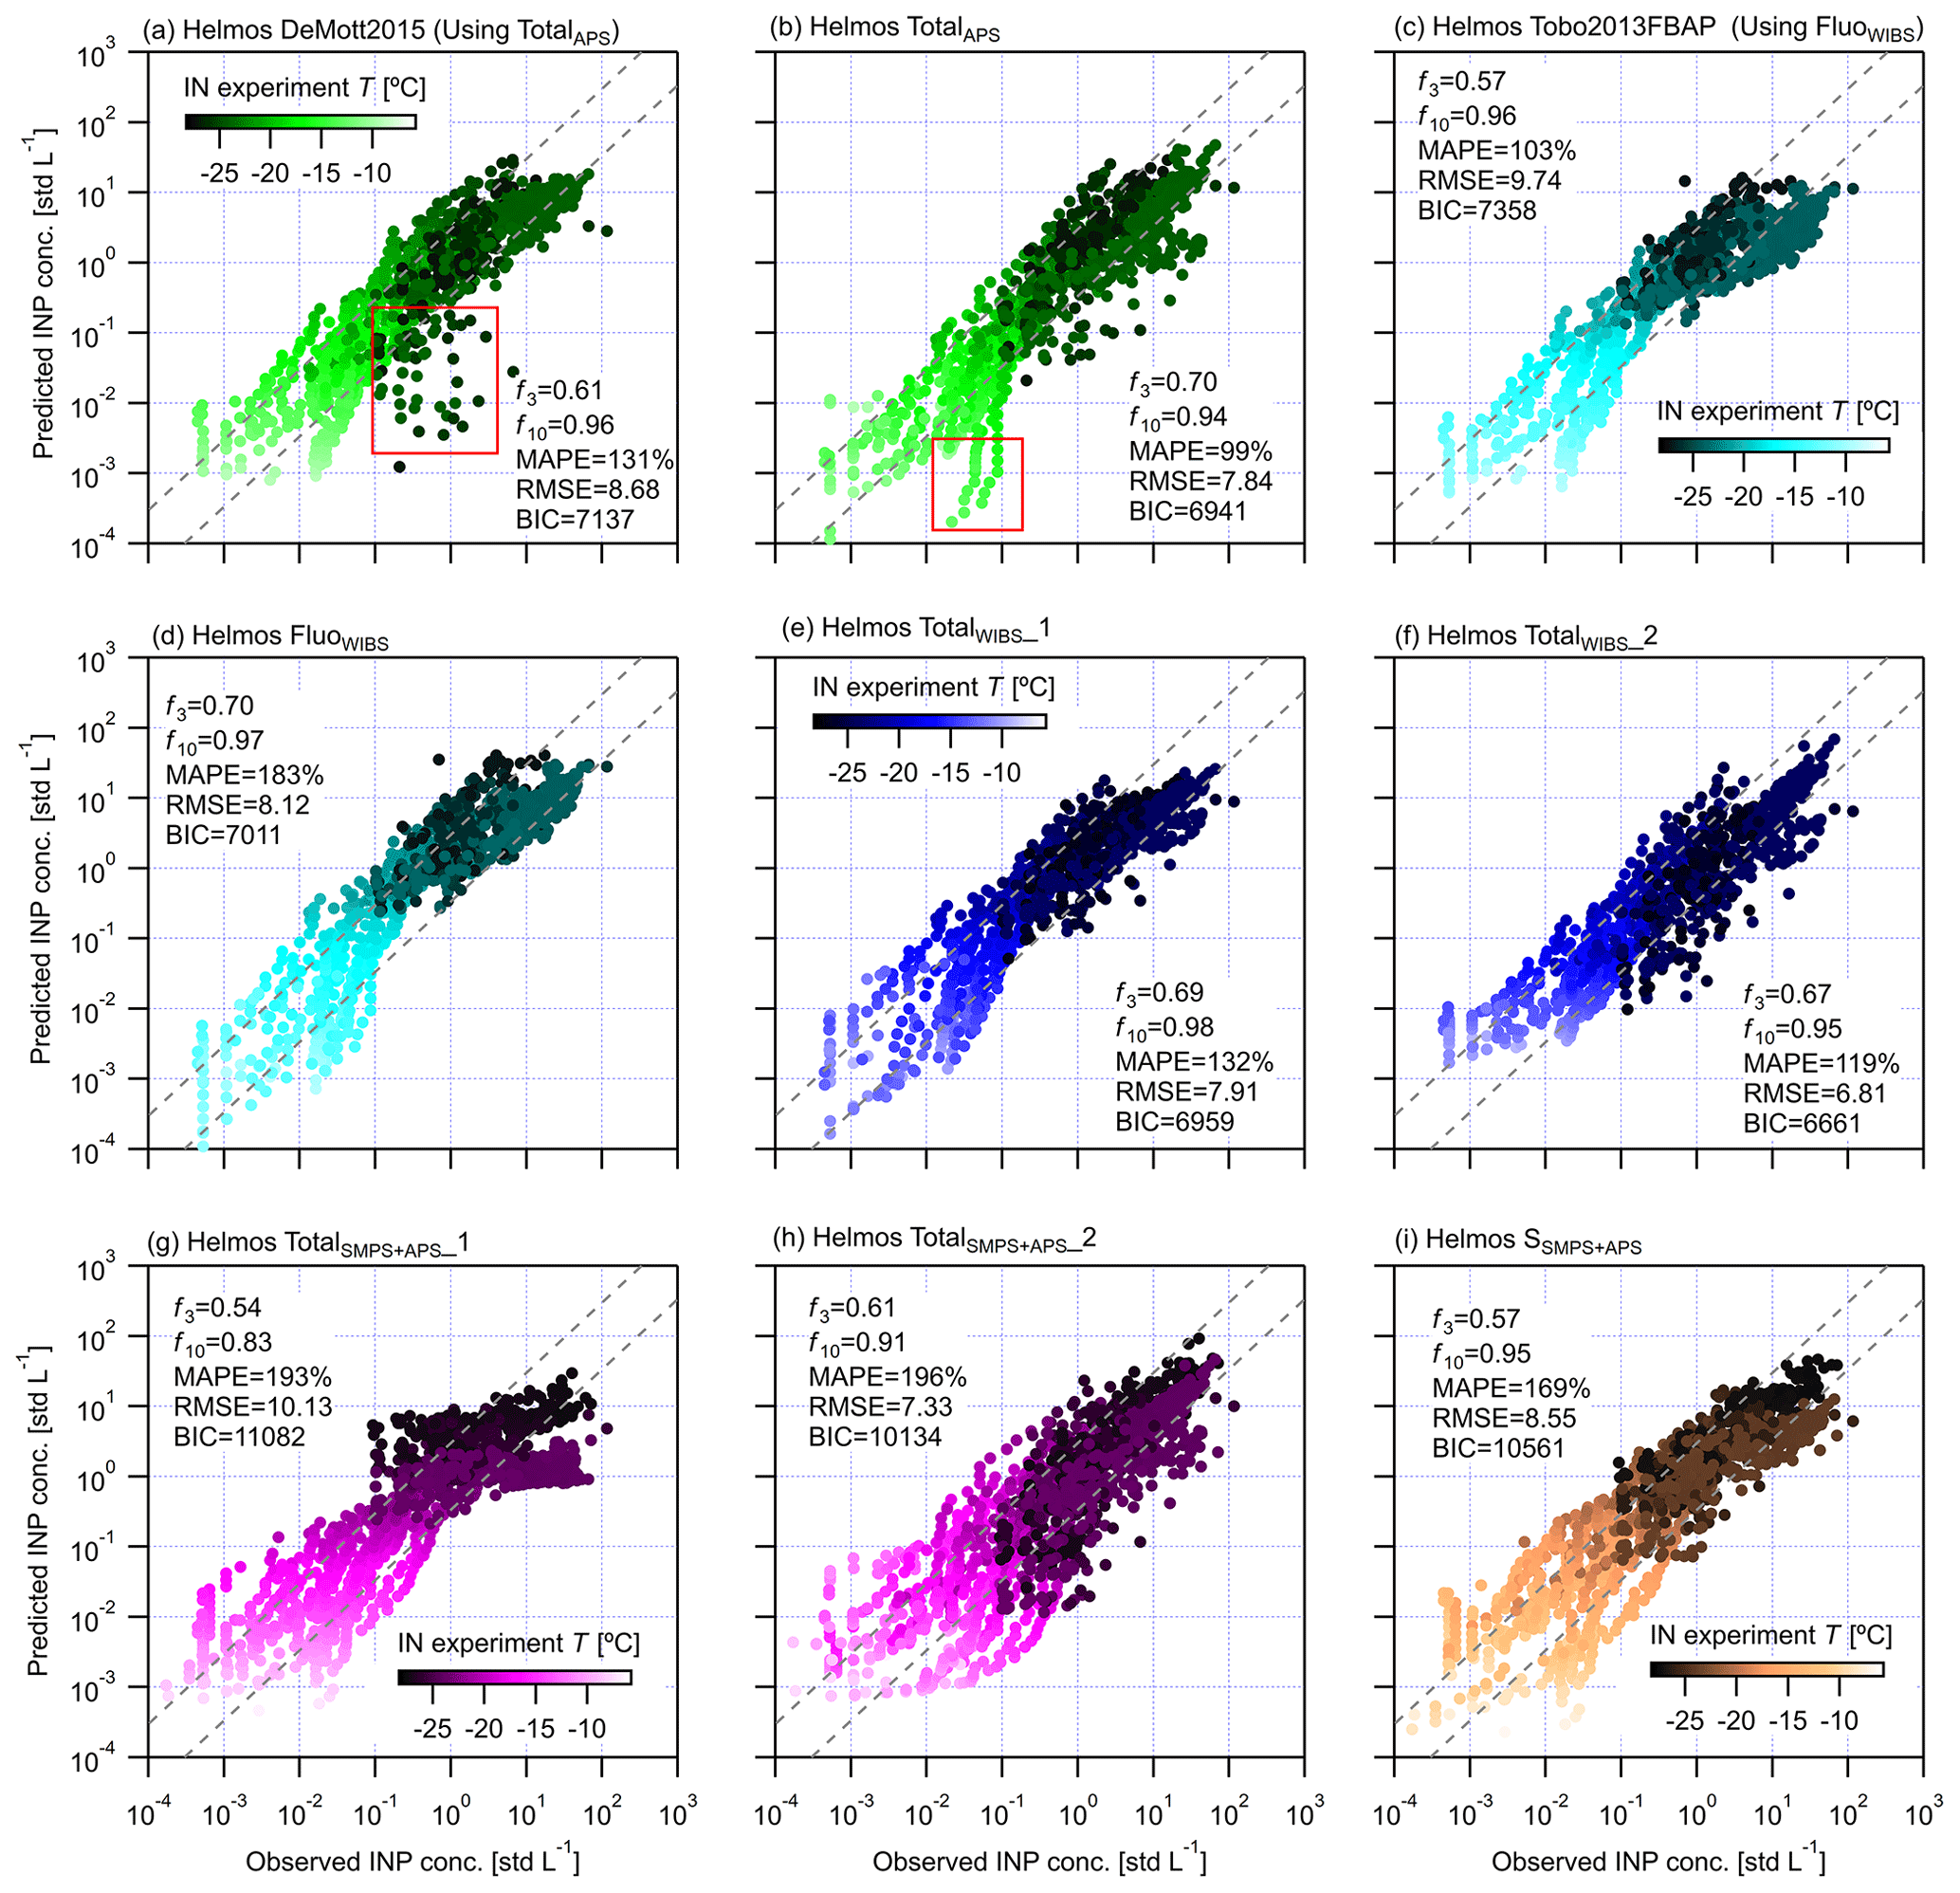
Figure 14Different parameterizations for predicting INPs at (HAC)2. Parameterizations in panels (a)–(f) are based on the dataset for which both APS and WIBS are available. Parameterizations in panels (g)–(i) are based on the overlapping APS and WIBS dataset. The parameterization shown in the figure as follows: (a) Helmos DeMott2015, (b) Helmos TotalAPS, (c) Helmos Tobo2013FBAP, (d) Helmos FluoWIBS, (e) Helmos TotalWIBS_1, (f) Helmos TotalWIBS_2, (g) Helmos TotalSMPS+APS_1, (h) Helmos TotalSMPS+APS_2 and (i) Helmos SSMPS+APS. The temperature condition for INP data is scaled as shown in the colour bar. Note that parameterizations using the same aerosol properties use the same colour bar. The dashed lines confine the range for observed and predicted data points within a factor of 3. The fraction of observed and predicted data points within a factor of 3 (f3) and 10 (f10) is provided in each panel, respectively. MAPE stands for mean absolute percentage error. RMSE is the root-mean-square error used as a measure of the difference between observed and predicted data. BIC is a value calculated by applying the Bayesian information criteria to evaluate the goodness of fit of parameterizations based on the same dataset (Schwarz, 1978).
Table 3Different parameterizations proposed for predicting INPs at Mount Helmos.
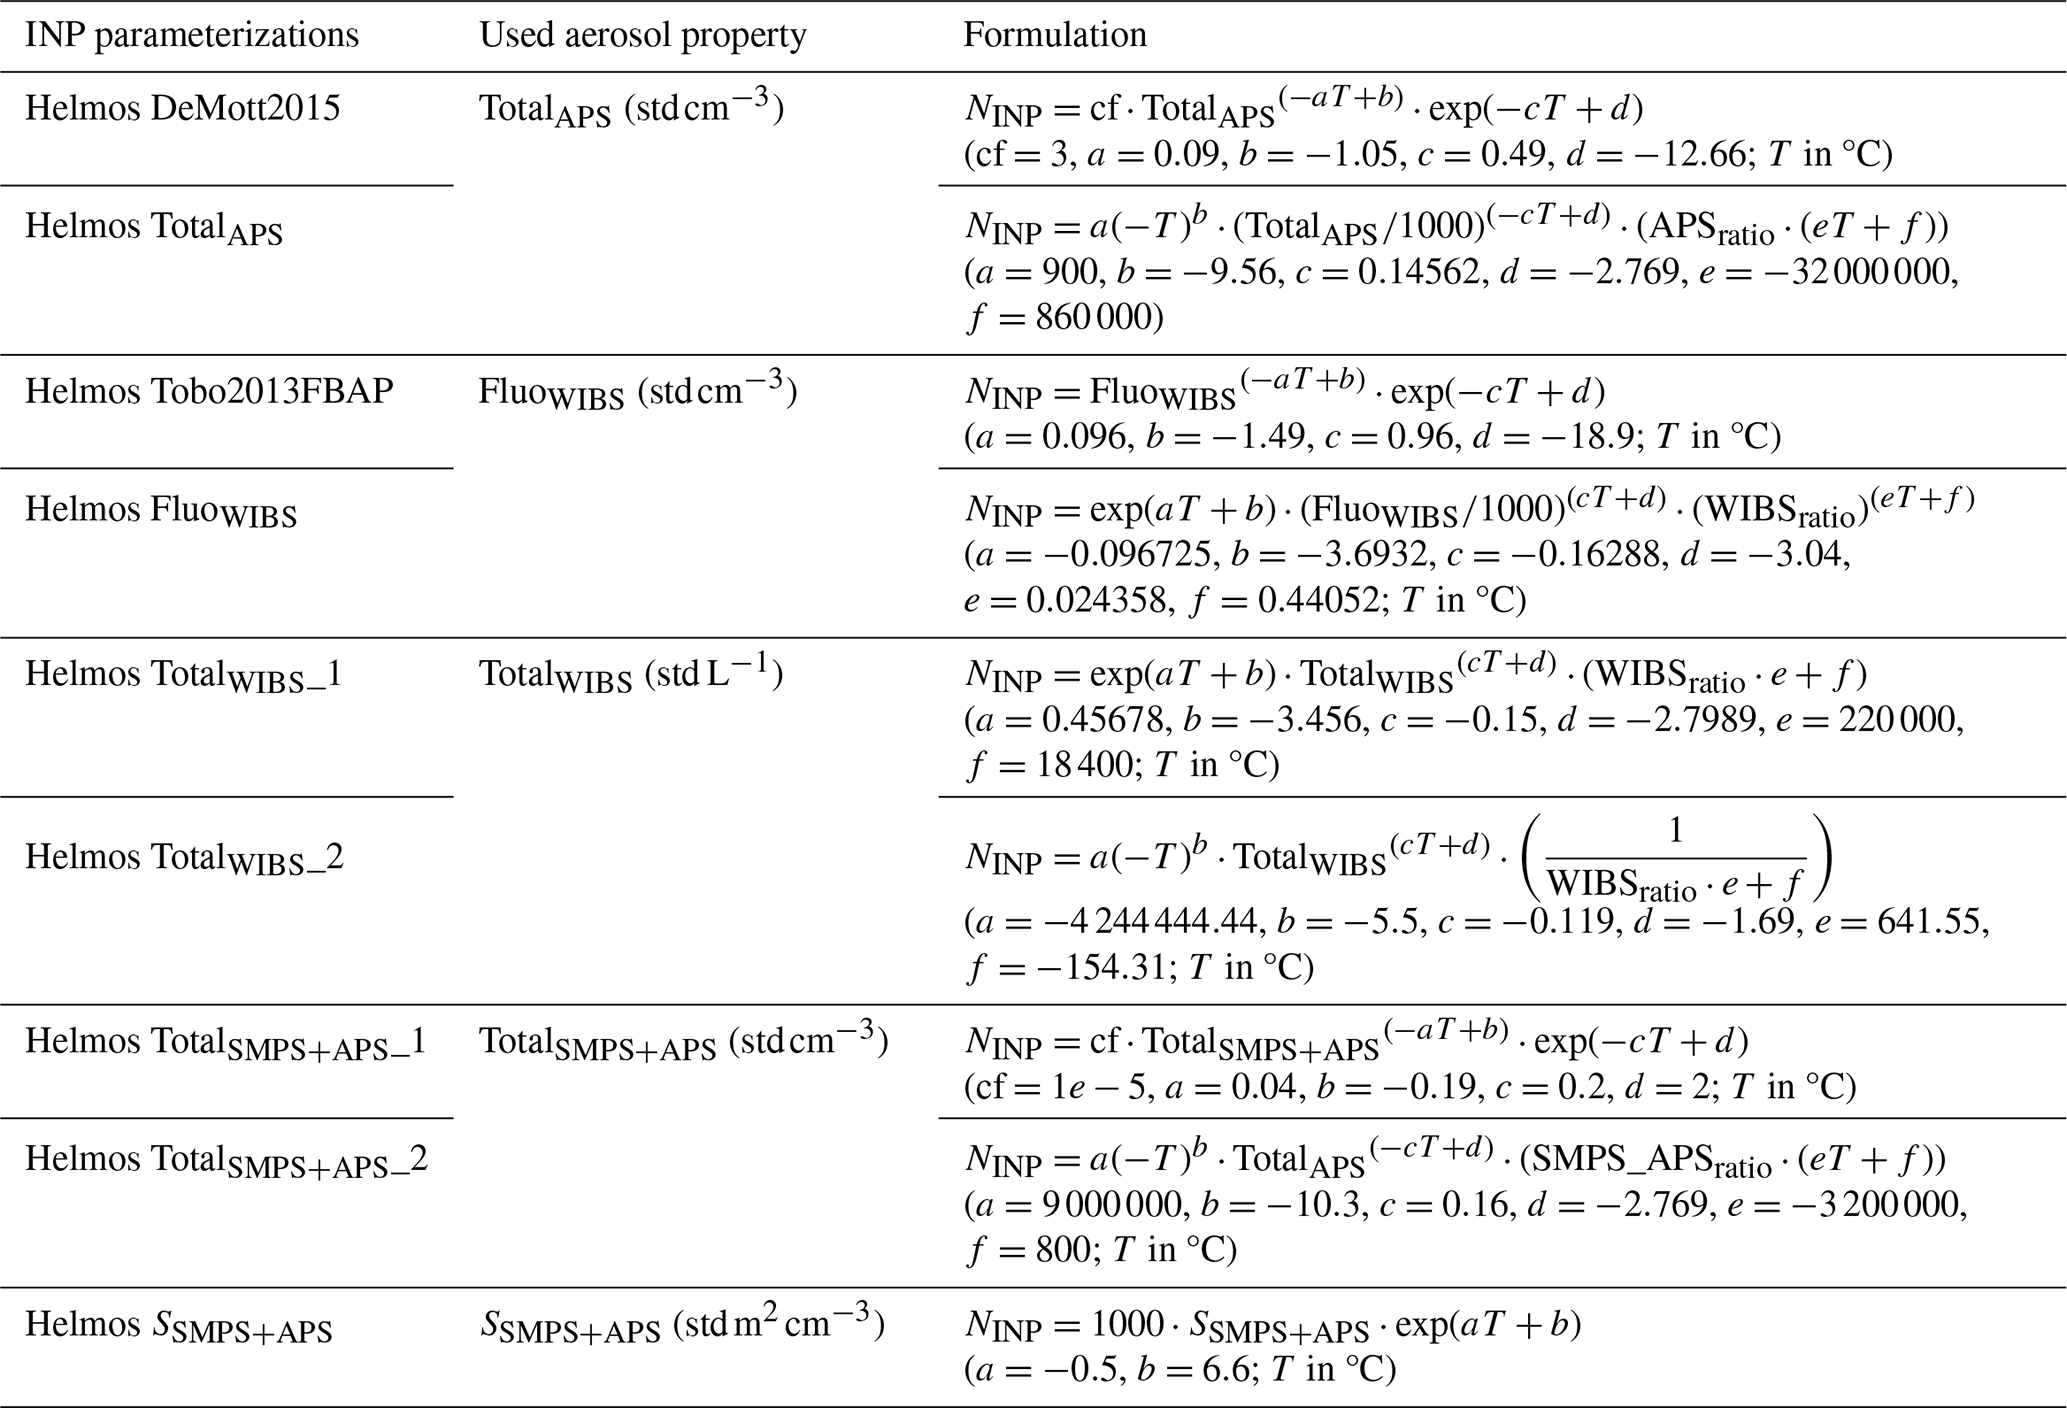
Note: APSratio is the ratio of CoarseAPS to FineAPS particle concentration, WIBSratio is the ratio of FluoWIBS to NonFluoWIBS particle concentration and SMPS_APSratio is the ratio of CoarseAPS to FineSMPS+APS particle concentration.
3.4.3 INP parameterizations using the TotalAPS particle concentration
The results in Fig. 14a and b compare the predictability of Helmos DeMott2015 and Helmos TotalAPS. After adaption, the percentage of NINP data points within 2 orders of magnitude compared to observations increases by 16 % for Helmos DeMott2015 (96 %; Fig. 14a) in comparison to DeMott2015 (80 %; Fig. 13a). Furthermore, ∼11 % of the 16 % comes from the predictions of NINP values within a factor of 3 compared to the observations. However, Helmos DeMott2015 does not show improvement with respect to predicting INPs for aerosol sources in the FT, as indicated by the underestimated values in the red square in Fig. 14a (also Fig. S20b and c). In particular, as shown in Fig. S20c, only 41 % of predictions from Helmos DeMott2015 are within a factor of 10 compared to the observations when (HAC)2 is in the FT with the influence of precipitation/clouds. Figure 14b shows that the consideration of the APSratio in the Helmos TotalAPS parameterization can improve its predictability by increasing the f3 from 0.61 to 0.70, compared with Helmos DeMott2015. Moreover, the lower mean absolute percentage error (MAPE), root-mean-square error (RMSE) and Bayesian information criteria (BIC) values of Helmos TotalAPS suggest its slightly better performance than Helmos DeMott2015, by showing a smaller deviation, a smaller overall error and a larger formula goodness of fit, respectively. However, Helmos TotalAPS cannot predict INPs within the f10 range at warm temperatures ( °C), probably due to biological particles from continental aerosols (Garcia et al., 2012; Pummer et al., 2015), as marked by the red square in Fig. 14b. Those data points are from two INSEKT filter samples collected on 28 and 29 October when (HAC)2 is affected by continental aerosols (Fig. S21i).
3.4.4 INP parameterizations using the FluoWIBS particle concentration
With a new set of parameters, Helmos Tobo2013FABP in Fig. 14c shows improved predictability with respect to NINP, displaying increased (f3 and f10 by 0.24 and 0.33, respectively) in comparison with Tobo2013FABP in Fig. 13c. This suggests that the INP populations observed at Mount Helmos might have different IN abilities from those observed in Tobo et al. (2013). After incorporating WIBSratio into Helmos FluoWIBS, the parameterization can further increase the f3 predictability to 0.70 (Fig. 14d) compared with Helmos Tobo2013FABP. Moreover, Helmos FluoWIBS shows lower RMSE and BIC values, suggesting a slightly better fitting goodness. On the other hand, Helmos FluoWIBS shows a larger MAPE value, which is due to its more scattered predictions with respect to INPs at warm temperatures ( °C).
3.4.5 INP parameterizations using the TotalWIBS particle concentration
Helmos TotalWIBS_1 and TotalWIBS_2 show comparable f3 and f10 predictions, larger than 0.67 and 0.95, respectively (Fig. 14e and f). Compared with Helmos TotalWIBS_1, Helmos TotalWIBS_2 shows smaller MAPE and RMSE values, suggesting an overall slightly smaller deviation in NINP predictions. Except for INPs from the source of South dust in the PBL after marine aerosols, Helmos TotalWIBS_1 can predict NINP from the other sources with an f10 larger than 97 % (Fig. S24). The exceptional performance for the source of South dust in the PBL after marine aerosols may be due to the limited observations, for which other parameterizations show similar results (see results in Sect. S9). Compared with Helmos TotalWIBS_1, the slightly overall lower f3 and f10 predictability of Helmos TotalWIBS_2 is because of its relatively poor predictions for INPs from the source of aerosols in the FT with precipitation/clouds (Fig. S25c).
3.4.6 INP parameterizations using the TotalSMPS+APS particle concentration
Figure 14g shows an f3 and f10 prediction of 0.54 and 0.83, respectively, for Helmos TotalSMPS+APS_1. Its NINP prediction skill is the lowest amongst the parameterizations shown in Fig. 14, possibly due to its poor ability to predict dust INPs (Fig. S26h). Compared with Helmos TotalSMPS+APS_1, the inclusion of SMPS_APSratio into Helmos TotalSMPS+APS_2 helps the parameterization to capture INPs from different particle populations and increases the f10 prediction by 7 % (Fig. 14h). Predictions from Helmos TotalSMPS+APS_2 also show a more symmetric distribution around the 1:1 line. However, Helmos TotalSMPS+APS_2 shows a decreased predictability for INPs from the source of aerosols in the FT with precipitation/clouds (f3=0.10 and f10=0.48 in Fig. S27c) compared with Helmos TotalSMPS+APS_1 (f3=0.86 and f10=1.0 in Fig. S26c).
3.4.7 INP parameterizations using the SSMPS+APS total particle surface area
The parameterization based on active site density (Young, 1974; DeMott, 1994; Connolly et al., 2009) is expressed as a function of T and the particle surface area (SSMPS+APS). Compared with Niemand2012, Ullrich2017 and McCluskey2018 (Table 1), the parameter b for Helmos SSMPS+APS (Table 3) is adjusted to obtain a better prediction, which enables Helmos SSMPS+APS to predict more than 90 % of data points within a factor of 10 compared to observations (Fig. 14). Helmos SSMPS+APS can also predict INPs from different aerosol sources with an f10 larger than 93 % (Fig. S28), except INPs sourced from South dust in the PBL after marine aerosols.
3.4.8 Summary of the parameterizations and recommendations
All of the parameterizations presented in Fig. 14 can predict >80 % of the measured INP concentrations at Mount Helmos within a factor of 10 of all observations of the corresponding dataset (see the caption of Fig. 14). Comparing all parameterizations with the same data subset in Fig. 14, four newly proposed parameterizations, including Helmos TotalAPS, Helmos FluoWIBS, Helmos TotalWIBS_1 and Helmos TotalWIBS_2, show f3 and f10 predictions of approximately 70 % and 95 %, respectively. The superior performance of these four parameterizations is likely due to the incorporation of aerosol particle ratios that are implicitly linked to specific particle types with distinct INP characteristics, thereby leading to better predictions of IN activity of particles. Helmos TotalWIBS_2 has the smallest BIC value, suggesting it may have the highest overall optimality in terms of the model dimension and the maximum likelihood of the prediction (Schwarz, 1978). Notably, only Helmos TotalWIBS_1 can predict INPs from all different sources with an f10 prediction larger than 95 %, which suggests its broad applicability for INPs from various sources. In addition, we further evaluate and compare parameterizations in Fig. 14a–f by using them to predict a larger dataset than the subset of data used for their development (Figs. S29–S35). The results suggest that Helmos TotalWIBS_1 outperforms the others by showing an f10 INP prediction that is larger than 95 % for all aerosol sources (except INPs sourced from South dust in the PBL after marine aerosols) as well as for the larger testing dataset (Fig. S34); hence, it is the parameterization of choice for models that can constrain all of the required input. Without including aerosol fluorescent properties, the results in both Fig. S30d (for Helmos DeMott2015) and Fig. S31d (Helmos TotalAPS) suggest that INP parameterizations considering only APS data cannot predict INPs from continental aerosols at warm temperatures, which are likely of biological origin. If considering only the aerosol particle number concentration for INP prediction, Helmos Tobo2013FBAP outperforms Helmos DeMott2015 and Helmos TotalSMPS+APS_1 (Fig. S22) with respect to predicting more than 90 % of INPs from different sources, although it shows an f10 of 0.5 for the dust case.
Here, we study the characteristics of different aerosol sources and their INP abundances in mixed-phased clouds at the high-altitude Helmos Hellenic Atmospheric Aerosol and Climate Change station, (HAC)2, Mount Helmos, Greece, during the Cloud–AerosoL InteractionS in the Helmos background TropOsphere (CALISHTO) campaign for a period between October and November 2021. INPs were measured for °C with online (PINE, all IN mechanisms) and offline (INSEKT, immersion freezing mode) techniques. The relationship between INPs and different aerosol particle types was unravelled to understand the ice formation ability of particles from different aerosol sources. Specific INP source apportionment was carried out using a synergy of in situ aerosol property characterization measurements, remote-sensing measurements and modelling experiments. The relative position of (HAC)2 in the atmosphere with respect to the planetary boundary layer (PBL) was determined using both PBL height results from a pulsed Doppler scanning lidar system (HALO) and the number concentration of particles larger than 95 nm measured by a scanning mobility particle sizer (SMPS N>95 nm), so as to differentiate the air mass sampled from the PBL to free troposphere (FT). The presence of precipitation/clouds at (HAC)2 was also monitored by a wideband Doppler spectral zenith profiler (WProf) radar using the radar equivalent reflectivity factor (Ze) and mean Doppler velocity (MDV). The size distribution (SMPS and APS, aerodynamic particle sizer), optical properties (nephelometer) and chemical composition (ToF-ACSM, time-of-flight aerosol chemical speciation monitor) of different aerosol particle populations were characterized when analysing the footprints and back trajectories of aerosol particles using FLEXPART and HYSPLIT results. Such a comprehensive synthesis for the purpose of INP source apportionment is not often reported in the literature. We conclude the following key findings:
-
Specific and detailed INP source apportionment was achieved, as demonstrated by the distinct characteristics of different sources, including continental aerosols, marine aerosols, dust aerosols, and a mixture of continental and dust aerosols. Fine particles (<1.0 µm) dominate continental aerosols, leading to an Ångström exponent (α) larger than 2.0, whereas coarse particles (>1.0 µm) comprise a substantial proportion of dust aerosols, showing a fairly constant α of approximately 1.0. Marine aerosols show the highest content of Cl−. The distinction of different aerosols is also indicated by their different particle portioning conditions, such as the fine-to-coarse particle ratio and fluorescent-to-nonfluorescent particle ratio.
-
In addition to the PBLH and SMPS N>95 nm used to diagnose the PBL conditions of the observation site, we note that a threshold value of 20 particles std L−1 for the CoarseAPS particle concentration can be used as a more conservative standard to qualitatively examine the observation site conditions with respect to the PBL. A higher or lower (compared to 20 particles std L−1) value than the threshold indicates that the observation site is inside or outside the PBL, respectively. Under strictly defined FT conditions without the influence of local and remote aerosols, i.e. background conditions, only 1 in 1×10⁶ of all aerosol particles acts as an INP for ± 1.0 °C. Additionally, we note that the INP abundance is also regulated by the property of relevant aerosol source and meteorological conditions, e.g. precipitation (Testa et al., 2021), in addition to temperatures and FT/PBL scenarios.
-
Notably, the particle properties and INP abundance of different aerosol sources also depend on the atmospheric conditions, i.e. the relative position with respect to the PBL. Compared with the conditions in the PBL, continental aerosols in the FT contain less particles. In particular, the decrease in coarse particles (>1.0 µm) for continental aerosols in the FT is more significant than the decrease in fine particles (<1.0 µm), which is responsible for its reduced INP abundance compared with the conditions in the PBL. The INP abundance in North continental aerosols is higher than that of background conditions in the FT by more than 1 order of magnitude when the air mass is in the PBL. Marine aerosols above the PBL show a similar INP abundance to that of North continental aerosols above the PBL. Dust-containing aerosols present the highest INP abundance among all sources. When dust is mixed with continental aerosol, the INP abundance decreases due to dilution, deposition and deactivation by atmospheric ageing.
-
The effects of precipitation/clouds lead to a slight decrease in coarse aerosol particles when the observation site is in the FT; however, this results in a small increase in the INP abundance. Such an enrichment in INPs is attributed to the release of cloud-processed particles and/or near-ground particle production caused by precipitation splash, both of which supply active INPs. On the other hand, the presence of precipitation/clouds results in decreased INP abundance when the observation site is in the PBL due to the wet removal of aerosol particles.
-
The INP attribution results suggest that biological particles from PBL air masses may be important INP sources for continental and marine aerosols, whereas coarse dust particles play the primary role in the observed INPs in dust aerosols. The concentrations of INPs from marine and continental aerosols above the PBL are within a range of a factor of 5 compared to ABCWIBS particles for more than 93 % of the PINE-observed INPs, suggesting that biological particles likely make an important contribution to the activated INPs. For dust-containing sources, biological particles may play a secondary role in the observed INPs after dust particles. We highlight that the fluorescent particle concentration recorded by WIBS (including biological particles and non-biological particles showing fluorescence) is able to describe all PINE-observed INP concentrations (for – −27 °C) within a factor of 5 for more than 80 % of observed data points. Additionally, we note that mineral dust and carbonaceous particles may fluoresce because of some association with biological material or PAHs from combustion. Both eBC and dust particles can be transported over a long distance in the FT.
-
The IN ability of different aerosol sources shows distinguishable characteristics and presents correlations with CoarseAPS and fluorescent particle proportions. The above new findings were used to improve the predictability of INP parameterizations, which predict observed INPs for more than 90 % of data points for all identified INP sources and outperform existing INP parameterizations in the literature. The APS-based INP parameterizations (Helmos TotalAPS in Table 3) show a less satisfactory INP predictability for warm temperatures ( °C) compared with their predictability for cold temperatures ( °C), suggesting their inadequate capability with respect to capturing biological INPs. Using particle fluorescence characteristics can improve INP parameterization predictability at warm temperatures. The parameterization developed from a data subset (∼80 % of observations) was evaluated by predicting all observations with both WIBS and INP data. Considering biological particles that fluoresce and the proportion of those particles, our INP parameterization (Helmos TotalWIBS_1 in Table 3) is able to predict the INP abundance for different sources within a factor of 10 for more than 95 % of data points, thereby outperforming the existing parameterizations in the literature and the others proposed in this study.
-
Existing INP parameterizations in the literature may be improved by including the fluorescent-to-nonfluorescent or coarse-to-fine particle ratios if available. Firstly, regional models, like the mesoscale Weather Research and Forecasting (WRF) model, can use the improved INP parameterizations to calculate the ice formation processes for MPCs which ultimately helps to predict the local weather condition changes, such as storm formation and evolution (Georgakaki et al., 2024). Moreover, published datasets from existing field studies can be reorganized into a large and inclusive database for the development of more general INP parameterizations for MPCs at global scales. By doing so, the predictability and applicability of the developed INP parameterizations for climate models can be improved. In particular, MPC simulations for regions with different INP sources, such as the crossroads of different air masses, like (HAC)2, or for different regions with different prevailing INP sources, such as continental or marine regions, can be better achieved. Ultimately, the regional and global simulations of aerosol–cloud interactions as well as climate modelling can benefit from the improved INP parameterization.
Due to insufficient aerosol particle collection during aerosol sampling and/or filter washing, an underestimation of INPs from INSEKT experiments may partly influence the INP parameterizations. In this regard, INSEKT data, which are analysed as lower estimations by more than a factor of 5 compared with PINE INPs (Sect. 3.4.1), were filtered before use for parameterization. We note that the underestimation of INPs caused by insufficient sampling of aerosol particles for offline INP analysis may also result in a lower estimation of aerosol–cloud interactions for warm temperatures in the MPC regime (e.g. °C); this could have important implications with respect to inducing biases in the microphysical evolution of clouds in models. Therefore, the particle collection efficiency should be evaluated for existing INP data and INP parameterizations in the literature before they are used for climate models. Filter sampling (Conen et al., 2015; Schneider et al., 2021) and liquid impingers (Wieder et al., 2022) have commonly been used to collect INP samples for offline analysis in existing studies. Standard sampling protocols for both methods are required to ensure sampling efficiency inter-comparison. For future studies, we suggest more flexible aerosol sampling strategies for offline INP measurements compared with that used in this study (∼1 d for INSEKT), such as (1) employing automated filter samplers that allow sampling periods to be adjusted according to the changing aerosol particle concentrations or (2) using wet cyclones to collect aerosol particles in liquids. The optimized sampling strategies for offline INP measurements should avoid filter overloading during dust events. To further test and validate the predictability of WIBS data-based INP parameterizations, a larger dataset that spans different seasons and is based on observations at different sites in different regions is required. The further development of WIBS data-based INP parameterizations will be addressed in our following work.
The data presented in this publication are available at https://doi.org/10.16904/envidat.538 (Gao et al., 2024).
The supplement related to this article is available online at: https://doi.org/10.5194/acp-24-9939-2024-supplement.
AN, AP and KE organized the CALISHTO campaign. KuG and AN conceived and led this study. KuG led the analysis; wrote the original manuscript with input from AN; and prepared all of the figures with contributions from RF, ACBR and SV. KuG analysed the data and interpreted the results with input from AN, AP, RF and PG. AN, AP, KE, RF, ACBR, FV, SV, MIG, OZ and PF conducted the experiments and collected the raw data. SV performed FLEXPART simulations. KuG ran HYSPLIT with support from AP. All authors discussed, reviewed and edited the manuscript.
The contact author has declared that none of the authors has any competing interests.
Publisher's note: Copernicus Publications remains neutral with regard to jurisdictional claims made in the text, published maps, institutional affiliations, or any other geographical representation in this paper. While Copernicus Publications makes every effort to include appropriate place names, the final responsibility lies with the authors.
The authors thank Tobias Könemann from the Envicontrol group for providing us with access to a wideband integrated bioaerosol sensor (WIBS). We are also grateful to Ghislain Motos for his help with the IGOR toolkit for WIBS data processing. Athanasios Nenes wishes to acknowledge Hector Angelos Nenes, who assisted with the installation of the WIBS at Mount Helmos.
This research has been supported by the European Research Council “PyroTRACH” project (project no. 726165), funded by H2020-EU.1.1. (ERC); the Swiss National Science Foundation (project no. 192292; “Atmospheric Acidity Interactions with Dust and its Impacts”, AAIDI); the “PANhellnfrastructure for Atmospheric Composition and climatE change” (grant no. MIS 5021516); and the European Union's Horizon Europe “CleanCloud” project (grant no. 101137639). Alexandros Papayannis and Romanos Foskinis received funding from the Basic Research Program PEVE (NTUA; grant no. PEVE0011/2021).
This paper was edited by Yves Balkanski and reviewed by three anonymous referees.
Barahona, D. and Nenes, A.: Parameterizing the competition between homogeneous and heterogeneous freezing in ice cloud formation – polydisperse ice nuclei, Atmos. Chem. Phys., 9, 5933–5948, https://doi.org/10.5194/acp-9-5933-2009, 2009.
Barlow, J. F., Dunbar, T. M., Nemitz, E. G., Wood, C. R., Gallagher, M. W., Davies, F., O'Connor, E., and Harrison, R. M.: Boundary layer dynamics over London, UK, as observed using Doppler lidar during REPARTEE-II, Atmos. Chem. Phys., 11, 2111–2125, https://doi.org/10.5194/acp-11-2111-2011, 2011.
Bates, T. S., Kapustin, V. N., Quinn, P. K., Covert, D. S., Coffman, D. J., Mari, C., Durkee, P. A., De Bruyn, W. J., and Saltzman, E. S.: Processes controlling the distribution of aerosol particles in the lower marine boundary layer during the First Aerosol Characterization Experiment (ACE 1), J. Geophys. Res.-Atmos., 103, 16369–16383, https://doi.org/10.1029/97jd03720, 1998.
Beall, C. M., Hill, T. C. J., DeMott, P. J., Köneman, T., Pikridas, M., Drewnick, F., Harder, H., Pöhlker, C., Lelieveld, J., Weber, B., Iakovides, M., Prokeš, R., Sciare, J., Andreae, M. O., Stokes, M. D., and Prather, K. A.: Ice-nucleating particles near two major dust source regions, Atmos. Chem. Phys., 22, 12607–12627, https://doi.org/10.5194/acp-22-12607-2022, 2022.
Bergeron, T.: On the physics of clouds and precipitation, in: Proces Verbaux de l'Association de Météorologie, International Union of Geodesy and Geophysics, 156–178, https://cir.nii.ac.jp/crid/1573105975504427392 (last access: 5 September 2024), 1935.
Billault-Roux, A.-C., Grazioli, J., Delanoë, J., Jorquera, S., Pauwels, N., Viltard, N., Martini, A., Mariage, V., Le Gac, C., Caudoux, C., Aubry, C., Bertrand, F., Schwarzenboeck, A., Jaffeux, L., Coutris, P., Febvre, G., Pichon, J. M., Dezitter, F., Gehring, J., Untersee, A., Calas, C., Figueras i Ventura, J., Vie, B., Peyrat, A., Curat, V., Rebouissoux, S., and Berne, A.: ICE GENESIS: Synergetic Aircraft and Ground-Based Remote Sensing and In Situ Measurements of Snowfall Microphysical Properties, B. Am. Meteorol. Soc., 104, E367–E388, https://doi.org/10.1175/bams-d-21-0184.1, 2023.
Bjordal, J., Storelvmo, T., Alterskjær, K., and Carlsen, T.: Equilibrium climate sensitivity above 5 °C plausible due to state-dependent cloud feedback, Nat. Geosci., 13, 718–721, https://doi.org/10.1038/s41561-020-00649-1, 2020.
Bond, T. C., Doherty, S. J., Fahey, D. W., Forster, P. M., Berntsen, T., DeAngelo, B. J., Flanner, M. G., Ghan, S., Kärcher, B., Koch, D., Kinne, S., Kondo, Y., Quinn, P. K., Sarofim, M. C., Schultz, M. G., Schulz, M., Venkataraman, C., Zhang, H., Zhang, S., Bellouin, N., Guttikunda, S. K., Hopke, P. K., Jacobson, M. Z., Kaiser, J. W., Klimont, Z., Lohmann, U., Schwarz, J. P., Shindell, D., Storelvmo, T., Warren, S. G., and Zender, C. S.: Bounding the role of black carbon in the climate system: A scientific assessment, J. Geophys. Res.-Atmos., 118, 5380–5552, https://doi.org/10.1002/jgrd.50171, 2013.
Boose, Y., Baloh, P., Plötze, M., Ofner, J., Grothe, H., Sierau, B., Lohmann, U., and Kanji, Z. A.: Heterogeneous ice nucleation on dust particles sourced from nine deserts worldwide – Part 2: Deposition nucleation and condensation freezing, Atmos. Chem. Phys., 19, 1059–1076, https://doi.org/10.5194/acp-19-1059-2019, 2019.
Brunner, C., Brem, B. T., Collaud Coen, M., Conen, F., Hervo, M., Henne, S., Steinbacher, M., Gysel-Beer, M., and Kanji, Z. A.: The contribution of Saharan dust to the ice-nucleating particle concentrations at the High Altitude Station Jungfraujoch (3580 m a.s.l.), Switzerland, Atmos. Chem. Phys., 21, 18029–18053, https://doi.org/10.5194/acp-21-18029-2021, 2021.
Burrows, S. M., McCluskey, C. S., Cornwell, G., Steinke, I., Zhang, K., Zhao, B., Zawadowicz, M., Raman, A., Kulkarni, G., China, S., Zelenyuk, A., and DeMott, P. J.: Ice-Nucleating Particles That Impact Clouds and Climate: Observational and Modeling Research Needs, Rev. Geophys., 60, e2021RG000745, https://doi.org/10.1029/2021rg000745, 2022.
Collaud Coen, M., Andrews, E., Aliaga, D., Andrade, M., Angelov, H., Bukowiecki, N., Ealo, M., Fialho, P., Flentje, H., Hallar, A. G., Hooda, R., Kalapov, I., Krejci, R., Lin, N.-H., Marinoni, A., Ming, J., Nguyen, N. A., Pandolfi, M., Pont, V., Ries, L., Rodríguez, S., Schauer, G., Sellegri, K., Sharma, S., Sun, J., Tunved, P., Velasquez, P., and Ruffieux, D.: Identification of topographic features influencing aerosol observations at high altitude stations, Atmos. Chem. Phys., 18, 12289–12313, https://doi.org/10.5194/acp-18-12289-2018, 2018.
Conen, F., Morris, C. E., Leifeld, J., Yakutin, M. V., and Alewell, C.: Biological residues define the ice nucleation properties of soil dust, Atmos. Chem. Phys., 11, 9643–9648, https://doi.org/10.5194/acp-11-9643-2011, 2011.
Conen, F., Rodríguez, S., Glin, C. H., Henne, S., Herrmann, E., Bukowiecki, N., and Alewell, C.: Atmospheric ice nuclei at the high-altitude observatory Jungfraujoch, Switzerland, Tellus B, 67, 25014, https://doi.org/10.3402/tellusb.v67.25014, 2015.
Conen, F., Eckhardt, S., Gundersen, H., Stohl, A., and Yttri, K. E.: Rainfall drives atmospheric ice-nucleating particles in the coastal climate of southern Norway, Atmos. Chem. Phys., 17, 11065–11073, https://doi.org/10.5194/acp-17-11065-2017, 2017.
Connolly, P. J., Möhler, O., Field, P. R., Saathoff, H., Burgess, R., Choularton, T., and Gallagher, M.: Studies of heterogeneous freezing by three different desert dust samples, Atmos. Chem. Phys., 9, 2805–2824, https://doi.org/10.5194/acp-9-2805-2009, 2009.
Crawford, I., Ruske, S., Topping, D. O., and Gallagher, M. W.: Evaluation of hierarchical agglomerative cluster analysis methods for discrimination of primary biological aerosol, Atmos. Meas. Tech., 8, 4979–4991, https://doi.org/10.5194/amt-8-4979-2015, 2015.
Crawford, I., Lloyd, G., Herrmann, E., Hoyle, C. R., Bower, K. N., Connolly, P. J., Flynn, M. J., Kaye, P. H., Choularton, T. W., and Gallagher, M. W.: Observations of fluorescent aerosol–cloud interactions in the free troposphere at the High-Altitude Research Station Jungfraujoch, Atmos. Chem. Phys., 16, 2273–2284, https://doi.org/10.5194/acp-16-2273-2016, 2016.
D'Alessandro, J. J., Diao, M., Wu, C., Liu, X., Jensen, J. B., and Stephens, B. B.: Cloud Phase and Relative Humidity Distributions over the Southern Ocean in Austral Summer Based on In Situ Observations and CAM5 Simulations, J. Climate, 32, 2781–2805, https://doi.org/10.1175/jcli-d-18-0232.1, 2019.
DeMott, P. J.: Quantitative descriptions of ice formation mechanisms of silver iodide-type aerosols, Atmos. Res., 38, 63–99, https://doi.org/10.1016/0169-8095(94)00088-U, 1994.
DeMott, P. J., Prenni, A. J., Liu, X., Kreidenweis, S. M., Petters, M. D., Twohy, C. H., Richardson, M. S., Eidhammer, T., and Rogers, D. C.: Predicting global atmospheric ice nuclei distributions and their impacts on climate, P. Natl. Acad. Sci. USA, 107, 11217–11222, https://doi.org/10.1073/pnas.0910818107, 2010.
DeMott, P. J., Prenni, A. J., McMeeking, G. R., Sullivan, R. C., Petters, M. D., Tobo, Y., Niemand, M., Möhler, O., Snider, J. R., Wang, Z., and Kreidenweis, S. M.: Integrating laboratory and field data to quantify the immersion freezing ice nucleation activity of mineral dust particles, Atmos. Chem. Phys., 15, 393–409, https://doi.org/10.5194/acp-15-393-2015, 2015.
Després, V. R., Huffman, J. A., Burrows, S. M., Hoose, C., Safatov, A. S., Buryak, G., Fröhlich-Nowoisky, J., Elbert, W., Andreae, M. O., Pöschl, U., and Jaenicke, R.: Primary biological aerosol particles in the atmosphere: a review, Tellus B, 64, 15598, https://doi.org/10.3402/tellusb.v64i0.15598, 2012.
Draxler, R. R. and Hess, G. D.: An Overview of the HYSPLIT_4 Modelling System for Trajectories, Dispersion, and Deposition, Aust. Meteorol. Mag., 47, 295–308, 1998.
Fennelly, M., Sewell, G., Prentice, M., O'Connor, D., and Sodeau, J.: Review: The Use of Real-Time Fluorescence Instrumentation to Monitor Ambient Primary Biological Aerosol Particles (PBAP), Atmosphere, 9, 1, https://doi.org/10.3390/atmos9010001, 2018.
Ferrone, A. and Berne, A.: Radar and ground-level measurements of clouds and precipitation collected during the POPE 2020 campaign at Princess Elisabeth Antarctica, Earth Syst. Sci. Data, 15, 1115–1132, https://doi.org/10.5194/essd-15-1115-2023, 2023.
Field, P. R., Lawson, R. P., Brown, P. R. A., Lloyd, G., Westbrook, C., Moisseev, D., Miltenberger, A., Nenes, A., Blyth, A., Choularton, T., Connolly, P., Buehl, J., Crosier, J., Cui, Z., Dearden, C., DeMott, P., Flossmann, A., Heymsfield, A., Huang, Y., Kalesse, H., Kanji, Z. A., Korolev, A., Kirchgaessner, A., Lasher-Trapp, S., Leisner, T., McFarquhar, G., Phillips, V., Stith, J., and Sullivan, S.: Chapter 7. Secondary Ice Production – current state of the science and recommendations for the future, Meteor. Mon., 58, 7.1–7.20, https://doi.org/10.1175/amsmonographs-d-16-0014.1, 2017.
Findeisen, W.: Die kolloidmeteorologischen Vorgänge bei der Niederschlagsbildung, Meteorol. Z., 55, 121–133, 1938.
Findeisen, W., Volken, E., Giesche, A. M., and Brönnimann, S.: Colloidal meteorological processes in the formation of precipitation, Meteorol. Z., 24, 443–454, https://doi.org/10.1127/metz/2015/0675, 2015.
Foskinis, R., Gao, K., Gini, M. I., Diapouli, E., Vratolis, S., Granakis, K., Zografou, O., Kokkalis, P., Kommpula, M., Vakkari, V., Eleftheriadis, K., Nenes, A., and Papayannis, A.: The influence of the planetary boundary layer on the atmospheric state and cloud formation at an orographic site at the Eastern Mediterranean, Tellus B, 76, 19–31, https://doi.org/10.16993/tellusb.1876, 2024.
Gao, K., Koch, H.-C., Zhou, C.-W., and Kanji, Z. A.: The dependence of soot particle ice nucleation ability on its volatile content, Environ. Sci.-Proc. Imp., 24, 2043–2069, https://doi.org/10.1039/D2EM00158F, 2022.
Gao, K., Vogel, F., Foskinis, R., Vratolis, S., Gini, M., Granakis, K., Billault-Roux, A., Georgakaki, P., Zografou, O., Fetfatzis, P., Berne, A., Papayiannis, A., Eleftheriadis, K., Möhler, O., and Nenes, A.: CALISHTO campaign dataset for the publication Biological and Dust Aerosols as Sources of Ice-nucleating Particles in the Eastern Mediterranean, EnviDat [data set], https://doi.org/10.16904/envidat.538, 2024.
Garcia, E., Hill, T. C. J., Prenni, A. J., DeMott, P. J., Franc, G. D., and Kreidenweis, S. M.: Biogenic ice nuclei in boundary layer air over two U. S. High Plains agricultural regions, J. Geophys. Res.-Atmos., 117, D18209, https://doi.org/10.1029/2012jd018343, 2012.
Georgakaki, P., Sotiropoulou, G., Vignon, É., Billault-Roux, A.-C., Berne, A., and Nenes, A.: Secondary ice production processes in wintertime alpine mixed-phase clouds, Atmos. Chem. Phys., 22, 1965–1988, https://doi.org/10.5194/acp-22-1965-2022, 2022.
Georgakaki, P., Billault-Roux, A.-C., Foskinis, R., Gao, K., Sotiropoulou, G., Gini, M., Takahama, S., Eleftheriadis, K., Papayannis, A., Berne, A., and Nenes, A.: Unraveling secondary ice production in winter orographic clouds through a synergy of in-situ observations, remote sensing and modeling, npj Clim. Atmos. Sci., 7, 145, https://doi.org/10.1038/s41612-024-00671-9, 2024.
Gini, M., Manousakas, M., Karydas, A. G., and Eleftheriadis, K.: Mass size distributions, composition and dose estimates of particulate matter in Saharan dust outbreaks, Environ. Pollut., 298, 118768, https://doi.org/10.1016/j.envpol.2021.118768, 2022.
Gong, X., Radenz, M., Wex, H., Seifert, P., Ataei, F., Henning, S., Baars, H., Barja, B., Ansmann, A., and Stratmann, F.: Significant continental source of ice-nucleating particles at the tip of Chile's southernmost Patagonia region, Atmos. Chem. Phys., 22, 10505–10525, https://doi.org/10.5194/acp-22-10505-2022, 2022.
Graber, E. R. and Rudich, Y.: Atmospheric HULIS: How humic-like are they? A comprehensive and critical review, Atmos. Chem. Phys., 6, 729–753, https://doi.org/10.5194/acp-6-729-2006, 2006.
Hagen, M. and Yuter, S. E.: Relations between radar reflectivity, liquid-water content, and rainfall rate during the MAP SOP, Q. J. Roy. Meteor. Soc., 129, 477–493, https://doi.org/10.1256/qj.02.23, 2006.
Harrison, A. D., Whale, T. F., Carpenter, M. A., Holden, M. A., Neve, L., O'Sullivan, D., Vergara Temprado, J., and Murray, B. J.: Not all feldspars are equal: a survey of ice nucleating properties across the feldspar group of minerals, Atmos. Chem. Phys., 16, 10927–10940, https://doi.org/10.5194/acp-16-10927-2016, 2016.
Henneberg, O., Lohmann, U., and Henneberger, J.: Formation and Development of Orographic Mixed-Phase Clouds, J. Atmos. Sci., 74, 3703–3724, https://doi.org/10.1175/jas-d-16-0348.1, 2017.
Hernandez, M., Perring, A. E., McCabe, K., Kok, G., Granger, G., and Baumgardner, D.: Chamber catalogues of optical and fluorescent signatures distinguish bioaerosol classes, Atmos. Meas. Tech., 9, 3283–3292, https://doi.org/10.5194/amt-9-3283-2016, 2016.
Herrmann, E., Weingartner, E., Henne, S., Vuilleumier, L., Bukowiecki, N., Steinbacher, M., Conen, F., Collaud Coen, M., Hammer, E., Jurányi, Z., Baltensperger, U., and Gysel, M.: Analysis of long-term aerosol size distribution data from Jungfraujoch with emphasis on free tropospheric conditions, cloud influence, and air mass transport, J. Geophys. Res.-Atmos., 120, 9459–9480, https://doi.org/10.1002/2015jd023660, 2015.
Hill, T. C. J., DeMott, P. J., Tobo, Y., Fröhlich-Nowoisky, J., Moffett, B. F., Franc, G. D., and Kreidenweis, S. M.: Sources of organic ice nucleating particles in soils, Atmos. Chem. Phys., 16, 7195–7211, https://doi.org/10.5194/acp-16-7195-2016, 2016.
Hoose, C. and Möhler, O.: Heterogeneous ice nucleation on atmospheric aerosols: a review of results from laboratory experiments, Atmos. Chem. Phys., 12, 9817–9854, https://doi.org/10.5194/acp-12-9817-2012, 2012.
Isokääntä, S., Kim, P., Mikkonen, S., Kühn, T., Kokkola, H., Yli-Juuti, T., Heikkinen, L., Luoma, K., Petäjä, T., Kipling, Z., Partridge, D., and Virtanen, A.: The effect of clouds and precipitation on the aerosol concentrations and composition in a boreal forest environment, Atmos. Chem. Phys., 22, 11823–11843, https://doi.org/10.5194/acp-22-11823-2022, 2022.
Iwata, A., Imura, M., Hama, M., Maki, T., Tsuchiya, N., Kunihisa, R., and Matsuki, A.: Release of Highly Active Ice Nucleating Biological Particles Associated with Rain, Atmosphere, 10, 605, https://doi.org/10.3390/atmos10100605, 2019.
Jahl, L. G., Brubaker, T. A., Polen, M. J., Jahn, L. G., Cain, K. P., Bowers, B. B., Fahy, W. D., Graves, S., and Sullivan, R. C.: Atmospheric aging enhances the ice nucleation ability of biomass-burning aerosol, Sci. Adv., 7, eabd3440, https://doi.org/10.1126/sciadv.abd3440, 2021.
Joung, Y. S., Ge, Z., and Buie, C. R.: Bioaerosol generation by raindrops on soil, Nat. Commun., 8, 14668, https://doi.org/10.1038/ncomms14668, 2017.
Kallos, G., Papadopoulos, A., Katsafados, P., and Nickovic, S.: Transatlantic Saharan dust transport: Model simulation and results, J. Geophys. Res.-Atmos., 111, D09204, https://doi.org/10.1029/2005jd006207, 2006.
Kampe, H. J. A. and Weickmann, H. K.: The effectiveness of natural and artificial aerosols as freezing nuclei, J. Atmos. Sci., 8, 283–288, https://doi.org/10.1175/1520-0469(1951)008<0283:TEONAA>2.0.CO;2, 1951.
Kamra, A. K., Murugavel, P., and Pawar, S. D.: Measured size distributions of aerosols over the Indian Ocean during INDOEX, J. Geophys. Res.-Atmos., 108, 8000, https://doi.org/10.1029/2002jd002200, 2003.
Kanji, Z. A., Ladino, L. A., Wex, H., Boose, Y., Burkert-Kohn, M., Cziczo, D. J., and Krämer, M.: Overview of ice nucleating particles, Meteor. Mon., 58, 1.1–1.33, https://doi.org/10.1175/amsmonographs-d-16-0006.1, 2017.
Kawana, K., Matsumoto, K., Taketani, F., Miyakawa, T., and Kanaya, Y.: Fluorescent biological aerosol particles over the central Pacific Ocean: covariation with ocean surface biological activity indicators, Atmos. Chem. Phys., 21, 15969–15983, https://doi.org/10.5194/acp-21-15969-2021, 2021.
Kaye, P. H., Stanley, W. R., and Hirst, E.: Single particle multichannel bio-aerosol fluorescence sensor, Opt. Express, 13, 3583–3593, https://doi.org/10.1364/OPEX.13.003583, 2005.
Kerminen, V.-M., Chen, X., Vakkari, V., Petäjä, T., Kulmala, M., and Bianchi, F.: Atmospheric new particle formation and growth: review of field observations, Environ. Res. Lett., 13, 103003, https://doi.org/10.1088/1748-9326/aadf3c, 2018.
Khadir, T., Riipinen, I., Talvinen, S., Heslin-Rees, D., Pöhlker, C., Rizzo, L., Machado, L. A. T., Franco, M. A., Kremper, L. A., Artaxo, P., Petäjä, T., Kulmala, M., Tunved, P., Ekman, A. M. L., Krejci, R., and Virtanen, A.: Sink, Source or Something In-Between? Net Effects of Precipitation on Aerosol Particle Populations, Geophys. Res. Lett., 50, e2023GL104325, https://doi.org/10.1029/2023GL104325, 2023.
Khan, B., Stenchikov, G., Weinzierl, B., Kalenderski, S., and Osipov, S.: Dust plume formation in the free troposphere and aerosol size distribution during the Saharan Mineral Dust Experiment in North Africa, Tellus B, 67, 27170, https://doi.org/10.3402/tellusb.v67.27170, 2015.
Khlystov, A., Stanier, C., and Pandis, S. N.: An Algorithm for Combining Electrical Mobility and Aerodynamic Size Distributions Data when Measuring Ambient Aerosol Special Issue ofAerosol Science and Technologyon Findings from the Fine Particulate Matter Supersites Program, Aerosol Sci. Technol., 38, 229–238, https://doi.org/10.1080/02786820390229543, 2004.
Kim, Y. J., Boatman, J. F., Gunter, R. L., Wellman, D. L., and Wilkison, S. W.: Vertical distribution of atmospheric aerosol size distribution over south-central New Mexico, Atmos. Environ., 27, 1351–1362, https://doi.org/10.1016/0960-1686(93)90261-V, 1992.
Knopf, D. A. and Alpert, P. A.: Atmospheric ice nucleation, Nat. Rev. Phys., 5, 203–217, https://doi.org/10.1038/s42254-023-00570-7, 2023.
Kostrykin, S., Revokatova, A., Chernenkov, A., Ginzburg, V., Polumieva, P., and Zelenova, M.: Black Carbon Emissions from the Siberian Fires 2019: Modelling of the Atmospheric Transport and Possible Impact on the Radiation Balance in the Arctic Region, Atmosphere, 12, 814, https://doi.org/10.3390/atmos12070814, 2021.
Küchler, N., Kneifel, S., Löhnert, U., Kollias, P., Czekala, H., and Rose, T.: A W-Band Radar–Radiometer System for Accurate and Continuous Monitoring of Clouds and Precipitation, J. Atmos. Ocean. Tech., 34, 2375–2392, https://doi.org/10.1175/jtech-d-17-0019.1, 2017.
Lacher, L., Clemen, H.-C., Shen, X., Mertes, S., Gysel-Beer, M., Moallemi, A., Steinbacher, M., Henne, S., Saathoff, H., Möhler, O., Höhler, K., Schiebel, T., Weber, D., Schrod, J., Schneider, J., and Kanji, Z. A.: Sources and nature of ice-nucleating particles in the free troposphere at Jungfraujoch in winter 2017, Atmos. Chem. Phys., 21, 16925–16953, https://doi.org/10.5194/acp-21-16925-2021, 2021.
Laj, P., Bigi, A., Rose, C., Andrews, E., Lund Myhre, C., Collaud Coen, M., Lin, Y., Wiedensohler, A., Schulz, M., Ogren, J. A., Fiebig, M., Gliß, J., Mortier, A., Pandolfi, M., Petäja, T., Kim, S.-W., Aas, W., Putaud, J.-P., Mayol-Bracero, O., Keywood, M., Labrador, L., Aalto, P., Ahlberg, E., Alados Arboledas, L., Alastuey, A., Andrade, M., Artíñano, B., Ausmeel, S., Arsov, T., Asmi, E., Backman, J., Baltensperger, U., Bastian, S., Bath, O., Beukes, J. P., Brem, B. T., Bukowiecki, N., Conil, S., Couret, C., Day, D., Dayantolis, W., Degorska, A., Eleftheriadis, K., Fetfatzis, P., Favez, O., Flentje, H., Gini, M. I., Gregorič, A., Gysel-Beer, M., Hallar, A. G., Hand, J., Hoffer, A., Hueglin, C., Hooda, R. K., Hyvärinen, A., Kalapov, I., Kalivitis, N., Kasper-Giebl, A., Kim, J. E., Kouvarakis, G., Kranjc, I., Krejci, R., Kulmala, M., Labuschagne, C., Lee, H.-J., Lihavainen, H., Lin, N.-H., Löschau, G., Luoma, K., Marinoni, A., Martins Dos Santos, S., Meinhardt, F., Merkel, M., Metzger, J.-M., Mihalopoulos, N., Nguyen, N. A., Ondracek, J., Pérez, N., Perrone, M. R., Petit, J.-E., Picard, D., Pichon, J.-M., Pont, V., Prats, N., Prenni, A., Reisen, F., Romano, S., Sellegri, K., Sharma, S., Schauer, G., Sheridan, P., Sherman, J. P., Schütze, M., Schwerin, A., Sohmer, R., Sorribas, M., Steinbacher, M., Sun, J., Titos, G., Toczko, B., Tuch, T., Tulet, P., Tunved, P., Vakkari, V., Velarde, F., Velasquez, P., Villani, P., Vratolis, S., Wang, S.-H., Weinhold, K., Weller, R., Yela, M., Yus-Diez, J., Zdimal, V., Zieger, P., and Zikova, N.: A global analysis of climate-relevant aerosol properties retrieved from the network of Global Atmosphere Watch (GAW) near-surface observatories, Atmos. Meas. Tech., 13, 4353–4392, https://doi.org/10.5194/amt-13-4353-2020, 2020.
Lohmann, U. and Neubauer, D.: The importance of mixed-phase and ice clouds for climate sensitivity in the global aerosol–climate model ECHAM6-HAM2, Atmos. Chem. Phys., 18, 8807–8828, https://doi.org/10.5194/acp-18-8807-2018, 2018.
Lohmann, U., Henneberger, J., Henneberg, O., Fugal, J. P., Bühl, J., and Kanji, Z. A.: Persistence of orographic mixed-phase clouds, Geophys. Res. Lett., 43, 10512–10519, https://doi.org/10.1002/2016gl071036, 2016.
Longo, A. F., Ingall, E. D., Diaz, J. M., Oakes, M., King, L. E., Nenes, A., Mihalopoulos, N., Violaki, K., Avila, A., Benitez-Nelson, C. R., Brandes, J., McNulty, I., and Vine, D. J.: P-NEXFS analysis of aerosol phosphorus delivered to the Mediterranean Sea, Geophys. Res. Lett., 41, 4043–4049, https://doi.org/10.1002/2014gl060555, 2014.
Mason, R. H., Si, M., Li, J., Chou, C., Dickie, R., Toom-Sauntry, D., Pöhlker, C., Yakobi-Hancock, J. D., Ladino, L. A., Jones, K., Leaitch, W. R., Schiller, C. L., Abbatt, J. P. D., Huffman, J. A., and Bertram, A. K.: Ice nucleating particles at a coastal marine boundary layer site: correlations with aerosol type and meteorological conditions, Atmos. Chem. Phys., 15, 12547–12566, https://doi.org/10.5194/acp-15-12547-2015, 2015.
McCluskey, C. S., Ovadnevaite, J., Rinaldi, M., Atkinson, J., Belosi, F., Ceburnis, D., Marullo, S., Hill, T. C. J., Lohmann, U., Kanji, Z. A., O'Dowd, C., Kreidenweis, S. M., and DeMott, P. J.: Marine and Terrestrial Organic Ice-Nucleating Particles in Pristine Marine to Continentally Influenced Northeast Atlantic Air Masses, J. Geophys. Res.-Atmos., 123, 6196–6212, https://doi.org/10.1029/2017jd028033, 2018.
Mignani, C., Wieder, J., Sprenger, M. A., Kanji, Z. A., Henneberger, J., Alewell, C., and Conen, F.: Towards parameterising atmospheric concentrations of ice-nucleating particles active at moderate supercooling, Atmos. Chem. Phys., 21, 657–664, https://doi.org/10.5194/acp-21-657-2021, 2021.
Miltenberger, A. K., Field, P. R., Hill, A. H., and Heymsfield, A. J.: Vertical redistribution of moisture and aerosol in orographic mixed-phase clouds, Atmos. Chem. Phys., 20, 7979–8001, https://doi.org/10.5194/acp-20-7979-2020, 2020.
Moallemi, A., Landwehr, S., Robinson, C., Simo, R., Zamanillo, M., Chen, G., Baccarini, A., Schnaiter, M., Henning, S., Modini, R. L., Gysel-Beer, M., and Schmale, J.: Sources, Occurrence and Characteristics of Fluorescent Biological Aerosol Particles Measured Over the Pristine Southern Ocean, J. Geophys. Res.-Atmos., 126, e2021JD034811, https://doi.org/10.1029/2021JD034811, 2021.
Möhler, O., Stetzer, O., Schaefers, S., Linke, C., Schnaiter, M., Tiede, R., Saathoff, H., Krämer, M., Mangold, A., Budz, P., Zink, P., Schreiner, J., Mauersberger, K., Haag, W., Kärcher, B., and Schurath, U.: Experimental investigation of homogeneous freezing of sulphuric acid particles in the aerosol chamber AIDA, Atmos. Chem. Phys., 3, 211–223, https://doi.org/10.5194/acp-3-211-2003, 2003.
Möhler, O., Adams, M., Lacher, L., Vogel, F., Nadolny, J., Ullrich, R., Boffo, C., Pfeuffer, T., Hobl, A., Weiß, M., Vepuri, H. S. K., Hiranuma, N., and Murray, B. J.: The Portable Ice Nucleation Experiment (PINE): a new online instrument for laboratory studies and automated long-term field observations of ice-nucleating particles, Atmos. Meas. Tech., 14, 1143–1166, https://doi.org/10.5194/amt-14-1143-2021, 2021.
Mordas, G., Prokopciuk, N., Byèenkienë, S., Andriejauskienë, J., and Ulevicius, V.: Optical Properties of the Urban Aerosol Particles Obtained from Ground Based Measurements and Satellite-Based Modelling Studies, Adv. Meteorol., 2015, 1–12, https://doi.org/10.1155/2015/898376, 2015.
Murray, B. J., O'Sullivan, D., Atkinson, J. D., and Webb, M. E.: Ice Nucleation by Particles Immersed in Supercooled Cloud Droplets, Chem. Soc. Rev., 41, 6519–6554, https://doi.org/10.1039/c2cs35200a, 2012.
Negron, A., DeLeon-Rodriguez, N., Waters, S. M., Ziemba, L. D., Anderson, B., Bergin, M., Konstantinidis, K. T., and Nenes, A.: Using flow cytometry and light-induced fluorescence to characterize the variability and characteristics of bioaerosols in springtime in Metro Atlanta, Georgia, Atmos. Chem. Phys., 20, 1817–1838, https://doi.org/10.5194/acp-20-1817-2020, 2020.
Niemand, M., Möhler, O., Vogel, B., Vogel, H., Hoose, C., Connolly, P., Klein, H., Bingemer, H., DeMott, P., Skrotzki, J., and Leisner, T.: A Particle-Surface-Area-Based Parameterization of Immersion Freezing on Desert Dust Particles, J. Atmos. Sci., 69, 3077–3092, https://doi.org/10.1175/jas-d-11-0249.1, 2012.
O'Sullivan, D., Murray, B. J., Malkin, T. L., Whale, T. F., Umo, N. S., Atkinson, J. D., Price, H. C., Baustian, K. J., Browse, J., and Webb, M. E.: Ice nucleation by fertile soil dusts: relative importance of mineral and biogenic components, Atmos. Chem. Phys., 14, 1853–1867, https://doi.org/10.5194/acp-14-1853-2014, 2014.
Pasquier, J. T., Henneberger, J., Ramelli, F., Lauber, A., David, R. O., Wieder, J., Carlsen, T., Gierens, R., Maturilli, M., and Lohmann, U.: Conditions favorable for secondary ice production in Arctic mixed-phase clouds, Atmos. Chem. Phys., 22, 15579–15601, https://doi.org/10.5194/acp-22-15579-2022, 2022.
Pereira, S., Wagner, F., and Silva, A. M.: Scattering properties and mass concentration of local and long-range transported aerosols over the South Western Iberia Peninsula, Atmos. Environ., 42, 7623–7631, https://doi.org/10.1016/j.atmosenv.2008.06.008, 2008.
Pereira Freitas, G., Adachi, K., Conen, F., Heslin-Rees, D., Krejci, R., Tobo, Y., Yttri, K. E., and Zieger, P.: Regionally sourced bioaerosols drive high-temperature ice nucleating particles in the Arctic, Nat. Commun., 14, 5997, https://doi.org/10.1038/s41467-023-41696-7, 2023.
Peter, J. R., Siems, S. T., Jensen, J. B., Gras, J. L., Ishizaka, Y., and Hacker, J. M.: Airborne observations of the effect of a cold front on the aerosol particle size distribution and new particle formation, Q. J. Roy. Meteor. Soc., 136, 944–961, https://doi.org/10.1002/qj.515, 2010.
Petters, M. D. and Wright, T. P.: Revisiting ice nucleation from precipitation samples, Geophys. Res. Lett., 42, 8758–8766, https://doi.org/10.1002/2015gl065733, 2015.
Pisso, I., Sollum, E., Grythe, H., Kristiansen, N. I., Cassiani, M., Eckhardt, S., Arnold, D., Morton, D., Thompson, R. L., Groot Zwaaftink, C. D., Evangeliou, N., Sodemann, H., Haimberger, L., Henne, S., Brunner, D., Burkhart, J. F., Fouilloux, A., Brioude, J., Philipp, A., Seibert, P., and Stohl, A.: The Lagrangian particle dispersion model FLEXPART version 10.4, Geosci. Model Dev., 12, 4955–4997, https://doi.org/10.5194/gmd-12-4955-2019, 2019.
Pöhlker, C., Huffman, J. A., and Pöschl, U.: Autofluorescence of atmospheric bioaerosols – fluorescent biomolecules and potential interferences, Atmos. Meas. Tech., 5, 37–71, https://doi.org/10.5194/amt-5-37-2012, 2012.
Pousse-Nottelmann, S., Zubler, E. M., and Lohmann, U.: Microphysical processing of aerosol particles in orographic clouds, Atmos. Chem. Phys., 15, 9217–9236, https://doi.org/10.5194/acp-15-9217-2015, 2015.
Prenni, A. J., Tobo, Y., Garcia, E., DeMott, P. J., Huffman, J. A., McCluskey, C. S., Kreidenweis, S. M., Prenni, J. E., Pöhlker, C., and Pöschl, U.: The impact of rain on ice nuclei populations at a forested site in Colorado, Geophys. Res. Lett., 40, 227–231, https://doi.org/10.1029/2012gl053953, 2013.
Pummer, B. G., Budke, C., Augustin-Bauditz, S., Niedermeier, D., Felgitsch, L., Kampf, C. J., Huber, R. G., Liedl, K. R., Loerting, T., Moschen, T., Schauperl, M., Tollinger, M., Morris, C. E., Wex, H., Grothe, H., Pöschl, U., Koop, T., and Fröhlich-Nowoisky, J.: Ice nucleation by water-soluble macromolecules, Atmos. Chem. Phys., 15, 4077–4091, https://doi.org/10.5194/acp-15-4077-2015, 2015.
Ran, L., Deng, Z., Wu, Y., Li, J., Bai, Z., Lu, Y., Zhuoga, D., and Bian, J.: Measurement report: Vertical profiling of particle size distributions over Lhasa, Tibet – tethered balloon-based in situ measurements and source apportionment, Atmos. Chem. Phys., 22, 6217–6229, https://doi.org/10.5194/acp-22-6217-2022, 2022.
Reicher, N., Budke, C., Eickhoff, L., Raveh-Rubin, S., Kaplan-Ashiri, I., Koop, T., and Rudich, Y.: Size-dependent ice nucleation by airborne particles during dust events in the eastern Mediterranean, Atmos. Chem. Phys., 19, 11143–11158, https://doi.org/10.5194/acp-19-11143-2019, 2019.
Ristovski, Z. D., Wardoyo, A. Y. P., Morawska, L., Jamriska, M., Carr, S., and Johnson, G.: Biomass burning influenced particle characteristics in Northern Territory Australia based on airborne measurements, Atmos. Res., 96, 103–109, https://doi.org/10.1016/j.atmosres.2009.12.002, 2010.
Rogers, D. C., DeMott, P. J., Kreidenweis, S. M., and Chen, Y.: Measurements of ice nucleating aerosols during SUCCESS, Geophys. Res. Lett., 25, 1383–1386, https://doi.org/10.1029/97gl03478, 1998.
Savage, N. J., Krentz, C. E., Könemann, T., Han, T. T., Mainelis, G., Pöhlker, C., and Huffman, J. A.: Systematic characterization and fluorescence threshold strategies for the wideband integrated bioaerosol sensor (WIBS) using size-resolved biological and interfering particles, Atmos. Meas. Tech., 10, 4279–4302, https://doi.org/10.5194/amt-10-4279-2017, 2017.
Schiebel, T.: Ice Nucleation Activity of Soil Dust Aerosols, Karlsruhe Institute of Technology, Karlsruhe, Germany, https://doi.org/10.5445/IR/1000076327, 2017.
Schneider, J., Höhler, K., Heikkilä, P., Keskinen, J., Bertozzi, B., Bogert, P., Schorr, T., Umo, N. S., Vogel, F., Brasseur, Z., Wu, Y., Hakala, S., Duplissy, J., Moisseev, D., Kulmala, M., Adams, M. P., Murray, B. J., Korhonen, K., Hao, L., Thomson, E. S., Castarède, D., Leisner, T., Petäjä, T., and Möhler, O.: The seasonal cycle of ice-nucleating particles linked to the abundance of biogenic aerosol in boreal forests, Atmos. Chem. Phys., 21, 3899–3918, https://doi.org/10.5194/acp-21-3899-2021, 2021.
Schrod, J., Thomson, E. S., Weber, D., Kossmann, J., Pöhlker, C., Saturno, J., Ditas, F., Artaxo, P., Clouard, V., Saurel, J.-M., Ebert, M., Curtius, J., and Bingemer, H. G.: Long-term deposition and condensation ice-nucleating particle measurements from four stations across the globe, Atmos. Chem. Phys., 20, 15983–16006, https://doi.org/10.5194/acp-20-15983-2020, 2020.
Schroder, F. and Strom, J.: Aircraft measurements of sub micrometer aerosol particles (>7 nm) in the midlatitude free troposphere and tropopause region, Atmos. Res., 44, 333–356, https://doi.org/10.1016/S0169-8095(96)00034-8, 1997.
Schwarz, G.: Estimating the Dimension of a Model, Ann. Stat., 6, 461–461, https://doi.org/10.1214/aos/1176344136, 1978.
Schween, J. H., Hirsikko, A., Löhnert, U., and Crewell, S.: Mixing-layer height retrieval with ceilometer and Doppler lidar: from case studies to long-term assessment, Atmos. Meas. Tech., 7, 3685–3704, https://doi.org/10.5194/amt-7-3685-2014, 2014.
Seinfeld, J. H., Bretherton, C., Carslaw, K. S., Coe, H., DeMott, P. J., Dunlea, E. J., Feingold, G., Ghan, S., Guenther, A. B., Kahn, R., Kraucunas, I., Kreidenweis, S. M., Molina, M. J., Nenes, A., Penner, J. E., Prather, K. A., Ramanathan, V., Ramaswamy, V., Rasch, P. J., Ravishankara, A. R., Rosenfeld, D., Stephens, G., and Wood, R.: Improving our fundamental understanding of the role of aerosol-cloud interactions in the climate system, P. Natl. Acad. Sci. USA, 113, 5781–5790, https://doi.org/10.1073/pnas.1514043113, 2016.
Spyrou, C., Mitsakou, C., Kallos, G., Louka, P., and Vlastou, G.: An improved limited area model for describing the dust cycle in the atmosphere, J. Geophys. Res., 115, D17211, https://doi.org/10.1029/2009jd013682, 2010.
Stein, A. F., Draxler, R. R., Rolph, G. D., Stunder, B. J. B., Cohen, M. D., and Ngan, F.: NOAA's HYSPLIT Atmospheric Transport and Dispersion Modeling System, B. Am. Meteorol. Soc., 96, 2059–2077, https://doi.org/10.1175/bams-d-14-00110.1, 2015.
Stohl, A., Forster, C., Frank, A., Seibert, P., and Wotawa, G.: Technical note: The Lagrangian particle dispersion model FLEXPART version 6.2, Atmos. Chem. Phys., 5, 2461–2474, https://doi.org/10.5194/acp-5-2461-2005, 2005.
Sullivan, S. C., Hoose, C., Kiselev, A., Leisner, T., and Nenes, A.: Initiation of secondary ice production in clouds, Atmos. Chem. Phys., 18, 1593–1610, https://doi.org/10.5194/acp-18-1593-2018, 2018.
Tan, I., Storelvmo, T., and Zelinka, M. D.: Observational constraints on mixed-phase clouds imply higher climate sensitivity, Science, 352, 224–227, https://doi.org/10.1126/science.aad5300, 2016.
Tang, D., Wei, T., Yuan, J., Xia, H., and Dou, X.: Observation of bioaerosol transport using wideband integrated bioaerosol sensor and coherent Doppler lidar, Atmos. Meas. Tech., 15, 2819–2838, https://doi.org/10.5194/amt-15-2819-2022, 2022.
Tang, K., Sánchez-Parra, B., Yordanova, P., Wehking, J., Backes, A. T., Pickersgill, D. A., Maier, S., Sciare, J., Pöschl, U., Weber, B., and Fröhlich-Nowoisky, J.: Bioaerosols and atmospheric ice nuclei in a Mediterranean dryland: community changes related to rainfall, Biogeosciences, 19, 71–91, https://doi.org/10.5194/bg-19-71-2022, 2022.
Tarn, M. D., Sikora, S. N. F., Porter, G. C. E., Wyld, B. V., Alayof, M., Reicher, N., Harrison, A. D., Rudich, Y., Shim, J. U., and Murray, B. J.: On-chip analysis of atmospheric ice-nucleating particles in continuous flow, Lab Chip, 20, 2889–2910, https://doi.org/10.1039/d0lc00251h, 2020.
Testa, B., Hill, T. C. J., Marsden, N. A., Barry, K. R., Hume, C. C., Bian, Q., Uetake, J., Hare, H., Perkins, R. J., Möhler, O., Kreidenweis, S. M., and DeMott, P. J.: Ice Nucleating Particle Connections to Regional Argentinian Land Surface Emissions and Weather During the Cloud, Aerosol, and Complex Terrain Interactions Experiment, J. Geophys. Res.-Atmos., 126, e2021JD035186, https://doi.org/10.1029/2021jd035186, 2021.
Tobo, Y., Prenni, A. J., DeMott, P. J., Huffman, J. A., McCluskey, C. S., Tian, G., Pöhlker, C., Pöschl, U., and Kreidenweis, S. M.: Biological aerosol particles as a key determinant of ice nuclei populations in a forest ecosystem, J. Geophys. Res.-Atmos., 118, 10100–10110, https://doi.org/10.1002/jgrd.50801, 2013.
Tobo, Y., DeMott, P. J., Hill, T. C. J., Prenni, A. J., Swoboda-Colberg, N. G., Franc, G. D., and Kreidenweis, S. M.: Organic matter matters for ice nuclei of agricultural soil origin, Atmos. Chem. Phys., 14, 8521–8531, https://doi.org/10.5194/acp-14-8521-2014, 2014.
Toprak, E. and Schnaiter, M.: Fluorescent biological aerosol particles measured with the Waveband Integrated Bioaerosol Sensor WIBS-4: laboratory tests combined with a one year field study, Atmos. Chem. Phys., 13, 225–243, https://doi.org/10.5194/acp-13-225-2013, 2013.
Ullrich, R., Hoose, C., Möhler, O., Niemand, M., Wagner, R., Höhler, K., Hiranuma, N., Saathoff, H., and Leisner, T.: A New Ice Nucleation Active Site Parameterization for Desert Dust and Soot, J. Atmos. Sci., 74, 699–717, https://doi.org/10.1175/jas-d-16-0074.1, 2017.
Umo, N. S., Murray, B. J., Baeza-Romero, M. T., Jones, J. M., Lea-Langton, A. R., Malkin, T. L., O'Sullivan, D., Neve, L., Plane, J. M. C., and Williams, A.: Ice nucleation by combustion ash particles at conditions relevant to mixed-phase clouds, Atmos. Chem. Phys., 15, 5195–5210, https://doi.org/10.5194/acp-15-5195-2015, 2015.
Vali, G.: Quantitative Evaluation of Experimental Results an the Heterogeneous Freezing Nucleation of Supercooled Liquids, J. Atmos. Sci., 28, 402–409, https://doi.org/10.1175/1520-0469(1971)028<0402:QEOERA>2.0.CO;2, 1971.
Vali, G.: Revisiting the differential freezing nucleus spectra derived from drop-freezing experiments: methods of calculation, applications, and confidence limits, Atmos. Meas. Tech., 12, 1219–1231, https://doi.org/10.5194/amt-12-1219-2019, 2019.
Vali, G., DeMott, P. J., Möhler, O., and Whale, T. F.: Technical Note: A proposal for ice nucleation terminology, Atmos. Chem. Phys., 15, 10263–10270, https://doi.org/10.5194/acp-15-10263-2015, 2015.
Violaki, K., Nenes, A., Tsagkaraki, M., Paglione, M., Jacquet, S., Sempéré, R., and Panagiotopoulos, C.: Bioaerosols and dust are the dominant sources of organic P in atmospheric particles, npj Clim. Atmos. Sci., 4, 63, https://doi.org/10.1038/s41612-021-00215-5, 2021.
Vratolis, S., Diapouli, E., Manousakas, M. I., Almeida, S. M., Beslic, I., Kertesz, Z., Samek, L., and Eleftheriadis, K.: A new method for the quantification of ambient particulate-matter emission fluxes, Atmos. Chem. Phys., 23, 6941–6961, https://doi.org/10.5194/acp-23-6941-2023, 2023.
Wegener, A.: Thermodynamik der Atmosphäre, Nature, 90, 31, https://doi.org/10.1038/090031a0, 1912.
Wieder, J., Mignani, C., Schär, M., Roth, L., Sprenger, M., Henneberger, J., Lohmann, U., Brunner, C., and Kanji, Z. A.: Unveiling atmospheric transport and mixing mechanisms of ice-nucleating particles over the Alps, Atmos. Chem. Phys., 22, 3111–3130, https://doi.org/10.5194/acp-22-3111-2022, 2022.
Wilson, T. W., Ladino, L. A., Alpert, P. A., Breckels, M. N., Brooks, I. M., Browse, J., Burrows, S. M., Carslaw, K. S., Huffman, J. A., Judd, C., Kilthau, W. P., Mason, R. H., McFiggans, G., Miller, L. A., Najera, J. J., Polishchuk, E., Rae, S., Schiller, C. L., Si, M., Temprado, J. V., Whale, T. F., Wong, J. P., Wurl, O., Yakobi-Hancock, J. D., Abbatt, J. P., Aller, J. Y., Bertram, A. K., Knopf, D. A., and Murray, B. J.: A marine biogenic source of atmospheric ice-nucleating particles, Nature, 525, 234–238, https://doi.org/10.1038/nature14986, 2015.
Xiao, H.-W., Xiao, H.-Y., Shen, C.-Y., Zhang, Z.-Y., and Long, A.-M.: Chemical Composition and Sources of Marine Aerosol over the Western North Pacific Ocean in Winter, Atmosphere, 9, 298, https://doi.org/10.3390/atmos9080298, 2018.
Young, K. C.: A numerical simulation of wintertime, orographic precipitation: Part I. Description ofmodelmicrophysics and numerical techniques, J. Atmos. Sci., 31, 1735–1748, https://doi.org/10.1175/1520-0469(1974)031<1735:ANSOWO>2.0.CO;2, 1974.
Yue, S., Li, L., Xu, W., Zhao, J., Ren, H., Ji, D., Li, P., Zhang, Q., Wei, L., Xie, Q., Pan, X., Wang, Z., Sun, Y., and Fu, P.: Biological and Nonbiological Sources of Fluorescent Aerosol Particles in the Urban Atmosphere, Environ. Sci. Technol., 56, 7588–7597, https://doi.org/10.1021/acs.est.1c07966, 2022.
Zaizen, Y., Okada, K., Ikegami, M., Sawa, Y., and Makino, Y.: Number-size Distributions of Aerosol Particles in the Free Troposphere over the Northwestern Pacific Ocean-Influence of Asian Outflow and Tropical Air Transport, J. Meteorol. Soc. Jpn., 82, 1147–1160, https://doi.org/10.2151/jmsj.2004.1147, 2004.
Zhang, X., Xu, X., Chen, H., Hu, X.-M., and Gao, L.: Dust-planetary boundary layer interactions amplified by entrainment and advections, Atmos. Res., 278, 106359, https://doi.org/10.1016/j.atmosres.2022.106359, 2022.
Zhou, C., Liu, Y., and Wang, Q.: Calculating the Climatology and Anomalies of Surface Cloud Radiative Effect Using Cloud Property Histograms and Cloud Radiative Kernels, Adv. Atmos. Sci., 39, 2124–2136, https://doi.org/10.1007/s00376-021-1166-z, 2022.
Ziemba, L. D., Beyersdorf, A. J., Chen, G., Corr, C. A., Crumeyrolle, S. N., Diskin, G., Hudgins, C., Martin, R., Mikoviny, T., Moore, R., Shook, M., Thornhill, K. L., Winstead, E. L., Wisthaler, A., and Anderson, B. E.: Airborne observations of bioaerosol over the Southeast United States using a Wideband Integrated Bioaerosol Sensor, J. Geophys. Res.-Atmos., 121, 8506–8524, https://doi.org/10.1002/2015jd024669, 2016.
Zografou, O., Gini, M., Fetfatzis, P., Granakis, K., Foskinis, R., Manousakas, M. I., Tsopelas, F., Diapouli, E., Dovrou, E., Vasilakopoulou, C. N., Papayannis, A., Pandis, S. N., Nenes, A., and Eleftheriadis, K.: High-altitude aerosol chemical characterization and source identification: insights from the CALISHTO campaign, Atmos. Chem. Phys., 24, 8911–8926, https://doi.org/10.5194/acp-24-8911-2024, 2024.