the Creative Commons Attribution 4.0 License.
the Creative Commons Attribution 4.0 License.
 | 29 Aug 2024
Technical note: Evaluation of the Copernicus Atmosphere Monitoring Service Cy48R1 upgrade of June 2023
Athanasios Tsikerdekis
Melanie Ades
Mihai Alexe
Anna Carlin Benedictow
Yasmine Bennouna
Lewis Blake
Idir Bouarar
Simon Chabrillat
Richard Engelen
Quentin Errera
Johannes Flemming
Sebastien Garrigues
Jan Griesfeller
Vincent Huijnen
Luka Ilić
Antje Inness
John Kapsomenakis
Zak Kipling
Bavo Langerock
Augustin Mortier
Mark Parrington
Isabelle Pison
Mikko Pitkänen
Samuel Remy
Andreas Richter
Anja Schoenhardt
Michael Schulz
Valerie Thouret
Thorsten Warneke
Christos Zerefos
Vincent-Henri Peuch
The Copernicus Atmosphere Monitoring Service (CAMS) provides daily analyses and forecasts of the composition of the atmosphere, including the reactive gases such as O3, CO, NO2, HCHO and SO2; aerosol species; and greenhouse gases. The global CAMS analysis system (IFS-COMPO) is based on the ECMWF Integrated Forecasting System (IFS) for numerical weather prediction (NWP) and assimilates a large number of composition satellite products on top of the meteorological observations ingested in IFS. The CAMS system receives regular upgrades, following the upgrades of IFS. The last upgrade, Cy48R1, operational since 27 June 2023, was major with a large number of code changes, both for IFS-COMPO and for NWP. The main IFS-COMPO innovations include the introduction of full stratospheric chemistry; a major update of the emissions; a major update of the aerosol model, including the representation of secondary organic aerosol; several updates of the dust life cycle and optics; updates to the inorganic chemistry in the troposphere; and the assimilation of Visible Infrared Imaging Radiometer Suite (VIIRS) aerosol optical depth (AOD) and TROPOspheric Monitoring Instrument (TROPOMI) CO. The CAMS Cy48R1 upgrade was validated using a large number of independent measurement datasets, including surface in situ, surface remote sensing, routine aircraft, and balloon and satellite observations. In this paper we present the validation results for Cy48R1 by comparing them with the skill of the previous operational system (Cy47R3), with the independent observations as reference, for the period October 2022 to June 2023, during which daily forecasts from both cycles are available. Major improvements in skill are found for the ozone profile in the lower–middle stratosphere and for stratospheric NO2 due to the inclusion of full stratospheric chemistry. Stratospheric trace gases compare well with the Atmospheric Chemistry Experiment Fourier Transform Spectrometer (ACE-FTS) observations between 10 and 200 hPa, with larger deviations between 1 and 10 hPa. The impact of the updated emissions is especially visible over East Asia and is beneficial for the trace gases O3, NO2 and SO2. The CO column assimilation is now anchored by the Infrared Atmospheric Sounding Interferometer (IASI) instead of the Measurements Of Pollution in The Troposphere (MOPITT) instrument, which is beneficial for most of the CO comparisons, and the assimilation of TROPOMI CO data improves the model CO field in the troposphere. In general the aerosol optical depth has improved globally, but the dust evaluation shows more mixed results. The results of the 47 comparisons are summarised in a scorecard, which shows that 83 % of the evaluation datasets show a neutral or improved performance of Cy48R1 compared to the previous operational CAMS system, while 17 % indicate a (slight) degradation. This demonstrates the overall success of this upgrade.
- Article
(36111 KB) - Full-text XML
-
Supplement
(12622 KB) - BibTeX
- EndNote


The Copernicus Atmosphere Monitoring Service (CAMS, http://atmosphere.copernicus.eu, last access: 7 June 2024) is the service component of the European Earth Observation programme Copernicus focusing on atmospheric composition (Peuch et al., 2022). The CAMS system was developed during a sequence of European research projects (Hollingsworth et al., 2008) and became an operational service in 2015. The CAMS global near-real-time (NRT) service provides daily analyses and 5 d forecasts of reactive trace gases and aerosol concentrations, as well as delayed-mode greenhouse gas analyses and forecasts. CAMS makes use of the measurements of the fleet of Copernicus Earth observation satellites, the Sentinel missions, as well as other relevant satellite and surface observations. Apart from the near-real-time products, CAMS produces global reanalyses for reactive gases and aerosols (Inness et al., 2019; Flemming et al., 2017) and greenhouse gases (Agustí-Panareda et al., 2023). CAMS furthermore produces daily forecasts and analyses of air quality in Europe based on an ensemble of air quality models (Peuch et al., 2022; Marécal et al., 2015).
The global CAMS system is part of the Integrated Forecasting System (IFS) of ECMWF, a system used to produce medium-range numerical weather predictions (NWPs) (ECMWF, 2024h). The modelling of reactive gases, aerosols and greenhouse gases is fully integrated in IFS (ECMWF, 2023). The assimilation of satellite data for atmospheric composition is part of the IFS 4D-Var data assimilation suite, and CAMS assimilates the complete set of meteorological observations together with the composition data. CAMS forecasts are therefore combined weather–composition forecasts. The extended IFS system developed by CAMS for trace gases and aerosols is referred to as IFS-COMPO. A second CAMS system, IFS-GHG, is developed for CO2 and CH4 analyses, (high-resolution) forecasts, and reanalyses. This paper focuses on the evaluation of the IFS-COMPO NRT products.
The CAMS effort (Peuch et al., 2022) includes dedicated scientific activities to continuously develop and improve the modelling and satellite assimilation aspects of IFS-COMPO, including the chemistry code (Flemming et al., 2015; Huijnen et al., 2016, 2019) and the development of the aerosol scheme (Rémy et al., 2019, 2022). The data assimilation of reactive gases is described in Inness et al. (2015). Recent extensions relevant to Cy48R1 include the modelling of stratospheric chemistry (Huijnen et al., 2016; Chabrillat et al., 2023) and the assimilation of TROPOspheric Monitoring Instrument (TROPOMI) CO (Inness et al., 2022b) and Visible Infrared Imaging Radiometer Suite (VIIRS) aerosol optical depth (AOD) (Garrigues et al., 2023). Since Cy48R1, the IFS upgrade documentation has also included a chapter with a detailed discussion of the IFS-COMPO-related modelling and data assimilation changes (ECMWF, 2023).
The CAMS service makes extensive use of independent measurement datasets of proven quality, available for different parts of the world, to evaluate the quality of the forecast, analysis and reanalysis products (Eskes et al., 2015; Katragkou et al., 2015; Lefever et al., 2015; Cuevas et al., 2015; Wagner et al., 2021; Agustí-Panareda et al., 2023). A total on the order of 65 measurement collections are used, obtained from observational networks like the Network for the Detection of Atmospheric Composition Change (NDACC), the World Meteorological Organization Global Atmosphere Watch (WMO-GAW) programme, the Aerosol Robotic Network (AERONET), the In-service Aircraft for a Global Observing System (IAGOS), the Integrated Carbon Observation System (ICOS) and the International Arctic Systems for Observing the Atmosphere (IASOA) and from space organisations like the National Aeronautics and Space Administration (NASA), European Space Agency (ESA), the European Organisation for the Exploitation of Meteorological Satellites (EUMETSAT), and others. The CAMS global near-real-time service component is evaluated in a series of validation reports that are produced every 3 months (Benedictow et al., 2023; ECMWF, 2024d). The CAMS reanalysis validation reports for the aerosols and reactive gases (Bennouna et al., 2023) and greenhouse gases (GHGs) (Ramonet et al., 2021) are updated on a yearly basis. Note that the production of the GHG reanalysis was interrupted (Agustí-Panareda et al., 2023) for a few years due to a degraded quality of the input satellite data. New system upgrades are evaluated before becoming operational, with CAMS Cy47R3 discussed in Eskes et al. (2021) and Cy48R1 in Eskes et al. (2023b).
The ECMWF NWP and CAMS operational systems are upgraded at the same time and follow the same model cycles. A CAMS upgrade implies, therefore, a simultaneous upgrade of the NWP part of IFS in IFS-COMPO and IFS-GHG. The last upgrade (and topic of this paper) is the upgrade from Cy47R3 to Cy48R1, implemented on 27 June 2023. Upgrades normally occur at least once a year, but Cy48R1 includes almost 2 years of developments. The delay is linked to the move of the ECMWF high-performance computing facilities from Reading, UK, to Bologna, Italy. As a result, Cy48R1 represents a major upgrade both for NWP and for CAMS. Detailed information about the ECMWF IFS upgrades can be found in ECMWF (2024h).
The CAMS pre-operational analyses and forecasts of CO2 and CH4 use an independent configuration of the IFS. The upgrade of the greenhouse gas system to Cy48R1 took place on 27 February 2024, and a separate upgrade verification report was written (Langerock et al., 2024). The greenhouse gas products will not be discussed in this paper.
Before each upgrade, the new analysis and forecast configuration is operated as a so-called experimental suite or e-suite in parallel to the operational near-real-time service (the o-suite, e.g. Cy47R3 in this paper) for about half a year. For the 27 June 2023 upgrade to Cy48R1, the e-suite run is available from 1 October 2022 to the moment of the upgrade, 27 June 2023. This implies that there is only a limited 9 months of data in the autumn, winter and spring available to the evaluation, with a focus on wintertime. The choice to generate 9 months of the e-suite data is made based on practical timing and computer resource considerations. The length of the e-suite run has been discussed in the CAMS team, and for the next upgrade to Cy49R1, planned for the end of 2024, the e-suite will hopefully cover a full year. CAMS also produces control runs without the assimilation of atmospheric composition data. The control runs allow us to distinguish changes due to the model from changes due to the assimilation of the atmospheric composition observations.
In this paper, the validation results are presented from comparisons of the performance of the Cy48R1 e-suite runs and e-suite control run with the operational run (o-suite and o-suite control run), all compared with independent observations. Prior to the upgrade, a preliminary evaluation of the new cycle was presented in a CAMS report (Eskes et al., 2023b), but this evaluation covered a relatively short period of about 5 months of CAMS results that were available at the time. This paper extends the validation by several months by including e-suite and o-suite analyses and forecasts up to the day of the upgrade, leading to more refined conclusions.
In Sect. 2 we summarise the changes implemented in Cy48R1, and in Sect. 3 we provide an overview of the validation datasets used. The validation results are shown in Sect. 4 in the form of a series of plots comparing e-suite, o-suite and independent observations.
The operational CAMS global system provides analyses of the atmospheric composition of aerosols and reactive gases worldwide by blending satellite data and atmospheric simulation through a process called data assimilation. An overview of all satellite datasets assimilated in the CAMS global system can be found in Peuch et al. (2022) and Eskes et al. (2023b). Further details on the different production runs and their data usage can be found on the CAMS global product website (ECMWF, 2024e). The history of CAMS system upgrades, the data products, the satellite data assimilated (and monitored) and relevant references are available on the CAMS data documentation website (ECMWF, 2024b), while the results of the operational satellite data monitoring are available on the CAMS data-monitoring website (ECMWF, 2024c). CAMS is continually extending its activity by testing and using new emerging datasets such as trace gas retrievals from the geostationary instruments, the Geostationary Environmental Monitoring Spectrometer (GEMS) and Tropospheric Emissions: Monitoring of Pollution (TEMPO); using improved retrievals from past and present missions; and preparing for future missions such as Sentinel-4 and Sentinel-5.
Copernicus products are made available for free. The CAMS products can be accessed through the Atmosphere Data Store (ADS) at https://ads.atmosphere.copernicus.eu/ (last access: 7 June 2024). The available o-suite output includes analysis fields available every 3 h, for the two 12 h analysis windows per day: twice-daily 5 d forecasts starting from the analysis at 00:00 and 12:00 UTC, with 2D fields available hourly and 3D fields available every 3 h. The output includes a large number of trace gases, aerosol composition and optical properties of the aerosols, as detailed on the ADS. Most of the comparisons documented below make use of the first 24 h of the forecast runs starting 00:00 UTC, which allows a direct comparison with the control run. For some comparisons the analysis results were used, as indicated.
A control run is produced for both the e-suite (e-suite control run) and the o-suite (o-suite control run). These runs are useful for distinguishing the impact of data assimilation changes from the impact of modelling changes. The control run applies the same settings as the respective o-suite and e-suite, but the data assimilation is not switched on for atmospheric composition. The meteorology in the control run is initialised with the meteorological fields from the o-suite (or e-suite). The control run archive contains 5 d forecasts starting from the 00:00 UTC analysis.
The global forecasting system is continually being evaluated to ensure the output meets the expected requirements. Comprehensive evaluation and quality assurance (EQA) reports are provided for the CAMS system on a quarterly basis (ECMWF, 2024d). CAMS uses a multitude of independent datasets to routinely monitor its global forecasts. It works with various data providers, acquiring the observations with appropriate timelines and generating graphics that show the differences between the forecasts and the independent observations (ECMWF, 2024g). The two main websites are the global evaluation server for near-real-time analysis and forecast products (ECMWF, 2024f) and the AeroVal evaluation server to evaluate the reanalysis products (ECMWF, 2024a).
In the next subsections, the model, data assimilation and emissions upgrades of the CAMS e-suite (Cy48R1) are summarised, and the observations used are introduced.
2.1 The CAMS e-suite (Cy48R1)
This upgrade encompasses several significant scientific advancements. Detailed documentation of the CAMS Cy48R1 upgrade for aerosols and reactive gases is available in ECMWF (2023). More information regarding the aerosol/chemistry changes and the meteorological changes is provided in ECMWF (2024i) and CAMS (2024), respectively. In the following subsections the model, assimilation and emissions updates are summarised.
2.1.1 Model updates
The CAMS IFS cycle 48R1 is based on the ECMWF's IFS cycle 48R1. The model consists of gas-phase chemistry modules for the troposphere (based on the CB05 scheme; see Williams et al., 2022, and references therein) and the stratosphere (based on the Belgian Assimilation System for Chemical ObsErvations (BASCOE) scheme; see Errera et al., 2019, and Huijnen et al., 2016, and references therein) that includes 123 active tracers. The distinction between the tropospheric and stratospheric chemistry schemes occurs at the tropopause, which is determined based on the temperature lapse rate of the model. The aerosol scheme AER (originally based on the Laboratoire de Météorologie Dynamique general circulation model (LMDZT GCM); Reddy, 2005) is a bulk-bin scheme that consists of 16 active species, which are coupled with the chemistry schemes in various ways (ECMWF, 2023).
Before Cy48R1, only ozone was modelled in the stratosphere using a linear parameterisation. The stratospheric chemistry module activated in Cy48R1 (Huijnen et al., 2016) is a re-implementation of the BASCOE chemical module, and it involves 64 species engaging in 157 gas-phase, 9 heterogeneous and 53 photolytic reactions (Errera et al., 2019). It encompasses ozone-depleting substances, greenhouse gases and other species vital for comprehensive stratospheric ozone photochemistry (Chabrillat et al., 2023). Additionally, basic sulfur chemistry is included to represent gas-phase sulfuric acid formation and enable coupling with the sulfate aerosol module, featuring OCS, SO2, SO3 and H2SO4 reactions. Note that the 64 tracers listed as active in stratospheric chemistry include HCN and CH3CN, as well as the tracers to represent sulfur chemistry, which are additions specific to CAMS, on top of the default BASCOE chemistry with 58 species described in Errera et al. (2019).
In the troposphere, inorganic chemistry was updated; hydrogen cyanide (HCN) and acetonitrile (CH3CN) are now included as long-lived tracers, serving as indicators of biomass burning activity. For the degradation of organic compounds, the basic isoprene oxidation scheme was replaced with a more explicit approach based on Stavrakou et al. (2010) and further modified according to Lamarque et al. (2012) and Myriokefalitakis et al. (2020). This updated scheme contains reaction products including glyoxal (CHOCHO), glycolaldehyde, isoprene peroxide, hydroxyacetone and two hydroxyaldehydes (Williams et al., 2022). The scheme was further expanded to include an explicit parameterisation of the aromatics tracers xylene and toluene, acting as precursors for secondary organic aerosol (SOA).
Recent developments of the CAMS aerosol modelling are described in Rémy et al. (2022). The Cy48R1 upgrade introduced notable changes in aerosol. The SOA species are now represented with dedicated tracers, distinguishing biogenic and anthropogenic origins, and coupled with the tropospheric chemistry for their production. The e-folding time that converts hydrophobic components of organic matter (OM) and black carbon (BC) into hydrophilic forms has been decreased to 2.8 h from 1.16 d. The assumed number size distribution for dust, which used to compute the offline dust aerosol optical properties (mass extinction, single-scattering albedo and asymmetry parameter), has been updated based on values from Ryder et al. (2018) derived from aircraft measurements over the tropical eastern Atlantic. The refractive index has also been updated. The dust source function, which is used to modulate dust emissions, has been recomputed based on a 3-year analysis of the MIDAS product (Gkikas et al., 2021), leading to monthly variations instead of fixed yearly values. A regional redistribution of total dust emissions into the three dust bins has been implemented, based on long simulations of dust mineralogy, which directs relatively high emissions to finer dust bins (1 and 2) compared to Cy47R3. The dust mass emissions and burden are significantly higher in Cy48R1 (see details in ECMWF, 2023), which leads to an increase in dust optical depth globally by about 30 %. Note however that the mass extinction coefficient (MEC), which is calculated by dividing aerosol optical depth by aerosol mass, is reduced for dust in Cy48R1 (Fig. S1 in the Supplement). Thus, although dust optical depth increases, dust mass extinction efficiency decreases. A new parameterisation for the rebound effect of super-coarse dust particles over continental surfaces, relying on Zhang (2001), was added, which reduces dry deposition for those particles. In addition, sedimentation, previously limited to super-coarse dust and sea salt, is now applied broadly to all aerosol tracers, although the impact is mainly significant in the stratosphere, where sedimentation is the dominant sink.
The aerosol optical properties of aerosols have received several updates in Cy48R1. The inclusion of a specific SOA species distinguishes primary from secondary OM. The new set of optical properties for OM, based on Brown et al. (2018), leads to higher extinction, particularly in low-relative-humidity conditions. Notably, the refractive index used in Cy48R1 results in more absorbing organic matter in the UV and near-UV regions, characterised as brown carbon. Further, a scaling factor (1.375) applied to the mass extinction of sulfate aerosol, previously based on the molar mass ratio of ammonium sulfate to sulfate, has been removed as ammonium is now a separate species (since cycle 46R1).
Nitrate and ammonium aerosols were added to the aerosol species in Cy46R1 whilst simultaneously the SO2 precursor was removed. However, the update to the new species as part of the aerosol data assimilation process was not correctly included (see Benedetti et al., 2009, for a full description of the aerosol assimilation process). This was fixed in Cy48R1, leading to increments now being added to both fine and coarse nitrate and ammonium.
2.1.2 Assimilation updates
The assimilated products in the operational CAMS system are visualised in Fig. S2. The assimilation of TROPOMI total column CO became operational on 28 April 2023 in Cy48R1 (only the last months of the e-suite period). The impact of this inclusion was tested from July to December 2021 (Inness et al., 2022a). The results showed an 8 % increase in CAMS total column CO. The assimilation impact was significant during periods of high CO emissions from boreal wildfires in July and August 2021. While TROPOMI CO assimilation enhanced column constraints, it had limited influence on individual plumes transported across continents and oceans above 500 hPa.
The CAMS aerosol data assimilation system has depended on the Moderate Resolution Imaging Spectroradiometer (MODIS) instrument for more than 10 years. To ensure forecast continuity, as the MODIS instrument is ageing, the assimilation of AOD from NOAA VIIRS AOD from the Suomi National Polar-orbiting Partnership (S-NPP) and the NOAA-20 satellite was tested (Garrigues et al., 2023); it was activated in Cy47R3 in February 2023 and is also active in Cy48R1. Experiments assimilating VIIRS on top of MODIS or in place of MODIS in the IFS cycle were carried out from June to November 2020. A comparison with AERONET revealed that both experiments resulted in overall lower bias, notably in Europe, Africa and Southeast Asia, with substantial improvements over desert and maritime aerosol sites.
The assimilation of data from different satellite instruments can introduce biases compared to each other or the model. To address this, a bias correction scheme, known as variational bias correction (VarBC), is employed. VarBC introduces additional degrees of freedom, represented as bias parameters, into the 4D-Var cost function's observational term. Observational datasets that do not use VarBC are considered anchors and are crucial for preventing drifts in the fields (Inness et al., 2013). Note that in Cy48R1 the anchor for CO was changed from the Measurements Of Pollution in The Troposphere (MOPITT) instrument (Terra) to the Infrared Atmospheric Sounding Interferometer (IASI; Metop-C) and TROPOMI (Sentinel-5P), while the new anchor for AOD is now VIIRS (on the NOAA-20 satellite).
Cy48R1 includes a new volcanic SO2 tracer (VSO2) in addition to the SO2 tracer. VSO2 is currently not coupled to the chemistry but uses an e-folding lifetime of 7 d. TROPOMI SO2 data with layer height information are assimilated into the VSO2 tracer following the method described in Inness et al. (2022a).
On 15 December 2022, still in Cy47R3, an update of the background error covariance wavelet file was implemented to use the correct NWP background errors. The update leads to considerably improved NWP forecast scores. As a consequence, changes to AOD and upper-tropospheric and lower-stratospheric ozone are also expected. The comparisons presented below cover the period October 2022–June 2023. The impact of this change is observed in ozone when comparing the first 2 months with the months in 2023.
2.1.3 Emission updates
CAMS emissions are available from gridded inventories per sector (Denier van der Gon et al., 2023), except the emissions from dust and sea salt aerosols, which are calculated online (ECMWF, 2023). Most emission inventories are at a monthly resolution, capturing the seasonal cycle. Only the emissions for biomass burning coming from GFAS v1.4 (Kaiser et al., 2012) are provided at a daily temporal resolution, including injection heights. Specifically in Cy48R1, the model uses anthropogenic emissions from CAMS-GLOB-ANT v5.3 (Soulie et al., 2023), aviation emission from CAMS-GLOB-AIR v1.1, biogenic emissions from a climatology constructed from CAMS-GLOB-BIO v3.1 (Sindelarova et al., 2022) and natural emissions of dimethyl sulfide (DMS) over the ocean from CAMS-GLOB-OCE v3.1. For reference, in cycle 47R3 the anthropogenic emissions were based on CAMS-GLOB-ANT v4.2 and biogenic emissions on CAMS-GLOB-BIO v3.1.
Natural emissions use a monthly mean climatology. For varying volcanic SO2 emissions, a climatology is constructed based on recent satellite-based inventories (Carn et al., 2017). In Cy48R1, a sector-specific treatment for any of the emissions is introduced, allowing sector-specific diurnal cycle profiles and injection heights; see Sect. 3.1.1 in ECMWF (2023) and Guevara et al. (2021) for more details.
The CAMS service includes activities dedicated to the validation of the global and regional (European) service products. The latest validation results for the CAMS-global near-real-time service (the o-suite) products can be found in Warneke et al. (2024), available in ECMWF (2024d), and the activity is described in Eskes et al. (2015). All CAMS validation reports for the global service products and the verification websites can be found in ECMWF (2024g).
The CAMS validation activity makes use of about 65 measurement datasets. It covers concentrations from the surface up to the stratosphere, using a wide range of instruments and measurement techniques, including surface in situ, surface remote sensing, aircraft and balloon in situ, and satellite observations.
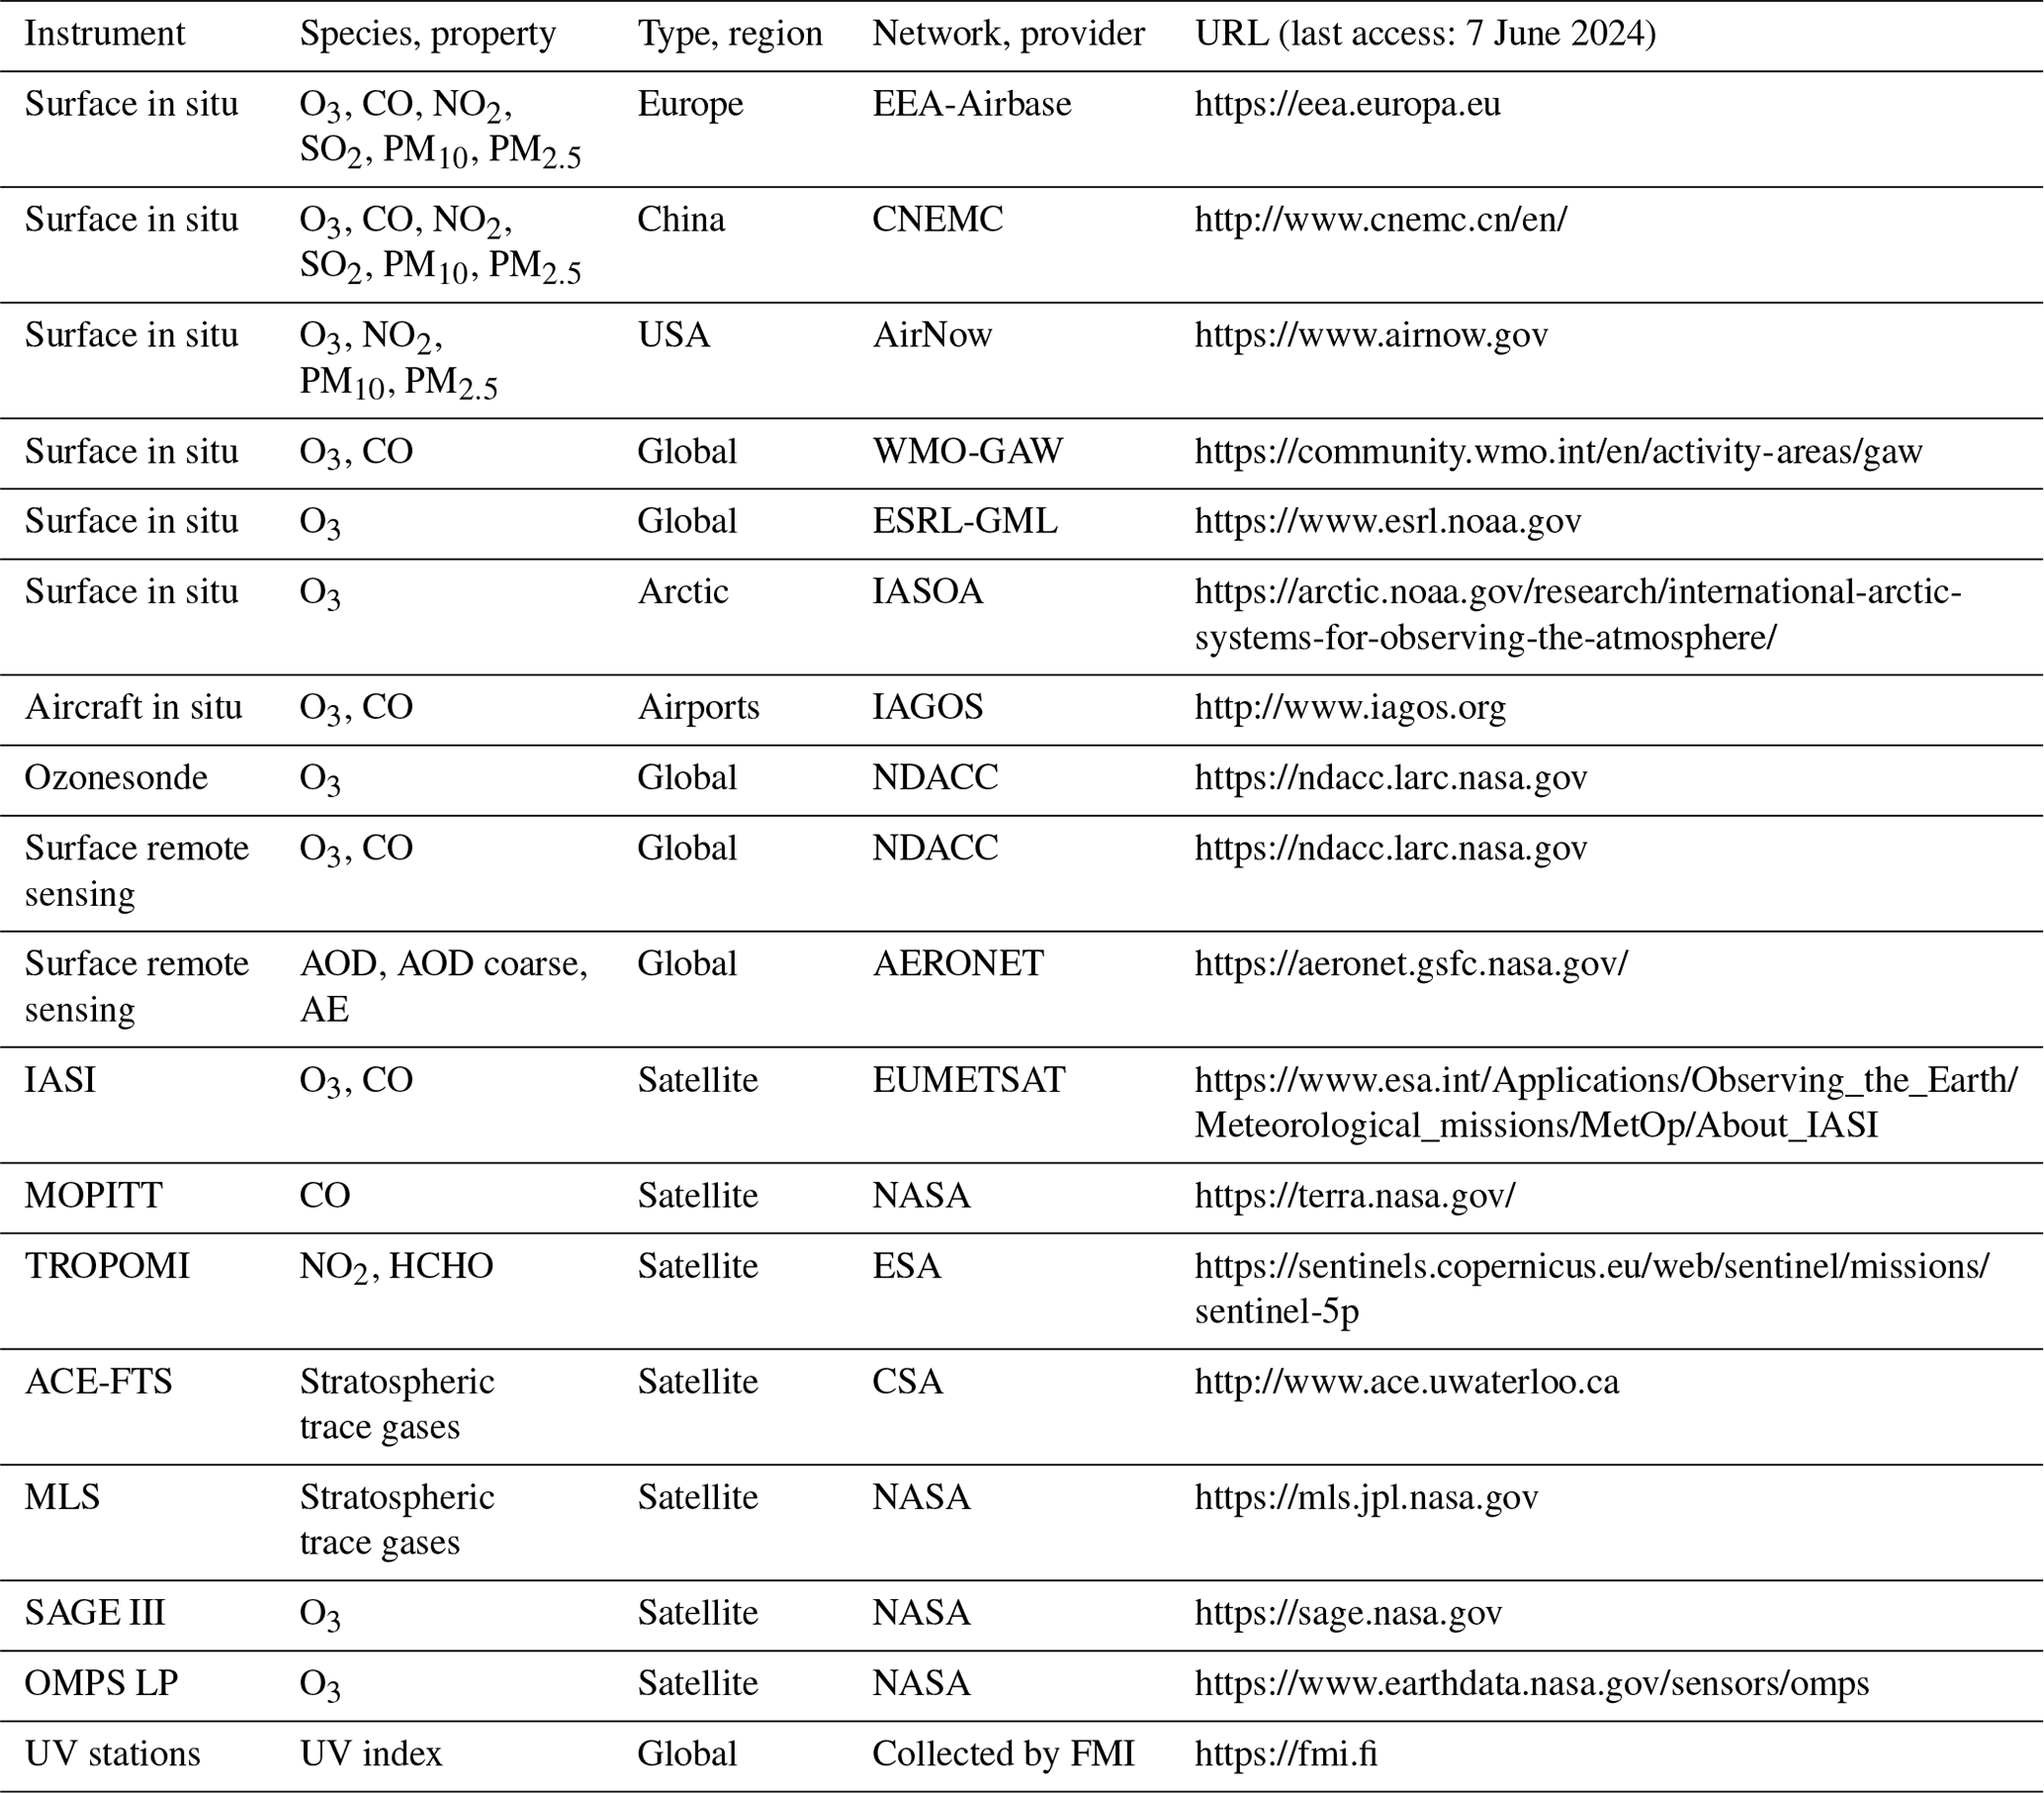
The observational datasets used for the evaluation of the Cy48R1 upgrade are summarised in Table 1. A description of all these diverse measurement datasets is beyond the scope of this paper. More details on the observation networks, instruments, measurement datasets and quality control can be found in the CAMS observations document (Eskes et al., 2023a) and in the list of references included in this document.
Table 1Observational datasets used for the evaluation of the CAMS Cy48R1 e-suite. AE denotes the Ångström exponent, and CSA denotes the Canadian Space Agency; other network abbreviations can be found in the main text.
The CAMS daily forecast and analysis products are evaluated on a regular 3-monthly basis. In practice this implies that only datasets can be used that are available within 1 month of real time. With several networks, such as NDACC, IAGOS or EEA surface observations, special arrangements (contracts) have been made such that near-real-time unvalidated data can be used. For instance, the IAGOS NRT data are only available for operational users such as the weather and air quality services (e.g. CAMS). These data are inspected and validated by the instrument principal investigator (PI) using a semi-automatic approach and become available as preliminary Level 1 (L1) data with a time delay of a few days, as described in Nédélec et al. (2015) for ozone and CO and in Petzold et al. (2015).
Many of the forecast-minus-observation results shown below make use of the following three metrics: the modified normalised mean bias (MNMB; a symmetric and normalised form to express the mean bias), the fractional gross error (FGE; a symmetric and normalised absolute mean difference) and the correlation (R). The scoring recommendations and metrics are discussed in Tsikerdekis et al. (2023).
In this section we will summarise the main findings of the comparison of the e-suite (Cy48R1) and o-suite (Cy47R3), where both are evaluated with the independent observational datasets discussed above. This is presented for individual trace gases and aerosol properties for the available observational datasets and for regions of interest. The evaluation is done for the period 1 October 2022 to 27 June 2023, when forecast results for both cycles are available. The corresponding e-suite control run (e-control) and o-suite control run (o-control), without the assimilation of the atmospheric composition satellite data, were also evaluated. The improvement in performance of e-suite compared to the o-suite is summarised in Table 2 for all of the observational datasets used for the evaluation. The individual entries of this scorecard are discussed in the subsections below.
Table 2Scorecard for the relative performance of the e-suite compared to the performance of the o-suite against observations. Meaning of the “Relative score” symbols: () the e-suite performs significantly better than the o-suite, (+) the e-suite shows small improvements, (n) (neutral) no significant difference between the o-suite and e-suite, (−) score is somewhat degraded in the e-suite, and () the e-suite performs significantly worse than the o-suite. Remote: remote sensing from surface station.
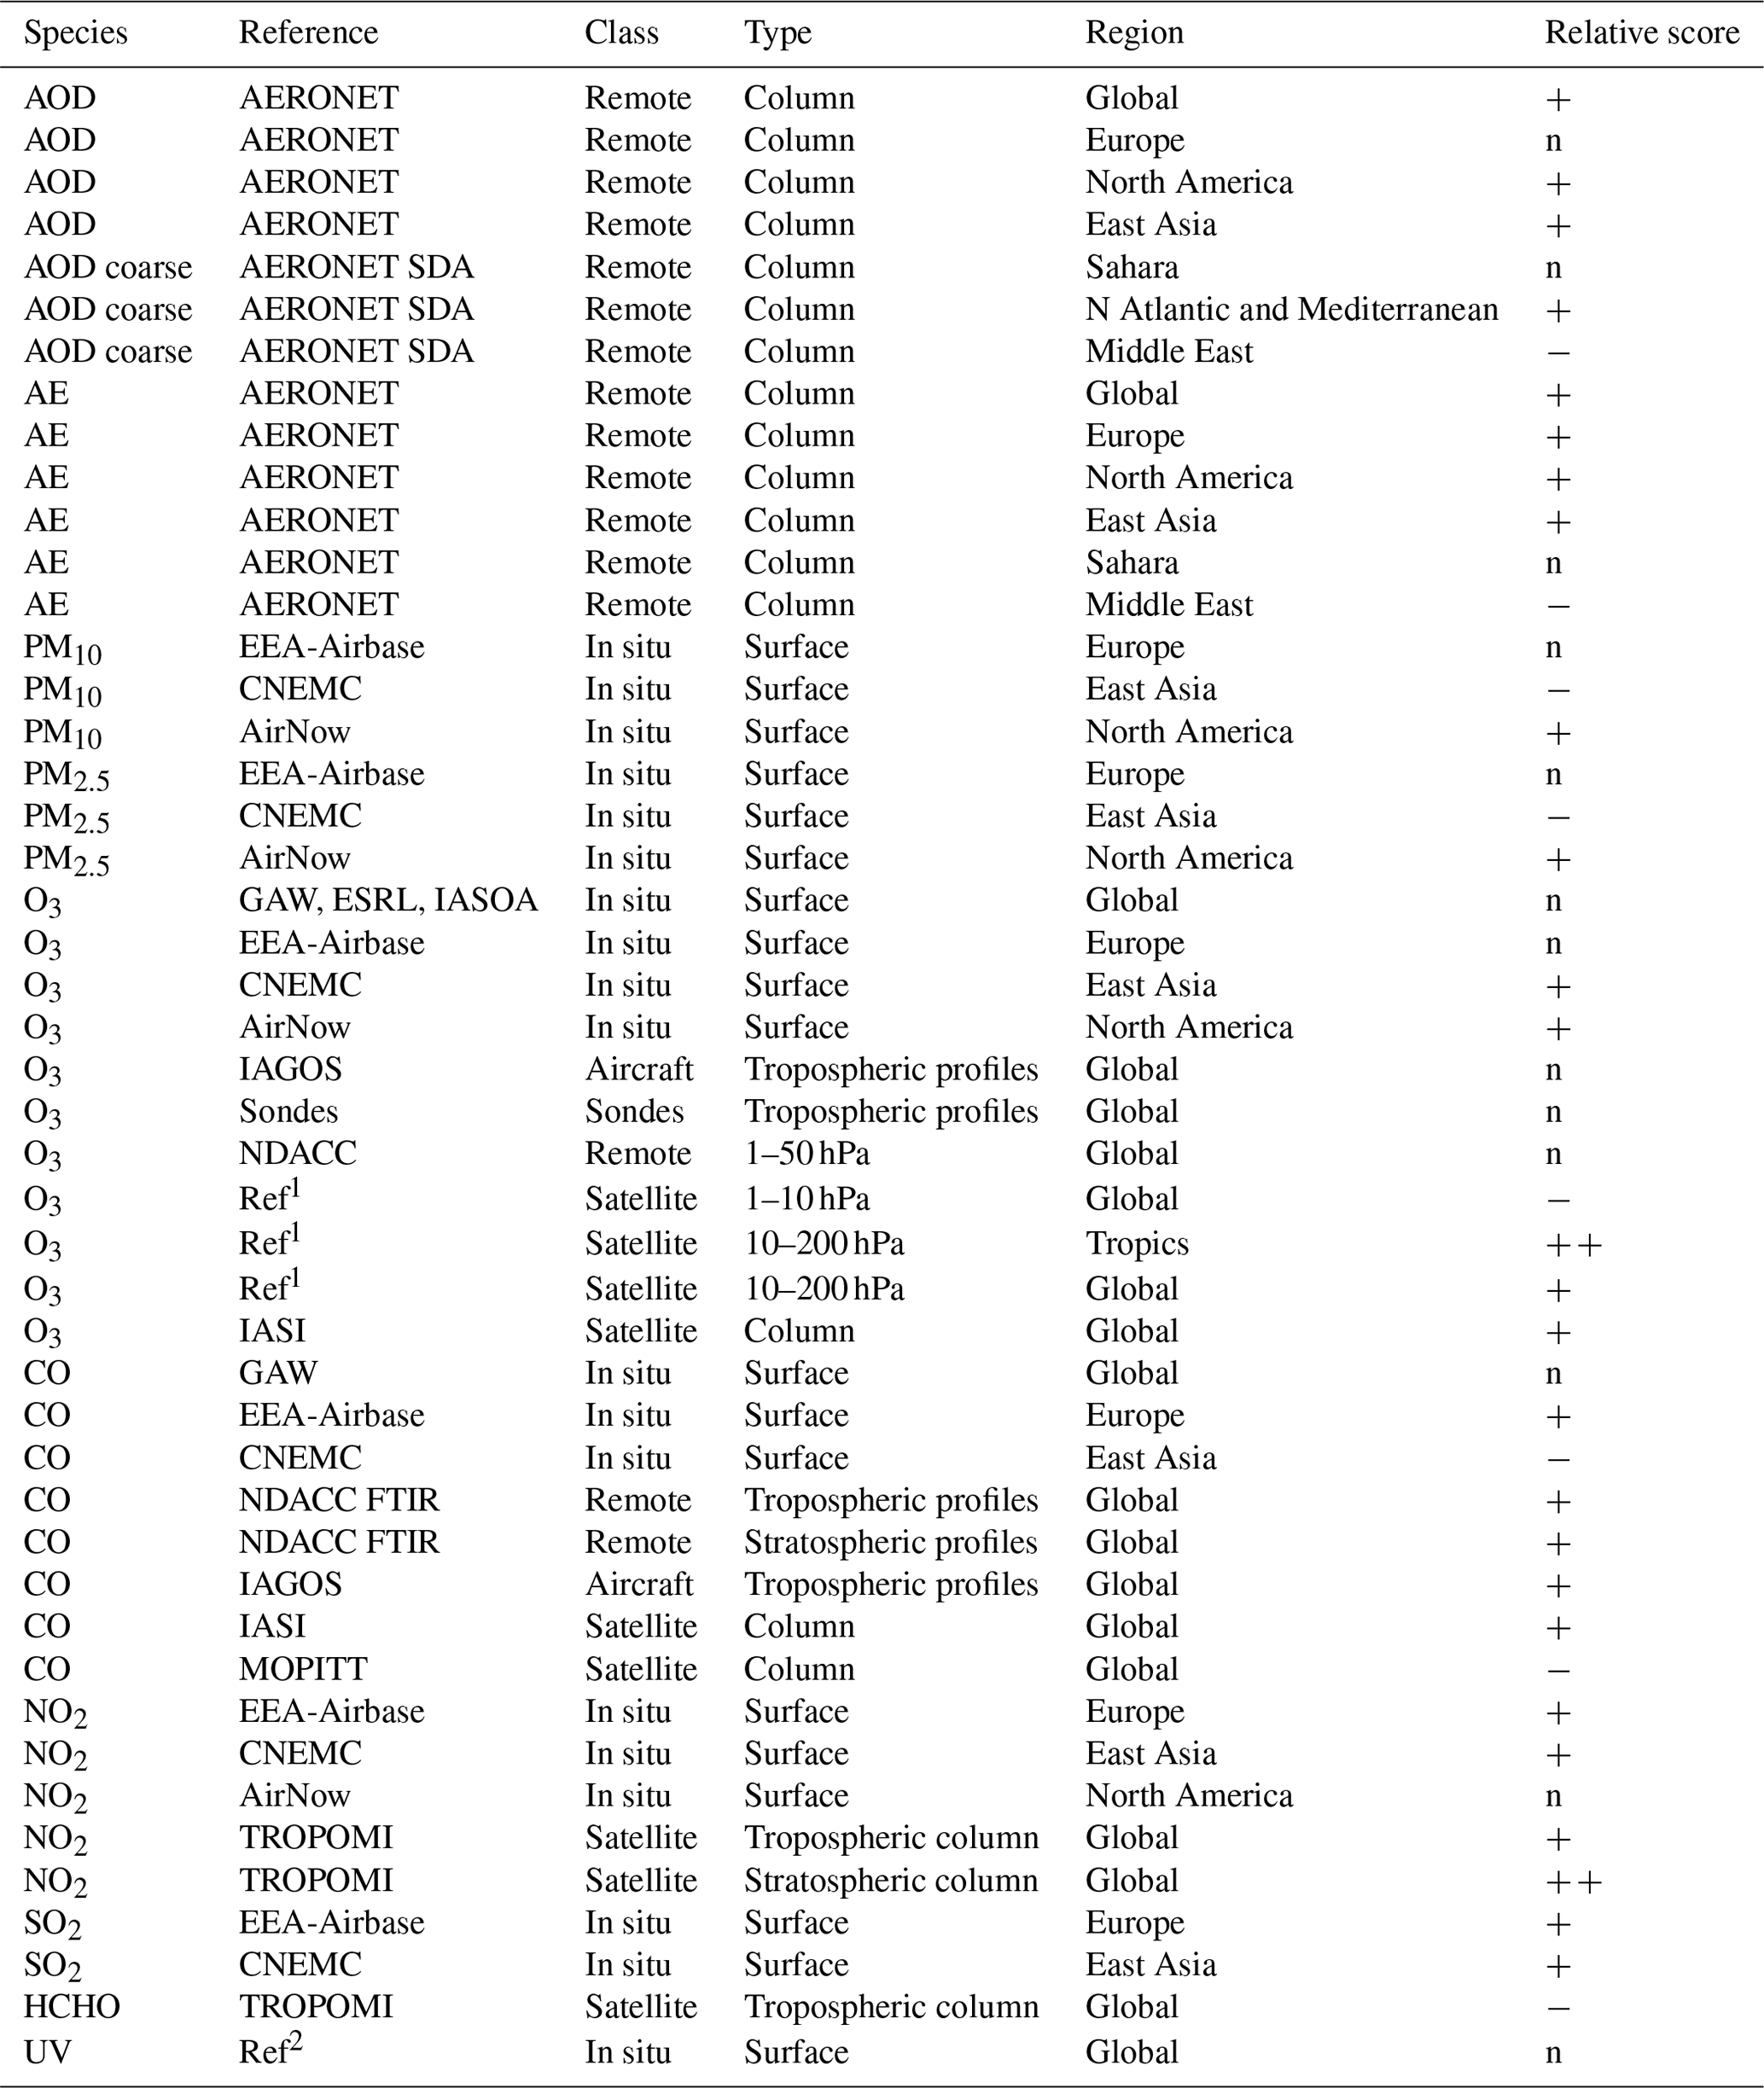
1 Based on the average statistics of ACE-FTS, SAGE III-ISS, OMPS LP, Aura MLS and ozonesondes. 2 Based on data from a network of stations collected by FMI.
4.1 Ozone (O3)
The ozone concentrations simulated by the CAMS e-suite and o-suite were evaluated using several surface measurements provided by WMO-GAW, NOAA Earth System Research Laboratories (ESRL), IASOA, the European Environment Agency air quality database (EEA-Airbase), the China National Environmental Monitoring Centre (CNEMC) and the US AirNow services; profile measurements from IAGOS and ozonesondes; and satellite total column observations from the Infrared Atmospheric Sounding Interferometer (IASI).
The comparison with surface observations over Europe (EEA-Airbase), Fig. 1, shows that MNMB of the e-suite is higher than that of the o-suite by up to 15 %, especially over central and northern Europe, changing some small underestimates into small overestimates. The e-suite temporal correlation improved slightly compared to the o-suite but not everywhere. The bias in the e-suite control run is slightly lower and improved compared to the o-suite control run, in agreement with comparisons with WMO-GAW and ESRL Global Monitoring Laboratory (ESRL-GML) observations.
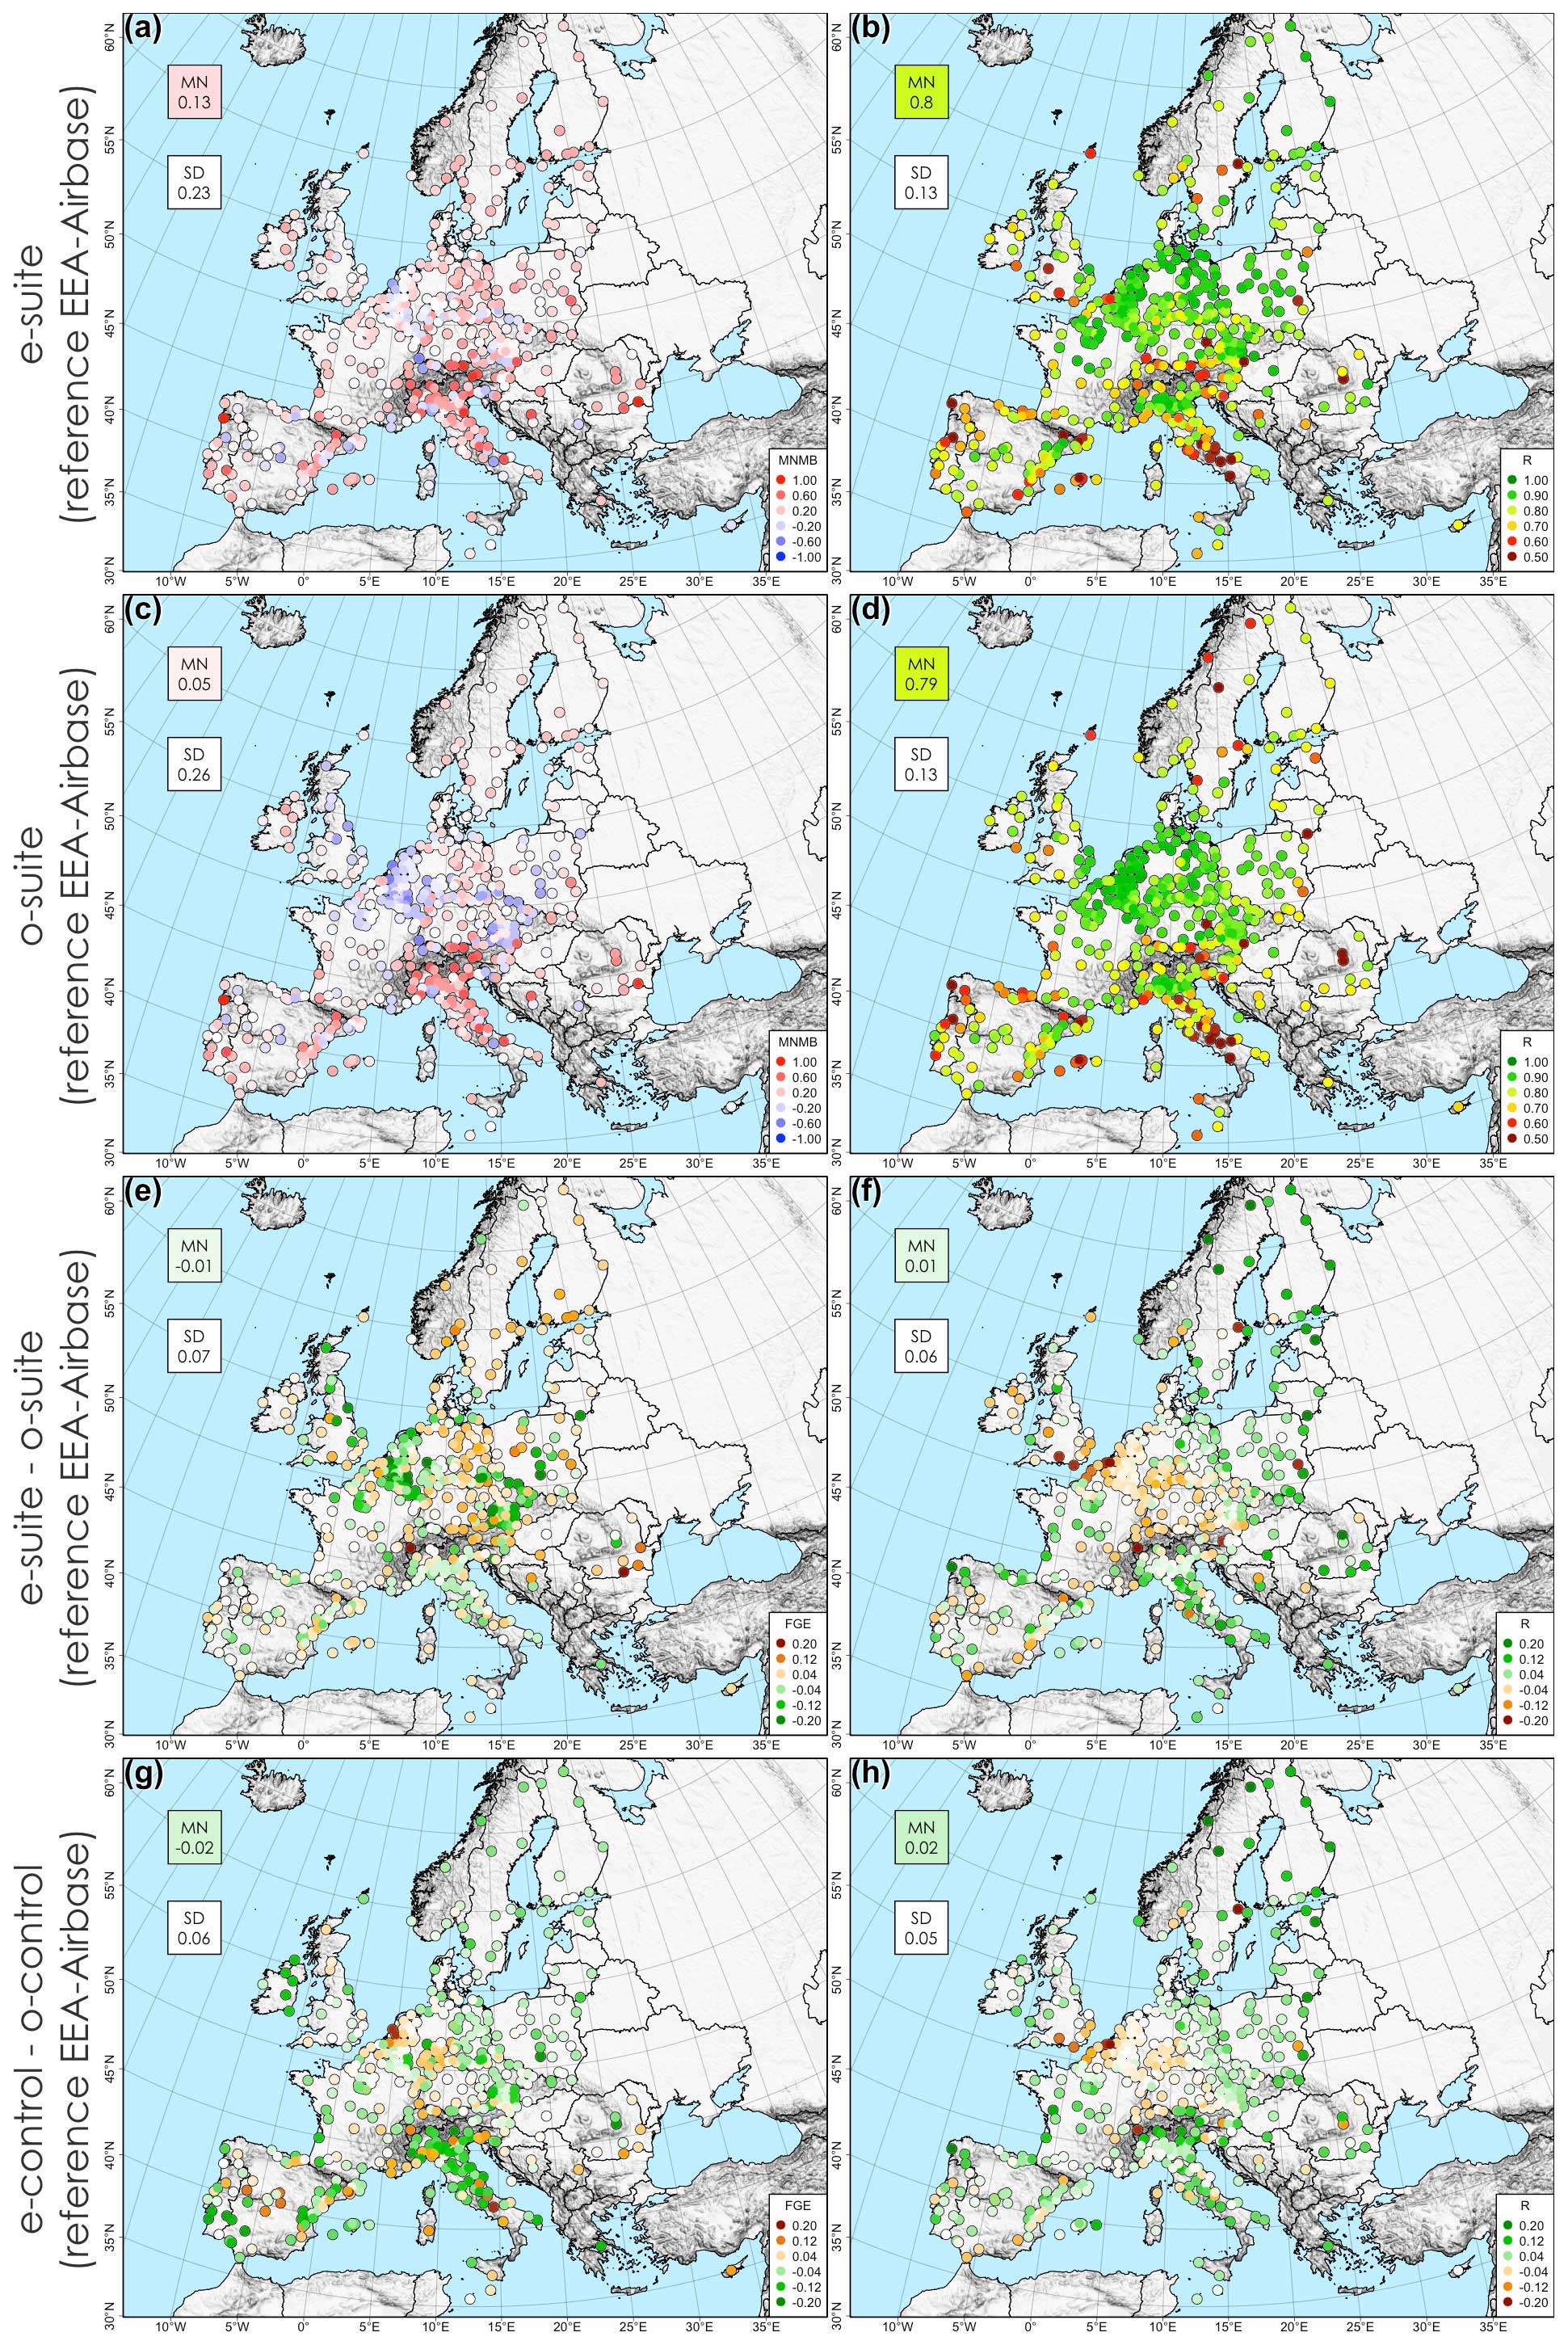
Figure 1Spatial distribution of the surface O3 evaluation over Europe, for the e-suite minus EEA-Airbase observations (a: MNMB; b: R), the o-suite minus observations (c: MNMB; d: R), the e-suite-minus-o-suite differences (e: FGE; f: R) and the e-control-minus-o-control differences (g: FGE; h: R) for the period 1 October to 27 June 2023. The mean (MN) and standard deviation (SD) for all stations are depicted for each map.
The surface ozone validation using observations from the China National Environmental Monitoring Centre, Fig. 2, shows that both the e-suite and the e-suite control runs reduce the negative bias observed for the o-suite and o-suite control runs over the northeastern region extending from Shanghai to Beijing. A slight improvement is also found over the megacity of Guangzhou in the south. This indicates less titration of ozone due to improved NO2 in the e-suite and e-suite control run – see also Sect. 4.3 below – which is likely linked to the anthropogenic emission update. The performance of the e-suite remained almost similar to that of o-suite in central and western China. The correlation on average is about 0.75 and is similar for all experiments.
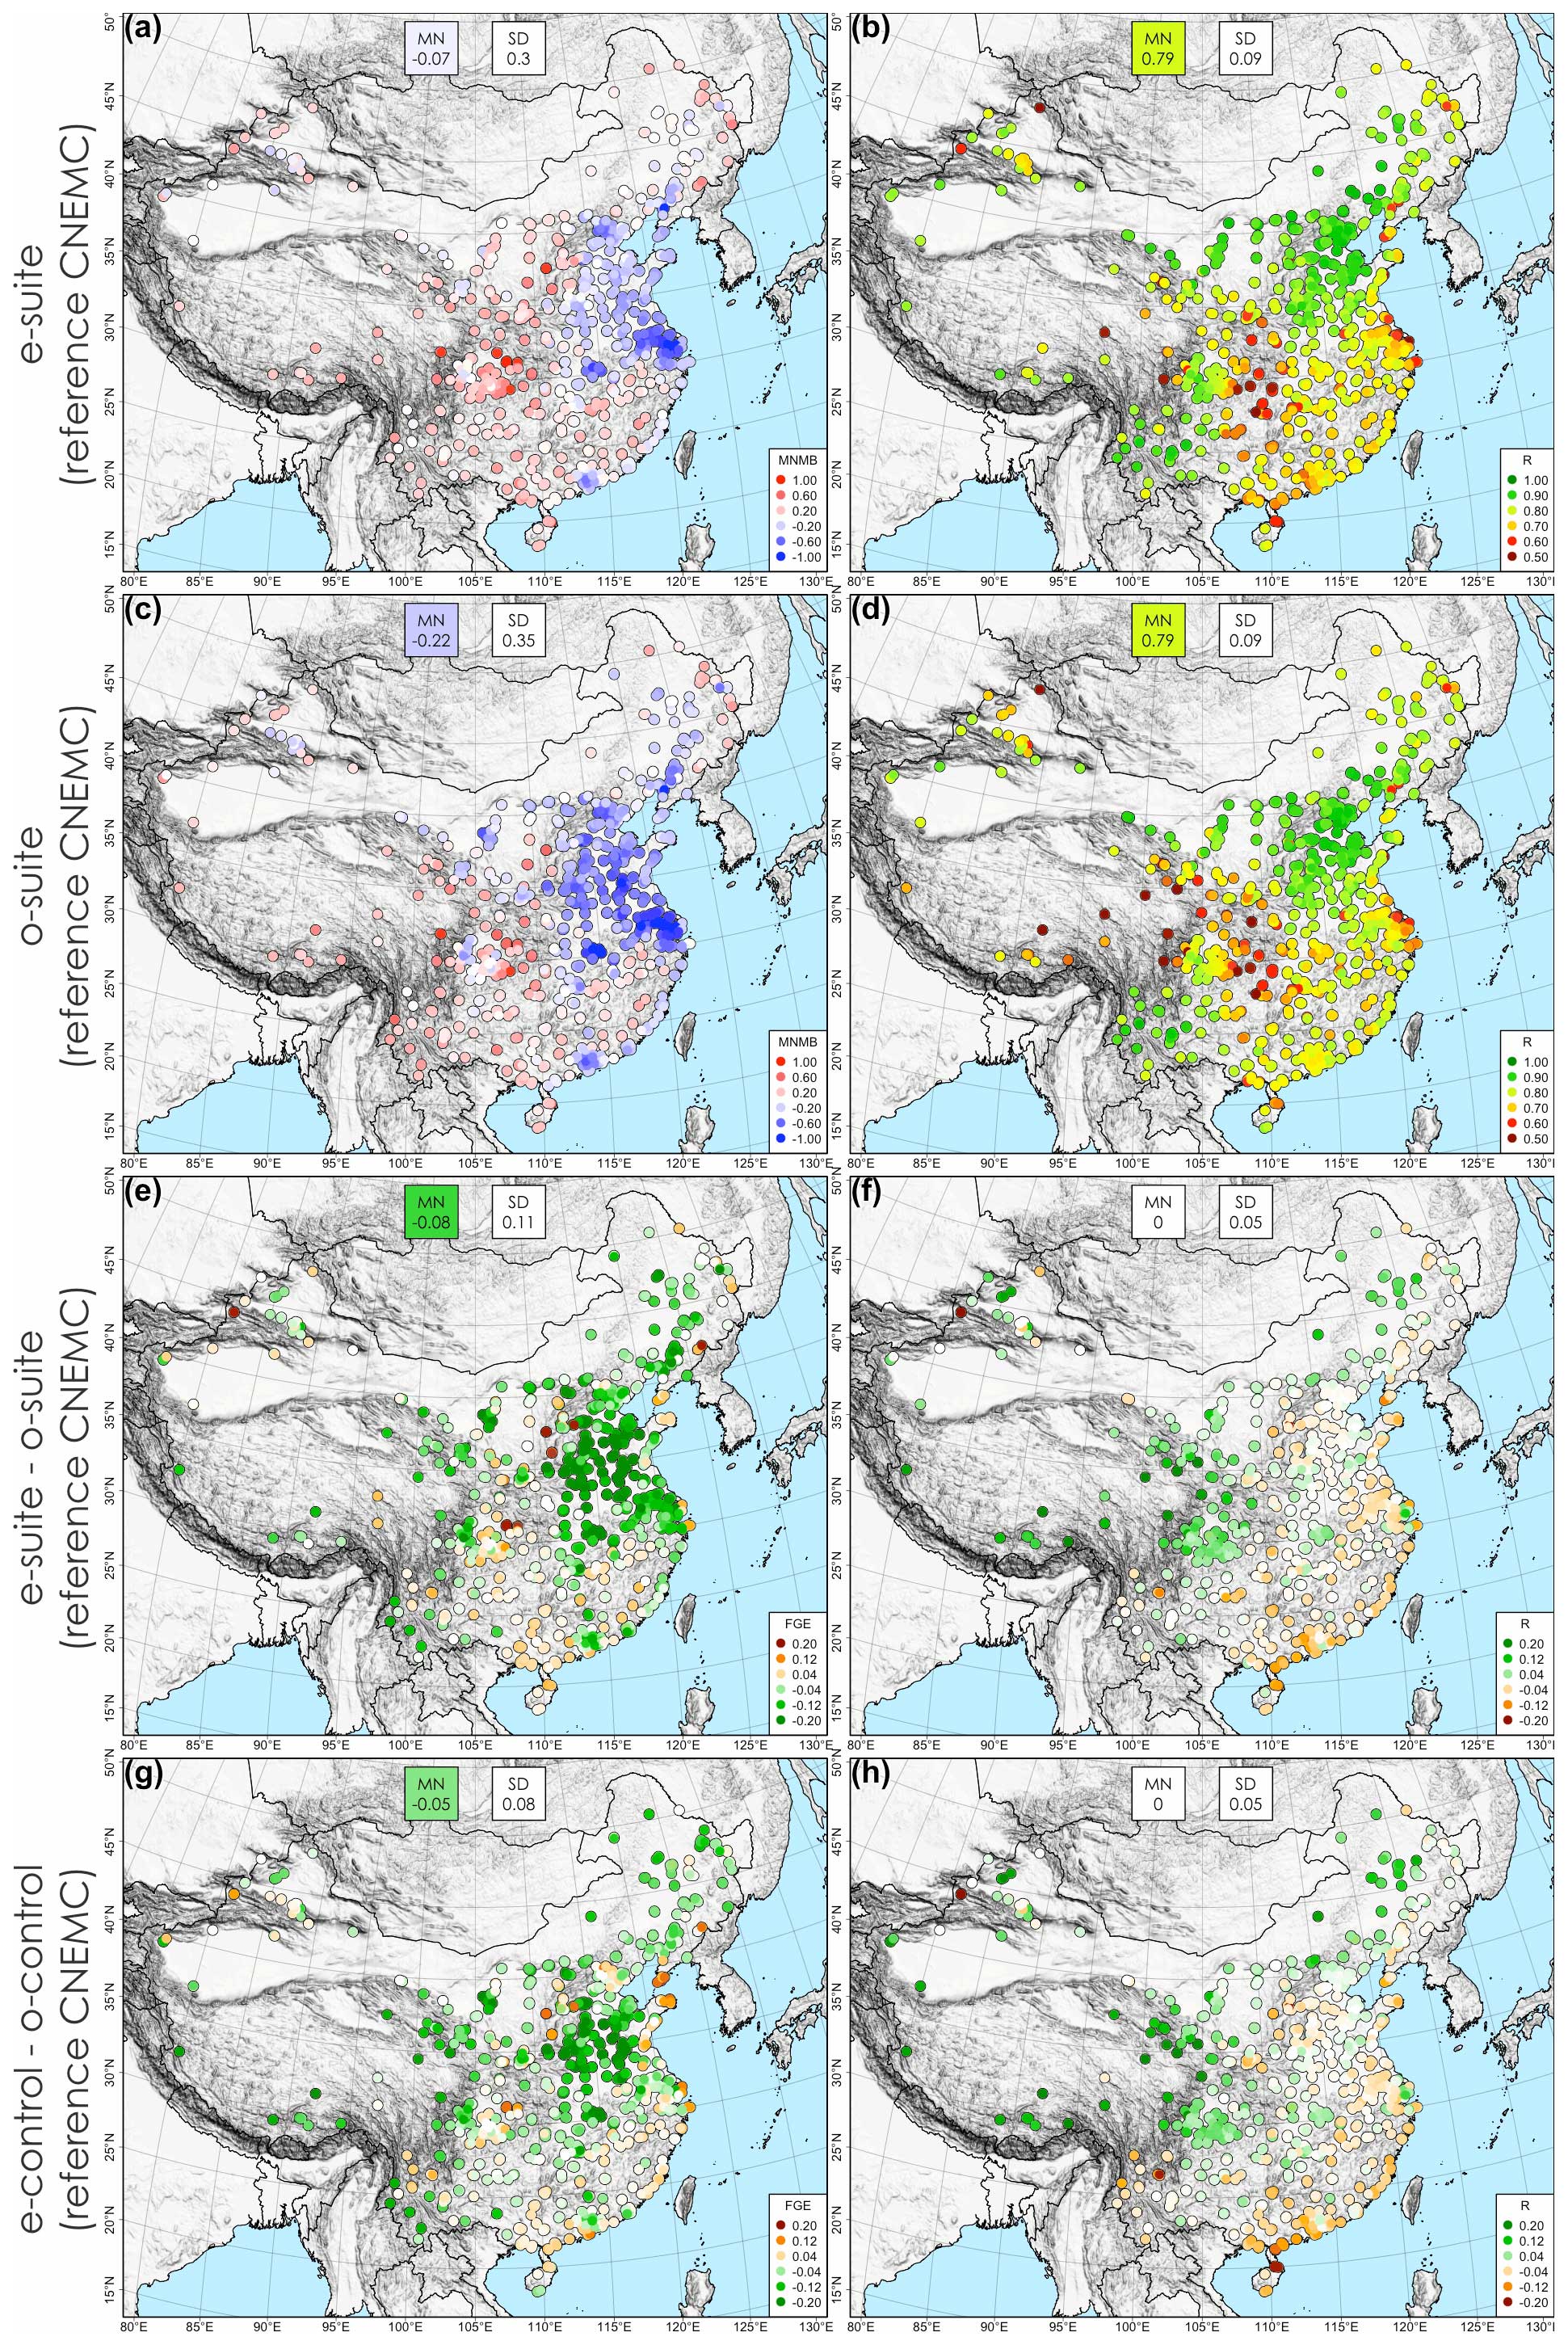
Figure 2Spatial distribution of the O3 evaluation over China, for the e-suite minus CNEMC observation (a: MNMB; b: R), the o-suite minus observations (c: MNMB; d: R), the e-suite-minus-o-suite differences (e: FGE; f: R) and the e-control-minus-o-control differences (g: FGE; h: R) for the period 1 October to 27 June 2023. The mean (MN) and standard deviation (SD) for all stations are depicted for each map.
The evaluation of surface ozone using the AirNow ground-based stations over North America, Fig. 3, shows that the overestimation is slightly higher in the e-suite than in the o-suite (MNMB from +13 % to +22 %), while the temporal correlation (R) and FGE improved, especially for the control run. The higher ozone bias may be related to a slight underestimation of NO2 in the e-suite compared to the o-suite (Fig. S3). The differences between the assimilation and control runs demonstrate the impact of the assimilation.
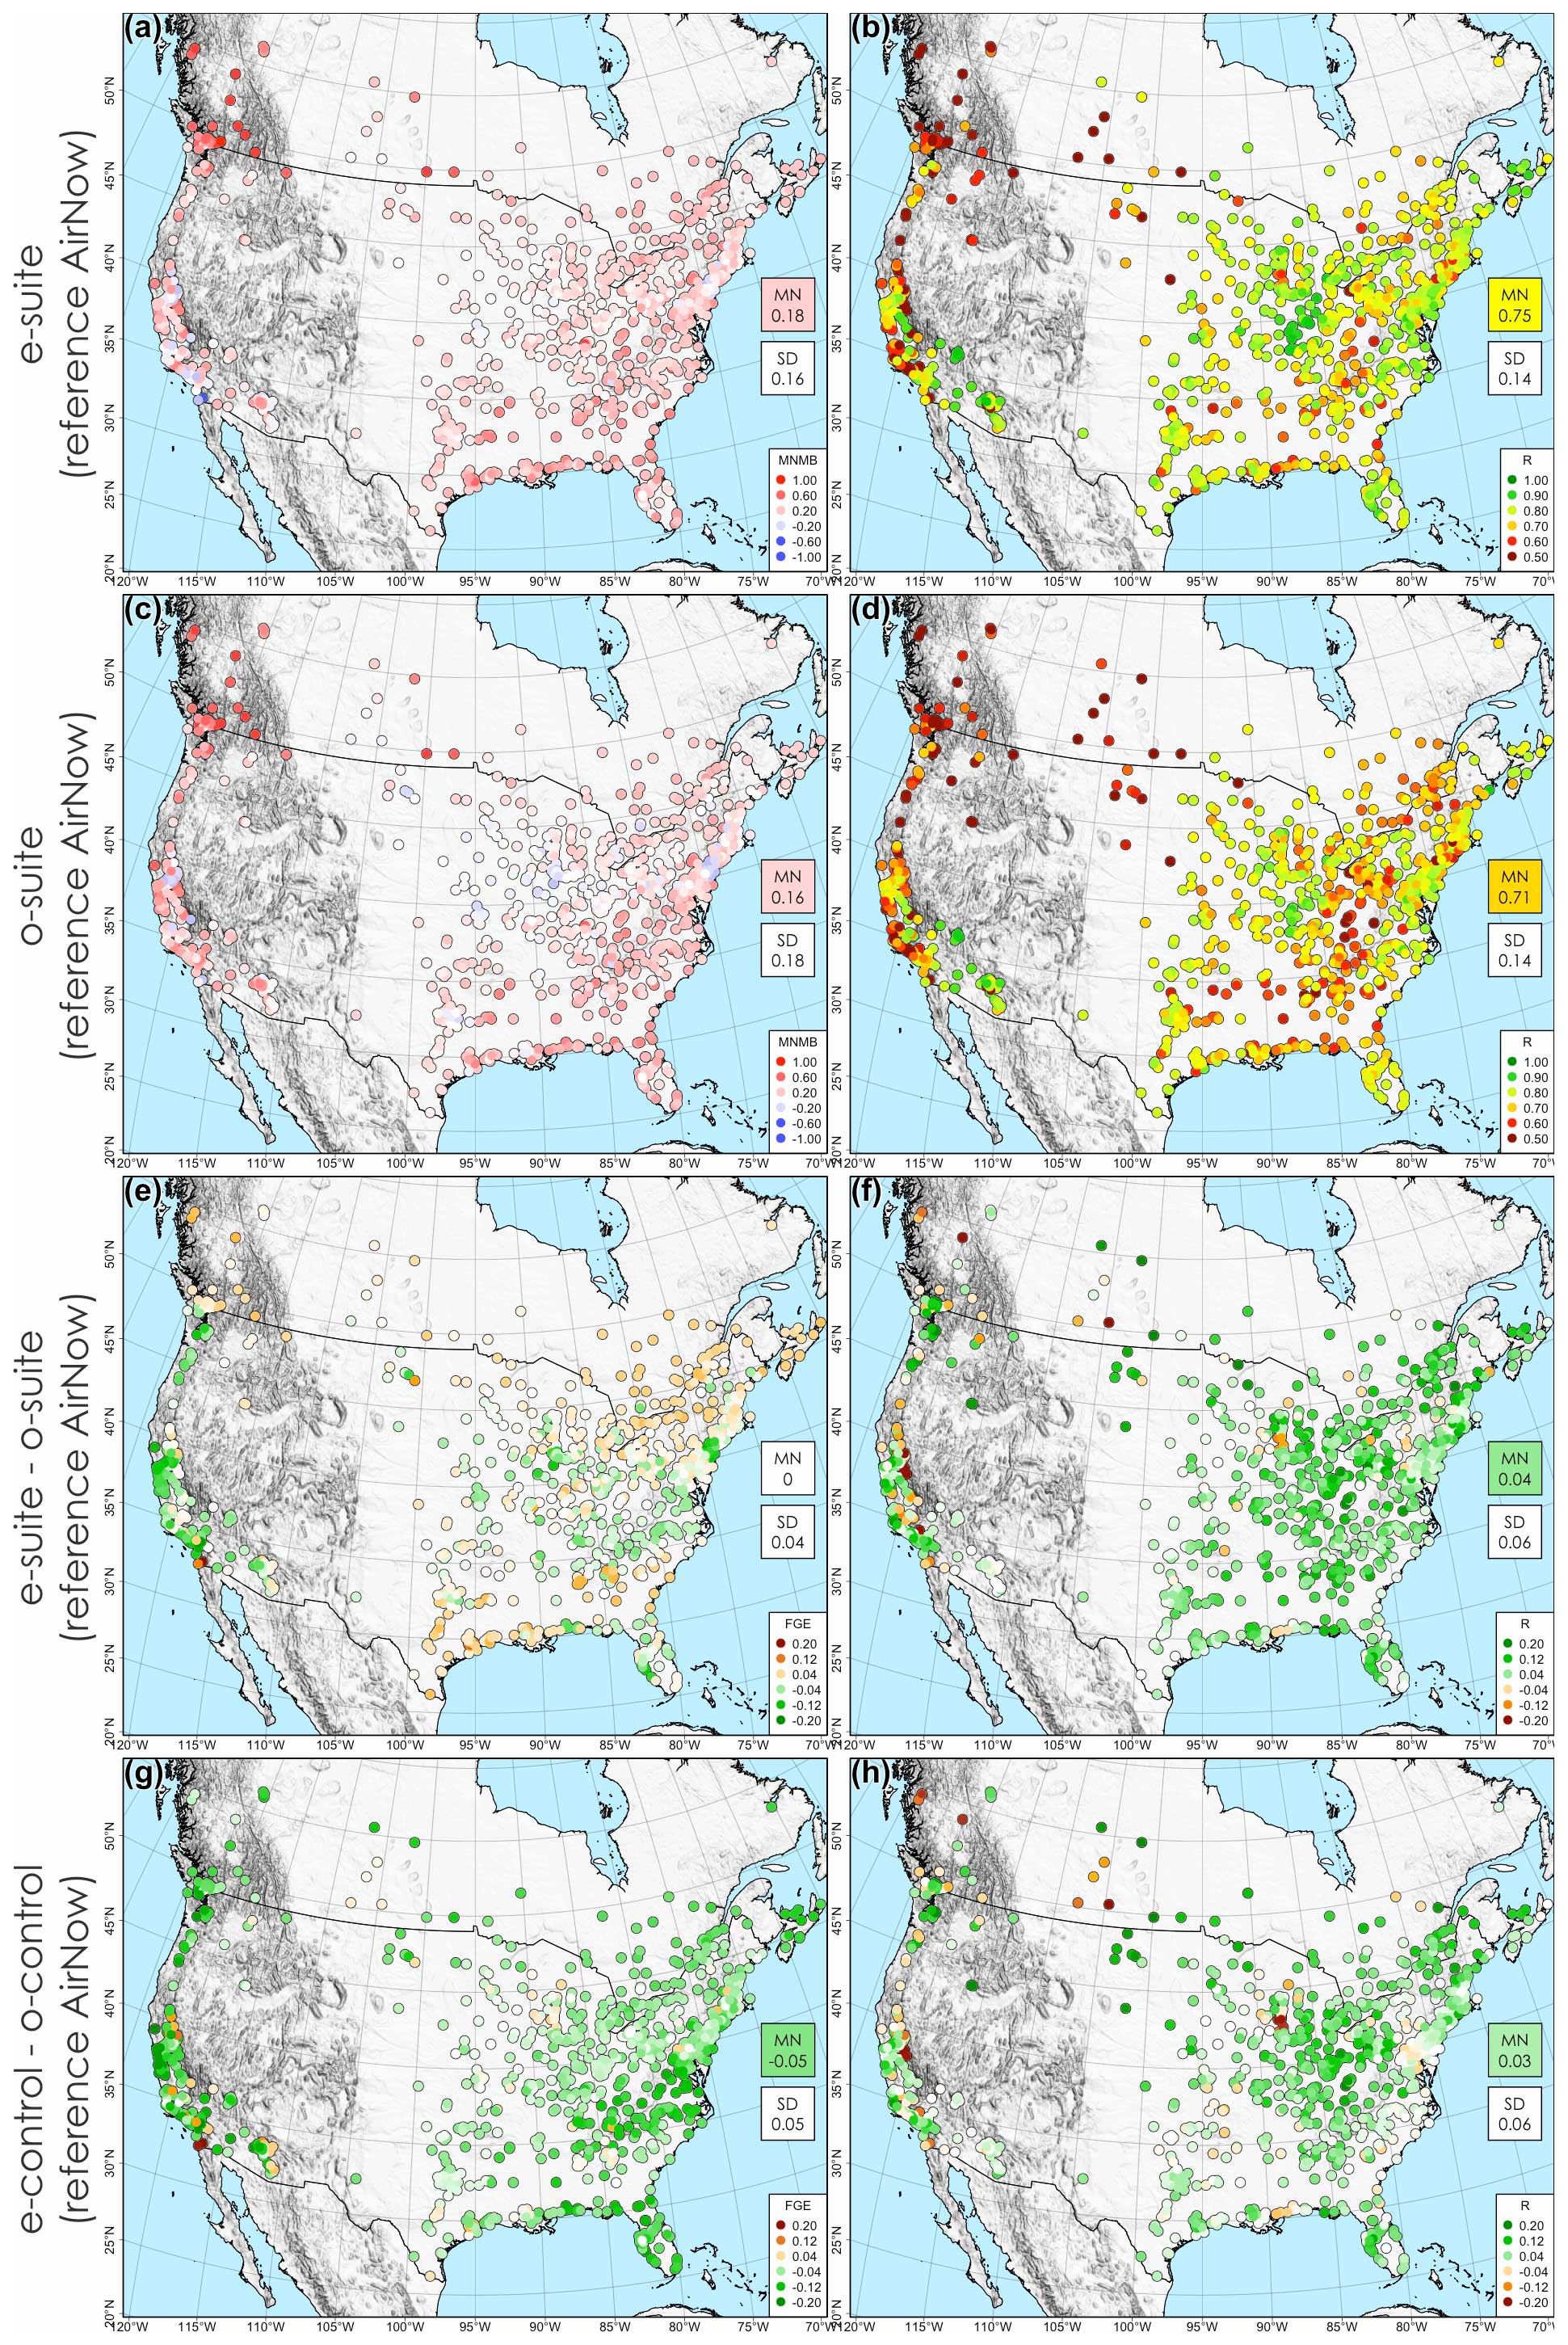
Figure 3Spatial distribution of the O3 evaluation over the USA and Canada, for the e-suite minus AirNow observations (a: MNMB; b: R), the o-suite minus observations (c: MNMB; d: R), the e-suite-minus-o-suite differences (e: FGE; f: R) and the e-control-minus-o-control differences (g: FGE; h: R) for the period 1 October to 27 June 2023. The mean (MN) and standard deviation (SD) for all stations are depicted for each map.
Surface ozone from the e-suite and o-suite was also compared to WMO-GAW, ESRL-GML and Arctic IASOA surface station observations (Fig. S4). During October 2022 to February 2023, there was no significant change in the surface ozone bias between the CAMS e-suite and o-suite, with relative biases of less than −40 % for most of the stations. An exception is the South Pole Observatory (SPO) station over the Antarctica, where the e-suite shows a higher negative bias (−50 %) than in the o-suite (−40 %).
The e-suite and o-suite have been evaluated with IAGOS aircraft measurements of tropospheric ozone. The time series of the daily profiles at Frankfurt Airport show that the e-suite and the o-suite perform similarly in general (Fig. 4). However, in the free troposphere (between 850 and 350 hPa, approximately between 1.5 and 8.5 km) the e-suite control run shows a reduced bias compared to the other runs from both the e-suite and the o-suite from the beginning of the evaluation period until April. For May–June, the e-suite control run develops a negative bias and the results of the other e-suite and o-suite runs are similar. This is more clearly depicted in the time series of the monthly scores by vertical layers at Frankfurt, which shows a better performance (MNMB and FGE) in the e-suite control run in the free troposphere in January–April and the degradation for May and June. The two controls runs show a seasonal difference, which is compensated for by the assimilation. At most airports worldwide, the bias in the lower troposphere (pressure > 850 hPa) is slightly larger for the e-suite than for the o-suite, in particular over airports located in western Africa and eastern Asia (not shown). In the free troposphere, the bias is about the same between the e-suite and the o-suite for most visited airports for the analysis or the 1 d forecast (Fig. S5). For the control run we observe larger differences, and the o-control shows mainly positive biases and the e-control mainly negative biases compared to IAGOS; see also Fig. 4. These differences are reduced and results are improved by the data assimilation in the free troposphere.
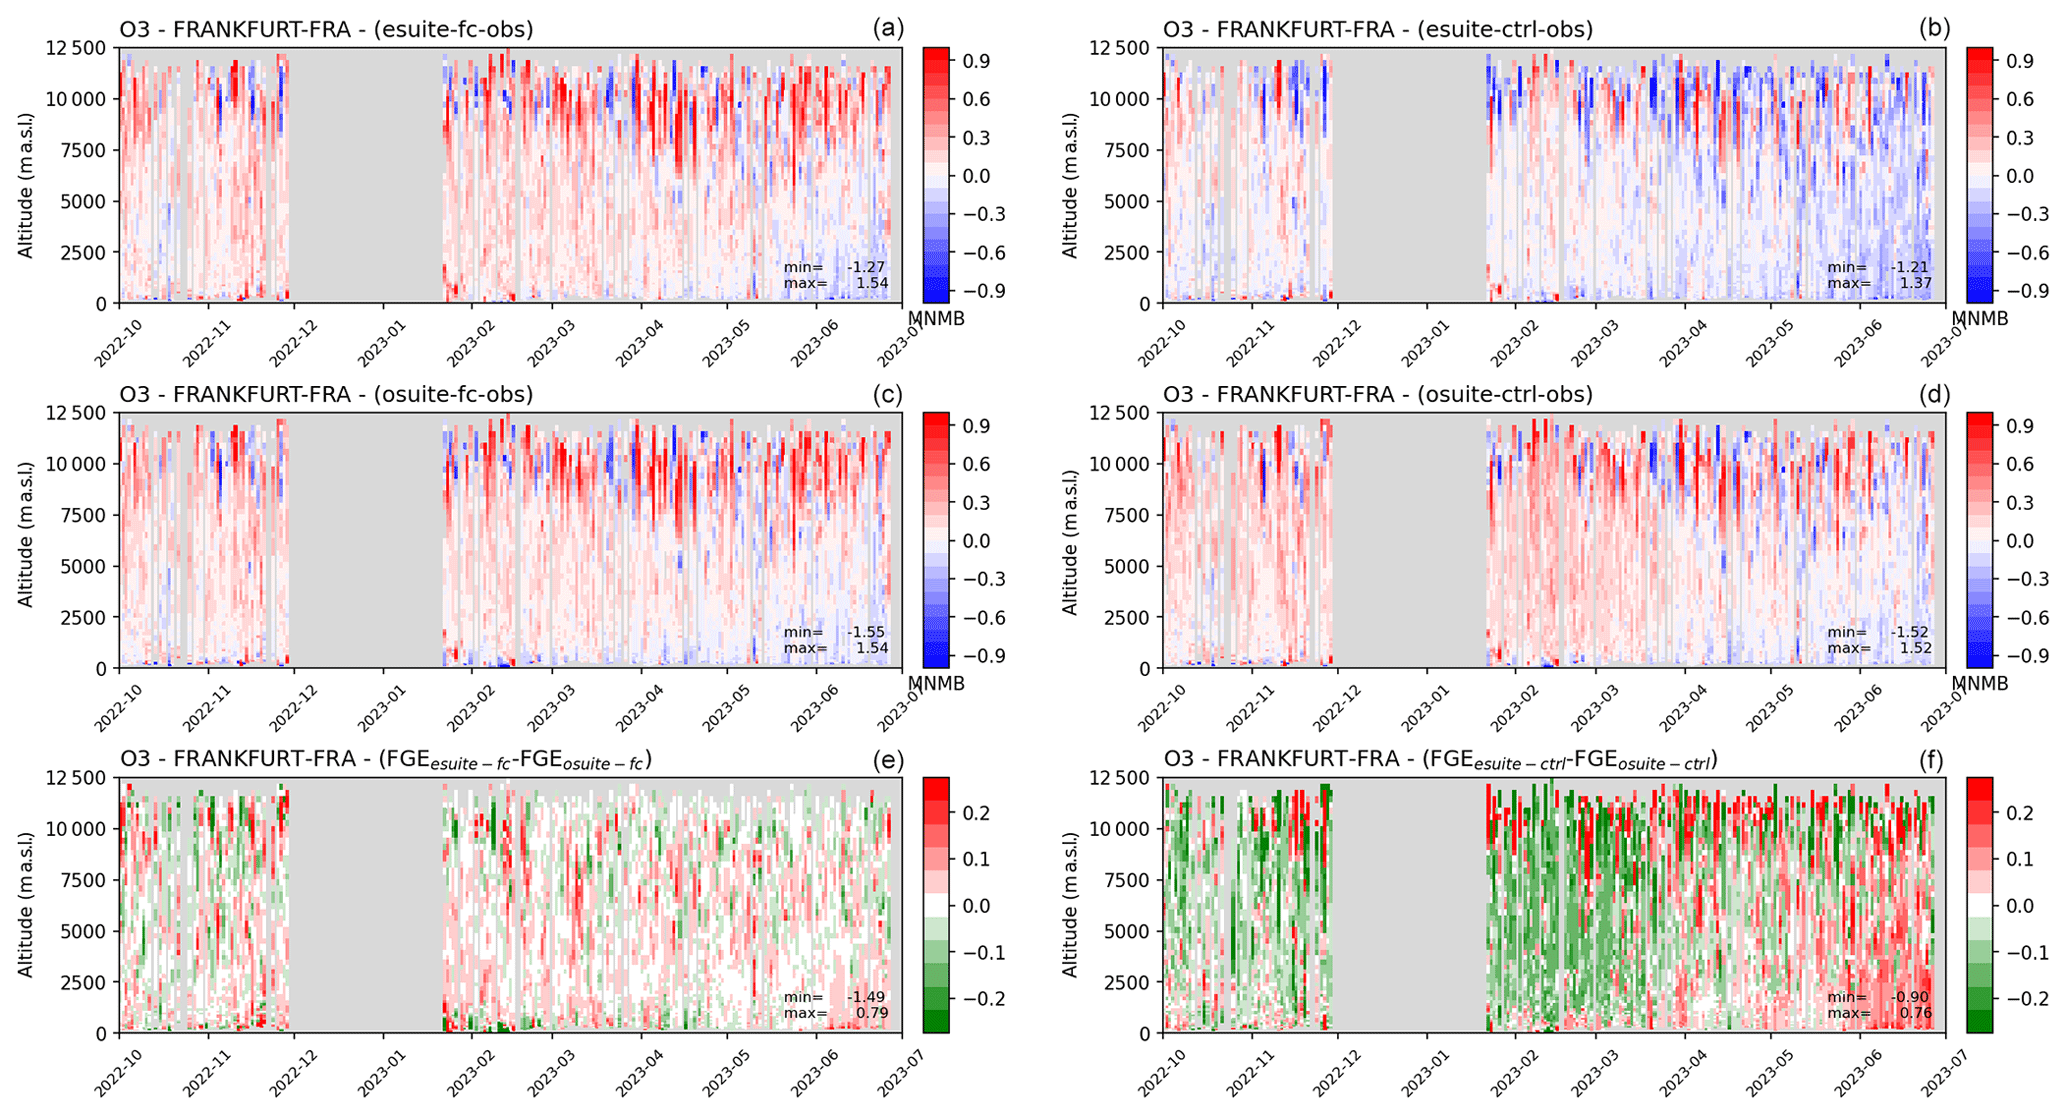
Figure 4Ozone comparisons using aircraft profile observations from IAGOS (http://www.iagos.org, last access: 7 June 2024). Time series of modified normalised differences, CAMS minus IAGOS, in the daily profiles of ozone at Frankfurt between October 2022 and 27 June 2023 for the e-suite (top left) and the o-suite (middle left) and their respective control runs (right). The fractional gross error differences between the e-suite and the o-suite are shown in the bottom row.
In the upper troposphere (evaluations based on flight level data with a potential vorticity below 2), ozone is overestimated and the results from the e-suite and the o-suite are very similar for all runs (Fig. S6), except for the o-suite control run, which presents slightly larger biases than the other runs over the northern Atlantic and North America.
Tropospheric ozone profiles have also been compared to ozonesonde observations; see Fig. 5. The Northern Hemisphere profile difference can be considered statistically robust (p value for tropospheric columns is below 0.01), and little difference is seen between the o-suite and e-suite in the troposphere. The e-suite control run shows a large negative bias in the upper troposphere and lower stratosphere (below 100 hPa), while almost no bias is found in the lower troposphere, in agreement with the IAGOS comparisons. For the other regions, the number of profiles is much lower, and the differences between the o-suite and e-suite are mixed: in the tropics and Antarctica, the bias in the lower troposphere is smaller for the e-suite, while the opposite is found in the Arctic and Southern Hemisphere mid-latitudes. The spread in the differences is similar for both runs. Note that the ozonesonde results in the troposphere, including the change in bias around March–April, are consistent with the IAGOS plots. Note that there is no significant change in the number of sondes around this time.
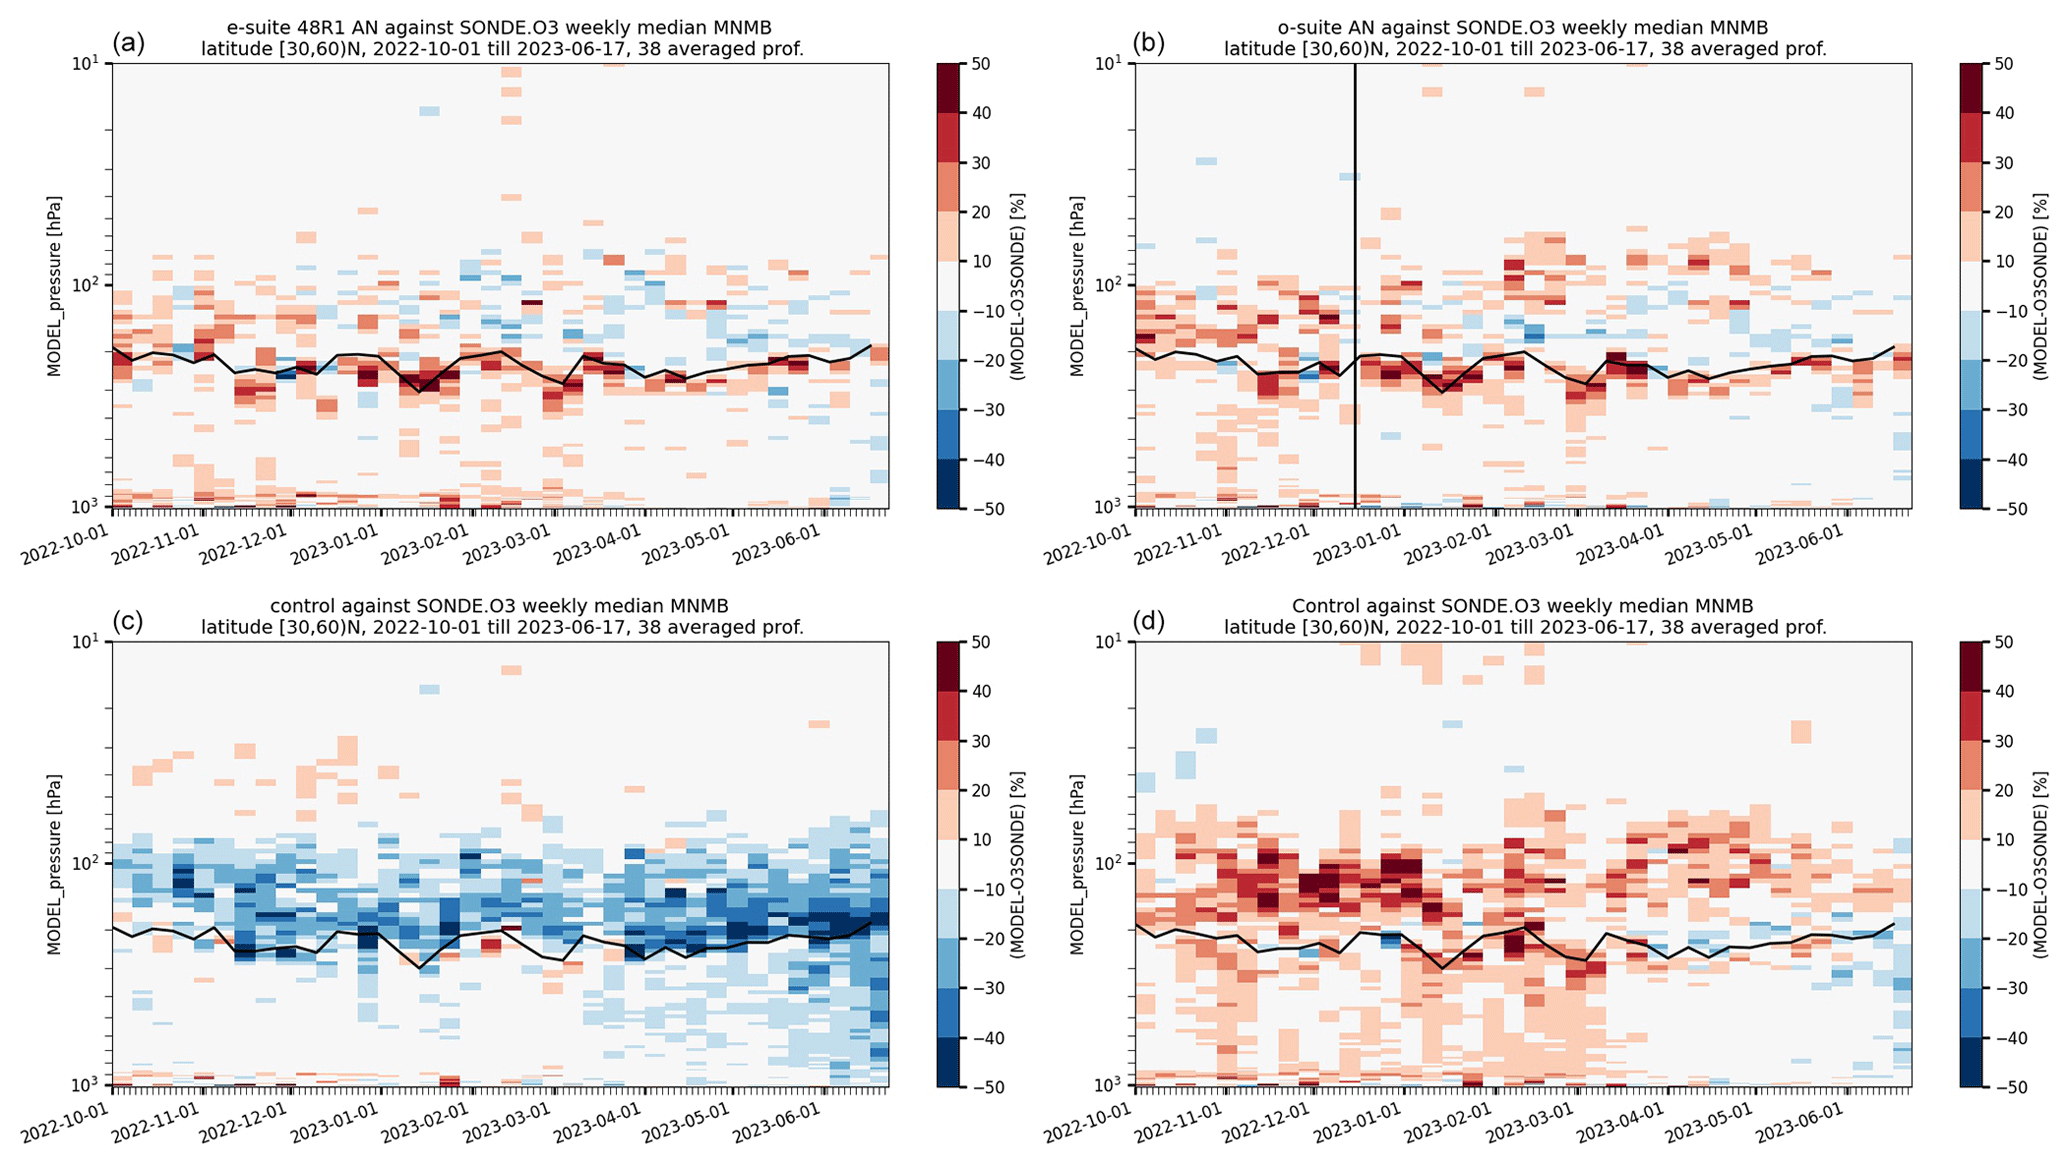
Figure 5Comparisons against ozonesondes. Time–pressure curtain plot of ozone profile MNMB for the e-suite analysis (a), the o-suite analysis (b), the e-suite control run (c) and o-suite control run (d) against sonde profiles for the Northern Hemisphere mid-latitudes. The horizontal black line represents the tropopause. The vertical black line in the o-suite plot indicates the 15 December change in the background error covariance in Cy47R3.
The global maps of monthly mean total column ozone for October 2022 are compared with satellite observations from IASI; see Fig. 6, top row. Overall, the performance is somewhat improved in the e-suite, with slightly better distributions of the ozone columns compared to the o-suite. A bias feature over the tropical Pacific Ocean in October 2022 has disappeared in the e-suite. This feature may be attributed to the issue with the background covariances in Cy47R3, which was solved on 15 December. The positive bias at low latitudes in October is smaller in the e-suite than in the o-suite. For December 2022, the difference between the e-suite and the o-suite is less prominent. The positive bias above the Pacific Ocean is improved in the e-suite and remains mostly below 5 %. There is hardly a difference between the e-suite and o-suite for June 2023.
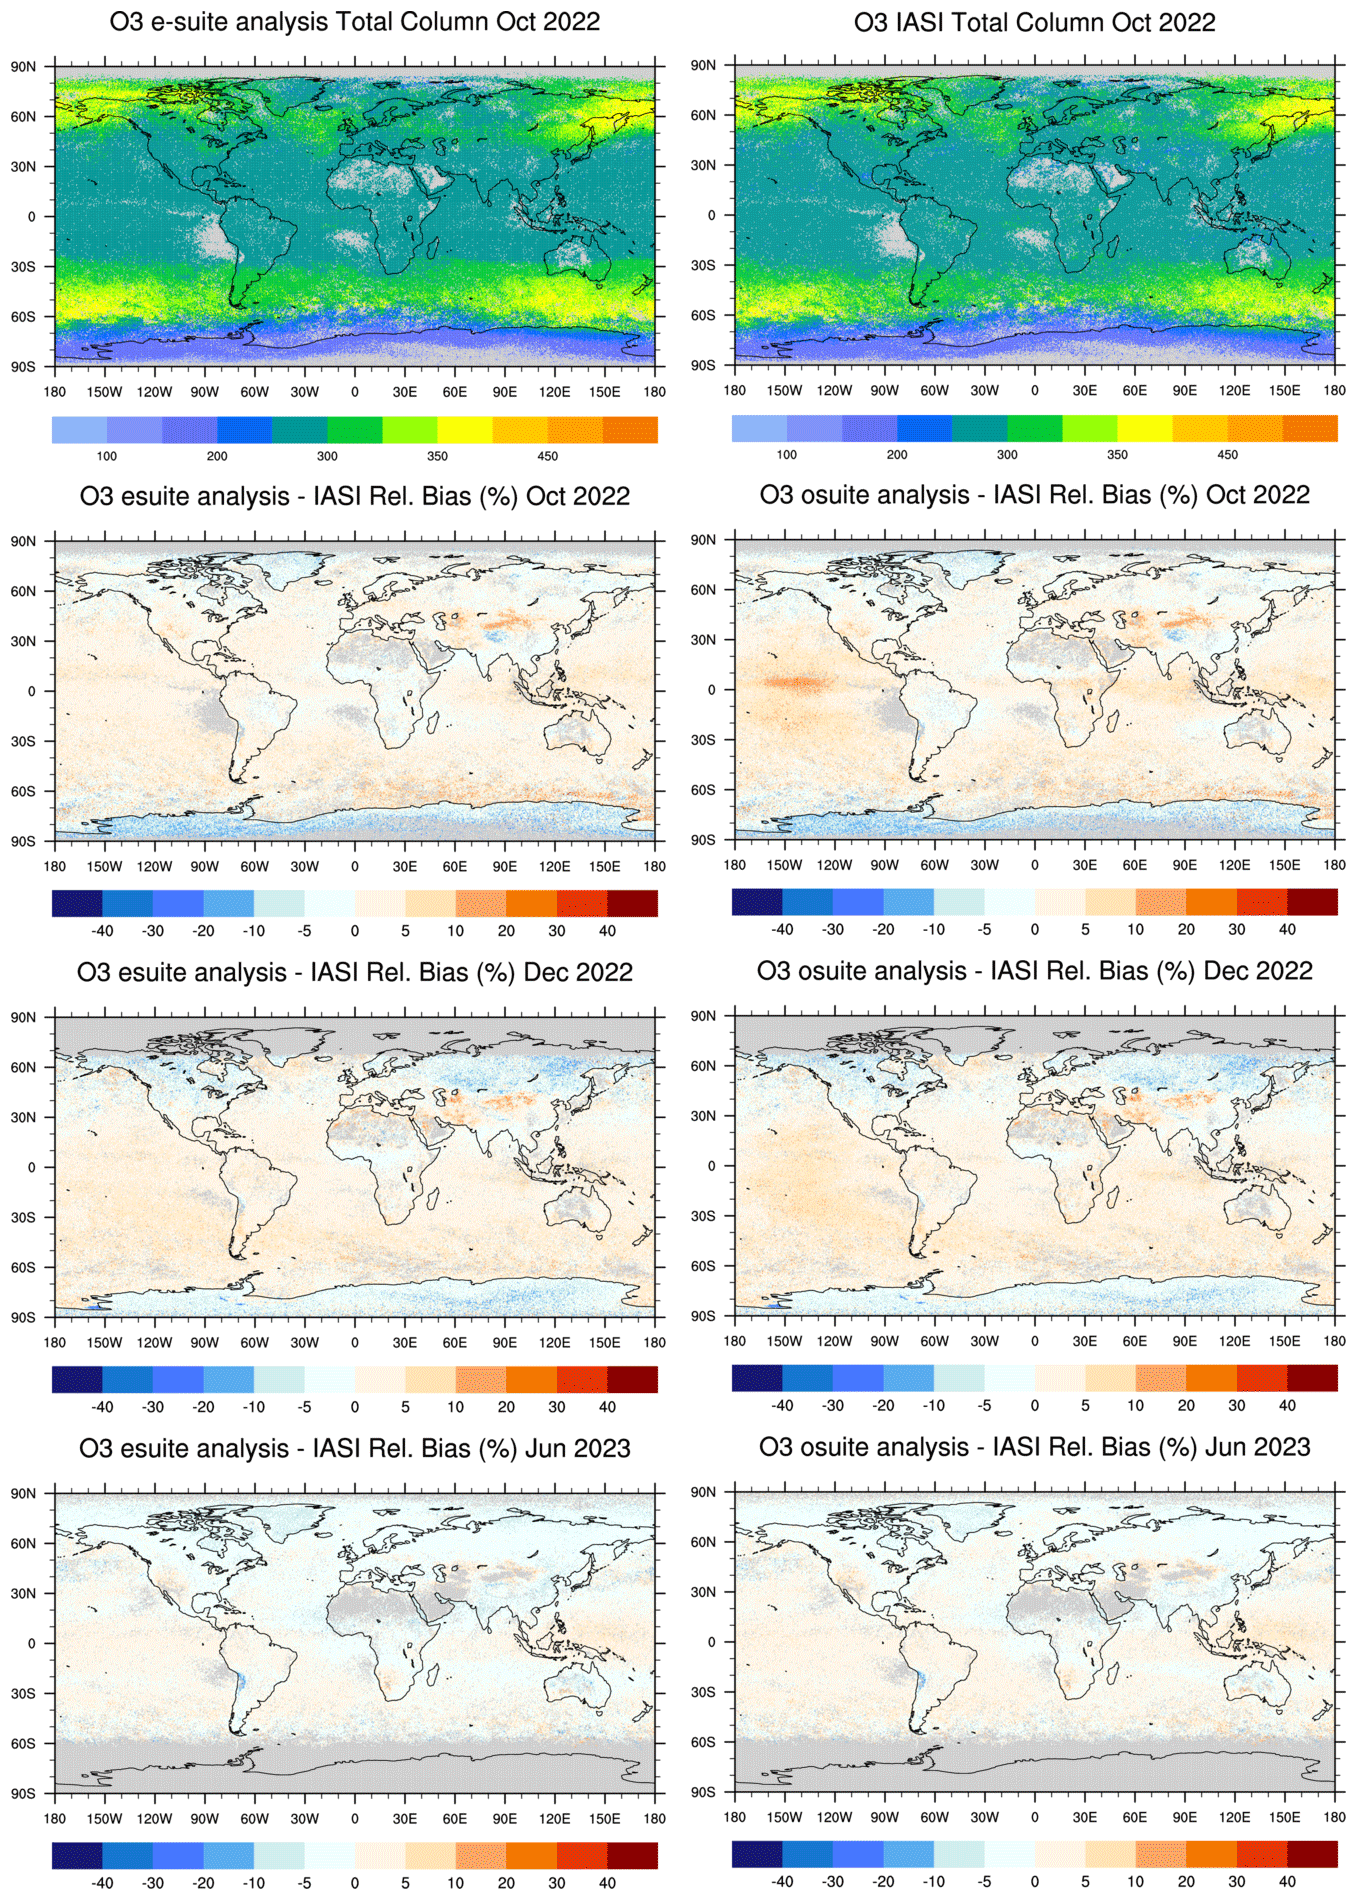
Figure 6Global maps of monthly mean total column ozone (Dobson units) compared with satellite observations from IASI. The figure shows the e-suite result (top left) and the IASI observations (top right) for October 2022, with the relative bias of the e-suite (left column) and the relative bias of the o-suite (right column) below with respect to IASI (%) for October 2022 (second row), December 2022 (third row) and June 2023 (bottom).
4.2 Carbon monoxide (CO)
The simulated carbon monoxide of the CAMS e-suite and o-suite was evaluated using surface observations from the WMO-GAW, EEA-Airbase, CNEMC and AirNow networks; vertical profiles from IAGOS aircraft and NDACC FTIR measurements; and satellite total column retrievals from MOPITT and IASI.
Over China, the comparison with surface CO observations indicates an overall reduction in CO concentrations in the e-suite, which leads to a reduced positive bias and better performance in the megacities over northeastern China and particularly over Shanghai, Hangzhou and Beijing (Fig. 7). The negative bias and FGE increased in the e-suite in the rest of China, including central China. Overall correlation range between 0.3 and 0.8 for most stations, with a mean of 0.53 for the e-suite. The e-suite shows similar correlations to the o-suite. In the densely populated northeastern part of China, correlations exceed 0.6 over most stations. The reduction in CO can be linked to the emission update in Cy48R1.
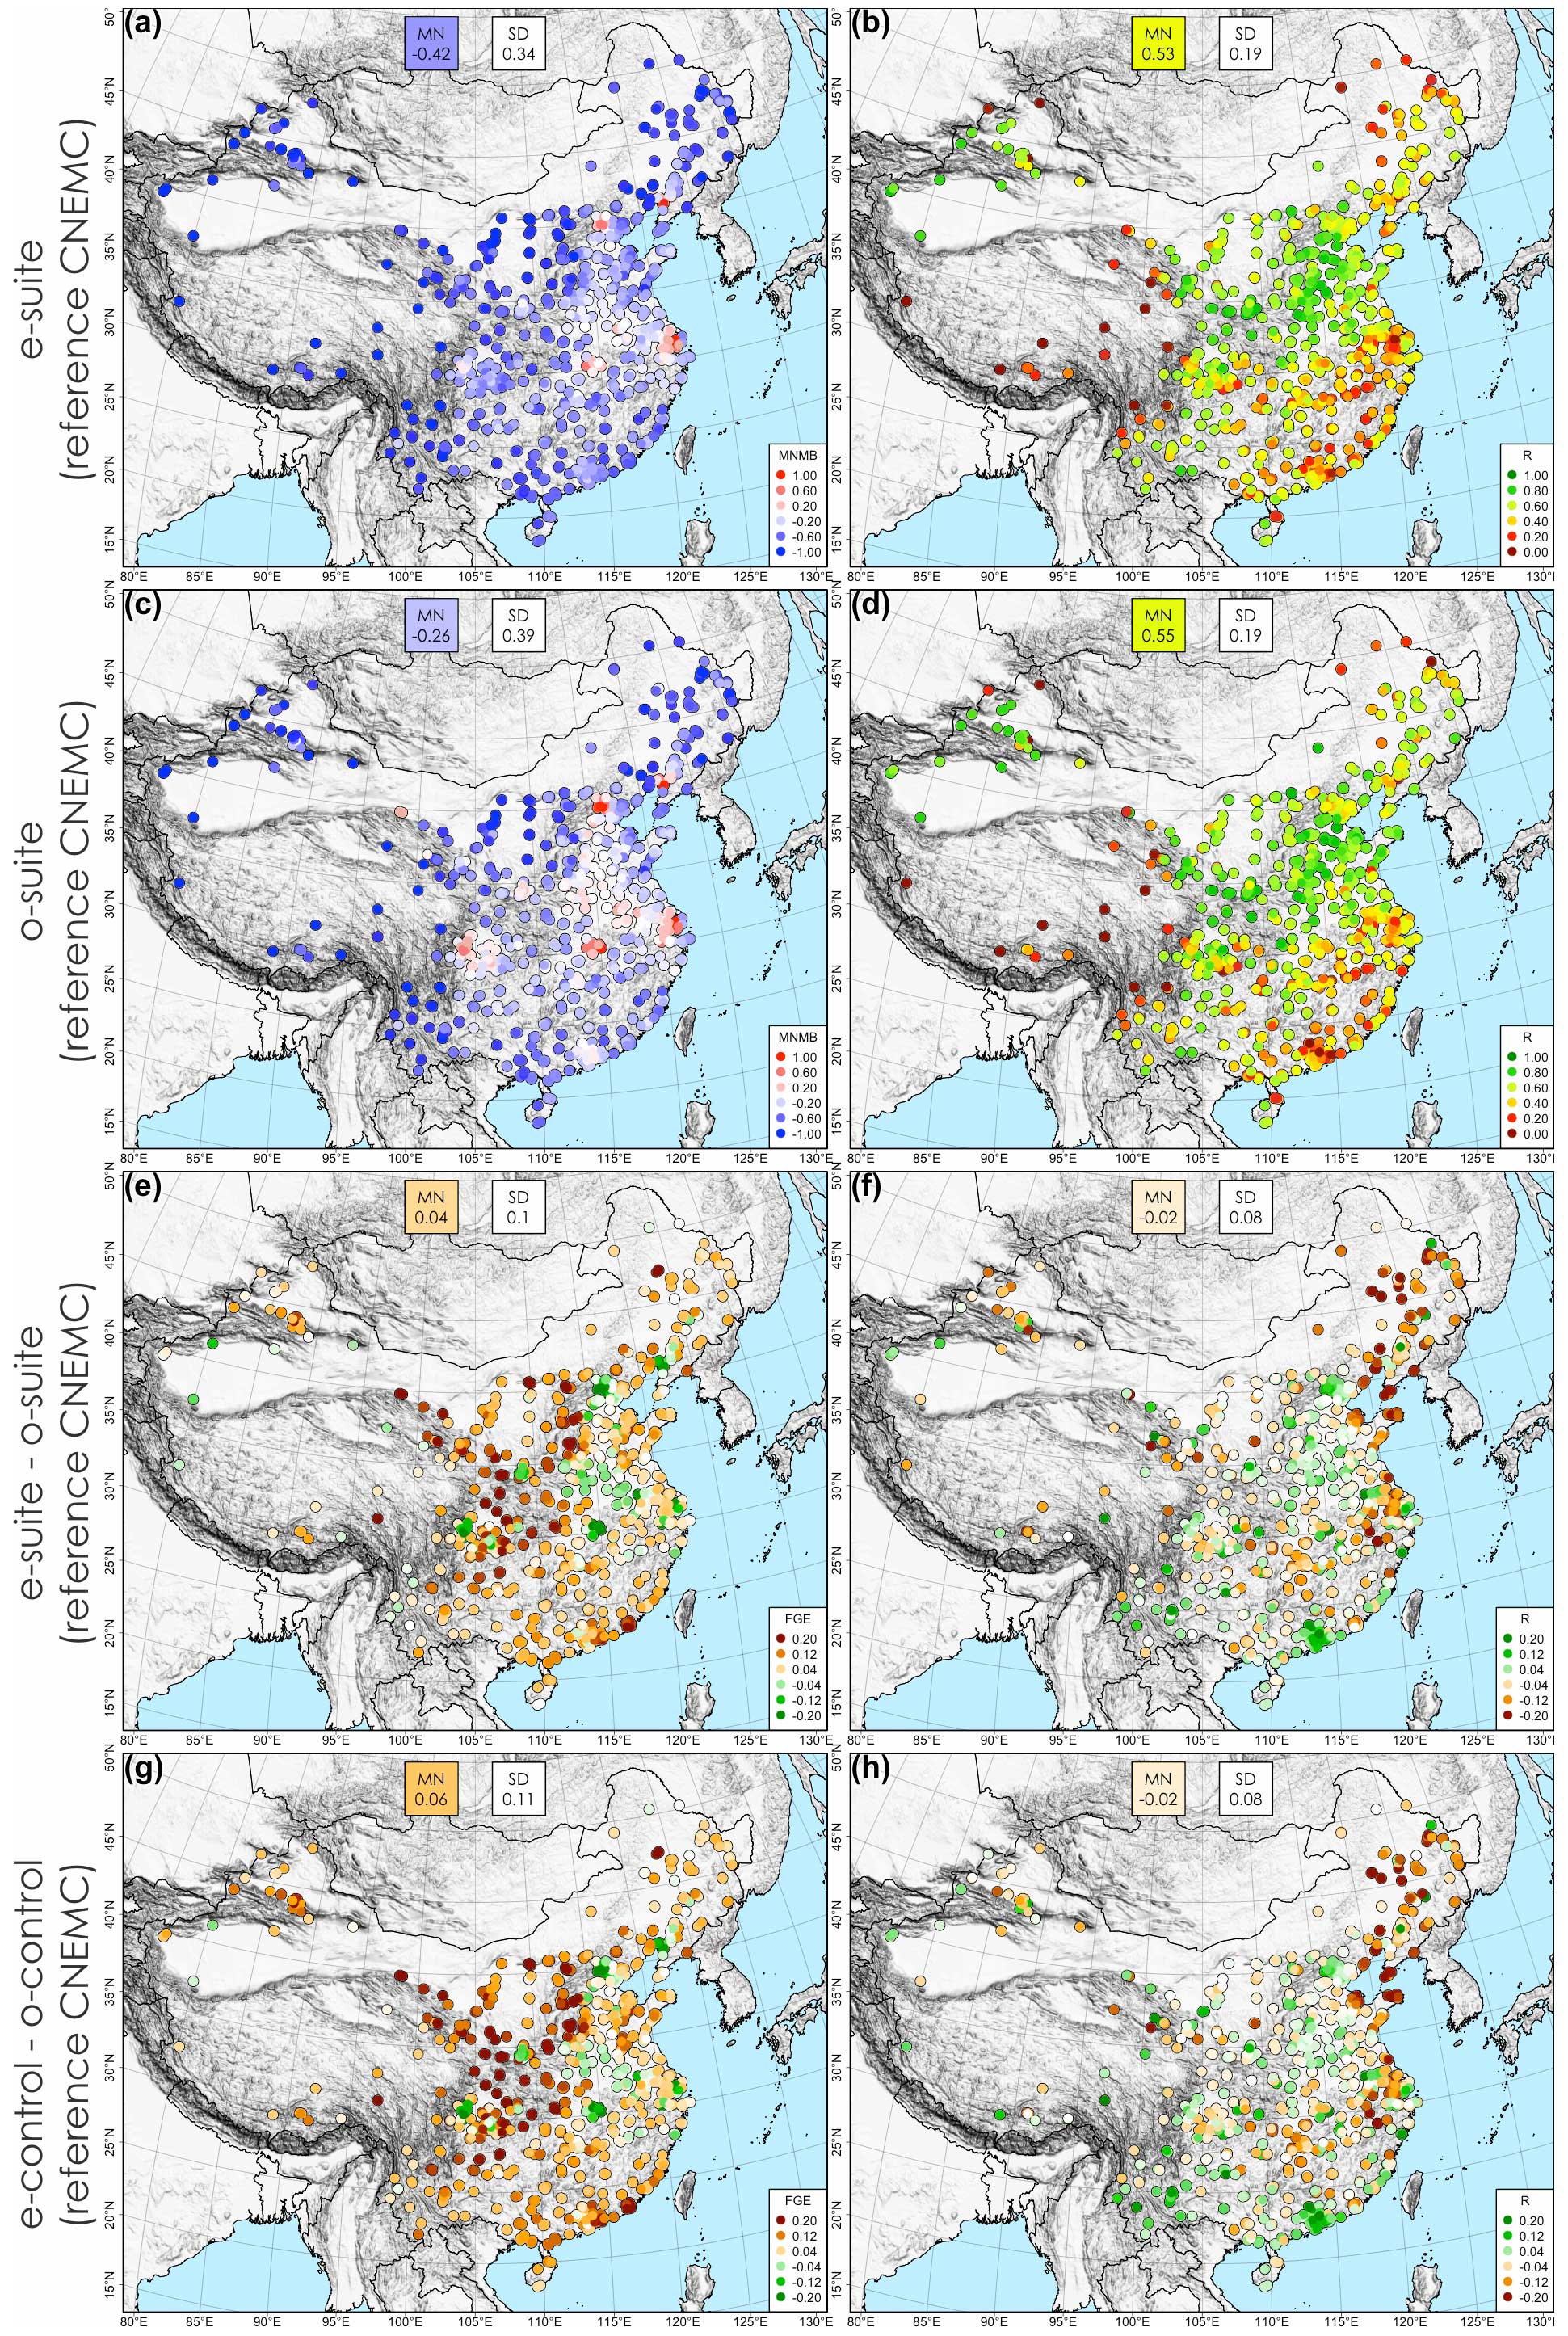
Figure 7Spatial distribution of the CO surface comparisons over China, for the e-suite minus CNEMC observations (a: MNMB; b: R), the o-suite minus observations (c: MNMB; d: R), the e-suite-minus-o-suite differences (e: FGE; f: R) and the e-control-minus-o-control differences (g: FGE; f: R) for the period 1 October 2023 to 27 June 2023. The mean (MN) and standard deviation (SD) for all stations are depicted for each map.
Compared to surface CO observations from five WMO-GAW stations (Hohenpeißenberg, Jungfraujoch, Sonnblick, Zugspitze and Monte Cimone, located in Europe), there was no significant change in the bias between CAMS e-suite and o-suite runs, which does not exceed ±10 % in general (Fig. S7). The correlation for the e-suite has slightly improved compared to the o-suite over Europe and the Cabo Verde station in the tropics.
The comparison of the CO mixing ratios to EEA-Airbase observations over Europe shows that the e-suite performs better than the o-suite in terms of bias and correlation over most stations (Fig. S8). In all cases note that e-control scored better than o-control as well; hence the detected improvements at the surface mainly originate from the model changes rather than assimilation changes.
The e-suite has been evaluated with IAGOS measurements of CO (Level 1 data) at different airports. The time series of the daily profiles (curtain plots) of MNMB at Frankfurt Airport are presented in Fig. 8. The e-suite shows a smaller negative bias than the o-suite at all altitudes for the analysis and the 1 d forecast. This is also shown in the time series of the monthly scores by layers at Frankfurt, with an analysis and forecast improvement for the e-suite in both the lower troposphere (LT) and the free troposphere (FT) (Fig. S9). However, CO is still underestimated by both the e-suite and the o-suite, with a larger bias in the LT than in the FT. According to the fractional gross error (FGE) monthly values, the e-suite improvement over the o-suite is about −0.05 for most of the months in the LT compared to about −0.02 in the FT, while for correlation results, no notable difference is found (Fig. S9). The control runs from the e-suite and o-suite show a different seasonal pattern of the bias with a notable increase in the bias starting in early spring for both models. Like for the assimilated runs, the bias from the control run is smaller for the e-suite than for the o-suite but only until March. This can also be seen in the monthly scores time series (Fig. S9). For the remaining months the performance is similar for both control runs in the lower troposphere and slightly better for the o-suite control run in the free troposphere. For all other airports worldwide, the bias (MNMB) in the low troposphere is very similar for the e-suite and the o-suite. However and like at Frankfurt, at most visited airports the absolute differences (FGE) are better in the free troposphere for assimilated runs of the e-suite compared with those of the o-suite (Fig. S10). Regarding the control run results, they are similar for both models. In the upper troposphere, at cruise altitude, CO is underestimated by both the e-suite and the o-suite runs. Like in the free troposphere, there is a clear improvement in the bias in the upper troposphere over all regions in the e-suite compared to the o-suite and in particular for the analysis (Fig. S11).
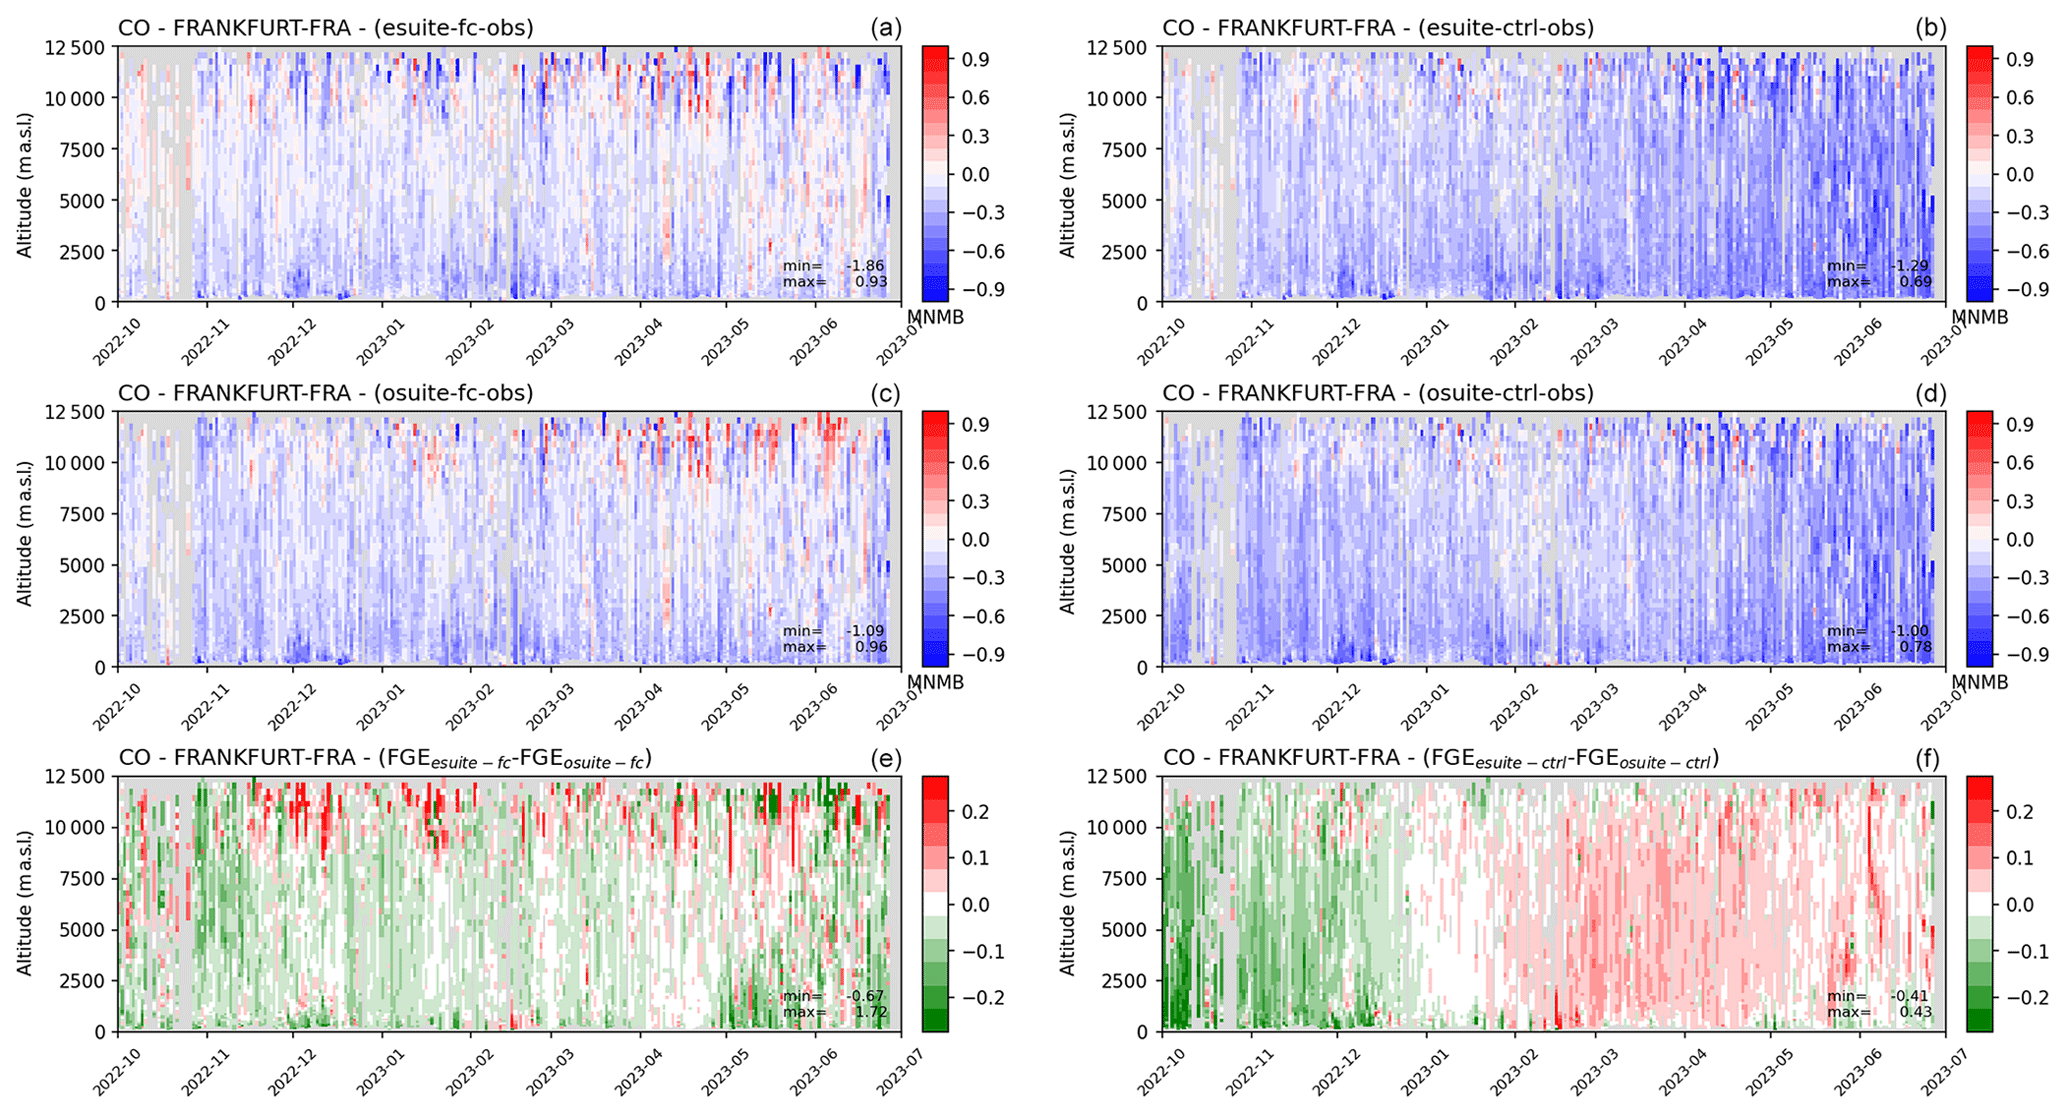
Figure 8CO comparisons using aircraft profile observations from IAGOS (http://www.iagos.org, last access: 7 June 2024). Time series of modified normalised differences, CAMS minus IAGOS, in the daily profiles of ozone at Frankfurt between October 2022 and 27 June 2023 for the e-suite (a) and the o-suite (c) and their respective control runs (b, d). The fractional gross error differences between the e-suite and the o-suite are shown in panels (e) and (f).
The results of the comparison with satellite CO column retrievals from the IASI and MOPITT instruments are shown in Fig. 9. Averaging kernels have been used in these comparisons. The IASI total column CO observations are well reproduced by the CAMS e-suite in terms of absolute amounts and spatial distribution. The e-suite relative bias for December 2022 with reference to IASI stays mostly within 20 %, with wide areas below 5 %, some negative bias above the southern Africa biomass burning area (up to 20 %), a positive bias around 60° S and a negative bias over Antarctica. The e-suite performs much better than the e-control, which shows negative biases for the major part of the globe up to 20 % regularly and peak amounts above South Africa exceeding 40 %. The o-suite mostly has a negative bias compared to IASI, up to 20 % regularly and up to 30 % over the Pacific. Rows four and five of Fig. 9 show the e-suite relative biases for March and June 2023, which support the previous findings also for the other seasons. The MOPITT comparison looks very different, as overall biases are smaller for the o-suite than for the e-suite. The e-suite shows widespread positive biases of up to 20 % which are not present in the o-suite. Only the negative biases of the o-suite of up to 20 % above northern Africa improved to remain mostly below 10 % in the e-suite. Similar observations are made for the additional months from different seasons. These results for CO total columns demonstrate changes in the bias correction implemented in the e-suite, which now uses IASI-C and TROPOMI as reference. Note that TROPOMI CO data were not assimilated in the e-suite until 28 April, so the impact of TROPOMI has not been explicitly evaluated here.
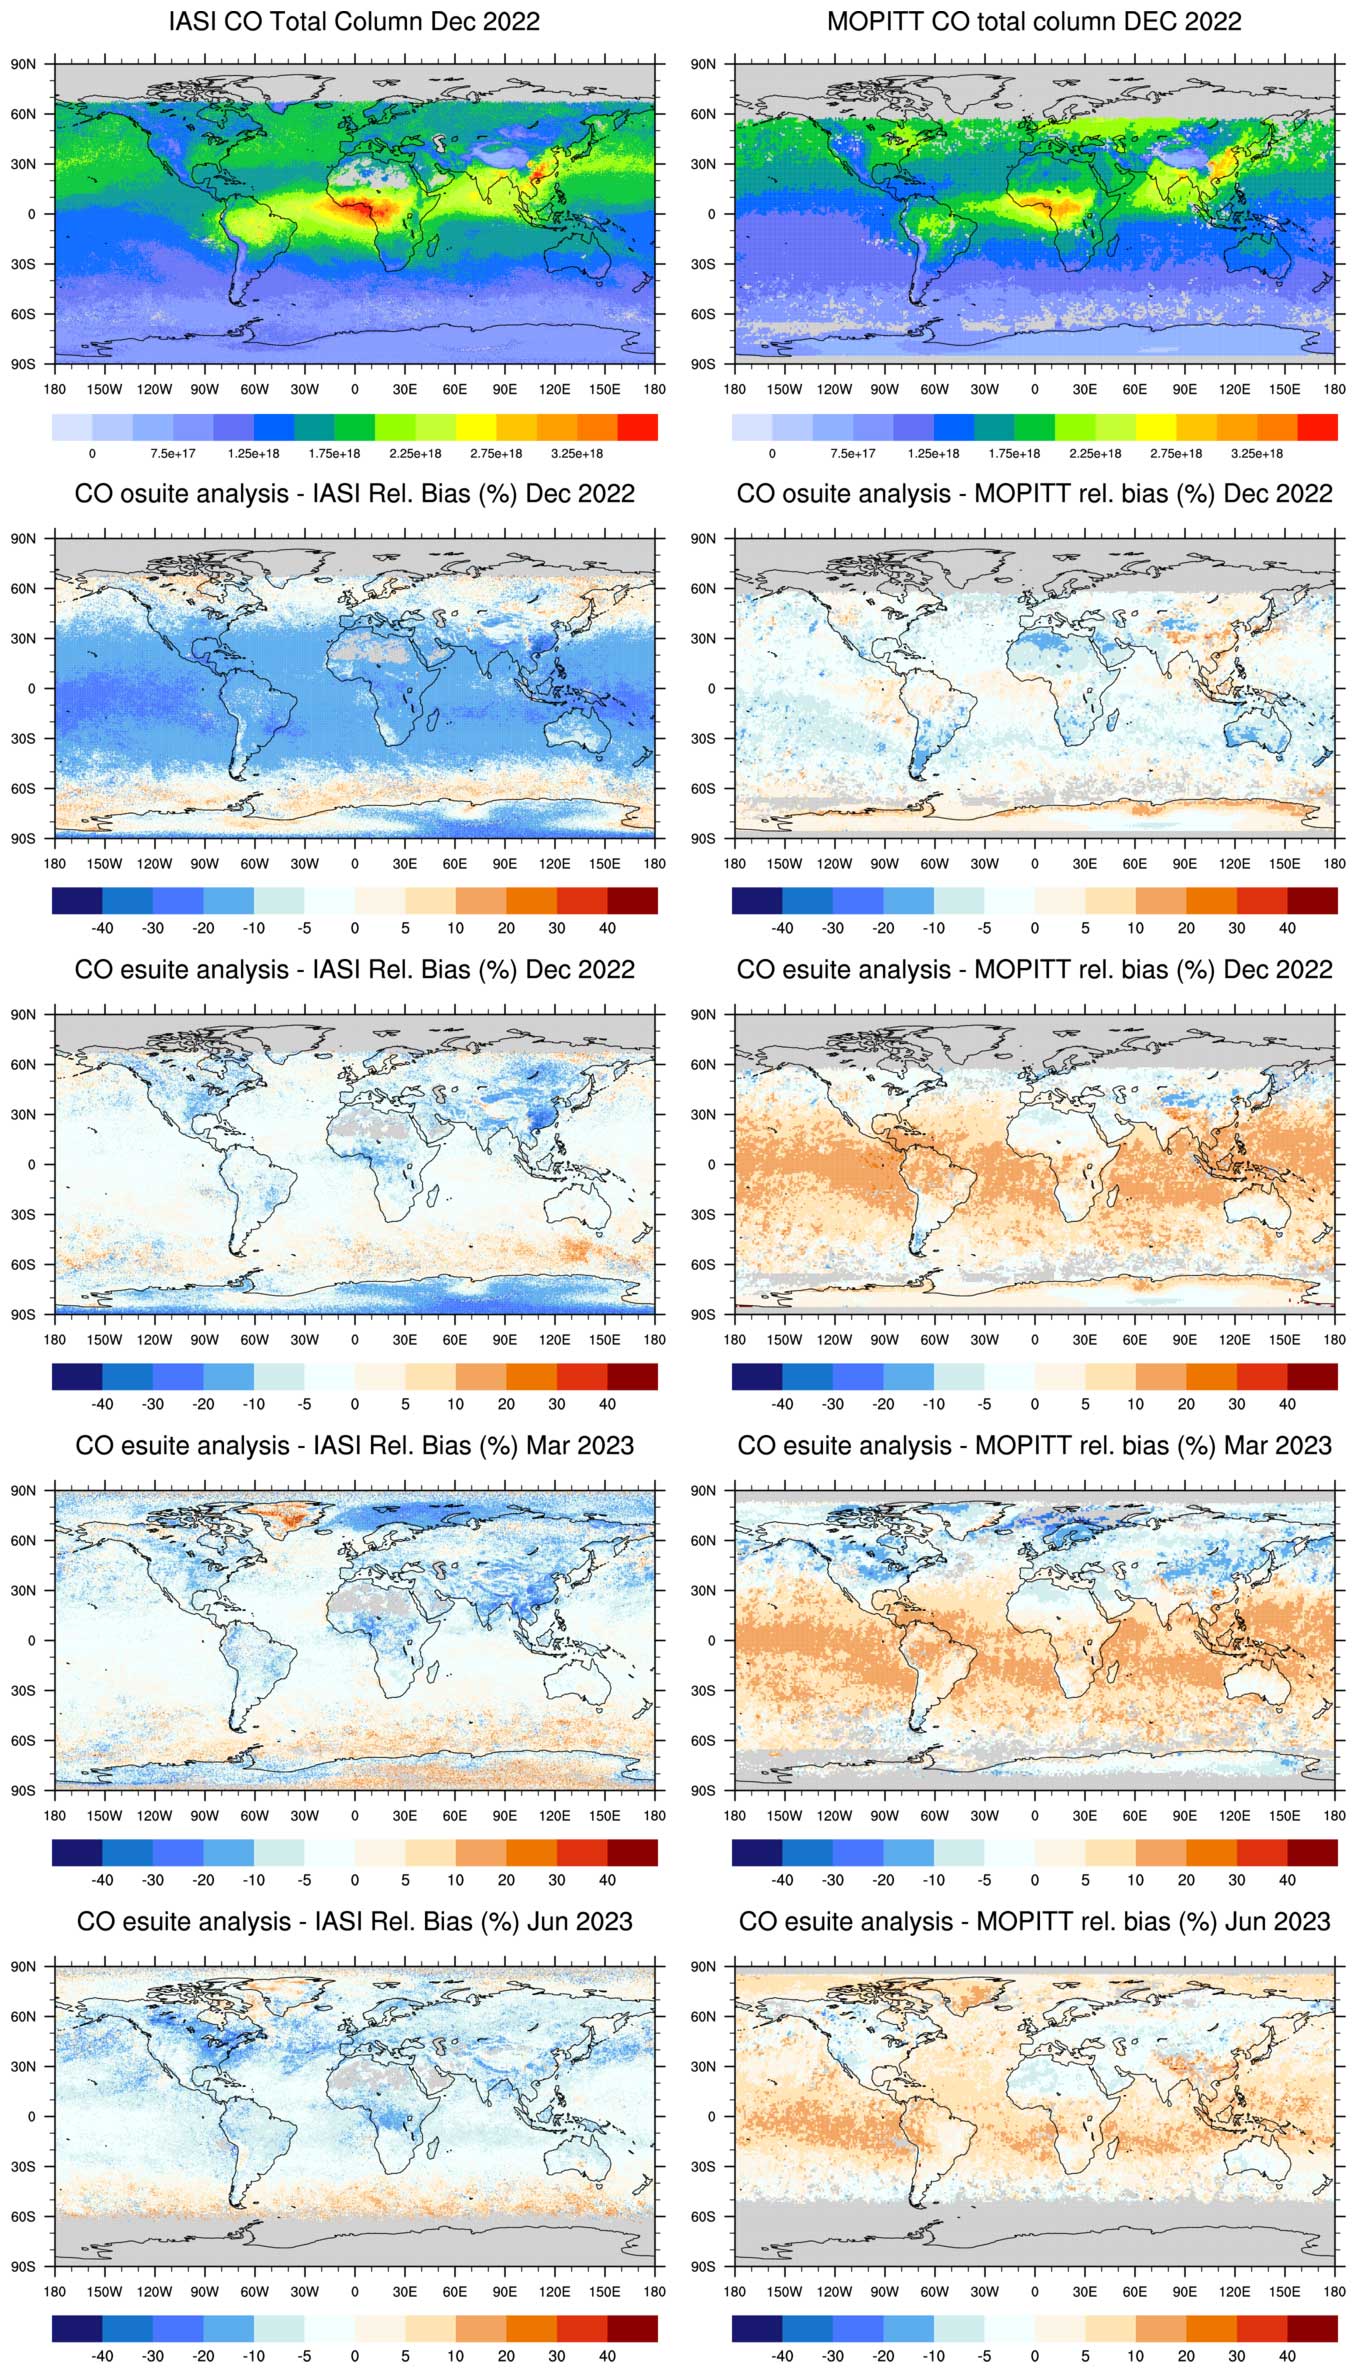
Figure 9Global maps of monthly mean total column CO comparing satellite observations from IASI (left column) with MOPITT (right column) validation including the satellite observation (first row), the relative bias of the o-suite result with respect to the satellite data (second row) and the relative bias of the e-suite result (third row) for December 2022, as well as the e-suite relative bias for March and June 2023 (fourth and fifth row, respectively).
In 2023, Canada suffered from a very extreme fire season, which started as early as May, with intense fires in June, and continued during the summer. The e-suite shows pronounced enhancements in CO in June, linked to the large GFAS fire emissions over Canada inserted in the model. As shown in Fig. 9, the amount of CO produced is underestimated by up to 20 % compared to IASI, and the largest relative error in the global map is located over Canada in June. However, the e-suite compares well with MOPITT over Canada, demonstrating the differences between these two satellite products. Negative CO biases over Canada compared to IASI (but positive compared to MOPITT) are also found in July and August, as shown in the JJA-2023 validation report available in ECMWF (2024d).
Over the Arctic Sea we observe a large region with negative biases in March compared to IASI. Note that IASI data have less sensitivity in spring as compared to summer above the Arctic due to lower thermal contrast, which may explain part of the differences. The MOPITT results seem to indicate a similar underestimate, so a negative bias in the analysis is likely.
Comparisons were also made against CO partial columns and profiles from the FTIR instruments, part of the surface remote sensing network, NDACC (Fig. 10). The scores for 13 NDACC stations are presented in Tables S1 and S2 in the Supplement. For tropospheric CO columns, the bias for the e-suite is reduced compared to the o-suite for almost all sites. Although correlations are similar for the o-suite and e-suite, the ratio of the standard deviation in the tropospheric columns for the e-suite and the FTIR time series is higher compared to the o-suite. The bias at the tropical sites has switched sign and is now positive. For stratospheric CO columns, the bias for the e-suite is reduced significantly for the southern hemispheric sites and is now of the order of the measurement uncertainty. The Southern Hemisphere correlations are also higher for the e-suite (in particular for the Antarctic Arrival Heights site). For the Northern Hemisphere, the e-suite and o-suite perform similarly. The o-suite has a degraded performance during this period in the Southern Hemisphere (Wollongong and Lauder stations), where the tropospheric columns show an increased negative bias compared to the months before October 2022 and the stratospheric columns show a strong (+20 %) positive bias. A direct comparison between the o-suite and e-suite should therefore be interpreted with care. The figure shows that for the e-suite, a reduced positive bias remains in the stratosphere for this period. This can be considered an improvement compared to the o-suite performance prior to October 2022 (negative bias < −20 %) and past October 2022 (positive bias > +20 %).
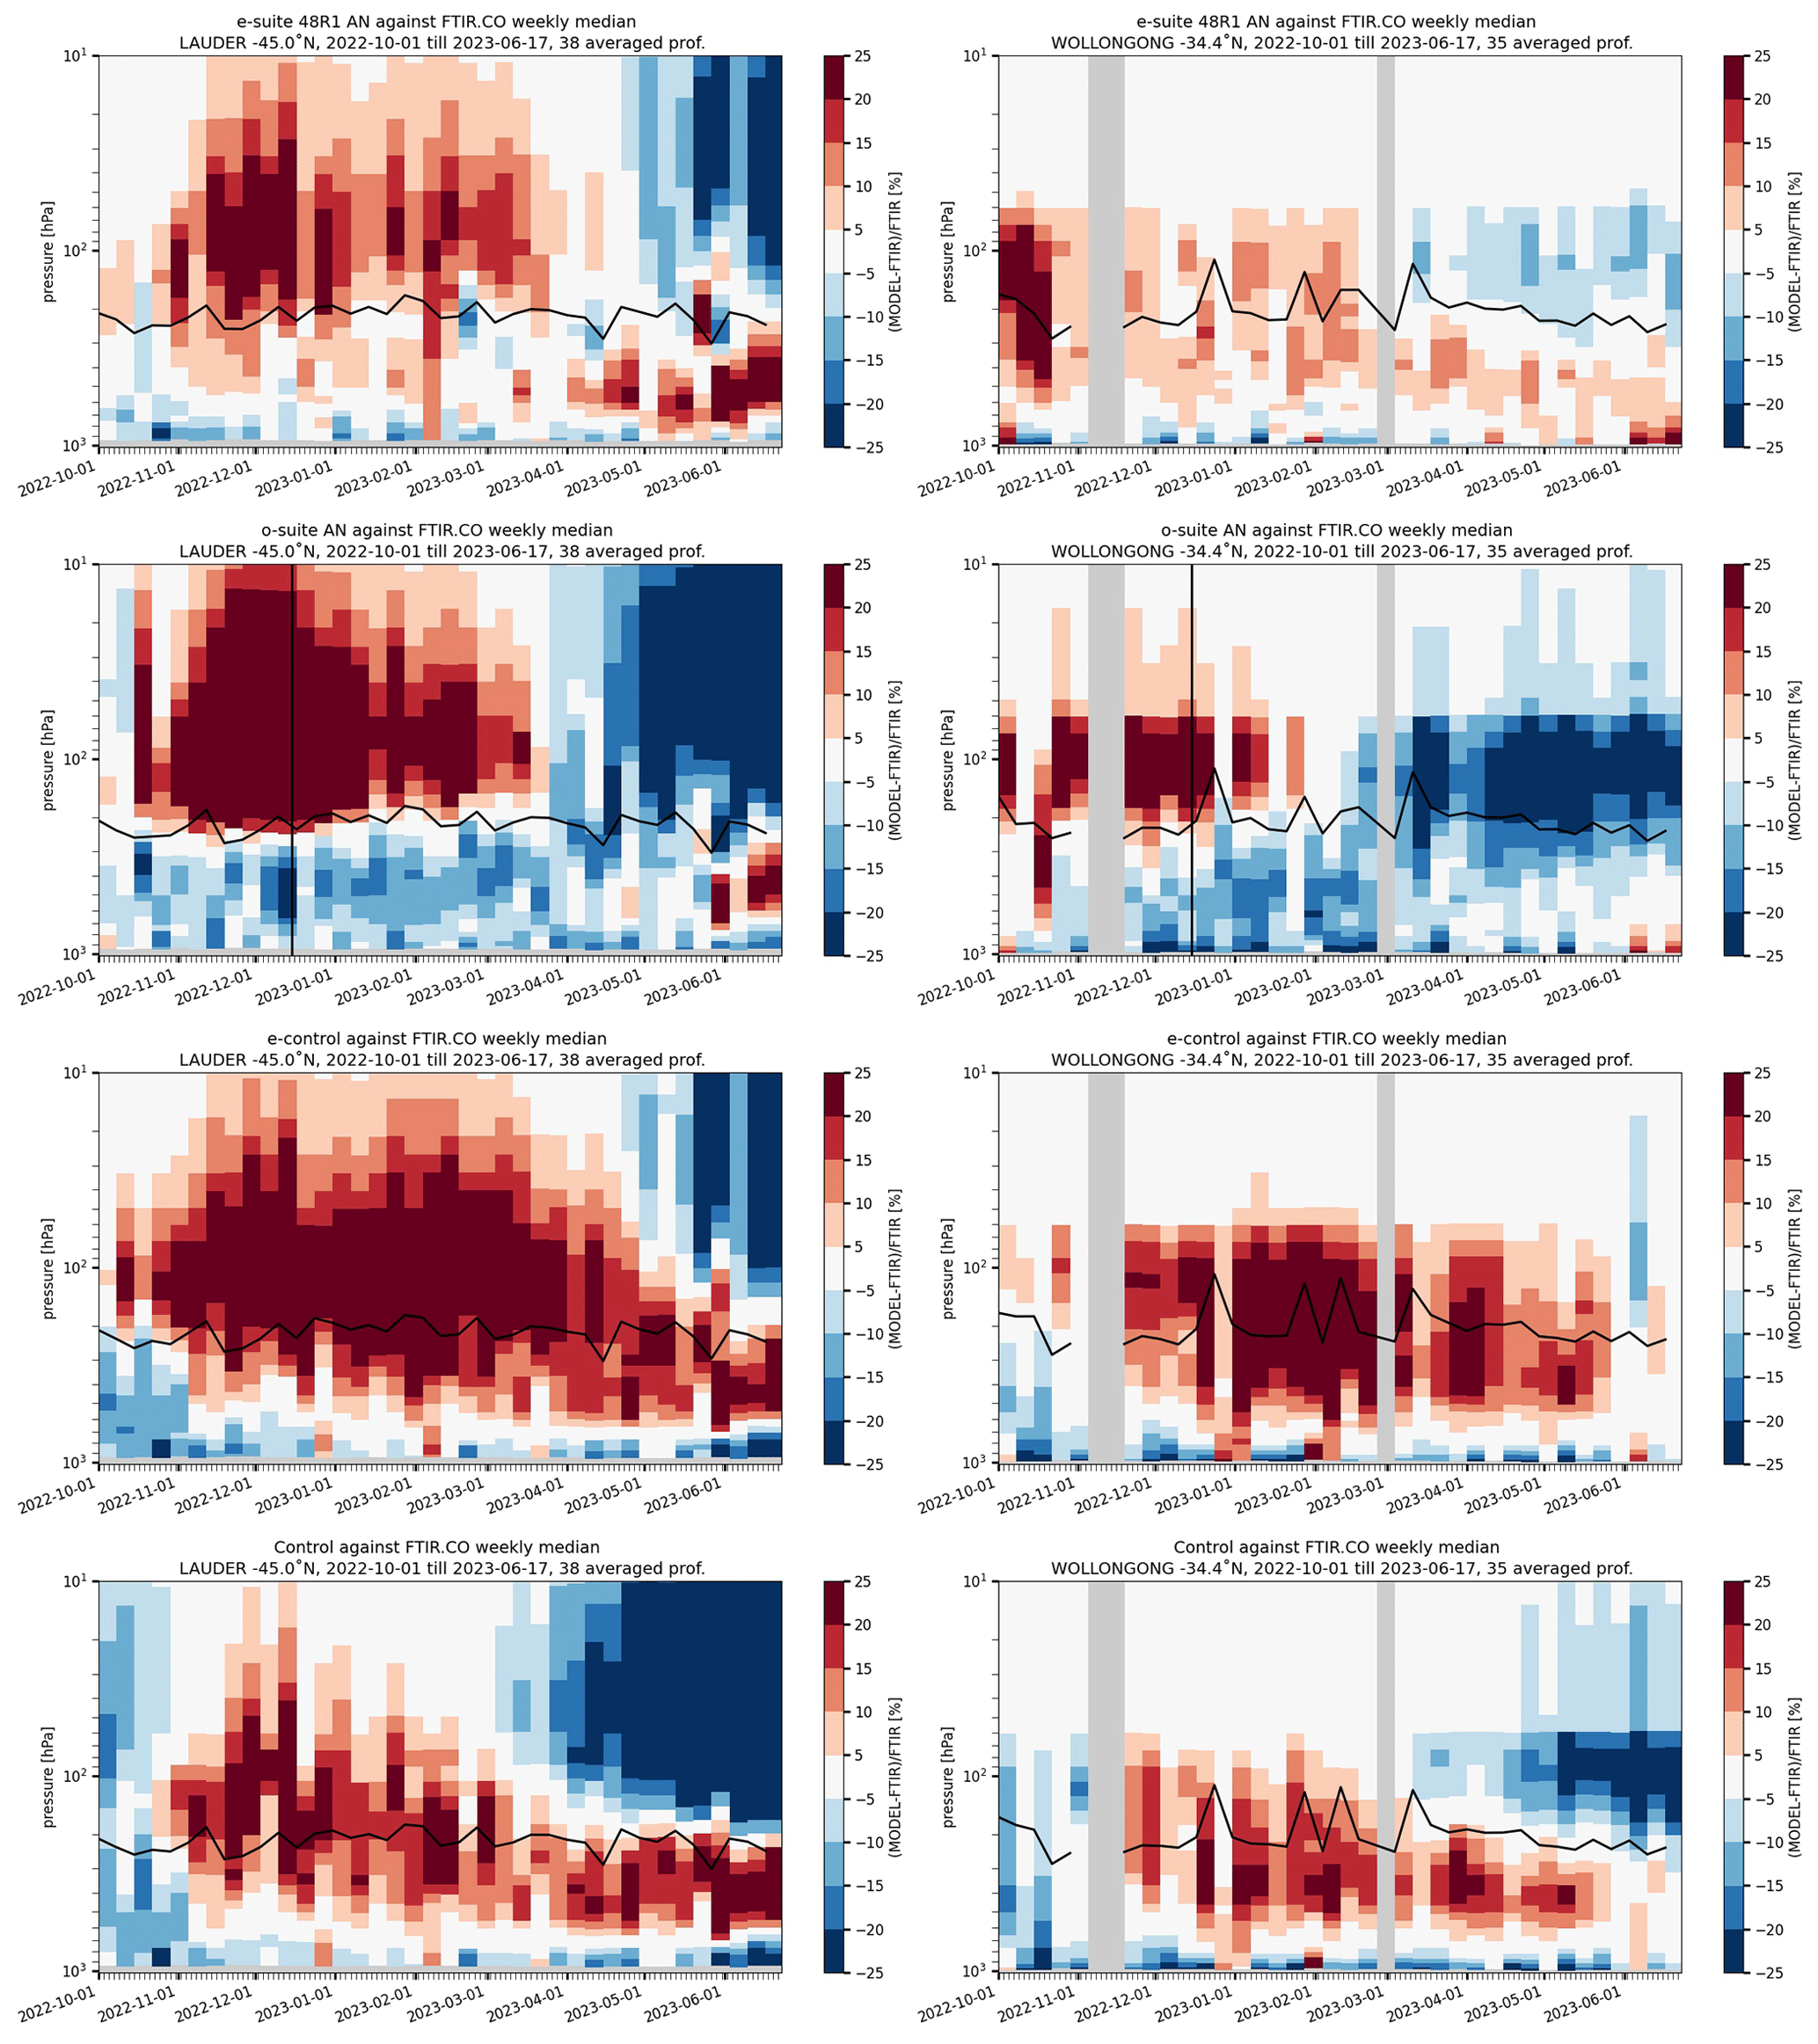
Figure 10Curtain plots of the CO profile relative difference in the CAMS products compared to FTIR observations from NDACC for the two southern hemispheric stations Lauder (left) and Wollongong (right). Shown are the differences with the e-suite (top row), o-suite (second row), e-control (third row) and o-control (bottom row). Model profiles are smoothed with the FTIR averaging kernels. The horizontal black line is the tropopause. The vertical black line indicates 15 December, when the change in the background error covariance was implemented.
As of 22 May 2023, wildfires had been raging across Canada's Alberta Province for 3 weeks. IAGOS aircraft profiles of CO over Montréal and Calgary picked up the pollution plumes from these events and have been compared with the CAMS results (Fig. S12). For most profiles studied during this event, the e-suite performed better than the o-suite, with values of the CO mixing ratios higher than those provided by the o-suite, although the forecast model still faces difficulties in capturing the high concentrations in the plumes, while the altitude is simulated with success.
4.3 Nitrogen dioxide (NO2)
The CAMS configurations were also compared with surface observations in China, Europe and North America.
Over China (Fig. 11), the e-suite and e-suite control run significantly reduce the Cy47R3 positive offset in surface NO2 over most regions in eastern China, which also leads to a reduced bias in surface ozone as discussed in Sect. 4.1. The correlation of the e-suite and e-suite control run is similar (slightly reduced) to that of the o-suite and o-suite control run. The mean correlation coefficient averaged over all stations is 0.52 for the e-suite and 0.54 for the o-suite.
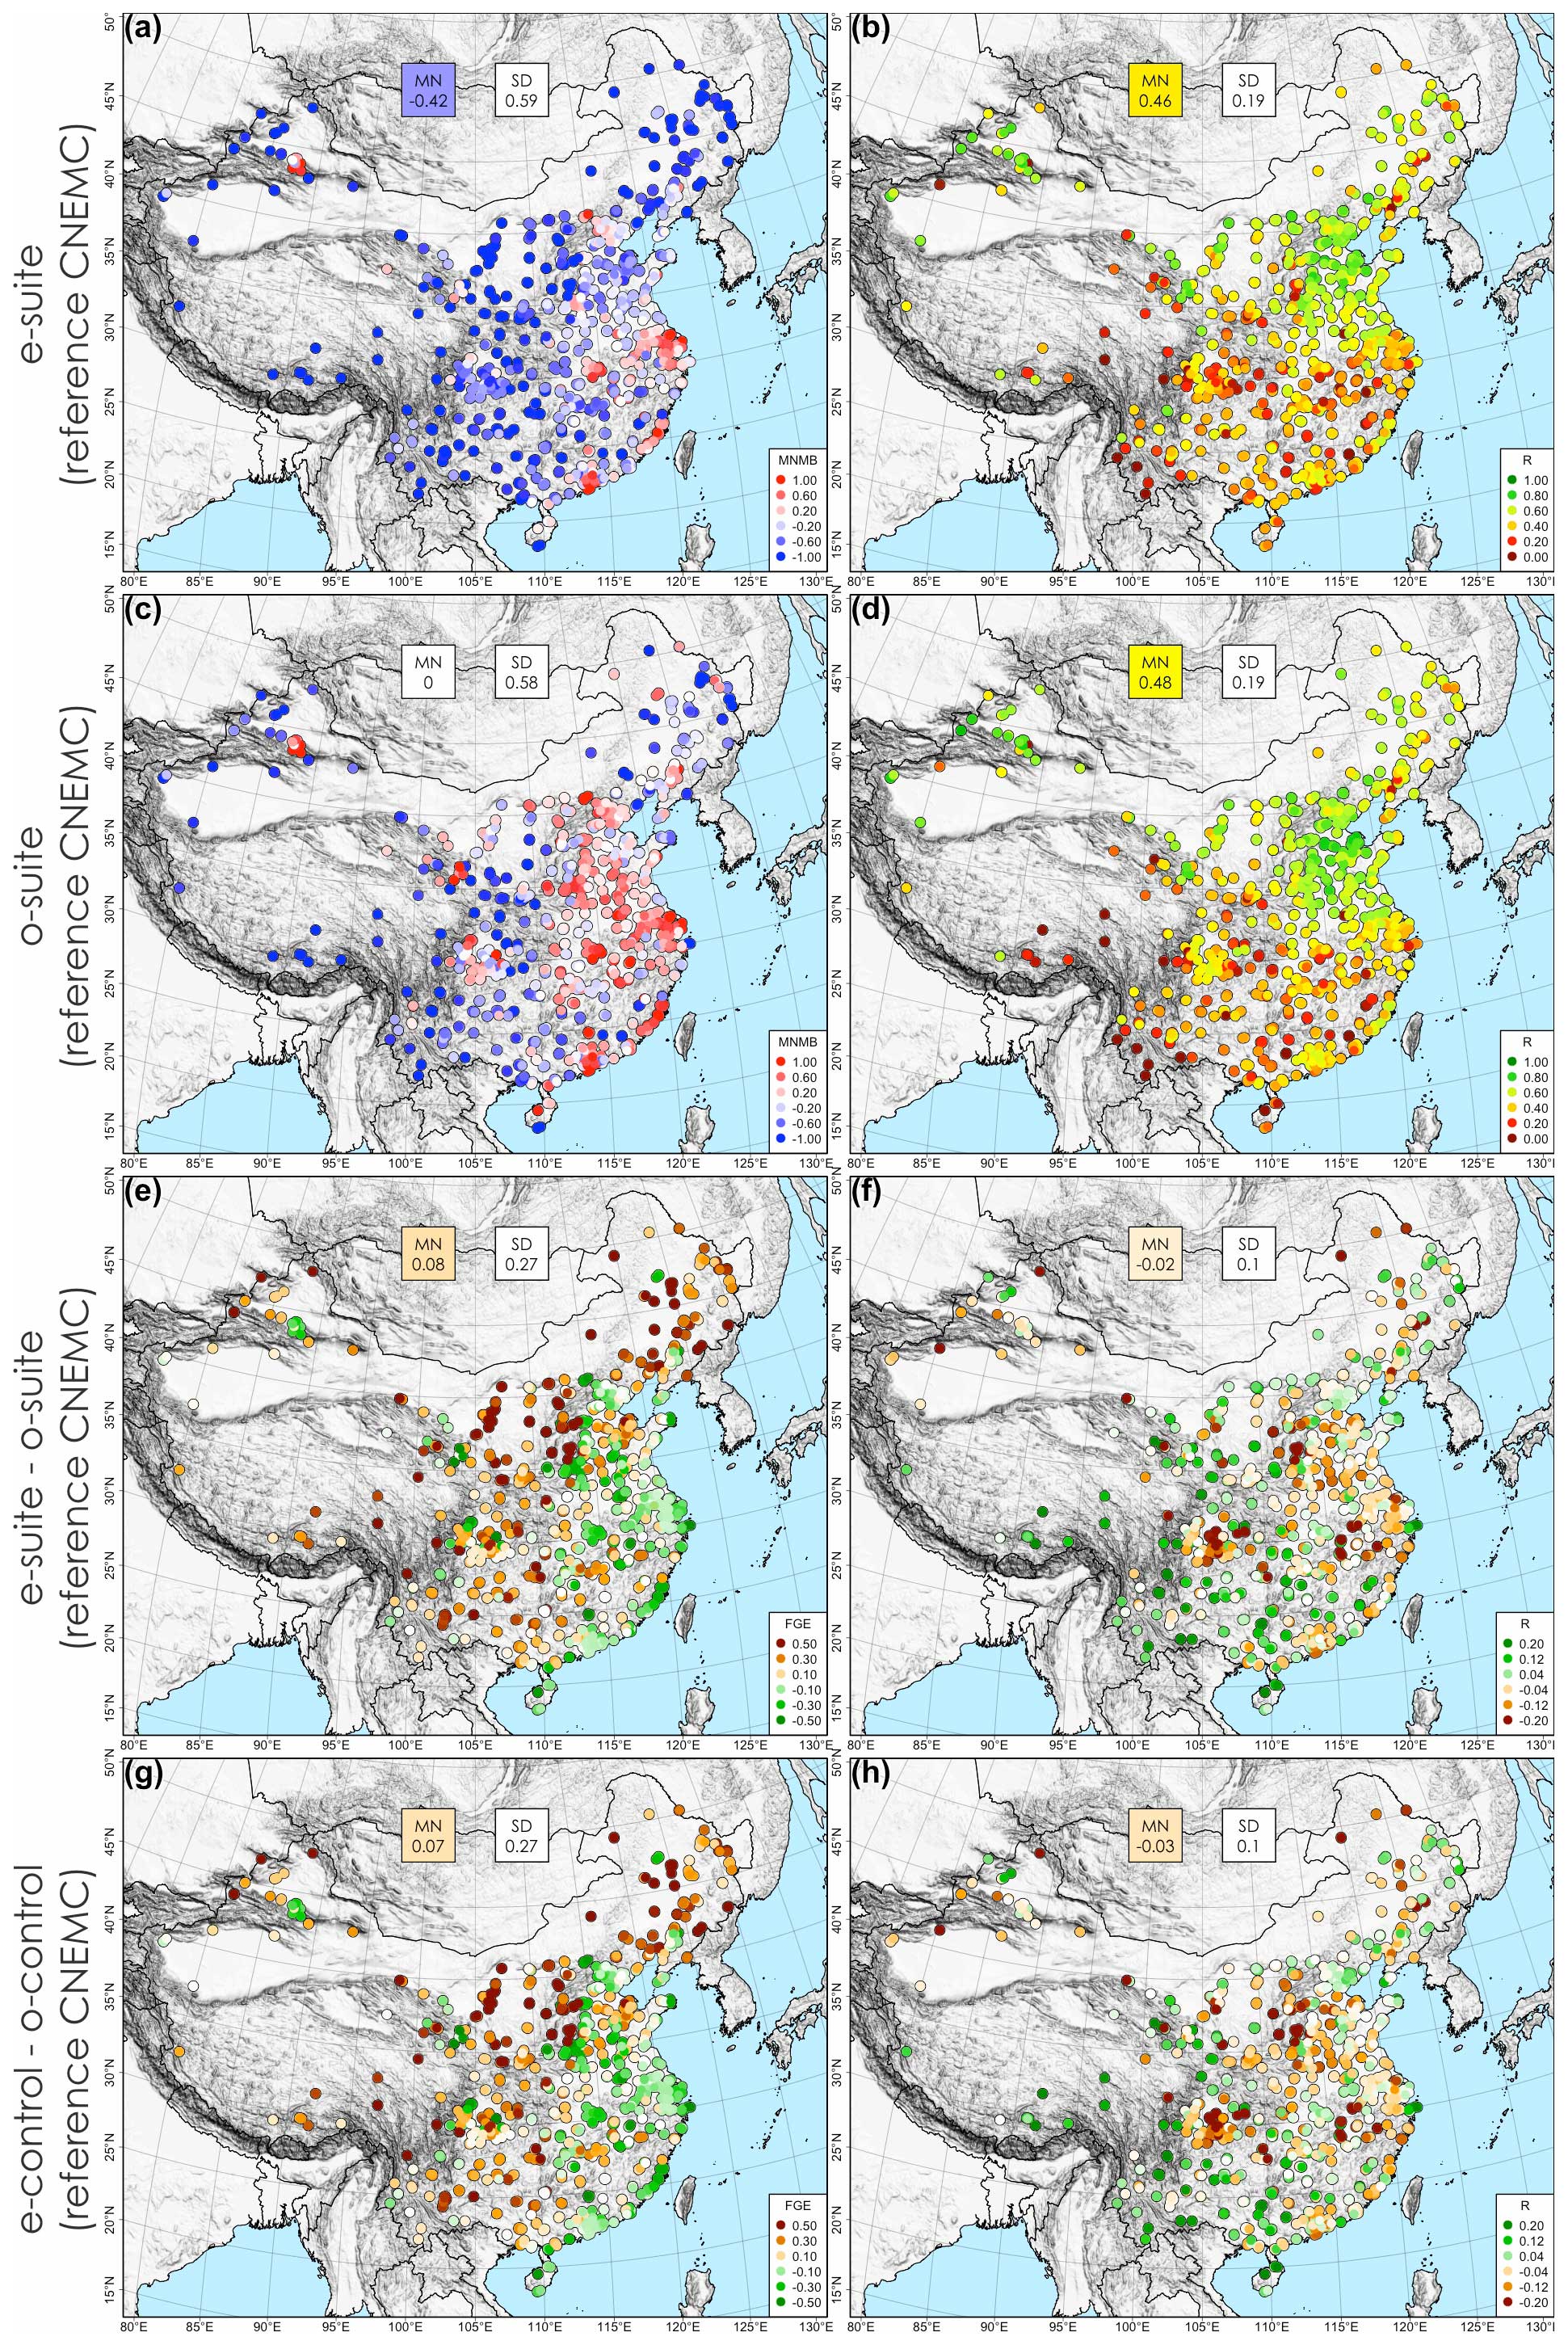
Figure 11Spatial distribution of the NO2 surface comparisons over China, for the e-suite minus CNEMC observations (a: MNMB; b: R), the o-suite minus observations (c: MNMB; d: R), the e-suite-minus-o-suite differences (e: FGE; f: R) and the e-control-minus-o-control differences (f: FGE; h: R) for the period 1 October to 27 June 2023. The mean (MN) and standard deviation (SD) for all stations are depicted for each map.
The comparison with surface NO2 observations in Europe obtained from EEA-Airbase shows that the e-suite performs better than the o-suite in terms of bias for a majority of the stations especially in central and northern Europe (Fig. S13). Interestingly, this coincides with the regions where a slightly higher bias was found for ozone in the e-suite, indicating that a chemical regime changes in the model. In terms of correlations, the e-suite and o-suite performed almost equally.
The evaluation of surface NO2 using the AirNow ground-based stations over North America shows that the underestimation in e-suite and e-suite control run is higher than in the o-suite and o-suite control run (from about −30 % to −40 %), while the temporal correlation (R) slightly improves (from 0.49 to 0.54) (Fig. S3).
The CAMS e-suite Cy48R1 tropospheric NO2 column data are compared to the TROPOMI scientific IUP, University of Bremen (IUP Bremen), tropospheric NO2 product; see Fig. 12. Three different months are selected for performance demonstration, including those periods with the highest and lowest solar elevation for the two hemispheres. Overall, the e-suite results correspond well to the observational data in terms of spatial and temporal variations and absolute amounts. However, there are also apparent differences between model and measurements. The largest differences are mainly observed above regions with major emissions. Locations strongly affected by anthropogenic pollution such as hotspots in China can show strong positive biases partly above 100 %. Relative to the o-suite, however, the e-suite performs better compared to TROPOMI especially above strongly polluted regions such as eastern China. Here, the positive bias in the o-suite is reduced in the e-suite as well as above other hotspot regions. This effect is most visible in the December maps (left column of Fig. 12). This improvement is likely due to the updated emissions used in Cy48R1. Most areas with strong positive biases are smaller in their spatial extent and smaller in their bias values in the e-suite compared to the o-suite. In addition, there are a few confined regions where the e-suite shows positive biases not present in the o-suite comparison such as above the North Sea. This can mainly be explained by the lower anthropogenic emissions in CAMS-GLOB-ANT v5.3 as applied in the e-suite, compared to CAMS-GLOB-ANT v4.2 in the o-suite.
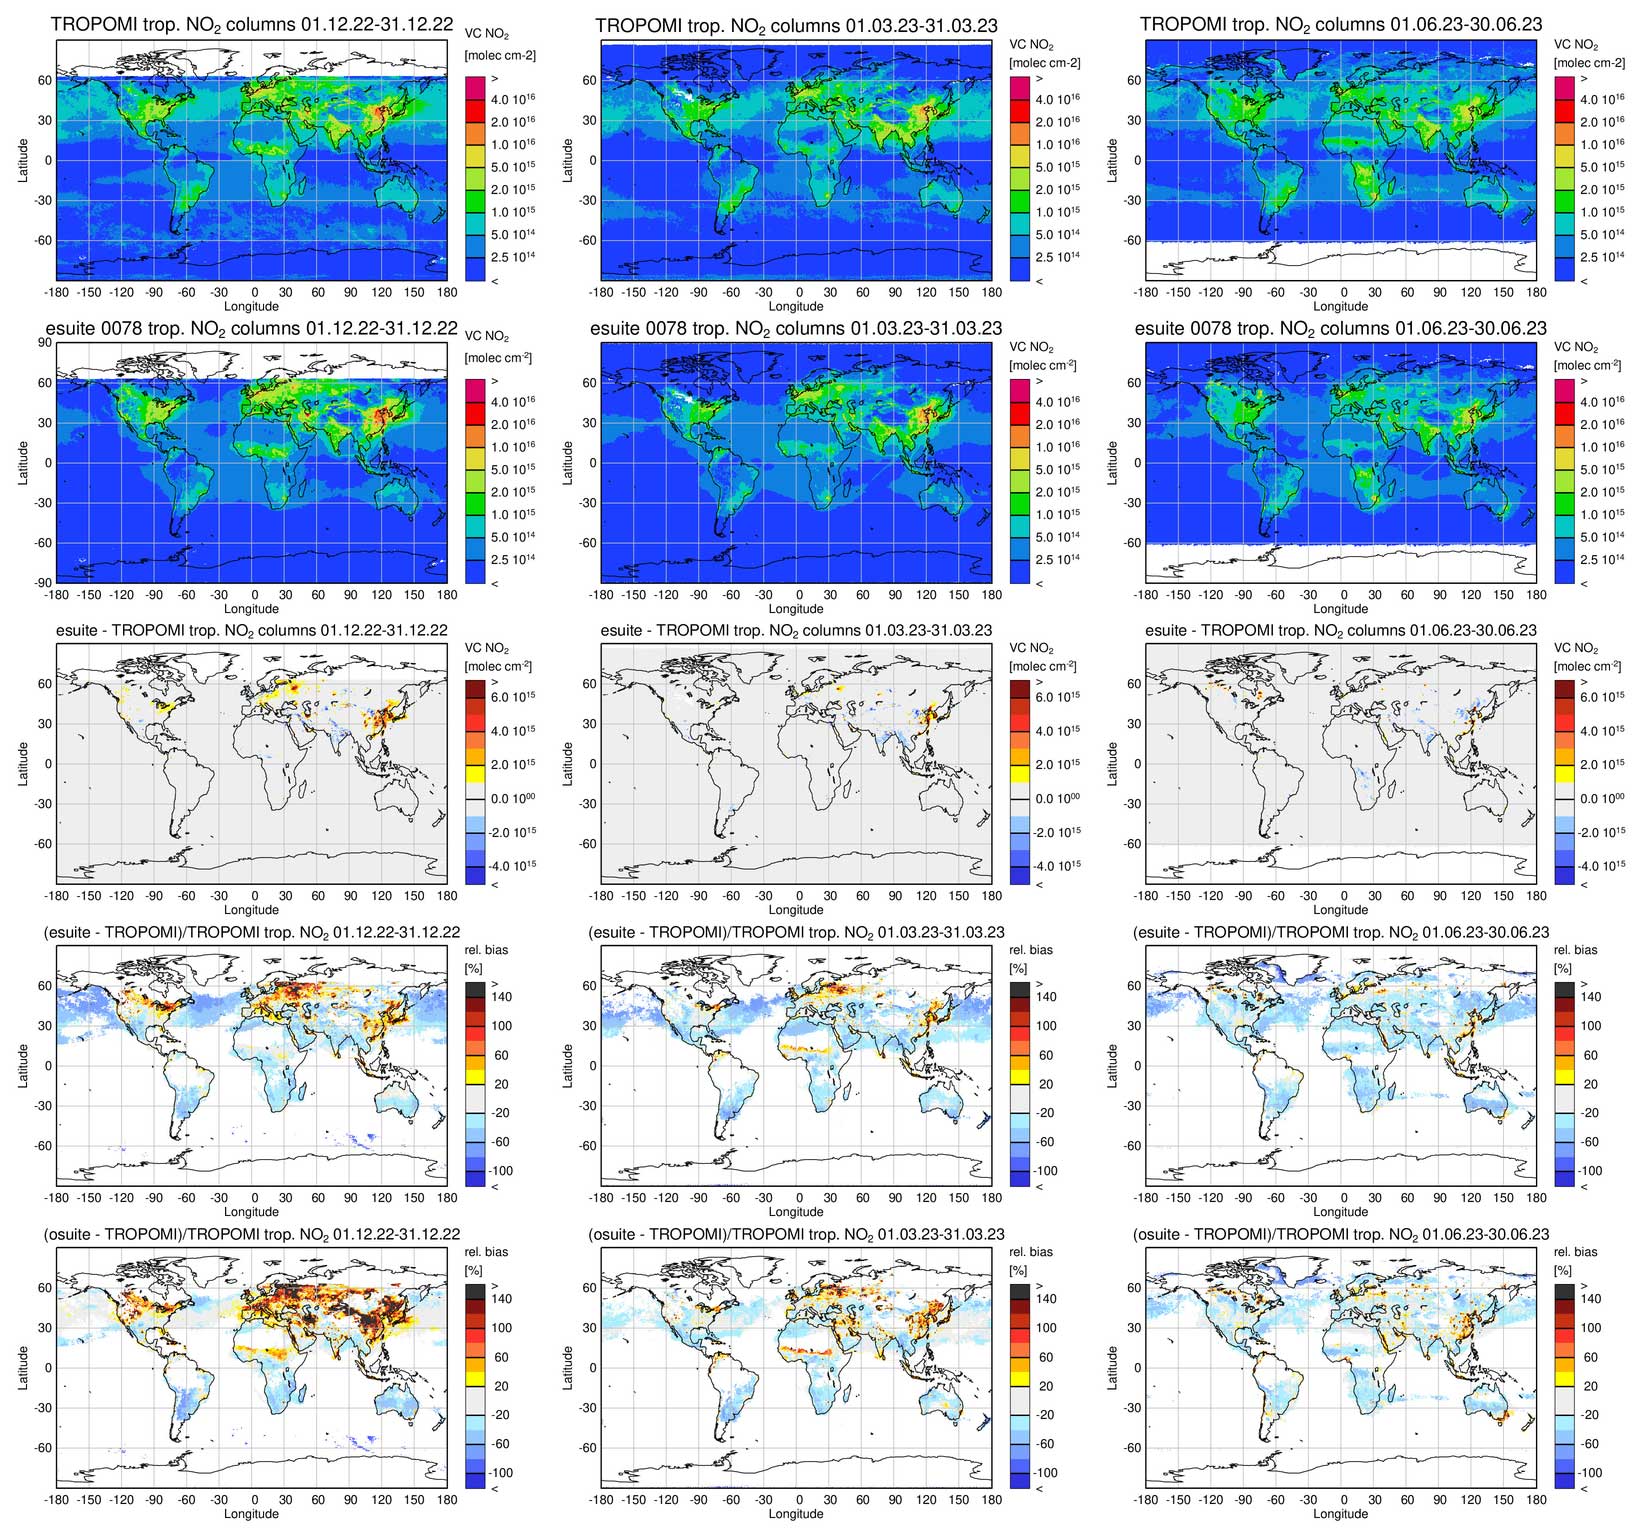
Figure 12Monthly mean global maps of tropospheric NO2 column densities for TROPOMI satellite observations (first row), the e-suite (second row), the difference between the e-suite and satellite (third row), the relative difference between the e-suite and satellite (fourth row), and the relative difference between the o-suite and satellite (fifth row) for December 2022 (left column), March 2023 (middle column) and June 2023 (right column). Units: 1×10¹⁵ molec. cm−2. Note that for the relative bias the regions with background values below 5×10¹⁴ molec. cm−2 are not included in the analysis.
Some typical biomass burning areas such as southern Africa or South America show negative biases around 40 % compared to TROPOMI. Negative biases are seen also above parts of the USA, the northern Atlantic, northern Pacific and parts of Asia. In contrast, positive biases are found over boreal fires. No noteworthy degradation in performance is seen when moving from the previous o-suite to the e-suite results. This is also true concerning the background regions: both the e-suite and the o-suite perform well in representing background values close to zero. The negative biases for some oceanic background regions are slightly larger for the e-suite than for the o-suite. The negative biases above the oceans on the Northern Hemisphere show up in areas where the absolute tropospheric NO2 column is small and close to background levels. Slight differences in absolute amounts thus cause comparably large relative bias values. Overall, the performance of the e-suite is slightly better than that of the o-suite.
4.4 Sulfur dioxide (SO2)
The comparison to SO2 surface observations from the China National Environmental Monitoring Centre shows that the e-suite–e-suite control run significantly reduces the positive bias observed for the o-suite–o-suite control run over most regions in eastern China, as indicated by the difference in FGE between the e-suite and o-suite (Fig. 13). However, a high overestimation (> 50 %) is still observed in the e-suite for many of the stations, indicating a remaining possible overestimation of SO2 emissions in the updated CAMS_GLOB_ANT inventory. Note that the temporal correlation (R) is slightly reduced in the e-suite compared to the o-suite.
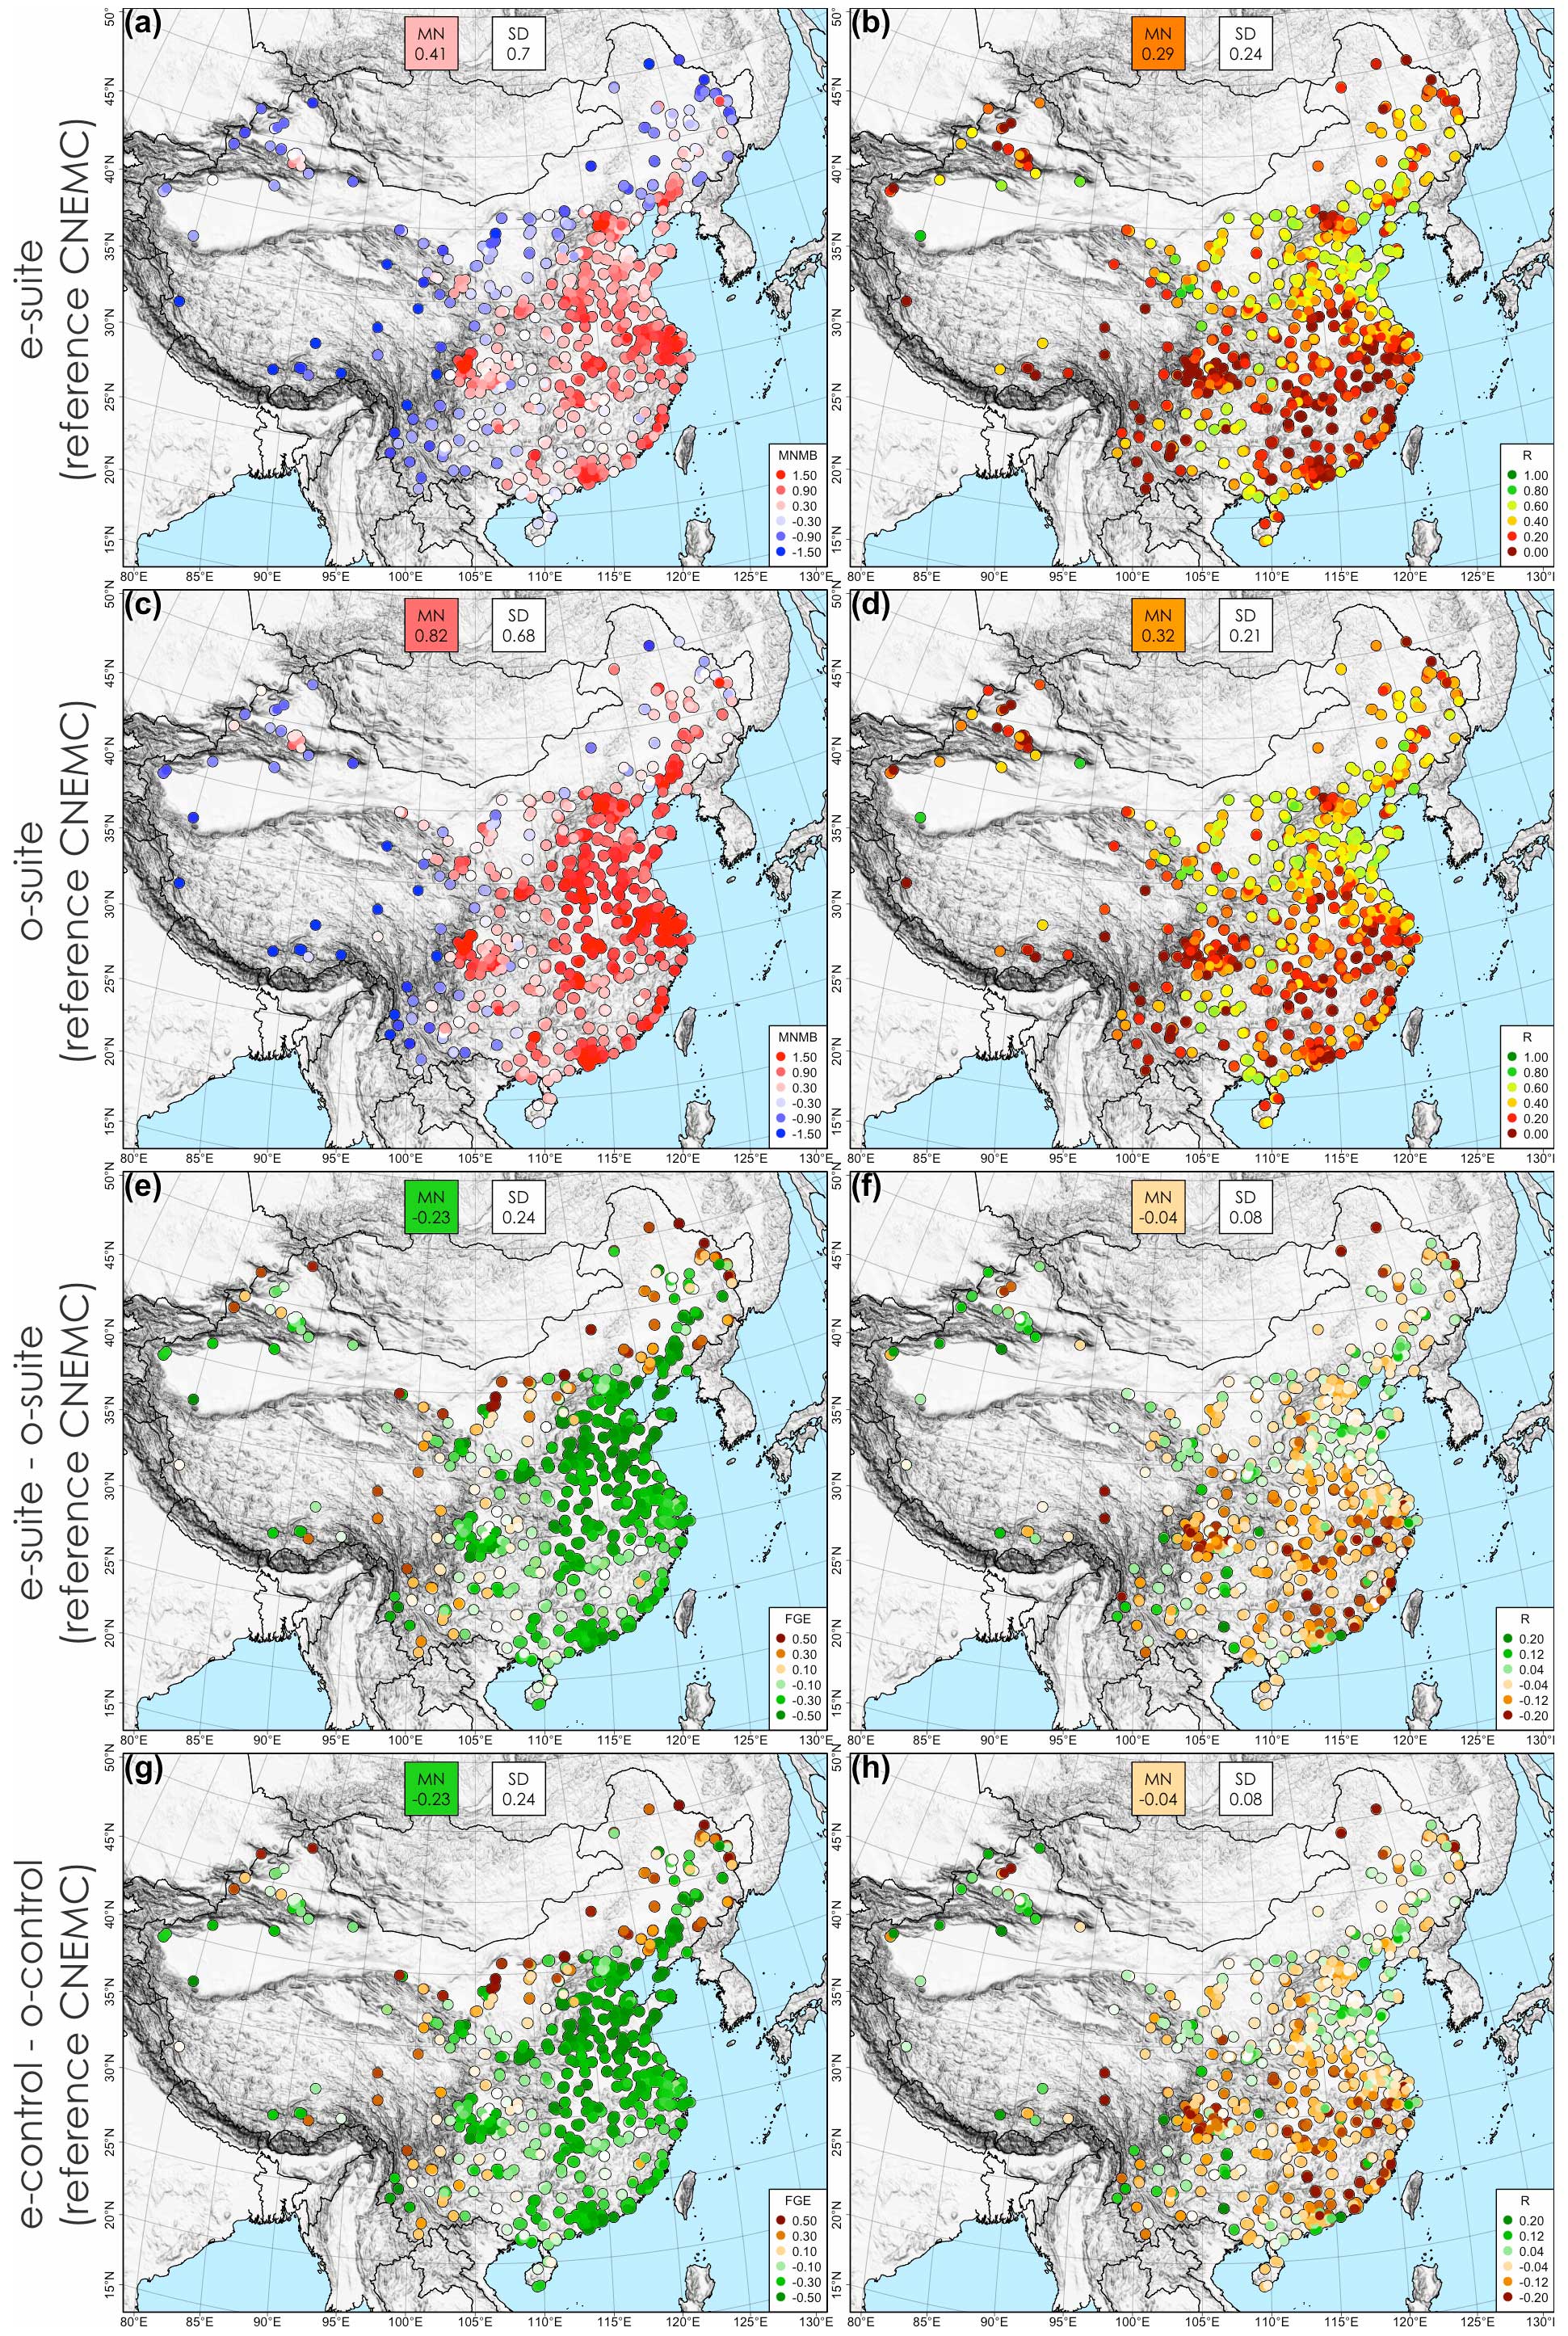
Figure 13Spatial distribution of the SO2 surface comparisons over China, for the e-suite minus CNEMC observations (a: MNMB; b: R), the o-suite minus observations (c: MNMB; d: R), the e-suite-minus-o-suite differences (e: FGE; f: R) and the e-control-minus-o-control differences (g: FGE; h: R) for the period 1 October to 27 June 2023. The mean (MN) and standard deviation (SD) for all stations are depicted for each map.
The comparison of the SO2 mixing ratio against EEA-Airbase observations over Europe shows that the e-suite–e-suite control run performs better than the o-suite–o-suite control run in terms of bias for most stations (Fig. S14). The correlations are almost equal.
4.5 Formaldehyde (HCHO)
The tropospheric formaldehyde (HCHO) column from the CAMS e-suite is compared to the TROPOMI scientific IUP Bremen tropospheric HCHO product (Eskes et al., 2023a). Monthly mean global maps and differences are shown in Fig. 14.
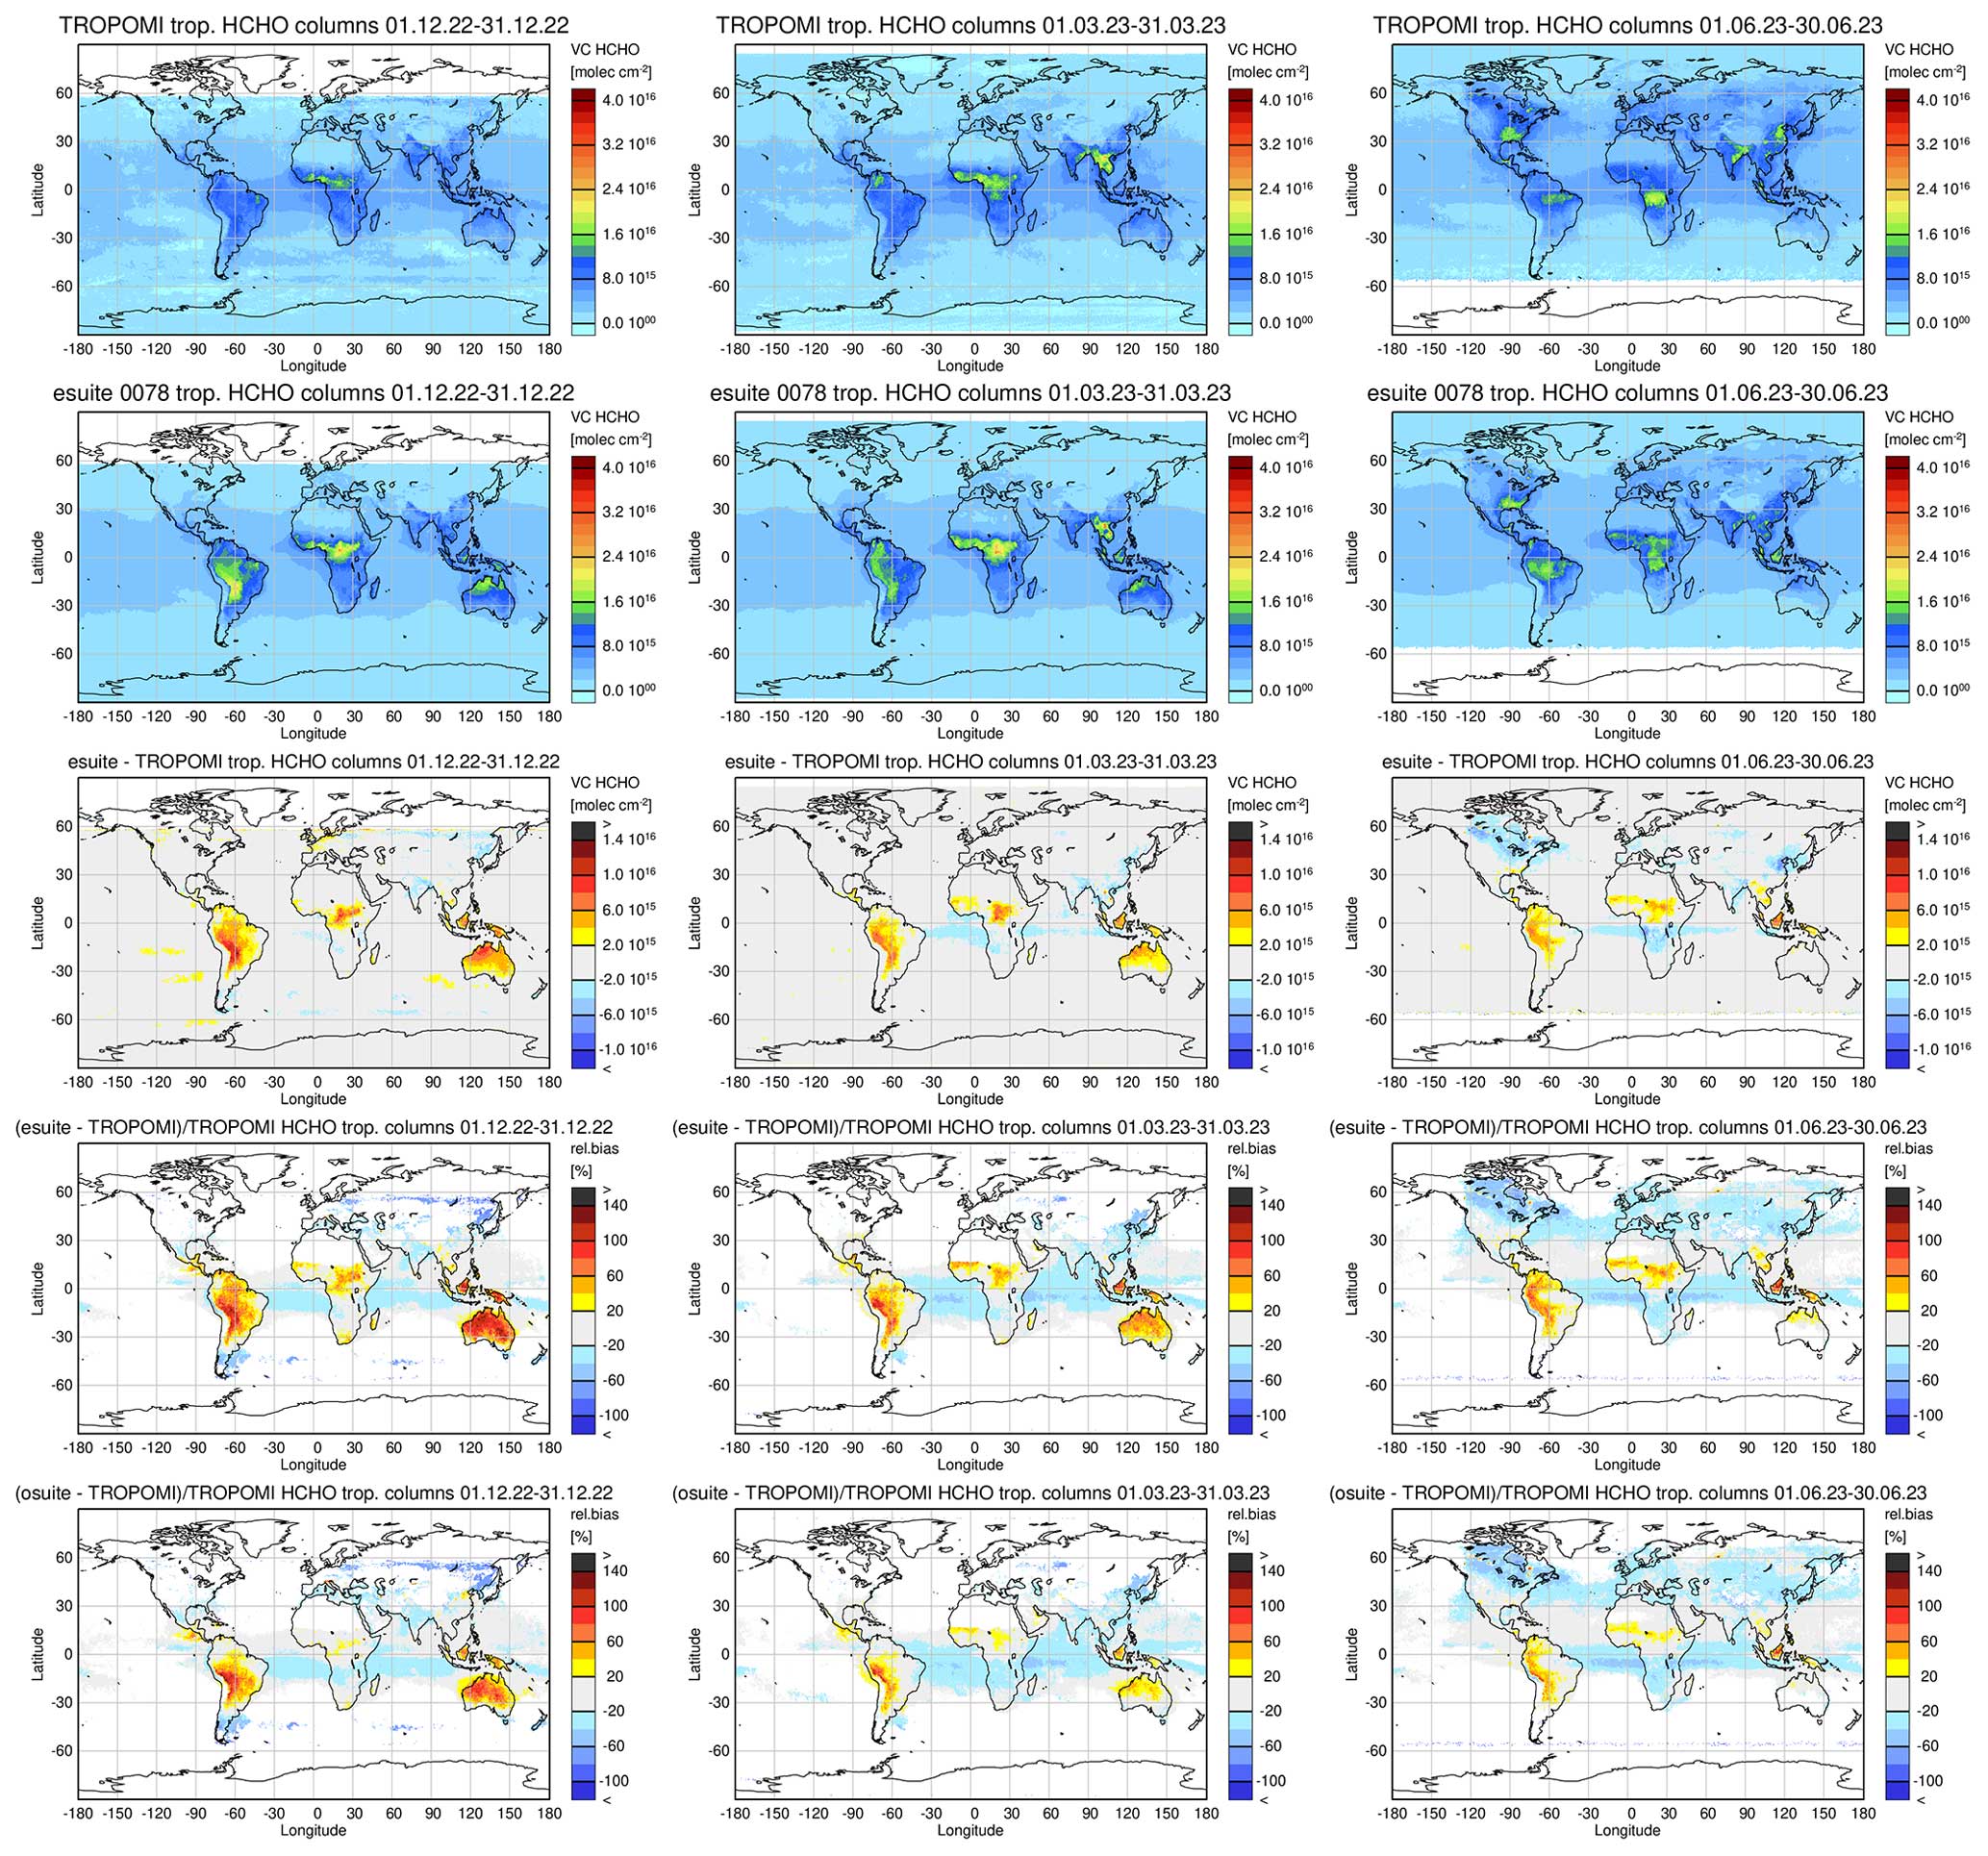
Figure 14Monthly mean global maps of tropospheric HCHO column densities for TROPOMI satellite observations (first row), the e-suite (second row), the difference between the e-suite and satellite (third row), the relative difference between the e-suite and satellite (fourth row), and the relative difference between the o-suite and satellite (fifth row) for December 2022 (left column), March 2023 (middle column) and June 2023 (right column). Units: 1×1515 molec. cm−2. Regions with mean background values below 3×10¹⁵ molec. cm−2 are excluded from the analysis (white areas).
The e-suite overestimates the tropospheric HCHO columns over South America and northern Australia by more than 60 % in December and March, and there is also an overestimation over Indonesia. The allocation of the HCHO columns over northern and southern Africa in the two months is well reproduced by the model, but there are biases in certain time periods, such as the overestimation north of the Equator and an underestimation in the south for June 2023.
In comparison to the o-suite, the overestimation above South America and northern Australia is stronger in the e-suite, visible in the relative biases of the e-suite and the o-suite in rows four and five of Fig. 14. This could be the effect of the updated isoprene chemistry, which induced higher HCHO production. Above northern Africa, the HCHO values show a larger positive bias, while over southern Africa the negative bias is slightly less pronounced in the e-suite. Overall, the performance is similar but slightly degraded for the e-suite.
4.6 Stratospheric ozone (O3)
Stratospheric ozone from the CAMS e-suite Cy48R1 and o-suite have been compared against satellite limb profiles and ozonesondes, considering the analyses, the fifth-day forecasts and the o-suite control run; see Fig. 15. The full e-suite period is considered, from 1 October 2022 to 27 June 2023.
The main conclusions are as follows:
-
In the lower stratosphere, at pressures higher than 10 hPa, the e-suite agrees better with the observations than the o-suite, with lower biases, lower FGE and higher correlations for the 9-month period evaluated.
-
The e-suite agrees much better with observations than the o-suite in the tropics.
-
The e-suite 5 d forecast agrees better with independent observations than the o-suite during ozone hole conditions.
-
In the upper stratosphere (at pressure lower than 10 hPa), the e-suite displays a larger negative bias than the o-suite, while the correlations are improved in the e-suite in the upper stratosphere in the tropics.
-
The control run of the e-suite shows a higher negative bias than the o-suite control run in the upper stratosphere above the 10 hPa level.
The differences between the o-suite and the e-suite are largely due to the introduction of full stratospheric chemistry, which is demonstrated by comparing the control runs of the o-suite and the e-suite.
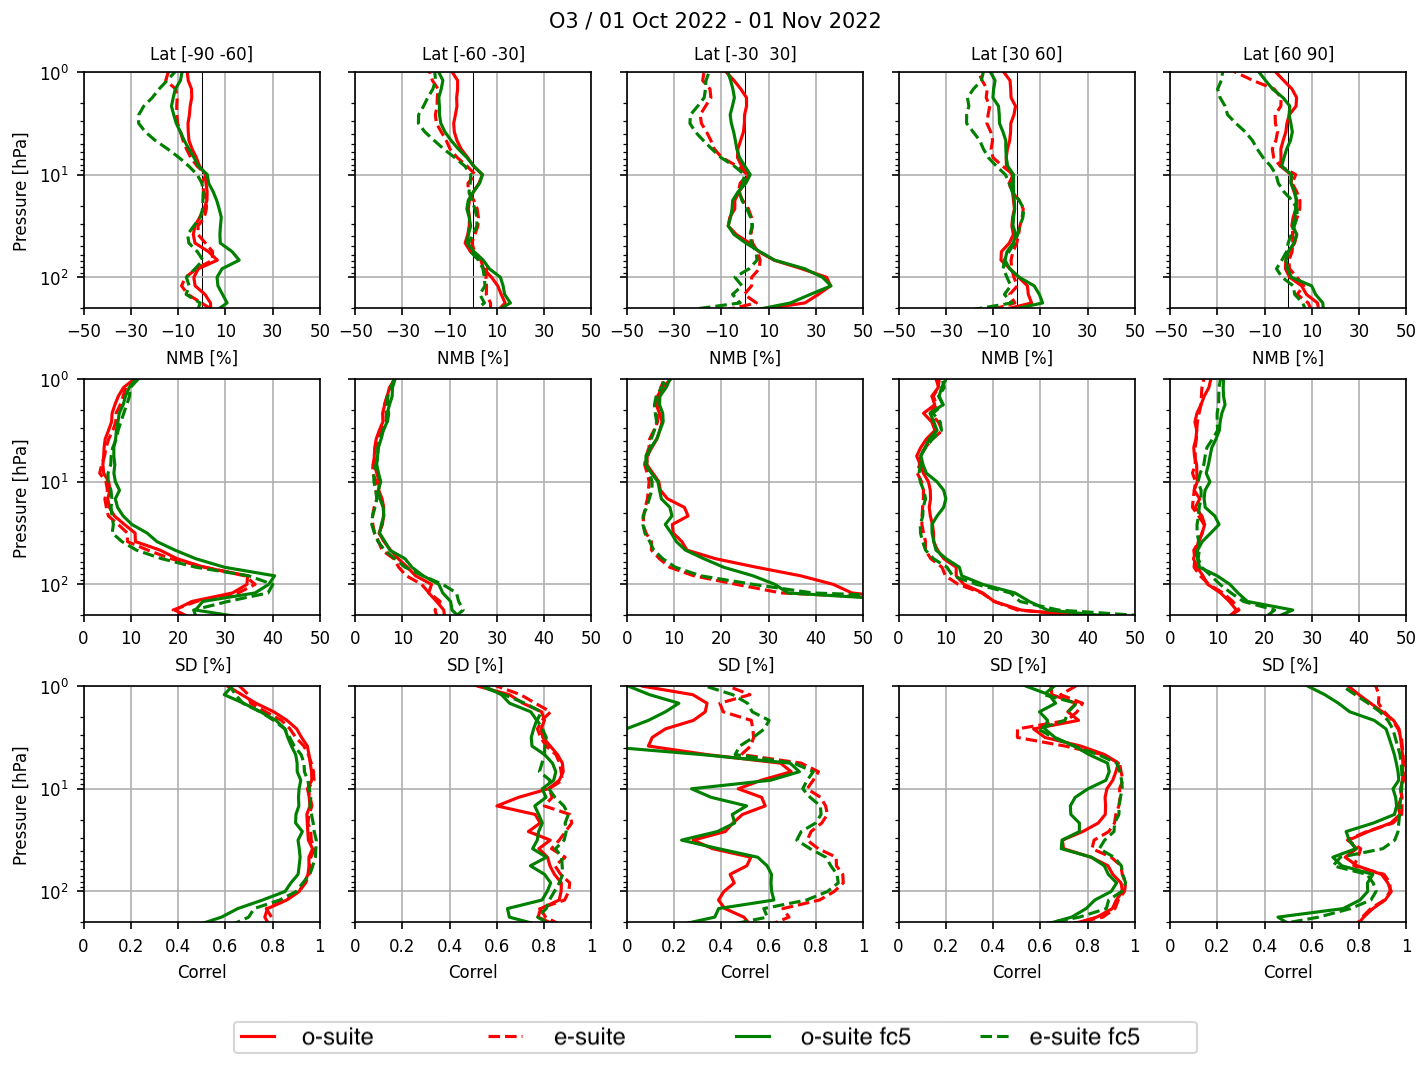
Figure 15The e-suite and o-suite compared to a multi-instrument mean (MIM), consisting of observed ozone profiles from ACE-FTS v4.1, Aura MLS v4.2, OMPS LP v2.5, SAGE III-ISS v5.2 and ozonesondes. Top row: normalised mean difference between the MIM ozone observed profiles and the o-suite analyses (solid red line), the o-suite fifth-day forecast (solid green line), the e-suite analyses (dashed red line) and the e-suite fifth-day forecast (dashed green line). The figure refers to the period October 2022, which is during the Antarctic ozone hole conditions. Five latitude bands are considered, from left to right: 90–60° S, 60–30° S, 30° S–30° N, 30–60° N and 60–90° N. The corresponding standard deviation of the differences and the correlation coefficient between observed profiles and the e-suite and o-suite runs are shown in the second and the third row, respectively.
Stratospheric ozone has also been compared to lidar profile observations from NDACC for the full e-suite period of 9 months; see Fig. 16. Above 10 hPa, the e-suite mean profile deviates from the o-suite, showing a negative bias compared to the lidar observations that increases with altitude. Between 50 and 10 hPa, the e-suite overestimates the ozone concentration. The negative bias feature observed around 20 hPa in the o-suite at Mauna Loa is no longer present in the e-suite. The dispersion (standard deviation, SD) in the differences is slightly, but systematically, improved for the e-suite. In general, the conclusions for the lidar comparisons are very similar to those for the satellite comparisons.
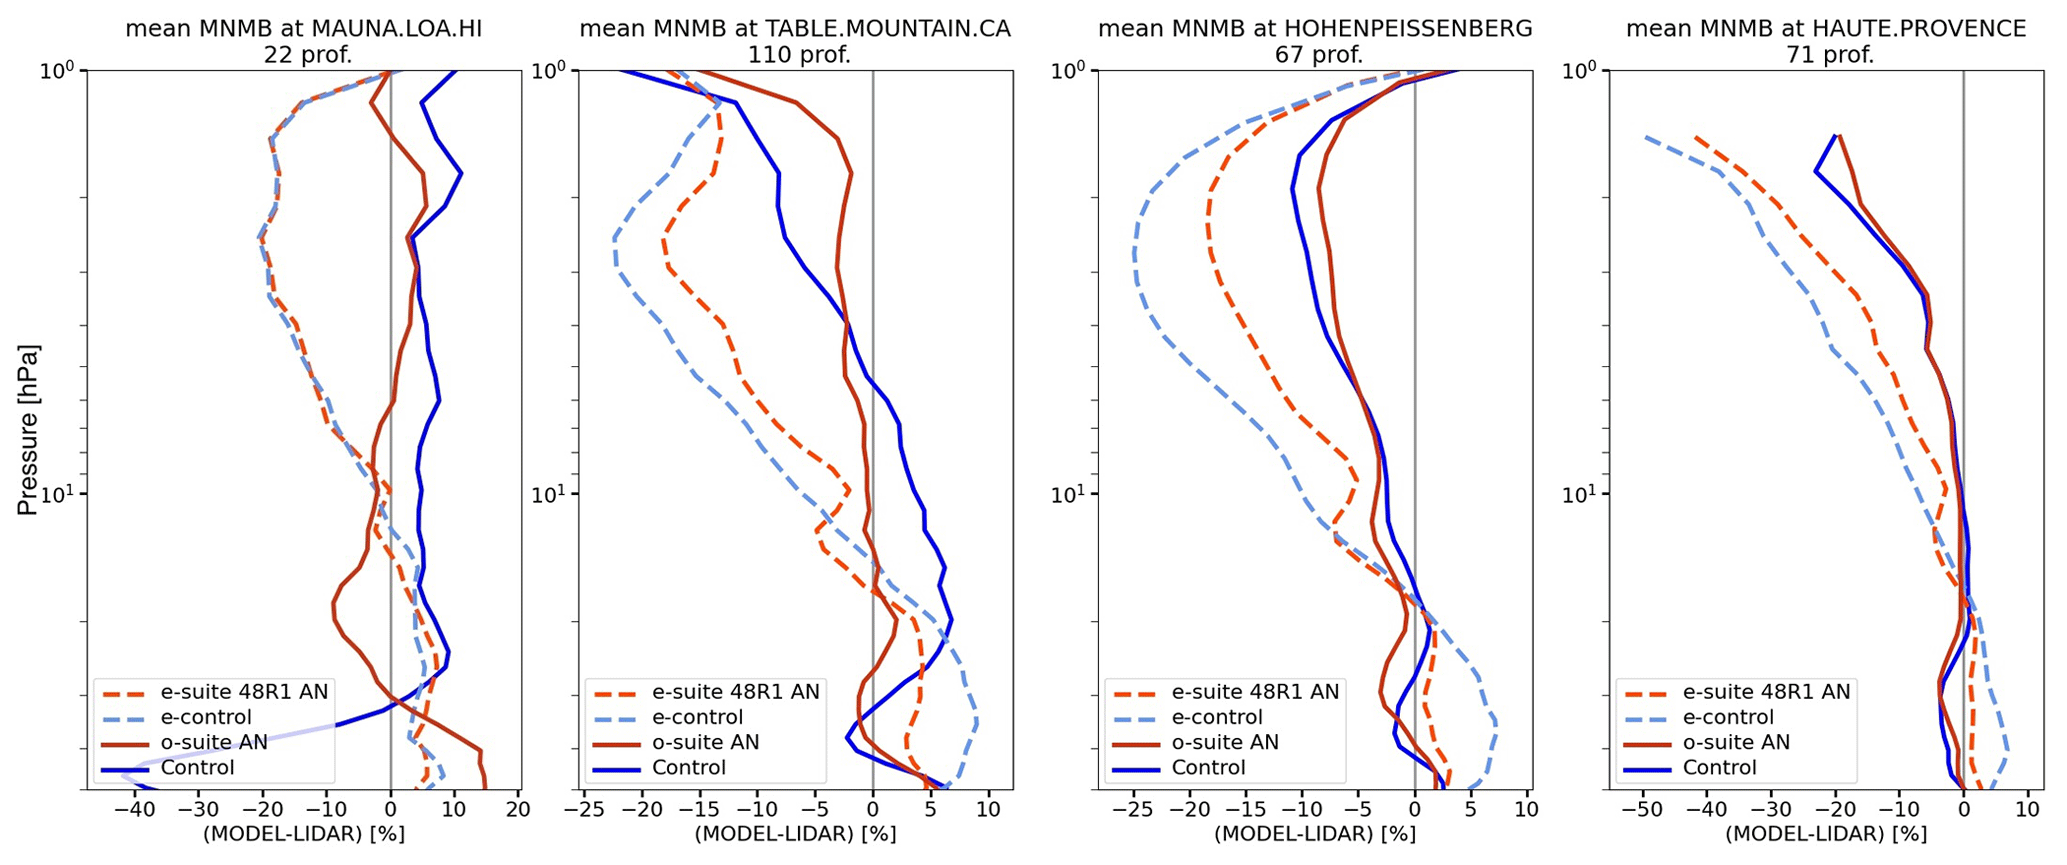
Figure 16Mean ozone profile differences for e-suite (dashed red), o-suite (solid red), e-suite control run (dashed blue) and o-suite control run (solid blue) compared to the stratospheric ozone lidar observations of four stations from NDACC.
4.7 Other trace gases in the stratosphere
Other species simulated in the stratosphere in the e-suite have been compared with satellite limb profiles considering 3-hourly first-day forecast. The new CAMS cycle 48R1 introduces full stratospheric chemistry, and meaningful comparisons with the o-suite are not possible. However, reasonable concentrations of these species are important because of their impact on ozone. The species considered are as follows: CCl4, CFC-11, CFC-12, HCFC-22, ClO, ClONO2, HCl, CH4, H2O, HNO3, N2O, N2O5, NO2, NOx (NO+NO2) and O3.
There is a relatively good agreement between the e-suite and observations for long-lived species (CCl4, CFC-11, CFC-12, CH4, HCFC-22 and N2O) and HCl between 10 and 200 hPa; see Fig. 17. The chemical H2O tracer in the CAMS e-suite shows a negative bias. Even though not perfect, CAMS e-suite NO2 (and NOx) agrees relatively well with observations, which was not the case in the previous o-suite cycles. Above the 10 hPa level, the concentrations are overestimated compared to the Atmospheric Chemistry Experiment Fourier Transform Spectrometer (ACE-FTS), and there is room for improvement. For ClO, the agreement is good with MLS and less good with ACE-FTS, but this dataset is supposed to be less reliable than MLS for this species.
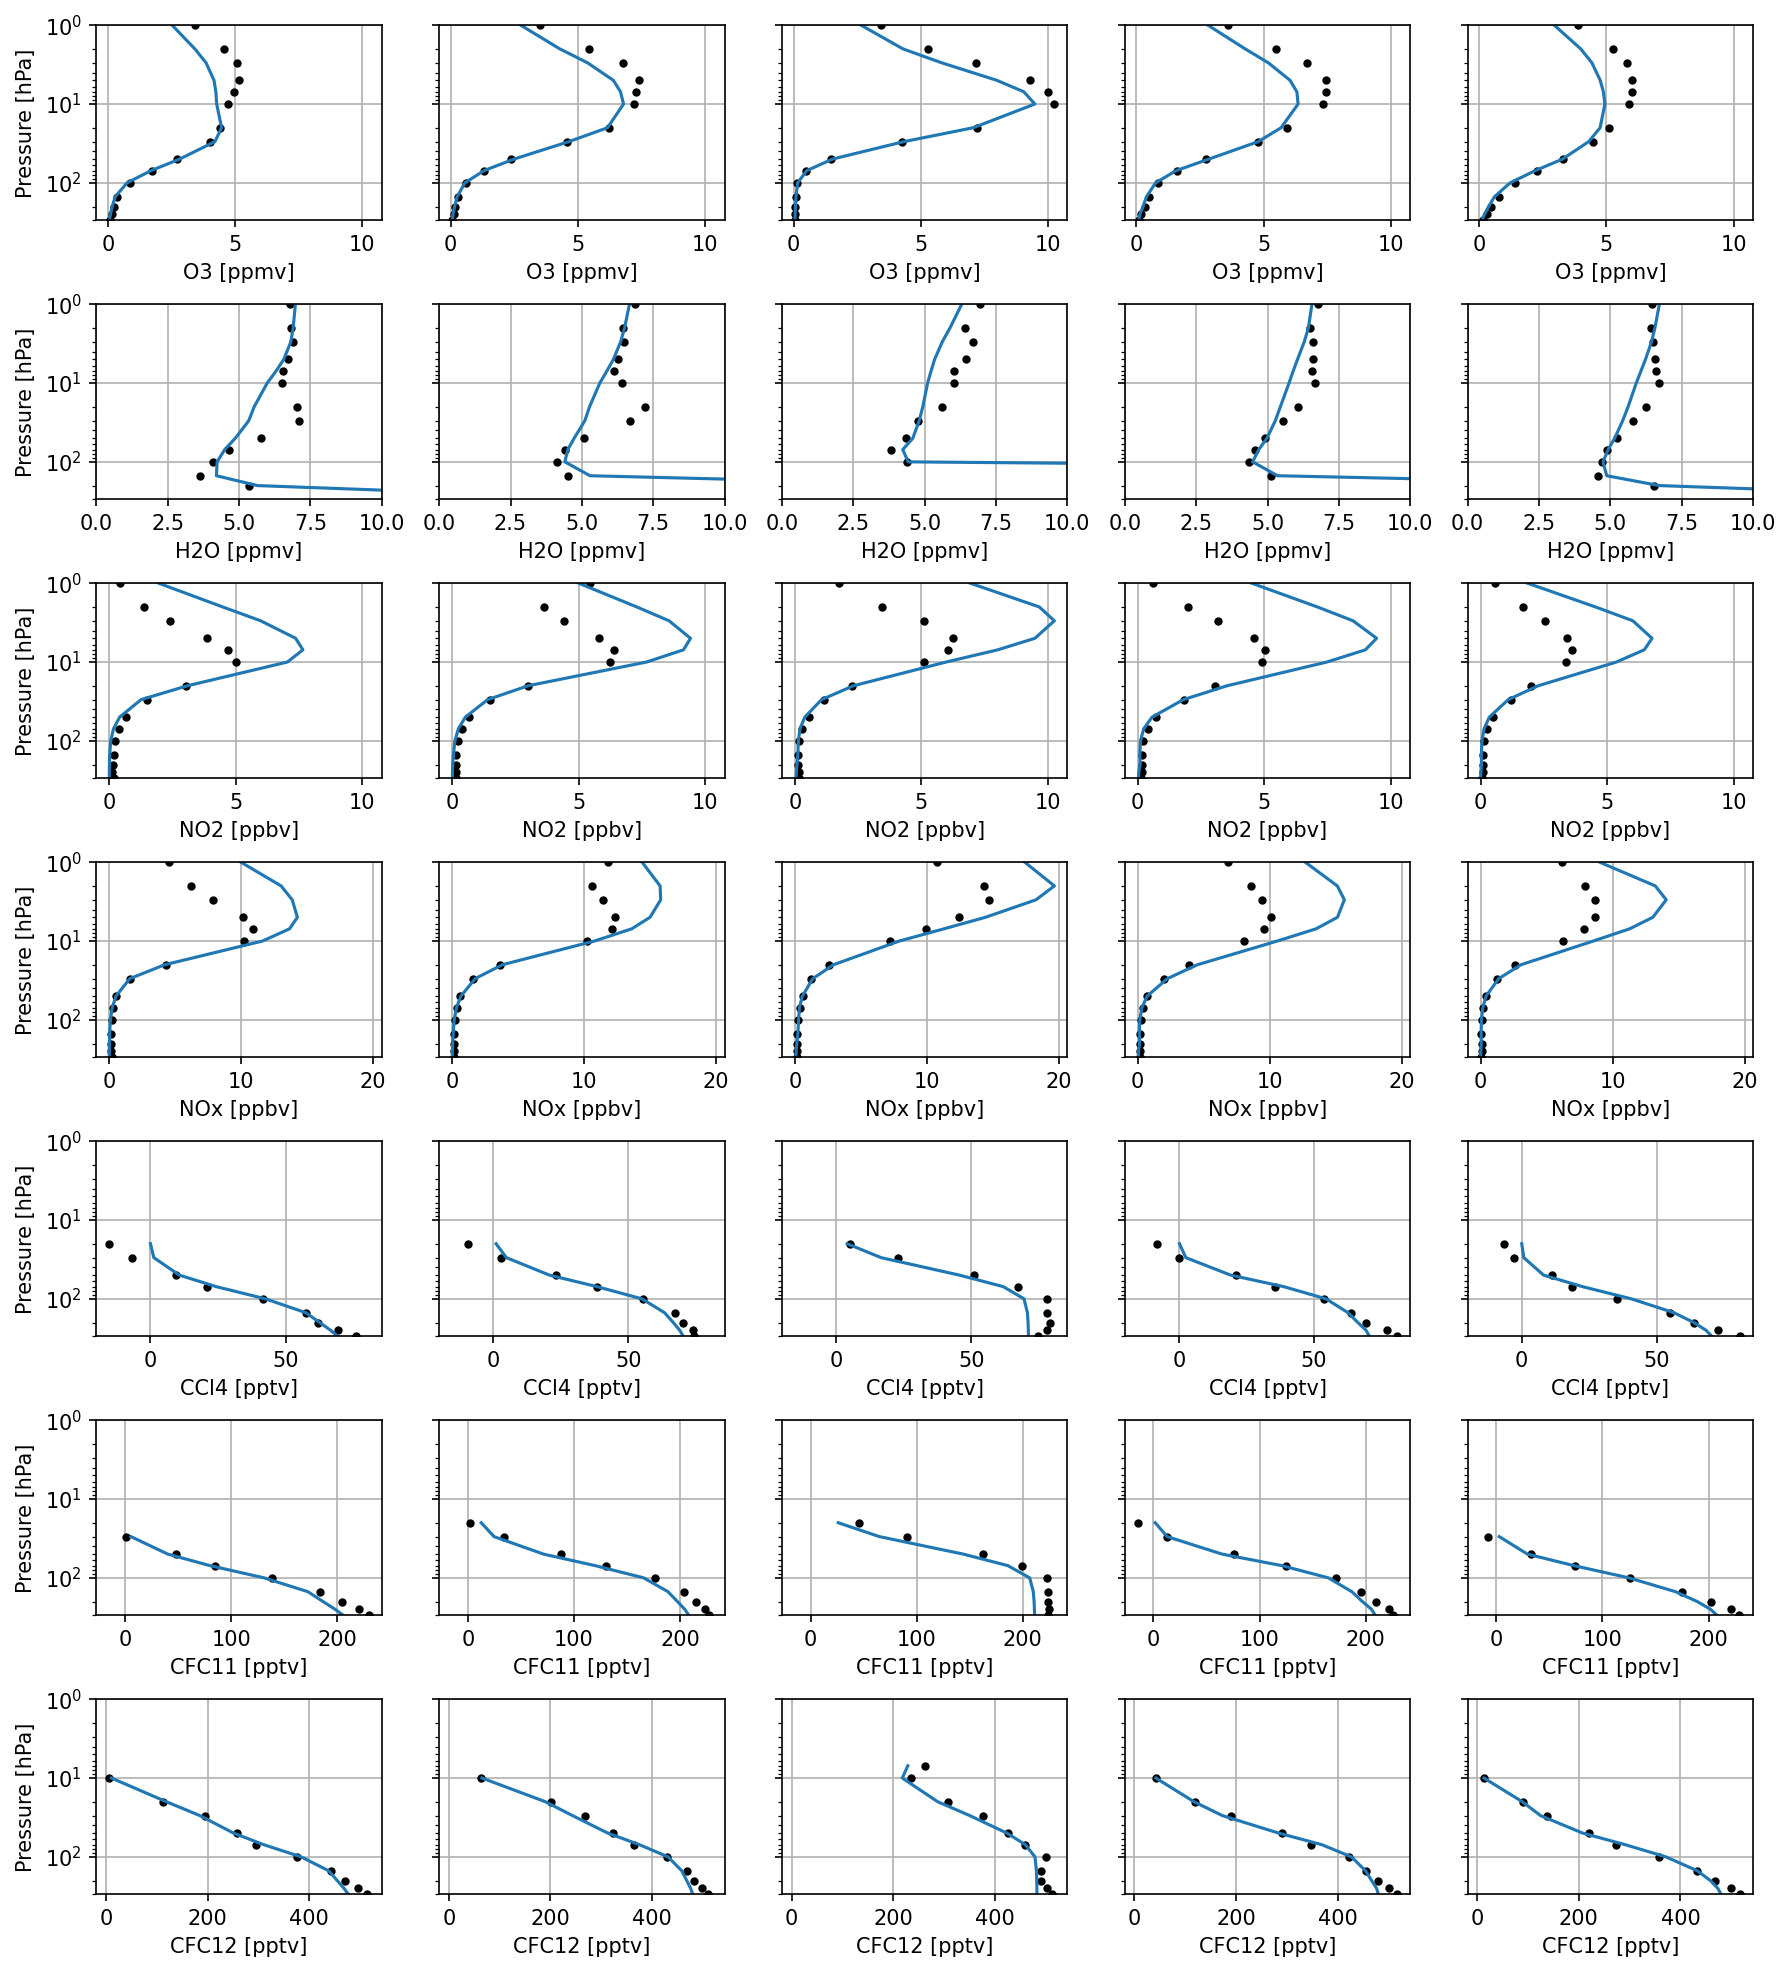
Figure 17Comparison of O3, H2O, NO2, NOx, CCl4, CFC-11 and CFC-12 from the e-suite first-day forecast (blue lines) with ACE-FTS observations (black dots) between 1 October 2022 and 27 June 2023. Five latitude bands are considered, from left to right: 90–60° S, 60–30° S, 30° S–30° N, 30–60° N and 60–90° N.
Stratospheric NO2 columns have been compared with TROPOMI retrievals; see Fig. 18. The observational NO2 stratospheric column is represented well by the e-suite in terms of absolute amounts, latitudinal variation and temporal changes. Over the largest part of the globe, column amounts agree to within 2×10¹⁵ molec cm−2, deviating by less than 10 %. The e-suite performs well in reproducing the general strong increase in stratospheric NO2 at high latitudes in the summer hemisphere.
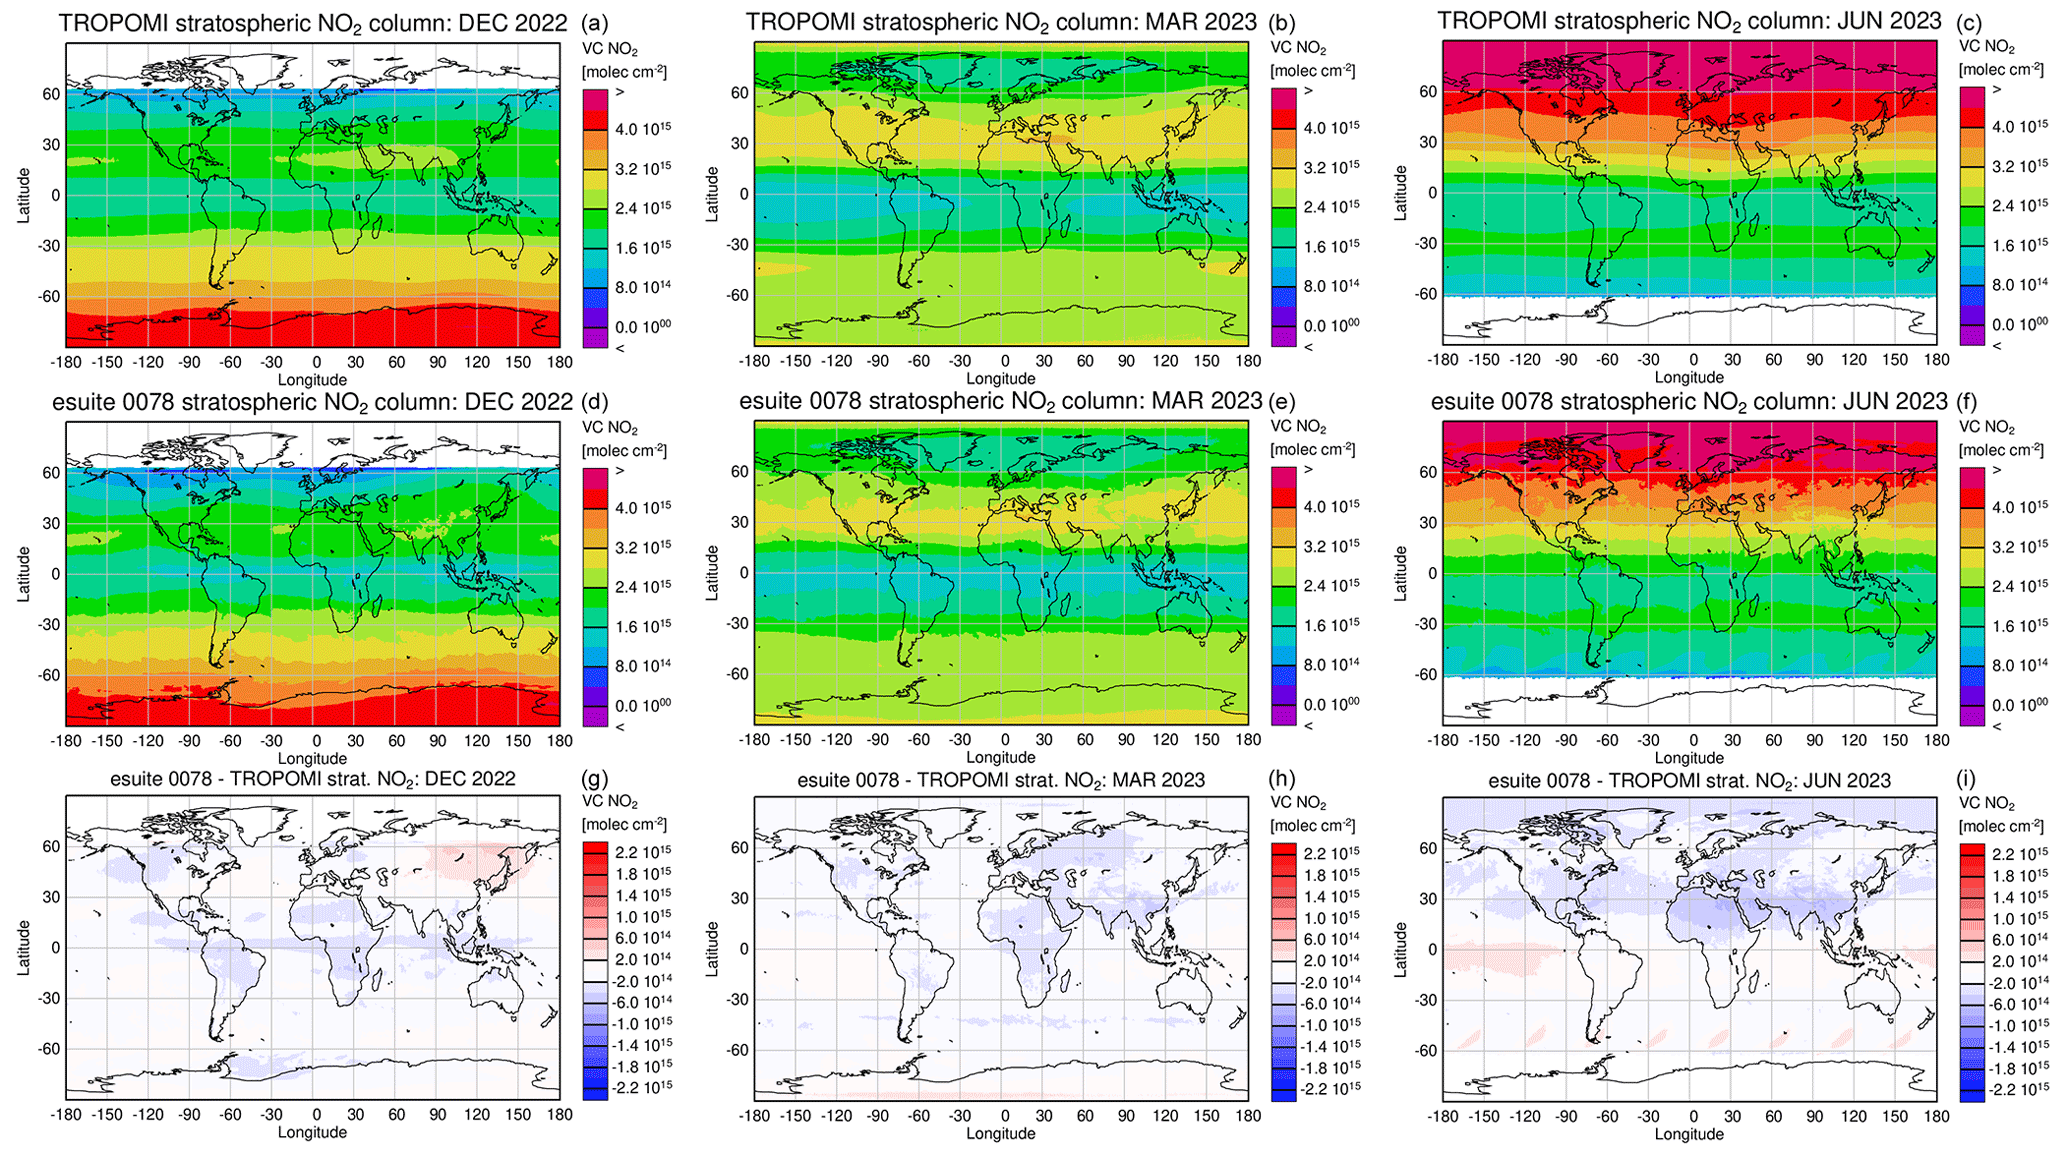
Figure 18Monthly mean NO2 stratospheric column amounts retrieved using TROPOMI observations (a, b, c) compared to the e-suite results (d, e, f). Panels (g), (h) and (i) show the differences between the e-suite and TROPOMI. Results are shown for December 2022 (a, d, g), March 2023 (b, e, h) and June 2023 (c, f, i). The STREAM-B algorithm was used to estimate the stratospheric contribution to the total retrieved column (Eskes et al., 2023a).
4.8 UV radiation
While no changes to the UV code were implemented in Cy48R1, the surface UV index (UVI) forecasts are affected by the changes in the optical depth of trace gases (most notably stratospheric ozone), aerosols and thick clouds. The net effect of these factors on the hourly forecast performance of the new model cycle was estimated using ground-based UVI measurements as the reference data at 38 stations, located in Europe, Israel, Thailand, Australia, New Zealand and the Antarctic.
Figure 19 illustrates the statistical improvement of Cy48R1 compared with Cy47R3 when evaluated against the ground-based observations in terms of MNMB, FGE and R. MNMB and FGE included all available hourly UVI forecasts, while R included only UV forecasts close to local noon in order to emphasise the importance of atmospheric composition (instead of the solar zenith angle, SZA) and to highlight the time of day when UV radiation is typically most intense and hazardous. Overall, the statistics (mean MNMB = 5 %, mean FGE = 0.30 and mean R = 0.82) indicate that CAMS UV forecasts are of good quality in Cy48R1. The mean values of R and FGE indicate no significant changes in correlation and scatter between the old and the new model cycles; however the mean MNMB increases slightly from 2 % to 6 %. This finding is supported by comparing the zonal mean of daily maximum UVI between the two model cycles, which increased by +0 % to +4 % in Cy48R1 compared to Cy47R3, with the largest increase of +2 % to +4 % occurring between 50° S and 60° N.
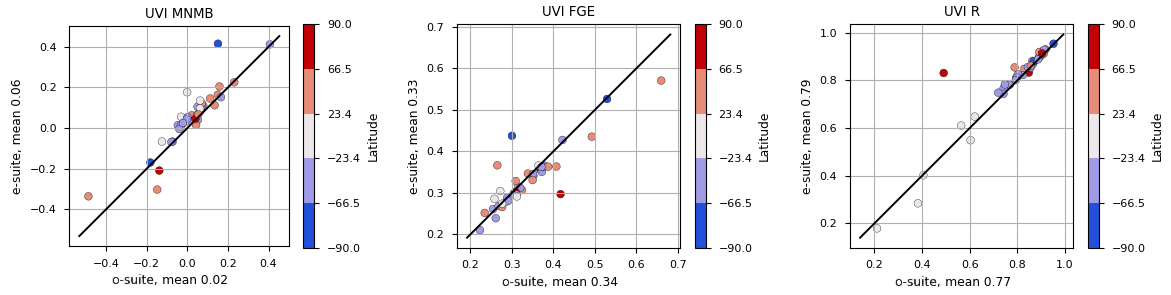
Figure 19Hourly UV index values from the CAMS e-suite and o-suite evaluated against ground-based UV measurements from 38 stations located in Europe, Israel, Thailand, Australia, New Zealand and the Antarctic. Scatterplots of MNMB, FGE and R between measurements and the o-suite (Cy47R3, x axis) and measurements and the e-suite (Cy48R1, y axis). Each dot represents a single measurement station, in either the northern latitudes (red) or the southern latitudes (blue). The time range is from 1 October 2022 to 27 June 2023.
4.9 Aerosol
Cy48R1 introduces a redistribution of aerosol optical depth per species (Fig. 20, first column). Starting from Cy48R1, the secondary organic aerosol (SOA) optical depth is now provided separately, whereas prior to this update, the SOA optical depth was included as part of the organic matter (OM) optical depth. For this report, the OM optical depth in the e-suite includes the SOA in order to ensure comparability with the OM optical depth in the o-suite. Compared to the o-suite, there is less AOD for the e-suite, particularly due to a reduction in sulfate optical depth (Fig. 20, second column). For the e-suite, there is less black carbon optical depth, particularly over central Africa. Over Southeast Asia and the Sahel, nitrate optical depth decreases by about 50 % in the e-suite compared to the o-suite. Contrarily, the sea salt and ammonium optical depth increases, while dust and organic matter changes are regionally dependent. The Ångström exponent (AE), a parameter which is indicative of the aerosol size distribution, is considerably lower globally (reduction by −0.12) in the e-suite, especially over the Middle East and Sahara, while it increased over South Africa, South America and Australia.
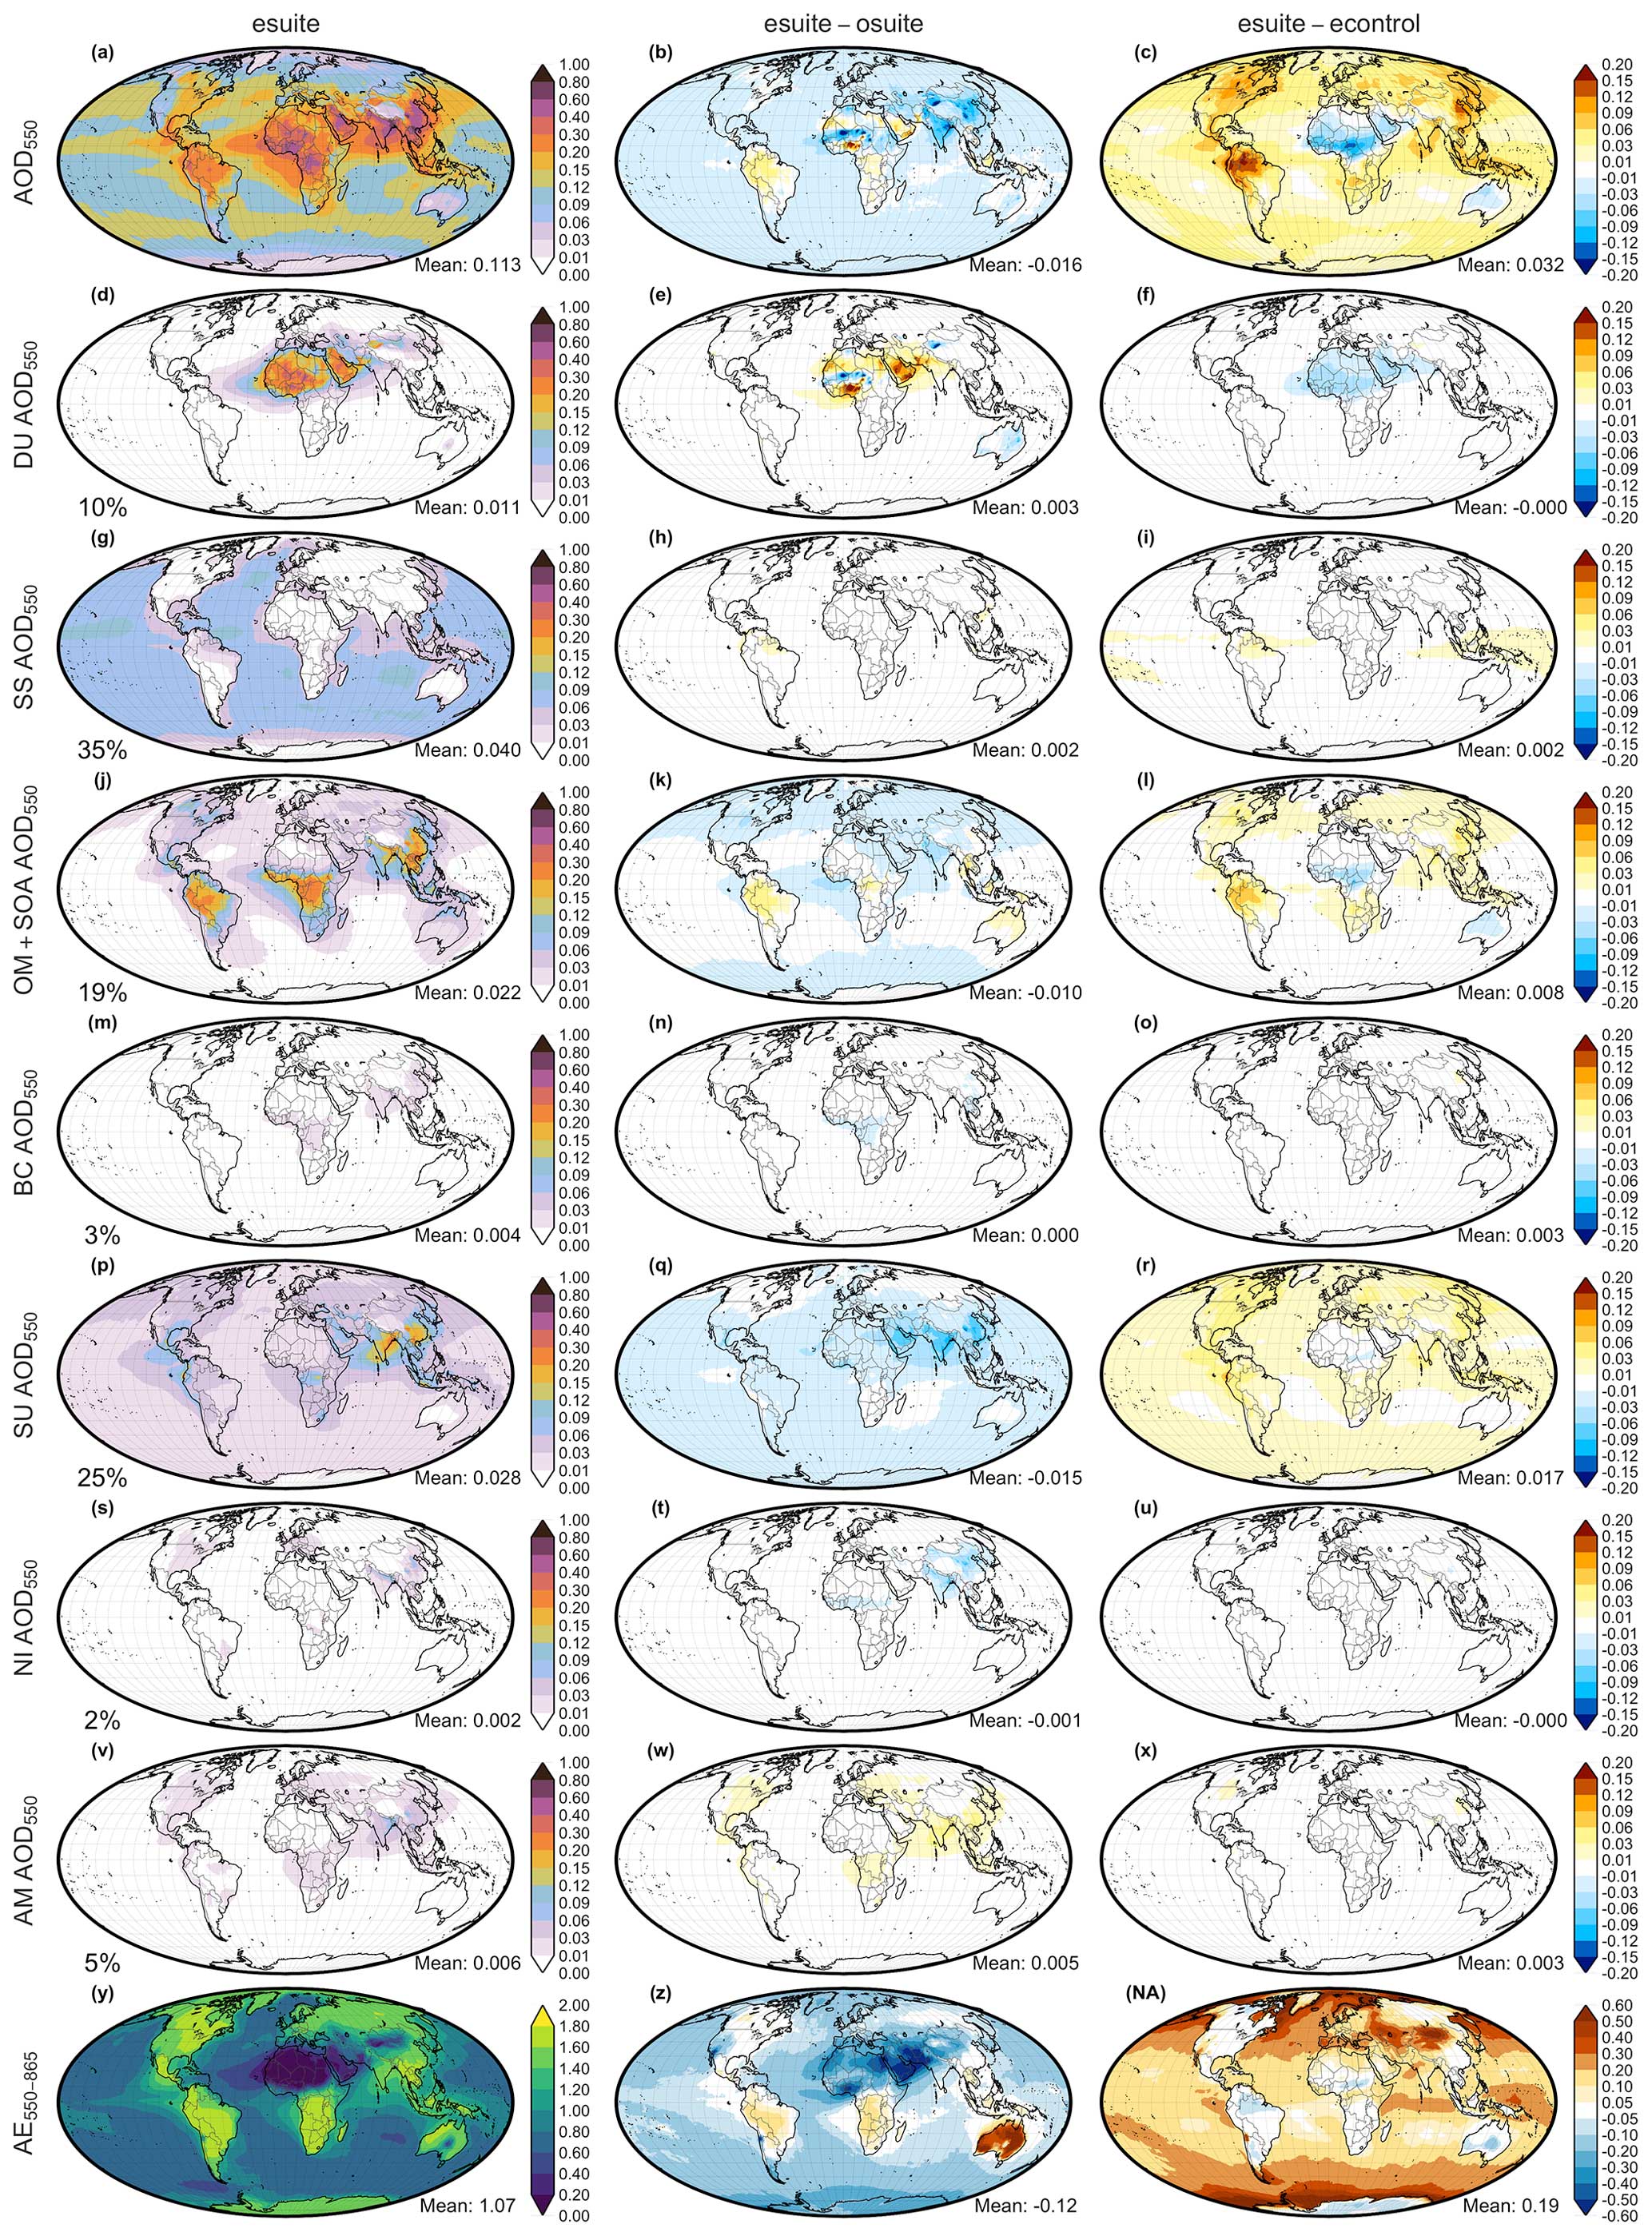
Figure 20AOD (first row), AOD for each species (second row to eighth row) and Ångström exponent (ninth row) for the e-suite (first column), differences of e-suite − o-suite (second column) and the differences of e-suite − e-control (third column) for the period 1 October 2022 to 27 June 2023. Species included are dust (DU), sea salt (SS), organic matter plus secondary organic aerosol (OM + SOA), black carbon (BC), sulfate (SU), nitrate (NI) and ammonium (AM). The percentage at the bottom-left corner of first column displays the relative contribution of each species optical depth to AOD.
These changes are related to (1) the introduction of two new secondary organic aerosol tracers (anthropogenic and biogenic) along with their respective precursor gas tracers (2) modifications to dust emissions and removal simulation that increased the global dust mass burden by a factor of 2, (3) a review of aerosol optical properties for dust and brown carbon, and (4) improvements to secondary inorganic aerosol simulation. Note that the AOD and AE mostly increase due to assimilation, except for dust (Fig. 20g, h, j).
The evaluation of daily aerosol optical depth (AOD) and the Ångström exponent (AE) against the ground-based network of AERONET version 3 Level 1.5 stations shows that e-suite overestimates less compared to the o-suite for both parameters (Figs. 21 and 22). The e-suite improves in terms of AOD MNMB globally (from +21 % in the o-suite to +7 % in the e-suite), especially over North America, Europe, East Asia and the Middle East. Over Southeast Asia and the Sahara, the MNMB performance remains almost unchanged. Notably for South Asia, a deterioration in performance (higher underestimation) is observed compared to the o-suite. The correlation (R) performance remains unchanged (approximately 0.70 in both the o-suite and the e-suite). Note that both control runs underestimate AOD (not shown).
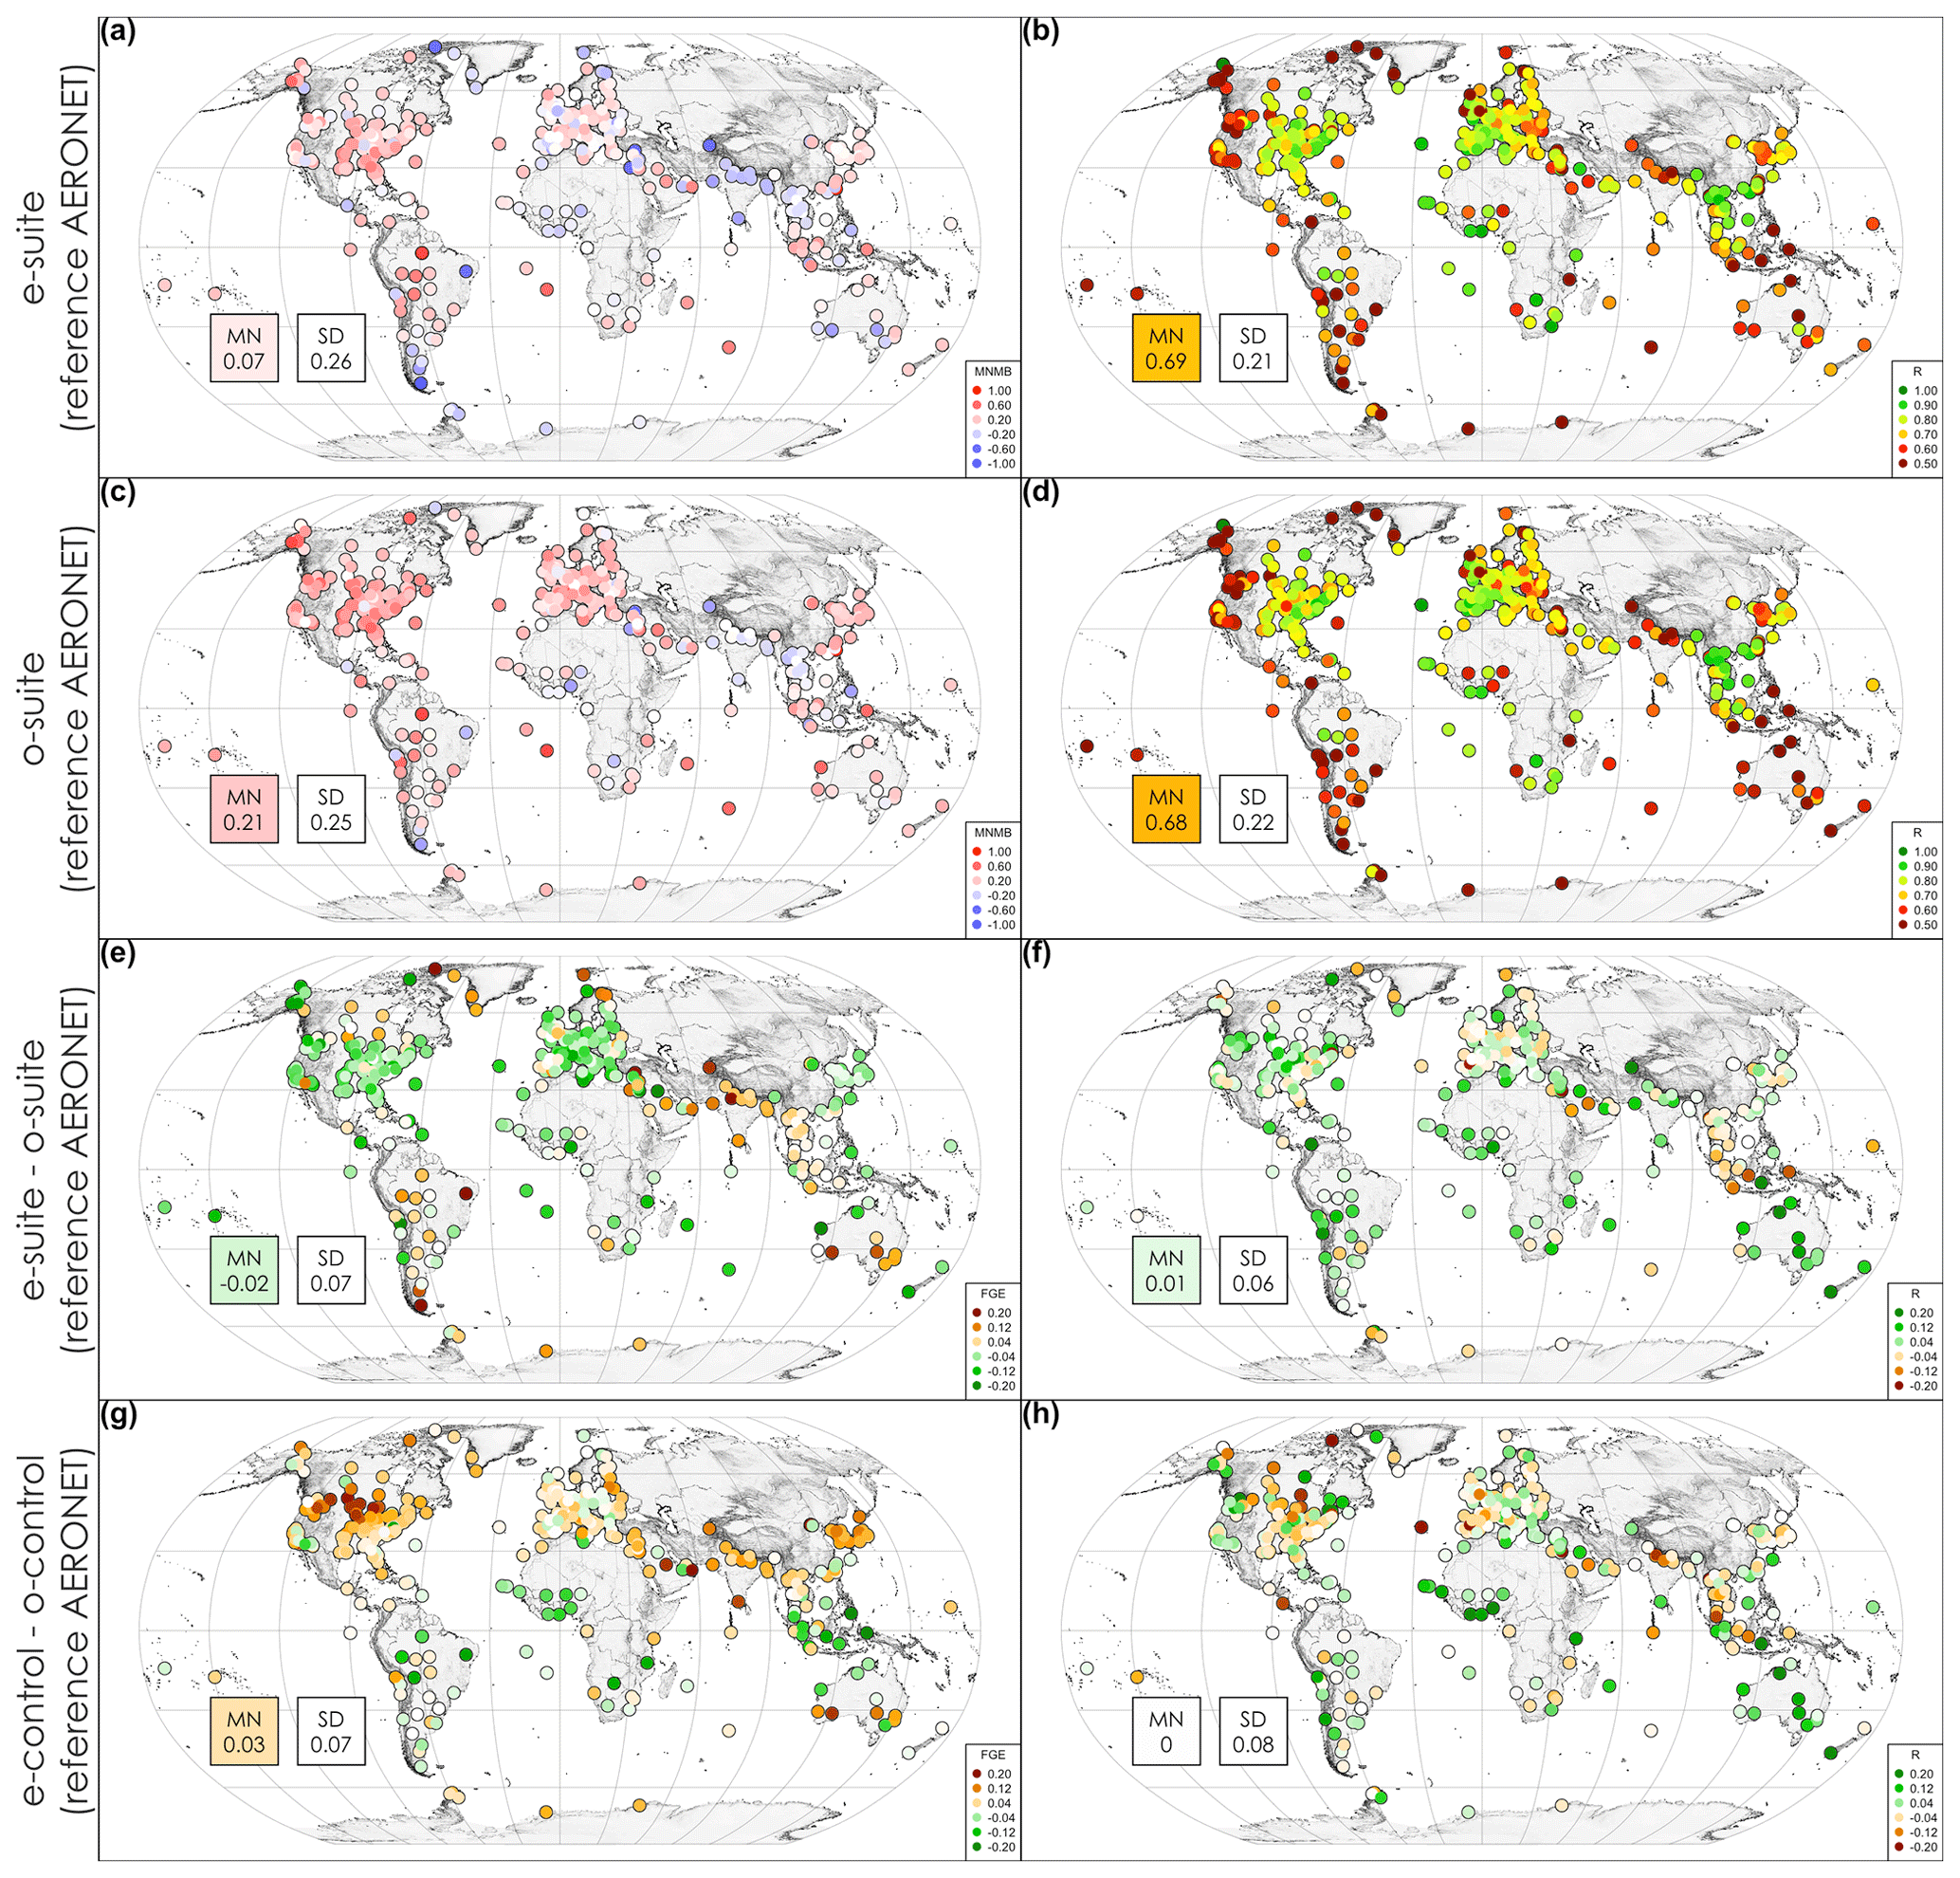
Figure 21Spatial distribution of the daily aerosol optical depth MNMB, FGE and R for the e-suite minus observations (a, b), the o-suite minus observations (c, d), the e-suite-minus-o-suite differences (e, f) and the e-control-minus-o-control differences (g, h) for the period 1 October to 27 June 2023 using AERONET v3 Level 1.5 as a reference. The mean (MN) and standard deviation (SD) for all stations are depicted for each map.
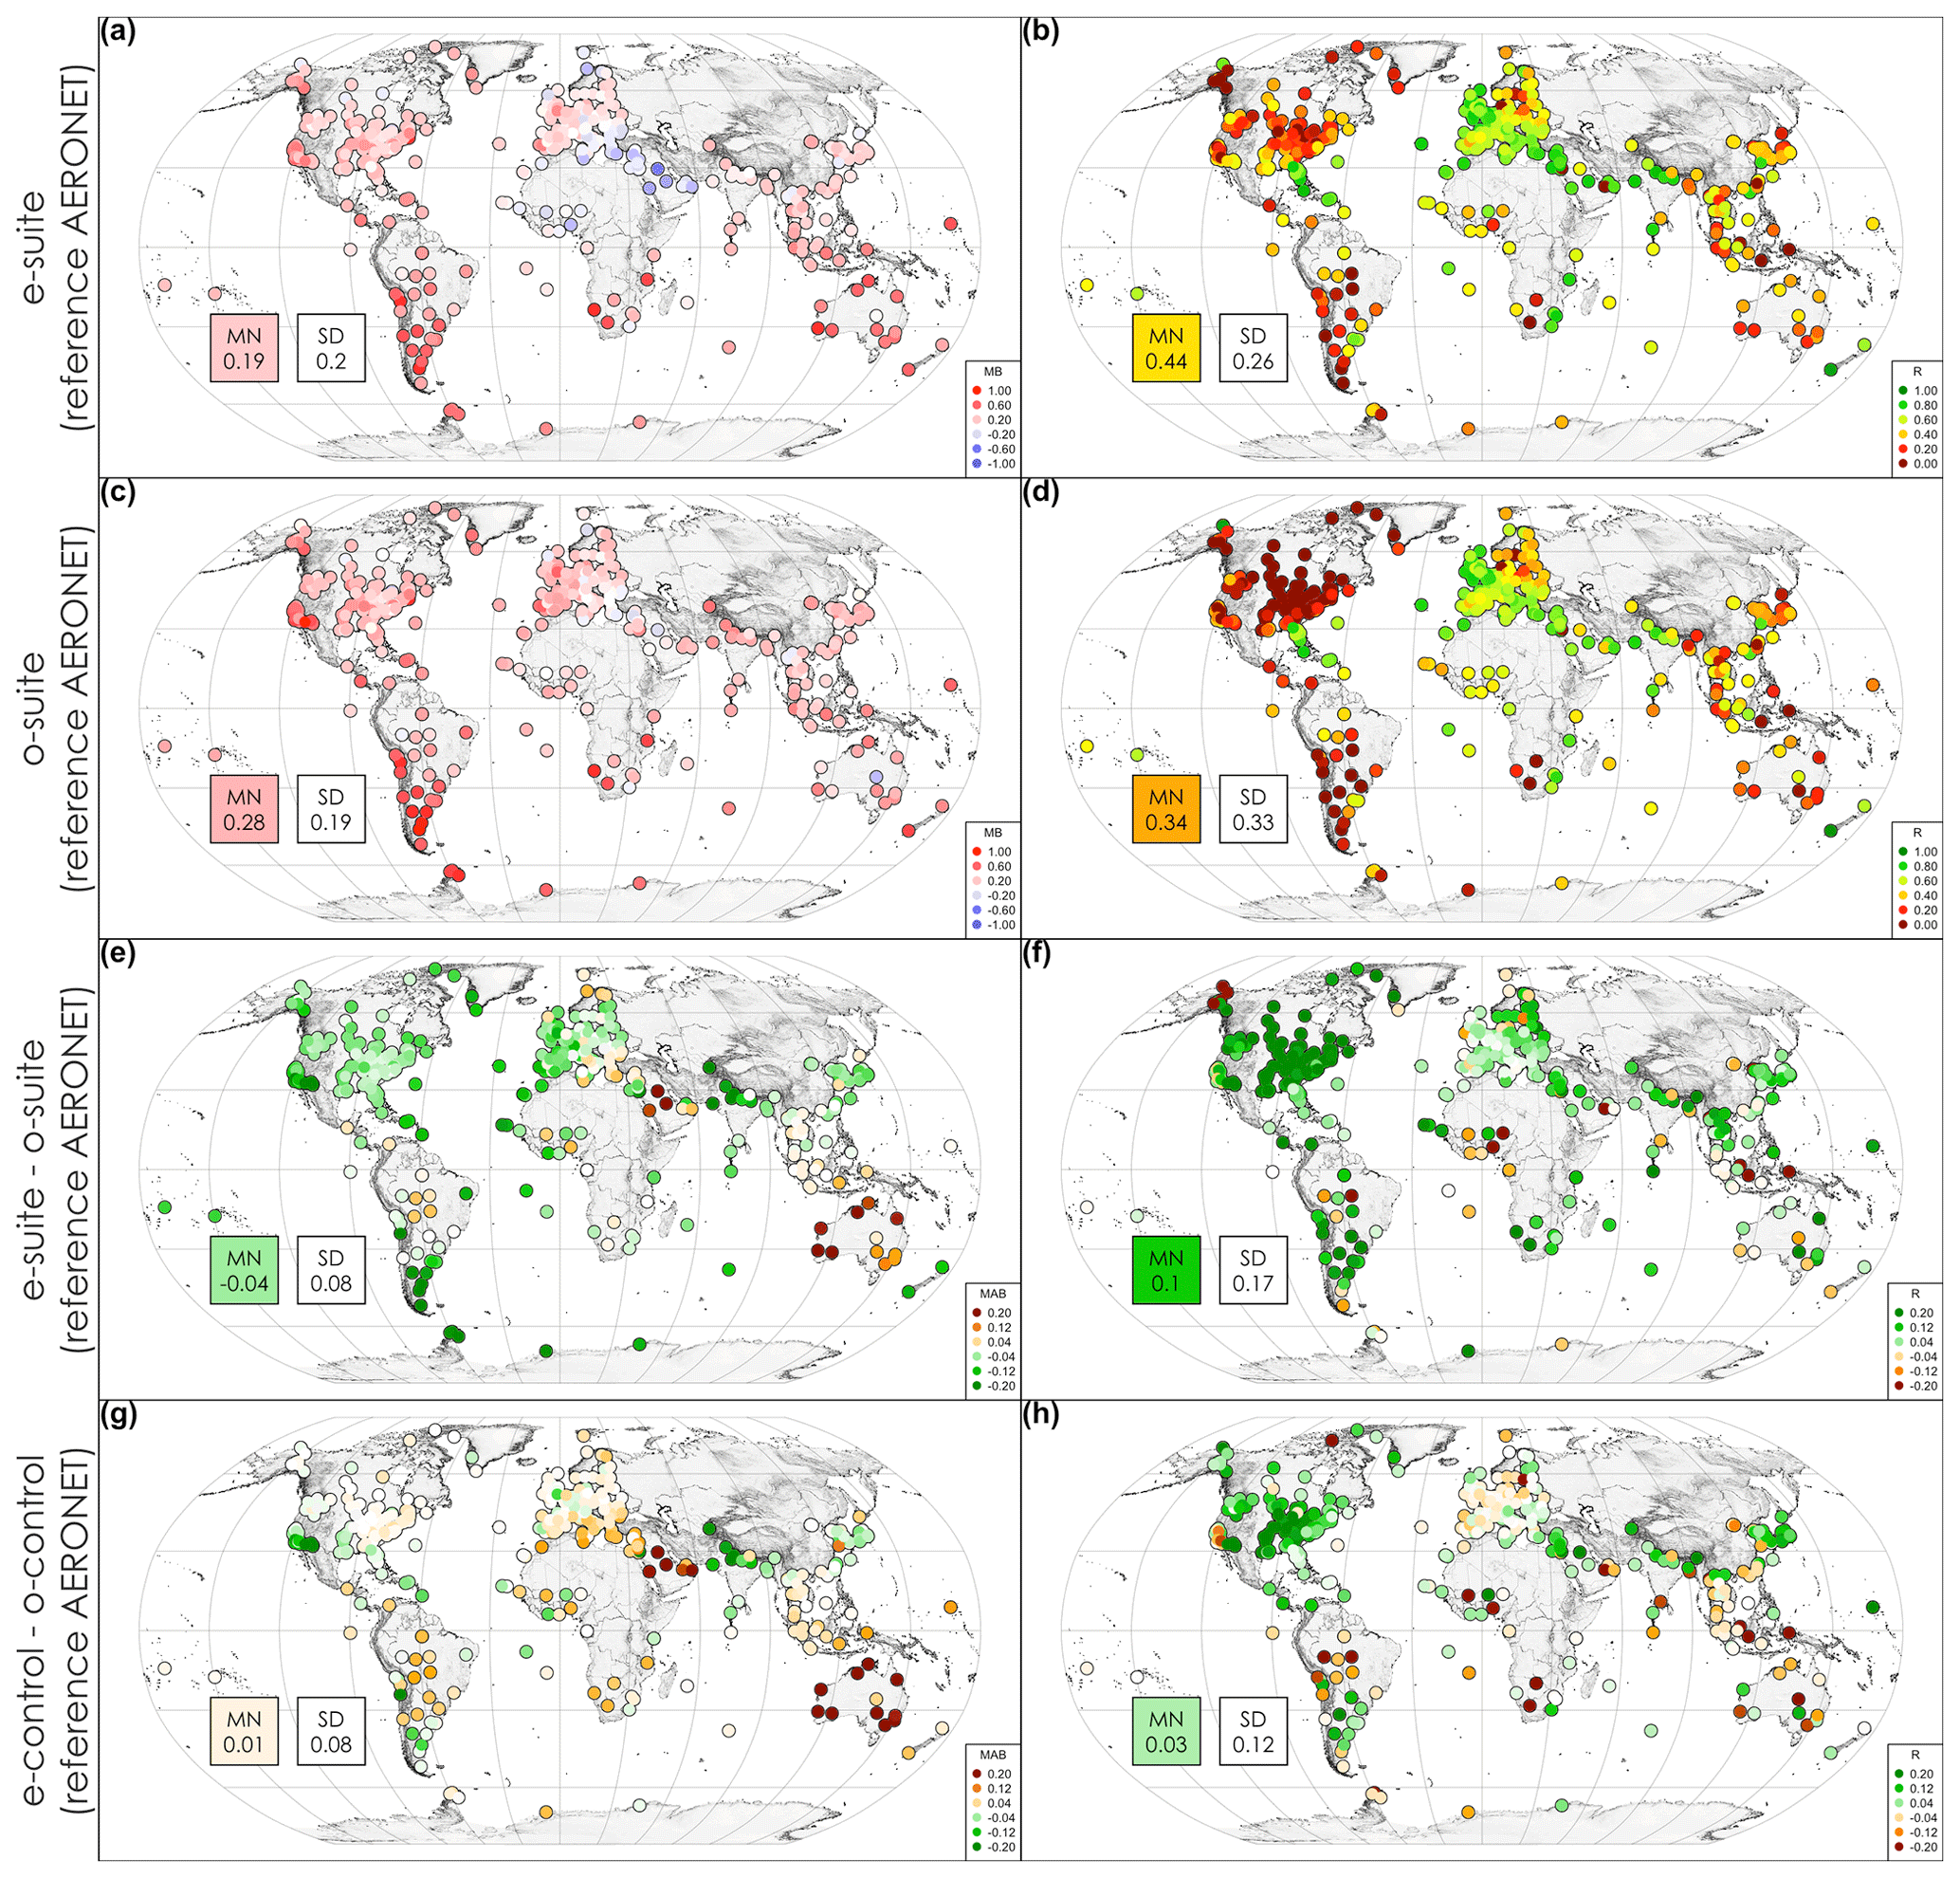
Figure 22Spatial distribution of the daily Ångström exponent MNMB, FGE and R for the e-suite minus observations (a, b), the o-suite minus observations (c, d), the e-suite-minus-o-suite differences (e, f) and the e-control-minus-o-control differences (g, h) for the period 1 October to 27 June 2023 using AERONET v3 Level 1.5 as a reference. The mean (MN) and standard deviation (SD) for all stations are depicted for each map.
The AE improves in terms of global bias (mean bias goes from +0.28 in the o-suite to +0.19 in the e-suite), with regional improvements in Europe and North America as well as East China (Fig. 22). The e-suite updated dust emissions and deposition fluxes, resulting in a coarser aerosol size distribution (smaller AE) and dust mass burden over the deserts in the e-suite control run. Results specifically related to dust changes are discussed in Sect. 4.11. The correlation (R) of AE improves globally (from 0.34 in the o-suite to 0.44 in the e-suite) and remains unchanged in Europe and East Asia, with a small improvement in South Asia, the Sahara and the Middle East and a considerable improvement over South America and North America, though R still remains below 0.5 in the latter case (MET Norway, 2024).
4.10 Particulate matter
Global daily near-real-time data of particulate matter, under 10 and 2.5 µm (PM10 and PM2.5, respectively) in diameter, from the surface observational networks AirNow (North America, U.S. Environmental Protection Agency, EPA), EEA-Airbase (Europe, European Environmental Agency, EEA) and CNEMC (China National Environmental Monitoring Centre), are used to evaluate e-suite and o-suite experiments for the period October 2022 to June 2023 (Fig. 23). Note that all stations are considered for the AirNow and CNEMC networks, including urban stations; hence CAMS may not be able to fully capture the very high PM2.5 and PM10 measured with observations at a local urban scale due to the coarse spatial resolution of the model. In this section we focus on the evaluation results for PM2.5. The results for PM10 were found to be very similar to those of PM2.5. The PM10 results are presented on the AeroVal website (MET Norway, 2024) and are discussed in Eskes et al. (2023b).
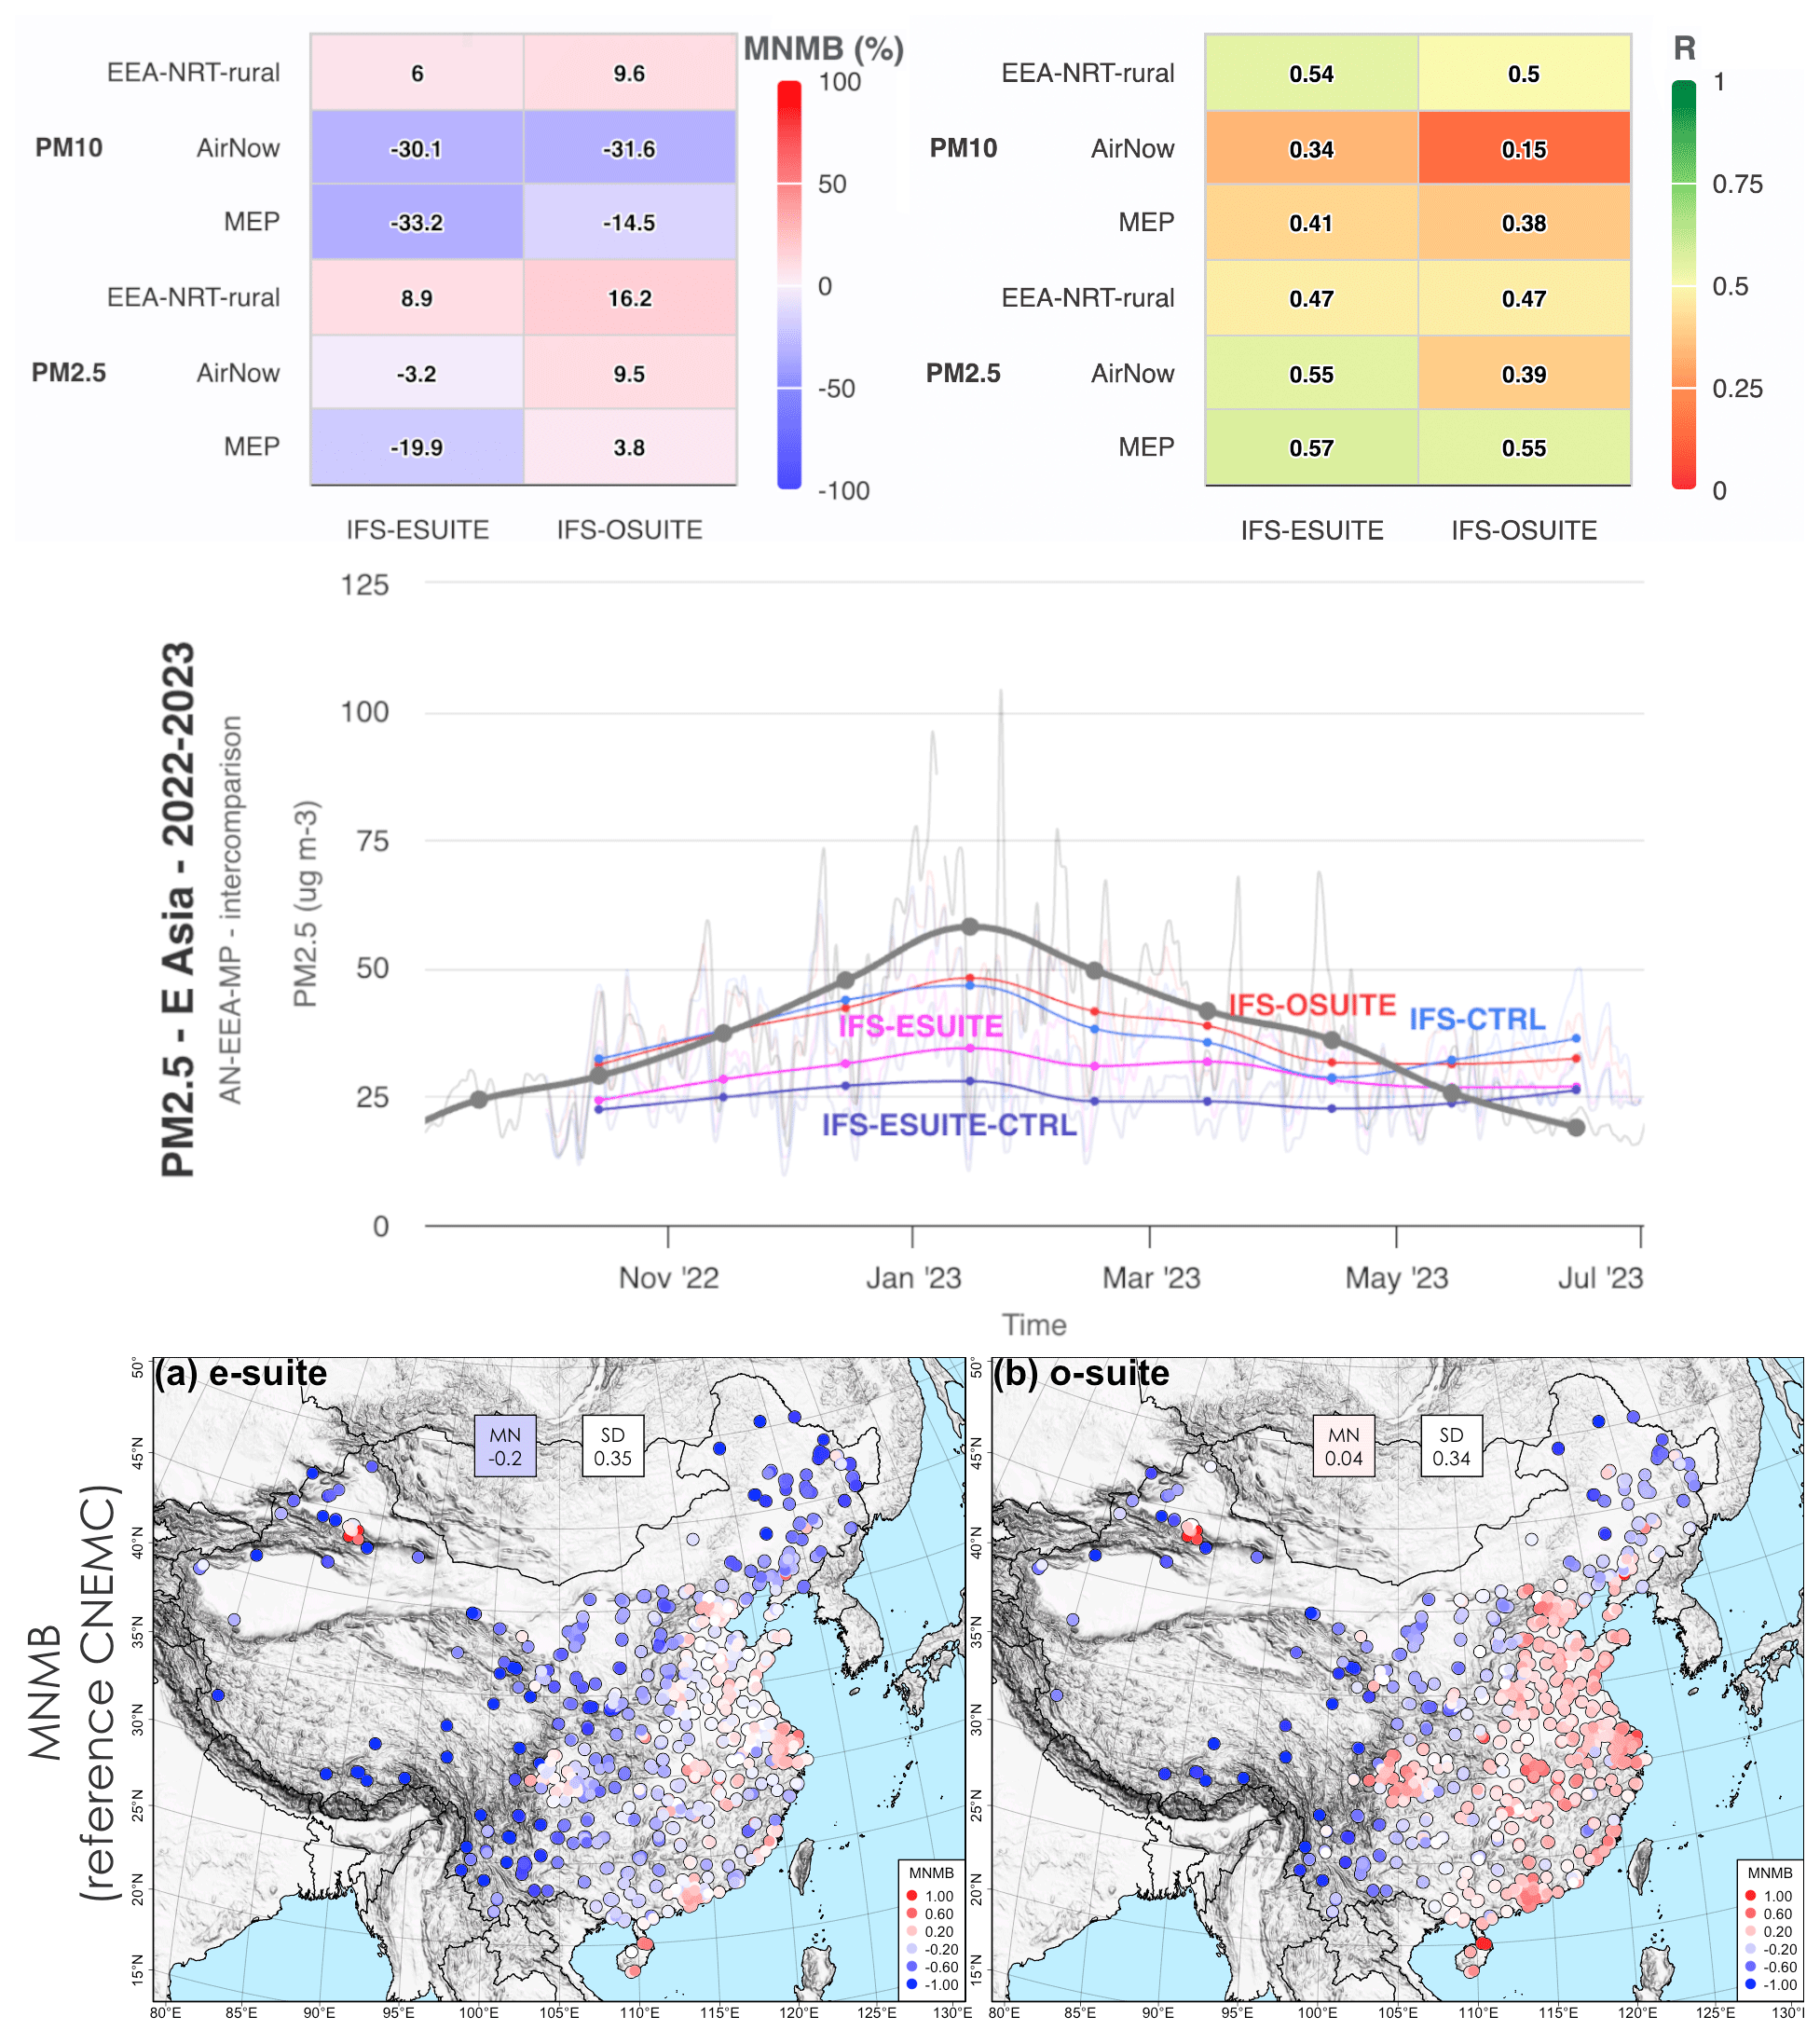
Figure 23Modified normalised mean bias of CAMS minus observations (top left) and correlation (top right) of PM2.5 and PM10 based on EEA-NRT-rural (Europe), AirNow (North America) and CNEMC (East Asia) monitoring stations. The average time series for all stations over East Asia (second row) and the MNMB maps for the (a) o-suite and (b) e-suite are also shown. The mean (MN) and standard deviation (SD) for all stations are depicted for each map.
Over North America and Europe, the e-suite improves PM2.5 in terms of MNMB (−3.2 % and 8.9 %, respectively) compared to the o-suite, which exhibited a small overestimation of about +9.5 % and +16.2 %. In contrast, over China MNMB of the e-suite (−19.9 %) exhibits a higher and negative bias when considering the performance over all available stations compared to the o-suite (+3.8 %). The spatial distribution of MNMB over China forms a clear dipole pattern. The eastern side, which encompass most of China's megacities, mostly overestimates PM2.5, while in the western part, which contains less populated, high-altitude regions, PM2.5 is underestimated. The PM2.5 of the e-suite outperforms that of the o-suite in the eastern part of the country, with MNMB lower than 25 % at most stations, while the opposite is the case for the western part, where the e-suite displays MNMB that is more negative than −50 % at most stations. The measured PM2.5 over China displays a peak in January, which is strongly underestimated by both the e-suite and the o-suite (Fig. 20). The correlation for the e-suite and o-suite remains unchanged in Europe (about 0.47), slightly improves over China (from 0.55 to 0.57) and is better in North America (from 0.39 to 0.55). The reduction in sulfates (Fig. 20), the reduction in the PM2.5 positive bias (Fig. 23) and the reduced positive bias of SO2 over China (Fig. 13) are linked to the reduced SO2 emissions in the e-suite.
4.11 Aerosol coarse
AOD coarse (AODc) values of the e-suite and o-suite were evaluated against the AERONET spectral deconvolution algorithm (SDA) version 3 Level 1.5 daily data (Fig. 24). Overall, the e-suite AODc performs better than the o-suite AODc in terms of FGE globally (from 1.09 to 0.77) and for all regions (except the Middle East and the Pacific–Australia–New Zealand). The same applies to MNMB and R (not shown). Since the AE is indicative of the aerosol size distribution, its mean absolute bias (MAB) reveals similar results.
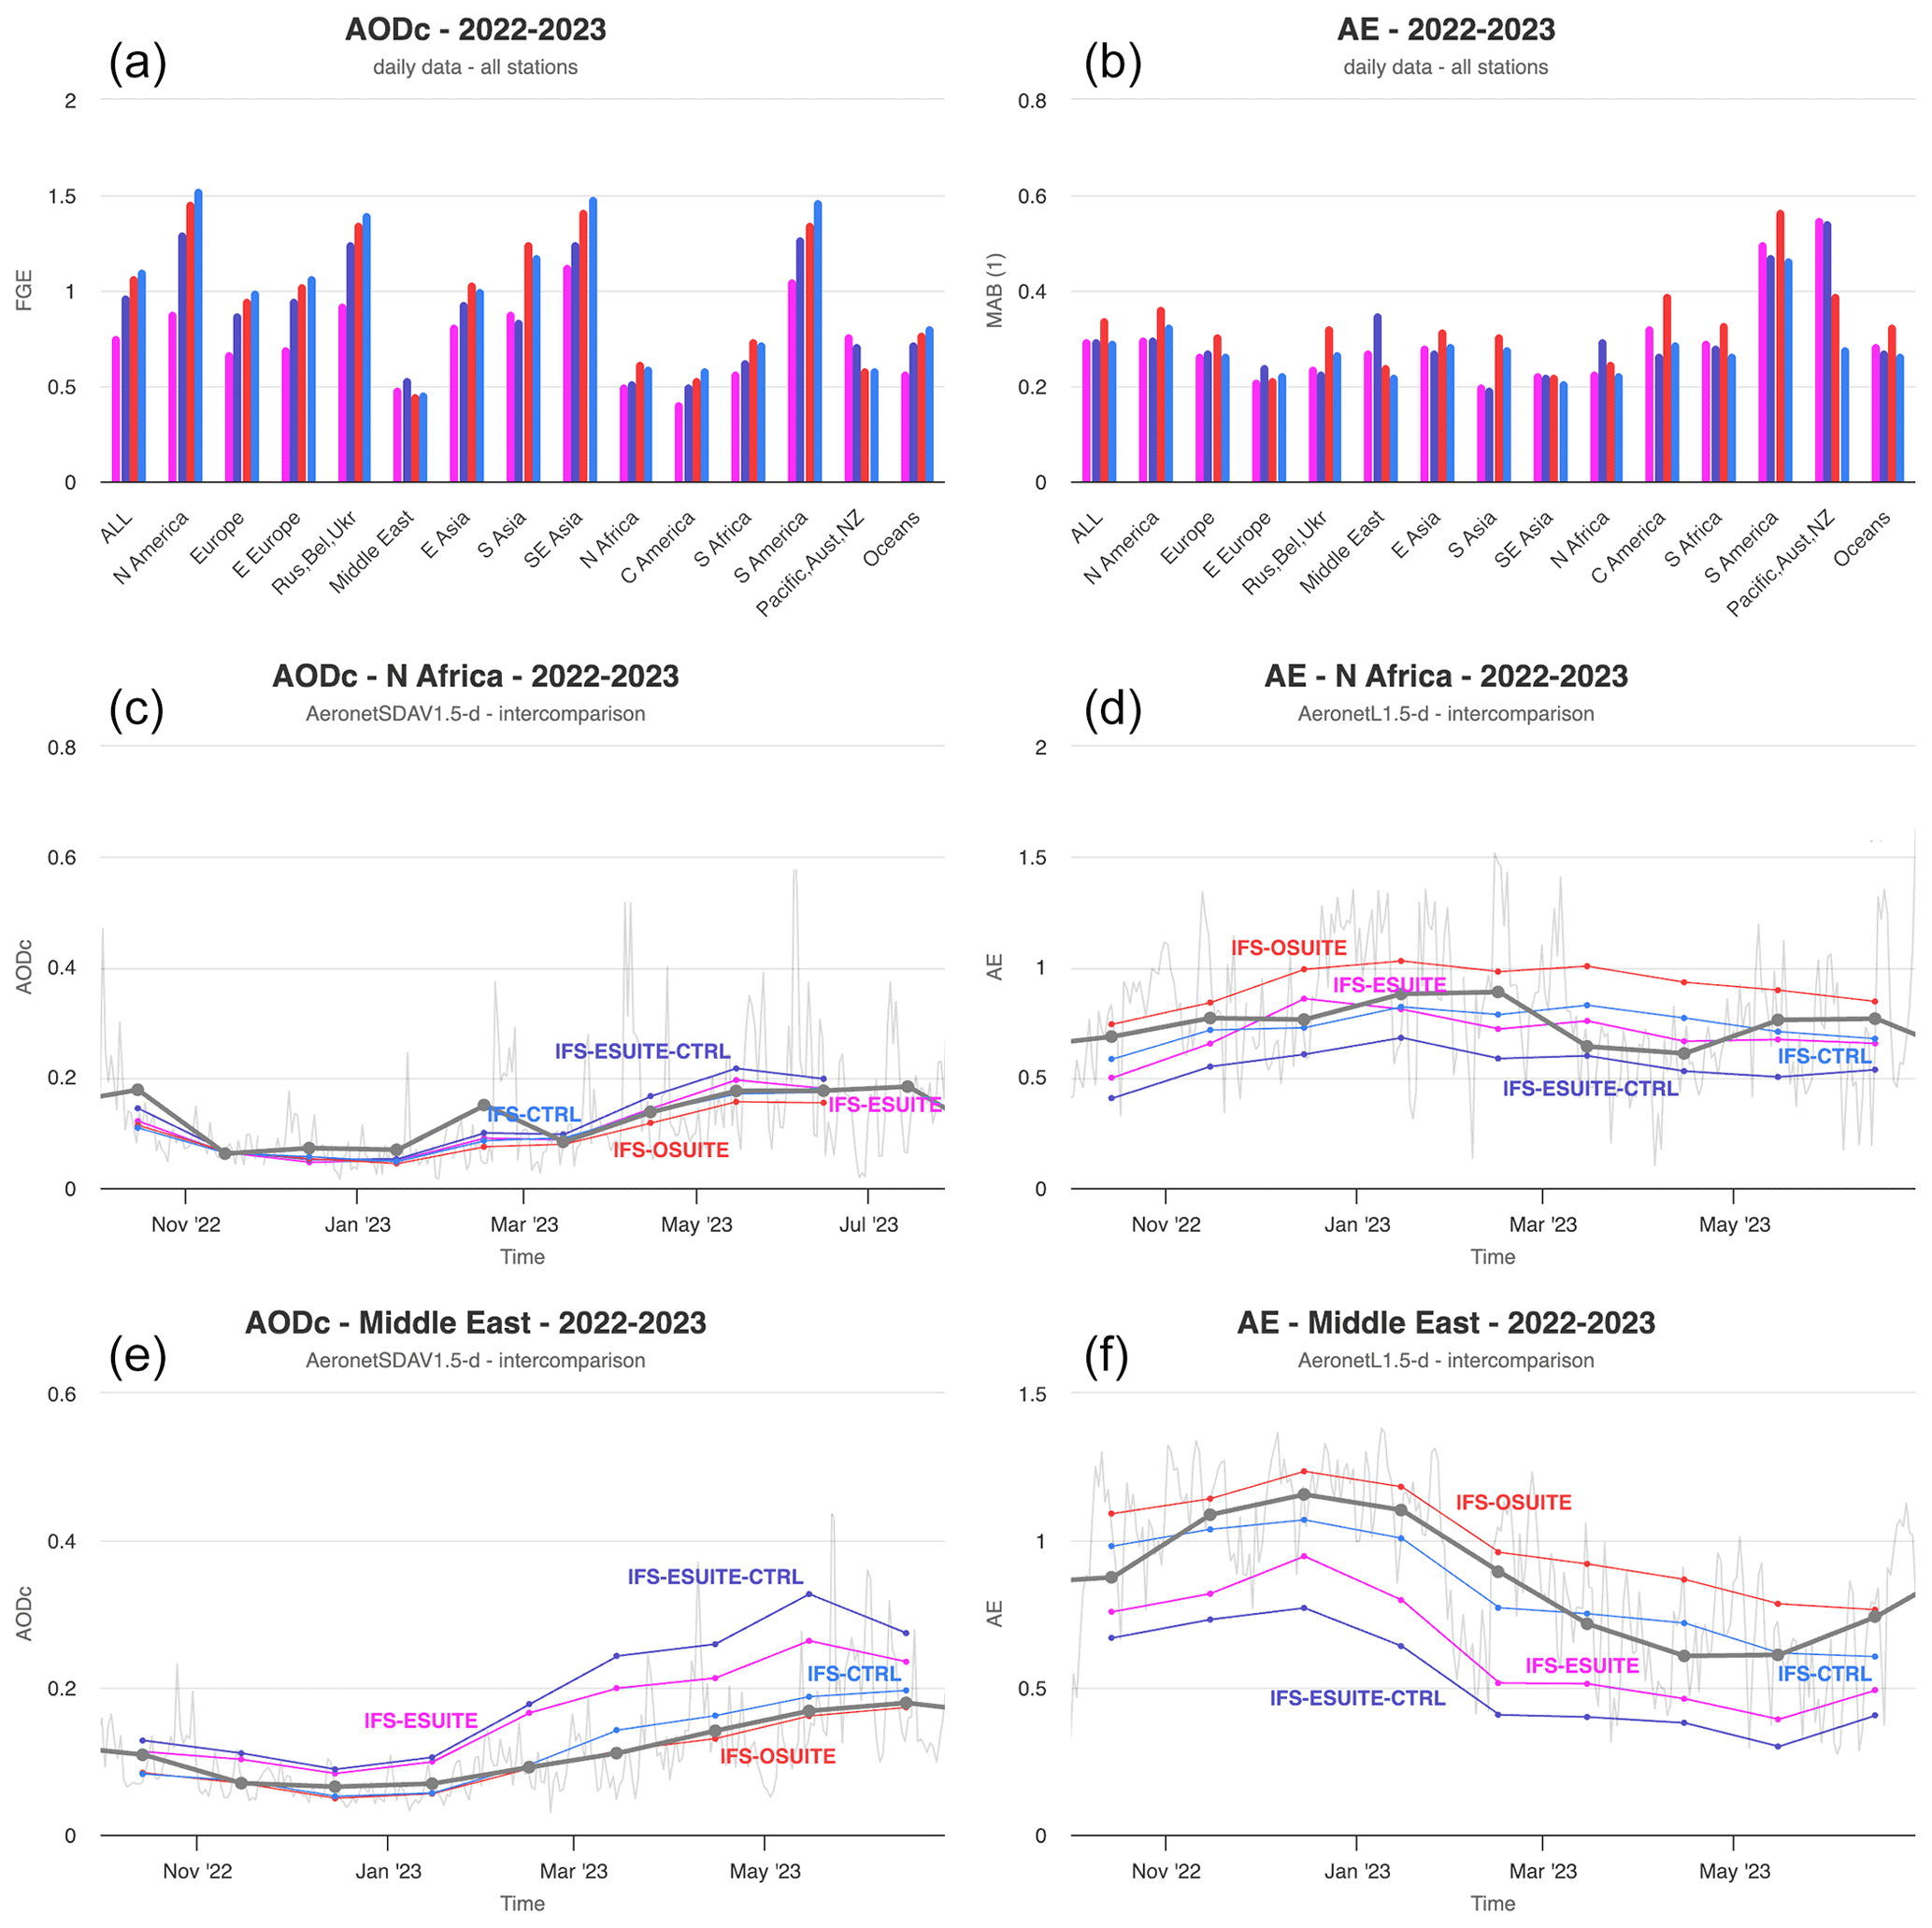
Figure 24Fractional gross error (FGE) of AOD coarse based on AERONET SDA (spectral deconvolution algorithm) version 3 Level 1.5 daily data (a, c, e) and the Ångström exponent between 440 and 870 nm mean absolute bias (MAB) based on AERONET version 3 Level 1.5 daily data (b, d, f). The monthly time series (bold lines) along with the daily time series of observations (thin lines) for northern Africa (c, d) and the Middle East (e, f) are also depicted.
Over and around arid areas, AODc is represented mainly by aerosol dust. The new dust emission increased dust optical depth (DOD) over the Middle East and increased/decreased the DOD over the northern/southern part of the Sahara (Fig. 20e). Over northern Africa, the increasing dust concentration in spring, which increases AODc and decreases AE, is represented slightly better by the e-suite compared to the o-suite. In contrast, in the Middle East the e-suite displays too high an AODc (too low an AE) compared to the observations. In particular, the simulated AODc and AE of the e-suite are better than those of the o-suite over AERONET stations that are located over the westward transport of Saharan dust in the North Atlantic (e.g. Cabo Verde), as well as over other regions that are affected less by dust (e.g. southern Europe) (MET Norway, 2024).
The upgrade of the ECMWF/CAMS global system to Cy48R1 on 27 June 2023 involved many system changes to the composition modelling, emissions and assimilation which are listed in Sect. 2.1. Cy48R1 represents a major upgrade and is the result of 2 years of model and data assimilation development. The upgrade introduces, among many other changes, a comprehensive stratospheric chemistry scheme with the addition of 63 gas species; contains important emissions updates; implements changes to the modelling of dust aerosol resulting in a redistribution of aerosol particles towards larger sizes; adds an explicit representation of secondary organic aerosol; and revisits isoprene and the chemistry of aromatics. In Cy48R1 the assimilation of TROPOMI CO and VIIRS AOD is introduced.
The validation results for 47 comparisons (measurement datasets) in total are summarised in the scorecard of Table 2, which compares the relative performance of the new Cy48R1 configuration to the previous Cy47R3 system that was operational until 27 June 2023. The judgements presented in this summary table are qualitative, based on expert judgement and the investigation of maps and scores. The presentation of one quantitative score and significance assessment performed using all datasets is, in practice, not feasible or meaningful. Each entry in the table has its own story, which is detailed in the subsections of the Results section (Sect. 4). The datasets used for the assessment are very heterogeneous. Some datasets are very sparse (e.g. IAGOS, where an extended data record is only available over Frankfurt) or cover only a limited region (e.g. surface concentrations from air quality networks), while other networks are dense, such as AERONET. Satellite data are available globally, but retrieval products for separate instruments (or the same instrument) often show significant differences, and biases and uncertainties are not easy to assess. There are strong regional and seasonal differences in the scores, reflecting differences in sources, processes or aspects like aerosol composition.
The main results for the trace gases may be summarised as follows:
-
The performance of CO has generally improved compared to all observations. The comparison against MOPITT is the exception. Previously, the assimilation system was anchored to MOPITT, while since Cy48R1 this anchor has been IASI. Furthermore, TROPOMI CO observations are now assimilated in Cy48R1. This anchoring change explains why the comparison with MOPITT is worse in the e-suite compared to the o-suite. However, the independent observations show that these changes are improvements.
-
NO2 and SO2 show improved validation results against multiple observations, both at the surface and in columns observed from space. This may be linked to the upgrade of the emissions, which more realistically describe the emission trends in recent years.
-
CAMS surface ozone and tropospheric ozone perform similarly in the e-suite and o-suite. However, ozone improvements are observed in eastern China and the USA at the surface, probably linked to the emission update and changes in the precursors like NO2.
-
Stratospheric ozone below the 10 hPa level and total column ozone have improved compared to observations, especially in the tropics. This may be linked to the inclusion of a full stratospheric chemistry scheme in Cy48R1. The bug fix in the formulation of the background covariances in Cy47R3 in December 2022 had a positive impact, especially for ozone in the tropics.
-
The comparison of a large number of trace species in the stratosphere against ACE-FTS and MLS shows realistic concentration profiles. This provides confidence in the implementation of stratospheric chemistry in IFS-COMPO.
-
The overestimation of HCHO in the tropics is more pronounced in the e-suite compared to TROPOMI. This may be related to the updated isoprene chemistry.
-
The UV evaluation shows only minor changes.
The results for the aerosols may be summarised as follows:
-
The aerosol optical depth evaluation shows improvements for most regions.
-
The Ångström exponent, which is a measure representative of the aerosol size distribution, shows some improvement on the global scale, but over the Middle East the performance deteriorates, showing too large a fraction of coarse particles.
-
Particulate matter (PM10 and PM2.5) at the surface is reduced in the e-suite, which leads to lower bias in the eastern part of China compared to the o-suite. The e-suite and o-suite perform similarly over North America and Europe.
It is important to note that the e-suite data are available for a period of about 9 months, with more emphasis on the Northern Hemisphere winter season. Therefore some results may not be fully representative of the entire year of 2023 or of other years. The assimilation of TROPOMI CO in the e-suite was switched on only at the end of April 2023, and its impact could not be fully evaluated.
In summary, 55 % of the evaluation datasets show an improved performance of Cy48R1 compared to the previous operational CAMS system, of which two improvements are indicated as major; 28 % of the comparisons are neutral; and 17 % indicate a degradation for the Cy48R1 e-suite compared to the Cy47R3 o-suite. This clearly indicates the overall success of the recent upgrade of the CAMS global system to Cy48R1.
The evaluation of the CAMS products with independent observations is continually developing. Apart from further establishing interfaces with the major observation networks, CAMS is actively acquiring and testing (surface) data from South America, Africa and Asian countries other than China. The scorecard presented in this paper provides a qualitative summary of the results. More quantitative scorecards are being developed for the quarterly o-suite validation reports; see Tsikerdekis et al. (2023).
The next upgrade of CAMS to Cy49R1 is planned for quarter 4 of 2024.
Access to the CAMS daily forecasts and analyses is provided by the CAMS Atmosphere Data Store (ADS) at https://ads.atmosphere.copernicus.eu/cdsapp#!/dataset/cams-global-atmospheric-composition-forecasts?tab=overview (ECMWF-ADS, 2024). The IFS forecasting and reanalysis system is not for public use as the ECMWF member states are the proprietary owners. The resulting datasets are however freely available from the ADS.
An interactive verification interface for the Cy48R1 e-suite is provided on the AeroVal server of MET Norway: https://aeroval.met.no/pages/evaluation/?project=cams2-82&experiment=IFS-ESUITE-Cy48R1 (MET Norway, 2024; https://doi.org/10.5281/zenodo.13270713, Norwegian Meteorological Institute – AeroTools, 2024).
The GAW ozone data are available at https://ebas-data.nilu.no/ (last access: 14 August 2024), and the carbon monoxide GAW data are available via the data hub at https://gaw.kishou.go.jp/ (last access: 14 August 2024) (WMO, 2010, 2013).
The ESRL-GML air quality data are available via the data hub at https://gml.noaa.gov/aftp/data/ozwv/SurfaceOzone/ (Global Monitoring Laboratory, 2024; Oltmans and Levy, 1994; https://doi.org/10.7289/V57P8WBF, McClure-Begley et al., 2014).
The AirNow air quality data are available via https://aqs.epa.gov/aqsweb/airdata/download_files.html#Raw (U.S. EPA, 2024).
The CNEMC air quality data are available via the data hub at https://quotsoft.net/air/ (CNEMC, 2024; Bai et al., 2020).
The EEA-Airbase air quality data are available via the data hub at https://aqportal.discomap.eea.europa.eu (EEA, 2024).
The AERONET AOD and SDA data version 3 level 1.5 are available via the following NASA website: https://aeronet.gsfc.nasa.gov/new_web/download_all_v3_aod.html (NASA-AERONET, 2024).
The FTIR datasets are provided in the public NDACC repository (https://www-air.larc.nasa.gov/missions/ndacc/data.html, NDACC, 2024) and the RD NDACC repository (https://www-air.larc.nasa.gov/missions/ndacc/data.html?RapidDelivery=rd-list, NDACC-RD, 2024).
The ozonesonde datasets are provided in the EVDC repository (https://evdc.esa.int; ESA, 2015).
ACE-FTS data can be accessed at the following web portal: https://databace.scisat.ca/level2/ace_v5.2/display_data.php (login required; ACE/SCISAT, 2024). First-time data users can register at https://databace.scisat.ca/l2signup.php (last access: 19 August 2024) (Boone et al., 2023).
SAGE III-ISS v5.3 data are available at https://doi.org/10.5067/ISS/SAGEIII/SOLAR_HDF5_L2-V5.3 (NASA/LARC/SD/ASDC, 2017; Wang et al., 2020).
EOS Aura MLS v5.0 data are available at https://doi.org/10.5067/Aura/MLS/DATA2516 (Schwartz et al., 2020; Livesey et al., 2022).
NASA OMPS LP v2.6 data are available at https://omps.gesdisc.eosdis.nasa.gov/data/SNPP_OMPS_Level2/OMPS_NPP_LP_L2_O3_DAILY.2.6 (NASA/OMPS/NPP/LP, 2024; Kramarova et al., 2018).
The IAGOS NRT observational data are available via the IAGOS Data Portal, https://doi.org/10.25326/704 (Boulanger et al., 2018).
The MOPITT v8 (https://doi.org/10.5067/TERRA/MOPITT/MOP02T_L2.008, NASA/LARC/SD/ASDC, 2000) data are available via the NASA data hub at https://search.earthdata.nasa.gov/ (last access: 14 August 2024).
The IASI CO data are available from https://iasi.aeris-data.fr/catalog (IASI/Metop, 2024; Hurtmans et al., 2012).
The Sentinel-5P TROPOMI IUP Bremen scientific NO2 product data (Lange et al., 2023) are available upon request. Please contact Andreas Richter (richter@iup.physik.uni-bremen.de) in case of interest.
European UV Database (EUVDB) spectral UV data can be accessed after registering with the service http://uvdb.fmi.fi/uvdb/index.html (EUVDB, 2024).
National Institute of Water and Atmospheric Research (NIWA) CliFlo UV index data can be accessed after subscribing at https://cliflo.niwa.co.nz/ (CliFlo, 2024).
The supplement related to this article is available online at: https://doi.org/10.5194/acp-24-9475-2024-supplement.
HE and AT initiated the paper and wrote most of the text. AB, YB, LB, QE, JG, LI, JK, BL, AM, MP, AR, AS, MS, VT, TW and CZ performed the comparisons and interpretation of the CAMS analysis and forecast results in relation to independent observations. JF, AI, SR, VH, SC, SG, MA, ZK, MA, MP, RE and VHP were involved in the development of the CAMS IFS-COMPO model and data assimilation system. IB and IP were involved in formulating and reviewing the conclusions.
At least one of the (co-)authors is a member of the editorial board of Atmospheric Chemistry and Physics. The peer-review process was guided by an independent editor, and the authors also have no other competing interests to declare.
The study presented in this paper started from the CAMS project document which contains a first evaluation of the Cy48R1 upgrade (Eskes et al., 2023b). In our paper we are presenting new results and figures for an extended period. We note that part of the descriptive text in this paper will resemble text in the CAMS report, available from the CAMS website, written by the same authors.
Publisher's note: Copernicus Publications remains neutral with regard to jurisdictional claims made in the text, published maps, institutional affiliations, or any other geographical representation in this paper. While Copernicus Publications makes every effort to include appropriate place names, the final responsibility lies with the authors.
We wish to acknowledge the provision of NRT World Meteorological Organization Global Atmosphere Watch (WMO-GAW) observational data provided to us by the Deutscher Wetterdienst (DWD).
We are grateful to the numerous operators of AERONET and to the central data processing facility at the NASA Goddard Space Flight Center for providing the NRT sun photometer data, especially Ilya Slutker and Brent Holben for sending the data.
We wish to acknowledge the provision of ozonesonde data by the World Ozone and Ultraviolet Radiation Data Centre established at Environment and Climate Change Canada (ECCC) in Toronto (http://woudc.org, last access: 7 June 2024), by the Data Host Facility of the Network for the Detection of Atmospheric Composition Change established at NOAA (http://ndacc.org, last access: 7 June 2024), by the Norwegian Institute for Air Research, by the National Aeronautics and Space Administration (NASA), and by the European Validation Data Centre (EVDC, https://evdc.esa.int, last access: 7 June 2024).
FTIR, microwave radiometer (MWR), lidar, Dobson, UV–VIS DOAS and sonde data used in this publication were obtained from the Network for the Detection of Atmospheric Composition Change (NDACC) and are available through the NDACC website: https://ndacc.larc.nasa.gov/ (last access: 7 June 2024).
The authors acknowledge the NOAA Earth System Research Laboratories (ESRL) Global Monitoring Laboratory (GML) for the provision of ground-based ozone concentrations.
The MOPITT CO data were obtained from the NASA Langley Research Center ASDC. We acknowledge the LATMOS IASI group for providing IASI CO data.
Sentinel-5 Precursor is a European Space Agency (ESA) mission on behalf of the European Commission (EC). The TROPOMI payload is a joint development by ESA and the Netherlands Space Office (NSO). The Sentinel-5 Precursor ground segment development has been funded by ESA with national contributions from the Netherlands, Germany and Belgium. This work contains modified Copernicus Sentinel-5P TROPOMI data (2018–2023). Sentinel-5P lv1 radiances and NO2 operational data were provided by Copernicus EU.
The authors acknowledge Environment and Climate Change Canada for the provision of Alert ozone data and Sara Crepinsek, NOAA, for the provision of Tiksi ozone data. Surface ozone data from the Zeppelin Mountain, Svalbard, are from https://luftkvalitet.miljodirektoratet.no (last access: 7 June 2024). Surface ozone data from the Villum Research Station, Station Nord (VRS), were financially supported by “The Danish Environmental Protection Agency” with means from the MIKA/DANCEA funds for Environmental Support to the Arctic Region. The Villum Foundation is acknowledged for the large grant that made it possible to build VRS in northern Greenland.
We thank the several institutes, their experts and their partners for providing us with UV index and spectral UV data from their ground-based observation stations: the Australian Radiation Protection and Nuclear Safety Agency (ARPANSA, Australia); the Department for Environment, Food & Rural Affairs (DEFRA, UK); the Finnish Meteorological Institute (FMI, Finland); the Israel Meteorological Service (IMS, Israel); the Laboratory of Atmospheric Physics of the Aristotle University of Thessaloniki (Greece); the National Institute of Water and Atmospheric Research (NIWA, New Zealand); and Silpakorn University (Thailand).
We acknowledge the National Aeronautics and Space Administration (NASA), USA, for providing the OMPS limb sounder data (http://npp.gsfc.nasa.gov/omps.html, last access: 7 June 2024), the SAGE III-ISS ozone data (https://eosweb.larc.nasa.gov/project/sageiii-iss/sageiii-iss_table, last access: 7 June 2024) and the Aura MLS offline data (http://mls.jpl.nasa.gov/index-eos-mls.php, last access: 7 June 2024).
We thank the Canadian Space Agency and ACE science team for providing Level 2 data retrieved from ACE-FTS on the Canadian satellite SCISAT-1.
The European Environment Information and Observation Network (Eionet) Air Quality Portal provides details relevant to the reporting of air quality information from EU member states and other EEA member and co-operating countries. This information is submitted according to directives 2004/107/EC and 2008/50/EC of the European Parliament and of the Council of the European Union.
We are grateful to the IAGOS operators from the various institutes which are members of IAGOS-AISBL (http://www.iagos.org, last access: 7 June 2024). The authors also acknowledge the strong support of the European Commission, Airbus, and the airlines (Lufthansa, Air France, Austrian Airlines, Air Namibia, Cathay Pacific, Iberia, China Airlines, Hawaiian Airlines, Eurowings Discover and Air Canada) which have carried the IAGOS equipment and undertaken maintenance. IAGOS has been additionally funded by the EU projects IAGOS-DS and IAGOS-ERI. The IAGOS database is supported in France by AERIS (https://www.aeris-data.fr, last access: 7 June 2024). It is worth noting that the IAGOS data used in this study are preliminary data (L1), against normal data policy (peer-reviewed publications need L2 data). Only CAMS-related activities are allowed to use these data thanks to a special agreement between IAGOS and CAMS for the specific interests of the development and validation of the operational model that ensures the teams have a full understanding of the limitations of these uncalibrated data. Note that the results may be slightly different from a validation with calibrated L2 data.
This research has been supported by the Copernicus Atmosphere Monitoring Service (CAMS), which is one of six services that form Copernicus, the European Union's Earth observation programme.
This paper was edited by Andreas Petzold and reviewed by two anonymous referees.
ACE/SCISAT: ACE-FTS data, Atmospheric Chemistry Experiment on SCISAT, University of Waterloo [data set], https://databace.scisat.ca/level2/ace_v5.2/display_data.php, last access: 27 August 2024. a
Agustí-Panareda, A., Barré, J., Massart, S., Inness, A., Aben, I., Ades, M., Baier, B. C., Balsamo, G., Borsdorff, T., Bousserez, N., Boussetta, S., Buchwitz, M., Cantarello, L., Crevoisier, C., Engelen, R., Eskes, H., Flemming, J., Garrigues, S., Hasekamp, O., Huijnen, V., Jones, L., Kipling, Z., Langerock, B., McNorton, J., Meilhac, N., Noël, S., Parrington, M., Peuch, V.-H., Ramonet, M., Razinger, M., Reuter, M., Ribas, R., Suttie, M., Sweeney, C., Tarniewicz, J., and Wu, L.: Technical note: The CAMS greenhouse gas reanalysis from 2003 to 2020, Atmos. Chem. Phys., 23, 3829–3859, https://doi.org/10.5194/acp-23-3829-2023, 2023. a, b, c
Bai, K., Li, K., Guo, J., Yang, Y., and Chang, N.-B.: Filling the gaps of in situ hourly PM2.5 concentration data with the aid of empirical orthogonal function analysis constrained by diurnal cycles, Atmos. Meas. Tech., 13, 1213–1226, https://doi.org/10.5194/amt-13-1213-2020, 2020. a
Benedetti, A., Morcrette, J.-J., Boucher, O., Dethof, A., Engelen, R. J., Fisher, M., Flentje, H., Huneeus, N., Jones, L., Kaiser, J. W., Kinne, S., Mangold, A., Razinger, M., Simmons, A. J., and Suttie, M.: Aerosol analysis and forecast in the European centre for medium-range weather forecasts integrated forecast system: 2. Data assimilation, J. Geophys. Res.-Atmos., 114, D13205, https://doi.org/10.1029/2008JD011115, 2009. a
Benedictow, A., Arola, A., Bennouna, Y., Bouarar, I., Cuevas, E., Errera, Q., Eskes, H., Griesfeller, J., Basart, S., Kapsomenakis, J., Langerock, B., Mortier, A., Pison, I., Pitkänen, M., Ramonet, M., Richter, A., Schoenhardt, A., Schulz, M., Tarniewicz, J., Thouret, V., Tsikerdekis, A., Warneke, T., and Zerefos, C.: Validation report of the CAMS near-real-time global atmospheric composition service Period December–February 2023, Copernicus Atmosphere Monitoring Service, https://doi.org/10.24380/I31D-5I54, 2023. a
Bennouna, Y., Arola, A., Benedictow, A., Blake, L., Bouarar, I., Cuevas, E., Errera, Q., Eskes, H., Griesfeller, J., Ilic, L., Kapsomenakis, J., Langerock, B., Mortier, A., I., P., Pitkänen, M., Richter, A., Schoenhardt, A., Schulz, M., Thouret, V., Tsikerdekis, A., Warneke, T., and Zerefos, C.: Validation report of the CAMS global reanalysis of aerosols and reactive trace gases, period 2003–2022, Copernicus Atmosphere Monitoring Service, https://doi.org/10.24380/1rx8-mwi7, 2023. a
Boone, C. D., Bernath, P. F., and Lecours, M.: Version 5 retrievals for ACE-FTS and ACE-imagers, J. Quant. Spectrosc. Ra., 310, 108749, https://doi.org/10.1016/j.jqsrt.2023.108749, 2023. a
Boulanger, D., Blot, R., Bundke, U., Gerbig, C., Hermann, M., Nédélec, P., Rohs, S., and Ziereis, H.: IAGOS Observational Data NRT – Time series and vertical profiles, AERIS [data set], https://doi.org/10.25326/704, 2018. a
Brown, H., Liu, X., Feng, Y., Jiang, Y., Wu, M., Lu, Z., Wu, C., Murphy, S., and Pokhrel, R.: Radiative effect and climate impacts of brown carbon with the Community Atmosphere Model (CAM5), Atmos. Chem. Phys., 18, 17745–17768, https://doi.org/10.5194/acp-18-17745-2018, 2018. a
CAMS: Implementation of IFS cycle 48r1 for CAMS, https://confluence.ecmwf.int/display/FCST/Implementation+of+IFS+cycle+48R1 (last access: 7 June 2024), 2024. a
Carn, S. A., Fioletov, V. E., McLinden, C. A., Li, C., and Krotkov, N. A.: A decade of global volcanic SO2 emissions measured from space, Scientific Reports, 7, 44095, https://doi.org/10.1038/srep44095, 2017. a
Chabrillat, S., Minganti, D., Huijnen, V., and Remy, S.: Report documenting the changes in PSC parameterization and improvements of ozone hole forecasts, Copernicus Atmosphere Monitoring Service, https://doi.org/10.24380/2NXV-H84F, 2023. a, b
CliFlo: UV Index, National Climate Database on the Web, NIWA [data set], https://cliflo.niwa.co.nz/, last access: 12 August 2024. a
CNEMC: Air quality data for China, China National Environmental Monitoring Centre [data set], https://quotsoft.net/air/, last access: 14 August 2024. a
Cuevas, E., Camino, C., Benedetti, A., Basart, S., Terradellas, E., Baldasano, J. M., Morcrette, J. J., Marticorena, B., Goloub, P., Mortier, A., Berjón, A., Hernández, Y., Gil-Ojeda, M., and Schulz, M.: The MACC-II 2007–2008 reanalysis: atmospheric dust evaluation and characterization over northern Africa and the Middle East, Atmos. Chem. Phys., 15, 3991–4024, https://doi.org/10.5194/acp-15-3991-2015, 2015. a
Denier van der Gon, H., Gauss, M., Granier, C., Arellano, S., Benedictow, A., Darras, S., Dellaert, S., Guevara, M., Jalkanen, J.-P., Krueger, K., Kuenen, J., Liaskoni, M., Liousse, C., Markova, J., Prieto Perez, A., Quack, B., Simpson, D., Sindelarova, K., and Soulie, A.: Documentation of CAMS emission inventory products, Copernicus Atmosphere Monitoring Service, https://doi.org/10.24380/Q2SI-TI6I, 2023. a
ECMWF: IFS Documentation CY48R1 - Part VIII: Atmospheric Composition, ECMWF, https://doi.org/10.21957/749DC09059, 2023. a, b, c, d, e, f, g
ECMWF: CAMS AeroVal evaluation server, https://cams2-82.aeroval.met.no (last access: 7 June 2024), 2024a. a
ECMWF: CAMS: Global atmospheric composition forecast data documentation, https://confluence.ecmwf.int/display/CKB/CAMS:+Global+atmospheric+composition+forecast+data+documentation (last access: 7 June 2024), 2024b. a
ECMWF: CAMS data monitoring, https://atmosphere.copernicus.eu/charts/packages/cams_monitoring/ (last access: 7 June 2024), 2024c. a
ECMWF: CAMS Evaluation and Quality Assurance (EQA) reports,https://atmosphere.copernicus.eu/eqa-reports-global-services (last access: 7 June 2024), 2024d. a, b, c, d
ECMWF: CAMS global products, http://atmosphere.copernicus.eu/documentation-global-systems (last access: 7 June 2024), 2024e. a
ECMWF: CAMS global validation server, https://global-evaluation.atmosphere.copernicus.eu (last access: 7 June 2024), 2024f. a
ECMWF: CAMS global validation services, https://atmosphere.copernicus.eu/global-services (last access: 7 June 2024), 2024g. a, b
ECMWF: Changes to the forecasting system, https://confluence.ecmwf.int/display/FCST/Changes+to+the+forecasting+system (last access: 7 June 2024), 2024h. a, b
ECMWF: Implementation of IFS Cycle 48r1, https://confluence.ecmwf.int/display/COPSRV/Implementation+of+IFS+cycle+48r1+for+CAMS (last access: 7 June 2024), 2024i. a
ECMWF-ADS: CAMS Global Atmospheric Forecasts, ECMWF-ADS [data set], https://ads.atmosphere.copernicus.eu/cdsapp#!/dataset/cams-global-atmospheric-composition-forecasts?tab=overview (last access: 16 August 2024), 2024. a
EEA: Hourly air quality data for Europe, European Air Quality Portal, European Environmental Agency [data set], https://aqportal.discomap.eea.europa.eu, last access: 27 August 2024. a
Errera, Q., Chabrillat, S., Christophe, Y., Debosscher, J., Hubert, D., Lahoz, W., Santee, M. L., Shiotani, M., Skachko, S., von Clarmann, T., and Walker, K.: Technical note: Reanalysis of Aura MLS chemical observations, Atmos. Chem. Phys., 19, 13647–13679, https://doi.org/10.5194/acp-19-13647-2019, 2019. a, b, c
ESA: ESA Validation Data Center, https://evdc.esa.int, last access: 1 July 2024. a
Eskes, H., Huijnen, V., Arola, A., Benedictow, A., Blechschmidt, A.-M., Botek, E., Boucher, O., Bouarar, I., Chabrillat, S., Cuevas, E., Engelen, R., Flentje, H., Gaudel, A., Griesfeller, J., Jones, L., Kapsomenakis, J., Katragkou, E., Kinne, S., Langerock, B., Razinger, M., Richter, A., Schultz, M., Schulz, M., Sudarchikova, N., Thouret, V., Vrekoussis, M., Wagner, A., and Zerefos, C.: Validation of reactive gases and aerosols in the MACC global analysis and forecast system, Geosci. Model Dev., 8, 3523–3543, https://doi.org/10.5194/gmd-8-3523-2015, 2015. a, b
Eskes, H., Basart, S., Benedictow, A., Bennouna, Y., Blechschmidt, A.-M., Errera, Q., Hansen, K., Kapsomenakis, J., Langerock, B., Richter, A., Sudarchikova, N., Schulz, M., and Zerefos, C.: Upgrade verification note for the CAMS real-time global atmospheric composition service: Evaluation of the e-suite for the CAMS 47R3 upgrade of 12 October 2021, Copernicus Atmosphere Monitoring Service, https://doi.org/10.24380/HFVP-FQ98, 2021. a
Eskes, H., Basart, S., Benedictow, A., Bennouna, Y., Cuevas, E., Errera, Q., Kapsomenakis, J., Langerock, B., Pitkänen, M., Ramonet, M., Richter, A., Schönhardt, A., Schulz, M., Warneke, T., and Zerefos, C.: Observation characterisation and validation methods document, Copernicus Atmosphere Monitoring Service, https://doi.org/10.24380/P5DE-SSQC, 2023a. a, b, c
Eskes, H., Tsikerdekis, A., Benedictow, A., Bennouna, Y., Blake, L., Bouarar, I., Errera, Q., Griesfeller, J., Ilic, L., Kapsomenakis, J., Langerock, B., Mortier, A., Pison, I., Pitkänen, M., Richter, A., Schönhardt, A., Schulz, M., Thouret, V., Warneke, T., and Zerefos, C.: Upgrade verification note for the CAMS near-real time global atmospheric composition service: Evaluation of the e-suite for the CAMS CY48R1 upgrade of 27 June 2023, Copernicus Atmosphere Monitoring Service, https://doi.org/10.24380/rzg1-8f3l, 2023b. a, b, c, d, e
EUVDB: Spectral UV, European UV Database, FMI [data set], http://uvdb.fmi.fi/uvdb/index.html, last access: 20 August 2024. a
Flemming, J., Huijnen, V., Arteta, J., Bechtold, P., Beljaars, A., Blechschmidt, A.-M., Diamantakis, M., Engelen, R. J., Gaudel, A., Inness, A., Jones, L., Josse, B., Katragkou, E., Marecal, V., Peuch, V.-H., Richter, A., Schultz, M. G., Stein, O., and Tsikerdekis, A.: Tropospheric chemistry in the Integrated Forecasting System of ECMWF, Geosci. Model Dev., 8, 975–1003, https://doi.org/10.5194/gmd-8-975-2015, 2015. a
Flemming, J., Benedetti, A., Inness, A., Engelen, R. J., Jones, L., Huijnen, V., Remy, S., Parrington, M., Suttie, M., Bozzo, A., Peuch, V.-H., Akritidis, D., and Katragkou, E.: The CAMS interim Reanalysis of Carbon Monoxide, Ozone and Aerosol for 2003–2015, Atmos. Chem. Phys., 17, 1945–1983, https://doi.org/10.5194/acp-17-1945-2017, 2017. a
Garrigues, S., Ades, M., Remy, S., Flemming, J., Kipling, Z., Laszlo, I., Parrington, M., Inness, A., Ribas, R., Jones, L., Engelen, R., and Peuch, V.-H.: Impact of assimilating NOAA VIIRS aerosol optical depth (AOD) observations on global AOD analysis from the Copernicus Atmosphere Monitoring Service (CAMS), Atmos. Chem. Phys., 23, 10473–10487, https://doi.org/10.5194/acp-23-10473-2023, 2023. a, b
Gkikas, A., Proestakis, E., Amiridis, V., Kazadzis, S., Di Tomaso, E., Tsekeri, A., Marinou, E., Hatzianastassiou, N., and Pérez García-Pando, C.: ModIs Dust AeroSol (MIDAS): a global fine-resolution dust optical depth data set, Atmos. Meas. Tech., 14, 309–334, https://doi.org/10.5194/amt-14-309-2021, 2021. a
Global Monitoring Laboratory: Surface ozone data, Global Monitoring Laboratory, Earth System Research Laboratories [data set], https://gml.noaa.gov/aftp/data/ozwv/SurfaceOzone/, last access: 14 August 2024. a
Guevara, M., Jorba, O., Tena, C., Denier van der Gon, H., Kuenen, J., Elguindi, N., Darras, S., Granier, C., and Pérez García-Pando, C.: Copernicus Atmosphere Monitoring Service TEMPOral profiles (CAMS-TEMPO): global and European emission temporal profile maps for atmospheric chemistry modelling, Earth Syst. Sci. Data, 13, 367–404, https://doi.org/10.5194/essd-13-367-2021, 2021. a
Hollingsworth, A., Engelen, R. J., Textor, C., Benedetti, A., Boucher, O., Chevallier, F., Dethof, A., Elbern, H., Eskes, H., Flemming, J., Granier, C., Kaiser, J. W., Morcrette, J.-J., Rayner, P., Peuch, V.-H., Rouil, L., Schultz, M. G., and Simmons, A. J.: TOWARD A MONITORING AND FORECASTING SYSTEM FOR ATMOSPHERIC COMPOSITION: The GEMS Project, B. Am. Meteorol. Soc., 89, 1147–1164, https://doi.org/10.1175/2008BAMS2355.1, 2008. a
Huijnen, V., Flemming, J., Chabrillat, S., Errera, Q., Christophe, Y., Blechschmidt, A.-M., Richter, A., and Eskes, H.: C-IFS-CB05-BASCOE: stratospheric chemistry in the Integrated Forecasting System of ECMWF, Geosci. Model Dev., 9, 3071–3091, https://doi.org/10.5194/gmd-9-3071-2016, 2016. a, b, c, d
Huijnen, V., Pozzer, A., Arteta, J., Brasseur, G., Bouarar, I., Chabrillat, S., Christophe, Y., Doumbia, T., Flemming, J., Guth, J., Josse, B., Karydis, V. A., Marécal, V., and Pelletier, S.: Quantifying uncertainties due to chemistry modelling – evaluation of tropospheric composition simulations in the CAMS model (cycle 43R1), Geosci. Model Dev., 12, 1725–1752, https://doi.org/10.5194/gmd-12-1725-2019, 2019. a
Hurtmans, D., Coheur, P. F., Wespes, C., Clarisse, L., Scharf, O., Clerbaux, C., Hadji-Lazaro, J., George, M., and Turquety, S.: FORLI radiative transfer and retrieval code for IASI, J. Quant. Spectrosc. Ra., 113, 1391–1408, https://doi.org/10.1016/j.jqsrt.2012.02.036, 2012. a
IASI/Metop: IASI PORTAL – Atmospheric composition data products, AERIS [data set], https://iasi.aeris-data.fr/catalog, last access: 27 August 2024. a
Inness, A., Baier, F., Benedetti, A., Bouarar, I., Chabrillat, S., Clark, H., Clerbaux, C., Coheur, P., Engelen, R. J., Errera, Q., Flemming, J., George, M., Granier, C., Hadji-Lazaro, J., Huijnen, V., Hurtmans, D., Jones, L., Kaiser, J. W., Kapsomenakis, J., Lefever, K., Leitão, J., Razinger, M., Richter, A., Schultz, M. G., Simmons, A. J., Suttie, M., Stein, O., Thépaut, J.-N., Thouret, V., Vrekoussis, M., Zerefos, C., and the MACC team: The MACC reanalysis: an 8 yr data set of atmospheric composition, Atmos. Chem. Phys., 13, 4073–4109, https://doi.org/10.5194/acp-13-4073-2013, 2013. a
Inness, A., Blechschmidt, A.-M., Bouarar, I., Chabrillat, S., Crepulja, M., Engelen, R. J., Eskes, H., Flemming, J., Gaudel, A., Hendrick, F., Huijnen, V., Jones, L., Kapsomenakis, J., Katragkou, E., Keppens, A., Langerock, B., de Mazière, M., Melas, D., Parrington, M., Peuch, V. H., Razinger, M., Richter, A., Schultz, M. G., Suttie, M., Thouret, V., Vrekoussis, M., Wagner, A., and Zerefos, C.: Data assimilation of satellite-retrieved ozone, carbon monoxide and nitrogen dioxide with ECMWF's Composition-IFS, Atmos. Chem. Phys., 15, 5275–5303, https://doi.org/10.5194/acp-15-5275-2015, 2015. a
Inness, A., Ades, M., Agustí-Panareda, A., Barré, J., Benedictow, A., Blechschmidt, A.-M., Dominguez, J. J., Engelen, R., Eskes, H., Flemming, J., Huijnen, V., Jones, L., Kipling, Z., Massart, S., Parrington, M., Peuch, V.-H., Razinger, M., Remy, S., Schulz, M., and Suttie, M.: The CAMS reanalysis of atmospheric composition, Atmos. Chem. Phys., 19, 3515–3556, https://doi.org/10.5194/acp-19-3515-2019, 2019. a
Inness, A., Aben, I., Ades, M., Borsdorff, T., Flemming, J., Jones, L., Landgraf, J., Langerock, B., Nedelec, P., Parrington, M., and Ribas, R.: Assimilation of S5P/TROPOMI carbon monoxide data with the global CAMS near-real-time system, Atmos. Chem. Phys., 22, 14355–14376, https://doi.org/10.5194/acp-22-14355-2022, 2022a. a, b
Inness, A., Ades, M., Balis, D., Efremenko, D., Flemming, J., Hedelt, P., Koukouli, M.-E., Loyola, D., and Ribas, R.: Evaluating the assimilation of S5P/TROPOMI near real-time SO2 columns and layer height data into the CAMS integrated forecasting system (CY47R1), based on a case study of the 2019 Raikoke eruption, Geosci. Model Dev., 15, 971–994, https://doi.org/10.5194/gmd-15-971-2022, 2022b. a
Kaiser, J. W., Heil, A., Andreae, M. O., Benedetti, A., Chubarova, N., Jones, L., Morcrette, J.-J., Razinger, M., Schultz, M. G., Suttie, M., and van der Werf, G. R.: Biomass burning emissions estimated with a global fire assimilation system based on observed fire radiative power, Biogeosciences, 9, 527–554, https://doi.org/10.5194/bg-9-527-2012, 2012. a
Katragkou, E., Zanis, P., Tsikerdekis, A., Kapsomenakis, J., Melas, D., Eskes, H., Flemming, J., Huijnen, V., Inness, A., Schultz, M. G., Stein, O., and Zerefos, C. S.: Evaluation of near-surface ozone over Europe from the MACC reanalysis, Geosci. Model Dev., 8, 2299–2314, https://doi.org/10.5194/gmd-8-2299-2015, 2015. a
Kramarova, N. A., Bhartia, P. K., Jaross, G., Moy, L., Xu, P., Chen, Z., DeLand, M., Froidevaux, L., Livesey, N., Degenstein, D., Bourassa, A., Walker, K. A., and Sheese, P.: Validation of ozone profile retrievals derived from the OMPS LP version 2.5 algorithm against correlative satellite measurements, Atmos. Meas. Tech., 11, 2837–2861, https://doi.org/10.5194/amt-11-2837-2018, 2018. a
Lamarque, J.-F., Emmons, L. K., Hess, P. G., Kinnison, D. E., Tilmes, S., Vitt, F., Heald, C. L., Holland, E. A., Lauritzen, P. H., Neu, J., Orlando, J. J., Rasch, P. J., and Tyndall, G. K.: CAM-chem: description and evaluation of interactive atmospheric chemistry in the Community Earth System Model, Geosci. Model Dev., 5, 369–411, https://doi.org/10.5194/gmd-5-369-2012, 2012. a
Lange, K., Richter, A., Schönhardt, A., Meier, A. C., Bösch, T., Seyler, A., Krause, K., Behrens, L. K., Wittrock, F., Merlaud, A., Tack, F., Fayt, C., Friedrich, M. M., Dimitropoulou, E., Van Roozendael, M., Kumar, V., Donner, S., Dörner, S., Lauster, B., Razi, M., Borger, C., Uhlmannsiek, K., Wagner, T., Ruhtz, T., Eskes, H., Bohn, B., Santana Diaz, D., Abuhassan, N., Schüttemeyer, D., and Burrows, J. P.: Validation of Sentinel-5P TROPOMI tropospheric NO2 products by comparison with NO2 measurements from airborne imaging DOAS, ground-based stationary DOAS, and mobile car DOAS measurements during the S5P-VAL-DE-Ruhr campaign, Atmos. Meas. Tech., 16, 1357–1389, https://doi.org/10.5194/amt-16-1357-2023, 2023. a
Langerock, B., Kouyate, M., Ramonet, M., Warneke, T., and Eskes, H.: Upgrade verification note for the CAMS near-real-time global atmospheric composition service: Evaluation of the e-suite for the CAMS CY48R1 upgrade for the Greenhouse Gases CO2 and CH4, Copernicus Atmosphere Monitoring Service (CAMS) report, https://doi.org/10.24380/A3MD-6M2N, 2024. a
Lefever, K., van der A, R., Baier, F., Christophe, Y., Errera, Q., Eskes, H., Flemming, J., Inness, A., Jones, L., Lambert, J.-C., Langerock, B., Schultz, M. G., Stein, O., Wagner, A., and Chabrillat, S.: Copernicus stratospheric ozone service, 2009–2012: validation, system intercomparison and roles of input data sets, Atmos. Chem. Phys., 15, 2269–2293, https://doi.org/10.5194/acp-15-2269-2015, 2015. a
Livesey, N. J., Read, W. G., Wagner, P. A., Froidevaux, L., Santee, M. L., Schwartz, M. J., Lambert, A., Millán Valle, L. F., Pumphrey, H. C., Manney, G. L., Fuller, R. A., Jarnot, R. F., Knosp, B. W., and Lay, R. R.: Earth Observing System (EOS) Aura Microwave Limb Sounder (MLS) Version 5.0x Level 2 and 3 data quality and description document, NASA JPL, https://mls.jpl.nasa.gov/data/v5-0_data_quality_document.pdf (last access: 14 August 2024), 2022. a
Marécal, V., Peuch, V.-H., Andersson, C., Andersson, S., Arteta, J., Beekmann, M., Benedictow, A., Bergström, R., Bessagnet, B., Cansado, A., Chéroux, F., Colette, A., Coman, A., Curier, R. L., Denier van der Gon, H. A. C., Drouin, A., Elbern, H., Emili, E., Engelen, R. J., Eskes, H. J., Foret, G., Friese, E., Gauss, M., Giannaros, C., Guth, J., Joly, M., Jaumouillé, E., Josse, B., Kadygrov, N., Kaiser, J. W., Krajsek, K., Kuenen, J., Kumar, U., Liora, N., Lopez, E., Malherbe, L., Martinez, I., Melas, D., Meleux, F., Menut, L., Moinat, P., Morales, T., Parmentier, J., Piacentini, A., Plu, M., Poupkou, A., Queguiner, S., Robertson, L., Rouïl, L., Schaap, M., Segers, A., Sofiev, M., Tarasson, L., Thomas, M., Timmermans, R., Valdebenito, Á., van Velthoven, P., van Versendaal, R., Vira, J., and Ung, A.: A regional air quality forecasting system over Europe: the MACC-II daily ensemble production, Geosci. Model Dev., 8, 2777–2813, https://doi.org/10.5194/gmd-8-2777-2015, 2015. a
McClure-Begley, A., Petropavlovskikh, I., and Oltmans, S.: NOAA Global Monitoring Surface Ozone Network 1973–2014, National Oceanic and Atmospheric Administration, Earth Systems Research Laboratory Global Monitoring Division, Boulder, CO [data set], https://doi.org/10.7289/V57P8WBF, 2014. a
MET Norway: Special experiment for the Cy48R1 e-suite on the CAMS AeroVal evaluation server, MET Norway [data set], https://aeroval.met.no/pages/evaluation/?project=cams2-82&experiment=IFS-ESUITE-Cy48R1, last access: 15 August 2024. a, b, c, d
Myriokefalitakis, S., Daskalakis, N., Gkouvousis, A., Hilboll, A., van Noije, T., Williams, J. E., Le Sager, P., Huijnen, V., Houweling, S., Bergman, T., Nüß, J. R., Vrekoussis, M., Kanakidou, M., and Krol, M. C.: Description and evaluation of a detailed gas-phase chemistry scheme in the TM5-MP global chemistry transport model (r112), Geosci. Model Dev., 13, 5507–5548, https://doi.org/10.5194/gmd-13-5507-2020, 2020. a
NASA-AERONET: AERONET AOD and SDA data version 3 level 1.5, NASA [data set], https://aeronet.gsfc.nasa.gov/new_web/download_all_v3_aod.html (last access: 14 August 2024), 2024. a
NASA/LARC/SD/ASD: MOPITT Derived CO (Thermal Infrared Radiances) V008, NASA Langley Atmospheric Science Data Center DAAC [data set], https://doi.org/10.5067/TERRA/MOPITT/MOP02T_L2.008, 2000. a
NASA/LARC/SD/ASDC: SAGE III/ISS L2 Solar Event Species Profiles (HDF5) V053, NASA Langley Atmospheric Science Data Center DAAC [data set], https://doi.org/10.5067/ISS/SAGEIII/SOLAR_HDF5_L2-V5.3, 2017. a
NASA/OMPS/NPP/LP: OMPS v2.6 ozone data, Ozone Mapping and Profiler Suite, NASA [data set], https://omps.gesdisc.eosdis.nasa.gov/data/SNPP_OMPS_Level2/OMPS_NPP_LP_L2_O3_DAILY.2.6, last access: 19 August 2024. a
NDACC: NDACC observational data, NDACC Public Data Access, Network for the Detection of Atmospheric Composition Change [data set], https://www-air.larc.nasa.gov/missions/ndacc/data.html, last access 27 August 2024. a
NDACC-RD: NDACC Rapid Delivery (RD) Data Access, Network for the Detection of Atmospheric Composition Change [data set], https://www-air.larc.nasa.gov/missions/ndacc/data.html?RapidDelivery=rd-list, last access: 27 August 2024. a
Nédélec, P., Blot, R., Boulanger, D., Athier, G., Cousin, J.-M., Gautron, B., Petzold, A., Volz-Thomas, A., and Thouret, V.: Instrumentation on commercial aircraft for monitoring the atmospheric composition on a global scale: the IAGOS system, technical overview of ozone and carbon monoxide measurements, Tellus B, 67, 27791, https://doi.org/10.3402/tellusb.v67.27791, 2015. a
Norwegian Meteorological Institute – AeroTools: metno/pyaerocom (0.20.0), Zenodo [code], https://doi.org/10.5281/zenodo.13270713, 2024. a
Oltmans, S. J. and Levy II, H.: Surface ozone measurements from a global network, Atmos. Environ., 28, 9–24, https://doi.org/10.1016/1352-2310(94)90019-1, 1994. a
Petzold, A., Thouret, V., Gerbig, C., Zahn, A., Brenninkmeijer, C. A. M., Gallagher, M., Hermann, M., Pontaud, M., Ziereis, H., Boulanger, D., Marshall, J., Nédélec, P., Smit, H. G. J., Friess, U., Flaud, J.-M., Wahner, A., Cammas, J.-P., Volz-Thomas, A., and IAGOS Team: Global-scale atmosphere monitoring by in-service aircraft – current achievements and future prospects of the European Research Infrastructure IAGOS, Tellus B, 67, 28452, https://doi.org/10.3402/tellusb.v67.28452, 2015. a
Peuch, V.-H., Engelen, R., Rixen, M., Dee, D., Flemming, J., Suttie, M., Ades, M., Agustí-Panareda, A., Ananasso, C., Andersson, E., Armstrong, D., Barré, J., Bousserez, N., Dominguez, J. J., Garrigues, S., Inness, A., Jones, L., Kipling, Z., Letertre-Danczak, J., Parrington, M., Razinger, M., Ribas, R., Vermoote, S., Yang, X., Simmons, A., de Marcilla, J. G., and Thépaut, J.-N.: The Copernicus Atmosphere Monitoring Service: from research to operations, B. Am. Meteorol. Soc., 103, E2650–E2668, https://doi.org/10.1175/bams-d-21-0314.1, 2022. a, b, c, d
Ramonet, M., Langerock, B., Warneke, T., and Eskes, H.: Validation report of the CAMS greenhouse gas global reanalysis, years 2003-2020, Copernicus Atmosphere Monitoring Service, https://doi.org/10.24380/438C-4597, 2021. a
Reddy, M. S.: Estimates of global multicomponent aerosol optical depth and direct radiative perturbation in the Laboratoire de Météorologie Dynamique general circulation model, J. Geophys. Res., 110, D10S16, https://doi.org/10.1029/2004jd004757, 2005. a
Rémy, S., Kipling, Z., Flemming, J., Boucher, O., Nabat, P., Michou, M., Bozzo, A., Ades, M., Huijnen, V., Benedetti, A., Engelen, R., Peuch, V.-H., and Morcrette, J.-J.: Description and evaluation of the tropospheric aerosol scheme in the European Centre for Medium-Range Weather Forecasts (ECMWF) Integrated Forecasting System (IFS-AER, cycle 45R1), Geosci. Model Dev., 12, 4627–4659, https://doi.org/10.5194/gmd-12-4627-2019, 2019. a
Rémy, S., Kipling, Z., Huijnen, V., Flemming, J., Nabat, P., Michou, M., Ades, M., Engelen, R., and Peuch, V.-H.: Description and evaluation of the tropospheric aerosol scheme in the Integrated Forecasting System (IFS-AER, cycle 47R1) of ECMWF, Geosci. Model Dev., 15, 4881–4912, https://doi.org/10.5194/gmd-15-4881-2022, 2022. a, b
Ryder, C. L., Marenco, F., Brooke, J. K., Estelles, V., Cotton, R., Formenti, P., McQuaid, J. B., Price, H. C., Liu, D., Ausset, P., Rosenberg, P. D., Taylor, J. W., Choularton, T., Bower, K., Coe, H., Gallagher, M., Crosier, J., Lloyd, G., Highwood, E. J., and Murray, B. J.: Coarse-mode mineral dust size distributions, composition and optical properties from AER-D aircraft measurements over the tropical eastern Atlantic, Atmos. Chem. Phys., 18, 17225–17257, https://doi.org/10.5194/acp-18-17225-2018, 2018. a
Schwartz, M., Froidevaux, L., Livesey, N., and Read, W.: MLS/Aura Level 2 Ozone (O3) Mixing Ratio V005, Greenbelt, MD, USA, Goddard Earth Sciences Data and Information Services Center (GES DISC) [data set], https://doi.org/10.5067/Aura/MLS/DATA2516, 2020. a
Sindelarova, K., Markova, J., Simpson, D., Huszar, P., Karlicky, J., Darras, S., and Granier, C.: High-resolution biogenic global emission inventory for the time period 2000–2019 for air quality modelling, Earth Syst. Sci. Data, 14, 251–270, https://doi.org/10.5194/essd-14-251-2022, 2022. a
Soulie, A., Granier, C., Darras, S., Zilbermann, N., Doumbia, T., Guevara, M., Jalkanen, J.-P., Keita, S., Liousse, C., Crippa, M., Guizzardi, D., Hoesly, R., and Smith, S. J.: Global anthropogenic emissions (CAMS-GLOB-ANT) for the Copernicus Atmosphere Monitoring Service simulations of air quality forecasts and reanalyses, Earth Syst. Sci. Data, 16, 2261–2279, https://doi.org/10.5194/essd-16-2261-2024, 2023. a
Stavrakou, T., Peeters, J., and Müller, J.-F.: Improved global modelling of HOx recycling in isoprene oxidation: evaluation against the GABRIEL and INTEX-A aircraft campaign measurements, Atmos. Chem. Phys., 10, 9863–9878, https://doi.org/10.5194/acp-10-9863-2010, 2010. a
Tsikerdekis, A., Eskes, H., and Schulz, M.: Scoring approaches for the evaluation of the CAMS global atmospheric composition forecasting system, Copernicus Atmosphere Monitoring Service, https://doi.org/10.24380/3UFO-IC5K, 2023. a, b
U.S. EPA: Hourly Data, Pre-Generated Data Files, U.S. EPA [data set], https://aqs.epa.gov/aqsweb/airdata/download_files.html#Raw, last access: 14 August 2024. a
Wagner, A., Bennouna, Y., Blechschmidt, A.-M., Brasseur, G., Chabrillat, S., Christophe, Y., Errera, Q., Eskes, H., Flemming, J., Hansen, K. M., Inness, A., Kapsomenakis, J., Langerock, B., Richter, A., Sudarchikova, N., Thouret, V., and Zerefos, C.: Comprehensive evaluation of the Copernicus Atmosphere Monitoring Service (CAMS) reanalysis against independent observations, Elementa: Science of the Anthropocene, 9, 00171, https://doi.org/10.1525/elementa.2020.00171, 2021. a
Wang, H. J. R., Damadeo, R., Flittner, D., Kramarova, N., Taha, G., Davis, S., Thompson, A. M., Strahan, S., Wang, Y., Froidevaux, L., Degenstein, D., Bourassa, A., Steinbrecht, W., Walker, K. A., Querel, R., Leblanc, T., Godin-Beekmann, S., Hurst, D., and Hall, E.: Validation of SAGE III/ISS solar occultation ozone products with correlative satellite and ground based measurements, J. Geophys. Res.-Atmos., 125, e2020JD032430. https://doi.org/10.1029/2020JD032430, 2020. a
Warneke, T., Arola, A., Benedictow, A., Bennouna, Y., Blake, L., Bouarar, I., Errera, Q., Eskes, H., Griesfeller, J., Ilić, L., Kapsomenakis, J., Kouyate, M., Langerock, B., Mortier, A., Pison, I., Pitkänen, M., Ramonet, M., Richter, A., Schoenhardt, A., Schulz, M., Tarniewicz, J., Thouret, V., Tsikerdekis, A., and Zerefos, C.: Validation report of the CAMS near-real-time global atmospheric composition service: September – November 2023, Copernicus Atmosphere Monitoring Service, https://doi.org/10.24380/90z9-nva, 2024. a
Williams, J. E. ., Huijnen, V., Bouarar, I., Meziane, M., Schreurs, T., Pelletier, S., Marécal, V., Josse, B., and Flemming, J.: Regional evaluation of the performance of the global CAMS chemical modeling system over the United States (IFS cycle 47r1), Geosci. Model Dev., 15, 4657–4687, https://doi.org/10.5194/gmd-15-4657-2022, 2022. a, b
WMO: Guidelines for the Measurement of Atmospheric Carbon Monoxide, GAW Report No. 192, World Meteorological Organization, Geneva, Switzerland, https://library.wmo.int/idurl/4/32181 (last access: 27 August 2024), 2010. a
WMO: Guidelines for the Continuous Measurements of Ozone in the Troposphere, GAW Report No. 209, World Meteorological Organization, Geneva, Switzerland, ISBN 978-92-63-11110-4, 2013. a
Zhang, L.: A size-segregated particle dry deposition scheme for an atmospheric aerosol module, Atmos. Environ., 35, 549–560, https://doi.org/10.1016/s1352-2310(00)00326-5, 2001. a
- Abstract
- Introduction
- Overview of the CAMS global system
- Observations used for the validation of the CAMS system
- Results: changes in atmospheric composition introduced by Cy48R1
- Conclusions
- Code and data availability
- Author contributions
- Competing interests
- Disclaimer
- Acknowledgements
- Financial support
- Review statement
- References
- Supplement