the Creative Commons Attribution 4.0 License.
the Creative Commons Attribution 4.0 License.
 | 28 Aug 2024
Distinct structure, radiative effects, and precipitation characteristics of deep convection systems in the Tibetan Plateau compared to the tropical Indian Ocean
Yuxin Zhao
Jiming Li
Deyu Wen
Yarong Li
Yuan Wang
Jianping Huang
Using spaceborne lidar and radar observations, this study identifies deep convection systems (DCSs), including deep convection cores (DCCs) and anvils, over the Tibetan Plateau (TP) and tropical Indian Ocean (TO) and finds that DCSs over the TP are less frequent, exhibiting narrower and thinner DCCs and anvils compared to those over the TO. The thinner DCCs over the TP exert weaker radiative cooling effects at the top of atmosphere (TOA) compared to the TO. But, the shortwave TOA cloud radiative effect (CRE) of TP anvils is stronger than that of the TO possibly due to more densely packed cloud tops over the TP. It results in a stronger TOA CRE of DCSs over the TP than that of TO. In particular, the longwave CRE of DCSs over the TP is notably greater at surface and low-level atmosphere due to the distinct lower temperature and less water vapour. The width of DCSs shows a positive correlation with wind shear and atmospheric instability, and the underlying mechanisms are discussed. We also find that the impact of aerosols on cloud top heights and precipitation displays significant discrepancies between the two regions. It is because that the aerosol invigoration effect is less efficient on the TP DCSs, mainly attributed to the significantly colder cloud base. Due to competition between invigoration and direct/semi-direct radiative effects of aerosols, the correlation between precipitation and aerosols over the TP is not obvious. However, precipitation in the TO experiences invigoration followed by suppression with increasing aerosols, due to the dominance of aerosol radiative effects and enhancement entrainment under polluted conditions.
- Article
(3106 KB) - Full-text XML
-
Supplement
(1066 KB) - BibTeX
- EndNote


The Tibetan Plateau (TP) has received global attention as the heat source of the East Asian summer monsoon due to its prominent altitude and special topography (Wu et al., 2017; Duan et al., 2020). Over the Tibetan Plateau, surface heating causes a low-pressure centre, which can attract the warm and moist air convergence from the ocean and then promote convective activity (Wu et al., 2012). It brings abundant water to the atmosphere over the Tibetan Plateau and its surrounding regions, and thus the Tibetan Plateau is referred to as the “Asian water tower” (Xu et al., 2008). Over the past decades, some studies have shown that the Tibetan Plateau has experienced significant climate change (Liu and Chen, 2000; Yao et al., 2012). The apparent climate change is closely related to variations in cloud properties, such as cloud types (Duan and Wu, 2006). In fact, based on the ground-based observations and ISCCP data, Yang et al. (2012) have pointed out that the contradiction between the decrease in total cloud cover and solar radiation dimming over the Tibetan Plateau can be explained by increasing deep convective clouds. Although deep convective cloud is less frequent compared to other cloud types, it has a more complicated vertical structure and larger extent, thus exerting a great influence on radiation and precipitation over the Tibetan Plateau region (Dong et al., 2016; Yan and Liu, 2019). In particular, the deep convective clouds that develop over the Tibetan Plateau can move downstream and cause strong precipitation and storms in eastern China (Hu et al., 2016; Y. Liu et al., 2019; Chen et al., 2020). Additionally, some convections can also penetrate the tropopause and affect tropospheric–stratospheric exchange, such as sending water vapour into the stratosphere and changing stratospheric multi-material concentrations through chemical reactions (Kirk-Davidoff et al., 1999; Forster and Shine, 2002; Luo et al., 2011).
Regarding deep convective clouds, some studies have investigated their vertical structure and precipitation characteristics over the Tibetan Plateau (e.g., Fu et al., 2020). Luo et al. (2011) found that the deep convection core over the Tibetan Plateau is shallower, less frequent, and embedded in smaller-size convection systems compared to the surrounding regions. Fu et al. (2008, 2017) demonstrated that the terrain has a significant impact on the vertical structure of deep convection in the Tibetan Plateau, based on TRMM data. In addition to the vertical structure, previous studies have also investigated the precipitation characteristics of deep convection. Wang et al. (2019) indicate that deep convective precipitation is the primary precipitation type over the Tibetan Plateau, and the intensity of extreme precipitation will increase significantly with climate warming. In terms of regional differences, the southeastern Tibetan Plateau experiences more convective systems, with 20 %–30 % of them associated with shear line, vortex, and low-pressure systems, while 70 %–80 % are formed locally (Hu et al., 2017). Compared to studies on precipitation characteristics, research on the cloud radiative effect (CRE) of deep convective clouds has received less attention over the Tibetan Plateau. Specifically, most studies on the CRE of deep convective clouds only focus on the deep convective cores, rather than the entire deep convective systems. Deep convection cores (DCCs) are important for the atmospheric hydrological cycle because of the heavy and widespread precipitation, but the non-precipitating anvils cannot be ignored either, as they have distinct radiative effects and more extensive spatial coverage (Feng et al., 2011). Based on surface observations from the Southern Great Plains (SGP) site (e.g. by total-sky imagers and condensation particle counters) and satellite retrievals, Yan et al. (2014) even found the opposite effect of aerosol loading on the CRE of DCCs and anvils. They noted that increasing aerosol loading can thicken DCCs, resulting in a cooling effect, while also expanding the extent of anvil clouds, which has a warming effect. Thus, the CRE of entire deep convection systems should depend on the relative contributions from DCCs and anvils. Therefore, a systematic analysis of the radiative effects of whole deep convection systems (DCSs) over the Tibetan Plateau is essential to reduce the uncertainties of climate change prediction over the Tibetan Plateau. In this study, we will focus on DCSs over the Tibetan Plateau. And the tropical Indian Ocean region is the comparative area, where deep convection occurs frequently.
In general, both the structure and precipitation of DCSs are influenced by meteorological factors and aerosol loading (Khain et al., 2005; Fan et al., 2009; Zhang et al., 2022; Zhao et al., 2022). For example, Ekman et al. (2007) found, based on models and simulated cases, that the extent of the anvils of the convective cloud is mainly dependent on the updraft velocity. Gong et al. (2020) demonstrated that frozen particle growth and convective system organization are promoted by strong wind shear and high ambient humidity. Aerosols are commonly considered to enhance convective precipitation through indirect aerosol effects (Xiao et al., 2023). Aerosols inhibit warm-rain processes by decreasing particle sizes and creating a narrow droplet spectrum (Squires and Twomey, 1960; Warner and Twomey, 1967; Warner, 1968; Rosenfeld, 1999). The freezing process releases a large amount of latent heating in small droplets, which promotes the development of cumulus clouds into thicker deep convective clouds and more convective precipitation (Andreae et al., 2004; Koren et al., 2005; Rosenfeld et al., 2008; Koren et al., 2010; Chakraborty et al., 2018; Pan et al., 2021). The impacts of aerosol and meteorological factors on the structure and precipitation of DCSs are coupled. Fan et al. (2009) found that wind shear influences the effect of aerosols on convection. Under strong wind shear, the increase in aerosol loading will always suppress convection, and under weak wind shear, increased aerosols will invigorate convection. Furthermore, the quantification of direct aerosol invigoration by microphysical effects, also known as primary aerosol convective invigoration (PAI), has been a challenging issue due to the interference of covarying meteorology–aerosol invigoration (MAI) effects. To address this problem, Zang et al. (2023) utilized an artificial neural network to distinguish the PAI and MAI. Their findings revealed that the PAI could explain approximately two-thirds of the observed total aerosol-driven variation in cloud top height. However, these studies mainly focus on the tropics, and it is unclear whether these conclusions can apply to the Tibetan Plateau. To address this, the decoupled effects of aerosols and meteorological factors on the development and precipitation of DCSs over the Tibetan Plateau and the contrastive area will be discussed in this study.
Continued advances in instrumental technology have provided strong support for the research of aerosol–cloud–precipitation interactions. Jiang et al. (2018) used the CloudSat and CALIPSO datasets to show that aerosols significantly affect the development of deep convection, with the enhancing or inhibiting effect of aerosols depending on their type and concentration. Based on spaceborne and ground-based observations, Sun et al. (2023) found a boomerang-shaped aerosol effect that ranged from promoting to inhibiting the top height of convective precipitation. They also found that aerosols can have different effects on precipitation rates at different levels. For regions like the Tibetan Plateau and tropical ocean, where ground-based observations are relatively lacking, spaceborne measurements (e.g. CloudSat and CALIPSO) are a powerful tool for aerosol–cloud–precipitation measurements. Therefore, in this study, we will explore the effect of aerosols and meteorological factors on the development and precipitation of DCSs using spaceborne measurements and reanalysis data.
This study systematically explores the differences in the structure, radiative effects, and precipitation of DCSs between the Tibetan Plateau and the tropical ocean, which was selected as a point of contrast. In particular, this study also discusses the impact of meteorological parameters and aerosol loading on the structure and precipitation of DCSs. The paper is structured as follows: Sect. 2 outlines the data and methodology. Section 3 presents the results on the structure, radiative effects, and precipitation of the DCSs in different regions, as well as the influence of meteorological parameters and aerosol loading on them. Finally, Sect. 4 concludes this study and suggests ideas for further research.
In this study, the DCSs are identified based on CALIPSO and CloudSat datasets (2B-CLDCLASS-lidar) from 2006 to 2019 over the Tibetan Plateau (TP; 30–37° N, 78–103° E; Fig. 1) and the tropical Indian Ocean (TO; 0–7° N, 68–93° E). The two regions are roughly the same size. Moreover, the radiative effects and precipitation characteristics of DCSs and the influence of meteorology and aerosols are also explored using some auxiliary datasets (e.g., reanalysis datasets). Information of all the datasets and parameters involved is summarized in Table 1.
Table 1The temporal coverage and resolution of datasets used in this study.
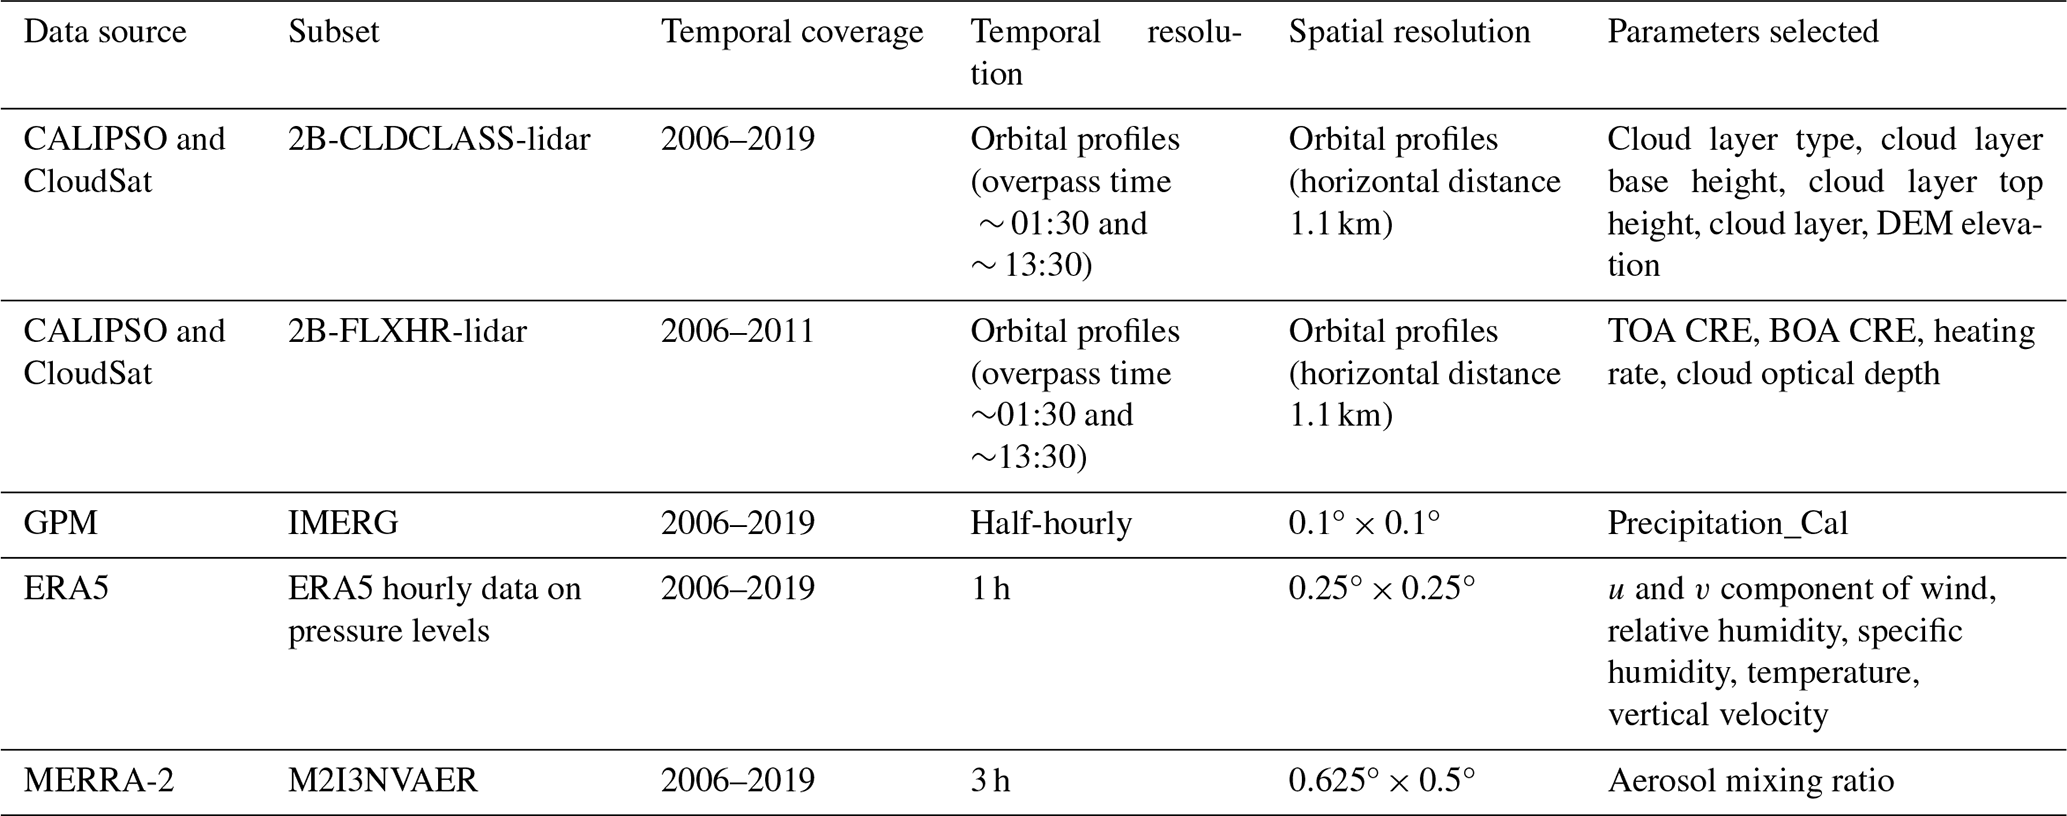
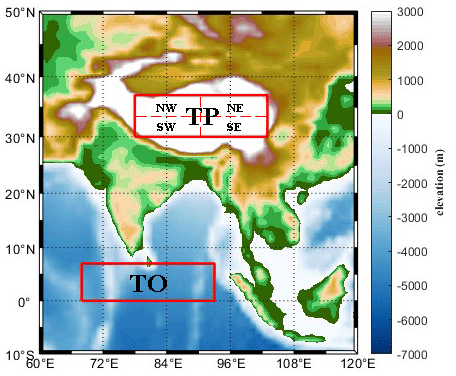
Figure 1The geographical location of the TP (30–37° N, 78–103° E) and TO (0–7° N, 68–93° E) regions for this study.
2.1 Satellite products
The DCSs are identified using 2B-CLDCLASS-lidar, which combines measurements from CloudSat's Cloud Profiling Radar (CPR) and Cloud Aerosol Lidar with Orthogonal Polarization (CALIOP) on board CALIPSO to classify clouds into eight types, including deep convective (cumulonimbus), cumulus, and high cloud (cirrus, cirrocumulus, and cirrostratus). This is due to the fact that CPR can penetrate the optically thick cloud layer to explore its internal structure, while lidar is more sensitive to optically thin cloud layers. As a result, the product provides a more complete cloud vertical structure by leveraging the respective advantages of lidar and radar (Wang, 2019). The 2B-CLDCLASS-lidar product is capable of identifying DCSs with both thick DCCs and thin anvils. Regrettably, due to the switch to Daylight-Only Operations (DO-Op) of CloudSat (Witkowski et al., 2018), the 2B-CLDCLASS-lidar data are only available at ∼ 01:30 and 13:30 local time from 2006 to 2011 and solely ∼ 13:30 from 2012 to 2019. Consequently, this study does not analyse the discrepancies between DCSs during the day and night.
2B-FLXHR-lidar, which inputs the CloudSat and CALIPSO cloud mask and lidar-based aerosol retrievals to a broadband radiative transfer model in order to provide the radiative fluxes and atmospheric heating rates profiles (Henderson and L'Ecuyer, 2020), is used to analyse the CRE and heating rates of DCCs and DCSs in this study. It is important to note that all CloudSat data since the switch to DO-Op in late 2011 have been daytime-only (at ∼ 13:30) (Witkowski et al., 2018). For the analysis of radiative effects of DCSs, we have selected the time period from 2006 to 2011, which coincides with the availability period of 2B-FLXHR-lidar. This reduces the sample size, but it is still adequate to obtain statistically significant results to some extent (sample size of DCSs: TP – 116 and TO – 623). Only daytime data (∼ 13:30) are utilized for the analysis of the shortwave CRE and heating rates, while the longwave CRE and heating rates are derived from ∼ 01:30 and ∼ 13:30 measurements. It should be noted that the ∼ 13:30 overpass time is close to the diurnal peak of insolation. Therefore, the shortwave CRE would be much more enhanced at 13:30 compared to the rest of the day. To exclude the influence of other cloud systems that overlap with deep convective systems, we have only considered the CRE and heating rates of single-layer cloud profiles. In other words, if a DCS includes multi-layer cloud profiles, then in calculating its CRE, we average only the CRE of the single-layer cloud profiles it contains and ignore the CRE of the multi-layer cloud profiles (the results of this DCS are not excluded). Only the results from Sect. 3.2 on the CRE and heating rates exclude multi-layer cloud profiles, whereas the results in other sections do not involve this treatment, as the influence of multi-layer cloud profiles is less significant. The cloud radiative heating (CRH) is defined as the heating rate difference between the all-sky and clear-sky profiles. The column integral of cloud heating rates is comparable to the CRE in the atmosphere (ATMCRE), and 1 W m−2 per 100 hPa of the ATMCRE corresponds to about 0.085 K d−1 of the CRH (Yan et al., 2016). Here, it is worth noting that due to the limited sample size of the radiation data, the radiative effects of DCSs are only analysed in terms of their characteristics, and the factors influencing them are not investigated further. In addition, the cloud optical depth used in the analysis of the shortwave CRE is also obtained from 2B-FLXHR-LIDAR. In this study, the identification of DCSs and their radiative effects is based on the instantaneous and twice-daily measurements from CloudSat and CALIPSO, which do not capture the full diurnal cycle. For this reason, our results must be considered cautiously in the sense of climatology.
The precipitation of DCSs is derived from the GPM_3IMERGHH product of the Integrated Multi-satellitE Retrievals for GPM (IMERG) Level-3 final run. This product merges precipitation estimates from various precipitation-relevant satellite passive microwave (PMW) sensors comprising the GPM constellation into half-hourly and 0.1° × 0.1° (roughly 10 × 10 km) fields (Huffman et al., 2019). In the precipitation evaluation over the Beijiang River basin of China, the IMERG final run shows a high correlation coefficient (0.63) and a low relative bias (0.92 %) with ground observations (Wang et al., 2017). Due to high spatial and temporal resolution, this precipitation dataset has obvious advantages in accurate matching with DCC samples recognized by 2B-CLDCLASS-lidar. It provides us with confidence to analyse the relationship between precipitation features of DCCs and meteorology. In addition, this study only analyses precipitation grids (precipitation > 0) that are spatially closest to DCC profiles and temporally closest to the detected time of each DCC. The mean precipitation is obtained by averaging these grids to match each DCC.
2.2 Reanalysis datasets
ERA5 is the fifth generation of ECMWF reanalysis for global climate and weather data from the past 8 decades. The data are available from 1940 onwards. Reanalysis combines model data with observations from around the world using the laws of physics to create a globally complete and consistent dataset. It optimally combines previous forecasts with the most recent observations to produce new best estimates of atmospheric conditions (Hersbach et al., 2020). Compared to ERA-Interim, ERA5 offers superior spatial and temporal resolution, as well as improved consistency between forecast models and observations (Hoffmann et al., 2019). ERA5 reanalysis is frequently employed in cloud and precipitation research, particularly in areas where ground-based observations are unavailable, such as the TP (Chen et al., 2020). Han et al. (2021) found in the evaluation of meteorological parameters derived from ERA5, based on radiosonde measurements on the Tibetan Plateau, that ERA5 data have good reliability for atmospheric parameters in the free atmosphere. The bias and root mean square error (RMSE) for temperature are generally less than 1.2 K, and for wind speed, the bias and RMSE are generally less than 2 m s−1. In this study, the ERA5 hourly data on 37 pressure levels from 1000 to 1 hPa with a resolution of 0.25° × 0.25° are used to provide the meteorological fields of DCSs (e.g. u and v component of wind, relative humidity, specific humidity, temperature, and vertical velocity). The calculation methods of meteorological factors are detailed in Sect. 2.4.2, while the relationship between meteorological factors and precipitation characteristics of DCSs is discussed in Sect. 3.3.
The 3-hourly aerosol reanalysis datasets (M2I3NVAER) derived from the Modern-Era Retrospective analysis for Research and Applications Version 2 (MERRA-2) with a spatial resolution of 0.625° × 0.5° (longitude × latitude) are used to demonstrate the impact of aerosol loading on DCSs. MERRA-2 is the latest atmospheric reanalysis of the modern satellite era produced by NASA's Global Modeling and Assimilation Office (GMAO). It combines recent measurements of atmospheric states and remotely sensed aerosol optical depths to provide the aerosol reanalysis (Buchard et al., 2015; Molod et al., 2015; Randles et al., 2016; Gelaro et al., 2017). It has been widely evaluated and used to study the interaction between aerosol and cloud (Douglas and L'Ecuyer, 2020). Xu et al. (2020) found that MERRA-2 aerosol properties are consistent with the Aerosol Robotic Network (AERONET) and Multi-angle Imaging SpectroRadiometer (MISR) over the Tibetan Plateau. The correlation coefficients are 0.73–0.88 and 0.94, respectively. M2I3NVAER provides assimilations of aerosol mixing ratio parameters at 72 model layers from 985 to 0.01 hPa. The parameters include dust, sulfur dioxide, sulfate aerosol, sea salt, hydrophilic black carbon, and hydrophilic organic carbon. Fine aerosols with a radius of less than 1 µm are the best proxy for cloud condensation nuclei (CCN) from MERRA-2 (Pan et al., 2021). They are also the best proxy for describing the aerosol invigoration on deep convection when compared to aerosol optical depth and coarse aerosols (Pan et al., 2021). The study uses the mass concentrations of fine aerosols with a radius < 1 µm under cloud base as a proxy for aerosol loading. The mass concentration of fine aerosols at all grids where each DCC is located is averaged to match each DCS, including the corresponding DCC. It is important to note that the aerosol information is selected from the first hour without precipitation before the DCSs are detected on the same day, as wet deposition processes can influence the results. The aim is to clarify the role of aerosols in the development and precipitation of DCSs.
2.3 Method
2.3.1 Identification of DCSs
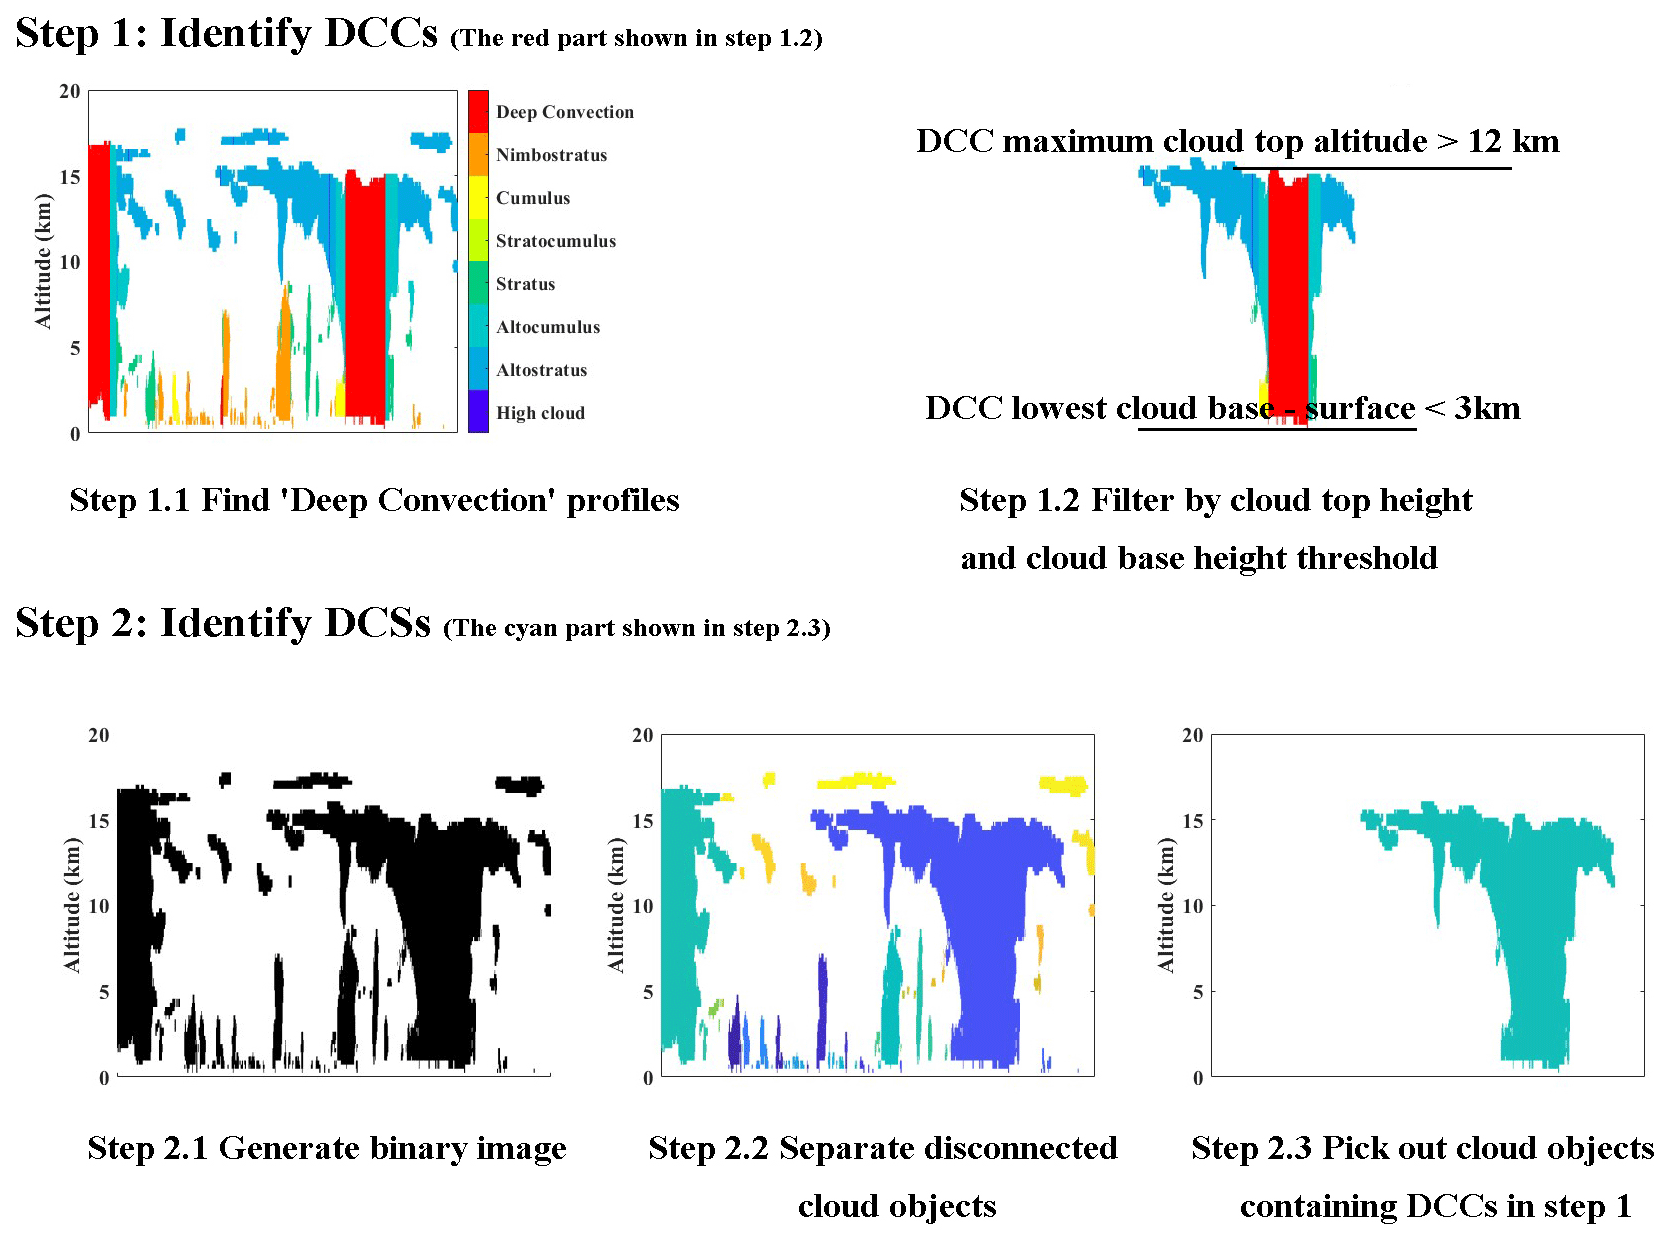
The DCS comprises two components: the DCC and anvil clouds that are connected to it. It is important to note that, unlike previous studies that focused on multiple profiles identified as DCSs and/or DCCs (Peng et al., 2014; Zhang et al., 2022), in this study, one DCS refers to the collection of spatially continuous cloud profiles. Here, DCCs are defined as adjacent profiles that contain cloud layers classified as a “deep convective” type in 2B-CLDCLASS-lidar. To ensure accuracy, only samples that meet the following two criteria, as per the methods of Luo et al. (2011), are retained, thereby excluding the influence of broken deep convection or cumulus on the results. The criteria for identifying deep convective clouds (DCC) are as follows: (1) the distance between the lowest cloud base of DCC and the ground or sea surface is less than 3 km, and (2) the maximum cloud top height of DCC is more than 12 km above the mean sea level.
Once the DCCs have been identified using the methods described above, the DCSs containing the corresponding DCCs can be identified based on the cloud top and base heights of the adjacent profiles. To achieve this, each vertical profile is divided into height bins at 240 m intervals, which corresponds to the vertical resolution of the CPR. The cloud top and base heights from 2B-CLDCLASS-lidar are then used to determine whether each bin is cloudy. The binary image is composed of adjacent profiles with cloudy pixels (assigned to 1) and clear pixels (assigned to 0). The “bwboundaries” function (provided by MATLAB) is then used to trace the boundaries of the binary image and separate and identify disconnected cloud objects. The cloud objects containing the DCCs picked out in the previous step are defined as the DCSs in this study. The anvil in this paper is defined as the part of the DCSs other than DCCs.
Figure 2 shows the example of DCS and flow chart for identifying DCCs and DCSs. The width of the DCSs and DCCs is calculated by multiplying the number of profiles by 1.1 km (horizontal spacing of adjacent profiles), and the thickness is calculated as the difference between the maximum cloud top height and the minimum cloud base height of the DCCs.
2.3.2 Calculation of meteorological factors
Previous studies have pointed out that the wind shear plays a significant role in developing DCSs (Fan et al., 2009). In this study, we investigate the relationship between the u and v components of wind, vertical velocity, and the development of DCSs using hourly ERA5 data on pressure levels with a horizontal resolution of 0.25° × 0.25° (Hersbach et al., 2019). Following the methodology of Di Giuseppe and Tompkins (2015) and Li et al. (2018), the u and v components of the wind are projected onto the CloudSat overpass track to obtain the scene-averaged, along-track horizontal wind V. The wind shear ()) between any two atmospheric layers i and j may be expressed as
where Vi and Vj are the horizontal winds at layers i and j, respectively, and Di,j is the layer separation distance. The layers i and j are determined by the maximum and minimum heights where the first profile and the last profile of DCSs are located. This method of representing wind shear using the absolute value of the wind speed difference was commonly used in previous studies (e.g., Sherwood and Wahrlich, 1999; Naud et al., 2008).
The vertical gradient of the saturated equivalent potential temperature (), which is diagnostic of the degree of atmospheric instability to moist convection (Naud et al., 2008), is a measure of the potential for cumulonimbus convection from a lapse-rate stability viewpoint (McDonnell and Holbrook, 2004). The impact of atmospheric instability of moist convection on a cloud spatial scale has been demonstrated (Mieslinger et al., 2019). Following the approach by Naud et al. (2008) and Li et al. (2018), we compute between the layers i and j, as described in the wind shear calculations.
where θ is the potential temperature, Lv is the latent heat of vaporization, rs is the saturation mixing ratio, Cp is the specific heat capacity at a constant pressure, and T is the atmospheric temperature. The larger the , the more stable the atmosphere.
Previous studies have indicated that vertical velocity plays a crucial role in the development and precipitation of DCSs (Khain et al., 2005; Xiao et al., 2023). To analyse the impact of high-level vertical motion on DCS development and precipitation, we extracted the vertical velocity at 500 hPa in the TO region from ERA5, as suggested by J. Li et al. (2017) and Zhang et al. (2022). The study by Zhang et al. (2020) suggests using the vertical velocity at 250 hPa as a proxy for high-level vertical motion in the TP region due to its high-altitude surface and distribution of vertical winds.
Wind shear and , which are linked to the horizontal development of DCSs, are averaged at all grids where each DCS is located. The vertical velocity is averaged at the grid points where the DCC is located. Considering the delayed impact of meteorological factors, the meteorological factor data in the hour before the DCS is detected are used for correlation analyses. This matching method is commonly used in studies analysing the impact of thermal and dynamic factors on clouds and precipitation (e.g., Sun et al., 2023). We estimated the movement distance of DCS (approximated by the horizontal wind speed at 700 hPa, referring to Sherwood and Wahrlich, 1999), finding that most samples (taking the DCSs in the TO as an example, the proportion is 88.3 %) move within 1 h without leaving their grid point or only moving to adjacent grid points. Therefore, selecting meteorological data from 1 h prior is reasonable. This study discusses the relationship between meteorological factors and aerosol–cloud–precipitation interactions. However, it is important to note that the apparent correlations do not necessarily imply causality.
2.3.3 Calculation of tropopause height
Overshooting convection significantly impacts stratospheric water vapour (Jensen et al., 2007). To analyse the proportion of DCSs that penetrate the tropopause in different regions, we first need to calculate the tropopause height using the temperature profiles from ERA5 hourly reanalysis data on pressure levels (Hersbach et al., 2020). The data have been regridded to a regular lat–long grid of 0.25° on 37 vertical levels. The high-spatiotemporal-resolution data enable temperature profiles to be obtained that match the location of the DCCs in the same hour as the convection samples are observed. The reliability of ERA5 data has been verified (Xian and Homeyer, 2019), and it has been confirmed that accurate tropopause heights can be obtained based on ERA5 (Sun et al., 2021). Using the ERA5 temperature profiles that match DCSs (closest to the location and time of DCSs being observed by satellite), we compute the vertical lapse rate profile according to the methods in Reichler et al. (2003). The profile is then interpolated on a 100 m vertical grid. The tropopause height is calculated based on the definition provided by the World Meteorological Organization (WMO, 1957): “(1) The first tropopause is defined as the lowest level at which the lapse rate decreases to 2 K km−1 or less, provided also the average lapse rate between this level and all higher levels within 2 km does not exceed 2 K km−1. (2) If there exists a layer above the first tropopause at which the lapse rate exceeds 3 K km−1 in any altitude range up to 1 km above it, a second tropopause is defined according to the criterion in (1), that this second tropopause may be within or above that 1 km layer.”.
3.1 The vertical structure of DCSs
This study analyses the characteristics of DCSs by focusing on whole cloud clusters, rather than individual profiles or grid boxes as in previous studies (Feng et al., 2011; Peng et al., 2016). Each cloud cluster identified as a DCS is considered one sample. Table 2 shows that there are more DCSs in the TO (977) than in the TP (240), due to differences in moisture and thermal conditions. Peng et al. (2014) found that there are more DCSs located at low latitudes than mid-latitudes, which is consistent with our results. Since the TO is located in the rising branch of the Hadley cell, the large-scale circulation also provides favourable conditions for convection (Bowen, 2011). It should be noted that the TP region is exclusively defined for the central Tibetan Plateau, aiming to minimize the influence of surface gradients on the formation of deep convective clouds (DCSs). Thus, this definition excludes the southern slope of the Tibetan Plateau, where convection occurs frequently. Based on the analysis of daytime (Table S1) and nighttime (Table S2) DCSs from 2006 to 2011 (after 2012, only 13:30 data are available), we found that samples over the TP mostly occur around 13:30 (111 samples), with only a small fraction occurring at night (10 samples). In contrast, over the TO, there are more DCSs that occur at 01:30 (357) compared with 13:30 (285). It should be noted that due to the limitations of sun-synchronous orbit satellite observations, the full diurnal cycle is not available, which may to some extent impact the results. Previous studies found that the occurrence frequency of deep convection reach the daily maximum at around 16:00–18:00 local time over the TP (Devasthale and Fueglistaler, 2010; Xu and Zipser, 2011). It means that CloudSat and CALIPSO overpass miss the peak of the deep convection. Kottayil et al. (2021) found that the diurnal peak time of deep convection occurrence frequency over the Indian Ocean occurs between ∼ 05:00 and ∼ 12:00 LT, and the diurnal amplitude is smaller at sea than over land. Due to the limited number of nighttime samples over the TP, their corresponding statistical results lack representativeness. Therefore, further analysis of diurnal differences in DCS structure is not conducted in this study. Compared to the TP region, the DCSs over the tropical ocean are wider and thicker. The average width and thickness of DCSs over the TO are 637.1 and 14.5 km, respectively. The average horizontal scale of DCSs over the TP region (about 258.8 km) is less than half of those over the TO. Meanwhile, the DCCs over the TP are thinner, measuring 9.8 km. Table 2 and Fig. 3 show that both the convective core and anvil cloud are narrower over the TP. And the proportion of DCC in DCS is greater in the TP region at 17.2 %. According to Fig. 3, the width of DCCs and DCSs in the TP is mostly concentrated at 10 and 100 km, respectively, while TO exhibits greater inter-sample variation in width with a wider range. The differences in deep convective features between the TP and the TO are closely linked to their unique local environment and terrain. The TP region is influenced by westerlies and the Indian monsoon, as well as local recycling, which involves evaporation, convection, and droplet re-evaporation (Yao et al., 2013). The lower height of the level of neutral buoyancy, the convective available potential energy, and the total precipitable water in the TP restrict the development of DCSs (Luo et al., 2011). Furthermore, the moisture supply in the TP is limited by topography, resulting in a compressibility effect that reduces the cloud thickness of DCSs. Compared with TO, the proportion of DCCs (DCSs) penetrating the tropopause is less over the TP at around 18.3 % (28.8 %). Even so, previous studies have found that deep convection over the TP contributes more to the transport of pollution to the stratosphere through the Asian summer monsoon circulation than deep convection in the tropics (Randel et al., 2010). They found that pollutants have a strong sink from contact with the ocean. Despite strong transport through tropical pipes, biomass burning pollutants originate more from the surrounding area of the TP, for example, India. Therefore, it is important to pay particular attention to overshooting convection on the TP. In the tropics, numerous studies have shown that DCSs are most commonly observed over this region (Sassen et al., 2009; Savtchenko, 2009). The main factor contributing to the generation of DCSs is convective instability caused by radiative heating (Peng et al., 2014). Despite the challenges posed by the higher tropopause height at lower latitudes, up to 38.1 % of DCSs in the TO region can penetrate the tropopause (as shown in Table 2). Furthermore, studies have indicated that if the tropical tropopause layer is initially supersaturated with respect to ice, the DCSs that penetrate the tropopause will reduce the humidity. This is due to the excess vapour condensing on the ice crystals (Jensen et al., 2007).
Table 2The spatial statistics of DCSs in different subregions. The definition of different parts of the TP are as follows: TP (NW) (33.5–37° N, 78–90.5° E), TP (NE) (33.5–37° N, 90.5–103° E), TP (SW) (30–33.5° N, 78–90.5° E), and TP (SE) (30–33.5° N, 90.5–103° E). SD is an abbreviation for standard deviation.
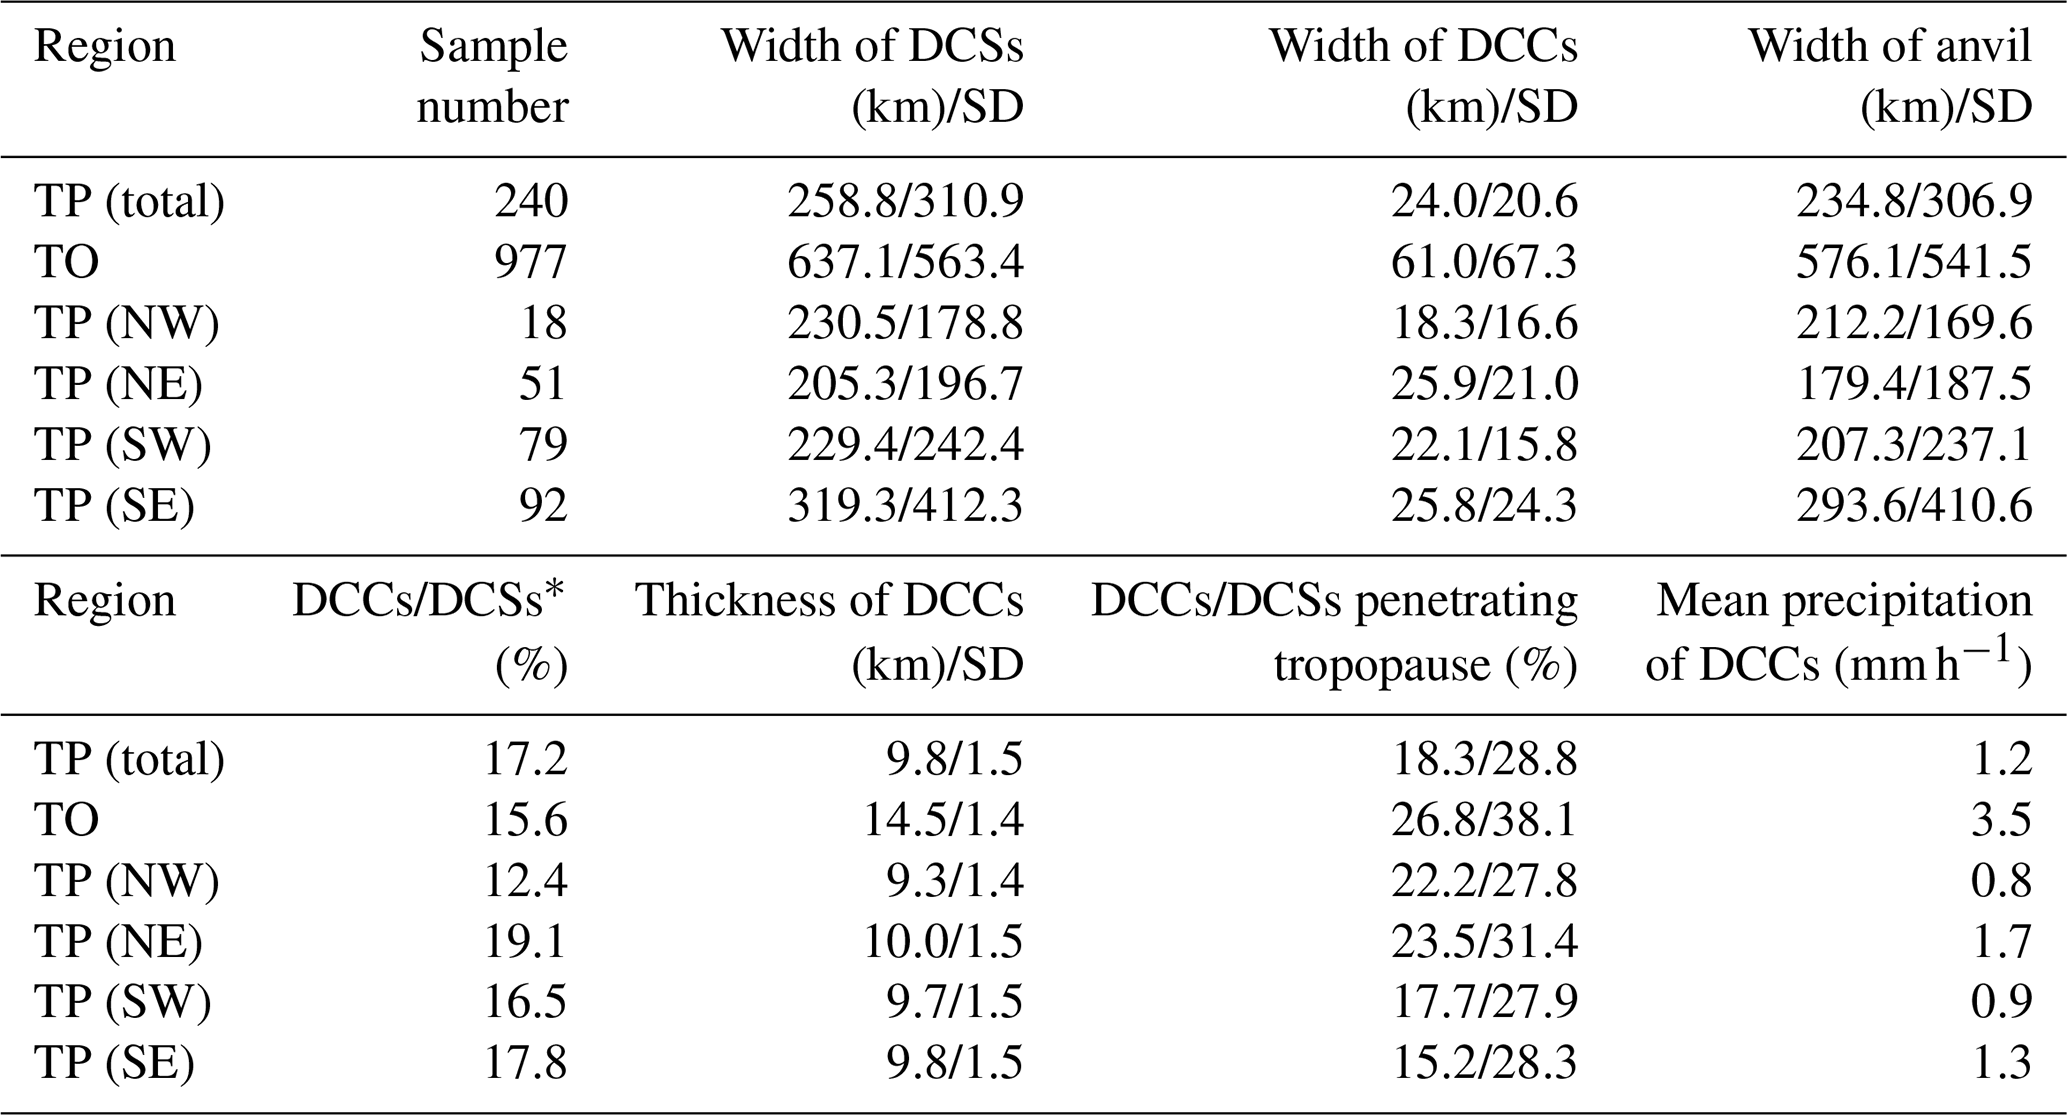
* The average of the ratio of the width of DCC in each DCS.
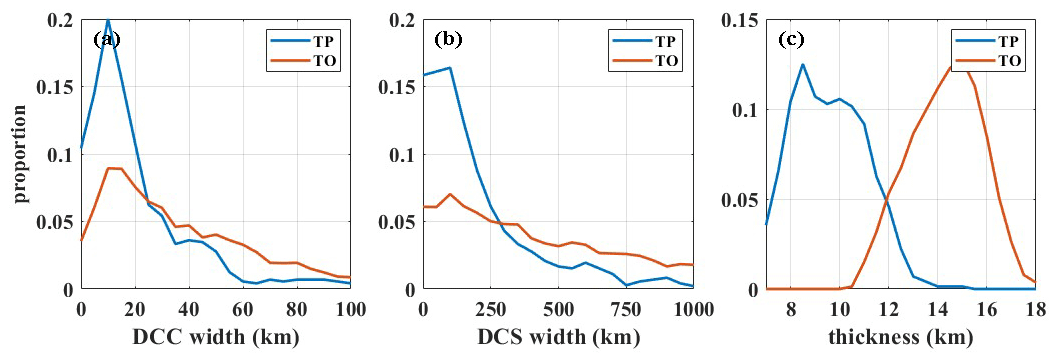
Figure 3The proportion of each bin of the width of DCCs (a), the width of DCSs (b), and the thickness of DCCs (c) in the total sample of TP, and TO.
To investigate the internal differences of the TP further, we divided it into four subregions using the coordinates 33.5° N, 90.5° E. According to Table 2, DCSs are mainly observed in the southern TP, which accounts for 71 % of the total samples. This is due to the more significant influence of the Indian monsoon on the southern TP, which releases large amounts of latent heat and abundant moisture during summer (Jiang et al., 2016; Zhang et al., 2017). The southeastern TP had the largest number of samples (92) and widest DCSs (319.3 km), with the widest anvil (293.6 km). The southwestern TP had the second-most DCSs (79), likely due to up-and-over convective storms and upslope moisture transport from the Indian subcontinent (Dong et al., 2016). In contrast, fewer DCSs form in the northwestern TP, and they are also thinner, with narrower anvils and convective cores. Warm and moist air from the Indian Ocean and nearby areas can promote convection over the southern TP, but it is difficult to transfer it to the northern TP (Xu et al., 2003). The evidence of lower specific humidity and vertical velocity in the northern TP (Zhang et al., 2020) also shows the difficulty in the development of DCSs.
Figure 4 shows the seasonal sample number, width, and thickness of DCSs in different seasons. It is worth noting that there are too few samples in spring to be representative, and therefore these DCSs will not be analysed. The TP region experiences significant seasonal differences in cloud development, which is affected by the Indian monsoon (Yao et al., 2012). In summer, the TP continuously attracts moist air from the low-latitude ocean (Xu et al., 2008), acting as a strong “dynamic pump” (Wu and Zhang, 1998). The lower branch of atmospheric flows packed with these moisture (Bai and Xu, 2004) rises along the south side of the plateau and causes frequent convections and precipitations (Xu et al., 2003). As shown in Fig. 4a, b, and c, the DCSs are most frequent, widest, and thickest during the summer. The average width and thickness of DCSs over the TP region during a summer season are around 266 and 9.9 km, respectively. Additionally, DCS development is significantly more dominant in the summer than in other seasons for each subregion of the TP region (see Fig. 4d, e, f). Figure 4e shows that the DCSs are most vigorously developed in the southeastern TP. This phenomenon is due to the abundance of water vapour (Zhou et al., 2012) and the favourable dynamic and thermal conditions for convection in the southeastern TP in summer. Under the control of a high-pressure system (Zhang et al., 1997), however, there is no deep convective system (DCS) over the TP during winter. In comparison to the TP, which is impacted by monsoons, the thickness of DCSs over the TO does not vary much by season. Summer convection in the tropical oceans is the least abundant (Fig. 4a) but the most horizontally extensive, with an average width of 811 km (Fig. 4b). The thickness of DCSs remains consistent throughout the seasons, at approximately 14.5 km (Fig. 4c).
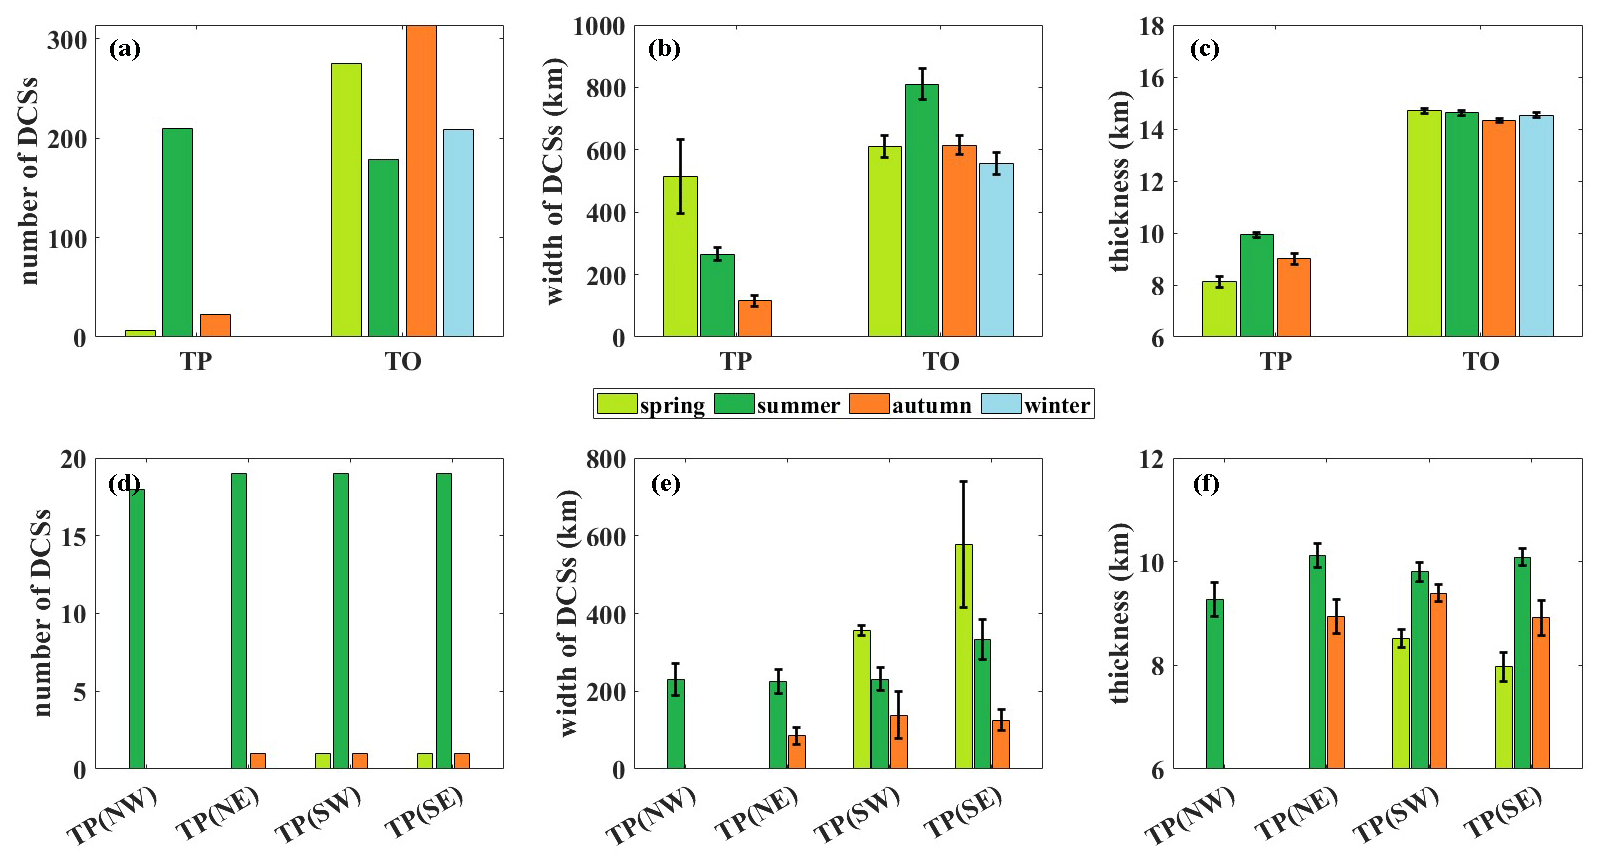
Figure 4The sample number (a, d), the width (km) (b, e), and the thickness (km) (c, f) of DCSs in different regions in different seasons (in the boreal hemisphere). The error bars represent the standard error for the sample mean (SEM; SEM = standard deviation , where n is the sample number).
3.2 Cloud radiative effects of DCSs
DCSs have a significant impact on the radiative flux in and out of the Earth–atmosphere system. Additionally, deep convection plays a crucial role in the atmosphere's interior. For instance, convective cloud top radiative cooling can promote cirrus formation in the tropopause transition layer (Sassen et al., 2009). DCSs are not comprised of a single uniform cloud type. Therefore, anvils and convective cores with different cloud characteristics have varying cloud radiative effects (Feng et al., 2011; Hartmann et al., 2001). For example, the outgoing longwave irradiances are higher for anvil clouds than for convective cores, while the reflected shortwave flux is greater for convective cores (Feng et al., 2011). Table 3 displays the average net cloud radiative effect (NCRE) of DCSs, DCCs, and anvils from different regions. The probability density distribution of the NCRE for different regions is also shown in Fig. 5. Table S3 presents both the shortwave (SW) and longwave (LW) CREs. To exclude the effects of other cloud systems, only the CRE of single-layer cloud profiles in DCSs is considered in this section. As the radiation data are only available for nearly 5 years, the sample size is reduced compared to Sect. 3.1. More details are provided in Sect. 2.2. Table 3 shows that the DCCs have the largest NCRE absolute value, while the NCRE absolute value of anvils is the smallest, and that of DCSs is the second largest. This indicates that the anvils, with thin optical thickness but high cloud height, partly offsets the strong cooling effect caused by optically thick DCCs in the whole DCSs. Anvil clouds have a limited impact on the reduction of incoming SW radiation, but they can emit LW radiation to some extent (as shown in Table S3). These findings are consistent with the previous study by Feng et al. (2011). Table 3 shows differences between regions, with the DCCs in the TP having the weaker radiative cooling effect, likely due to their thinness compared to other regions. The average net top-of-atmosphere (TOA) and bottom-of-atmosphere (BOA) CREs are −407.3 and −569.7 W m−2, respectively. This results in an average radiative heating of the inner atmosphere of 162.4 W m−2. In contrast, DCCs in the TO have the greatest radiative cooling effect, with a net TOA CRE of −526.5 W m−2 and a net BOA CRE of −703.9 W m−2, resulting in the CRE in the atmosphere (ATM) being 177.4 W m−2. Table S3 shows that the regional differences in the TOA CRE of DCCs are mainly due to differences in SW CRE.
In particular, the LW BOA CRE of DCCs in the TP is significantly greater than that in the TO. This phenomenon was also observed by Yan et al. (2016), who proposed that it may be due to the uplifted topography and associated unique vertical profiles of temperature and water vapour. To identify the cause of the significant LW BOA CRE in the TP, we examined the clear-sky LW flux and the cloudy LW flux at the BOA. The LW CRE was calculated by subtracting the net clear-sky LW flux from the net LW cloudy flux. The findings, as shown in Figs. S1 and S2, indicate that the TP varies from the TO primarily in terms of downward clear-sky LW flux. The lower-humidity atmosphere of the TP is less capable of capturing LW radiation, resulting in a particularly small clear-sky downward LW flux (Yang et al., 2010). This contributes to the more negative net (downward minus upward) clear-sky LW flux in the TP. Although the colder cloud base temperatures at the TP (as shown in Fig. S9) result in a smaller net cloudy LW flux, it does not change the fact that the DCCs in the TP have a larger LW BOA CRE. Also due to the more negative clear-sky LW flux, the DCSs and anvils in the TP have a larger LW BOA CRE than those in the TO (Table S3). The unique topography and water vapour conditions of the TP may make the effect of clouds on radiation more efficient. As explained earlier in this subsection, the difference in the CRE between DCCs and DCSs is due to the effect of anvils. At the TP, where the anvils are narrower, the net TOA CRE of DCSs is −307.2 W m−2, which is 100.1 W m−2 higher than the CRE of DCCs. In contrast, the absolute value of the TOA CRE of DCSs is smaller in the TO region than in the TP, despite the fact that the radiative cooling of DCCs at TOA is stronger in the TO. The TO region has more massively developed DCSs, which also have wider anvils. Thus, in the TO region, the anvils with a larger (absolute minimum) TOA CRE (around −157.4 W m−2) have the more obvious offsetting effect on the NCRE of DCCs. In contrast, in the TP region, where the development of DCSs is relatively less pronounced, the TOA CRE of the anvils is −249.0 W m−2. It should be noted that the relatively thinner anvils in the TP (averaging 4.3 km) result in more radiative cooling compared to the anvils in the TO (averaging 5.5 km). The disparity in the TOA CRE between the anvil clouds in the two regions is mainly due to the fact that the anvils in the TP have a more negative SW CRE (Table S3). Figure S3 shows that in cases with comparable thickness, the SW TOA CRE of anvils in the TP is more negative than that observed in the TO. Luo et al. (2011) found that the DCCs in the TP have more densely packed cloud tops dominated by larger particles, as indicated by the smaller distance between cloud top height and radar echo top (10 dBz) height. This is a common disparity between continental and oceanic deep convection (Liu et al., 2007). To clarify the reasons for the stronger SW radiative cooling of anvils over the TP, we analysed the cloud optical depth of anvils in different regions based on the 2B-FLXHR-lidar dataset. The results (Fig. S4) show that the cloud optical depth of anvils over the TP is larger compared with the TO, though the thickness is thinner. This suggests that anvils over the TP are more densely packed. And for this reason, the anvils in the TP have a more negative SW CRE.
Table 3The mean NCRE of DCSs, DCCs, and anvils in different regions.
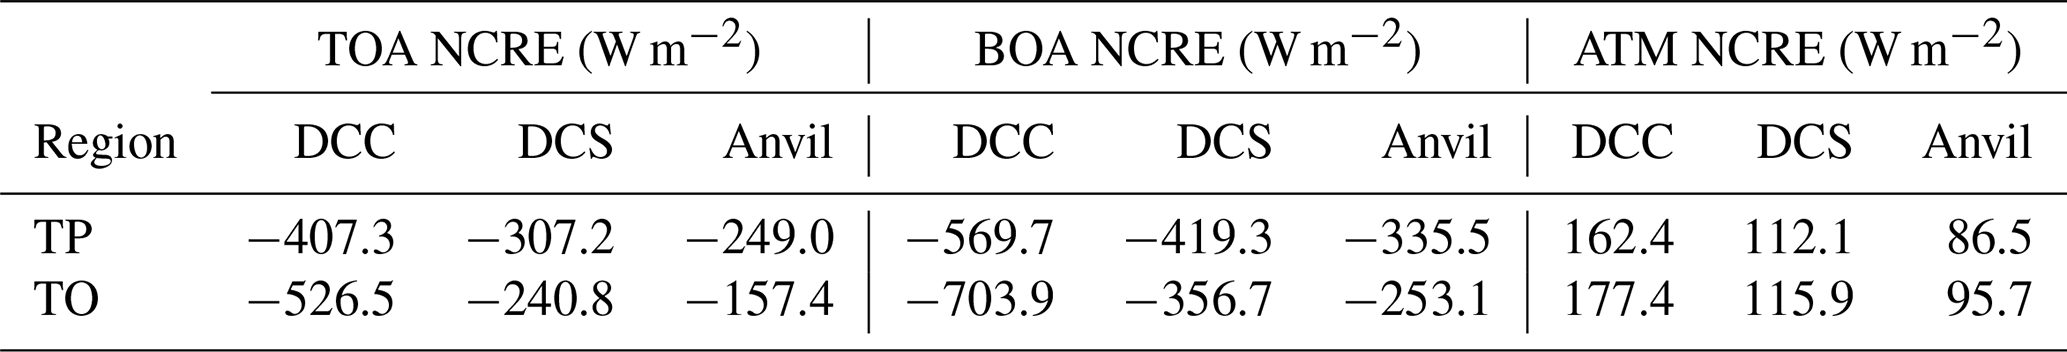
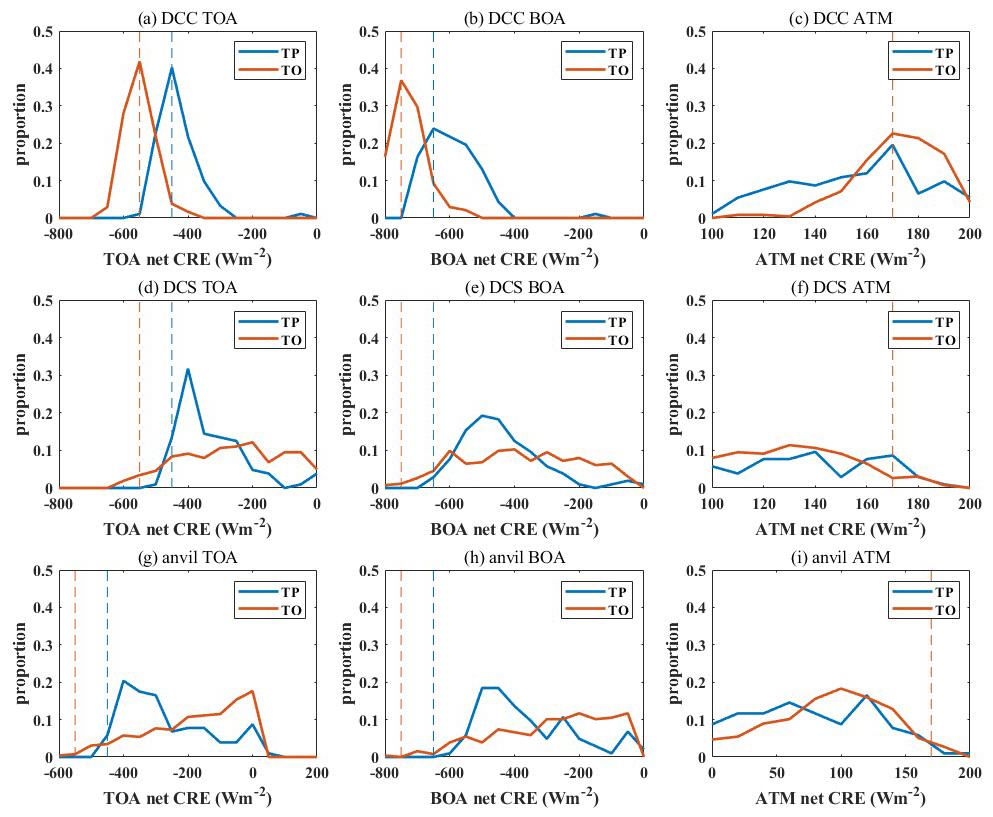
Figure 5The proportion of each bin in the total sample of DCCs, DCSs, and anvils in the TP (blue) and TO (red) of the NCRE at the top of the atmosphere (TOA) (a, d, g), at the bottom of the atmosphere (BOA) (b, e, h), and in the atmosphere (ATM) (c, f, i). The dashed lines show the peak of DCC.
The sample distribution of the CRE for DCSs in different regions is illustrated by the proportion of numbers in each bin to the total sample size (refer to Fig. 5). As illustrated in Fig. 5a, the net TOA CRE of DCCs in the TP is concentrated around −450 W m−2. However, 95 % of the DCCs in the TO have a net TOA CRE of less than −450 W m−2, resulting in a larger radiative cooling effect. As shown in Fig. S5, the SW CRE of DCCs in the TO is much smaller than that in the TP. The reason for this result is that the DCSs in the tropics are thicker and reflect more SW radiation back to TOA. Additionally, the LW CRE of the DCCs in the TO is slightly larger than that in the TP. It was found that the TOA in the tropics receives more LW radiation under clear-sky conditions, while DCCs with higher cloud tops and lower temperatures emit less LW radiation. The larger difference between them results in a greater LW CRE for DCCs in the tropics. The concentration of the TOA SW and LW CRE of DCCs is more pronounced in the TO than in the TP. This is due to the homogeneous subsurface of the TO region and the thickness of the DCSs, which do not exhibit significant seasonal variations. Similarly, for the net BOA CRE in Fig. 5b, DCCs in the TO also exhibit significantly greater radiative cooling, with the NCRE was concentrated around −750 W m−2, with an absolute value 100 W m−2 greater than that in the TP. Figure 5c shows that both the TP's and TO's DCCs have a concentration of the ATM NCRE at 170 W m−2. However, the CRE of DCCs in the TO is larger overall, while that in the TP has a more spread-out distribution. From Fig. S5m, it can be seen that the DCCs in the TO have a lower ATM SW CRE due to stronger reflection of solar radiation with larger thickness. Additionally, the ATM LW CRE of DCCs in the TO is larger due to the higher cloud temperature with lower cloud base. Figure 5d, e, and f display the NCRE of DCSs in various regions, which is more dispersed than that of the DCCs. One possible reason for this is that the structure of the different DCSs varies considerably, particularly in the TO region, which is partially visible in Fig. 3b. The dashed lines indicate the value at which the CRE of DCCs is primarily concentrated. It is evident that the TOA and BOA CREs of DCSs are generally less negative than those of DCCs in both TP and TO. The ATM CRE of DCSs varies greatly between samples in both the TP and the TO and is much lower than that of the DCCs. Figure S5k and l show that the ATM SW and LW CREs of DCSs in both the TP and TO are smaller after adding the anvils into count. Due to anvils being thinner and higher relative to DCCs, anvils reflect less solar radiation and emit less LW radiation. This results in the weaker CRE of DCSs compared to DCCs.
To analyse the ATM CRE further, we calculate the vertical CRH profiles for the DCSs/DCCs. We define the CRH based on the definition of Haynes et al. (2013), which is the difference between the all-sky radiative heating rates and the clear-sky radiative heating rates (CRH = heating rateall−sky – heating rateclear). Radiative heating is an important component of the Earth system's energy budget (Stephens et al., 2012), and clouds play a crucial role in regulating radiative processes (Slingo and Slingo, 1988, 1991). Passive sensors struggle to identify vertical boundaries of clouds, resulting in a poorly resolved vertical profile of global radiative heating (Mace, 2010; Haynes et al., 2011). However, active sensors such as the CPR on board CloudSat and CALIOP on board CALIPSO can provide a more accurate vertical gradient of the CRH (Henderson et al., 2013) and a near-global view of the tops and bases of most radiatively active clouds. Currently, vertical CRH profiles are commonly used to analyse the cloud radiative effects on the atmosphere (Lv et al., 2015; Yan et al., 2016; Pan et al., 2020; Zhao et al., 2024). In fact, the CRH (in K d−1) is equivalent to the ATM CRE per unit mass (in W m−2 (100 hPa)−1) (Yan et al., 2016). Figure 6 displays the averaged vertical profiles of the CRH in various regions. As only sufficient deep convection was identified (cloud top heights above 12 km above sea level and cloud base heights within 3 km of the ground; see Sect. 2.4.1 for identification methods), the cloud top height of DCSs in the TP and TO did not differ significantly, and the patterns of CRHs in different regions were generally consistent. Figure 6a and d demonstrate that the negative LW CRH peak is at 14 km for both TP and TO, with similar DCC LW CRH values of −6.0 and −5.7 K d−1, respectively. The radiative flux exchange between the atmosphere above the cloud and the cloud top causes the LW CRH near the cloud top to be negative. For DCCs, the LW CRH is positive below 10 km. This is due to enhanced infrared cloud radiative warming by upper-level cloud tops, which prevent LW radiation from escaping to space while radiating towards the surface (Haynes et al., 2013). Near the surface, there is stronger radiative heating, which is due to the radiative heating of the cloud base. This peak of the LW CRH near the surface is more distinct in the TP compared with the TO, due to the colder boundary layer emitting less upwelling LW radiation in the TP (Haynes et al., 2013). Note that the TP has a significant topographical gradient, resulting in fewer samples from height bins below 5.5 km and a larger standard deviation. To ensure the representativeness of the results, the results below 4.56 km (total sample size less than 50) are not shown in Fig. 6. The CRH is calculated as the all-sky heating rates minus clear-sky heating rates. Therefore, the reasons for the high CRH value can be analysed through the results of heating rates under all-sky and clear-sky conditions. Under all-sky conditions, the LW heating rate of the boundary layer is significantly greater in the TP than in the TO (refer to Fig. S6b and d). This is due to the fact that the cold boundary in the TP can only emit a small amount of upwelling LW radiation, which is less than the infrared radiation from the cloud above, resulting in a large peak of the all-sky heating rates. In clear-sky conditions (refer to Fig. S7b and d), the LW cooling primarily results from the emission of water vapour, which occurs throughout much of the troposphere and decrease above 10 km in both regions mainly due to the decrease in saturation water vapour pressure with decreasing temperature (Hartmann et al., 2001). The less LW cooling in the low-level atmosphere of the TP is likely attributed to the lower surface temperature and water vapour in the TP (McFarlane et al., 2007). Combined with the greater LW heating under all-sky conditions and less LW cooling under clear-sky conditions, which is the difference between the two conditions, the LW CRH appears to be large near the surface of the TP. The DCSs have a smaller average thickness and lower cloud top, resulting in less LW radiative cooling near the cloud tops and less LW radiative heating in the low level. There are two peaks of the LW CRH of DCSs in the TP at 8 and 14 km. In the TO, the LW CRH of DCSs only peaks at 14 km. The distribution of the LW CRH of DCSs is associated with the difference in cloud tops between the two regions. We checked the sample distribution of cloud top heights for DCSs in both regions and found the same peaks.
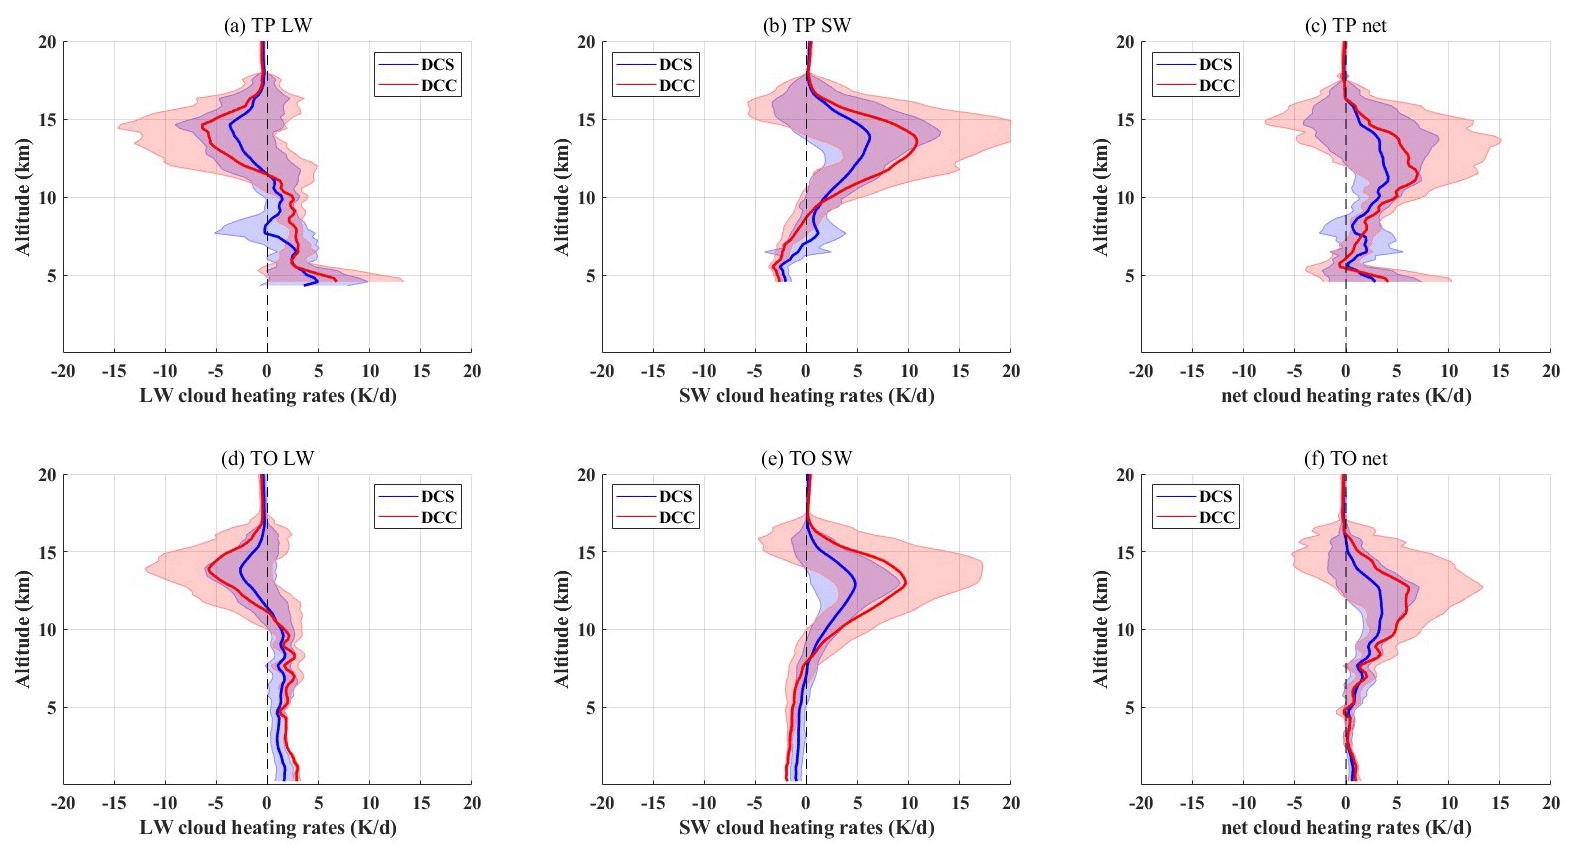
Figure 6The mean vertical profiles of longwave (a, d), shortwave (b, e), and net (c, f) cloud radiative heating (CRH) rates (K d−1) in the TP and TO. The red lines represent the results of DCCs, and the blue lines represent the results of DCSs. The shading range represents the standard deviation.
As shown in Fig. 6b and e, the peak of the SW CRH is also near the cloud tops at 13 km of 10 K d−1 of DCCs. The cloud tops absorb SW radiation and tend to reduce SW absorption by the underlying atmosphere by reflection (Haynes et al., 2013; Pan et al., 2018), resulting in a maximum SW CRH in the upper troposphere and a small SW CRH in the lower troposphere. The DCCs in the TP and TO show similar SW heating rates for all-sky conditions, except that the peak in the TP is slightly larger (Fig. S6). The clear-sky SW heating rates are larger in the TP despite having less water vapour and oxygen to absorb SW radiation. The reason for this is that vast majority of TP's DCSs are observed in summer, when the solar zenith angle is low, with more opportunity to absorb SW radiation. But there is no significant seasonal difference in the number of DCSs in the TO compared with the TP. Also, due to this reason, the SW CRH is smaller at lower levels. Similar to the results for the LW CRH, the absolute value of the SW CRH for DCSs is smaller than that for DCCs when averaged with thinner anvils. Additionally, the second peak of the SW CRH for DCSs in the TP is related to the second peak of frequency of the DCSs' cloud top heights.
Combining LW and SW CRHs, the net CRH exhibits significant radiative heating in the upper troposphere (Fig. 6c, f). This heating is more pronounced for DCCs than DCSs. The radiative heating caused by DCSs has great influence on large-scale circulation variations, and the column-integrated radiative heating of upper-level clouds in the tropics accounts for approximately 20 % of the latent heating (Li et al., 2013). Fueglistaler and Fu (2006) proposed that the spatial gradients in radiative heating rates, caused by the seasonal and spatial differences of tropical convection and associated high cloud coverage, may be partially responsible for stratospheric mixing. Since the development of DCSs is forced by the high terrain of the TP (Fu et al., 2008, 2017), both the LW heating layer and the SW cooling layer are shallower for TP DCSs. The maximum net CRH of DCCs in the TP is 7 K d−1 at 11.3 km, and in the TO it is 6 K d−1 at 12.7 km. The net CRH of the DCCs is larger in the TP than in the TO in the low-level atmosphere due to the large LW radiative heating of the boundary layer by DCCs. The CRH of DCSs has similar features to that of DCCs, but the regional differences are smaller. The differences between the CRH of DCSs and DCCs are primarily attributed to anvil clouds, making them predominantly evident in the upper atmosphere.
3.3 The effect of meteorological factors and aerosols on the development and precipitation of DCSs
3.3.1 The effect of aerosols and meteorological factors on the development of DCSs
Previous studies have demonstrated that various meteorological factors significantly impact the development of DCSs. For example, using a three-dimensional numerical cloud model, Weisman and Klemp (1982) find that for a given amount of buoyancy, higher wind shear leads to more conducive supercell formation. Atmospheric instability, which affects the entrainment drying and warming, has been found to be associated with cloud size in the observations (Mieslinger et al., 2019). In addition, previous studies have found that vertical velocity is a significant factor in the development of deep convection (Khain et al., 2005; Koren et al., 2010; Jiang et al., 2018). In addition to meteorological factors, aerosols can also have a critical impact on clouds (Peng et al., 2016; R. Li et al., 2017; Pan et al., 2021; Xiao et al., 2023). However, the impact of aerosols on DCSs remains poorly understood due to limited observations and complex mechanisms involved. The effects of aerosols and meteorological factors on clouds are coupled, posing challenges for the study of aerosol–cloud interactions. Based on a cloud-resolving model, Fan et al. (2009) find that wind shear qualitatively determines whether aerosols inhibit or enhance DCSs' strength; i.e., aerosols promote convection under weak wind shear, while the opposite occurs under strong wind shear. Xiao et al. (2023) discovered that the net latent heat released by microphysical processes in aerosol–cloud interaction can increase the vertical velocity and facilitate the development of the DCSs. Through partial correlation analysis, Jiang et al. (2018) find that the qualitative effects of aerosols and meteorological factors on deep convection had regional differences. That is, in some cases, aerosols and meteorology affect convection in the same direction, but in other cases they might be opposite.
In this study, we decouple meteorology and aerosol effects by discussing the relationship between meteorological factors and the development of DCSs under different background aerosol concentrations (Fig. 7). Section 2.3 provides details on the selection and matching of aerosol data. The aerosol mass concentration is divided into polluted and clean environments using the 30th and 70th percentiles as thresholds. The impact of meteorological factors on the development of DCSs is illustrated in Fig. S8. The width of DCSs is positively correlated with wind shear in both regions, as shown in Fig. 7a (and Fig. S8a and d). Although the correlation between DCS width and wind shear is not obvious in the TP region under low aerosol loading, this may be due to a limited sample. Alternatively, the development of DCSs on the TP may be somewhat restricted due to a limited amount of CCN and water vapour supply. These results indicate that wind shear qualitatively promotes the horizontal development of DCSs. A previous study has found that wind shear could enhance the tilting of clouds and increase cloud fraction (Neggers et al., 2003). The wind shear can intensify updrafts and make cold pools colder, particularly when the shear direction reverses across the jet level (Robe and Emanuel, 2001). Figure 7b and e (and Fig. S8b and e) show the difference in the horizontal development of DCSs under different conditional stability of moist convection (e.g., ). The results indicate that an increase in z results in a wider DCS width. A larger implies a more stable atmosphere and a stronger inversion near the anvils of DCSs. It has been found that a stronger inversion can reduce entrainment drying and warming, resulting in a moister atmosphere and wider DCSs (Myers and Norris, 2013). The differences in DCS width under two aerosol loading conditions are relatively small (Fig. 7a, b, d, e), suggesting that the influence of meteorological factors on the width of DCSs is possibly dominant. In the TO, the DCSs in polluted environments are partly wider than those in clean environments. This suggests that when aerosols increase, although cloud droplets evaporation and ice crystal sublimation are accelerated due to aerosol semi-direct effects (Rosenfeld et al., 2008), the invigoration of convection by aerosol (Andreae et al., 2004; Khain et al., 2012; Koren et al., 2014) can still lead to an increase in the width of DCSs. It is important to note that this study only analysed aerosols under the base of DCCs, whereas DCSs involve entrainment over a much larger area.
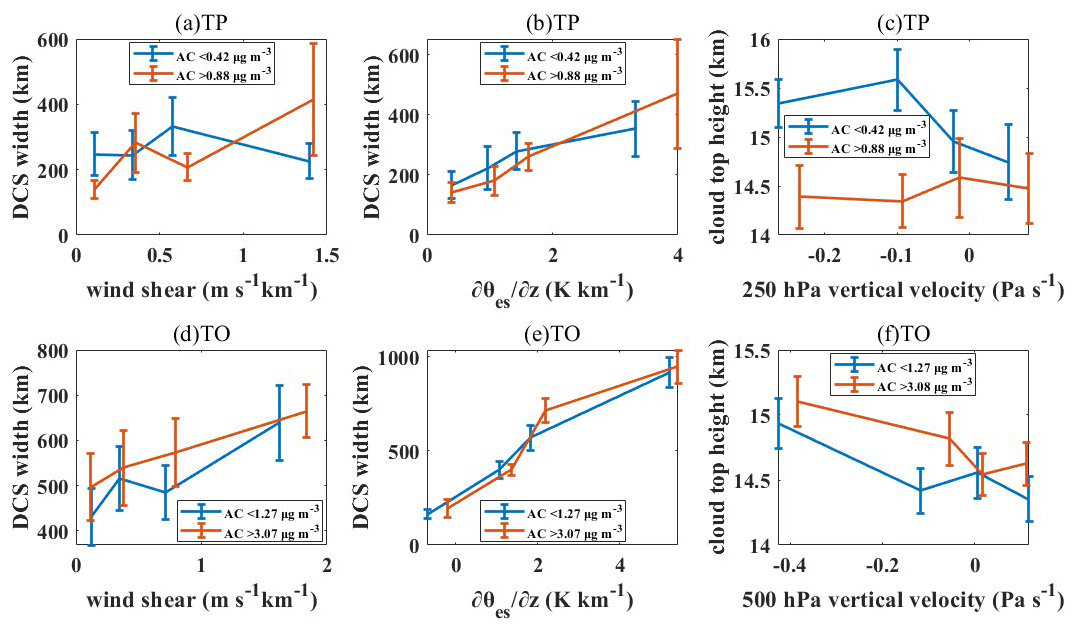
Figure 7Bin-averaged wind shear (m s−1 km−1; a, d), the vertical gradient of the saturated equivalent potential temperature (K km−1; b, e), and vertical velocity (Pa s−1; c, f) with DCS width (km) and cloud top height (km) from different subregions. The blue lines represent the results at weak aerosol loading (less than 30th percentiles), and the red lines represent the results at strong aerosol loading (more than 70th percentiles). The error bars represent the standard error of the mean (SEM = standard error ).
Figure 7c and f illustrate the relationship between vertical velocity and cloud top height in different regions. The negative value of vertical velocity indicates the updraft, while the cloud top height refers to the maximum of cloud top heights for all profiles in each DCC. Previous studies have confirmed that upward velocity contributes to the development of deep convection (Khain et al., 2005; Koren et al., 2010; Jiang et al., 2018). High upward motion results in efficient transport of liquid cloud water to the level of homogeneous nucleation and longer convection lifetime (Ekman et al., 2007). Additionally, homogeneous nucleation is more efficient with high vertical wind speed (Heymsfield et al., 2005), which is closely related to cloud dynamics, precipitation rate and radiative properties. And as a result, more liquid water is converted to ice through homogeneous freezing, promoting deep convection (Ekman et al., 2007). However, the cloud top height does not obviously increase with upward velocity in the TP (Fig. S8c). This suggests that there are factors other than vertical velocity that affect the cloud top height of DCCs in the TP. As shown in Fig. 7c, the correlation between vertical velocity and cloud top height is more obvious under low aerosol loading and there are distinct differences between two aerosol loading conditions. That is, the cloud top height is much higher in clean environments in the TP. We found that the cloud base temperature of DCCs in the TP is much lower than that in the TO (Fig. S9). In the TP, where the average altitude exceeds 3000 m, the cloud base temperature of 44 % of the DCSs is below zero, despite the restriction that the cloud base of DCSs must be no more than 3 km from the surface in the identification. Aerosol microphysical effects that promote the development of convection are primarily effective in warm-base clouds (> 15°C) (Rosenfeld et al., 2008; Li et al., 2011). While the invigoration of aerosol microphysical effects becomes ineffective, aerosol radiative effects also inhibit the development of convection (Jiang et al., 2018). The higher cloud top of DCSs under clear conditions over the TP may be related to the above mechanisms. In the TO, the intensity of ascending motion showed a strong positive correlation with cloud top height (Fig. S8). Higher upward velocity means more efficient transport of cloud water, promoting convection development (Ekman et al., 2007). Different from the TP, the aerosol invigoration effect (Khain et al., 2005; Koren et al., 2010; Jiang et al., 2018) is effective over the TO because the warm-base DCSs dominate in the TO (almost all of over 15°C), resulting in higher cloud tops under higher aerosol loading.
3.3.2 The effect of aerosols and meteorological factors on the precipitation of DCSs
The relationship between precipitation and meteorological factors (i.e., vertical velocity) and fine aerosol concentration is explored (Fig. 8). Section 2.3 provides details on the selection and matching of aerosol data. The average precipitation of different regions is presented in the last column of Table 2. The results show that, due to the limited water vapour and convection intensity, the precipitation of the DCCs is significantly less in the TP (1.2 mm h−1) than in the TO (3.5 mm h−1). Figure 8a and d show the relationship between precipitation and vertical velocity for DCCs in different regions. In all regions, an increase in upward motion velocity corresponds to an increase in DCC precipitation. Higher vertical velocity is more conducive to the transport of larger particles and/or more hydrological material, such as water vapour, into the upper atmosphere, which in turn results in heavier precipitation (Luo et al., 2014).
The aerosol–cloud–precipitation interaction related to deep convection has received much attention in recent years (Tao et al., 2007; Li et al., 2010; Han et al., 2022). Aerosols can inhibit warm-rain processes by reducing the cloud droplet size and causing a narrow droplet spectrum, which inhibits collision and coalescence processes (Squires and Twomey, 1960; Warner and Twomey, 1967; Warner, 1968; Rosenfeld, 1999). This leads to more and smaller cloud droplets being transported to the upper layers to condense, resulting in more latent heat being released. This process is known as the “aerosol invigoration effect” (Andreae et al., 2004; Rosenfeld et al., 2008) and promotes convection and precipitation. Figure 8b and e depict the relationship between aerosol concentration and DCC precipitation in different regions. Figure 8b shows that the aerosol invigoration effect on DCC precipitation is not obvious in the TP. One possible explanation is that the aerosols absorb solar radiation and stabilize the daytime boundary layer, thereby inhibiting precipitation (Koren et al., 2008). Previous studies suggest that this suppression process dominates whether the cloud is above or within the aerosol layer, even though the upper atmosphere can be less stable due to the aerosol heating below (Koren et al., 2008). Additionally, the TP experiences a large number of cold-base DCSs due to its high surface altitude (the cloud base temperature of DCSs in different regions is shown in Fig. S9). As in the theory presented by Rosenfeld et al. (2008), clouds with a cloud top temperature of less than −4°C and cloud base temperature of more than 15°C are considered the most favourable conditions for the aerosol invigoration effect (Li et al., 2011). The precipitation of DCCs in the TP does not show an obvious change with increasing aerosols, probably due to the combination of insufficient aerosol invigoration effects caused by the cold cloud base and inhibition effects from aerosols.
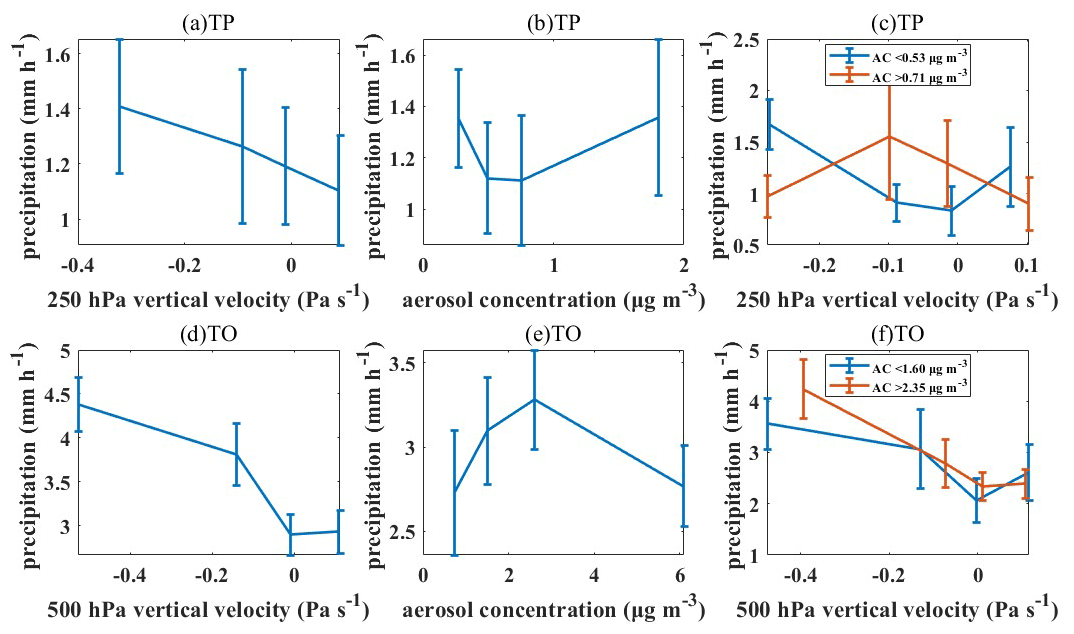
Figure 8Bin-averaged vertical velocity (Pa s−1; a, d) and aerosol concentration (µg m−3; b, e) with precipitation (mm h−1) from different subregions and the relationship between vertical velocity and precipitation under different aerosol conditions (c, f). The blue lines represent the results at small aerosol loading (less than 30th percentiles), and the red lines represent the results at large aerosol loading (more than 70th percentiles). The error bars represent the standard error of the mean (SEM = standard error ).
In the TO, there is a clear increase in DCC precipitation with increasing aerosol concentration under clean conditions (Fig. 8e). This phenomenon can be explained by the “aerosol invigoration effect” mentioned above. However, as aerosols continue to increase, their effect on DCC precipitation shifts from invigoration to suppression. Previous studies (Dagan et al., 2015; Wang et al., 2018; H. Liu et al., 2019) have also observed similar phenomena. This may be due to the fact that the aerosol microphysical effect (or aerosol invigoration effect) is more sensitive in relative clean environments. While under high aerosol loading conditions, the aerosol radiative effect dominates (Koren et al., 2008; Wang et al., 2018). The radiative heating of absorbing aerosols increases atmospheric stability and reduces the moisture content due to evaporation (Ackerman et al., 2000). In our results, we similarly find that the DCC under polluted conditions corresponds to a smaller upward motion velocity (Fig. S10a). The aerosol–cloud response takes on a boomerang shape when two competing effects are present (Rosenfeld et al., 2008; Jiang et al., 2018). Nevertheless, the aerosol radiative effect over the oceans is expected to be weaker due to the ocean's high heat capacity, which prevents rapid changes in surface temperatures (H. Liu et al., 2019). Meanwhile, aerosols under DCSs, which cover a large area, can only absorb a limited amount of solar radiation. This can further reduce the impact of aerosol radiative effect. Observations and cloud models over the tropical ocean demonstrate that this suppression of precipitation by aerosols under polluted environments is more likely to be due to enhanced entrainment (H. Liu et al., 2019). Under the influence of increased aerosols, cloud droplet size become smaller (Squires and Twomey, 1960; Warner and Twomey, 1967) and more susceptible to consumption by entrainment (Xue and Feingold, 2006). Furthermore, polluted conditions cause a delay in precipitation, allowing for increased evaporation and sublimation of hydrometeors in the unsaturated part of clouds, ultimately leading to a reduction in cloud water (H. Liu et al., 2019). Corresponding to H. Liu et al. (2019), we checked the 500 hPa relative humidity corresponding to the DCCs in the TO region (Fig. S10b) and found that it decreases as the aerosol loading increases. This implies that the entrainment process has a greater impact under polluted conditions.
The precipitation of DCCs remains a challenging task due to the complex mechanisms involved in aerosol–cloud–precipitation interactions and variable meteorological fields. To address this issue, we attempted to differentiate between clean and polluted environments and discuss the relationship between precipitation and meteorological factors separately. This allowed us to decouple the effects of aerosols and meteorological fields. Figure 8c and f show the relationship between vertical velocity and precipitation for different aerosol loadings. In Fig. 8c, the results for low aerosol loading indicate that DCCs with greater upward velocity also have more precipitation in the TP. In this case, precipitation is primarily enhanced by stronger transport of particles and hydrometeors (Luo et al., 2014). Under high aerosol loading, the varied responses of DCCs with different cloud base temperatures result in an insignificant relationship between vertical velocity and precipitation (shown by the red line in Fig. 8c). We checked the cloud base temperature of DCCs in the first bin, which are under the strongest upward motion but do not produce much precipitation. The results show that the average cloud base temperature of the DCCs in the first bin is only −1.25°C, which is lower than the average for the TP (0.87°C). This means that DCCs from the first bin may be less able to be aerosol-invigorated to produce more precipitation and instead lead to a suppression of precipitation due to aerosol direct (Koren et al., 2008; Wang et al., 2018) and semi-direct effects (Rosenfeld et al., 2008). The results in the TO (Fig. 8f) show no obvious differences between the two aerosol loading conditions, with both exhibiting a similar increase in precipitation as the upward velocity increases. As discussed in Fig. 8e, under the influence of competing aerosol effects, increased aerosols show an invigoration followed by a shift to inhibition of precipitation. Figure 8f demonstrates that DCCs still produce slightly more precipitation under higher aerosol loading compared to lower aerosol loading.
The TP, as the “Asian water tower”, exerts a global-scale influence on land–ocean–atmosphere interaction and the hydrological cycle (Xu et al., 2008). Over the TP, deep convection plays a crucial role in the energy and hydrological cycle. However, previous studies on the CRE of deep convective clouds over the TP predominantly concentrate on the deep convective cores, rather than considering the combined effects of the deep convection systems, including anvils. In this study, the entire cloud cluster containing the deep convective core (DCC) and anvils is identified as the deep convection system (DCS). Using data from CloudSat and CALIPSO satellites, we explore the horizontal and vertical structure characteristics of TP DCCs and DCSs and compare them with the results in the TO. Additionally, the radiative effects of DCCs and DCSs and the effects of meteorological factors and aerosols on the DCCs and DCSs are discussed. The main results are given in the following.
Differences in terrain, water vapour, dynamical, and thermal conditions between the two regions result in varying DCS characteristics. The DCSs in the TP are less than half as wide as those over the TO, and they also exhibit a smaller thickness. Due to the influence of monsoon, DCSs in the TP develop most vigorously in summer, particularly in the southeastern TP. There is no obvious seasonal difference in the DCS characteristics in the TO, except for less frequent occurrences but wider DCSs in summer.
The optically thin anvils in the DCSs typically offset some of the radiative cooling effects of the DCCs. The DCCs in the TP are relatively thinner, resulting in weaker radiative cooling effects at the TOA compared to the TO. Despite the thinner anvils in the TP, the radiative cooling effect of TP anvils is stronger due to their larger cloud optical depth compared with the TO anvils. The average TOA CRE of TP DCSs is more negative compared with DCSs in the TO, where the anvils are wider. The unique vertical profiles of temperature and water vapour associated with the uplifted topography cause the DCCs and DCSs to result in more radiative LW heating at the surface and low-level atmosphere in the TP. However, both the positive part of the LW CRH profile and the negative part of the SW CRH profile in the low-level atmosphere are thinner, resulting in a slightly smaller ATM CRE of DCCs and DCSs in the TP.
Meteorological factors have obvious effects on the development of DCSs and their precipitation. Both high wind shear and can effectively promote the horizontal development of DCSs by enhancing cloud tilt and reducing entrainment, respectively. High-level vertical ascent velocity is positively correlated with the cloud top height of DCCs in the TO. And the cloud top height is larger under high aerosol loading due to aerosol invigoration effect. However, the relationship between vertical velocity and cloud top height is not obvious in the TP, and the cloud tops are lower under high aerosol loading.
Aerosols have quite different effects on precipitation in the two regions. In the TP, there is no obvious correlation between aerosol loading and precipitation. For the DCSs in the TO, the increased aerosols have an invigoration effect on precipitation under clear conditions, but this effect shifts to suppression under polluted conditions.
Drawing from the above, the DCSs over the high-altitude TP show distinct structure, radiative effects, and precipitation characteristics compared with the DCSs in the TO. Specifically, (1) the more densely packed anvils; (2) the more efficient radiative heating of DCSs at the surface, due to less upwelling longwave flux emitted by the surface under clear-sky conditions; and (3) the different effects of aerosols on the development and precipitation of TP DCS compared with the TO.
Referring to previous studies, we found that the different effects of aerosols may be due to the lower cloud base temperature of TP DCSs. In cold-base clouds, large amounts of condensate freeze, and the presence of high concentrations of CCN can slow down autoconversion, leading to the freezing of most cloud droplets into small ice particles propelled by the strong updraft. These particles lack an effective mechanism to coagulate and fall as precipitation. These ice particles fail to release thermal buoyancy during the processes of freezing and precipitation, requiring additional energy for ascent. Consequently, convection is inhibited under high aerosol loading (Rosenfeld et al., 2008). It should be noted that the above is based on possible mechanisms inferred from similar phenomena. Whether there is a causal relationship still needs to be tested in future studies.
The diverse DCC and DCS structural features in different regions suggests the importance of exploring complete cloud clusters rather than just focusing on profiles labelled with cloud types denoting “deep convection” (e.g., DCC). However, this also leads to the limitation of sample size, which prevents us from further studying the details of DCSs. In addition, the sun-synchronous orbit satellite (CloudSat and CALIPSO) datasets used in this study only provide instantaneous observations twice daily. The results may be incomplete, as the full diurnal cycle cannot be captured. While the instantaneous CRE of DCSs is focused in this study, the daily average SW CRE can be calculated by normalizing shortwave radiation fluxes to daily mean insolation (L'Ecuyer et al., 2019). But daily variations in cloud cover must be disregarded. We recalculated the SW CRE following the method in L'Ecuyer et al. (2019). The results indicate that the SW CRE is reduced to 40 % of its instantaneous value, consequently decreasing the absolute value of the NCRE (not shown). However, there were no changes in the differences among DCS components or between the TP and TO regions. We are attempting to develop algorithms that, in combination with passive satellites, will enable the tracking of deep convective trajectories and changes in cloud properties on the plateau. This will overcome the limitation of overpass time of polar-orbiting satellites. By comprehensively monitoring the complete life cycle of DCS, we anticipate gaining enhanced insights into the underlying factors governing their behaviour and the subsequent effects downstream. This endeavour holds the potential to furnish crucial observational evidence for refining forecasting techniques and advancing model development in the field of atmospheric science.
In addition, in this study, we not only explore the radiative effects of the DCCs but also consider the influence of the anvils on the CRE and CRH of the DCSs. Cirrus clouds depend on deep convection, which can be directly derived from anvils or stimulated by indirect effects of deep convection (e.g. radiative cooling effects of deep convection, pileus-like updrafts, and gravity waves which often are initiated by organized convection) (Sassen et al., 2009). In particular, we note that more than 30 % of DCSs can penetrate the tropopause (shown in Table 2), which means that a large number of cirrus clouds in the stratosphere can be supplied by convection. Although our definition of DCS (the DCC cloud top must be higher than 12 km, which is close to the upper troposphere) may contribute to this surprising number, it also suggests that we need to pay more attention to this phenomenon of overshooting clouds. In our previous study (Zhao et al., 2023), we conducted a quantitative analysis of overshooting cloud cover and its diurnal variability using the cloud–aerosol transport system (CATS). Our findings revealed that the cloud cover of overshooting clouds is higher during the night and reaches its maximum value at 16:00 UTC. Furthermore, Zhao et al. (2024) suggested that there will be an increase in overshooting clouds in warming climates. Building upon these findings, our future objectives involve investigating the general mechanisms associated with overshooting convection and quantifying the radiative impacts of overshooting convection from a climate-oriented perspective.
2B-CLDCLASS-lidar and 2B-FLXHR-lidar data are available from the CloudSat Data Processing Center at https://www.cloudsat.cira.colostate.edu/data-products/2b-cldclass-lidar (CloudSat DPC, 2022a) and https://www.cloudsat.cira.colostate.edu/data-products/2b-flxhr-lidar (CloudSat DPC, 2022b). The IMERG datasets are available from the Goddard Earth Sciences Data and Information Services Center (GES DISC) at https://doi.org/10.5067/GPM/IMERG/3B-HH/06 (Huffman et al., 2023). The ERA5 datasets are available from the Climate Data Store (CDS) at https://doi.org/10.24381/cds.bd0915c6 (Hersbach et al., 2023). The MERRA-2 datasets are available from the Global Modeling and Assimilation Office (GMAO) at https://doi.org/10.5067/LTVB4GPCOTK2 (Global Modeling and Assimilation Office (GMAO), 2023).
The supplement related to this article is available online at: https://doi.org/10.5194/acp-24-9435-2024-supplement.
YZ and JL organized the paper and performed related analysis. YZ prepared the manuscript with contributions from all co-authors. JL conceptualized the paper and revised the whole manuscript. DW and YL downloaded the data used in this study. YW and JH provided suggestions for this study. All authors contributed to the discussion of the results and reviewed the manuscript.
At least one of the (co-)authors is a member of the editorial board of Atmospheric Chemistry and Physics. The peer-review process was guided by an independent editor, and the authors also have no other competing interests to declare.
Publisher's note: Copernicus Publications remains neutral with regard to jurisdictional claims made in the text, published maps, institutional affiliations, or any other geographical representation in this paper. While Copernicus Publications makes every effort to include appropriate place names, the final responsibility lies with the authors.
This research was jointly supported by the NSFC Major Project (grant no. 42090030), the Strategic Priority Research Program of the Chinese Academy of Sciences (grant no. XDA2006010301), and the Excellent Young Scholars (grant no. 42022037). We would like to thank the CloudSat, CALIPSO, GPM, ERA5, and MERRA-2 science teams for providing excellent and accessible data products that made this study possible. The authors sincerely thank the two anonymous referees for their helpful comments and suggestions, which helped improve the paper.
This research has been supported by the NSFC Major Project (grant no. 42090030), the Strategic Priority Research Program of the Chinese Academy of Sciences (grant no. XDA2006010301), and the Excellent Young Scholars (grant no. 42022037).
This paper was edited by Guy Dagan and reviewed by two anonymous referees.
Ackerman, A. S., Toon, O. B., Stevens, D. E., Heymsfield, A. J., Ramanathan, V., and Welton, E. J.: Reduction of Tropical Cloudiness by Soot, Science, 288, 1042–1047, https://doi.org/10.1126/science.288.5468.1042, 2000.
Andreae, M. O., Rosenfeld, D., Artaxo, P., Costa, A. A., Frank, G. P., Longo, K. M., and Silva-Dias, M. A. F.: Smoking Rain Clouds over the Amazon, Science, 303, 1337–1342, https://doi.org/10.1126/science.1092779, 2004.
Bai, J. and Xu, X.: Atmospheric hydrological budget with its effects over Tibetan Plateau, J. Geogr. Sci., 14, 81–86, https://doi.org/10.1007/BF02873094, 2004.
Bowen, G. J.: A faster water cycle, Science, 332, 430–431, https://doi.org/10.1126/science.1205253, 2011.
Buchard, V., da Silva, A. M., Colarco, P. R., Darmenov, A., Randles, C. A., Govindaraju, R., Torres, O., Campbell, J., and Spurr, R.: Using the OMI aerosol index and absorption aerosol optical depth to evaluate the NASA MERRA Aerosol Reanalysis, Atmos. Chem. Phys., 15, 5743–5760, https://doi.org/10.5194/acp-15-5743-2015, 2015.
Chakraborty, S., Fu, R., Rosenfeld, D., and Massie, S. T.: The influence of aerosols and meteorological conditions on the total rain volume of the mesoscale convective systems over tropical continents, Geophys. Res. Lett., 45, 13099–13106, https://doi.org/10.1029/2018GL080371, 2018.
Chen, Y., Zhang, A., Zhang, Y., Cui, C., Wan, R., Wang, B., and Fu, Y.: A Heavy Precipitation Event in the Yangtze River Basin Led by an Eastward Moving Tibetan Plateau Cloud System in the Summer of 2016, J. Geophys. Res.-Atmos., 125, e2020JD032429, https://doi.org/10.1029/2020JD032429, 2020.
CloudSat DPC: 2B-CLDCLASS-LIDAR P1_R05, CloudSat Data Processing Center [data set], https://www.cloudsat.cira.colostate.edu/data-products/2b-cldclass-lidar, last access: 31 October 2022a.
CloudSat DPC: 2B-FLXHR-LIDAR P1_R05, CloudSat Data Processing Center [data set], https://www.cloudsat.cira.colostate.edu/data-products/2b-flxhr-lidar, last access: 31 October 2022b.
Dagan, G., Koren, I., Altaratz, O., and Heiblum, R. H.: Time-dependent, non-monotonic response of warm convective cloud fields to changes in aerosol loading, Atmos. Chem. Phys., 17, 7435–7444, https://doi.org/10.5194/acp-17-7435-2017, 2017.
Devasthale, A. and Fueglistaler, S.: A climatological perspective of deep convection penetrating the TTL during the Indian summer monsoon from the AVHRR and MODIS instruments, Atmos. Chem. Phys., 10, 4573–4582, https://doi.org/10.5194/acp-10-4573-2010, 2010.
Di Giuseppe, F. and Tompkins, A. M.: Generalizing Cloud Overlap Treatment to Include the Effect of Wind Shear, J. Atmos. Sci., 72, 2865–2876, https://doi.org/10.1175/jas-d-14-0277.1, 2015.
Dong, W., Lin, Y., Wright, J. S., Ming, Y., Xie, Y., Wang, B., Luo, Y., Huang, W., Huang, J., and Wang, L.: Summer rainfall over the southwestern Tibetan Plateau controlled by deep convection over the Indian subcontinent, Nat. Commun., 7, 1–9, https://doi.org/10.1038/ncomms10925, 2016.
Douglas, A. and L'Ecuyer, T.: Quantifying cloud adjustments and the radiative forcing due to aerosol-cloud interactions in satellite observations of warm marine clouds, Atmos. Chem. Phys., 20, 6225–6241, https://doi.org/10.5194/acp-20-6225-2020, 2020.
Duan, A. and Wu, G.: Change of cloud amount and the climate warming on the Tibetan Plateau, Geophys. Res. Lett., 33, L22704, https://doi.org/10.1029/2006GL027946, 2006.
Duan, A., Hu, D., Hu, W., and Zhang, P.: Precursor effect of the Tibetan Plateau heating anomaly on the seasonal march of the East Asian summer monsoon precipitation, J. Geophys. Res.-Atmos., 125, e2020JD032948, https://doi.org/10.1029/2020JD032948, 2020.
Ekman, A., Engström, A., and Wang, C.: The effect of aerosol composition and concentration on the development and anvil properties of a continental deep convective cloud, Q. J. R. Meteorol. Soc., 133, 1439–1452, https://doi.org/10.1002/QJ.108, 2007.
Fan, J., Yuan, T., Comstock, J. M., Ghan, S., Khain, A., Leung, L. R., Li, Z., Martins, V. J., and Ovchinnikov, M.: Dominant role by vertical wind shear in regulating aerosol effects on deep convective clouds, J. Geophys. Res.-Atmos., 114, D22206, https://doi.org/10.1029/2009JD012352, 2009.
Feng, Z., Dong, X., Xi, B., Schumacher, C., Minnis, P., and Khaiyer, M.: Top-of-atmosphere radiation budget of convective core/stratiform rain and anvil clouds from deep convective systems, J. Geophys. Res.-Atmos., 116, D23202, https://doi.org/10.1029/2011JD016451, 2011.
Forster, P. M. d. F. and Shine, K. P.: Assessing the climate impact of trends in stratospheric water vapor, Geophys. Res. Lett., 29, 1086, https://doi.org/10.1029/2001GL013909, 2002.
Fu, Y., Liu, Q., Zi, Y., Feng, S., Li, Y., and Liu, G.: Summer precipitation and latent heating over the Tibetan Plateau based on TRMM measurements, Plat. Mount. Meteorol. Res., 28, 8–18, https://doi.org/10.3969/j.issn.1674-2184.2008.01.002, 2008.
Fu, Y., Pan, X., Yang, Y., Chen, F., and Liu, P.: Climatological characteristics of summer precipitation over East Asia measured by TRMM PR: A review, J. Meteorol. Res., 31, 142–159, https://doi.org/10.1007/s13351-017-6156-9, 2017.
Fu, Y., Ma, Y., Zhong, L., Yang, Y., Guo, X., Wang, C., Xu, X., Yang, K., Xu, X., Liu, L., Fan, G., Li, Y., and Wang, D.: Land-surface processes and summer-cloud-precipitation characteristics in the Tibetan Plateau and their effects on downstream weather: a review and perspective, Natl. Sci. Rev., 7, 500–515, https://doi.org/10.1093/nsr/nwz226, 2020.
Fueglistaler, S. and Fu, Q.: Impact of clouds on radiative heating rates in the tropical lower stratosphere, J. Geophys. Res.-Atmos., 111, D23202, https://doi.org/10.1029/2006JD007273, 2006.
Gelaro, R., McCarty, W., Suárez, M. J., Todling, R., Molod, A., Takacs, L., Randles, C. A., Darmenov, A., Bosilovich, M. G., Reichle, R., Wargan, K., Coy, L., Cullather, R., Draper, C., Akella, S., Buchard, V., Conaty, A., da Silva, A. M., Gu, W., Kim, G.-K., Koster, R., Lucchesi, R., Merkova, D., Nielsen, J. E., Partyka, G., Pawson, S., Putman, W., Rienecker, M., Schubert, S. D., Sienkiewicz, M., and Zhao, B.: The Modern-Era Retrospective Analysis for Research and Applications, Version 2 (MERRA-2), J. Clim., 30, 5419–5454, https://doi.org/10.1175/jcli-d-16-0758.1, 2017.
Global Modeling and Assimilation Office (GMAO): MERRA-2 inst3_3d_aer_Nv: 3d, 3-Hourly, Instantaneous, Model-Level, Assimilation, Aerosol Mixing Ratio V5.12.4, Greenbelt, MD, USA, Goddard Earth Sciences Data and Information Services Center (GES DISC) [data set], https://doi.org/10.5067/LTVB4GPCOTK2, 2023.
Gong, J., Zeng, X., Wu, D. L., Munchak, S. J., Li, X., Kneifel, S., Ori, D., Liao, L., and Barahona, D.: Linkage among ice crystal microphysics, mesoscale dynamics, and cloud and precipitation structures revealed by collocated microwave radiometer and multifrequency radar observations, Atmos. Chem. Phys., 20, 12633–12653, https://doi.org/10.5194/acp-20-12633-2020, 2020.
Han, X., Zhao, B., Lin, Y., Chen, Q., Shi, H., Jiang, Z., Fan, X., Wang, J., Liou, K.-N., and Gu, Y.: Type-Dependent Impact of Aerosols on Precipitation Associated With Deep Convective Cloud Over East Asia, J. Geophys. Res.-Atmos., 127, e2021JD036127, https://doi.org/10.1029/2021JD036127, 2022.
Hartmann, D. L., Holton, J. R., and Fu, Q.: The heat balance of the tropical tropopause, cirrus, and stratospheric dehydration, Geophys. Res. Lett., 28, 1969–1972, https://doi.org/10.1029/2000GL012833, 2001.
Haynes, J. M., Jakob, C., Rossow, W. B., Tselioudis, G., and Brown, J.: Major characteristics of Southern Ocean cloud regimes and their effects on the energy budget, J. Climate., 24, 5061–5080, https://doi.org/10.1175/2011JCLI4052.1, 2011.
Haynes, J. M., Vonder Haar, T. H., L'Ecuyer, T., and Henderson, D.: Radiative heating characteristics of Earth's cloudy atmosphere from vertically resolved active sensors, Geophys. Res. Lett., 40, 624–630, https://doi.org/10.1002/grl.50145, 2013.
Henderson, D. and L'Ecuyer, T.: level 2B fluxes and heating rates with lidar [2B-FLXHR-LIDAR] process description and interface control document, CloudSat Project Rep., https://www.cloudsat.cira.colostate.edu/cloudsat-static/info/dl/2b-flxhr-lidar/2B-FLXHR-LIDAR_PDICD.P1_R05.rev0.pdf (last access: 16 February 2024), 2020.
Henderson, D. S., L'Ecuyer, T., Stephens, G., Partain, P., and Sekiguchi, M.: A Multisensor Perspective on the Radiative Impacts of Clouds and Aerosols, J. Appl. Meteorol. Clim., 52, 853–871, https://doi.org/10.1175/JAMC-D-12-025.1, 2013.
Hersbach, H., Bell W, P. B., Horányi, A., J., M.-S., J., N., Radu, R., Schepers, D., Simmons, A., Soci, C., and Dee, D.: Global reanalysis: goodbye ERA-Interim, hello ERA5, ECMWF Newsletter, 159, 17–24, https://doi.org/10.21957/vf291hehd7, 2019.
Hersbach, H., Bell, B., Berrisford, P., Hirahara, S., Horányi, A., Muñoz-Sabater, J., Nicolas, J., Peubey, C., Radu, R., Schepers, D., Simmons, A., Soci, C., Abdalla, S., Abellan, X., Balsamo, G., Bechtold, P., Biavati, G., Bidlot, J., Bonavita, M., De Chiara, G., Dahlgren, P., Dee, D., Diamantakis, M., Dragani, R., Flemming, J., Forbes, R., Fuentes, M., Geer, A., Haimberger, L., Healy, S., Hogan, R. J., Hólm, E., Janisková, M., Keeley, S., Laloyaux, P., Lopez, P., Lupu, C., Radnoti, G., de Rosnay, P., Rozum, I., Vamborg, F., Villaume, S., and Thépaut, J.-N.: The ERA5 global reanalysis, Q. J. R. Meteorol. Soc., 146, 1999–2049, https://doi.org/10.1002/qj.3803, 2020.
Hersbach, H., Bell, B., Berrisford, P., Biavati, G., Horányi, A., Muñoz Sabater, J., Nicolas, J., Peubey, C., Radu, R., Rozum, I., Schepers, D., Simmons, A., Soci, C., Dee, D., and Thépaut, J.-N.: ERA5 hourly data on pressure levels from 1940 to present, Copernicus Climate Change Service (C3S) Climate Data Store (CDS) [data set], https://doi.org/10.24381/cds.bd0915c6, last access: 8 May 2023.
Heymsfield, A. J., Miloshevich, L. M., Schmitt, C., Bansemer, A., Twohy, C., Poellot, M. R., Fridlind, A., and Gerber, H.: Homogeneous Ice Nucleation in Subtropical and Tropical Convection and Its Influence on Cirrus Anvil Microphysics, J. Atmos. Sci., 62, 41–64, https://doi.org/10.1175/JAS-3360.1, 2005.
Hoffmann, L., Günther, G., Li, D., Stein, O., Wu, X., Griessbach, S., Heng, Y., Konopka, P., Müller, R., Vogel, B., and Wright, J. S.: From ERA-Interim to ERA5: the considerable impact of ECMWF's next-generation reanalysis on Lagrangian transport simulations, Atmos. Chem. Phys., 19, 3097–3124, https://doi.org/10.5194/acp-19-3097-2019, 2019.
Hu, L., Deng, D., Gao, S., and Xu, X.: The seasonal variation of Tibetan Convective Systems: Satellite observation, J. Geophys. Res.-Atmos., 121, 5512–5525, https://doi.org/10.1002/2015JD024390, 2016.
Hu, L., Deng, D., Xu, X., and Zhao, P.: The regional differences of Tibetan convective systems in boreal summer, J. Geophys. Res.-Atmos., 122, 7289–7299, https://doi.org/10.1002/2017JD026681, 2017.
Huffman, G. J., Bolvin, D. T., Braithwaite, D., Hsu, K., Joyce, R., Kidd, C., Nelkin, E. J., Sorooshian, S., Tan, J., and Xie, P.: NASA Global Precipitation Measurement (GPM) Integrated Multi-satellitE Retrievals for GPM (IMERG) Algorithm Theoretical Basis Document (ATBD) Version 06, https://docserver.gesdisc.eosdis.nasa.gov/public/project/GPM/IMERG_ATBD_V06.pdf (last access: 13 February 2023), 2019.
Huffman, G. J., Stocker, E. F., Bolvin, D. T., Nelkin, E. J., and Jackson, T.: GPM IMERG Final Precipitation L3 Half Hourly 0.1° × 0.1° V06, Greenbelt, MD, Goddard Earth Sciences Data and Information Services Center (GES DISC) [data set], https://doi.org/10.5067/GPM/IMERG/3B-HH/06, last access: 13 December 2023.
Jensen, E. J., Ackerman, A. S., and Smith, J. A.: Can overshooting convection dehydrate the tropical tropopause layer, J. Geophys. Res.-Atmos., 112, D11209, https://doi.org/10.1029/2006JD007943, 2007.
Jiang, J. H., Su, H., Huang, L., Wang, Y., Massie, S., Zhao, B., Omar, A., and Wang, Z.: Contrasting effects on deep convective clouds by different types of aerosols, Nat. Commun., 9, 3874, https://doi.org/10.1038/S41467-018-06280-4, 2018.
Jiang, X., Li, Y., Yang, S., Yang, K., and Chen, J.: Interannual Variation of Summer Atmospheric Heat Source over the Tibetan Plateau and the Role of Convection around the Western Maritime Continent, J. Clim., 29, 121–138, https://doi.org/10.1175/JCLI-D-15-0181.1, 2016.
Khain, A., Rosenfeld, D., and Pokrovsky, A.: Aerosol impact on the dynamics and microphysics of deep convective clouds, Q. J. R. Meteorol. Soc., 131, 2639–2663, https://doi.org/10.1256/QJ.04.62, 2005.
Khain, A. P., Phillips, V., Benmoshe, N., and Pokrovsky, A.: The Role of Small Soluble Aerosols in the Microphysics of Deep Maritime Clouds, J. Atmos. Sci., 69, 2787–2807, https://doi.org/10.1175/2011JAS3649.1, 2012.
Kirk-Davidoff, D. B., Hintsa, E. J., Anderson, J. G., and Keith, D. W.: The effect of climate change on ozone depletion through changes in stratospheric water vapour, Nature, 402, 399–401, https://doi.org/10.1038/46521, 1999.
Kottayil, A., Satheesan, K., John, V. O., and Antony, R.: Diurnal variation of deep convective clouds over Indian monsoon region and its association with rainfall, Atmos. Res., 255, 105540, https://doi.org/10.1016/j.atmosres.2021.105540, 2021.
Koren, I., Kaufman, Y. J., Rosenfeld, D., Remer, L. A., and Rudich, Y.: Aerosol invigoration and restructuring of Atlantic convective clouds, Geophys. Res. Lett., 32, L14828, https://doi.org/10.1029/2005gl023187, 2005.
Koren, I., Vanderlei Martins, J., Remer, L. A., and Afargan, H.: Smoke invigoration versus inhibition of clouds over the amazon, Science, 321, 946–949, https://doi.org/10.1126/science.1159185, 2008.
Koren, I., Feingold, G., and Remer, L. A.: The invigoration of deep convective clouds over the Atlantic: aerosol effect, meteorology or retrieval artifact?, Atmos. Chem. Phys., 10, 8855–8872, https://doi.org/10.5194/acp-10-8855-2010, 2010.
Koren, I., Dagan, G., and Altaratz, O.: From aerosol-limited to invigoration of warm convective clouds, Science, 344, 1143–1146, https://doi.org/10.1126/science.1252595, 2014.
L'Ecuyer, T. S., Hang, Y., Matus, A. V., and Wang, Z.: Reassessing the Effect of Cloud Type on Earth's Energy Balance in the Age of Active Spaceborne Observations. Part I: Top of Atmosphere and Surface, J. Clim., 32, 6197–6217, https://doi.org/10.1175/JCLI-D-18-0753.1, 2019.
Li, J., Mao, J., and Wang, F.: Comparative study of five current reanalyses in characterizing total cloud fraction and top of the atmosphere cloud radiative effects over the Asian monsoon region, Int. J. Climatol., 37, 5047–5067, https://doi.org/10.1002/joc.5143, 2017.
Li, J., Lv, Q., Jian, B., Zhang, M., Zhao, C., Fu, Q., Kawamoto, K., and Zhang, H.: The impact of atmospheric stability and wind shear on vertical cloud overlap over the Tibetan Plateau, Atmos. Chem. Phys., 18, 7329–7343, https://doi.org/10.5194/acp-18-7329-2018, 2018.
Li, R. and Q.-L. Min.: Impacts of mineral dust on the vertical structure of precipitation, J. Geophys. Res.-Atmos., 115, D09203, https://doi.org/10.1029/2009JD011925, 2010.
Li, R., Dong, X., Guo, J., Fu, Y., Zhao, C., Wang, Y., and Min, Q.: The implications of dust ice nuclei effect on cloud top temperature in a complex mesoscale convective system, Sci. Rep., 7, 13826, https://doi.org/10.1038/s41598-017-12681-0, 2017.
Li, W., Schumacher, C., and McFarlane, S. A.: Radiative heating of the ISCCP upper level cloud regimes and its impact on the large-scale tropical circulation, J. Geophys. Res.-Atmos., 118, 592–604, https://doi.org/10.1002/jgrd.50114, 2013.
Li, Z., Niu, F., Fan, J., Liu, Y., Rosenfeld, D., and Ding, Y.: Long-term impacts of aerosols on the vertical development of clouds and precipitation, Nat. Geosci., 4, 888–894, https://doi.org/10.1038/ngeo1313, 2011.
Lin, B., Wielicki, B. A., Minnis, P., Chambers, L., Xu, K.-M., Hu, Y., and Fan, A.: The Effect of Environmental Conditions on Tropical Deep Convective Systems Observed from the TRMM Satellite, J. Clim., 19, 5745–5761, https://doi.org/10.1175/JCLI3940.1, 2006.
Liu, C., Zipser, E. J., and Nesbitt, S. W.: Global distribution of tropical deep convection: Different perspectives from TRMM infrared and radar data, J. Climate., 20, 489–503, https://doi.org/10.1175/JCLI4023.1, 2007.
Liu, H., Guo, J., Koren, I., Altaratz, O., Dagan, G., Wang, Y., Jiang, J. H., Zhai, P., and Yung, Y. L.: Non-Monotonic Aerosol Effect on Precipitation in Convective Clouds over Tropical Oceans, Sci. Rep., 9, 7809, https://doi.org/10.1038/s41598-019-44284-2, 2019.
Liu, X. and Chen, B.: Climatic warming in the Tibetan Plateau during recent decades, Int. J. Climatol., 20, 1729–1742, https://doi.org/10.1002/1097-0088(20001130)20:14<1729::AID-JOC556>3.0.CO;2-Y, 2000.
Liu, Y., Zhu, Q., Huang, J., Hua, S., and Jia, R.: Impact of dust-polluted convective clouds over the Tibetan Plateau on downstream precipitation, Atmos. Environ., 209, 67–77, https://doi.org/10.1016/J.ATMOSENV.2019.04.001, 2019.
Lv, Q., Li, J., Wang, T., and Huang, J.: Cloud radiative forcing induced by layered clouds and associated impact on the atmospheric heating rate, J. Meteorol. Res., 29, 779–792, https://doi.org/10.1007/s13351-015-5078-7, 2015.
Luo, Y., Zhang, R., Qian, W., Luo, Z., and Hu, X.: Intercomparison of Deep Convection over the Tibetan Plateau–Asian Monsoon Region and Subtropical North America in Boreal Summer Using CloudSat/CALIPSO Data, J. Clim., 24, 2164–2177, https://doi.org/10.1175/2010JCLI4032.1, 2011.
Luo, Z. J., Jeyaratnam, J., Iwasaki, S., Takahashi, H., and Anderson, R.: Convective vertical velocity and cloud internal vertical structure: An A-Train perspective, Geophys. Res. Lett., 41, 723–729, https://doi.org/10.1002/2013GL058922, 2014.
Mace, G. G., Zhang, Q. Q., Vaughan, M., Marchand, R., Stephens, G., Trepte, C., and Winker, D.: A description of hydrometeor layer occurrence statistics derived from the first year of merged Cloudsat and CALIPSO data, J. Geophys. Res.-Atmos., 114, D00A26, https://doi.org/10.1029/2007JD009755, 2009.
Mace, G. G.: Cloud properties and radiative forcing over the maritime storm tracks of the Southern Ocean and North Atlantic derived from A-Train, J. Geophys. Res., 115, D10201, https://doi.org/10.1029/2009JD012517, 2010.
McDonnell, K. A. and Holbrook, N. J.: A Poisson regression model approach to predicting tropical cyclogenesis in the Australian/southwest Pacific Ocean region using the SOI and saturated equivalent potential temperature gradient as predictors, Geophys. Res. Lett., 31, L20110, https://doi.org/10.1029/2004GL020843, 2004.
McFarlane, S. A., Mather, J. H., and Ackerman, T. P.: Analysis of tropical radiative heating profiles: A comparison of models and observations, J. Geophys. Res.-Atmos., 112, D14218, https://doi.org/10.1029/2006JD008290, 2007.
Mieslinger, T., Horváth, Á., Buehler, S. A., and Sakradzija, M.: The Dependence of Shallow Cumulus Macrophysical Properties on Large-Scale Meteorology as Observed in ASTER Imagery, J. Geophys. Res.-Atmos., 124, 11477–11505, https://doi.org/10.1029/2019JD030768, 2019.
Molod, A., Takacs, L., Suarez, M., and Bacmeister, J.: Development of the GEOS-5 atmospheric general circulation model: evolution from MERRA to MERRA2, Geosci. Model Dev., 8, 1339–1356, https://doi.org/10.5194/gmd-8-1339-2015, 2015.
Myers, T. A. and J. R. Norris.: Observational Evidence That Enhanced Subsidence Reduces Subtropical Marine Boundary Layer Cloudiness, J. Clim., 26, 7507–7524, https://doi.org/10.1175/JCLI-D-12-00736.1, 2013.
Naud, C. M., Del Genio, A., Mace, G. G., Benson, S., Clothiaux, E. E., and Kollias, P.: Impact of Dynamics and Atmospheric State on Cloud Vertical Overlap, J. Clim., 21, 1758–1770, https://doi.org10.1175/2007JCLI1828.1, 2008.
Neggers, R. A. J., Jonker, H. J. J., and Siebesma, A. P.: Size Statistics of Cumulus Cloud Populations in Large-Eddy Simulations, J. Atmos. Sci., 60, 1060–1074, https://doi.org/10.1175/1520-0469(2003)60<1060:SSOCCP>2.0.CO;2, 2003.
Pan, Z., Mao, F., Lu, X., Gong, W., Shen, H., and Mao, Q.: Enhancement of vertical cloud-induced radiative heating in East Asian monsoon circulation derived from CloudSat-CALIPSO observations, Int. J. Remote. Sens., 41, 595–614, https://doi.org/10.1080/01431161.2019.1646935, 2020.
Pan, Z., Rosenfeld, D., Zhu, Y., Mao, F., Gong, W., Zang, L., and Lu, X.: Observational Quantification of Aerosol Invigoration for Deep Convective Cloud Lifecycle Properties Based on Geostationary Satellite, J. Geophys. Res.-Atmos., 126, e2020JD034275, https://doi.org/10.1029/2020JD034275, 2021.
Peng, J., Zhang, H., and Li, Z.: Temporal and spatial variations of global deep cloud systems based on CloudSat and CALIPSO satellite observations, Adv. Atmos. Sci., 31, 593–603, https://doi.org/10.1007/S00376-013-3055-6, 2014.
Peng, J., Li, Z., Zhang, H., Liu, J., and Cribb, M.: Systematic Changes in Cloud Radiative Forcing with Aerosol Loading for Deep Clouds in the Tropics, J. Atmos. Sci., 73, 231–249, https://doi.org/10.1175/JAS-D-15-0080.1, 2016.
Randel, W. J., Park, M., Emmons, L., Kinnison, D., Bernath, P., Walker, K. A., Boone, C., and Pumphrey, H.: Asian Monsoon Transport of Pollution to the Stratosphere, Science, 328, 611–613, https://doi.org/10.1126/science.1182274, 2010.
Randles, C. A., Silva, A. M. d., Buchard, V., Darmenov, A., Colarco, P. R., Aquila, V., Bian, H., P, E., Nowottnick, Pan, X., Smirnov, A., Y, H., and Govindaraju, R.: The MERRA-2 Aerosol Assimilation, Technical Report Series on Global Modeling and Data Assimilation, Vol. 45, NASA Tech. Rep., https://gmao.gsfc.nasa.gov/pubs/docs/Randles887.pdf (last access: 16 February 2024), 2016.
Reichler, T., Dameris, M., and Sausen, R.: Determining the Tropopause Height from Gridded Data, Geophys. Res. Lett., 30, 2042, https://doi.org/10.1029/2003GL018240, 2003.
Robe, F. R. and Emanuel, K. A.: The Effect of Vertical Wind Shear on Radiative–Convective Equilibrium States, J. Atmos. Sci., 58, 1427–1445, https://doi.org/10.1175/1520-0469(2001)058<1427:TEOVWS>2.0.CO;2, 2001.
Rosenfeld, D.: TRMM observed first direct evidence of smoke from forest fires inhibiting rainfall, Geophys. Res. Lett., 26, 3105–3108, https://doi.org/10.1029/1999GL006066, 1999.
Rosenfeld, D., Lohmann, U., Raga, G. B., O'Dowd, C. D., Kulmala, M., Fuzzi, S., Reissell, A., and Andreae, M. O.: Flood or Drought: How Do Aerosols Affect Precipitation?, Science, 321, 1309–1313, https://doi.org/10.1126/science.1160606, 2008.
Sassen, K., Wang, Z., and Liu, D.: Cirrus clouds and deep convection in the tropics: Insights from CALIPSO and CloudSat, J. Geophys. Res.-Atmos., 114, D00H06, https://doi.org/10.1029/2009JD011916, 2009.
Savtchenko, A.: Deep convection and upper-tropospheric humidity: A look from the A-Train, Geophys. Res. Lett., 36, L06814, https://doi.org/10.1029/2009GL037508, 2009.
Sherwood, S. C. and Wahrlich, R.: Observed Evolution of Tropical Deep Convective Events and Their Environment, Mon. Weather Rev., 127, 1777–1795, https://doi.org/10.1175/1520-0493(1999)127<1777:OEOTDC>2.0.CO;2, 1999.
Slingo, A. and Slingo, J. M.: The response of a general circulation model to cloud longwave radiative forcing, I: Introduction and initial experiments, Q. J. R. Meteorol. Soc., 114, 1027–1062, https://doi.org/10.1002/qj.49711448209, 1988.
Slingo, J. M. and Slingo, A.: The response of a general circulation model to cloud longwave radiative forcing. II: Further studies, Q. J. R. Meteorol. Soc., 117, 333–364, https://doi.org/10.1002/qj.49711749805, 1991.
Squires, P. and Twomey, S.: The Relation Between Cloud Droplet Spectra and the Spectrum of Cloud Nuclei, in: Physics of Precipitation: Proceedings of the Cloud Physics Conference, Woods Hole, Massachusetts, 3–5 June, 1959, 211–219, https://doi.org/10.1029/GM005p0211, 1960.
Stephens, G. L., Li, J., Wild, M., Clayson, C. A., Loeb, N., Kato, S., L'Ecuyer, T., Stackhouse, P. W., Lebsock, M., and Andrews, T.: An update on Earth's energy balance in light of the latest global observations, Nat. Geosci., 5, 691–696, https://doi.org/10.1038/ngeo1580, 2012.
Sun, N., Fu, Y., Zhong, L., Zhao, C., and Li, R.: The Impact of Convective Overshooting on the Thermal Structure over the Tibetan Plateau in Summer Based on TRMM, COSMIC, Radiosonde, and Reanalysis Data, J. Clim., 34, 8047–8063, https://doi.org/10.1175/jcli-d-20-0849.1, 2021.
Sun, Y., Wang, Y., Zhao, C., Zhou, Y., Yang, Y., Yang, X., Fan, H., Zhao, X., and Yang, J.: Vertical Dependency of Aerosol Impacts on Local Scale Convective Precipitation, J. Geophys. Res.-Atmos., 50, e2022GL102186, https://doi.org/10.1029/2022GL102186, 2023.
Tao, W.-K., Li, X., Khain, A., Matsui, T., Lang, S., and Simpson, J.: Role of atmospheric aerosol concentration on deep convective precipitation: Cloud-resolving model simulations, J. Geophys. Res.-Atmos., 112, D24S18, https://doi.org/10.1029/2007JD008728, 2007.
Wang, Q., Li, Z., Guo, J., Zhao, C., and Cribb, M.: The climate impact of aerosols on the lightning flash rate: Is it detectable from long-term measurements?, Atmos. Chem. Phys., 18, 12797–12816, https://doi.org/10.5194/acp-18-12797-2018, 2018.
Wang, R., Xian, T., Wang, M. X., Chen, F. J., Yang, Y. J., Zhang, X. D., Li, R., Zhong, L., Zhao, C., and Fu, Y. F.: Relationship between Extreme Precipitation and Temperature in Two Different Regions: The Tibetan Plateau and Middle-East China, J. Meteorol. Res., 33, 870–884, https://doi.org/10.1007/s13351-019-8181-3, 2019.
Wang, Z.: CloudSat 2B-CLDCLASS-LIDAR product process description and interface control document, Process Description and Interface Control Document (PDICD) P1_R05, CloudSat Project Rep., https://www.cloudsat.cira.colostate.edu/cloudsat-static/info/dl/2b-cldclass-lidar/2B-CLDCLASS-LIDAR_PDICD.P1_R05.rev0_.pdf (last access: 18 February 2024), 2019.
Wang, Z., Zhong, R., Lai, C., and Chen, J.: Evaluation of the GPM IMERG satellite-based precipitation products and the hydrological utility, Atmos. Res., 196, 151–163, https://doi.org/10.1016/j.atmosres.2017.06.020, 2017.
Warner, J.: A Reduction in Rainfall Associated with Smoke from Sugar-Cane Fires – An Inadvertent Weather Modification?, J. Appl. Meteorol. Clim., 7, 247–251, https://doi.org/10.1175/1520-0450(1968)007<0247:ARIRAW>2.0.CO;2, 1968.
Warner, J. and Twomey, S.: The Production of Cloud Nuclei by Cane Fires and the Effect on Cloud Droplet Concentration, J. Atmos. Sci., 24, 704–706, https://doi.org/10.1175/1520-0469(1967)024<0704:TPOCNB>2.0.CO;2, 1967.
Weisman, M. L. and Klemp, J. B.: The Dependence of Numerically Simulated Convective Storms on Vertical Wind Shear and Buoyancy, Mon. Weather Rev., 110, 504–520, https://doi.org/10.1175/1520-0493(1982)110<0504:TDONSC>2.0.CO;2, 1982.
Witkowski, M. M., Vane, D., and Livermore, T.: CloudSat-Life in Daylight Only Operations (DO-Op), 2018 SpaceOps Conference, Marseille, France, 1 June 2018, https://arc.aiaa.org/doi/pdf/10.2514/6.2018-2562 (last access: 26 August 2024), 2018.
WMO: Meteorology-a three-dimensional science: Second session for the commisstion for aerology, WMO Bulletin, 6, 134–138, https://library.wmo.int/idurl/4/42003 (last access: 23 August 2024), 1957.
Wu, G. and Zhang, Y.: Tibetan Plateau forcing and the timing of the monsoon onset over south Asia and the South China Sea, Mon. Weather Rev., 126, 913–927, https://doi.org/10.1175/1520-0493(1998)126<0913:TPFATT>2.0.CO;2, 1998.
Wu, G., Liu, Y., He, B., Bao, Q., Duan, A., and Jin, F.-F.: Thermal Controls on the Asian Summer Monsoon, Sci. Rep., 2, 404, https://doi.org/10.1038/srep00404, 2012.
Wu, G., He, B., Duan, A., Liu, Y., and Yu, W.: Formation and variation of the atmospheric heat source over the Tibetan Plateau and its climate effects, Adv. Atmos. Sci., 34, 1169–1184, https://doi.org/10.1007/s00376-017-7014-5, 2017.
Xian, T. and Homeyer, C. R.: Global tropopause altitudes in radiosondes and reanalyses, Atmos. Chem. Phys., 19, 5661–5678, https://doi.org/10.5194/acp-19-5661-2019, 2019.
Xiao, Z., Yu, Y., Miao, Y., Zhu, S., He, H., Wang, Y., and Che, H.: Impact of Aerosols on Convective System Over the North China Plain: A Numerical Case Study in Autumn, J. Geophys. Res.-Atmos., 128, e2022JD037465, https://doi.org/10.1029/2022JD037465, 2023.
Xu, W. and Zipser, E. J.: Diurnal variations of precipitation, deep convection, and lightning over and east of the eastern Tibetan Plateau, J. Climate. , 24, 448–465, https://doi.org/10.1175/2010JCLI3719.1, 2011.
Xu, X., Miao, Q., Wang, J., and Zhang, X.: The water vapor transport model at the regional boundary during the Meiyu period, Adv. Atmos. Sci., 20, 333–342, https://doi.org/10.1007/BF02690791, 2003.
Xu, X., Lu, C., Shi, X., and Gao, S.: World water tower: An atmospheric perspective, Geophys. Res. Lett., 35, L20815, https://doi.org/10.1029/2008GL035867, 2008.
Xu, X., Wu, H., Yang, X., and Xie, L.: Distribution and transport characteristics of dust aerosol over Tibetan Plateau and Taklimakan Desert in China using MERRA-2 and CALIPSO data, Atmos. Environ., 237, 117670, https://doi.org/10.1016/j.atmosenv.2020.117670, 2020.
Xue, H. and Feingold, G.: Large-Eddy Simulations of Trade Wind Cumuli: Investigation of Aerosol Indirect Effects, J. Atmos. Sci., 63, 1605–1622, https://doi.org/10.1175/JAS3706.1, 2006.
Yan, H., Li, Z., Huang, J., Cribb, M., and Liu, J.: Long-term aerosol-mediated changes in cloud radiative forcing of deep clouds at the top and bottom of the atmosphere over the Southern Great Plains, Atmos. Chem. Phys., 14, 7113–7124, https://doi.org/10.5194/acp-14-7113-2014, 2014.
Yan, Y. and Liu, Y.: Vertical Structures of Convective and Stratiform Clouds in Boreal Summer over the Tibetan Plateau and Its Neighboring Regions, Adv. Atmos. Sci., 36, 1089–1102, https://doi.org/10.1007/s00376-019-8229-4, 2019.
Yan, Y., Liu, Y., and Lu, J.: Cloud vertical structure, precipitation, and cloud radiative effects over Tibetan Plateau and its neighboring regions, J. Geophys. Res.-Atmos., 121, 5864–5877, https://doi.org/10.1002/2015JD024591, 2016.
Yang, K., He, J., Tang, W., Qin, J., and Cheng, C. C. K.: On downward shortwave and longwave radiations over high altitude regions: Observation and modeling in the Tibetan Plateau, Agr. Forest Meteorol., 150, 38–46, https://doi.org/10.1016/j.agrformet.2009.08.004, 2010.
Yang, K., Ding, B., Qin, J., Tang, W., Lu, N., and Lin, C.: Can aerosol loading explain the solar dimming over the Tibetan Plateau, Geophys. Res. Lett., 39, L20710, https://doi.org/10.1029/2012GL053733, 2012.
Yao, T., Thompson, L., Yang, W., Yu, W., Gao, Y., Guo, X., Yang, X., Duan, K., Zhao, H., Xu, B., Pu, J., Lu, A., Xiang, Y., Kattel, D. B., and Joswiak, D.: Different glacier status with atmospheric circulations in Tibetan Plateau and surroundings, Nat. Clim. Change, 2, 663–667, https://doi.org/10.1038/NCLIMATE1580, 2012.
Yao, T., Masson Delmotte, V., Gao, J., Yu, W., Yang, X., Risi, C., Sturm, C., Werner, M., Zhao, H., and He, Y.: A review of climatic controls on δ18O in precipitation over the Tibetan Plateau: Observations and simulations, Rev. Geophys., 51, 525–548, 2013.
Zang, L., Rosenfeld, D., Pan, Z., Mao, F., Zhu, Y., Lu, X., and Gong, W.: Observing aerosol primary convective invigoration and its meteorological feedback, Geophys. Res. Lett., 50, e2023GL104151, https://doi.org/10.1029/2023GL104151, 2023.
Zhang, C., Tang, Q., and Chen, D.: Recent Changes in the Moisture Source of Precipitation over the Tibetan Plateau, J. Clim., 30, 1807–1819, https://doi.org/10.1175/JCLI-D-15-0842.1, 2017.
Zhang, F., Yu, Q. R., Mao, J. L., Dan, C., Wang, Y., He, Q., Cheng, T., Chen, C., Liu, D., and Gao, Y.: Possible mechanisms of summer cirrus clouds over the Tibetan Plateau, Atmos. Chem. Phys., 20, 11799–11808, https://doi.org/10.5194/acp-20-11799-2020, 2020.
Zhang, J., Zhao, B., Liu, X., Lin, G., Jiang, Z., Wu, C., and Zhao, X.: Effects of Different Types of Aerosols on Deep Convective Clouds and Anvil Cirrus, Geophys. Res. Lett., 49, e2022GL099478, https://doi.org/10.1029/2022GL099478, 2022.
Zhang, Y., Sperber, K. R., and Boyle, J. S.: Climatology and Interannual Variation of the East Asian Winter Monsoon: Results from the 1979–95 NCEP/NCAR Reanalysis, Mon. Weather Rev., 125, 2605–2619, https://doi.org/10.1175/1520-0493(1997)125<2605:caivot>2.0.co;2, 1997.
Zhao, X., Zhao, C., Yang, Y., Sun, Y., and Xia, Y.: Dust aerosol impacts on the time of cloud formation in the Badain Jaran Desert area, J. Geophys. Res.-Atmos., 127, e2022JD037019, https://doi.org/10.1029/2022JD037019, 2022.
Zhao, Y., Li, J., Zhang, L., Deng, C., Li, Y., Jian, B., and Huang, J.: Diurnal cycles of cloud cover and its vertical distribution over the Tibetan Plateau revealed by satellite observations, reanalysis datasets, and CMIP6 outputs, Atmos. Chem. Phys., 23, 743–769, https://doi.org/10.5194/acp-23-743-2023, 2023.
Zhao, Y., Li, J., Wang, Y., Zhang, W., and Wen, D.: Warming climate-induced changes in cloud vertical distribution possibly exacerbate intra-atmospheric heating over the Tibetan Plateau, Geophys. Res. Lett., 51, e2023GL107713, https://doi.org/10.1029/2023GL107713, 2024.
Zhou, S., Wu, P., Wang, C., and Han, J.: Spatial distribution of atmospheric water vapor and its relationship with precipitation in summer over the Tibetan Plateau, J. Geogr. Sci., 22, 795–809, https://doi.org/10.1007/s11442-012-0964-8, 2012.