the Creative Commons Attribution 4.0 License.
the Creative Commons Attribution 4.0 License.
 | 16 Aug 2024
Real-world emission characteristics of VOCs from typical cargo ships and their potential contributions to secondary organic aerosol and O3 under low-sulfur fuel policies
Fan Zhang
Binyu Xiao
Yan Zhang
Chongguo Tian
Rui Li
Can Wu
Yali Lei
Si Zhang
Xinyi Wan
Yubao Chen
Yong Han
Min Cui
Cheng Huang
Hongli Wang
Yingjun Chen
Mandatory use of low-sulfur fuel according to the global sulfur limit regulation has reduced the emissions of SO2 and particulate matter (PM) significantly on ships, and it also leads to a very large uncertainty in volatile organic compound (VOC) emissions. Therefore, an on-board test of VOCs from nine typical cargo ships with low-sulfur fuels in China was carried out in this study. Results showed that the emission factor of VOCs (EFVOCs) varied largely from 0.09 to 3.01 g kg−1 of fuel, with domestic coastal cargo ships (CCSs) having the highest level, followed by inland cargo ships (ICSs) and ocean-going vessels (OGVs). The switch of fuels from heavy fuel oil (HFO) to diesel increased EFVOCs by 48 % on average, which enhanced both O3 and secondary organic aerosol (SOA) formation potential, especially for OGVs. Besides, the use of low-sulfur fuels for OGVs also led to a significant increase in naphthalene emission. These indicated that the implementation of a global ultra-low-sulfur oil policy in the near future needs to be optimized. Moreover, aromatics were the most important common contributors to O3 and SOA in ship exhausts, which need to be controlled as a matter of priority. It was also found that the benzene, toluene, and ethylbenzene ratio of on average could be considered a diagnostic characteristic to distinguish ship emissions from other emission sources.
- Article
(3051 KB) - Full-text XML
-
Supplement
(1232 KB) - BibTeX
- EndNote


Maritime transport accounts for more than 80 % of global trade by volume (United Nations Conference on Trade and Development, 2020), leading to significant environmental and health effects (Corbett et al., 2007; Liu et al., 2016; X.-T. Wang et al., 2021). As a non-ignorable anthropogenic emission source of air pollutants, shipping emissions have gained more and more attention in recent decades. However, most of the previous studies focus on primary pollutants, such as SO2, NOx, COx, HC, particulate matter (PM), and its components, namely the particulate number (PN) (Y. Zhang et al., 2022; Santos et al., 2022; S. Zhou et al., 2019; Chu-Van et al., 2017; Reda et al., 2015; Buffaloe et al., 2014; Beecken et al., 2014; Moldanova et al., 2013; Fu et al., 2013; Moldanova et al., 2009; Lack et al., 2009; Lack et al., 2008). Only few studies estimate the influence of ship exhaust fumes on secondary photochemical oxidation products, such as O3 and secondary organic aerosol (SOA), and are concerned with their relative precursors (Jonson et al., 2009; Song et al., 2010; Lang et al., 2017; Wu et al., 2019; Wang et al., 2019; Wu et al., 2020). Results from these limited studies show that the ozone formation potential (OFP) and secondary organic aerosol formation potential (SOAFP) of shipping emissions are much greater than that from on-road vehicles due to their higher volatile organic compound (VOC) emission factors and normalized reactivities (Wu et al., 2019; Wu et al., 2020). Therefore, the neglection of secondary pollutants such as O3 and SOA would vastly underestimate the actual influence of shipping emissions on environmental air.
Volatile organic compounds (VOCs) are typical O3 and SOA precursors. Generally speaking, alkanes, alkenes, aromatics, and carbonyls with a carbon number > 6 in VOCs can form SOA (Grosjean, 1992; Grosjean and Seinfeld, 1989). While O3 is formed from the photochemical interactions of volatile organic VOCs and oxides of nitrogen (NOx), with alkenes having the highest maximum incremental reactivity (MIR), followed by aromatics and oxygenated VOCs (OVOCs; Carter, 1994). Typical aromatics, alkenes, and alkanes are the most concerning VOCs from diesel exhausts. For example, previous studies find that aromatics and alkanes contribute the most to SOAFP from diesel exhaust fumes, with single-ring aromatics such as toluene, benzene, and xylene contributing the most (Gentner et al., 2012; Che et al., 2023). M. Wang et al. (2020) point out that naphthalene, butene, toluene, benzene, and dodecane are the highest contributors to OFP from the exhausts of diesel trucks. Besides, OVOCs such as formaldehyde, acetaldehyde, and benzaldehyde also have high-ozone formation potential (Yao et al., 2015; M. Wang et al., 2020). Even though concentrations of PM2.5 have decreased rapidly in recent years, O3 presented continuous upward trends in most of China (Lu et al., 2020). More and more strict limitations of VOCs have been applied to the main sources such as industrial emissions and vehicle exhaust, while VOCs from shipping have not gained much attention. Most of the previous studies just give the characteristics of the total non-methane hydrocarbons (NMHCs) from ships but not specific VOC species (Cooper, 2003; F. Zhang et al., 2016). Only few studies have reported the VOC emission factors (EFs) and their composition from specific types of ships under specific operating conditions (Wu et al., 2020; R. Wang et al., 2020; Wu et al., 2019; Xiao et al., 2018; Zetterdahl et al., 2016; Huang et al., 2018b; Cooper et al., 1996). The limited measured VOC data cannot reflect the actual situation of shipping emissions. More on-board VOC measurement for typical ships with representative fuels under different operating conditions need to be carried out, especially after the implementation of low-sulfur fuel policies.
According to the International Maritime Organization (IMO), the maximum fuel sulfur content has been set to be 0.5 % () worldwide by 2020 and 0.1 % () in emission control areas (ECAs). The Chinese government has also set the coastal ECAs that require the sulfur content to be 0.5 % () since 2019 and 0.1 % () in inland ECAs since 2020 (Ministry of Transport of the People's Republic of China, 2018). The use of ultra-low-sulfur fuel (< 0.1 % ()) globally is an inevitable trend in the near future. Fuel quality could affect the pollutants from ship exhausts significantly. For example, a large amount of PM, SO2, and NOx has been reduced since the implementation of ship emission control policies (Weng et al., 2022; X. Wang et al., 2021; Zhang et al., 2019; Viana et al., 2015; Repka et al., 2021). It has also been revealed from the results of previous studies that the switching of high-sulfur-content fuels (sulfur content ≥ 0.5 %) to low-sulfur-content fuels (0.1 % < sulfur content < 0.5 %) leads to significant uncertainties in VOC emissions. For example, Wu et al. (2019) show that the reduction in EFs of VOCs (EFVOCs) is 67 % when switching from high-sulfur-content, heavy-fuel oil (HFO) to low-sulfur-content marine diesel oil for a container ship. While another study finds that after limiting the fuel sulfur content, the EFVOCs are approximately 15 times that of the values before the implementation of the fuel switch policy (IFSP) from ships at berth in Guangzhou, China. This leads to nearly 29 times greater OFP and approximately 2 times greater SOAFP than before IFSP (Wu et al., 2020). Huang et al. (2018c) also presented similar results of larger SOAFP when switching fuel from a high-sulfur-content HFO to diesel oil for a large cargo vessel. It seems that the low-sulfur fuel regulation has different effects on VOC emissions for different types of ships. Therefore, it is essential to figure out the actual emission of VOCs, as well as the formation potential of SOA and O3 under the conditions of low-sulfur fuel regulations. This will greatly reduce the uncertainties in VOC inventory estimation and provide basic data for the formulation of optimal emission control policies of ships after considering the comprehensive impacts on various pollutants.
By the end of 2022, China had 121 900 water transport vessels (Ministry of Transport of the People's Republic of China, 2022); 15 ports in China were listed among the top 20 ports in the world for cargo throughput, and 7 container ports were listed among the largest 10 container ports in the world. The large number of active ships in China has resulted in a serious impact on ambient air and human health, particularly in coastal, inland, and port areas (Huang et al., 2022; Zhang et al., 2017; Liu et al., 2016). Research reveals that most of the pollutants are from cargo transport ships compared with other types of ships (Wan et al., 2020). Clarifying the EF of VOCs, profiles, influence factors, and their contribution to the O3 and SOA formation potential of typical cargo ships are the basis for estimating the VOC inventory and for establishing proper control measures. Besides, it is also a very important breakthrough point to further improve the ambient air quality in port and nearshore areas by controlling the VOC emissions from ship exhausts.
Therefore, an on-board test of exhaust pollutants from nine typical cargo ships in China, including two coastal cargo ships (CCSs), three ocean-going vessels (OGVs), and four inland cargo ships (ICSs) was carried out in this study. VOC samples from different types of engines with different fuels under actual operating conditions were collected, and 106 VOC species were analyzed. Based on the data, the following factors were evaluated and discussed in this study: (1) fuel-based emission factors of VOCs (EFVOCs) and their components, (2) influence factors, (3) profiles of VOCs, and (4) O3 and SOA formation potential.
2.1 Test ships and fuels
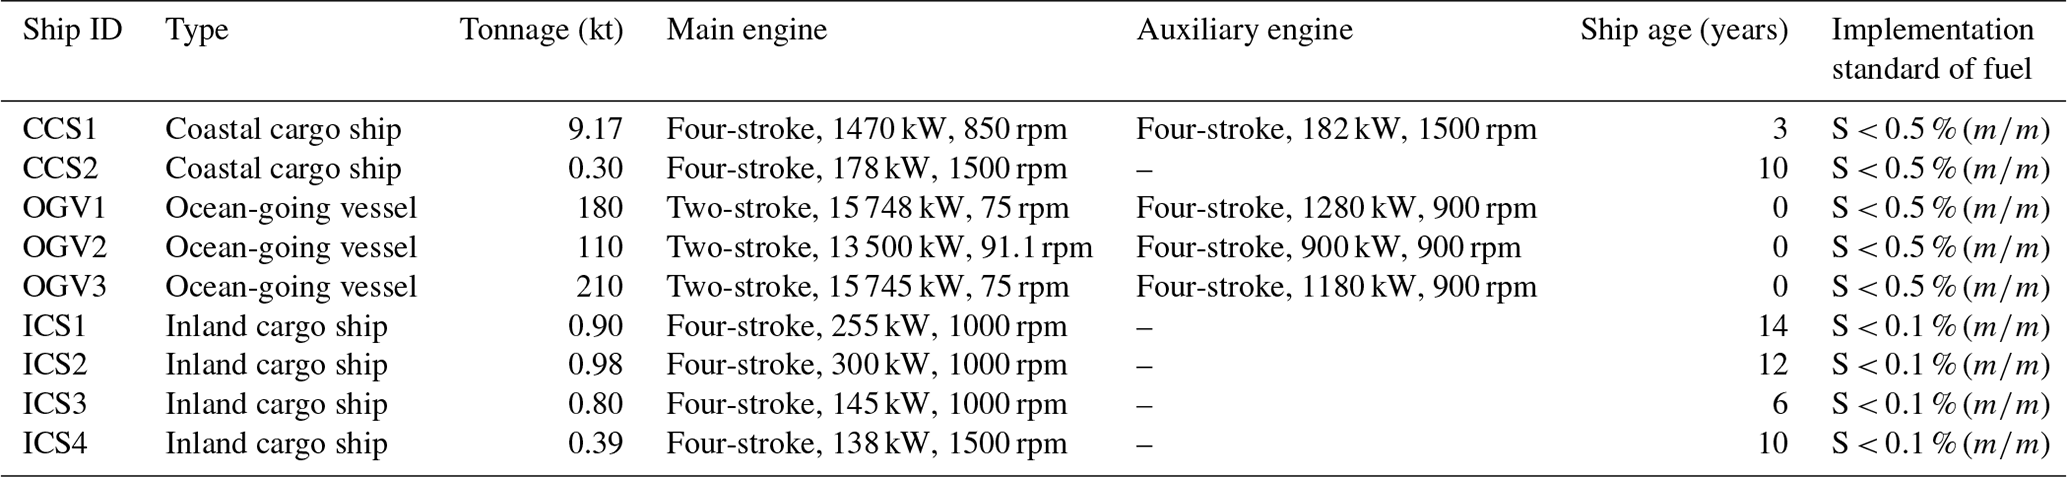
VOC samples from nine different ships were collected in this study, including two coastal cargo ships, three ocean-going vessels, and four inland cargo ships in the Yangtze River. The detailed technical parameters of the sampling ships are shown in Table 1. Different types of cargo ships had different technical parameters in China. For example, the engine power of coastal cargo ships varied largely, with about 57 % being equipped with engines of more than 500 kW. Of the other remaining coastal cargo ships, 17 % of which range from 150 to 250 kW. Therefore, one large coastal cargo ship with the main engine power of 1470 kW and another small coastal cargo ship with main engine power of 178 kW were selected here. Coastal cargo ships typically transport cargo among different coastal ports with 1 to several days per voyage. The main operating modes are cruise (∼ 75 % engine load), maneuvering (low and variable engine loads), and idling.
Ocean-going vessels usually have large tonnages with large power main engines. Statistical automatic identification system (AIS) data show that engines with power from 4 to 10 kW account for the largest proportion (∼ 25 %) of the total OGVs in China, followed by 2 to 4 kW (∼ 23 %) and 10 to 20 kW (∼ 20 %). Besides, newly built OGVs have a tendency to have greater and greater engine power. Hence, three ocean-going vessels with different engine power levels ranging from 13.5 to 15.7 kW were tested in this study. They are designed for transporting goods across borders, usually with several months per voyage. The main operating mode is cruising in the open ocean. While during the processes of coming in and out of the port, the engines of OGVs are typically active in the maneuvering mode, with relative lower and variable engine loads, which could have a great influence on the nearshore environment due to higher emission levels of pollutants.
Most inland cargo vessels are generally equipped with high-speed, small main engines powered by up to 1000 kW (∼ 70 %). Among them, the vast majority are below 500 kw. Therefore, four typical inland cargo ships with engine power between 138 and 300 kW were chosen in this study. The inland cargo vessels are typically active among different inland ports or coastal ports near inland rivers with several hours to several days per voyage. Affected by the complicated water conditions of inland rivers, cruise and maneuvering are the most important operating modes for inland cargo ships.
In brief, the measured ships in this study could represent the typical cargo ships in China to a certain extent. It is worth noting that the ocean-going vessels were newly constructed ships, while the inland cargo ships had older engines (6 to 14 years) compared with other types of ships (younger than 10 years).
Besides, most large cargo ships are equipped with both a main engine and an auxiliary engine. The main engine provides navigation power, and the engine loads vary greatly with the different operating modes. While the auxiliary engine mainly provides domestic electricity or heating on board, and the engine load is relatively stable with about 75 % load. Small cargo ships are equipped only with main engines, such as the tested inland cargo ships and small coastal cargo ships in this study.
Characteristics of the HFO and diesel oil used for the test ships in this study are shown in Table S1 in the Supplement. In order to meet the requirements of diesel engines for non-road mobile machinery in China, regular diesel (0#) was used for all inland cargo ships here. Results showed that the sulfur contents of all the fuels were no more than 0.5 % (), which were within current ship emission control standards of both China and the IMO. As typical tracers of high-sulfur-content HFO, nickel and vanadium content levels and their ratios were still higher but not distinguishable enough in low-sulfur-content HFO compared with diesel oil, which provides further evidence that it is necessary to be cautious when using them as tracers of ship emissions under the current low-sulfur regulation. It should be noted that much higher levels of calcium and zinc were detected in lubricating oils of OGVs.
2.2 Sampling system and samples
A portable dilution sampling system was used in this campaign, and the components and principles have been described elsewhere (Zhang et al., 2018). Briefly, two separate sampling pipes were placed into the exhaust stacks (about 1.5 m deep of the exhaust outlet) to route emissions from the main engine and auxiliary engine, respectively, to the sampling system on the highest deck of the ship. Then, the probe of a flue gas analyzer (testo 350, Testo, Germany) was placed into the sampling pipe to test the gaseous matters directly to obtain online data (CO2, O2, CO, NO, NO2, and SO2). Another probe was used to extract the flue gas for the diluted system. The dilution ratios ranged between 1–10 in this study. VOC samples were collected by summa canisters from both the main engines and auxiliary engines of all the ships listed in Table 1. The sampling time was 20–30 min for each sample, according to actual operating conditions.
A total of 48 VOC samples was obtained for the test ships, involving different engine types with different fuels under different operating modes (see Table S2 for detailed information). For the coastal/inland cargo ships, all samples were collected based on actual operating modes (about 1 to several days from one trip). For ocean-going vessels, samples from many more operating modes could be obtained thanks to the testing of the newly constructed ships (about 1 week from one trip).
2.3 Chemical and data analysis
As shown in Table S3, a total of 106 volatile organic compounds was detected in this study, according to United States Environmental Protection Agency (U.S. EPA) TO-15 1999, including 11 oxygenated volatile organic compounds (OVOCs), 17 aromatics, 29 alkanes, 11 alkenes, 35 halohydrocarbons, and 4 other species. These measured VOC species were typical concerning VOCs, could be considered the main VOC components referring to relative studies (Huang et al., 2018a; Wu et al., 2020; Araizaga et al., 2013), and could reflect the emission conditions of ship exhaust fumes. As shown in Eqs. (1) and (2), the carbon balance method was used to calculate the EFVOCs, which was also introduced in our previous study (F. Zhang et al., 2016).
where EFx is the EF for VOC species X (g kg−1 fuel), ΔX and ΔCO2 represent the concentrations of X and CO2 with the background concentrations subtracted (mol m−3), MX represents the molecular weight of species X (g mol−1), is the molecular weight of CO2 (44 g mol−1), and is the EF for CO2 (g kg−1 fuel).
where CF represents the mass of carbon in 1 kg diesel fuel (g C (kg fuel)−1); c(CCO), , c(CPM), and c(CHC) represent the mass concentrations of carbon as CO, CO2, PM, and HC (g C m−3), respectively, in the flue gas; and c∗(CO2) is the molar concentration of CO2 (mol m−3).
Detailed calculation processes of normalized ozone reactivity (; g O3 g−1 VOCs), OFP (g O3 kg−1 fuel), normalized secondary organic aerosol reactivity (RSOA; mg SOA g−1 VOCs), and SOA formation potential (SOAFP; mg SOA kg−1 fuel) are given in the following.
Normalized ozone reactivity (; g O3 g−1 VOCs) and OFP (g O3 kg−1 fuel) were calculated using the maximum incremental reactivity (MIR) coefficient method (Carter, 2010a) which represents the maximum contribution of VOC species to the near-surface O3 concentration under optimal conditions. The equations are as follows:
where ωi is the mass percentage of the total VOC emissions for species i, and MIRi is the MIR coefficient for VOC species i, which was referenced from Carter (2010b) (see Table S3 for details).
where OFP is the ozone formation potential (g kg−1 fuel), and [VOC]i is the emission factor for VOC species i (g kg−1 fuel).
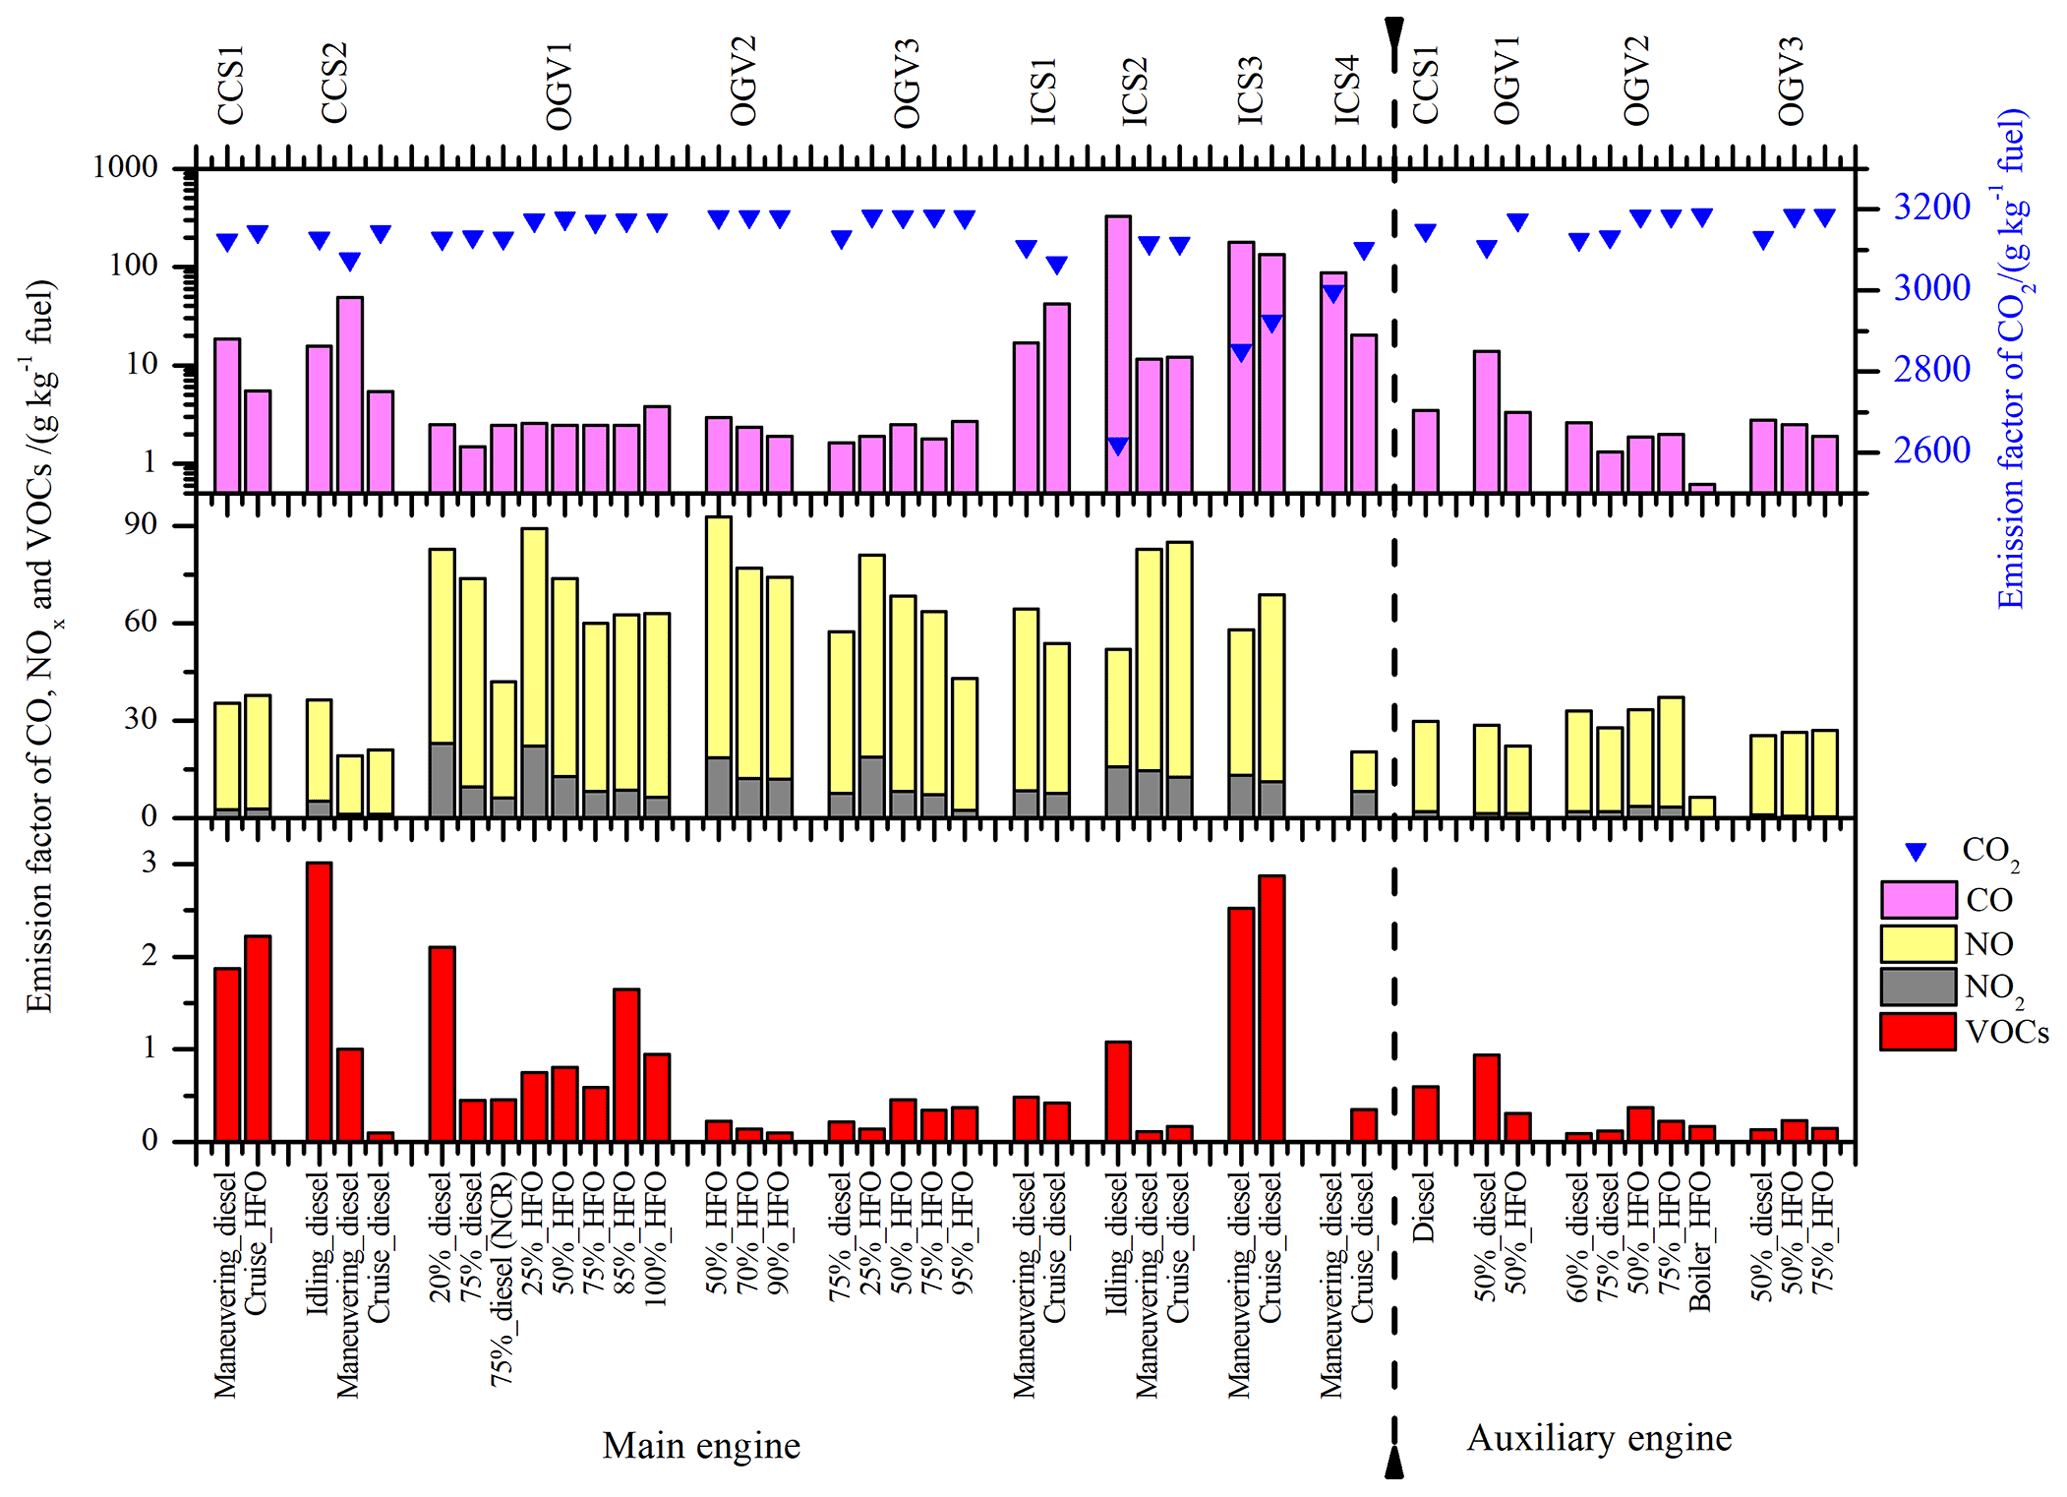
Figure 1Emission factors of gaseous pollutants under all operating conditions for the test ships.
As for O3, the normalized secondary organic aerosol reactivity (RSOA; mg SOA g−1 VOCs) and SOA formation potential (SOAFP; mg SOA kg−1 fuel) were also calculated. Their equations are as follows:
where Yi is the SOA yield for VOC species i (see Table S4 for details). The SOAFP of VOCs under high-NOx and low-NOx conditions was calculated.
2.4 Quality assurance and quality control
Rigorous quality assurance and quality controls were conducted during the whole experiment. Ambient air blanks were analyzed in the same way as mentioned above to determine background concentration. The VOC concentrations of each sample were obtained by subtracting ambient air blank results. Duplicate samples, as well as standard gas, were examined after analyzing a batch of 10 samples to ensure that the error was within 5 %.
3.1 Emission factors and components of VOCs
EFVOCs for the test ships are shown in Fig. 1 and Table S5. In order to calculate the EFVOCs and investigate their influence factors, EFs of other gaseous pollutants such as CO2, CO, NO, and NO2 were also given and discussed briefly. For CO2, the emission factors ranged from 2622 to 3185 g kg−1 fuel that was influenced by both fuel type and operating mode. CO showed the opposite trend with CO2, varying from 0.62 to 180 g kg−1 fuel and reflecting the condition of the combustion efficiency. The ranged from 6.26 to 92.8 g kg−1 fuel, with 60 % to 99 % NO, which inferred the condition of the combustion temperature in the cylinder.
Results showed that the EFVOCs for all test ships presented wide differences, which ranged from 0.09 to 3.01 g kg−1 fuel. Ship type, engine type, operating mode, and fuel type could influence the EFVOCs that will be discussed in more detail in Sect. 3.2. Briefly, higher VOCs had been observed both in low-load and high-load operating modes such as maneuvering and idling, while in medium-load operating modes, the EFVOCs presented lower levels (a detailed result is also shown in Fig. 3a). Main engines presented obviously higher EFs levels than auxiliary engines (see Fig. 3c for details). And CCSs and ICSs had relatively higher EFs compared with OGVs (see Fig. 3d for details). It was worth noting that when the fuels were switched from HFO to marine diesel oil for OGVs, increasing trends were presented for EFVOCs in this study, while the CCSs showed the opposite trend with a slight decrease for EFVOCs.
Table 2EFs of VOCs from ships in this study and previous studies. ro-ro stands for roll on–roll off.
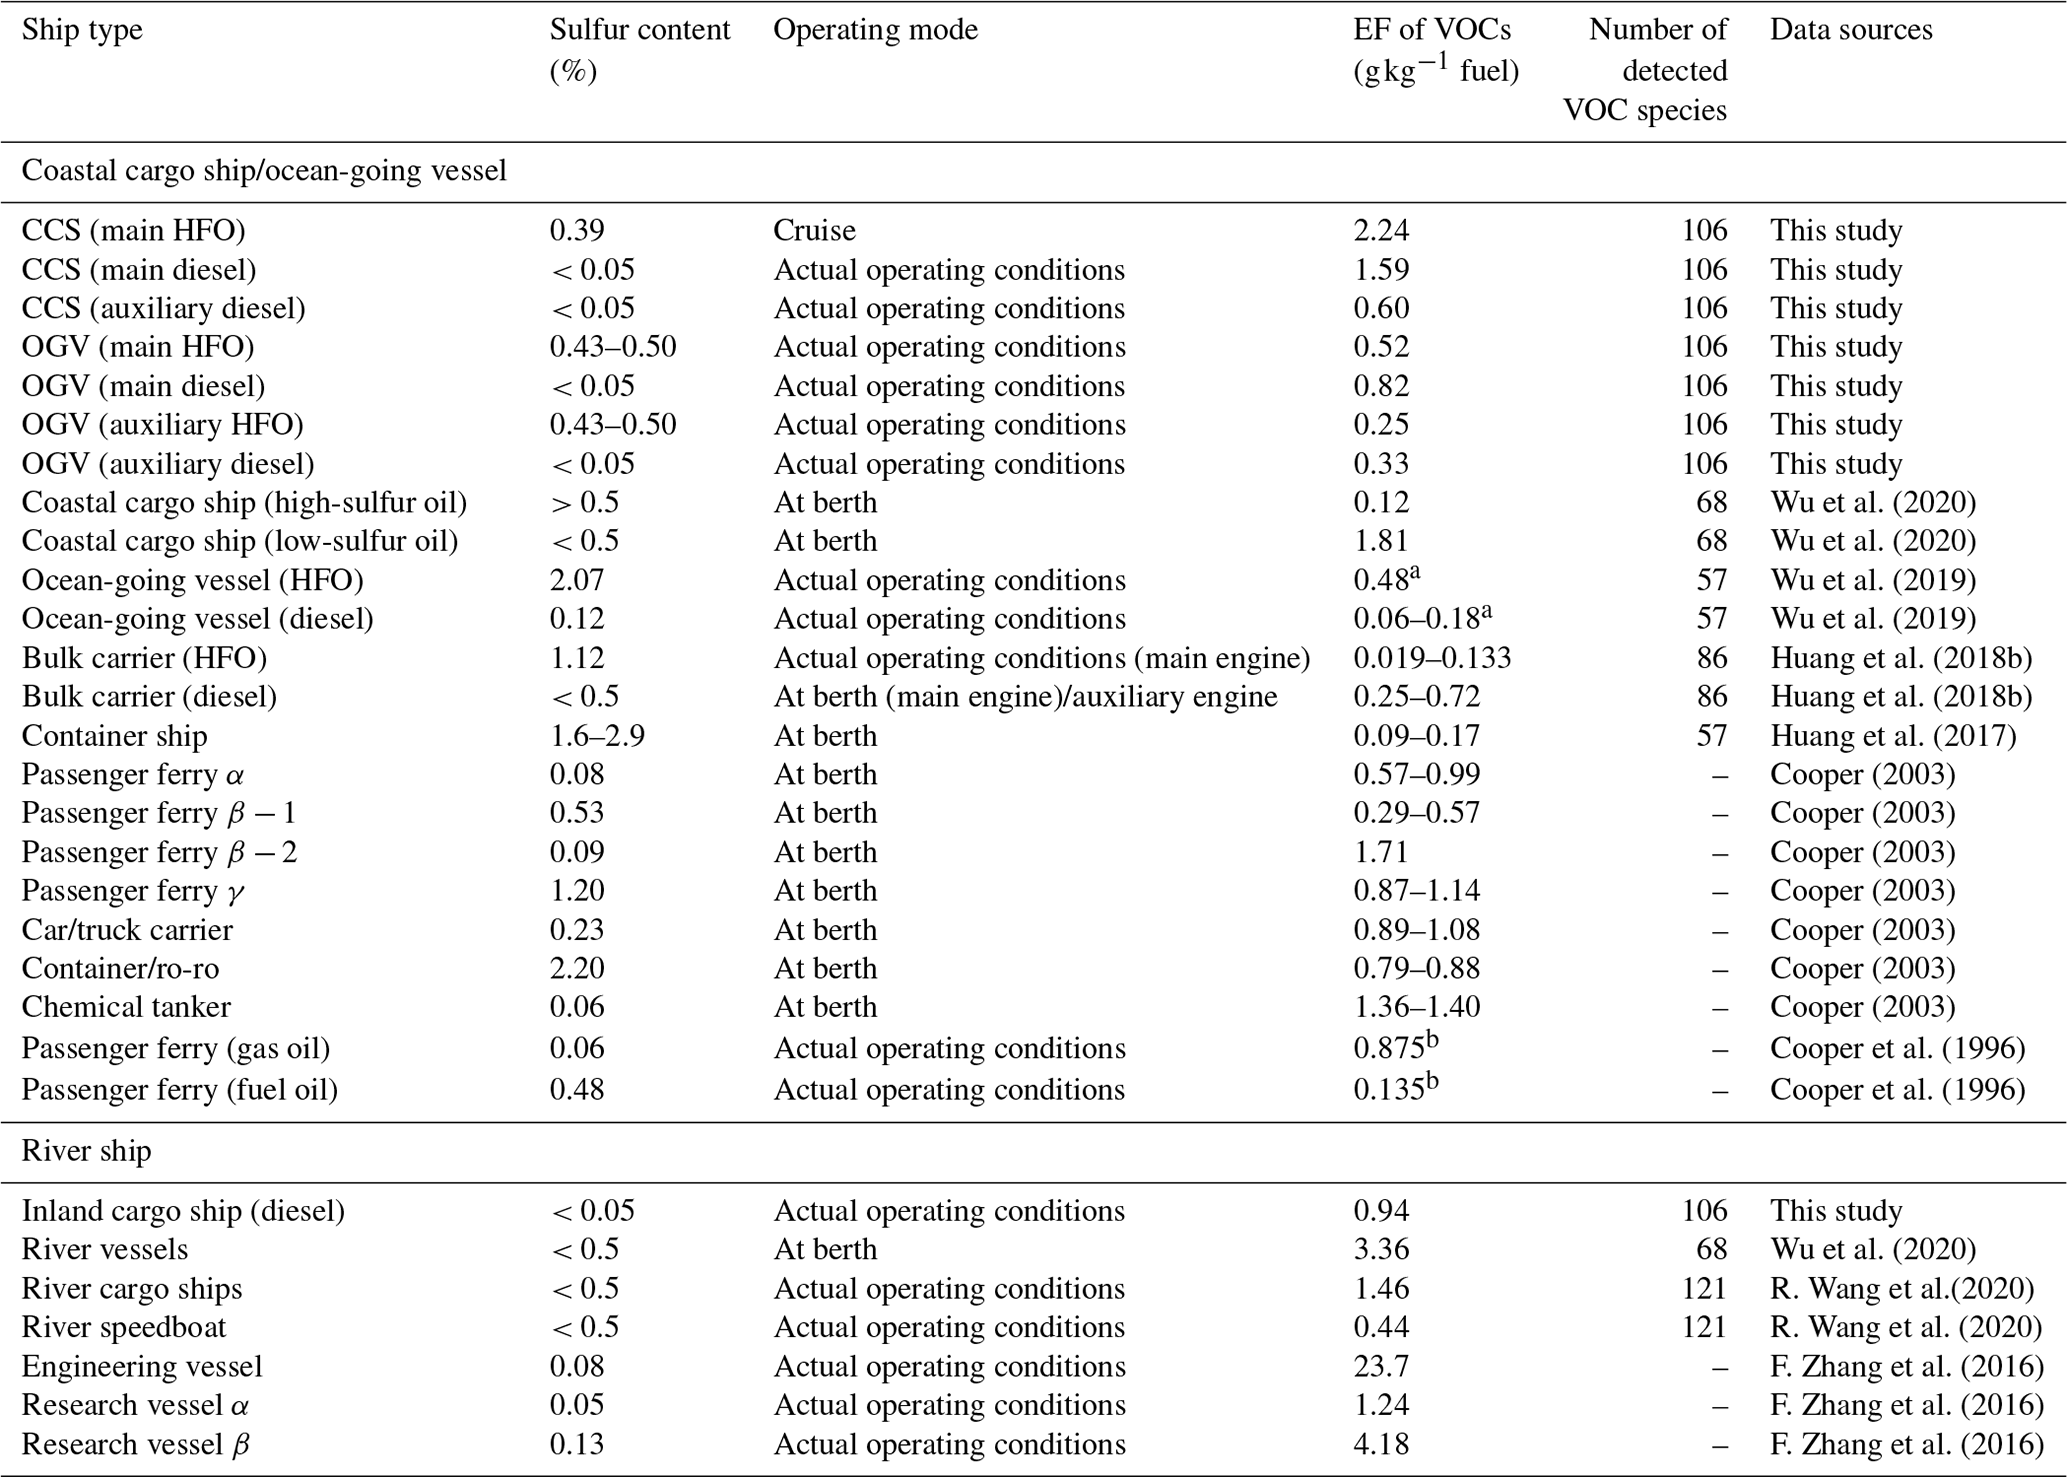
a The EF values were estimated based on Fig. 2. b The EFs were calculated by assuming that the fuel consumption rate for the test ships was 200 g fuel kWh−1.
Average EFVOCs emitted from ships in this study were also compared with those reported in other studies (Table 2). Altogether, the measured EFVOCs varied largely from 0.02 to 23.7 g kg−1 fuel for all test ships. Complex factors could lead to the large uncertainty, such as the different detected VOC species in different studies and different engine types and fuel qualities. This also indicated that the uncertainty should be noticed when EFVOCs were used as basic data to calculate the emission inventory or estimate other environmental influences. The test ships in this study presented a comparable level of EFVOCs with other studies. It seemed that OGVs with large engines typically showed a lower level of EFVOCs no matter what types of fuel was used when compared with river ships and coastal ships. Moreover, compared with on-road vehicles with diesel fuel (H. Zhou et al., 2019), VOCs emitted from non-road engines, such as ships, agricultural machinery, and construction machinery, had much higher levels (Huang et al., 2018a; Hua et al., 2019; Zhou et al., 2022), which should be paid more attention, especially in the case of more and more strict limitations of VOCs being applied to on-road vehicles.
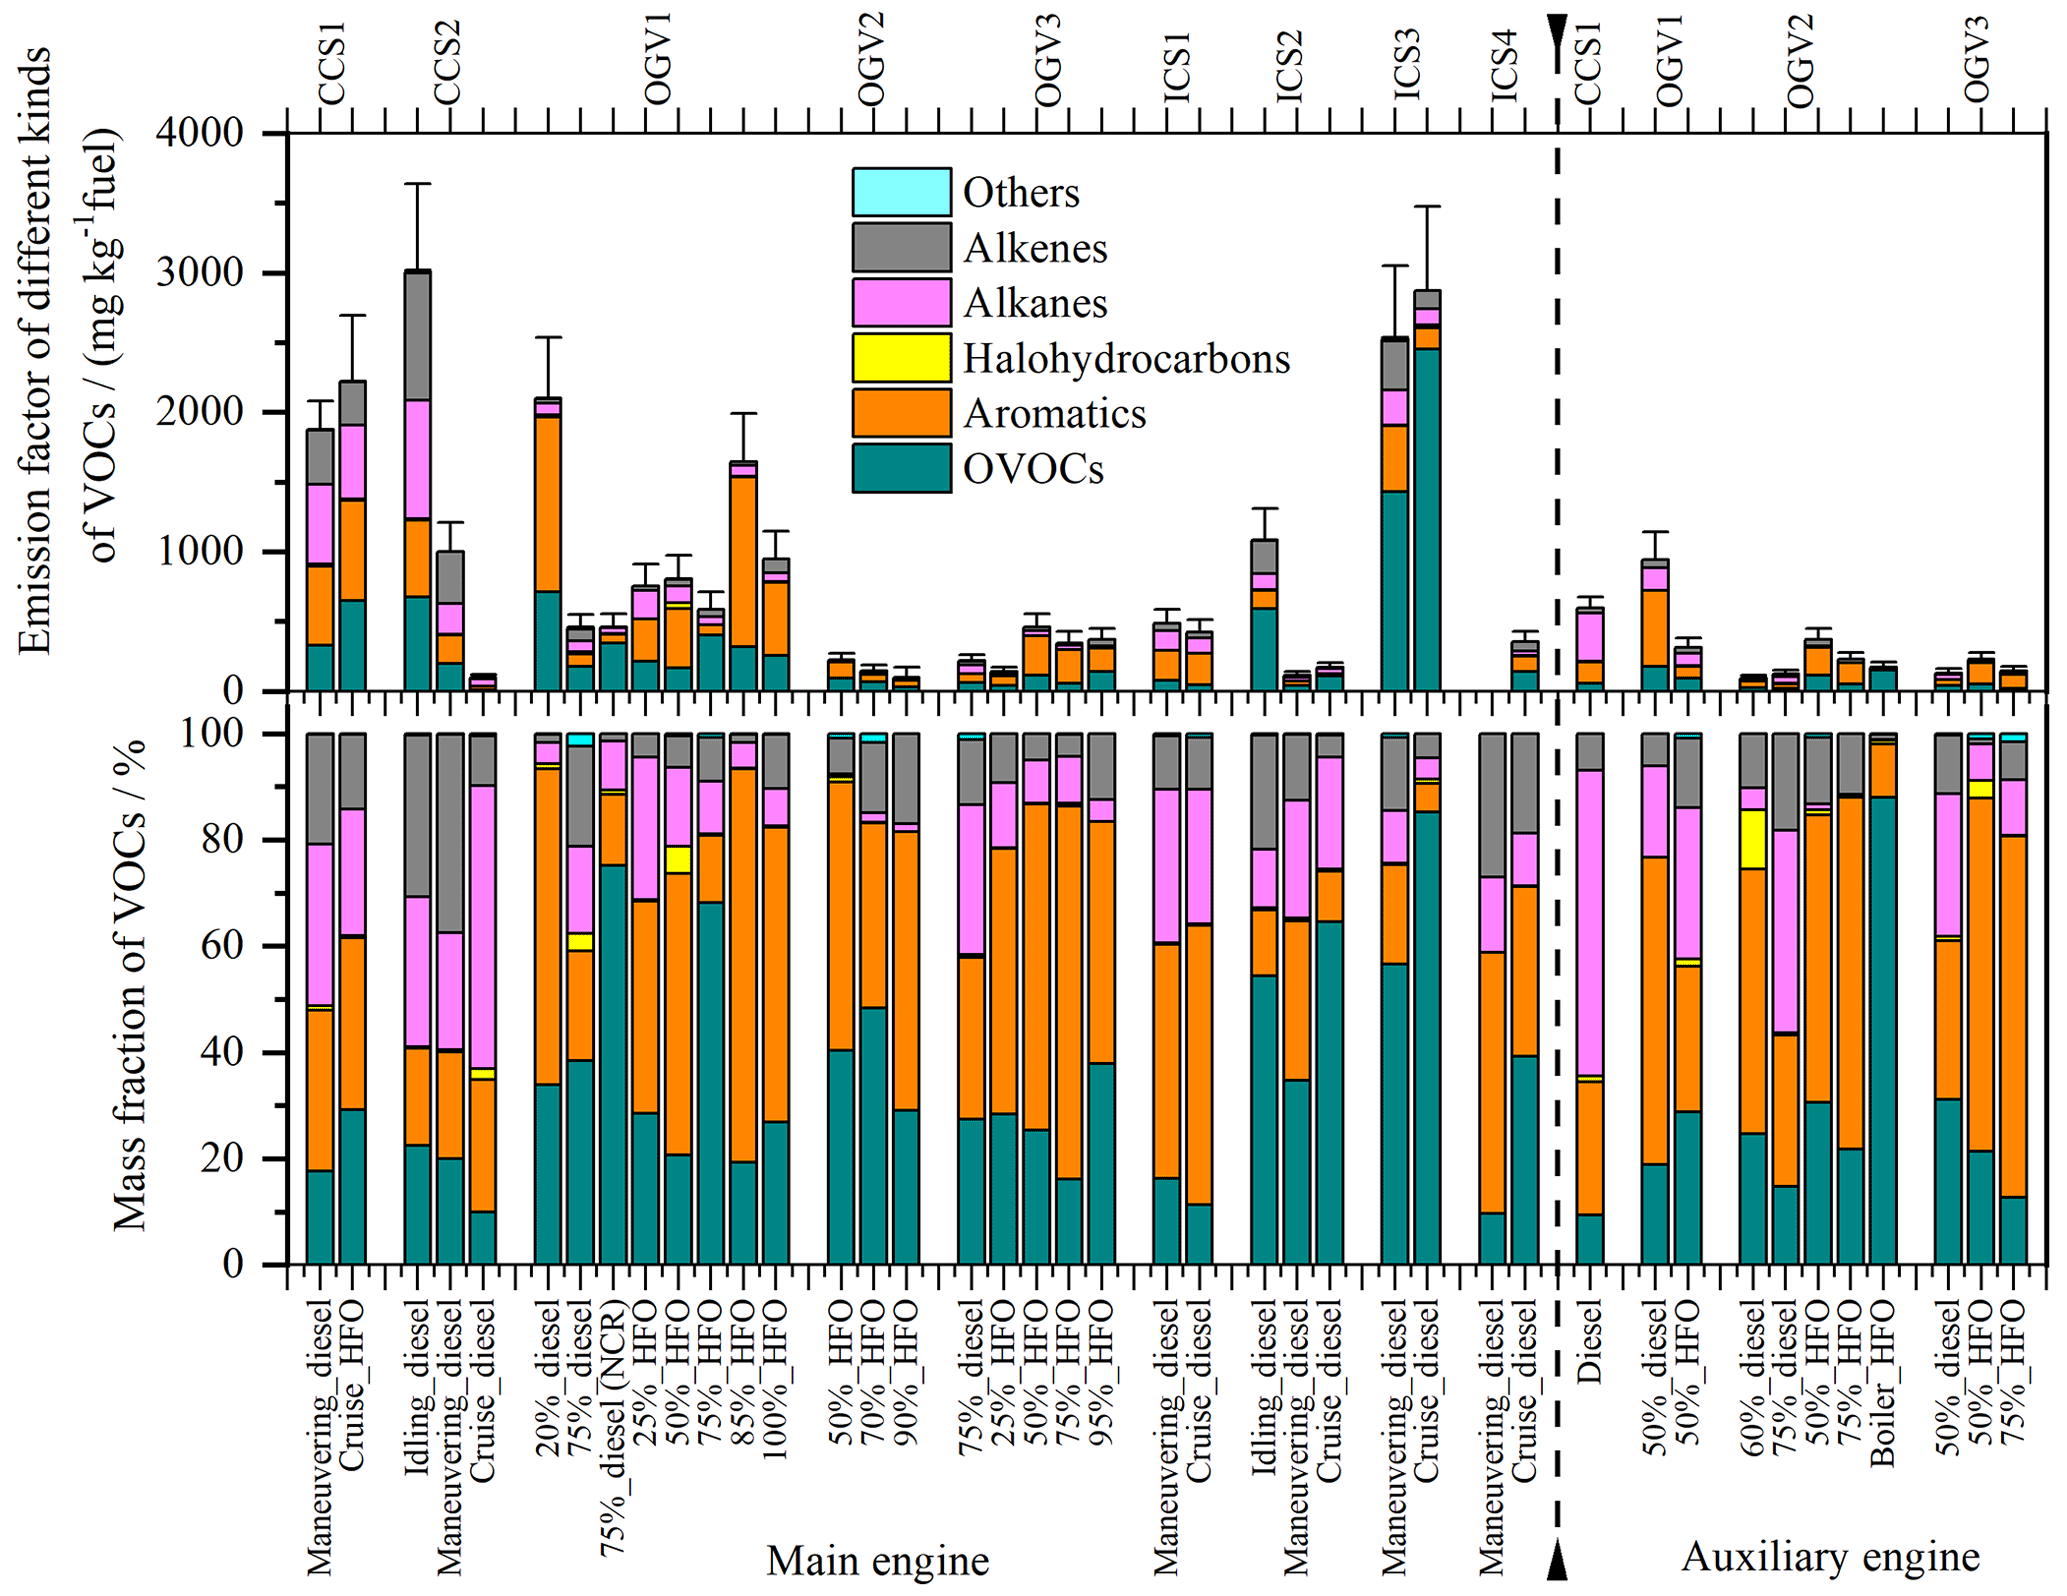
Components and mass fractions of VOCs from the test ships are shown in Figs. 2 and S1 in the Supplement. OVOCs and aromatics were the main components of the detected VOC species, accounting for 9.38 %–88.0 % and 5.38 %–74.0 % of the total VOCs, respectively. Alkanes also accounted for non-ignorable fractions, which ranged from 0.2 % to 57.2 %. Alkenes, halohydrocarbons, and other quantified species only contributed small fractions of the total VOCs. The results in this study were consistent with that of Huang et al. (2018a) about a large ocean-going bulk carrier but showed different VOC components compared to that of Wu et al. (2019) for a coastal container ship and Wu et al. (2020) for auxiliary engines at berth. The different detected VOC species in different studies played an important role in the differences, while the fuel type and its chemical composition might also have considerable impacts.
The main VOC components of OVOCs, aromatics, alkanes, and alkenes presented different variation patterns under different operating modes, fuel types, and engine types due to their different formation mechanisms (Fig. 2). For example, OVOCs from diesel engines are typically from the oxidation of small molecular weight, yet incomplete, combustion hydrocarbons (Hao et al., 2014; Pan, 2008); therefore, the operating mode and engine type could influence the EF levels obviously but not the fuel type. The direct emission of unburned fuel components and pyrosynthesis (formation of aromatics by the regeneration of fragmented radical species) are the two main formation processes of polycyclic aromatic hydrocarbons (PAHs) (Radischat et al., 2015). EFs of aromatics showed relatively higher levels in medium operating modes compared with other modes in this study. One main reason was that the higher temperature in medium operating modes promoted polymerization, resulting in the processes of dehydrogenation and PAH formation (Zhang et al., 2021) which exceeded the direct emission of unburned fuel components (Radischat et al., 2015). Alkanes are mainly from the incomplete combustion of fuels; therefore, alkanes from diesel fuel presented higher EFs than HFO because of the higher aliphatic compounds in diesel fuel (Liu et al., 2022; Sippula et al., 2014). Alkenes emitted from diesel engines are always related to the pyrolysis process of the fuel combustion in the cylinder (Alotaibi et al., 2018; M. Zhang et al., 2022). As a result, in high operating modes of more than 90 % engine loads, it had higher EFalkenes levels in this study due to the pyrolysis process under higher temperature and incomplete combustion because of the smaller air-to-fuel ratios in the cylinder.
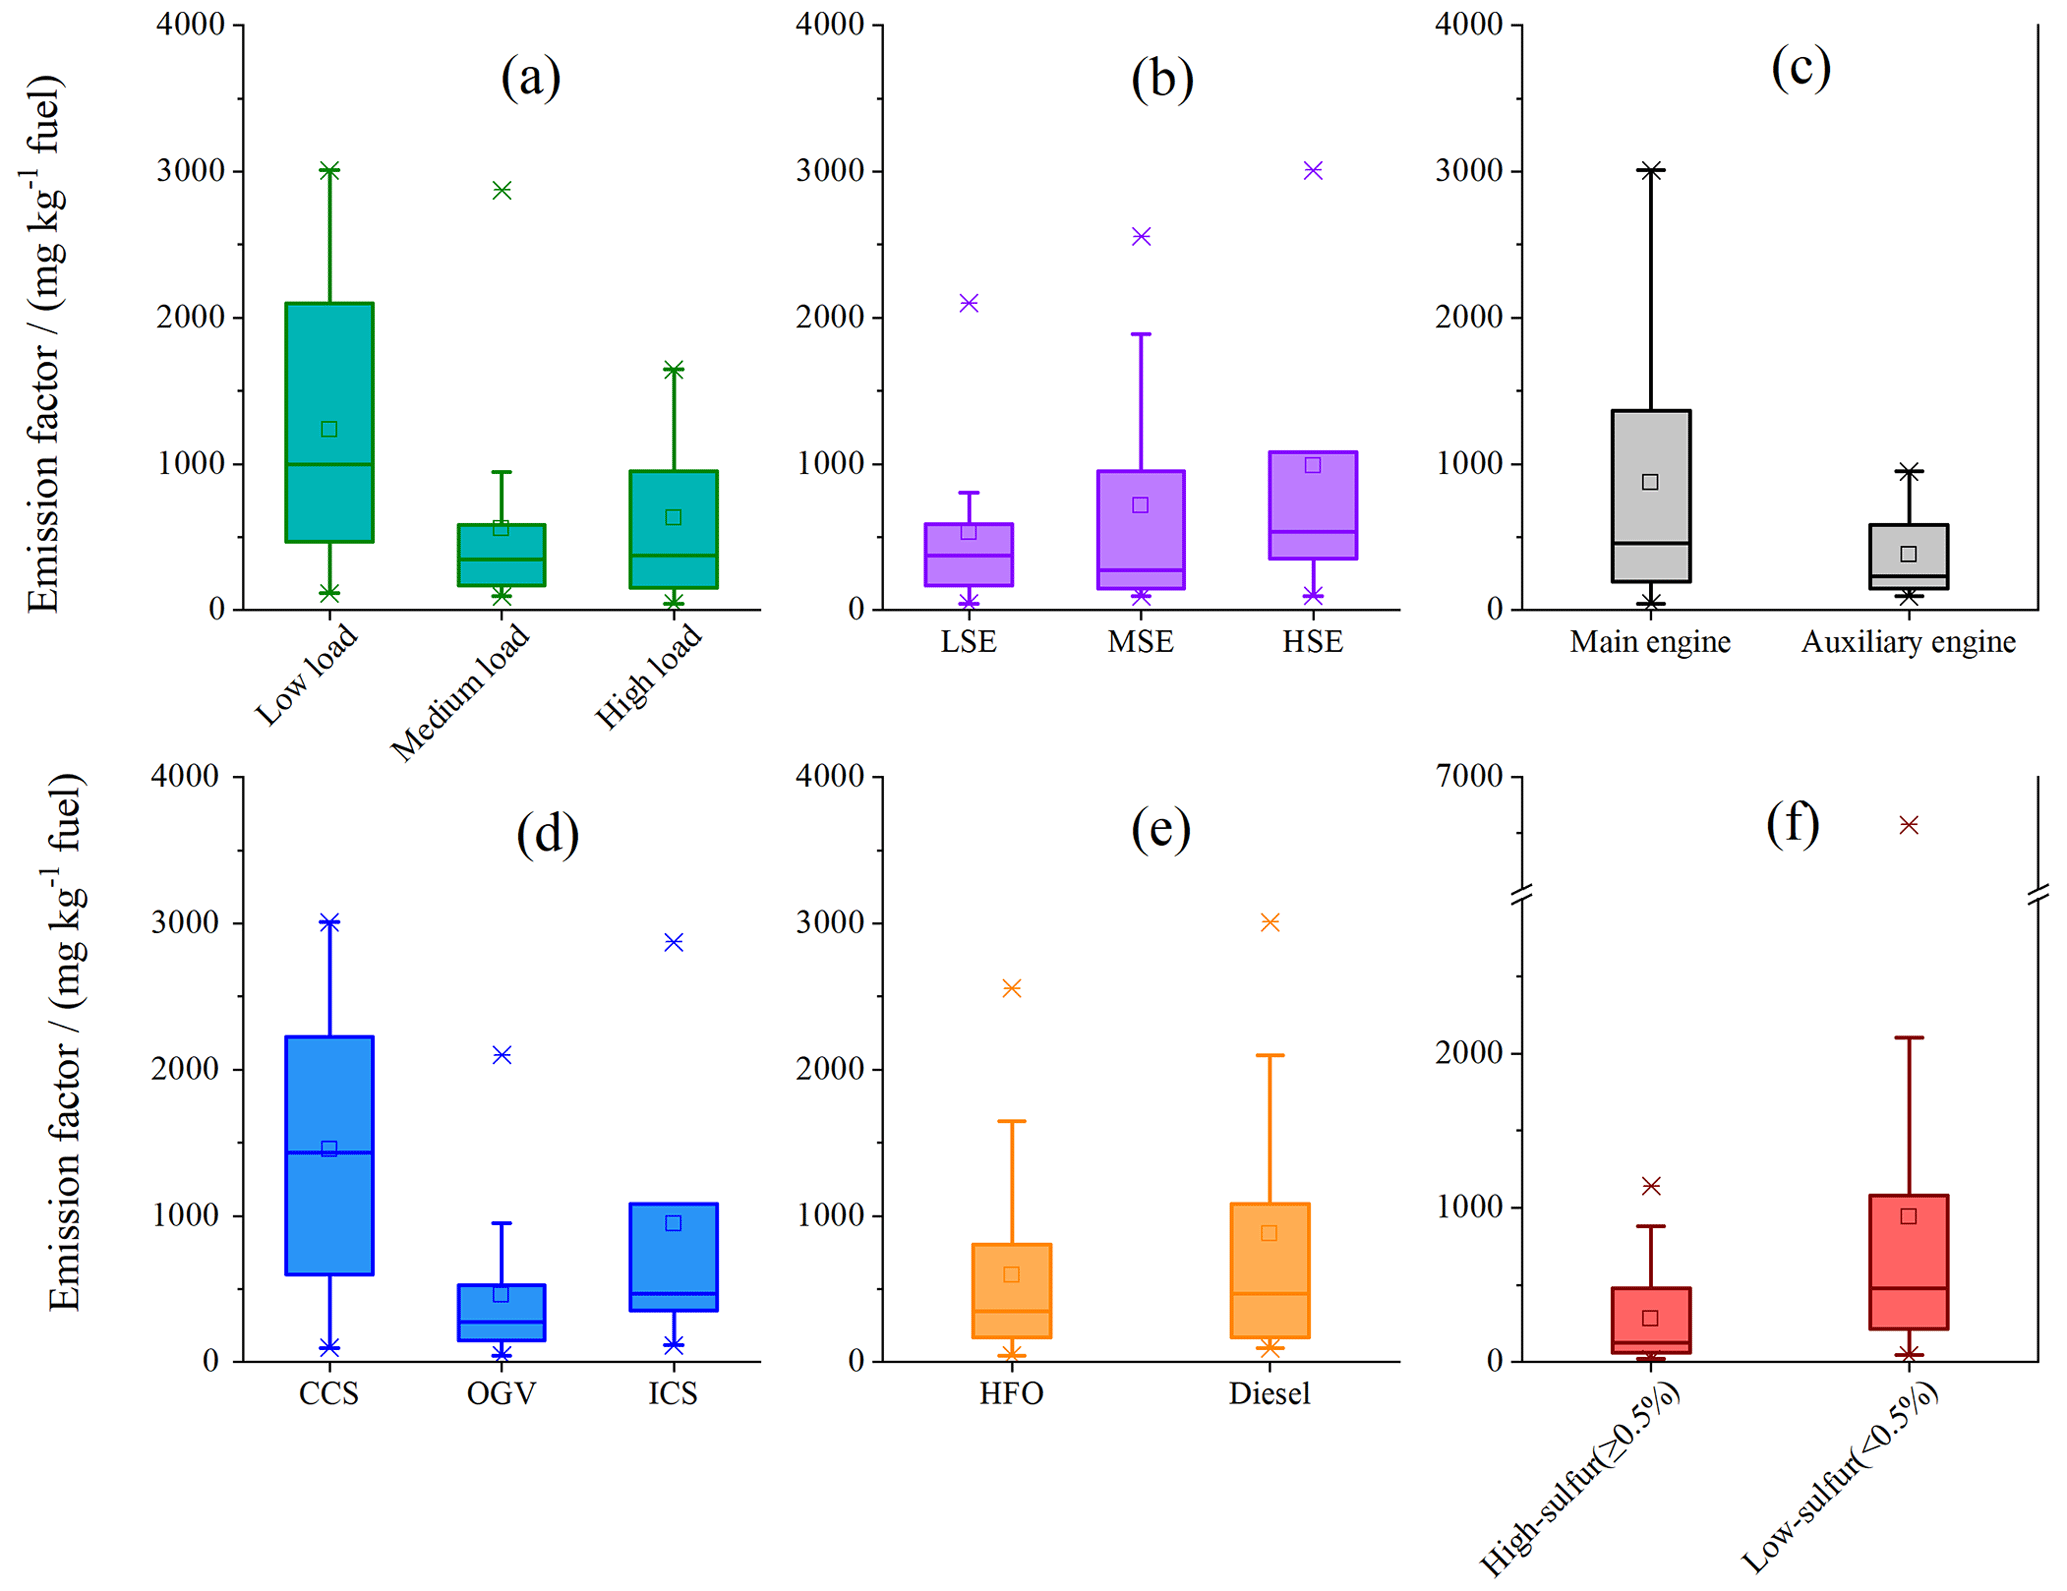
3.2 Influence factor analysis
It was mentioned above that influence factors such as the operating condition, engine type, ship type, and fuel type could affect the emission level and component of VOCs from ship exhaust fumes. Box-and-whisker plots of VOC emission factors under these different drivers are presented in Fig. 3. As shown in Fig. 3a, the engine load could affect the VOC emission significantly. EFVOCs had the lowest level when the engines were operating in medium loads and the highest in low loads. This was consistent with the results of VOC emissions reported by previous studies such as Huang et al. (2018a), Wu et al. (2019), and Radischat et al. (2015), which are also shown in Fig. S2. The combustion condition in the cylinder could be responsible for the variation in the VOC emissions, which means that incomplete combustion was one principal reason for the high VOC emissions.
Engine type is also one significant influence factor of VOC emissions. The engines were classified into three types in this study according to their engine speed, including low-speed engines (LSEs; rated speed < 100 rpm), medium-speed engines (MSEs; 100 rpm ≤ rated speed < 1000 rpm), and high-speed engines (HSEs; rated speed ≥ 1000 rpm). It can be seen from Fig. 3b that with the increase in engine speed, the EFVOCs showed an increasing trend. This could be explained by the fact that, when compared with HSEs, LSEs with high engine power usually had higher combustion efficiencies that led to lower levels of VOC emissions (Zhang et al., 2018).
The EFVOCs between the main engines and auxiliary engines also varied obviously. The average EFVOCs from the main engines were 2.3 times that of auxiliary engines in this study (seen in Fig. 3c). A similar result was also reported by Liu et al. (2022) about the intermediate volatile organic compound (IVOC) emission for the same test OGVs, even though the auxiliary engines were mainly high-speed or medium-speed engines that had higher VOC emissions as mentioned above. Owing to the much lower VOC emissions in medium loads that the auxiliary engines have been using, it could be inferred that the impact of the operating condition exceeded that of the engine type to VOC emissions.
As seen in Fig. 3d, the EFVOCs varied obviously under different types of ships, with CCSs having the highest levels and OGVs the lowest. This could be explained by the combined influence of the operating condition and engine type, as mentioned above. First, as shown in Fig. 3b, high-speed and medium-speed engines were equipped for the CCSs, and they could lead to a higher emission factor of VOCs (EFVOCs) compared with low-speed engines that are equipped for OGVs. Besides, the unstable operating conditions of CCSs and ICSs, such as maneuvering and low load, also promoted the emission of VOCs (Radischat et al., 2015). Therefore, it could be indicated that coastal areas with a high population density need get more attention due to the higher VOC emissions from CCSs and ICSs.
As mentioned before, the fuel type could influence the EFVOCs significantly (Wu et al., 2019, 2020), which also would be one of the most important influence factors in the future under the background of increasingly strict ship oil policies. Under the condition of low-sulfur-content fuels in China, the average EFVOCs were 592 and 878 mg kg−1 fuel for diesel and HFO in this study, respectively (seen in Fig. 3e). In addition to the direct emission of unburned fuel components, VOCs also could be emitted from the pyrosynthesis of the fuel in the cylinder (Radischat et al., 2015). In order to explore the relationship between the chemical composition of low-sulfur-content fuel and VOC emissions, n-alkanes, b-alkanes, and aromatics in the fuels from OGVs were tested (Liu et al., 2022) (see Table S6 for details). Obviously, diesel had higher n-alkanes and b-alkanes content than HFO, and aromatics were the opposite. It can be seen from Fig. S3 that the EFAlkanes, EFAlkenes, and EFhalohydrocarbons from ships with diesel presented higher levels compared with that of HFO. EFAromatics and other components showed the opposite trends, while no obvious difference in EFOVOCs was observed between diesel and HFO. Emission characteristics of the VOC main components were basically consistent with the fuel composition in this study. It could be argued that the composition of fuel did have a significant impact on VOC emissions.
To further explore the impact of the sulfur content of fuel on VOC emissions, EFVOCs of low-sulfur-content fuel (< 0.5 % ) and high-sulfur-content fuel (≥ 0.5 % ) in this study and previous studies were summarized in Fig. 3f. The average EFVOCs from low-sulfur-content fuel was significantly higher than that of high-sulfur-content fuel by almost 3.4 times. This indicated that when the fuels were switched from high sulfur to low sulfur there was a dramatic increase in VOC emissions. Low-sulfur-content fuels are usually produced in three ways, including a blending technique that uses light low-sulfur oils mixed with heavy high-sulfur oils; heavy-oil hydrogenation technology that removes sulfur through the hydrogenation of high-sulfur residual oil; and biological desulfurization technology that uses microbial enzymes to catalyze and oxidize the organic sulfur in oil, convert it into water-soluble sulfide, and then remove the sulfur (Kuimov et al., 2016). Among these, blended low-sulfur oils are the most widely used oils (Zhang, 2019; Han et al., 2022). Except for light low-sulfur oils mixed during the production of low-sulfur oils, other non-petroleum refined oils, such as coal tar and chemical waste, are also added. Consequently, emission factors, as well as the composition of VOCs, have changed significantly. Since low-sulfur-content fuels (< 0.5 % ) have been used worldwide since 2020 and 0.1 % () in ECAs since 2015, it would imply that the impact of fuel type on VOC emissions needs to be given sufficient attention.
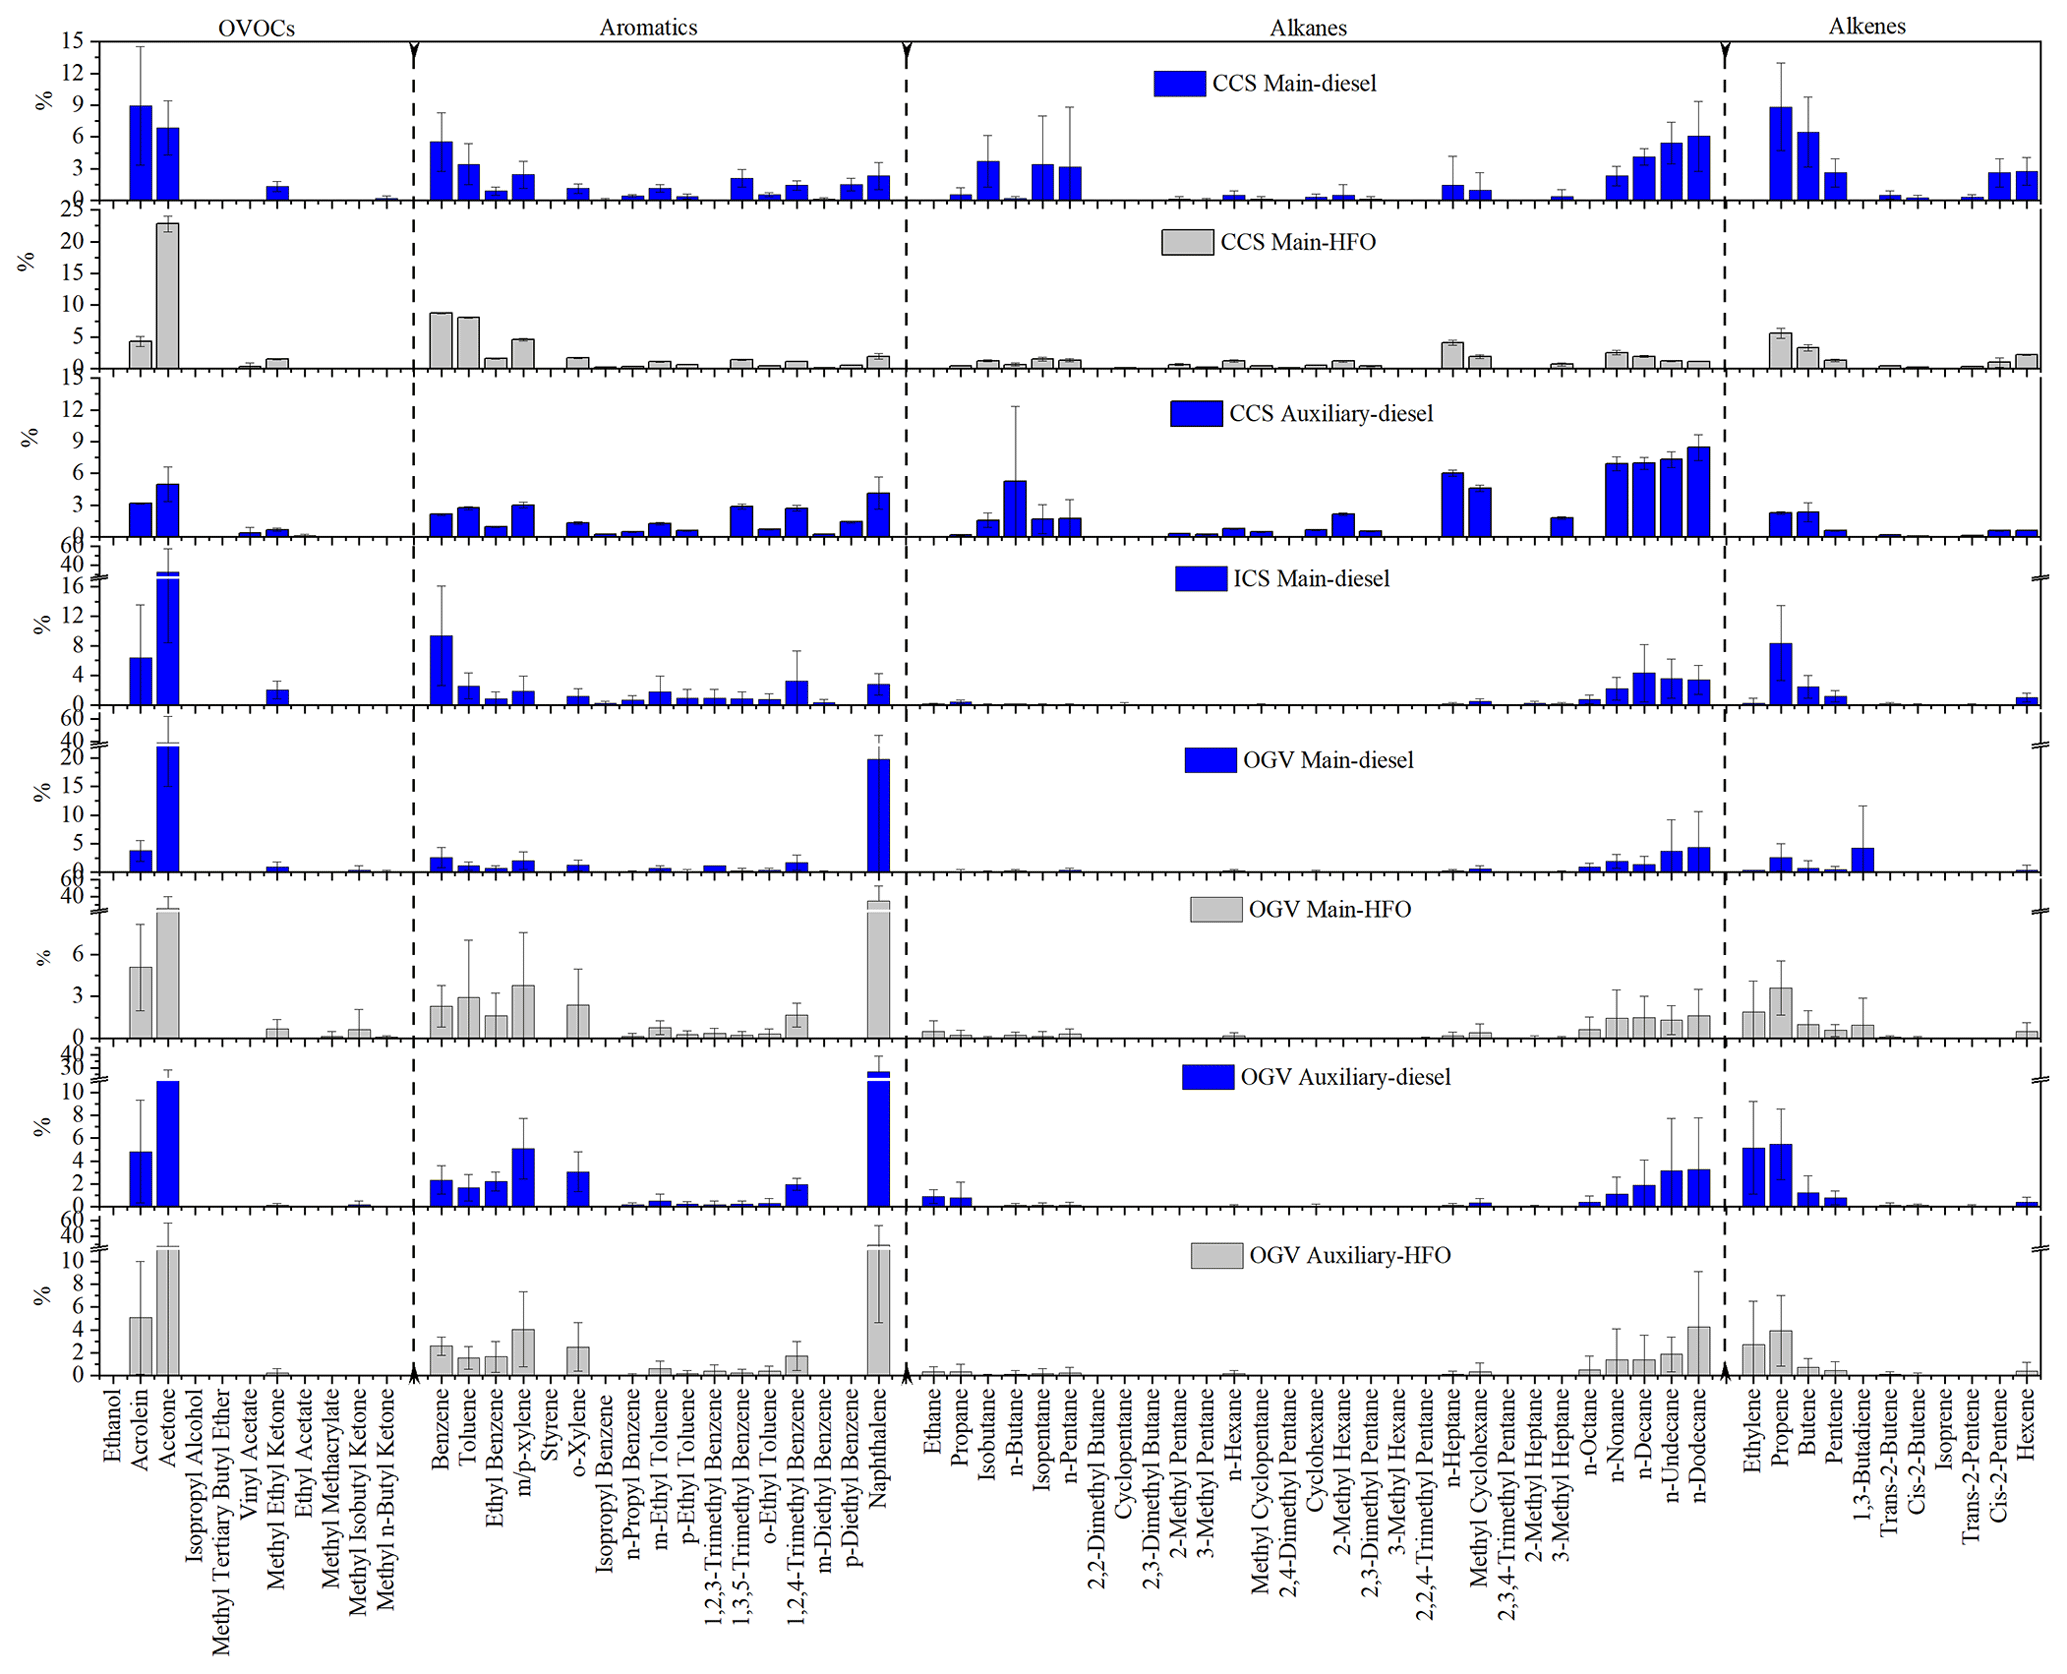
Figure 4Mass fractions of individual VOCs from test ships under different engine types and fuels (except halohydrocarbons, tetrahydrofuran, carbon disulfide, and 1,4-dioxane due to their very small mass fractions).
3.3 Profiles and diagnostic characteristics of VOCs
3.3.1 Profiles of VOCs
Figure 4 presents the mass fractions of VOCs (except halohydrocarbons, tetrahydrofuran, carbon disulfide, and 1,4-dioxane due to their very small mass fractions; 0.55 %–3.06 % of total VOCs) from the three types of test ships (CCSs, OGVs, and ICSs) under different engine types (main engine and auxiliary engine) and fuels (HFO and diesel). Detailed mass fractions of all the test VOC species in this study are also given in Table S7. As shown in Fig. 4, the profiles of VOCs showed obvious differences. To be specific, the most abundant VOC species were acetone and acrolein in OVOCs; propene and butene in alkenes; and n-nonane, n-decane, n-undecane, and n-dodecane in alkanes for almost all of the test ships. As for aromatics, the OGVs showed big differences compared with other types of ships that had large amounts of naphthalene, while benzene, toluene, and m/p-xylene were the highest-content aromatic substances for other ships. Previous studies on OGVs showed the similar high naphthalene and acetone contents in the exhaust when using low-sulfur fuels (Agrawal et al., 2010; Huang et al., 2018b). Besides, high levels of formaldehyde and acetaldehyde were also found in exhausts of OGVs (Agrawal et al., 2010). Unfortunately, because of the limitation of the testing methods, they were not measured in this study. Due to the high reactivity and the important role in the formation of secondary organic aerosols, formaldehyde and acetaldehyde need to receive more attention from ship exhausts, especially for OGVs. In addition, a small scientific research ship (499 t; 5 years; high-speed engine; diesel (0#)) was also tested in this study, and the VOC profile is given in Fig. S4 for comparison. Obviously, the VOC profile pattern was very similar to that of inland cargo ships with the same small high-speed engines and diesel (0#) as fuel, indicating the significant impact of the engine type and fuel type.
The top 25 VOC species from the test cargo ships are presented in Table S8. It could be seen that most of the top 25 VOC species emitted from exhausts were the same but with different rankings for different engine types under different fuels. For example, OVOCs, alkenes, and aromatics were the most abundant VOC species for the main engines of CCSs and ICSs, while alkanes were ranked as the highest-content VOC species for auxiliary engines. As mentioned above, naphthalene and acetone were the absolute highest two VOC species for OGVs, followed by alkenes, OVOCs, and aromatics from exhausts of HFO fuel; but alkenes, OVOCs, and alkanes from exhausts of diesel fuels. This high naphthalene emission has also been shown in other studies (Radischat et al., 2015; Huang et al., 2018c; Yeh et al., 2023). The unusually high naphthalene levels from OGVs need to be noted. Naphthalene was mainly formed during the pyrolyzation from incomplete combustion and the direct emission of unburned fuel components (Radischat et al., 2015). A recent study reported that the addition of additives of naphthalene-based lubricants to low-sulfur fuel during the blended fuel manufacturing process to improve stability could lead to an increase in PAH emissions in exhaust fumes, with naphthalene being the main pollutant (Yeh et al., 2023). To further explore the extent to which the content of naphthalene in fuel affects the EFs of naphthalene in ship exhaust fumes, several chemical compositions such as alkanes and aromatic contents in the fuels of the test OGVs were measured, as shown in Liu et al. (2022) (see Table S6). Results showed that the average naphthalene content in HFO was almost 30 times higher than that in diesel. When the engine was operated in the same operating condition, higher EFnaphthalene was observed from HFO than diesel. Therefore, we infer that chemical component in fuel does influence the emission of PAHs, including naphthalene, in the exhaust. Besides, VOCs with lower molecular weights such as acetone and acrolein were the dominant OVOC compounds in this study. The main reason is probably as follows: OVOC compounds are typically derived from the oxidation of VOCs with incomplete combustion (Hao et al., 2014), while VOCs with lower molecular weights have a higher chance of being oxidized to form oxides than those with higher molecular weights which are often broken down into VOCs with a smaller carbon number during the oxidation process (R. Wang et al., 2020).
Furthermore, characteristics of VOCs based on the carbon number are also given and discussed in this study. The detected VOC species were classified into 12 groups from C1 to C12 (Fig. S5). Different types of ships with different fuels showed obvious differences in their components. For example, C3 VOCs were found to be the most important species for all test ships, while C10 showed much higher mass fractions from OGVs than other ships, which was caused by the high naphthalene content. The same as for the VOC profiles, ICSs and scientific research ships presented very similar VOC mass fraction distributions across the 12 groupings. Besides, except for the auxiliary engine of CCSs with diesel oil, the OGVs emitted comparatively higher high-carbon number (C7–C12) components than low-carbon number (C1–C6) components.
3.3.2 Diagnostic characteristics of VOCs
Diagnostic ratios of pair species, such as toluene to benzene (), ethylbenzene to m,p-xylene (E/X), n-butane to isopentane (n-Bu/i-Bu) and isopentane to n-pentane (i-P/n-P), are always used to identify the potential emission sources (Z. Zhang et al., 2016; Li et al., 2021; Song et al., 2018; Song et al., 2020). These ratios from ship exhausts in this study are shown in Table S9. was further analyzed here as it is the most widely used diagnostic ratio among them. It was reported in previous study that the ratios were < 1 for biomass, biofuel, and coal burning; 1 to 10 for vehicle emissions; and > 1 for solvent applications or industrial processes (Z. Zhang et al., 2016). In this study, the ratios varied between 0.29 and 1.28 from ship exhausts, which were overlapped with biomass, biofuel, and coal burning sources to some extent. However, it could be considered to distinguish on-road diesel vehicles with a ratio of 1.5 ± 0.8 (Wang et al., 2013; Yao et al., 2015) and non-road diesel construction vessels with a ratio of 1.4 ± 1.3. The results were similar to that of 0.45–0.57 from Wu et al. (2020) and 1.07 from Xiao et al. (2018) but significantly differed from that of 4.81–42.8 from Huang et al. (2018c).
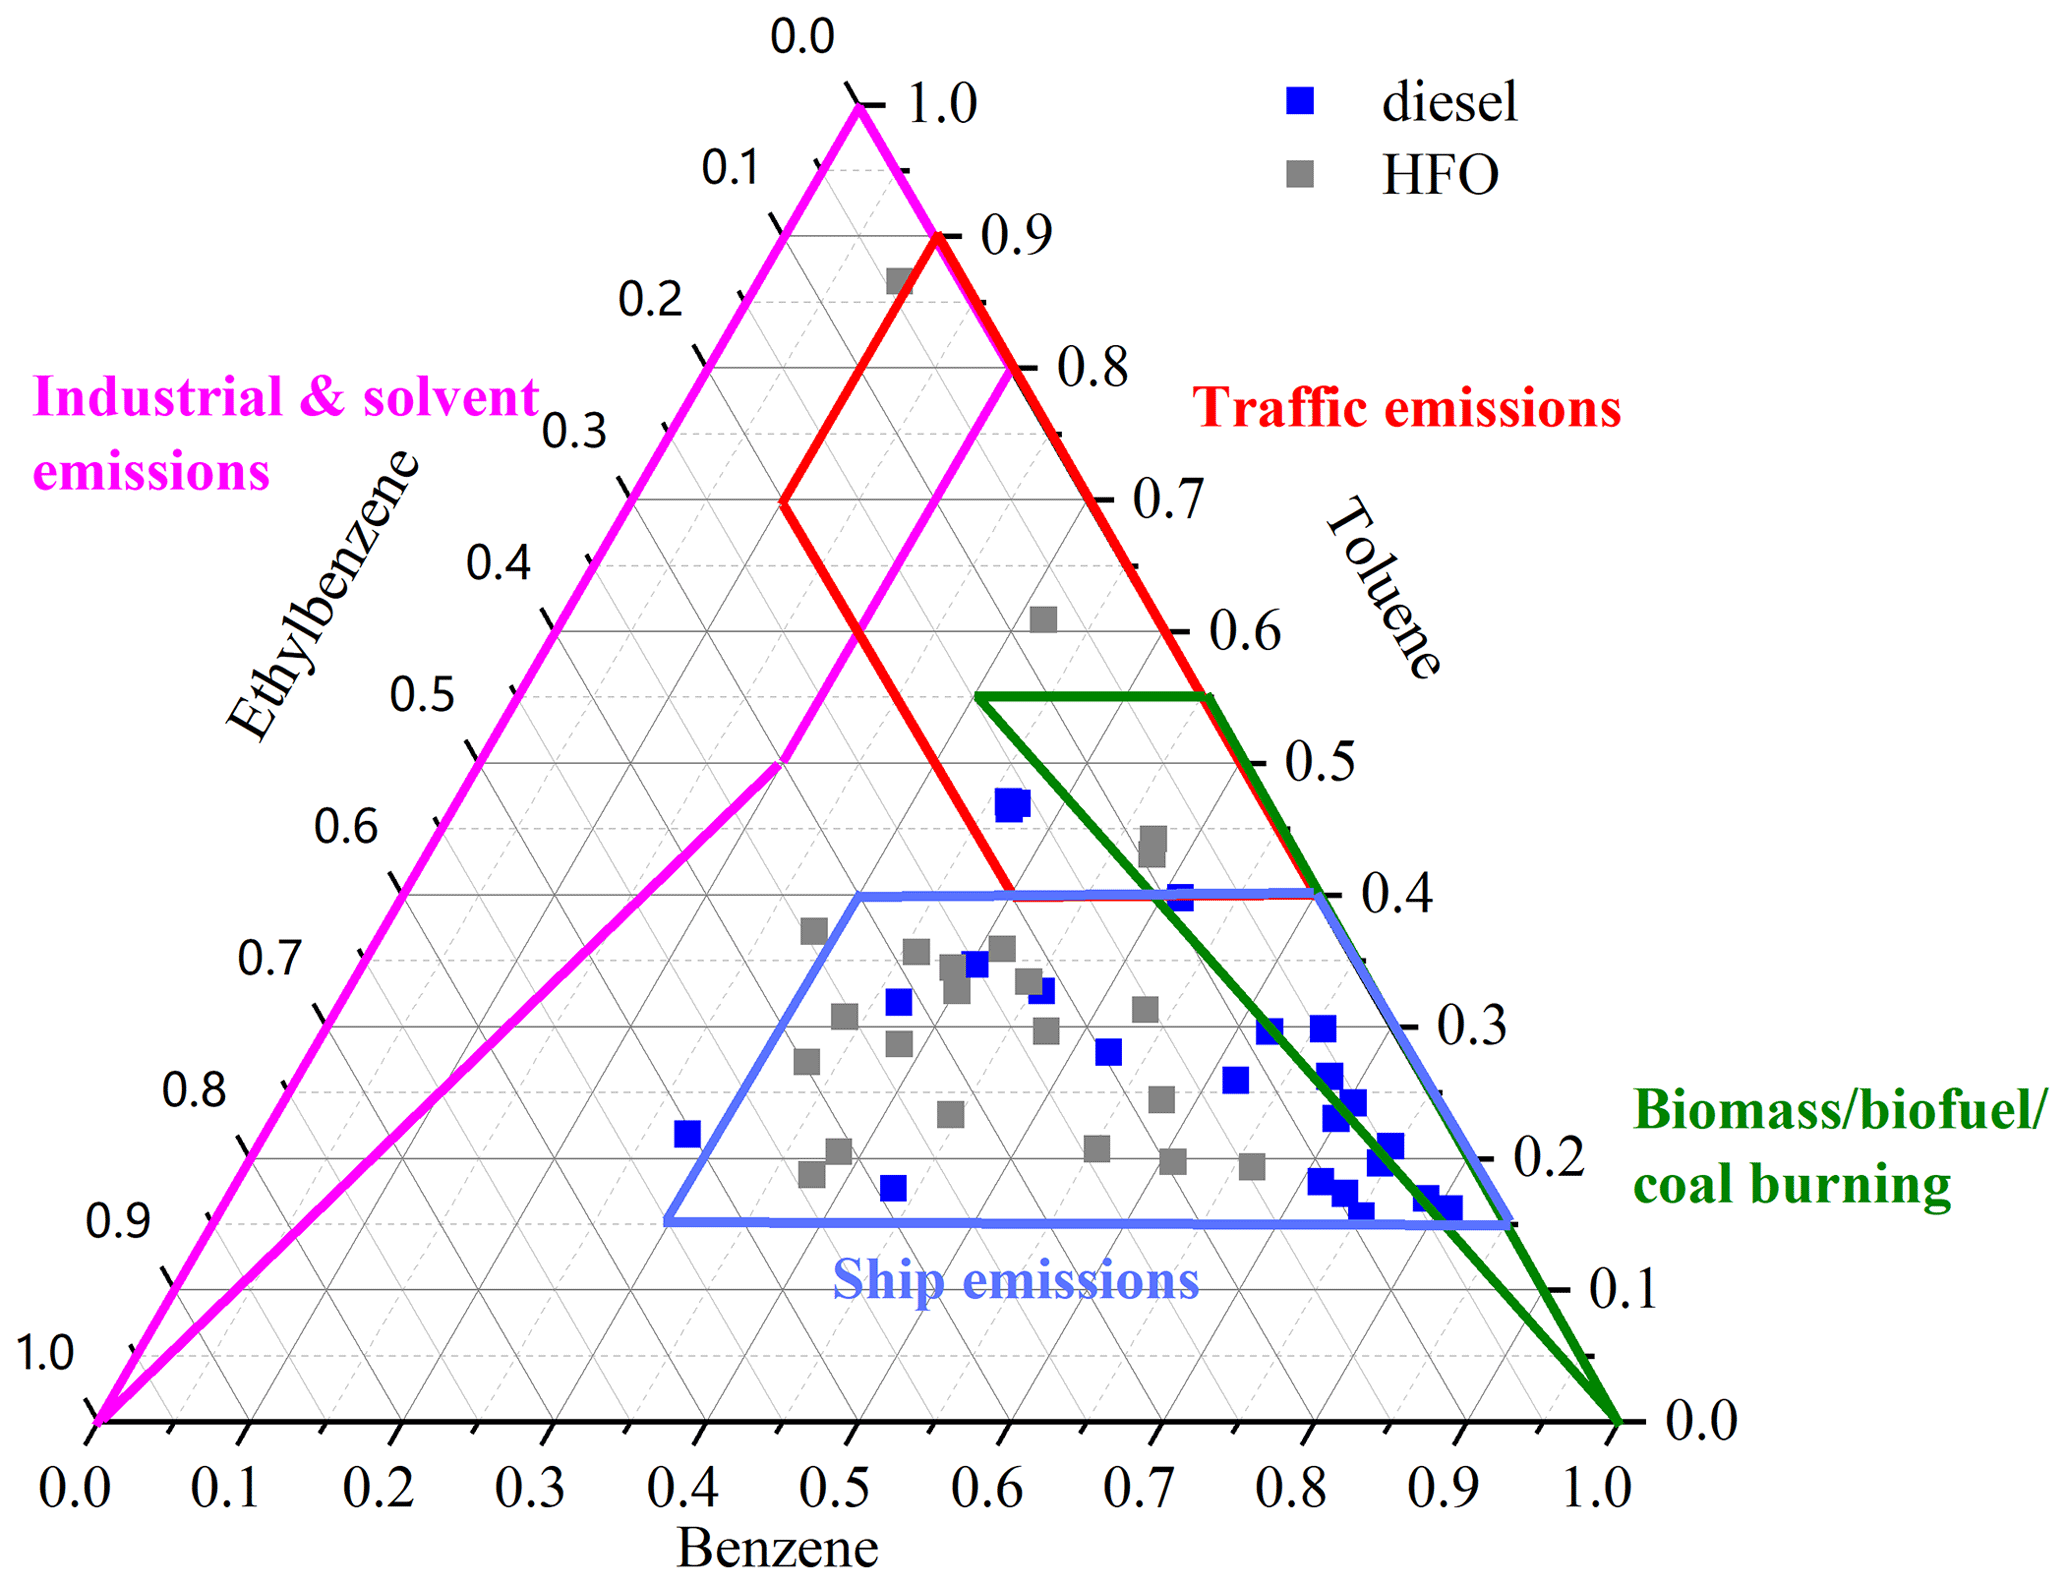
Figure 5Relative proportions of benzene, toluene, and ethylbenzene from ship exhausts. ratios from other sources cited in Z. Zhang et al. (2016) summarized 28 examples from biomass burning, 35 examples from biofuel burning, 17 examples from coal burning, 11 examples from diesel vehicle exhaust, 31 examples from gasoline vehicle exhaust, 24 examples from gasoline evaporation, 25 examples from roadside or tunnel tests, and 66 examples from industrial processes and solvent applications.
In order to overcome the overlapping effects of the ratio among different emission sources and better distinguish ship emissions from other emission sources, a ternary diagram of the relative compositions of benzene, toluene, and ethylbenzene from ship exhausts in this study is presented in Fig. 5. The ratios were on average from the test ships; differed from that of for biomass, biofuel, and coal burning; and were for industrial emissions and especially for traffic emissions, respectively (Z. Zhang et al., 2016). Besides, most of the relative compositions of B, T, and E from ship exhausts in this study were relatively stable and mainly concentrated within a certain area that was seldom overlapped with other emission sources in the ternary diagram. This indicated that the ratios could be considered a diagnostic characteristic to distinguish ship emissions from other emission sources, especially with respect to traffic emissions.
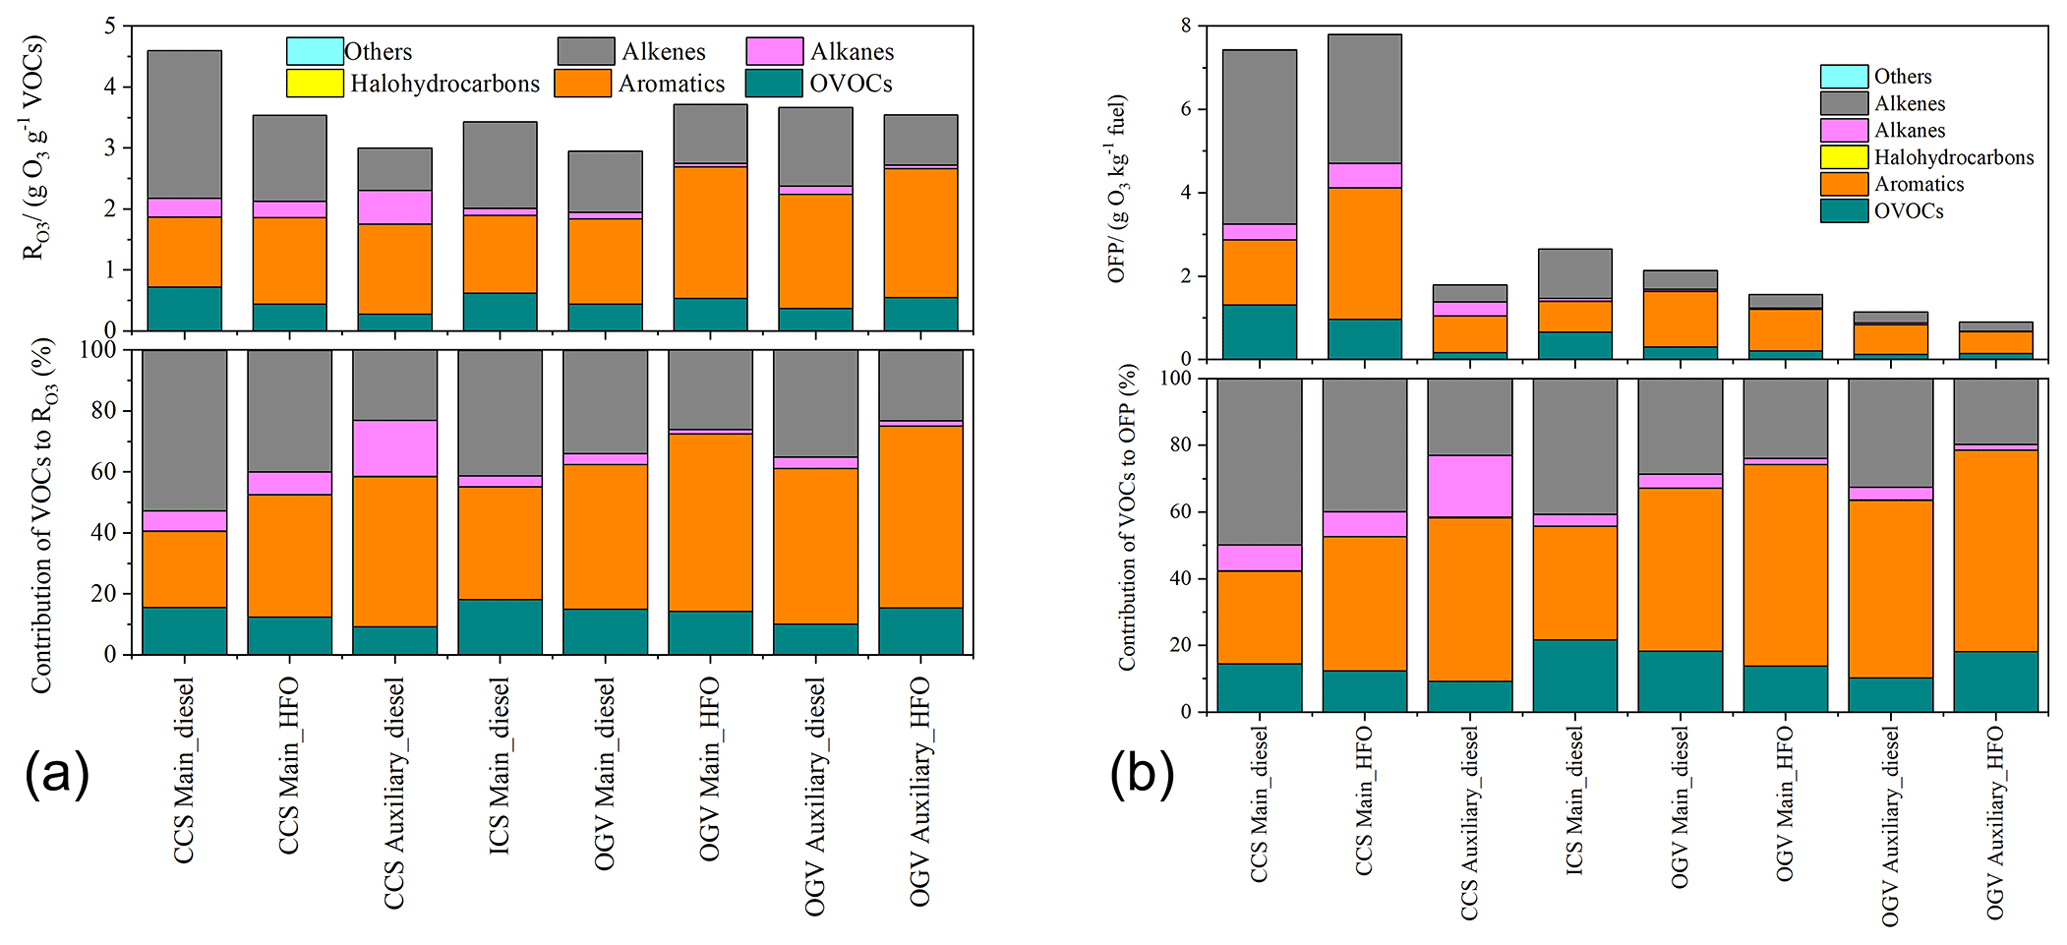
Figure 6(a) The normalized ozone reactivity (; g O3 g−1 VOCs) and contribution of VOC species to . (b) Ozone formation potential (OFP; g O3 kg−1 fuel) and contribution of VOC species to OFP.
3.4 Ozone and SOA formation potential
3.4.1 Ozone formation potential
The normalized ozone reactivities () ranged between 2.95 and 4.60 g O3 g−1 VOCs for the test ships (presented in Fig. 6 and Table S10) in this study, meaning that there was a diversity of ozone reactivities in VOCs from different ships, which were due to the different shares of VOC species emitted from different ships with different fuels. The values were within the range of the previously reported results estimated by Wu et al. (2020) (2.62 to 5.41 g O3 g−1 VOCs) and Wu et al. (2019) (approximately 4.5 to 6.0 g O3 g−1 VOCs) but showed different fragments of VOC species to . The different detected VOC species was also one inferred reason for the variation in in different studies. Aromatics and alkenes were the most significant contributors to in this study due to their high reactivities. Aromatics had relatively higher contributions for the OGVs, and the CCSs and ICSs were more affected by alkenes, excepted for the auxiliary engine with the diesel oil in CCSs. Besides, it also can be seen from Fig. 6a that when the fuels were switched from diesel to HFO, more aromatics were contributed to because of the higher aromatic but lower aliphatic compounds in HFO (Sippula et al., 2014). On the contrary, alkenes showed reverse trends with aromatics, which were attributed to engine combustion and operation conditions of the test ships, as well as the high content of alkenes in diesel fuel in China (Mo et al., 2016).
As described in Fig. 6b, the OFP varied significantly from 0.91 to 7.81 g O3 kg−1 fuel, with the main engines of the CCSs presenting the highest levels but auxiliary engines of OGVs the lowest, even though the showed no such big differences among all of the test ships. The main reason was the huge variation in EFVOCs, as well as the difference in the component of VOC species emitted from different ships with different fuels. However, due to lack of measurements of OVOC species such as formaldehyde, acetaldehyde, and benzaldehyde in this study, the presented OFP was underestimated. Similar to , aromatics and alkenes were the most significant contributors to OFP, accounting for 28 %–61 % and 20 %–50 % of the total OFP, respectively. It is worth noting that when the fuels were switched from HFO to diesel for the OGVs, there were obvious increasing OFP trends. This was similar to result of Huang et al. (2018b) in that HFO had lower OFP compared with the diesel fuel of an ocean-going vessel and Wu et al. (2020) in that after the implementation of the fuel switch policy for ships at berth, the OFP increased from 0.35 to 10.37 g O3 kg−1 fuel. However, the CCSs had a slightly higher OFP value with HFO than diesel in this study. A previous study also reported that the OFP from HFO was ∼ 3.3-fold higher than from burning diesel for a coastal container ship (Wu et al., 2019). It seemed that when the fuels were switched from high sulfur to low sulfur, there was an obvious increase in the OFP, especially for OGVs. When the fuels were switched from low-sulfur HFO to ultra-low-sulfur diesel (sulfur content < 0.1 %), the OFP would be also influenced by other factors, such as engine type, which needs to be further explored by more on-board measurements. Besides, river ships and coastal ships had higher OFP than OGVs, and the main engines had higher OFP than auxiliary engines, which were consistent with the previous study (Wu et al., 2020).
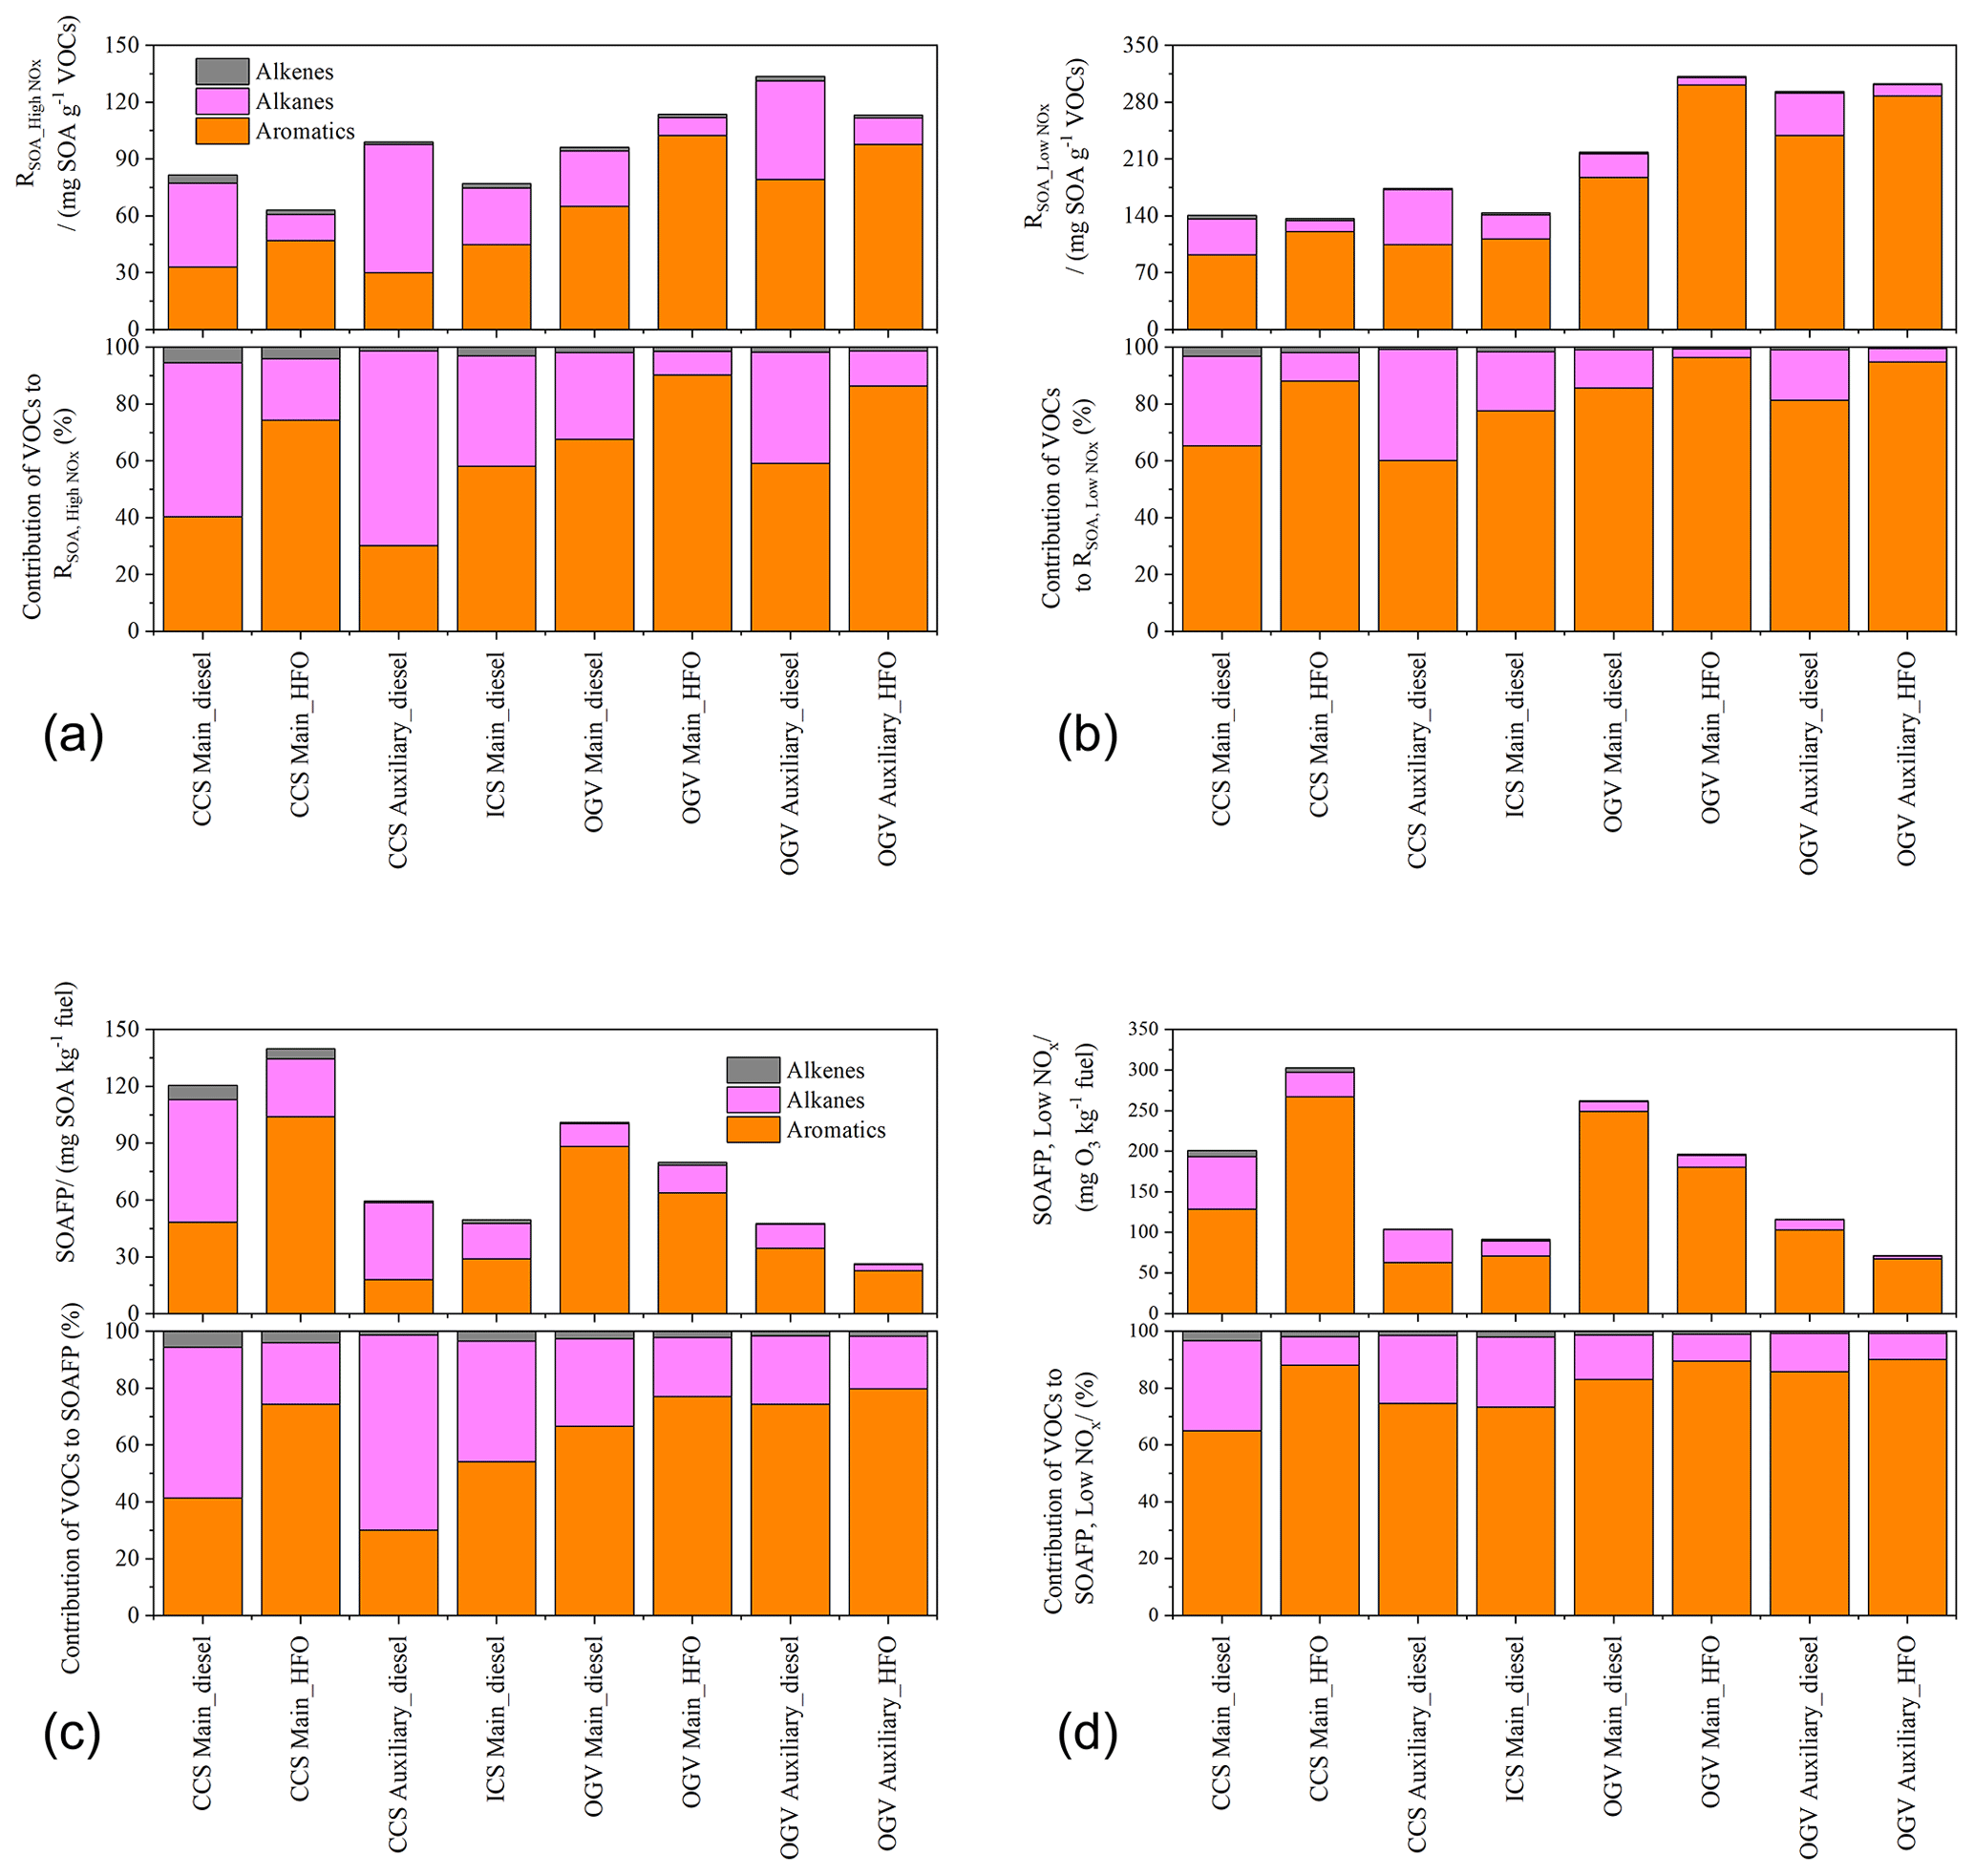
Figure 7The normalized SOA reactivity (RSOA; mg SOA g−1 VOCs) and contribution of VOC species to RSOA under (a) high NOx and (b) low NOx. The SOAFP (mg SOA kg−1 fuel) and contribution of VOC species to SOAFP under (c) high NOx and (d) low NOx.
3.4.2 SOA formation potential
Similar to , normalized SOA reactivities (RSOA) under high-NOx and low-NOx conditions are also estimated and presented in Fig. 7a, b and Table S10. The RSOA ranged from 63.2 to 134 mg SOA g−1 VOCs under high-NOx conditions and 137 to 312 mg SOA g−1 VOCs under low-NOx conditions in this study, which were within the range of previously reported results (Wu et al., 2020; Huang et al., 2018b; Xiao et al., 2018; Wu et al., 2019) but at relatively higher levels compared with these studies. Unlike , the RSOA showed relatively higher values for OGVs compared with CCSs and ICSs. The main reason for this was the content difference in the heavy organic compounds in VOCs, such as the higher proportion of naphthalene that has a high SOA yield, which is also presented above in Table S4 and Fig. 4. Huang et al. (2018c) also showed similar RSOA levels in a test OGV. Almost all of the RSOA levels were contributed from aromatics and alkanes in this study. There were different variation trends in the total RSOA between different fuels for different types of ships but with obviously higher proportions of aromatics for ships with HFO than diesel fuel due to the higher aromatic contents in fuels, while alkanes were the opposite. Besides, the RSOA of ship exhausts in this study showed much higher levels compared with other traffic sources presented in a previous study (Xiao et al., 2018), including diesel trucks and gasoline vehicles, which suggested that VOCs from ship exhaust deserve special attention.
The SOAFP in this study ranged from 26.5 to 140 mg SOA kg−1 fuel and 71.5 to 303 mg SOA kg−1 fuel under high-NOx and low-NOx conditions, respectively (Fig. 7c and d). The SOAFP values in this study were within the range of previous studies but showed relatively higher levels, which might be mainly caused by both the different detected VOCs species and the variation in VOC EFs. Even though OGVs had relatively higher RSOA levels, due to the variation in EFs among the test ships, SOAFP showed different patterns with RSOA. The main engines in this study had higher SOAFP values than the auxiliary engines no matter what type of fuel was used, indicating the important effect of engine type. Similar to OFP, the switch of fuel from HFO to diesel could increase the SOAFP for OGVs. Similar results were also found from Wu et al. (2020) in that, after IFSP, the SOAFP increased 1.6 times and 2.5 times under high-NOx and low-NOx conditions and Huang et al. (2018b) in that a higher SOAFP was presented from diesel than from HFO. The CCSs showed the opposite SOAFP variation trend with OGVs, similar to Wu et al. (2019), in that SOAFP from HFO was 2.1-fold higher than that of diesel. Moreover, similar to RSOA, aromatics and alkanes were the most significant contributors to SOAFP, and there were also obvious higher proportions of aromatics to SOAFP for ships with HFO than diesel fuel. The main reason for this was that the EFs of aromatics from engines with HFO were higher than that of diesel fuel due to the higher content of aromatics of HFO than diesel. It has been indicated that intermediate VOCs (IVOCs) were significant SOA precursors with high yields (Robinson et al., 2007; Tkacik et al., 2012). In another of our studies, IVOCs from the test OGVs were also detected, and the SOAFP of IVOCs from several selected conditions (main engine and auxiliary engine of cruising loads using marine gas oil (MGO) and HFO, respectively) were calculated (Liu et al., 2022). Results showed that the SOAFP from the IVOCs of the main engine using diesel and HFO was 540.5 and 482.1 mg SOA kg−1 fuel, respectively, 542.2 and 451.3 mg SOA kg−1 fuel for the auxiliary engine, respectively. Obviously, the switch from the low-sulfur fuel of HFO to the ultra-low-sulfur fuel of diesel could also increase the SOAFP from the IVOCs. Even though the SOAFP from VOCs was lower than that of the IVOCs, they were still not negligible, especially under low-sulfur-fuel policies.
3.4.3 Top 20 contributing VOC species to OFP and SOAFP
Due to the significant contribution of VOCs to O3 and SOA, it is essential to distinguish the highest contributing VOC species for the formulation of emission reduction policies. Therefore, the top 20 contributing VOC species to OFP and SOAFP are presented in Tables S11 and S12. Most of the listed VOC species in OFP and SOAFP among different engine types and fuels were the same but with different rankings. For example, propene was the highest contributing VOC species to O3 for the main engines of CCSs and ICSs, followed by acrolein, trimethyl benzene, butene, etc. Trimethyl benzene, propene, and acrolein were ranking as the top VOC species to OFP for the auxiliary engine of CCSs. As for OGVs, naphthalene was the highest contributing VOC species to O3, followed by propene, acrolein, 1,3-butadiene, and xylene. As shown in Table S12, the top VOC species contributing to SOAFP were benzene, naphthalene, n-dodecane, n-undecane, and xylene for all the test ships. Naphthalene was undoubtedly the highest contributing VOC species to SOAFP for OGVs. In conclusion, it was obvious that as the important common contributors to both O3 and SOA, aromatics should be prioritized in control measures. Besides, VOC species with high O3 reactivities also need to be paid enough attention, e.g., alkenes, even though they have low EF levels.
Shipping emissions are a non-ignorable anthropogenic emission source of air pollutants, especially in coastal areas. Therefore, more and more strict emission control regulations have been implemented globally. For example, the maximum fuel sulfur content has been set to be 0.5 % () worldwide by 2020 and 0.1 % () in ECAs. The Chinese government also has set the coastal ECAs that have required a sulfur content of 0.5 % () since 2019 and 0.1 % () in inland ECAs since 2020. The mandatory use of low-sulfur fuels has reduced the emissions of SO2 and PM significantly for ships, while it also leads to very large uncertainty in VOC emissions. In view of this, an on-board test of VOCs from nine typical cargo ships with low-sulfur fuels in China were carried out in this study.
Results showed that EFVOCs varied largely from 0.09 to 3.01 g kg−1 fuel, with domestic coastal cargo ships (CCSs) having the highest levels and ocean-going vessels (OGVs) the lowest. The test ships in this study presented a level of EFVOCs comparable with other studies. However, the measured EFVOCs varied largely among different studies due to complex reasons such as different detected VOC species and different engine types and fuel qualities. OVOCs and aromatics were the main components of the detected VOC species, followed by alkanes, while alkenes, halohydrocarbons, and other quantified species only contributed small fractions.
The emission level and component of VOCs from ship exhaust fumes could be affected by complex influence factors such as the operating condition, engine type, ship type, and fuel type. For example, EFVOCs had the lowest level when the engines were operating with medium loads and the highest level with low loads. Besides, with the increase in engine speed, the EFVOCs showed an increasing trend. The average EFVOCs from the main engines was 2.3 times that of auxiliary engines in this study. Moreover, the EFVOCs varied obviously under different types of ships, with CCSs having the highest levels and OGVs the lowest. It needs to be noted that the fuel type could influence the emission of EFVOCs significantly. The switch of fuels from heavy-fuel oil to diesel increased EFVOCs by 48 % on average in this study. A bigger cause for concern is that from the summarized results in this study and previous studies, the average EFVOCs from low-sulfur-content fuel were significantly higher than that of high-sulfur-content fuel by almost 3.4 times.
The most abundant VOC species were acetone and acrolein in OVOCs, propene and butene in alkenes, n-nonane, n-decane, n-undecane, and n-dodecane in alkanes for almost all of the test ships. As for aromatics, the OGVs showed big differences compared with other types of ships that had large amounts of naphthalene due to the use of low-sulfur fuels, while benzene, toluene, and m/p-xylene were the highest-content aromatic substances for other ships. We also found that the benzene, toluene, and ethylbenzene ratio of on average could be considered a diagnostic characteristic to distinguish ship emissions from other emission sources.
The OFP in this study varied significantly from 0.91 to 7.81 g O3 kg−1 fuel, with the main engines of CCSs presenting the highest levels but auxiliary engines of OGVs the lowest. The SOAFP in this study ranged from 71.5 to 303 mg SOA kg−1 fuel under low-NOx conditions. Main engines in this study had higher SOAFP values than auxiliary engines no matter what type of fuel was used, indicating the important effect of the engine type. It is also worth noting that when the fuels were switched from high sulfur to low sulfur, there was an obvious increase in OFP and SOAFP, especially for OGVs. Moreover, aromatics were the most important common contributors to O3 and SOA in ship exhausts, which need to be controlled with priority.
It could be concluded from this study and previous studies that through the switch from high-sulfur HFO to low-sulfur HFO or low-sulfur HFO to ultra-low-sulfur diesel, VOC emissions from OGVs increased significantly, which further promoted the formation potential of O3 and SOA, especially in coastal areas. Therefore, the implementation of the ultra-low-sulfur oil policy in the near future is likely to further increase the emission of VOCs, which needs to be optimized. Besides, the results herein indicate that aromatics are absolutely the most important common contributors to OFP and SOAFP which need to be controlled as a matter of priority in ship exhausts. Since aromatics are typically from the polymerization, improving the engine combustion conditions of ship engines is an effective way to reduce O3 and SOA from ship exhausts, especially in coastal and inland areas. Moreover, organic matter such as naphthalene from ship exhausts with low-sulfur HFO should be explored and considered to be potential tracers to identify ocean-going ships from coastal and inland ships. Last, the EFs and profiles of VOCs emitted from ship exhausts varied significantly. One important reason was that the sample size of the on-board measured VOCs was too small; in addition, the detection methods and detected VOC species differed greatly among different studies. Therefore, many more on-board tests need to be implemented, and standard VOC detection methods, as well as essential VOC species, should be clarified, especially under the current low-sulfur regulations.
Datasets are available upon request to the corresponding author, Gehui Wang (ghwang@geo.ecnu.edu.cn).
The supplement related to this article is available online at: https://doi.org/10.5194/acp-24-8999-2024-supplement.
FZ, YZ, CH, HW, YiC, and GW conceptualized and designed the study. BX, ZL, CT, XW, YH, MC, and YuC performed the measurements. FZ, RL, CW, YL, SZ, and GW analyzed the data. FZ wrote the draft. All the authors reviewed, edited, and contributed to the scientific discussion in the paper.
The contact author has declared that none of the authors has any competing interests.
Publisher's note: Copernicus Publications remains neutral with regard to jurisdictional claims made in the text, published maps, institutional affiliations, or any other geographical representation in this paper. While Copernicus Publications makes every effort to include appropriate place names, the final responsibility lies with the authors.
This study has been supported by the National Natural Science Foundation of China (grant nos. 42377096, 42130704, and 42077195), the State Environmental Protection Key Laboratory of Formation and Prevention of Urban Air Pollution Complex (grant no. 2021080547), and the Ministry of Industry and Information Technology of China (grant no. MC-202019-C08).
This paper was edited by Roya Bahreini and reviewed by Tom Eckel and one anonymous referee.
Agrawal, H., Welch, W. A., Henningsen, S., Miller, J. W., and Cocker, D. R.: Emissions from main propulsion engine on container ship at sea, J. Geophys. Res.-Atmos., 115, D23205, https://doi.org/10.1029/2009jd013346, 2010.
Alotaibi, F. M., González-Cortés, S., Alotibi, M. F., Xiao, T., Al-Megren, H., Yang, G., and Edwards, P. P.: Enhancing the production of light olefins from heavy crude oils: Turning challenges into opportunities, Catal. Today, 317, 86–98, https://doi.org/10.1016/j.cattod.2018.02.018, 2018.
Araizaga, A. E., Mancilla, Y., and Mendoza, A.: Volatile Organic Compound Emissions from Light-Duty Vehicles in Monterrey, Mexico: a Tunnel Study, Int. J. Environ. Res., 7, 277–292, 2013.
Beecken, J., Mellqvist, J., Salo, K., Ekholm, J., and Jalkanen, J.-P.: Airborne emission measurements of SO2, NOx and particles from individual ships using a sniffer technique, Atmos. Meas. Tech., 7, 1957–1968, https://doi.org/10.5194/amt-7-1957-2014, 2014.
Buffaloe, G. M., Lack, D. A., Williams, E. J., Coffman, D., Hayden, K. L., Lerner, B. M., Li, S.-M., Nuaaman, I., Massoli, P., Onasch, T. B., Quinn, P. K., and Cappa, C. D.: Black carbon emissions from in-use ships: a California regional assessment, Atmos. Chem. Phys., 14, 1881–1896, https://doi.org/10.5194/acp-14-1881-2014, 2014.
Carter, W. P. L.: Development of Ozone Reactivity Scales for Volatile Organic Compounds, Air Waste, 44, 881–899, https://doi.org/10.1080/1073161X.1994.10467290, 1994.
Carter, W. P. L.: Update maximum incremental reactivity scale and hydrocarbon bin reactivities for regulatory application, California Air Resources Board Contract 07-339, University of California, 2010a.
Carter, W. P. L.: Development of the SAPRC-07 chemical mechanism, Atmos. Environ., 44, 5324–5335, https://doi.org/10.1016/j.atmosenv.2010.01.026, 2010b.
Che, H., Shen, X., Yao, Z., Wu, B., Gou, R., Hao, X., Cao, X., Li, X., Zhang, H., Wang, S., and Chen, Z.: Real-world emission characteristics and inventory of volatile organic compounds originating from construction and agricultural machinery, Sci. Total Environ., 894, 164993, https://doi.org/10.1016/j.scitotenv.2023.164993, 2023.
Chu-Van, T., Ristovski, Z., Pourkhesalian, A. M., Rainey, T., Garaniya, V., Abbassi, R., Jahangiri, S., Enshaei, H., Kam, U. S., Kimball, R., Yang, L., Zare, A., Bartlett, H., and Brown, R. J.: On-board measurements of particle and gaseous emissions from a large cargo vessel at different operating conditions, Environ. Pollut., 237, 832–841, https://doi.org/10.1016/j.envpol.2017.11.008, 2017.
Cooper, D. A.: Exhaust emissions from ships at berth, Atmos. Environ., 37, 3817–3830, https://doi.org/10.1016/s1352-2310(03)00446-1, 2003.
Cooper, D. A., Peterson, K., and Simpson, D.: Hydrocarbon, PAH and PCB emissions from ferries: A case study in the Skagerak–Kattegatt–Oresund region, Atmos. Environ., 30, 2463–2473, https://doi.org/10.1016/1352-2310(95)00494-7, 1996.
Corbett, J. J., Winebrake, J. J., Green, E. H., Kasibhatla, P., Eyring, V., and Lauer, A.: Mortality from ship emissions: A global assessment, Environ. Sci. Technol., 41, 8512–8518, https://doi.org/10.1021/es071686z, 2007.
Fu, M., Ding, Y., Ge, Y., Yu, L., Yin, H., Ye, W., and Liang, B.: Real-world emissions of inland ships on the Grand Canal, China, Atmos. Environ., 81, 222–229, https://doi.org/10.1016/j.atmosenv.2013.08.046, 2013.
Gentner, D. R., Isaacman, G., Worton, D. R., Chan, A. W. H., Dallmann, T. R., Davis, L., Liu, S., Day, D. A., Russell, L. M., Wilson, K. R., Weber, R., Guha, A., Harley, R. A., and Goldstein, A. H.: Elucidating secondary organic aerosol from diesel and gasoline vehicles through detailed characterization of organic carbon emissions, P. Natl. Acad. Sci. USA, 109, 18318–18323, https://doi.org/10.1073/pnas.1212272109, 2012.
Grosjean, D.: In situ organic aerosol formation during a smog episode: Estimated production and chemical functionality, Atmos. Environ. A-Gen., 26, 953–963, https://doi.org/10.1016/0960-1686(92)90027-I, 1992.
Grosjean, D. and Seinfeld, J. H.: Parameterization of the formation potential of secondary organic aerosols, Atmos. Environ., 23, 1733–1747, https://doi.org/10.1016/0004-6981(89)90058-9, 1989.
Han, S., Wang, Y., Wang, L., Liu, Y., Wang, L., and Yu, Z.: Study on low cost processing scheme of low sulfur marine fuel oil, Petroleum Processing and Petrochemicals, 53, 63–69, 2022.
Hao, B., Song, C., Lv, G., Li, B., Liu, X., Wang, K., and Liu, Y.: Evaluation of the reduction in carbonyl emissions from a diesel engine using Fischer–Tropsch fuel synthesized from coal, Fuel, 133, 115–122, https://doi.org/10.1016/j.fuel.2014.05.025, 2014.
Hua, H., Jiang, S., Sheng, H., Zhang, Y., Liu, X., Zhang, L., Yuan, Z., and Chen, T.: A high spatial-temporal resolution emission inventory of multi-type air pollutants for Wuxi city, J. Clean. Prod., 229, 278–288, https://doi.org/10.1016/j.jclepro.2019.05.011, 2019.
Huang, C., An, J.-y., and Lu, J.: Emission Inventory and Prediction of Non-road Machineries in the Yangtze River Delta Region, China, Environ. Sci. (Chinese), 39, 3965–3975, https://doi.org/10.13227/j.hjkx.201802082, 2018a (in Chinese).
Huang, C., Hu, Q., Li, Y., Tian, J., Ma, Y., Zhao, Y., Feng, J., An, J., Qiao, L., Wang, H., Jing, S. a., Huang, D., Lou, S., Zhou, M., Zhu, S., Tao, S., and Li, L.: Intermediate Volatility Organic Compound Emissions from a Large Cargo Vessel Operated under Real-World Conditions, Environ. Sci. Technol., 52, 12934–12942, https://doi.org/10.1021/acs.est.8b04418, 2018b.
Huang, C., Hu, Q., Wang, H., Qiao, L., Jing, S. a., Wang, H., Zhou, M., Zhu, S., Ma, Y., Lou, S., Li, L., Tao, S., Li, Y., and Lou, D.: Emission factors of particulate and gaseous compounds from a large cargo vessel operated under real-world conditions, Environ. Pollut., 242, 667–674, https://doi.org/10.1016/j.envpol.2018.07.036, 2018c.
Huang, H., Zhou, C., Huang, L., Xiao, C., Wen, Y., Li, J., and Lu, Z.: Inland ship emission inventory and its impact on air quality over the middle Yangtze River, China, Sci. Total Environ., 843, 156770, https://doi.org/10.1016/j.scitotenv.2022.156770, 2022.
Huang, X., Zhang, Z., Yang, W., LI, S., Zhu, M., Fang, H., He, J., Chen, J., Wan, C., Zhang, Y., Liu, G., Huang, Z., Wang, Y., and Wang, X.: Emission factors and preliminary emission estimates of air pollutants from ships at berth in the Guangzhou port, Environ. Sci. (Chinese), 38, 1–10, http://www.hjkx.ac.cn/hjkx/ch/reader/query_year_catalog.aspx# (last access: 8 August 2024), 2017.
Jonson, J. E., Tarrason, L., Klein, H., Vestreng, V., Cofala, J., and Whall, C.: Effects of ship emissions on European ground-level ozone in 2020, Int. J. Remote Sens., 30, 4099–4110, https://doi.org/10.1080/01431160902821858, 2009.
Kuimov, D. N., Minkin, M. S., and Lukyanov, A. D.: Low-sulfur fuel and oil production, Materials Science Forum, 870, 671–676, https://doi.org/10.4028/www.scientific.net/MSF.870.671, 2016.
Lack, D., Lerner, B., Granier, C., Baynard, T., Lovejoy, E., Massoli, P., Ravishankara, A. R., and Williams, E.: Light absorbing carbon emissions from commercial shipping, Geophys. Res. Lett., 35, L13815, https://doi.org/10.1029/2008gl033906, 2008.
Lack, D. A., Corbett, J. J., Onasch, T., Lerner, B., Massoli, P., Quinn, P. K., Bates, T. S., Covert, D. S., Coffman, D., Sierau, B., Herndon, S., Allan, J., Baynard, T., Lovejoy, E., Ravishankara, A. R., and Williams, E.: Particulate emissions from commercial shipping: Chemical, physical, and optical properties, J. Geophys. Res.-Atmos., 114, D00f04, https://doi.org/10.1029/2008jd011300, 2009.
Lang, J., Zhou, Y., Chen, D., Xing, X., Wei, L., Wang, X., Zhao, N., Zhang, Y., Guo, X., Han, L., and Cheng, S.: Investigating the contribution of shipping emissions to atmospheric PM2.5 using a combined source apportionment approach, Environ. Pollut., 229, 557–566, https://doi.org/10.1016/j.envpol.2017.06.087, 2017.
Li, C., Cui, M., Zheng, J., Chen, Y., Liu, J., Ou, J., Tang, M., Sha, Q., Yu, F., Liao, S., Zhu, M., Wang, J., Yao, N., and Li, C.: Variability in real-world emissions and fuel consumption by diesel construction vehicles and policy implications, Sci. Total Environ., 786, 147256, https://doi.org/10.1016/j.scitotenv.2021.147256, 2021.
Liu, H., Fu, M., Jin, X., Shang, Y., Shindell, D., Faluvegi, G., Shindell, C., and He, K.: Health and climate impacts of ocean-going vessels in East Asia, Nat. Clim. Change, 6, 1037–1041, https://doi.org/10.1038/nclimate3083, 2016.
Liu, Z., Chen, Y., Zhang, Y., Zhang, F., Feng, Y., Zheng, M., Li, Q., and Chen, J.: Emission Characteristics and Formation Pathways of Intermediate Volatile Organic Compounds from Ocean-Going Vessels: Comparison of Engine Conditions and Fuel Types, Environ. Sci. Technol., 56, 12917–12925, https://doi.org/10.1021/acs.est.2c03589, 2022.
Lu, X., Zhang, L., Wang, X., Gao, M., Li, K., Zhang, Y., Yue, X., and Zhang, Y.: Rapid Increases in Warm-Season Surface Ozone and Resulting Health Impact in China Since 2013, Environ. Sci. Tech. Let., 7, 240–247, https://doi.org/10.1021/acs.estlett.0c00171, 2020.
Ministry of Transport of the People's Republic of China: Notice of the Ministry of Transport of the People's Republic of China on issuing and distributing the implementation plan of the control area for the discharge of atmospheric pollutants from ships, Ministry of Transport of the People's Republic of China, 2018.
Ministry of Transport of the People's Republic of China: Statistical Bulletin on Development of Transport Industry (2022), Ministry of Transport of the People's Republic of China, https://www.chinahighway.com/article/65393930.html (last access: 8 August 2024), 2022.
Mo, Z., Shao, M., and Lu, S.: Compilation of a source profile database for hydrocarbon and OVOC emissions in China, Atmos. Environ., 143, 209–217, https://doi.org/10.1016/j.atmosenv.2016.08.025, 2016.
Moldanova, J., Fridell, E., Popovicheva, O., Demirdjian, B., Tishkova, V., Faccinetto, A., and Focsa, C.: Characterisation of particulate matter and gaseous emissions from a large ship diesel engine, Atmos. Environ., 43, 2632–2641, https://doi.org/10.1016/j.atmosenv.2009.02.008, 2009.
Moldanová, J., Fridell, E., Winnes, H., Holmin-Fridell, S., Boman, J., Jedynska, A., Tishkova, V., Demirdjian, B., Joulie, S., Bladt, H., Ivleva, N. P., and Niessner, R.: Physical and chemical characterisation of PM emissions from two ships operating in European Emission Control Areas, Atmos. Meas. Tech., 6, 3577–3596, https://doi.org/10.5194/amt-6-3577-2013, 2013.
Pan, S.: Formation history of carbonyl compounds during combustion process fueled with alcohols-diesel blends Tianjin University, Master's thesis, Tianjin University, 2008.
Radischat, C., Sippula, O., Stengel, B., Klingbeil, S., Sklorz, M., Rabe, R., Streibel, T., Harndorf, H., and Zimmermann, R.: Real-time analysis of organic compounds in ship engine aerosol emissions using resonance-enhanced multiphoton ionisation and proton transfer mass spectrometry, Anal. Bioanal. Chem., 407, 5939–5951, https://doi.org/10.1007/s00216-015-8465-0, 2015.
Reda, A. A., Schnelle-Kreis, J., Orasche, J., Abbaszade, G., Lintelmann, J., Arteaga-Salas, J. M., Stengel, B., Rabe, R., Harndorf, H., Sippula, O., Streibel, T., and Zimmermann, R.: Gas phase carbonyl compounds in ship emissions: Differences between diesel fuel and heavy fuel oil operation, Atmos. Environ., 112, 369–380, https://doi.org/10.1016/j.atmosenv.2015.03.058, 2015.
Repka, S., Erkkilä-Välimäki, A., Jonson, J. E., Posch, M., Törrönen, J., and Jalkanen, J. P.: Assessing the costs and environmental benefits of IMO regulations of ship-originated SOx and NOx emissions in the Baltic Sea, Ambio, 50, 1718–1730, https://doi.org/10.1007/s13280-021-01500-6, 2021.
Robinson, A. L., Donahue, N. M., Shrivastava, M. K., Weitkamp, E. A., Sage, A. M., Grieshop, A. P., Lane, T. E., Pierce, J. R., and Pandis, S. N.: Rethinking organic aerosols: Semivolatile emissions and photochemical aging, Science, 315, 1259–1262, https://doi.org/10.1126/science.1133061, 2007.
Santos, L. F. E. d., Salo, K., and Thomson, E. S.: Quantification and physical analysis of nanoparticle emissions from a marine engine using different fuels and a laboratory wet scrubber, Environ. Sci.-Process Impacts, 24, 1769–1781, https://doi.org/10.1039/D2EM00054G, 2022.
Sippula, O., Stengel, B., Sklorz, M., Streibel, T., Rabe, R., Orasche, J., Lintelmann, J., Michalke, B., Abbaszade, G., Radischat, C., Groeger, T., Schnelle-Kreis, J., Harndorf, H., and Zimmermann, R.: Particle Emissions from a Marine Engine: Chemical Composition and Aromatic Emission Profiles under Various Operating Conditions, Environ. Sci. Technol., 48, 11721–11729, https://doi.org/10.1021/es502484z, 2014.
Song, C., Ma, C., Zhang, Y., Wang, T., Wu, L., Wang, P., Liu, Y., Li, Q., Zhang, J., Dai, Q., Zou, C., Sun, L., and Mao, H.: Heavy-duty diesel vehicles dominate vehicle emissions in a tunnel study in northern China, Sci. Total Environ., 637, 431–442, https://doi.org/10.1016/j.scitotenv.2018.04.387, 2018.
Song, C., Liu, Y., Sun, L., Zhang, Q., and Mao, H.: Emissions of volatile organic compounds (VOCs) from gasoline- and liquified natural gas (LNG)-fueled vehicles in tunnel studies, Atmos. Environ., 234, 117626, https://doi.org/10.1016/j.atmosenv.2020.117626, 2020.
Song, S.-K., Shon, Z.-H., Kim, Y.-K., Kang, Y.-H., Oh, I.-B., and Jung, C.-H.: Influence of ship emissions on ozone concentrations around coastal areas during summer season, Atmos. Environ., 44, 713–723, https://doi.org/10.1016/j.atmosenv.2009.11.010, 2010.
Tkacik, D. S., Presto, A. A., Donahue, N. M., and Robinson, A. L.: Secondary Organic Aerosol Formation from Intermediate-Volatility Organic Compounds: Cyclic, Linear, and Branched Alkanes, Environ. Sci. Technol., 46, 8773–8781, https://doi.org/10.1021/es301112c, 2012.
United Nations Conference on Trade and Development: Review of Maritime Transport 2020, United Nations Publications, 2020.
Viana, M., Fann, N., Tobias, A., Querol, X., Rojas-Rueda, D., Plaza, A., Aynos, G., Conde, J. A., Fernandez, L., and Fernandez, C.: Environmental and Health Benefits from Designating the Marmara Sea and the Turkish Straits as an Emission Control Area (ECA), Environ. Sci. Technol., 49, 3304–3313, https://doi.org/10.1021/es5049946, 2015.
Wan, Z., Ji, S., Liu, Y., Zhang, Q., Chen, J., and Wang, Q.: Shipping emission inventories in China's Bohai Bay, Yangtze River Delta, and Pearl River Delta in 2018, Mar. Pollut. Bull., 151, 110882, https://doi.org/10.1016/j.marpolbul.2019.110882, 2020.
Wang, J., Jin, L., Gao, J., Shi, J., Zhao, Y., Liu, S., Jin, T., Bai, Z., and Wu, C.-Y.: Investigation of speciated VOC in gasoline vehicular exhaust under ECE and EUDC test cycles, Sci. Total Environ., 445–446, 110–116, https://doi.org/10.1016/j.scitotenv.2012.12.044, 2013.
Wang, M., Li, S., Zhu, R., Zhang, R., Zu, L., Wang, Y., and Bao, X.: On-road tailpipe emission characteristics and ozone formation potentials of VOCs from gasoline, diesel and liquefied petroleum gas fueled vehicles, Atmos. Environ., 223, 117294, https://doi.org/10.1016/j.atmosenv.2020.117294, 2020.
Wang, R., Tie, X., Li, G., Zhao, S., Long, X., Johansson, L., and An, Z.: Effect of ship emissions on O3 in the Yangtze River Delta region of China: Analysis of WRF-Chem modeling, Sci. Total Environ., 683, 360–370, https://doi.org/10.1016/j.scitotenv.2019.04.240, 2019.
Wang, R., Yuan, Z., Zheng, J., Li, C., Huang, Z., Li, W., Xie, Y., Wang, Y., Yu, K., and Duan, L.: Characterization of VOC emissions from construction machinery and river ships in the Pearl River Delta of China, J. Environ. Sci., 96, 138–150, https://doi.org/10.1016/j.jes.2020.03.013, 2020.
Wang, X., Yi, W., Lv, Z., Deng, F., Zheng, S., Xu, H., Zhao, J., Liu, H., and He, K.: Ship emissions around China under gradually promoted control policies from 2016 to 2019, Atmos. Chem. Phys., 21, 13835–13853, https://doi.org/10.5194/acp-21-13835-2021, 2021.
Wang, X.-T., Liu, H., Lv, Z.-F., Deng, F.-Y., Xu, H.-L., Qi, L.-J., Shi, M.-S., Zhao, J.-C., Zheng, S.-X., Man, H.-Y., and He, K.-B.: Trade-linked shipping CO2 emissions, Nat. Clim. Change, 11, 945–951, https://doi.org/10.1038/s41558-021-01176-6, 2021.
Weng, J., Han, T., Shi, K., and Li, G.: Impact analysis of ECA policies on ship trajectories and emissions, Mar. Pollut. Bull., 179, 113687, https://doi.org/10.1016/j.marpolbul.2022.113687, 2022.
Wu, D., Ding, X., Li, Q., Sun, J. F., Huang, C., Yao, L., Wang, X. M., Ye, X. N., Chen, Y. J., He, H., and Chen, J. M.: Pollutants emitted from typical Chinese vessels: Potential contributions to ozone and secondary organic aerosols, J. Clean. Prod., 238, 9, https://doi.org/10.1016/j.jclepro.2019.117862, 2019.
Wu, Z., Zhang, Y., He, J., Chen, H., Huang, X., Wang, Y., Yu, X., Yang, W., Zhang, R., Zhu, M., Li, S., Fang, H., Zhang, Z., and Wang, X.: Dramatic increase in reactive volatile organic compound (VOC) emissions from ships at berth after implementing the fuel switch policy in the Pearl River Delta Emission Control Area, Atmos. Chem. Phys., 20, 1887–1900, https://doi.org/10.5194/acp-20-1887-2020, 2020.
Xiao, Q., Li, M., Liu, H., Fu, M., Deng, F., Lv, Z., Man, H., Jin, X., Liu, S., and He, K.: Characteristics of marine shipping emissions at berth: profiles for particulate matter and volatile organic compounds, Atmos. Chem. Phys., 18, 9527–9545, https://doi.org/10.5194/acp-18-9527-2018, 2018.
Yao, Z., Wu, B., Shen, X., Cao, X., Jiang, X., Ye, Y., and He, K.: On-road emission characteristics of VOCs from rural vehicles and their ozone formation potential in Beijing, China, Atmos. Environ., 105, 91–96, https://doi.org/10.1016/j.atmosenv.2015.01.054, 2015.
Yeh, C.-K., Tzu, F.-M., Chen, P.-Y., Shen, H.-C., Yuan, C.-S., Lin, C., Pu, H.-P., Ngo, H. H., and Bui, X.-T.: Emission characteristics of naphthalene from ship exhausts under global sulfur cap, Sci. Total Environ., 902, 166172, https://doi.org/10.1016/j.scitotenv.2023.166172, 2023.
Zetterdahl, M., Moldanova, J., Pei, X. Y., Pathak, R. K., and Demirdjian, B.: Impact of the 0.1 % fuel sulfur content limit in SECA on particle and gaseous emissions from marine vessels, Atmos. Environ., 145, 338–345, https://doi.org/10.1016/j.atmosenv.2016.09.022, 2016.
Zhang, F., Chen, Y., Tian, C., Lou, D., Li, J., Zhang, G., and Matthias, V.: Emission factors for gaseous and particulate pollutants from offshore diesel engine vessels in China, Atmos. Chem. Phys., 16, 6319–6334, https://doi.org/10.5194/acp-16-6319-2016, 2016.
Zhang, F., Chen, Y., Chen, Q., Feng, Y., Shang, Y., Yang, X., Gao, H., Tian, C., Li, J., Zhang, G., Matthias, V., and Xie, Z.: Real-World Emission Factors of Gaseous and Particulate Pollutants from Marine Fishing Boats and Their Total Emissions in China, Environ. Sci. Technol., 52, 4910–4919, https://doi.org/10.1021/acs.est.7b04002, 2018.
Zhang, F., Chen, Y., Su, P., Cui, M., Han, Y., Matthias, V., and Wang, G.: Variations and characteristics of carbonaceous substances emitted from a heavy fuel oil ship engine under different operating loads, Environ. Pollut., 284, 117388, https://doi.org/10.1016/j.envpol.2021.117388, 2021.
Zhang, G.: Development opportunities to CNOOC low sulfur marine bunker oil manufacturing by IMO2020, Inorganic Chemicals Industry, 51, 1–5, https://kns.cnki.net/kcms/detail/12.1069.TQ.20191210.1728.002.html (last access: 8 August 2024), 2019 (in Chinese).
Zhang, M., Jia, R., Li, Y., and Wang, Z.: Effect of different pyrolysis conditions on methanol-diesel pyrolysisi product, Vehicle engine (Chinese), 258, 46–51, 2022 (in Chinese).
Zhang, Y., Yang, X., Brown, R., Yang, L., Morawska, L., Ristovski, Z., Fu, Q., and Huang, C.: Shipping emissions and their impacts on air quality in China, Sci. Total Environ., 581–582, 186–198, https://doi.org/10.1016/j.scitotenv.2016.12.098, 2017.
Zhang, Y., Deng, F., Man, H., Fu, M., Lv, Z., Xiao, Q., Jin, X., Liu, S., He, K., and Liu, H.: Compliance and port air quality features with respect to ship fuel switching regulation: a field observation campaign, SEISO-Bohai, Atmos. Chem. Phys., 19, 4899–4916, https://doi.org/10.5194/acp-19-4899-2019, 2019.
Zhang, Y., Zhao, K., Lou, D., and Fang, L.: Study on the real-world emission characteristics of gaseous and particulate pollutants from an inland ship using a portable emission measurement system, Mar. Pollut. Bull., 184, 114205, https://doi.org/10.1016/j.marpolbul.2022.114205, 2022.
Zhang, Z., Zhang, Y., Wang, X., Lu, S., Huang, Z., Huang, X., Yang, W., Wang, Y., and Zhang, Q.: Spatiotemporal patterns and source implications of aromatic hydrocarbons at six rural sites across China's developed coastal regions, J. Geophys. Res.-Atmos., 121, 6669–6687, https://doi.org/10.1002/2016jd025115, 2016.
Zhou, H., Zhao, H., Hu, J., Li, M., Feng, Q., Qi, J., Shi, Z., Mao, H., and Jin, T.: Primary particulate matter emissions and estimates of secondary organic aerosol formation potential from the exhaust of a China V diesel engine, Atmos. Environ., 218, 116987, https://doi.org/10.1016/j.atmosenv.2019.116987, 2019.
Zhou, S., Zhou, J. X., and Zhu, Y. Q.: Chemical composition and size distribution of particulate matters from marine diesel engines with different fuel oils, Fuel, 235, 972–983, https://doi.org/10.1016/j.fuel.2018.08.080, 2019.
Zhou, W.-Q., Li, C., Liu, J.-W., Zhu, M.-N., Gui, X.-L., Yu, F., Liao, S.-d., Jiang, F., Li, G.-H., Jiang, B., and Zheng, J.-Y.: Emission Characterstics of VOCs and n-alkanes from Diesel Forklifts, Environ. Sci. (Chinese), 43, 735–742, https://doi.org/10.13227/j.hjkx.202107174, 2022 (in Chinese).