the Creative Commons Attribution 4.0 License.
the Creative Commons Attribution 4.0 License.
 | 16 Aug 2024
NO3 reactivity during a summer period in a temperate forest below and above the canopy
Patrick Dewald
Tobias Seubert
Simone T. Andersen
Gunther N. T. E. Türk
Jan Schuladen
Max R. McGillen
Cyrielle Denjean
Jean-Claude Etienne
Olivier Garrouste
Marina Jamar
Sergio Harb
Manuela Cirtog
Vincent Michoud
Mathieu Cazaunau
Antonin Bergé
Christopher Cantrell
Sebastien Dusanter
Bénédicte Picquet-Varrault
Alexandre Kukui
Chaoyang Xue
Abdelwahid Mellouki
Jos Lelieveld
We present direct measurements of biogenic volatile organic compound (BVOC)-induced nitrate radical (NO3) reactivity (kVOC) through the diel cycle in the suburban, temperate forest of Rambouillet near Paris (France). The data were obtained in a 6-week summer period in 2022 as part of the Atmospheric ChemistRy Of the Suburban foreSt (ACROSS) campaign. kVOC was measured in a small (700 m2) clearing mainly at a height of 5.5 m above ground level but also at 40 m (for 5 d and nights). At nighttime, mean values (and 25th–75th percentile ranges) of = s−1 and = s−1 indicate a significant vertical gradient and low NO3 reactivity above the canopy, whereas (5.5 m) showed peak values of up to 2 s−1 close to the ground. The strong vertical gradient in NO3 reactivity could be confirmed by measurements between 0 and 24 m on one particular night characterized by a strong temperature inversion and is a result of the decoupling of air masses aloft from the ground- and canopy-level sources of BVOCs (and nitric oxide, NO). No strong vertical gradient was observed in the mean daytime NO3 reactivity, with = (0.12 ± 0.04) s−1 for the entire campaign and = (0.07 ± 0.02) s−1 during the 5 d period.
Within the clearing, the fractional contribution of VOCs to the total NO3 loss rate coefficient (ktot, determined by photolysis, reaction with NO and VOCs) was 80 %–90 % during the night and ∼ 50 % during the day. In terms of chemical losses of α-pinene below canopy height in the clearing, we find that at nighttime hydroxyl radicals (OH) and ozone (O3) dominate, with NO3 contributing “only” 17 %, which decreases further to 8.5 % during the day. Based on measured OH, measured O3, and calculated NO3 concentrations, the chemical lifetime of BVOCs at noon is about 1 h and is likely to be longer than timescales of transport out of the canopy (typically of the order of minutes), thus significantly reducing the importance of daytime in-canopy processing. Clearly, in forested regions where sufficient nitric oxide and nitrogen dioxide (NOx) is available, the role of NO3 and OH as initiators of BVOC oxidation is not strictly limited to nighttime and daytime, respectively, as often implied in e.g. atmospheric chemistry textbooks.
- Article
(4225 KB) - Full-text XML
-
Supplement
(1747 KB) - BibTeX
- EndNote


Forests emit great quantities (∼ 1000 Tg yr−1) of a variety of biogenic volatile organic compounds (BVOCs), such as isoprene and monoterpenes, into the atmosphere (Guenther et al., 2012; Hakola et al., 2012; Vermeuel et al., 2023). The transport of combustion-related emissions from urban and industrialized regions results in the presence of NOx (the sum of nitric oxide, NO, and nitrogen dioxide, NO2) in forested regions, as does microbial activity in soils (Ludwig et al., 2001; Barger et al., 2005; Pilegaard, 2013). An important step in photochemical ozone (O3) generation is the oxidation of VOCs, which may be initiated by hydroxyl (OH) and nitrate radicals (NO3) or O3 itself (Geyer et al., 2001; Lelieveld et al., 2008; Peräkylä et al., 2014). The interaction of largely anthropogenic NOx with BVOCs is thus a key component of tropospheric ozone production in many regions (Pusede et al., 2015). Here we focus on NO3, which is formed from the reaction between NO2 (e.g. from Reaction R1) and O3 (Reaction R2) and is in a thermal equilibrium with NO2 and dinitrogen pentoxide (N2O5, Reactions R3 and R4) (Wayne et al., 1991).
In the troposphere, NO3 reacts efficiently with NO to re-form NO2 (Reaction R5), reacts with unsaturated VOCs (Reaction R6), and is photolysed rapidly with a lifetime that is often only a few seconds (Reactions R7a and R7b) (Finlayson-Pitts and Pitts, 2000). NO is reduced in concentration at night owing to its reaction with O3, and since both NO and sunlight drastically reduce the lifetime of NO3, the latter is often thought of as a “nighttime-only” oxidant (Wayne et al., 1991; Platt and Heintz, 1994; Martinez et al., 2000; Brown and Stutz, 2012). Note that, in some environments, direct heterogeneous losses of NO3, as well as indirect losses via N2O5 uptake, can also be important (Saathoff et al., 2001; Bertram and Thornton, 2009; Phillips et al., 2016).
While both the reaction with NO (Reaction R5) and the photolysis (Reaction R7) recycle either NO or NO2, reactions between NO3 and VOCs result in a variety of gas-phase products, including organic nitrates (RONO2) and nitric acid (HNO3) (Hallquist et al., 1999; Ayres et al., 2015; Ng et al., 2017), which may be lost by deposition and/or transferred to the condensed phase, forming e.g. secondary organic aerosols (SOAs) (Bates et al., 2022; Day et al., 2022; DeVault et al., 2022). The interaction of NO3 with BVOCs can represent an efficient process for the removal of NOx from the gas phase and a mechanism for SOA generation (Fry et al., 2014; Romer Present et al., 2020), making the fractional contribution of Reaction (R6) to the overall loss rate of NO3 of particular interest.
As unsaturated BVOCs, such as isoprene and monoterpenes, are often present at part per billion by volume (ppbv) levels in the forest (Kesselmeier and Staudt, 1999; Hakola et al., 2009), the local NO3 lifetimes are typically short not only during the day, but also at night (McLaren et al., 2004; J. Liebmann et al., 2018; J. M. Liebmann et al., 2018). NO3 mixing ratios are often below 1 part per trillion by volume (pptv), making their detection in highly reactive air masses very challenging (J. Liebmann et al., 2018). Measuring the NO3 reactivity (together with NO2 and O3 to calculate the NO3 production rate) provides a means to assess the atmospheric fate of the nitrate radical even when its mixing ratio is too low (<0.5 pptv) to be detected (Dewald et al., 2022).
There are also meteorological effects that induce differences in the fate of NO3 during the day and night. While daytime insolation at ground level can result in efficient (turbulent) mixing of the boundary layer, the radiative cooling of the ground at lower temperatures at night means that the nocturnal boundary layer can be highly stratified (Stull, 1988). This results in strong gradients in the mixing ratios of e.g. BVOCs (Fish et al., 1999), and the below-canopy reactivity of NO3 can be very different to that above (Mogensen et al., 2015; J. Liebmann et al., 2018). To date, NO3 vertical profiles are available for high altitudes (i.e. above the boundary layer) in non-forested environments (Smith et al., 1993; von Friedeburg et al., 2002; Stutz et al., 2004; Brown et al., 2007a; Yan et al., 2021), yet highly resolved vertical profiles of NO3 (or its reactivity) for low altitudes at nighttime are sparse (Brown et al., 2007b; J. Liebmann et al., 2018).
In this study, we present and analyse nighttime and daytime NO3 reactivity measurements above and below the canopy in a temperate forest ca. 50 km from Paris (France) during the summer of 2022 as part of the Atmospheric ChemistRy Of the Suburban foreSt (ACROSS) campaign (Cantrell and Michoud, 2022).
2.1 Site description and meteorology
The ACROSS campaign took place from mid-June until the end of July 2022 at a clearing (ca. 700 m2) in the suburban forest of Rambouillet in France (48.687° N, 1.704° E). Rambouillet forest covers an area of about 150 km2 and is located about 50 km to the south-west of Paris. The surrounding trees are mainly oaks (∼ 68 %) and pine (up to 25 %) (Marchant et al., 2017), with an average height of ∼ 25 m. Daytime maximum temperatures during ACROSS were ∼ 20–40 °C (Fig. 1b), while nighttime temperatures decreased to 10–25 °C, often with a significant (positive) gradient in height that started to develop in the late afternoon when tree-induced shadowing of the ground led to radiative cooling (Andersen et al., 2024).
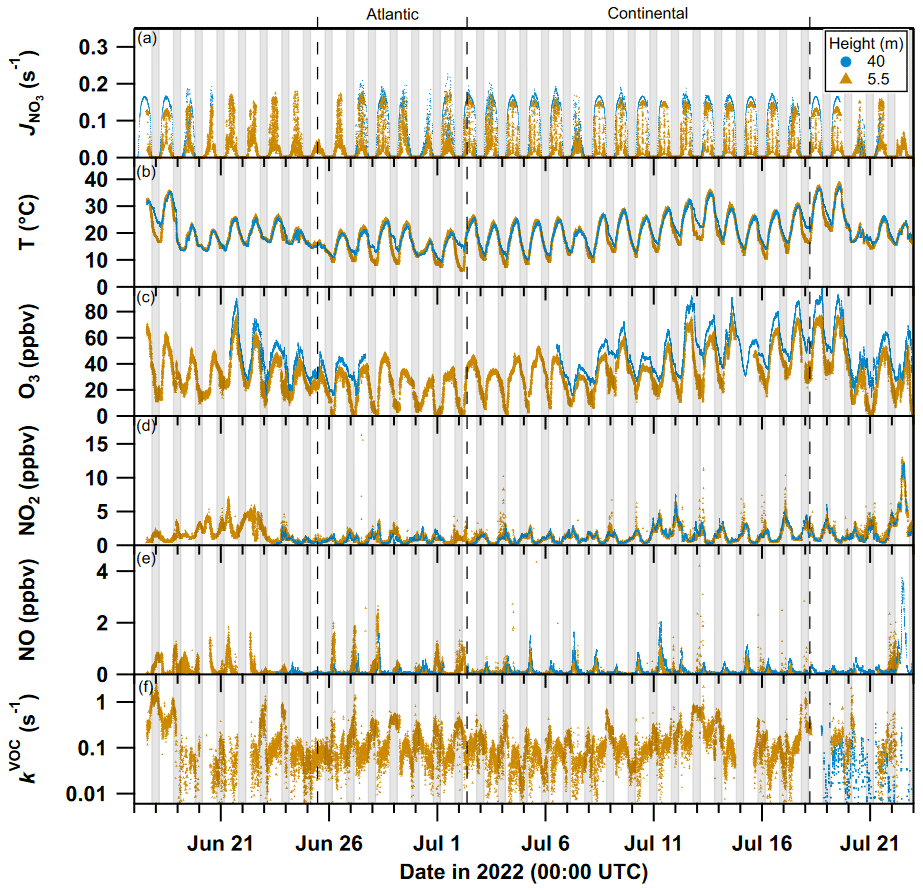
Figure 1Time series of NO3 photolysis frequencies (, a), temperature (T, b), ozone (O3, c), nitrogen dioxide (NO2, d), nitric oxide (NO, e), and VOC-induced NO3 reactivity (kVOC, f) sampled at 5.5 m a.g.l. (orange triangles; 3.2 and 5 m for NO and T, respectively) and 40 m a.g.l. (blue circles). The major and minor ticks on the x axis represent 00:00 UTC of the corresponding date. The dashed lines separate periods with air of Atlantic and continental origin. Nighttime periods are grey-shaded.
Back trajectories of 48 h show that air originated from the Atlantic Ocean between 25 June and 2 July, whereas air passed predominantly over industrialized regions, including Paris, the UK, Benelux states, and the Ruhr area, from 2–18 July (Andersen et al., 2024). Local wind directions and speeds are shown as a wind rose in the Supplement (Fig. S1).
The clearing housed several instrumented containers and also a tower, which enabled measurements to be made at 40 m, either via instruments located at the top of the tower or via sampling from a gas manifold attached to a high-flow inlet at the top of the tower.
2.2 NO3 reactivity
The flow-tube cavity ring-down spectrometer (FT-CRDS; Liebmann et al., 2017) used to quantify NO3 reactivity was installed in the Max Planck Institute for Chemistry (MPIC) container and sampled mainly from the centre of a high-volume-flow (10 000 standard L min−1, slpm) stainless steel tube ( cm), the top of which was 5.5 m above ground level (m a.g.l.). We present measurements of kVOC, which is defined as the VOC-induced pseudo-first-order NO3 loss rate coefficient (in units of s−1) and is equal to Σki[VOC]i, with [VOC]i and ki being the VOC concentrations and the corresponding rate coefficient for Reaction (R6), respectively. The FT-CRDS was connected to the high-flow inlet with a 1.5 m long piece of in. outer diameter (o.d.) PFA tubing (overall residence time of 0.4 s) equipped with a Teflon membrane filter (2 µm pore, 47 mm diameter, Pall Corp.) to prevent particles entering the cavity. The filter was replaced every 3 d. From 18 July, the NO3 reactivity setup sampled air alternately from the high-flow inlet and from the manifold, taking air from 40 m. The instrument was attached to the manifold with ca. 20 m in. PFA tubing (ca. 5 s residence time).
NO3 was generated by mixing 3–5 standard cm3 min−1 (sccm) of NO (1 part per million by volume (ppmv) in N2, Air Liquide) with O3 in a thermostated (30 °C) Teflon-coated (FEPD 121, Chemours) reactor (ca. 5 min residence time) at a pressure of 1100 Torr. O3 was generated by the 185 nm photolysis of O2 in a flow of 400 sccm dry synthetic air, which was provided from a commercial zero-air generator (CAP-180, Fuhr GmbH). In order to convert the resultant N2O5 quantitatively to NO3 (Reaction R4), the flow was heated to 140 °C in ca. 15 cm of in. o.d. PFA tubing. The flow containing NO3 was then mixed with 2.8 slpm of either synthetic air (to define zero reactivity) or ambient air within a in. PFA T-piece and directed to the FEP-coated, darkened, and thermostated (20 °C) flow tube where NO3 had 11 s to react. NO3 surviving the reactor was quantified on-line by cavity ring-down spectroscopy at 662 nm. Zeroing (“baseline measurement”) was achieved by adding an excess of NO (3 sccm of 100 ppmv in N2, Air Liquide) to titrate NO3 (Reaction R5). In synthetic air, the NO3 mixing ratios were typically in the range of 30–50 pptv. As the presence of NO3 and N2O5 in ambient air would bias the measurement, at nighttime the air was sampled through a 2 L glass flask (heated to 35 °C, ∼ 40 s residence time) to ensure that ambient N2O5 is converted to NO3. All radicals, including NO3, OH, RO2, and HO2, are lost on the glass walls and thus prevented from reaching the flow tube. From 18 July, air was sampled through the glass flask throughout the diel cycle. No difference in kVOC was observed directly after switching between “daytime mode” (no flask) and “nighttime mode” (sampling through flask), indicating that no compounds significantly contributing to kVOC are lost in the glass flask. Accurate quantification of NO3 reactivity requires that the synthetic air is humidified to ambient level (monitored with a commercial sensor, IST, HYT939), which was achieved with a permeation tube (MH-070-24F-4, Perma Pure LLC) filled with de-ionized water (LiChrosolv, Merck GmbH). Dynamic dilution of ambient air with synthetic air extended the dynamic range of the instrument to NO3 reactivities of up to ca. 2.1 s−1. Since Reactions (R1) to (R5) and wall losses (0.001 s−1) take place in addition to the reaction of interest (Reaction R6), a numerical simulation procedure was used to separate contributions of NOx in the flow tube and thus extract the NO3 reactivity towards VOCs, as detailed in Liebmann et al. (2017). When sampling through the glass flask, ambient NO mixing ratios used for the simulation were corrected for the impact of Reaction (R1) with correction factors between 1 % and 40 %.
The uncertainty in kVOC is determined by the stability of the NO3 source, the cavity stability (i.e. noise level and baseline stability), and the numerical simulation corrections. The uncertainty induced by the simulation is dependent on the ratio between NO2 and kVOC (Liebmann et al., 2017). During the campaign source and cavity stability, numerical simulation and uncertainties in the NO correction (impact of Reaction R5) contributed on average ca. 11 %, 9 %, and 26 % to the average overall uncertainty of ca. 30 %. The limit of detection (LOD) is derived from the variability (2 standard deviations, 2σ) in consecutive baselines and NO3 source measurements and was on average 0.006 s−1 during this campaign. In this paper we index the NO3 reactivity according to the following scheme: (5.5 m), (5.5 m), (40 m), and (40 m), which are the measured reactivities towards VOCs during the day/night at the two different heights. Note that reactivity measurements at 40 m were limited to the last 5 d of the campaign. We also refer to ktot, which is the total NO3 loss term including reaction with NO and photolysis as well as reaction with VOCs.
2.3 NO, NO2, and O3
NO2 mixing ratios at 5.5 m were measured by sampling via 1.5 m in. (o.d.) PFA tubing and a membrane filter (2 µm pore, 47 mm diameter, Pall Corp.) through the second (405 nm) cavity of the NO3 reactivity instrument (J. M. Liebmann et al., 2018). The instrument's LOD was 87 pptv (2σ, 4 s), and the measurement was associated with a total uncertainty of 7 %. On top of the tower (40 m), NO2 was measured via a cavity attenuated phase shift (CAPS) setup (precision of 6 %, LOD of 40 pptv), which was zeroed on an hourly basis.
NO was measured using a commercial instrument based on chemiluminescence detection (CLD 780 TR, Eco Physics, LOD of 10 pptv for 1 min averaging time), which was installed in a container ca. 17 m distance from the MPIC container and sampled at a height of 3.2 m above the ground. The NO mixing ratios were corrected for a change in sensitivity during the campaign (Andersen et al., 2024). Measurement of NO at 40 m height was carried out using another CLD (T200UP, Teledyne) that sampled from the tower manifold. This measurement was corrected for losses from Reaction (R1), with corrections ranging from 1 %–28 %. The instrument's LOD was 30 pptv, and its total uncertainty was 3.2 %.
A commercial ozone monitor (model 205, 2B Technologies) based on UV absorption was installed in the MPIC container and measured ozone mixing ratios at 5.5 m height with an LOD of 2 ppbv and an associated uncertainty of 5 %. O3 from the top of the tower was quantified by means of a second ozone monitor with an LOD of 2.5 ppbv (APOA370, HORIBA).
2.4 Photolysis frequencies and temperatures
Actinic flux was measured on top of the tower (41 m) and above the roof of the MPIC container (5 m), in both cases using spectral radiometers (Metcon GmbH). Actinic fluxes were converted to photolysis frequencies of NO3 and other compounds using IUPAC- and NASA-evaluated absorption cross sections (Burkholder et al., 2016; IUPAC, 2024). Commercial temperature sensors (Atexis PT1000 and Thermoset PT100) monitored ambient air temperature simultaneously at 5, 13, 21, and 41 m.
An overview of the measurements relevant for analysis of NO3 reactivity is given in Fig. 1 where data obtained at 5.5 m a.g.l. (orange) and 40 m a.g.l. (blue) are plotted.
The VOC-induced NO3 reactivity at a height of 5.5 m (kVOC(5.5 m), panel f, orange triangles) was generally high, with values between ∼ 0.1 and 0.5 s−1, and also highly variable, with nighttime peak values of up to 2 s−1. In contrast, (40 m) was often close to or below the LOD (≤0.006 s−1) when sampling from the top of the tower between 18 and 23 July (panel f, blue circles).
NO mixing ratios (panel e) at 3.2 m a.g.l. (orange circles) were on average between 0.1 and 0.3 ppbv but occasionally peaked at 1–4 ppbv mostly in the morning during the continental phase. As detailed in Andersen et al. (2024), nighttime NO mixing ratios were close to or below the LOD when sampling air masses, which, according to 2 d back trajectories, were largely of continental origin (2–18 July). In contrast, up to several parts per billion by volume of NO were observed at night during a period dominated by air with its origin over the Atlantic (26 June–2 July) when O3 levels (at 5.5 m) were below the LOD (panel c). NO2 mixing ratios (panel d) were similar at both heights and, in the absence of anthropogenic influence, mostly between 0.5 and 2 ppbv.
The large diel variation in O3 mixing ratios at 5.5 m (40–80 ppbv during the day and as low as 0 at nighttime, panel c) results from its net daytime photochemical production through reactions involving OH, NOx, and VOCs (Crutzen and Lelieveld, 2001) and its nocturnal losses via reactions (e.g. with NO and BVOC) and deposition. Nocturnal O3 mixing ratios at 40 m (20–40 ppbv) are higher than at 5.5 m (0–20 ppbv), and their diel cycle at 40 m is weaker than at 5.5 m. This results from a combination of removal processes of O3 at lower levels (reaction with NO released from soil, reaction with unsaturated, biogenic VOCs released from vegetation, and deposition to soil and foliar surfaces) and weak vertical mixing at nighttime (Andersen et al., 2024).
3.1 kVOC: variability and controlling factors close to the ground
At a height of 5.5 m, kVOC shows large variability across the diel cycle and from night-to-night (Fig. 1f), which is driven by variability in emissions of reactive BVOCs and in the height of the nocturnal boundary layer (NBL). In Fig. 2, kVOC(5.5 m) is plotted together with the difference in temperature (ΔT) measured at 5 and 41 m, where , and shows that the largest values of (5.5 m) occur on nights when a temperature inversion (ΔT < 0 K) evolves. The impact of temperature inversion on NO3 reactivity at 5.5 m is illustrated by comparing a night with no temperature inversion (24–25 July, period A) to a night with moderate temperature inversion (30 June–1 July, period B). In the absence of a temperature inversion we see a roughly constant value < 0.1 s−1 for kVOC(5.5 m) through the diel cycle (period A in the inset of Fig. 2). In contrast, when a temperature inversion developed (period B in the inset of Fig. 2), kVOC(5.5 m) was relatively low (< 0.1 s−1) until ca. 19:30 UTC. Over the next 2 h, it gradually increased to reach peak values as large as 0.4 s−1, which were associated with larger variability. Over the same period, O3 levels decreased from ∼ 30–40 to < 10 ppbv, which has been rationalized in terms of suppression of entrainment of above-canopy air (with higher levels of O3) into air masses close to the ground during temperature inversions (Andersen et al., 2024). The temperature inversion and associated reduction in vertical mixing impede upward transport of both NO (emitted from the soil) and BVOCs (emitted from vegetation) so that both may accumulate within and below the canopy after sunset. The association of high values of kVOC(5.5 m) with low values of O3 during nighttime temperature inversions has previously been reported for the boreal forest (J. Liebmann et al., 2018). In addition, elevated NO3 reactivity at night is also aided by the fact that the nocturnal mixing ratios of O3 and OH are diminished due to deposition and/or lack of photochemistry so that the lifetime and mixing ratios of monoterpenes increase (see Sect. 3.6).
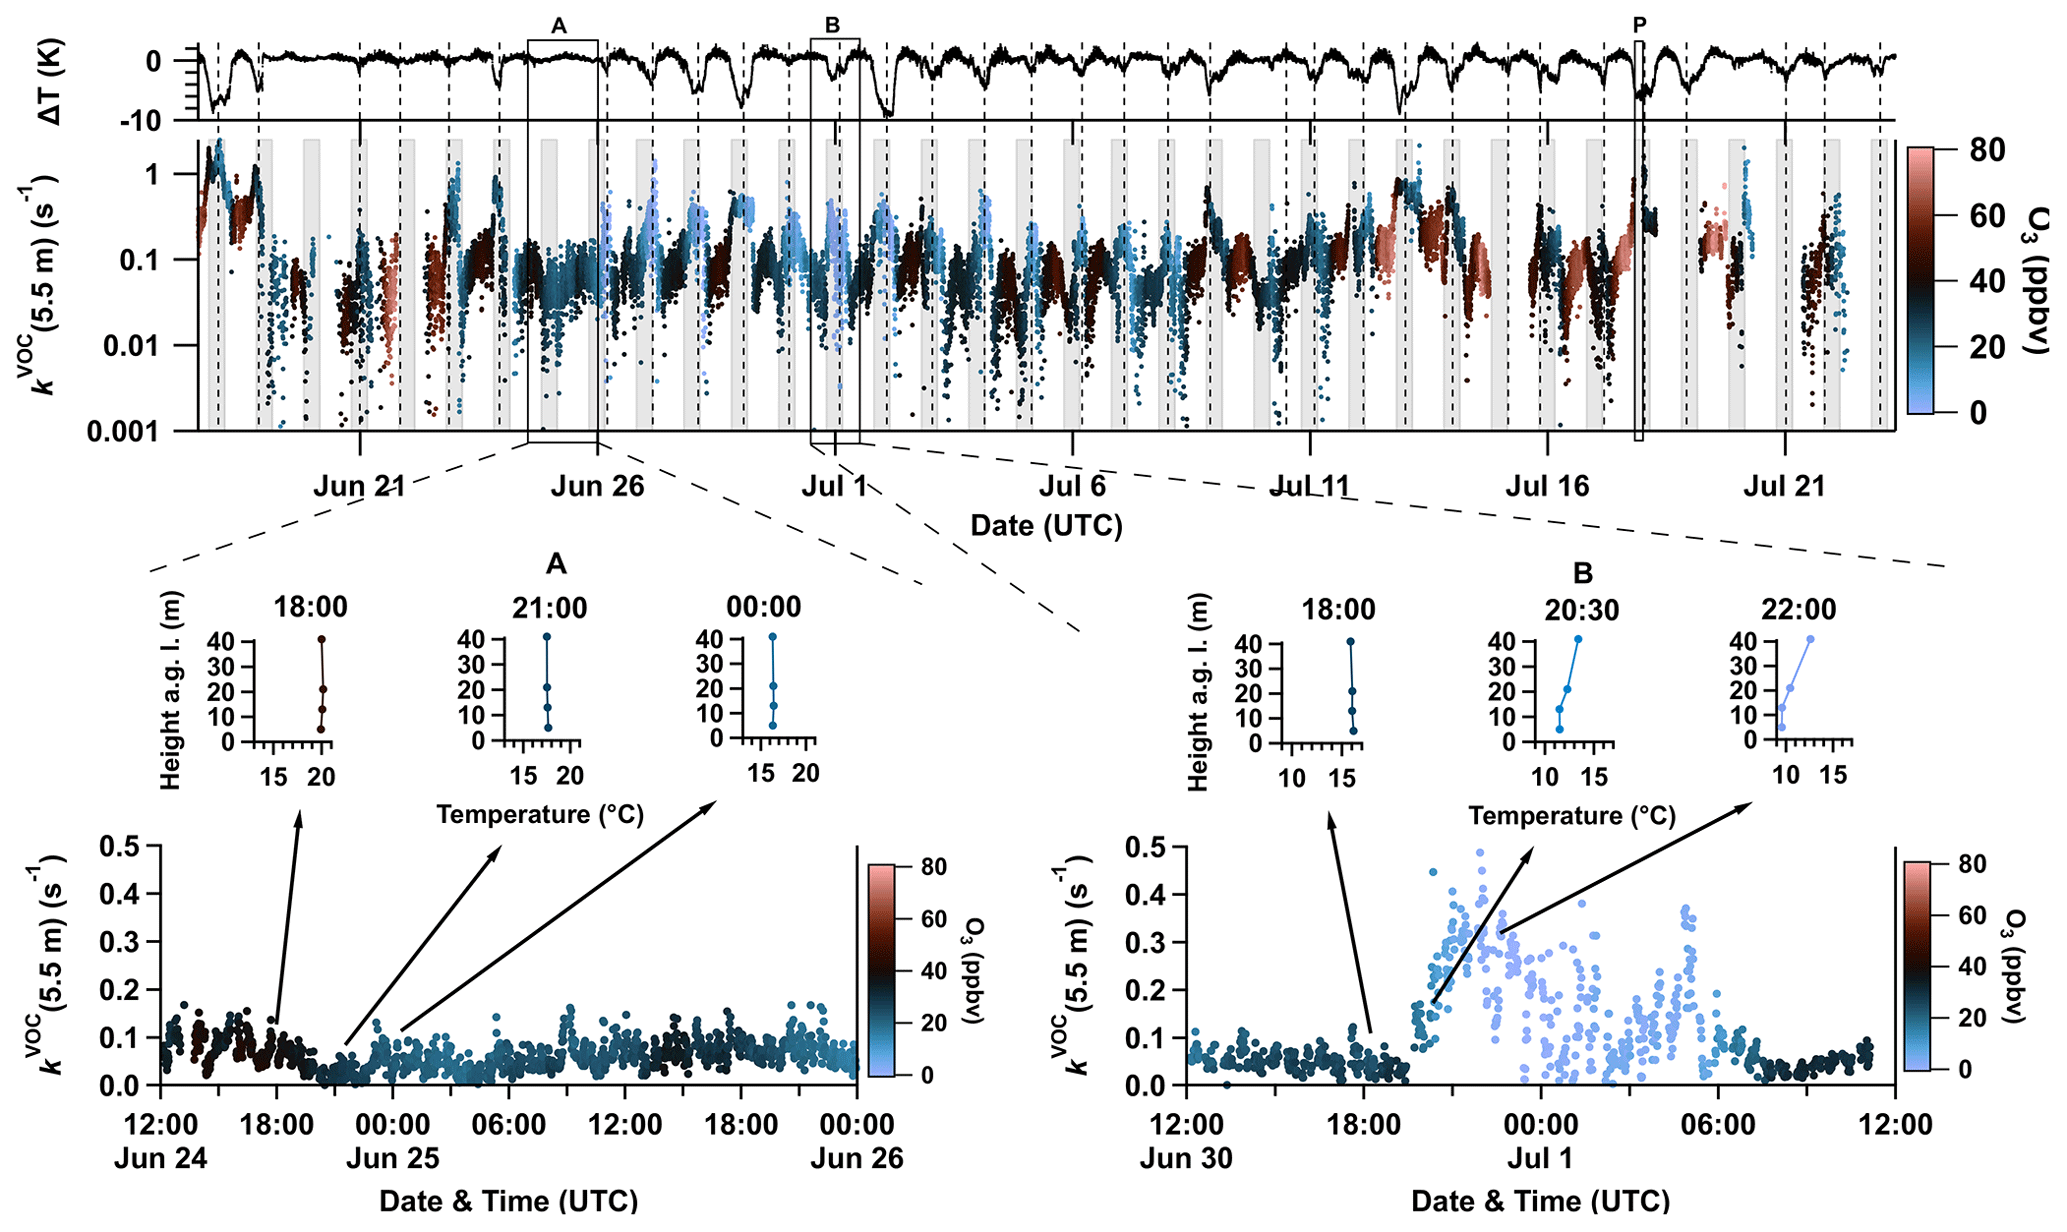
Figure 2Time series of kVOC (second panel, logarithmic scale) near ground level (5.5 m) coloured by O3 mixing ratios measured at the same height (colour scale on the right). Nighttime periods are grey-shaded. The difference between temperatures measured at 5 and 41 m (ΔT) is plotted in the first panel. Temperature inversions are marked by dashed vertical lines. Periods A (lower-left panel) and B (lower-right panel) exemplify daytime–nighttime transitions, both with (right) and without (left) clear temperature inversions, with NO3 reactivity plotted along with temperature profiles at selected times. A vertical profile of kVOC was measured in period P (see Sect. 3.5).
The hypothesis that temperature inversions partially drive the observed NO3 reactivity within the canopy is reinforced by close inspection of the temperature profiles in period B in the inset of Fig. 2. At 18:00 UTC, no gradient in temperature (16.5 °C) between 5 and 41 m was observed. At 20:30 UTC, a positive gradient in temperature was observed at heights >20 m, becoming more distinct at 22:00 UTC. Under these conditions, vertical mixing from ground level to above-canopy levels (ca. 20 m) is suppressed, whereas some mixing may still take place between 5 and 13 m where no temperature difference was observed. Weak (but non-zero) vertical mixing at the lower levels may be the cause of the high variability in (5.5 m) whereby instabilities in the stratification at lower levels of the NBL allow for sampling (at 5.5 m) of air with different (variable) time periods spent at lower/higher levels and thus with highly variable reactivity. The resulting high variability in NO3 mixing ratios has been documented for NO3 measurements made close to the ground (Brown et al., 2003; Crowley et al., 2010).
In forests, the most abundant BVOCs are typically isoprene and monoterpenes (Hakola et al., 2012; Vermeuel et al., 2023). Since the corresponding rate coefficients for the reaction of NO3 with monoterpenes are up to 2 orders of magnitude larger than those of isoprene (IUPAC, 2024), monoterpenes are expected to be the main contributor to kVOC during the ACROSS campaign. Relative monoterpene emission factors are temperature dependent and described by exp (β(T−297 K)) with β=0.1 K−1 in forested environments (Guenther et al., 1993), resulting in a strong seasonal variation (Hakola et al., 2006; Vermeuel et al., 2023). As a consequence, correlations between air temperature, VOC mixing ratios, and OH reactivity have been reported (Kalogridis et al., 2014; Pfannerstill et al., 2021). Figure 3a shows that, during the day (black data points), with temperatures varying from 297 to 311 K, an increase in kVOC(5.5 m) is observed. The inset contains daytime values measured between 10:00 and 14:00 UTC against air temperature, and a linear regression suggests a fair correlation between the two (Pearson correlation coefficient r = 0.66). The factor of 4 increase in the emission rate over this range as reported in Guenther et al. (1993) is much larger than the observed change in kVOC(5.5 m). This is however expected as the daytime concentrations of monoterpenes (MTs) will be determined not only by emission rates but also by their lifetime, which, in the clearing, will be reduced by reactions with daytime oxidants such as OH and O3 and (possibly more importantly) transport out of the canopy (Bohn, 2006). At nighttime (blue and red dots in Fig. 3a), there is no clear correlation between kVOC(5.5 m) and temperature, although the highest values of kVOC(5.5 m) are generally observed at lower temperatures. A plot of (5.5 m) versus ΔT, coloured according to the temperature at 5 m (Fig. 3b), reveals that higher NO3 reactivity is accompanied by large (negative) values of ΔT. The maximum value of s−1 was observed when a strong temperature inversion (ΔT < −6 K) coincided with a high nocturnal air temperature. During cooler nights (T(5 m)< 12 °C), kVOC(5.5 m) was < 0.5 s−1 even during periods with very strong temperature inversions. Our analysis thus shows that while temperature is an important factor influencing NO3 reactivity at 5.5 m through enhanced rates of emission of BVOCs, the effect (at least at sub-canopy levels) is greatly amplified by temperature inversions which favour accumulation of MTs in a shallow boundary layer close to the surface. In an upcoming publication we use monoterpene measurements to analyse NO3 (and N2O5) mixing ratios and lifetimes at both 5.5 and 40 m heights during ACROSS and draw a comparison between directly measured NO3 reactivity and that attributed to various BVOCs.
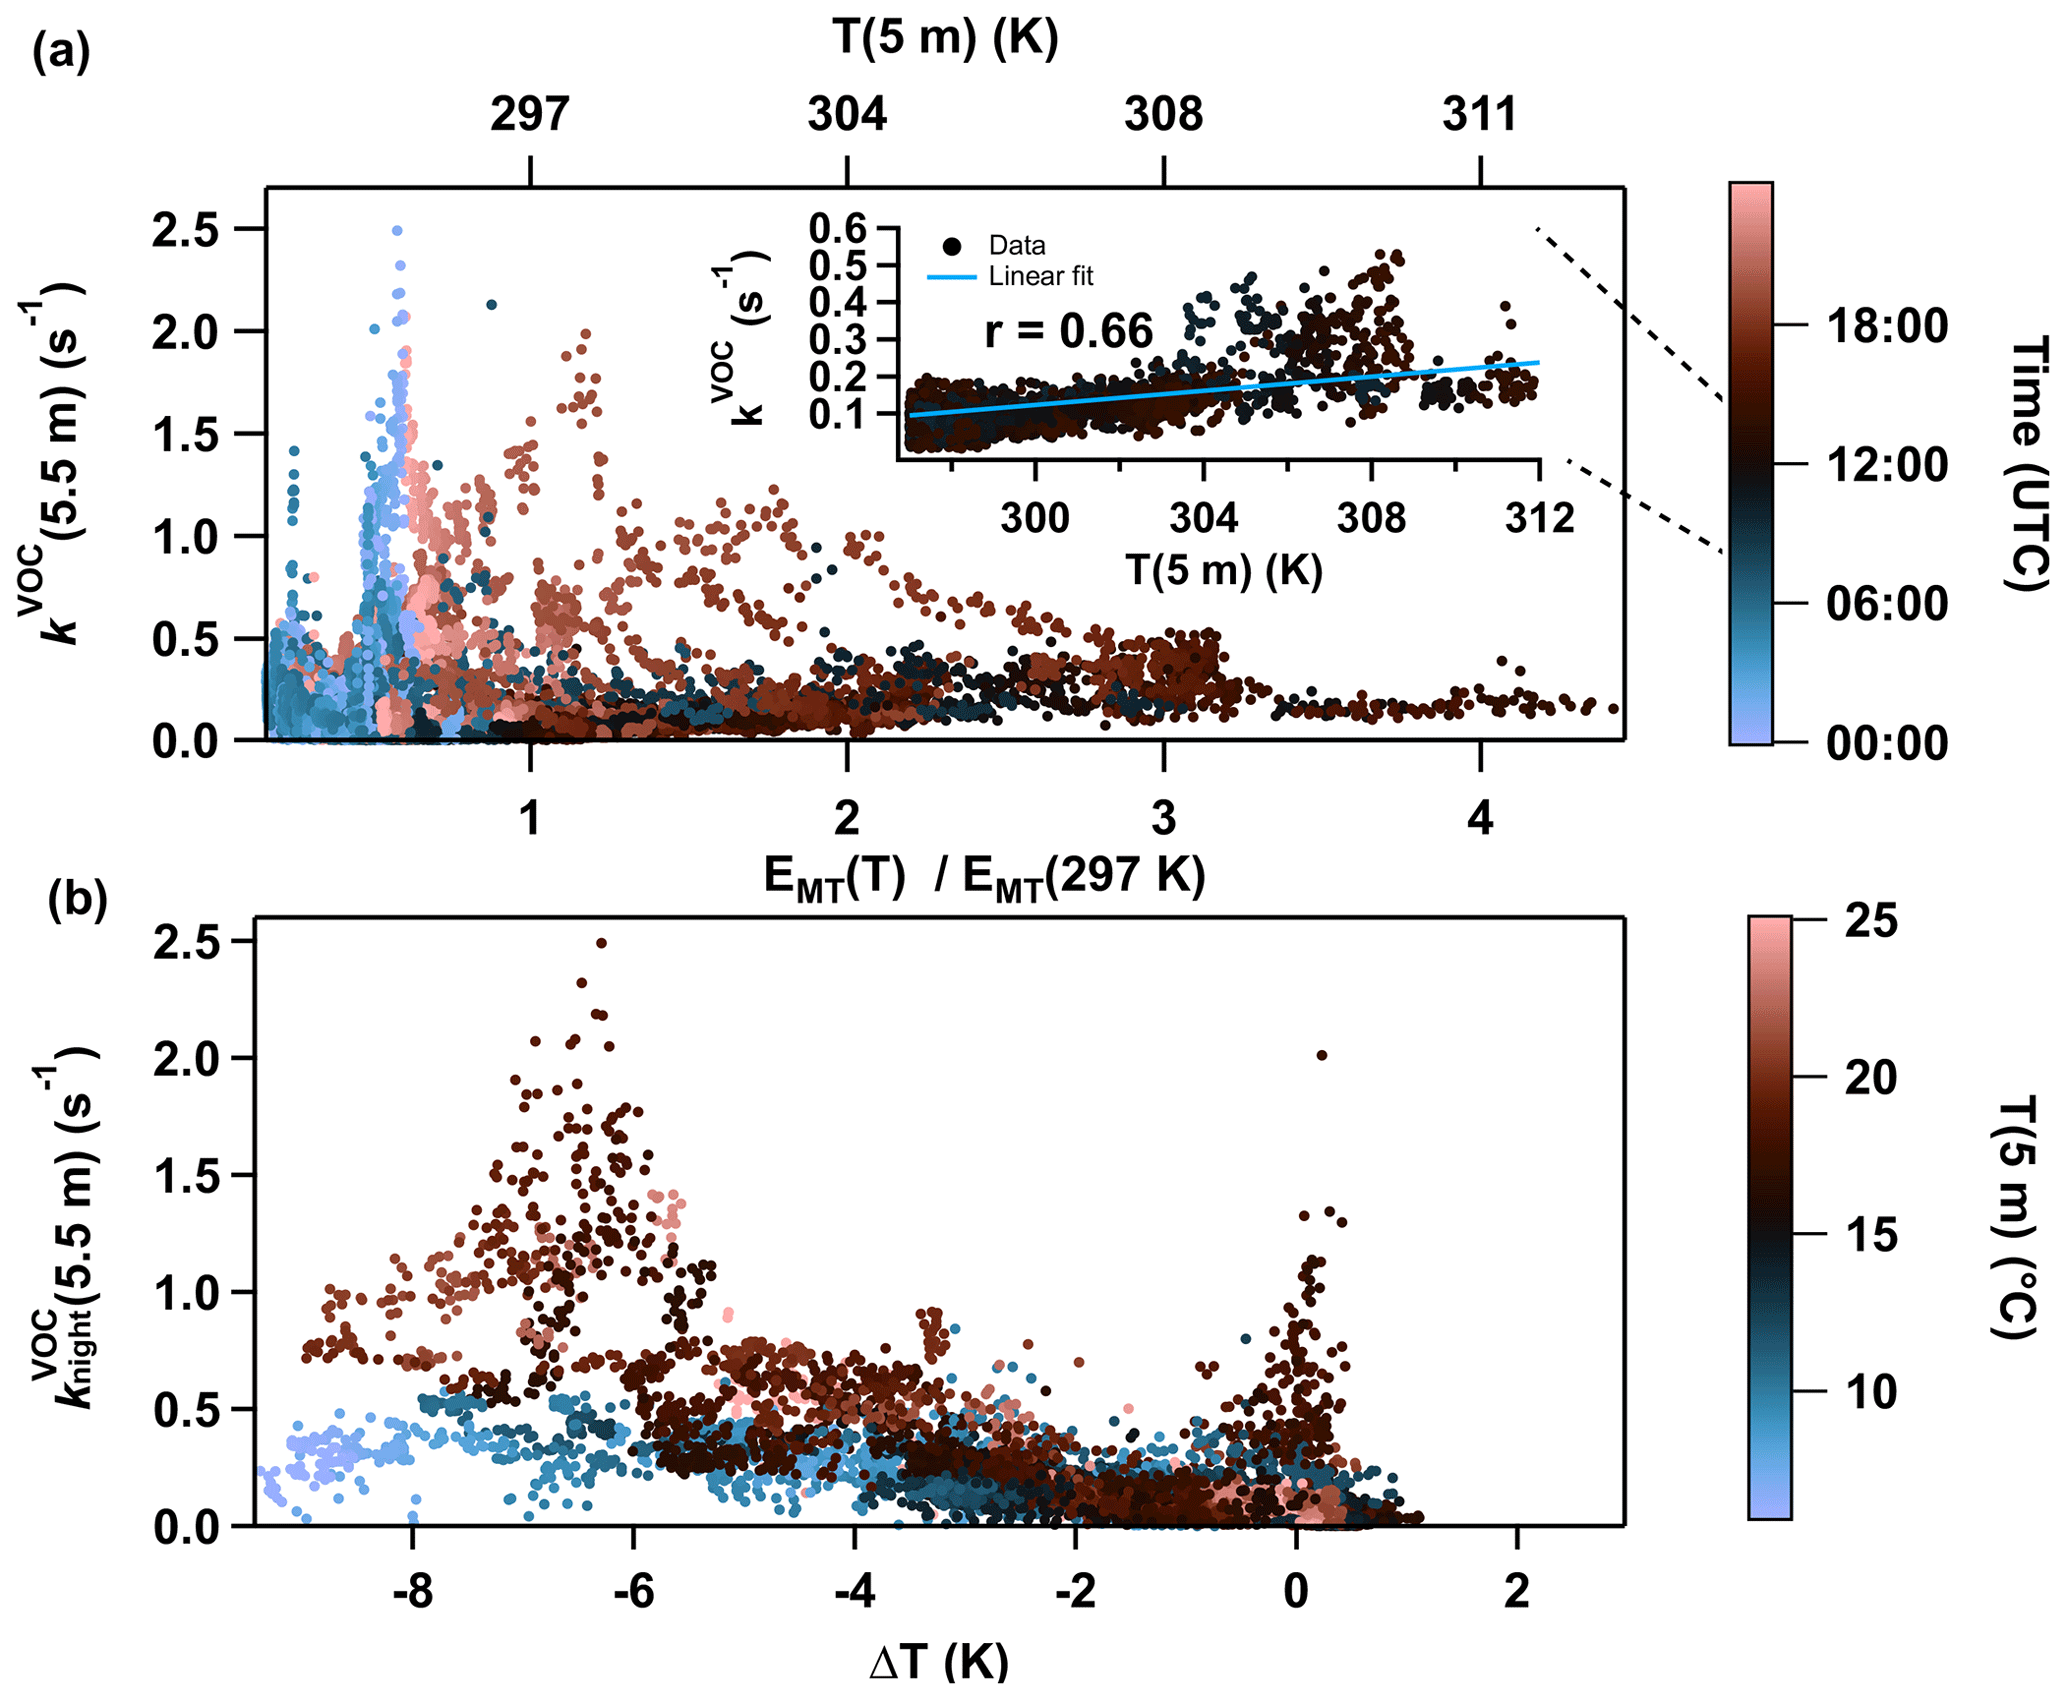
Figure 3(a) NO3 reactivity at 5.5 m (kVOC(5.5 m)) plotted against the expected change in the monoterpene emission factor (EMT) relative to 297 K using (Guenther et al., 1993). Data points are coloured according to the time of the day (UTC) with night/morning (blue), daytime (black), and afternoon/night (red). The inset shows kVOC(5.5 m) between 10:00 and 14:00 UTC plotted against air temperature (5 m). Linear regression (solid blue line) yields a Pearson correlation coefficient (r) of 0.66. (b) Nocturnal ground-level NO3 reactivity (5.5 m) versus the temperature difference (ΔT) between 41 and 5 m. The data points are coloured according to the ground-level temperature T(5 m).
3.2 Nitrate radical lifetime within and above the canopy
For the last 5 d of the ACROSS campaign (18–23 July), the NO3 reactivity was measured at a height of 40 m every even hour, with data obtained at 5.5 m every odd hour. The corresponding time series of this measurement with a discussion of the vertical gradients observed during this period is appended in the Supplement (Sect. S2). With the data from this period, we could derive the total (chemical) loss rate coefficient of NO3 not only at 5.5 m but also at 40 m, which is given by
where kVOC is our directly measured VOC-induced loss, is the NO3 photolysis frequency (Fig. 1a), and k5 is the rate coefficient (IUPAC, 2024) for the reaction between NO and NO3. Equation (1) neglects NO3 loss processes resulting from direct (and indirect) heterogeneous reactions of NO3 (and N2O5) as well as reactions with HOx and organic radicals, which, for the ACROSS environment, is justified in the Supplement (Sect. S3). The NO3 lifetime is the inverse of the total NO3 loss rate coefficient:
We plot through the diel cycle (5.5 and 40 m) in Fig. 4. To calculate ktot(5.5 m), the whole campaign period (as in Fig. 1) was considered since data gaps in both NO and close to the ground and on top of the tower reduced the availability of quasi-simultaneous values of ktot(5.5 m) and ktot(40 m) (see Sect. S4). At a height of 5.5 m, the nocturnal lifetime of NO3 is 2–3 s and (counterintuitively) somewhat longer (4–5 s) during the day despite its photolysis. At a height of 40 m, above the canopy, the daytime lifetime of NO3 is close to 3–4 s, whereas at night it increases to 10–12 s. The similar lifetimes at both heights during the day imply a vertically well-mixed layer. On the other hand, the longer nocturnal lifetime at 40 m compared to 5.5 m can be attributed to decoupling from direct (ground-level and within-canopy) sources of NO and BVOCs (see Sect. 3.1). The longer nocturnal lifetime of NO3 at 40 m enabled it to be detected on some nights of the campaign, whereas NO3 measurements were, unlike N2O5, always below LOD close to the ground. A detailed analysis of the NO3 (and N2O5) measurements will be presented in a future publication.
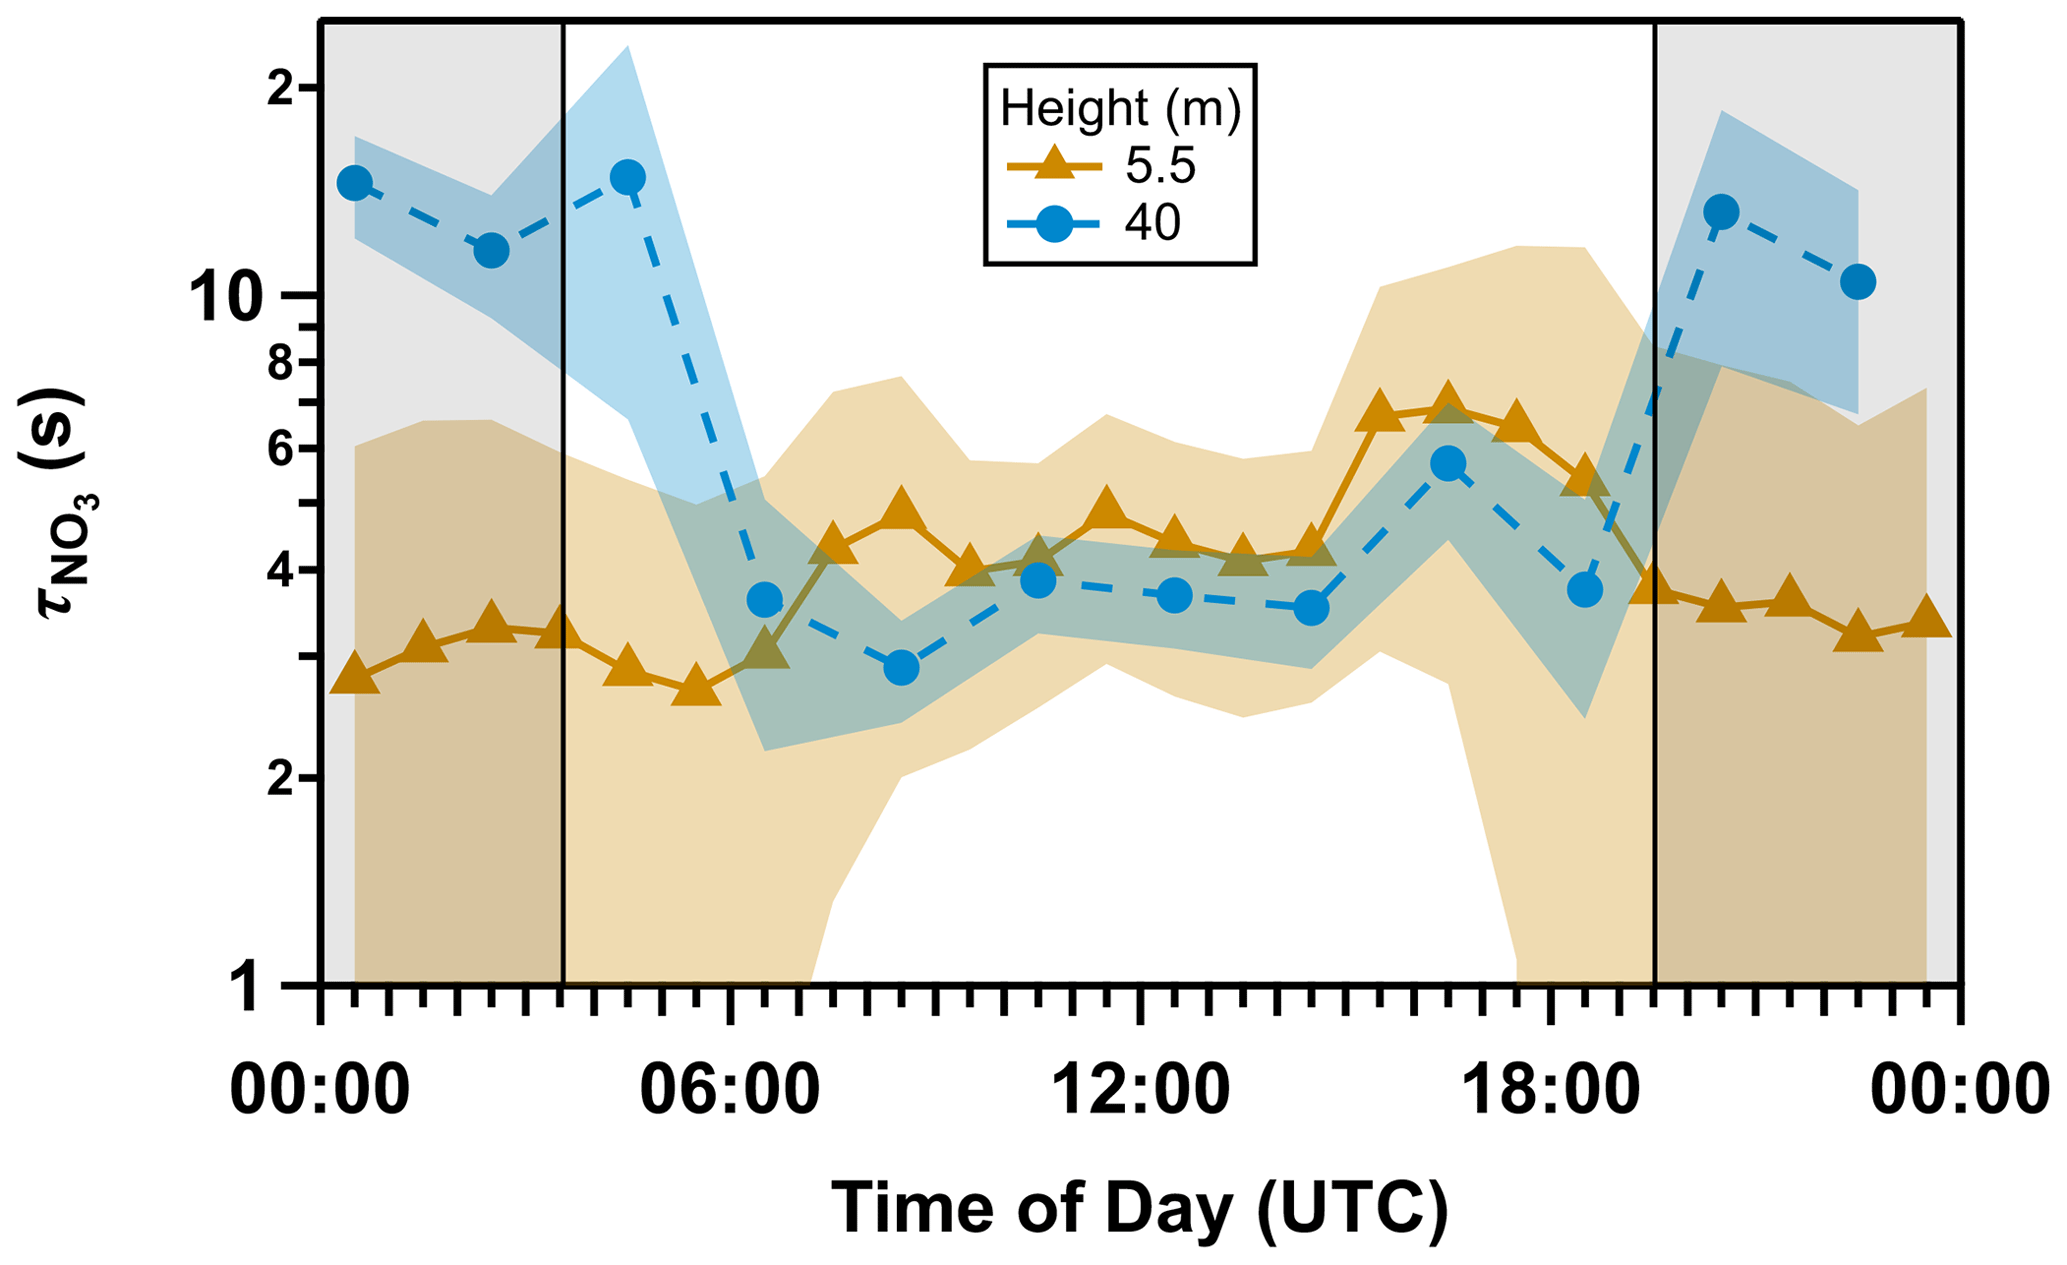
Figure 4Mean diel cycle of overall NO3 lifetime () calculated from Eq. (2) at 5.5 m (dark orange triangles with solid line, 17 June–23 July) and 40 m (blue circles with dashed line, every 2 h, 18–23 July). The shaded areas represent the standard deviation (1σ). The nighttime period (19:30 to 03:30 UTC) is grey-shaded.
3.3 Fate of the nitrate radical within the canopy
A mean diel cycle of kVOC(5.5 m) for the whole campaign is depicted in Fig. 5. The higher mean nighttime value ( = s−1 compared to = (0.12 ± 0.04) s−1) is a result of the accumulation of BVOCs in a shallow sub-canopy layer with reduced rates of canopy venting owing to temperature inversions. The observation of a daytime minimum and nighttime maximum in kVOC(5.5 m) is consistent with measurements in the boreal forest in Finland (J. Liebmann et al., 2018), where terpene emissions dominated the fate of NO3, and strong temperature inversions were present at night. Values of kVOC in the boreal forest in autumn were a factor of 2–3 lower than those we measured in the temperate forest during ACROSS, which is presumably related to the lower temperatures as well as other factors such as leaf area index, vegetation type, and availability of oxidizing agents, which affect the abundance of monoterpenes.
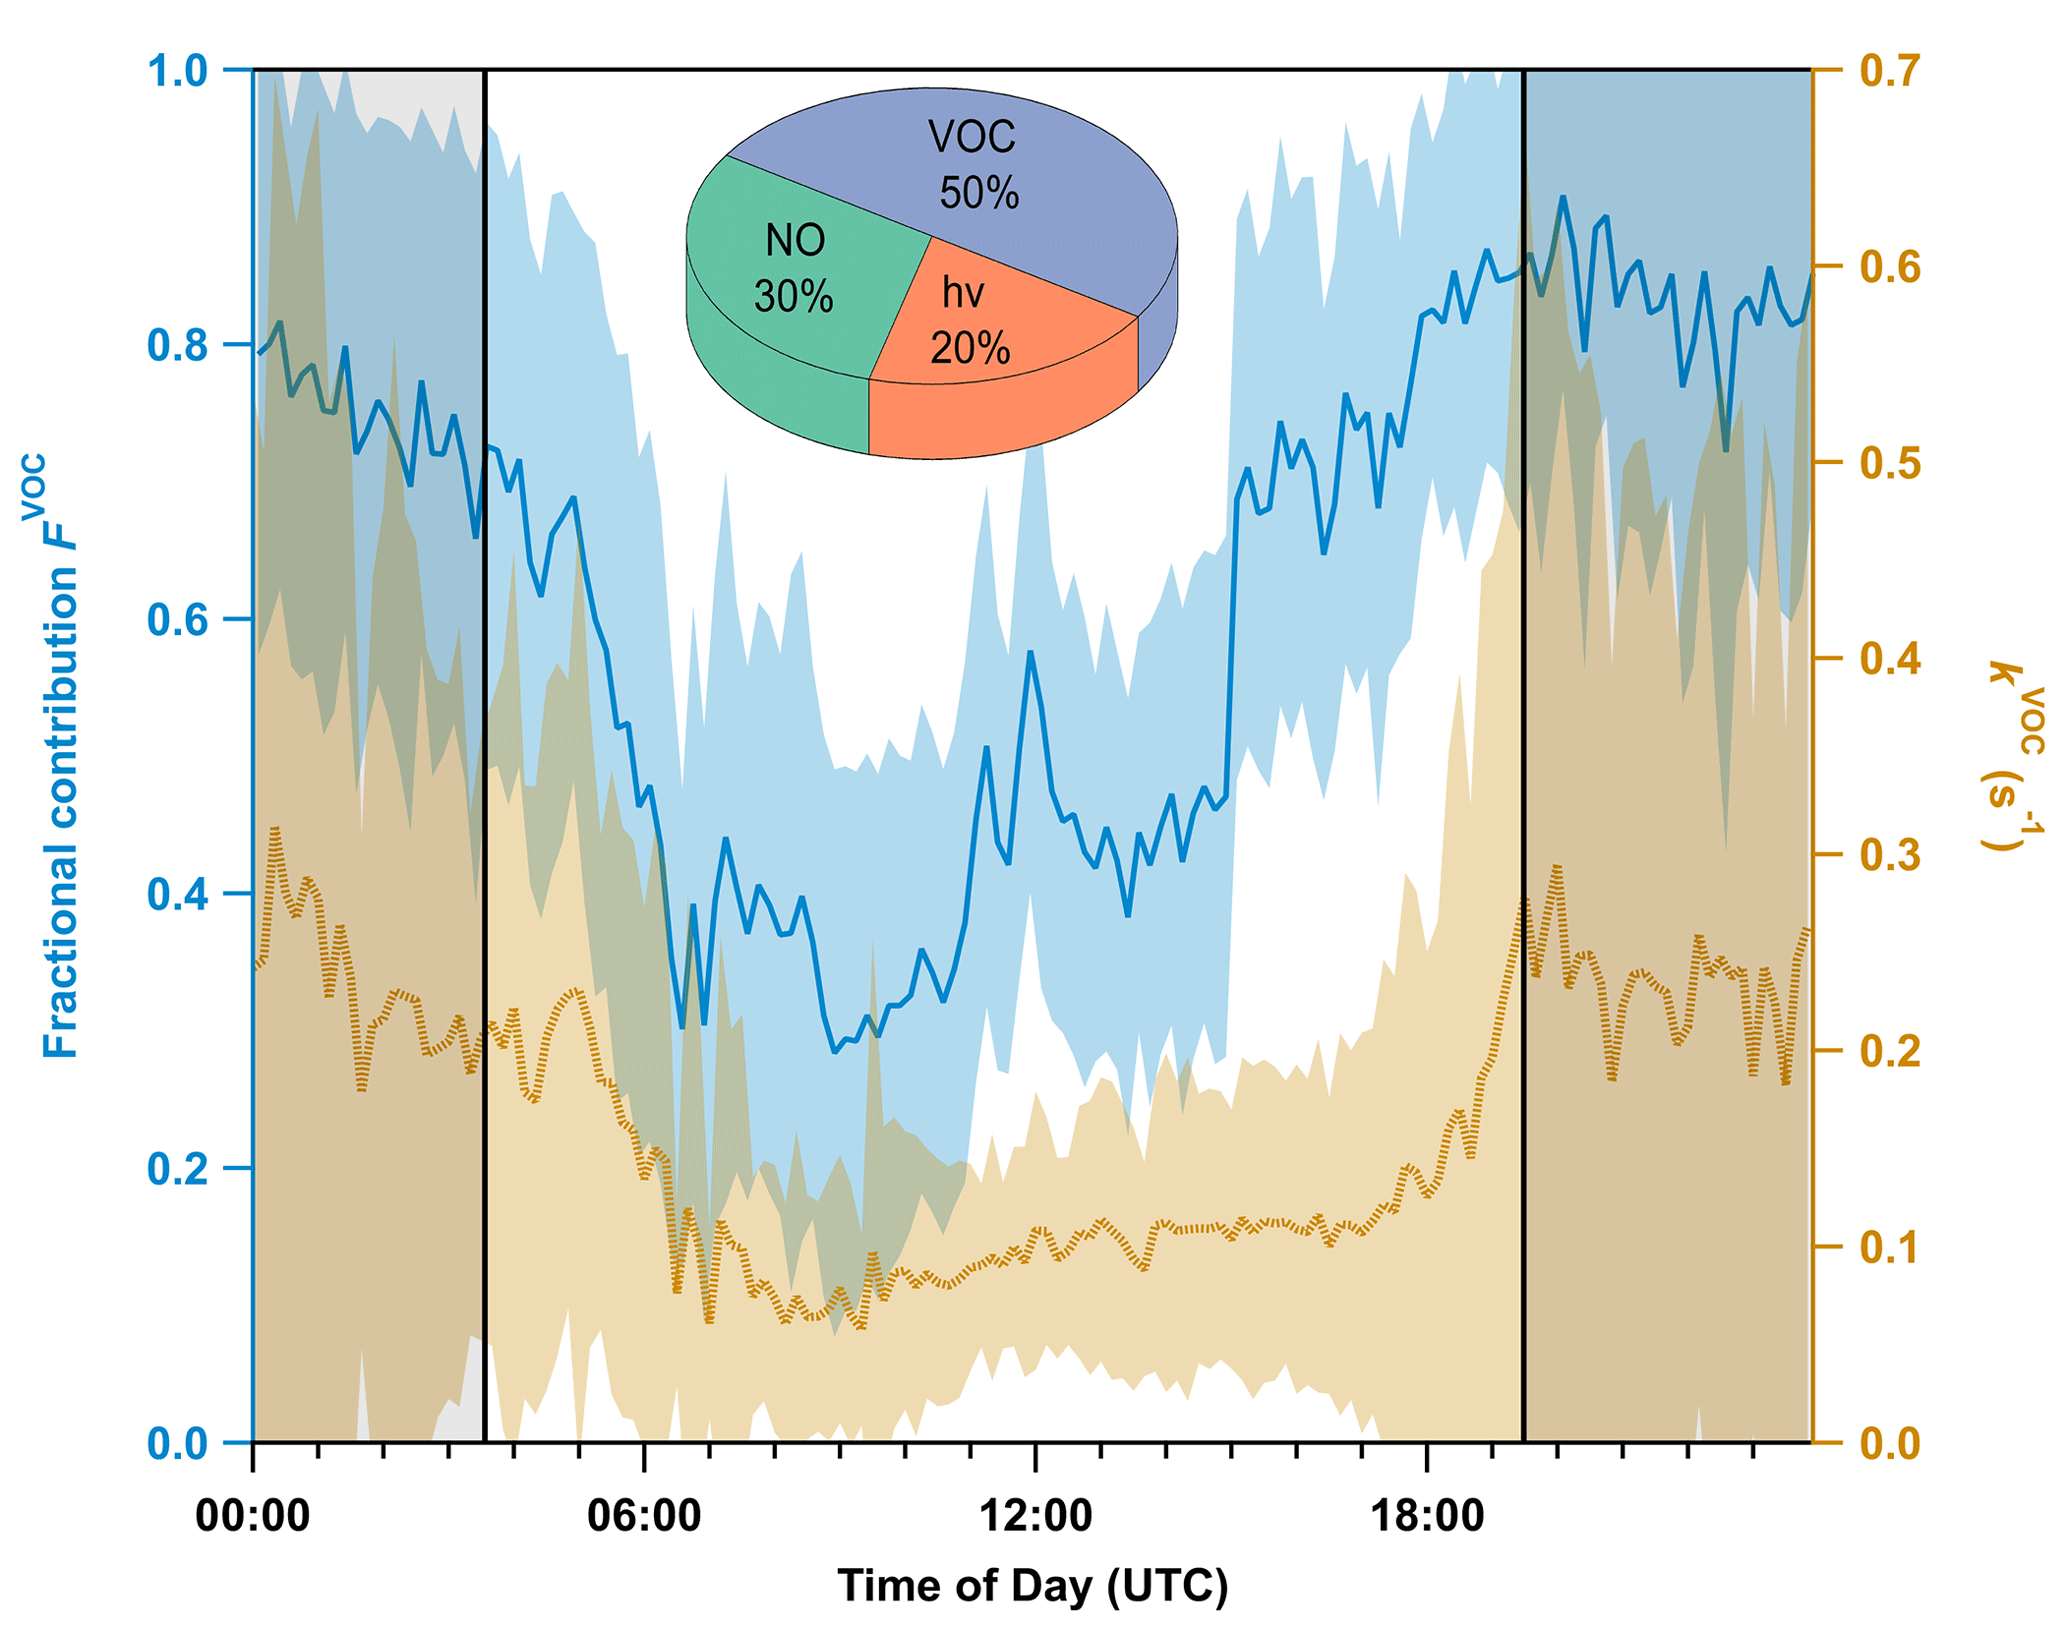
Figure 5Mean diel profiles (10 min averages, 17 June–23 July) of VOC-induced NO3 reactivity (kVOC, right y axis) at 5.5 m along with its fractional contribution (FVOC, left y axis) to the overall NO3 loss. The shaded areas represent the standard deviation (1σ). The nighttime period is grey-shaded and separated by solid black lines. The pie chart shows the fractional contribution of each process in Eq. (1) to the overall NO3 loss term during the day.
The fractional contribution, FVOC, of the reaction of NO3 with VOCs to its total loss rate coefficient, ktot, is given by Eq. (3):
and shown in Fig. 5. At night, FVOC (grey-shaded area, blue line) is ca. 0.7–0.8, with the remaining 20 % to 30 % assigned to reaction with NO. During the day, while photolysis (20 %) and reaction with NO (30 %) gain increased importance, VOCs still account for 50 % of the NO3 reactivity. The large daytime contribution of kVOC is partly related to the fact that actinic flux (and thus the photolysis frequencies of NO3) within the clearing at 5.5 m height is reduced compared to above-canopy levels (Fig. 1a). In addition, the photolysis frequency for NO2 is also reduced so that the distribution of NOx between NO and NO2 is shifted towards NO2 and away from NO, resulting in a reduction in k5[NO]. In order to assess the impact of this effect, we calculated FVOC with above-canopy values of and NO. In this scenario, daytime FVOC increases to 33 %; i.e. the reduction in photolysis frequencies increases FVOC by a factor of 1.5. J. Liebmann et al. (2018) reported a daytime average for FVOC of only 20 % in a boreal forest. Despite the fact that both sites are similarly affected by low NO and high monoterpene levels, this value is still significantly lower than 33 %, which can be reconciled with lower daytime values of kVOC in the boreal forest. The comparatively high daytime contribution of VOCs to NO3 consumption below the canopy thus stems from both reduction in and higher values of kVOC, with the latter most likely due to higher concentrations of monoterpenes than in the boreal forest. This observation is consistent with even higher daytime VOC contributions to NO3 loss of >97 % reported for sunlit wildfire plumes by Decker et al. (2021), who reconciled their result with VOC mixing ratios that were sufficiently high to outcompete photolysis and NO.
We note at this point that the photolysis frequencies measured in the clearing will be substantially larger than in the non-cleared forest. By comparing (5.5 m) with values observed above the canopy in the early morning and afternoon when the integrating dome of the spectral radiometer experienced only diffuse sunlight, we observe a reduction in (5.5 m) by a factor of >10 (Sect. S5). A substantial reduction in in-forest actinic flux compared to in a clearing and above the canopy has been reported by Bohn (2006) for a temperate deciduous forest, albeit of different tree type and density of foliage. As discussed by Bohn (2006), a reduction in NO3 photolysis frequency implies that the relative importance of NO3 (compared to OH and O3) as a daytime oxidant in the forest canopy is even larger than that (∼ 50 %) derived above. A caveat to this is that the formation of NO3 requires the presence of O3 and NO2, both of which are likely to have substantial deposition terms in dense foliage in the non-cleared forest. We also recognize that, during the daytime, the in-canopy chemical lifetimes of BVOCs may be much longer (see Sect. 3.6) than the average residence time with respect to canopy outflow so that most BVOC daytime oxidation may take place above the forest.
3.4 Fate of the nitrate radical above the canopy
In Fig. 6, we plot the diel cycle of kVOC(40 m), which shows a daytime maximum and nighttime minimum, which is the opposite of that measured at 5.5 m (see Fig. 5) but is typical of measurement sites that are decoupled from near-ground emissions during the night (Crowley et al., 2011; J. M. Liebmann et al., 2018; Dewald et al., 2022). The daytime mean value of = (0.07 ± 0.02) s−1 is similar to that measured at 5.5 m, which presumably results from vertical mixing that is rapid compared to chemical lifetimes of BVOCs and NO. In contrast, the average value (±25th and 75th percentiles, respectively) of = s−1 is approximately 1 order of magnitude lower than (5.5 m). Recall however that due to its poor data coverage during the 5 d period, kVOC(5.5 m) from the whole campaign is used for this comparison.
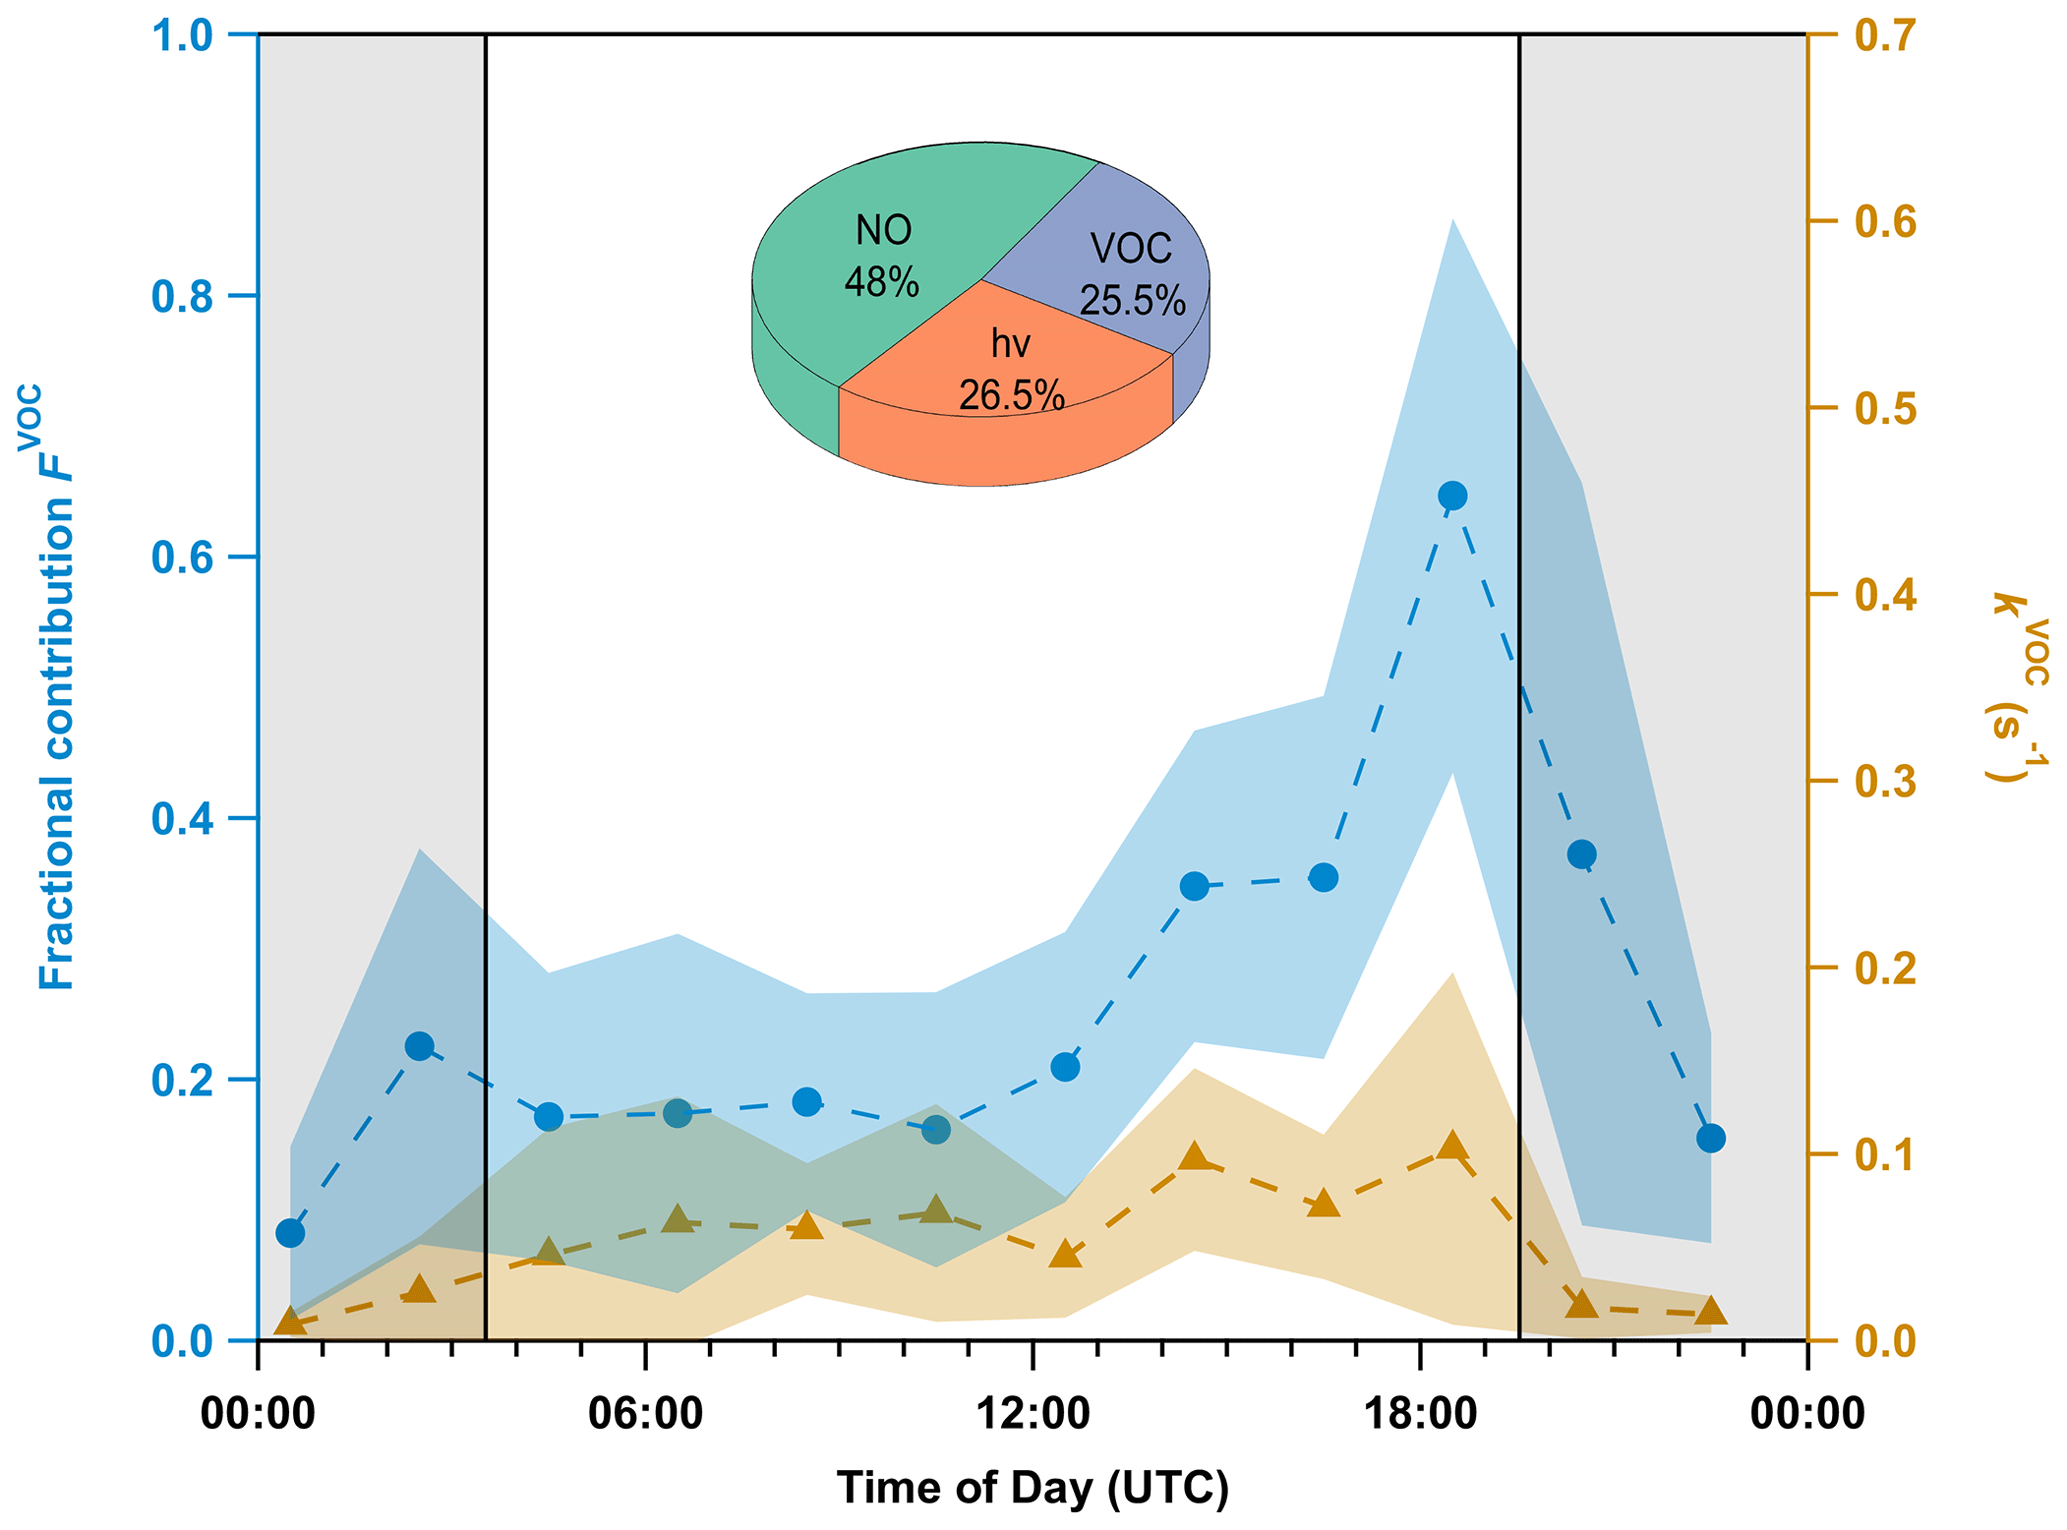
Figure 6Mean diel profiles (1 h averages, every 2 h, 18–23 July) of VOC-induced NO3 reactivity (kVOC, orange triangles) at 40 m along with its fractional contribution (FVOC, blue circles) to the overall NO3 loss. The shaded areas represent the standard deviation (1σ). The nighttime period is grey-shaded. The pie chart shows the fractional contribution of each process in Eq. (1) to the overall NO3 loss term during the day.
The daytime, chemical, and gas-phase NO3 loss processes at 40 m (see pie chart in Fig. 6) also differ significantly from those at 5.5 m (see Fig. 5), with the contribution of BVOCs almost halved (25.5 %) in favour of both NO (48 %) and photolysis (26.5 %). Reaction with NO is thus the main daytime loss process for NO3 at 40 m, which is a result of greater NO mixing ratios at this height during the 5 d period. But even at night, NO mixing ratios during this period were still high enough (40–150 pptv) to compete with VOCs. In addition, some days between 18 and 23 July were cloudy, which is why NO3 loss via reaction with NO prevails even at a height of 40 m. A time series comparing , k5[NO], and ktot at both heights during this period is appended in the Supplement (Sect. S4).
3.5 Vertical gradient (0–24 m) in NO3 reactivity
During the night from 17–18 July (a night with a strong temperature inversion with ΔT between −4 and −6 K), gas-phase NO3 reactivity (resulting from reaction with both BVOCs and NO), NO2, and O3 were measured at heights between 0 and 24 m a.g.l. in 4 m steps. Measurements of NO2 and O3 at 40 m during the same night are also plotted in Fig. 7. As NO mixing ratios were not available at all heights, the NO3 reactivity was not corrected for this and thus includes NO3 removal via reaction with NO (kNO=k5[NO]); i.e. kVOC becomes kVOC + kNO.
Between 20:00 and 00:00 UTC five profiles of kVOC+kNO were measured, each taking < 20 min. The first profile was measured after an increase in (5.5 m), which was associated with the onset of the temperature inversion. kVOC + kNO (averaged over the five single profiles) is plotted against height in Fig. 7c along with the data obtained at 40 m in the following nights (see Sect. 3.2). The data reveal a strong trend in NO3 reactivity, with the highest values (0.34 s−1) measured at ground level, where NO is expected to have a greater impact, gradually decreasing with height to a value of ca. 0.08 s−1 at 24 m. The data at 40 m (uncorrected for NO) are broadly consistent with this trend and, together with Fig. 6, imply that NO is the main contributor to NO3 reactivity above canopy level. The gradient in NO2 (Fig. 7b) shows no clear trend for heights below 24 m and is determined by its nighttime production (mainly the reaction between NO and O3), which depends on the availability of NO and the availability of O3 (which has a positive gradient). As modelled in Stutz et al. (2004), a negative nocturnal gradient in NO with height is expected, notably due to soil emission and reaction with O3 (Andersen et al., 2024). In addition, NO2 loss via deposition is expected to be more important at the lower levels. These processes appear to roughly counterbalance each other on this night, resulting in an almost-constant mixing ratio between ground level and 24 m. This observation is consistent with that in Stutz et al. (2004), who could, if at all, only find very weak gradients. Figure 7a also includes the vertical profiles of O3, which increases from ca. 27 ppbv at ground level to 58 ppbv at 40 m, presumably a result of near-ground loss processes such as deposition and reaction with NO/BVOCs and lack of entrainment of O3 from above the canopy, where higher mixing ratios were measured (Fig. 1c) (Brown et al., 2007a). The measured vertical profiles of O3 were much less distinct in Stutz et al. (2004), which contradicted their model calculations that suggested a monotonic increase within the first 100 m, broadly consistent with our case study.
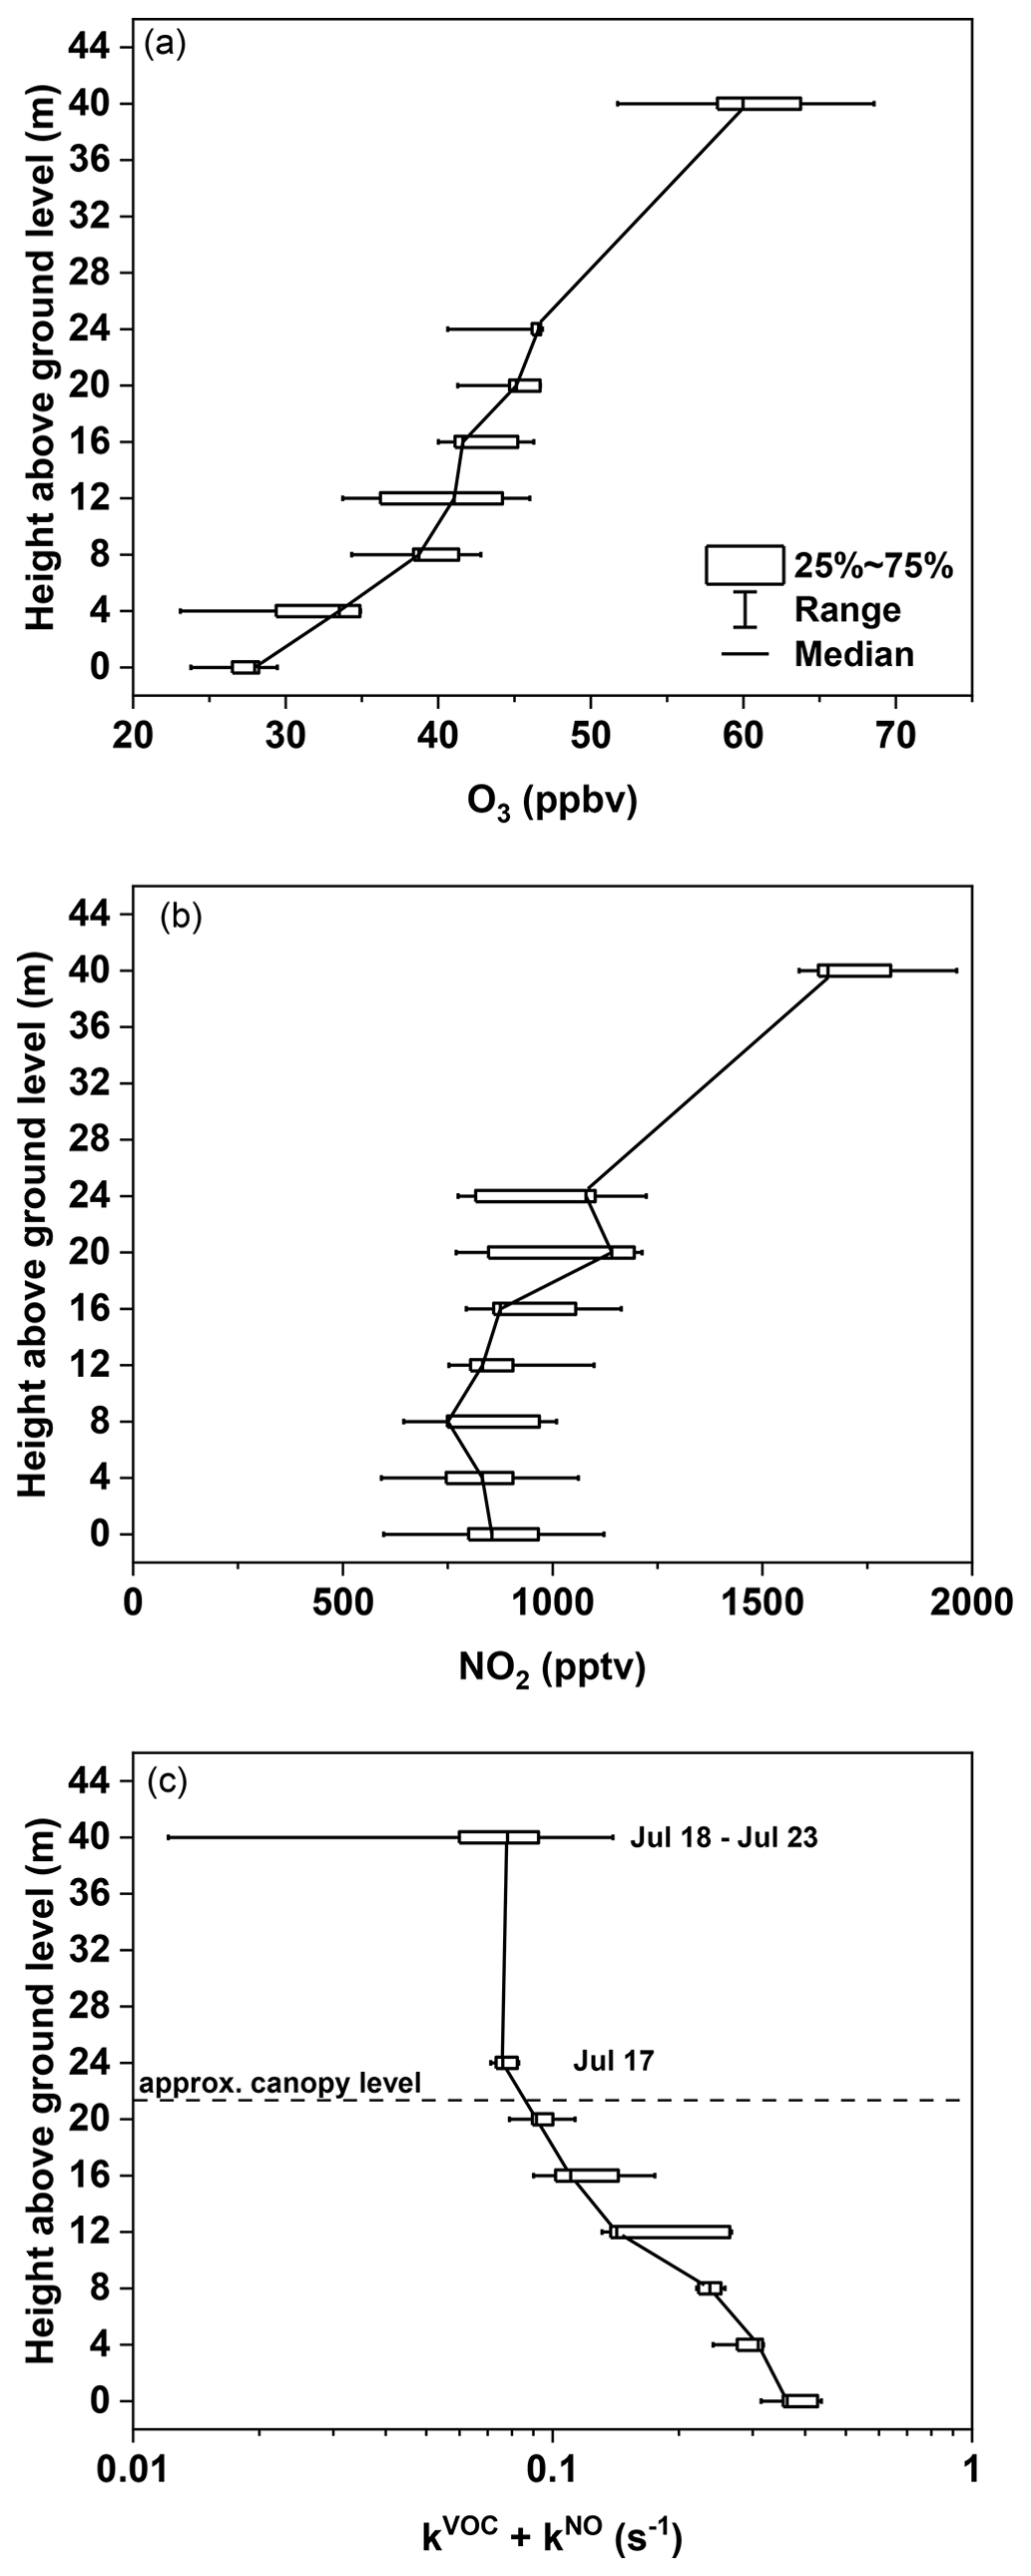
Figure 7Box-and-whisker plots (full range, 25th, 50th, and 75th percentiles) of vertical profiles of (a) O3, (b) NO2, and (c) total gas-phase NO3 reactivity (kVOC+kNO) measured during the temperature-inverted night of 17–18 July between 20:00 and 00:00 UTC. NO3 reactivities measured on top of the tower (40 m) during the nights between 18 and 23 July are also shown.
3.6 Fractional contribution of NO3 to BVOC oxidation below the canopy
Our results show that, within the canopy, the nitrate radical is lost by reactions with BVOCs not only during the night but also during the day. Here we calculate the fractional contribution of NO3 to the oxidation of a dominant BVOC, α-pinene (Guenther et al., 2012; J. Liebmann et al., 2018; Vermeuel et al., 2023). As detailed in Eq. (4), the overall loss rate coefficient for α-pinene (kα-pinene) can be calculated from the concentrations of each oxidant (OH, NO3, and O3) and the corresponding rate coefficients kx+αpin of , , and for the reaction of OH, NO3, and O3 with α-pinene at 298 K, respectively (IUPAC, 2024).
As measured NO3 mixing ratios near ground-level were below the LOD of 2 pptv throughout the whole campaign, we derived steady-state mixing ratios, [NO3]ss, from the ratio of production (k2[NO2][O3]) and overall NO3 loss rate coefficients ktot (Eq. 1) (Heintz et al., 1996; Brown et al., 2003; McLaren et al., 2010; Crowley et al., 2011). Note that the OH measurements were carried out with a chemical ionization mass spectrometer (CIMS; Kukui et al., 2008; see Sect. S3) ca. 17 m apart from the MPIC container. Figure 8a depicts the campaign-averaged median mixing ratios of OH, O3, and NO3 (steady state) throughout the diel cycle. Nighttime steady-state NO3 mixing ratios were 0.1–0.2 pptv during late evening until midnight, decreasing to < 0.1 ppt between midnight and dawn. This is related to not only the reduced availability of O3 but also the increase in kVOC, both of which were usually accompanied by temperature inversions. Remarkably, daytime NO3 values were similar and occasionally even higher than nighttime values, emphasizing the fact that photolysis was not the major daytime loss process for NO3. As expected, OH mixing ratios were the highest during the daytime (peak value of 0.14 pptv) but were not zero at night (0.01–0.03 pptv). Nighttime OH is formed in the oxidation of terpenes by O3 and in secondary reactions of RO2 and HO2 (formed in the same process) with NO. Median O3 mixing ratios reached ca. 44 ppbv during the day and continuously decreased to ca. 15 ppbv during the night and the early morning.
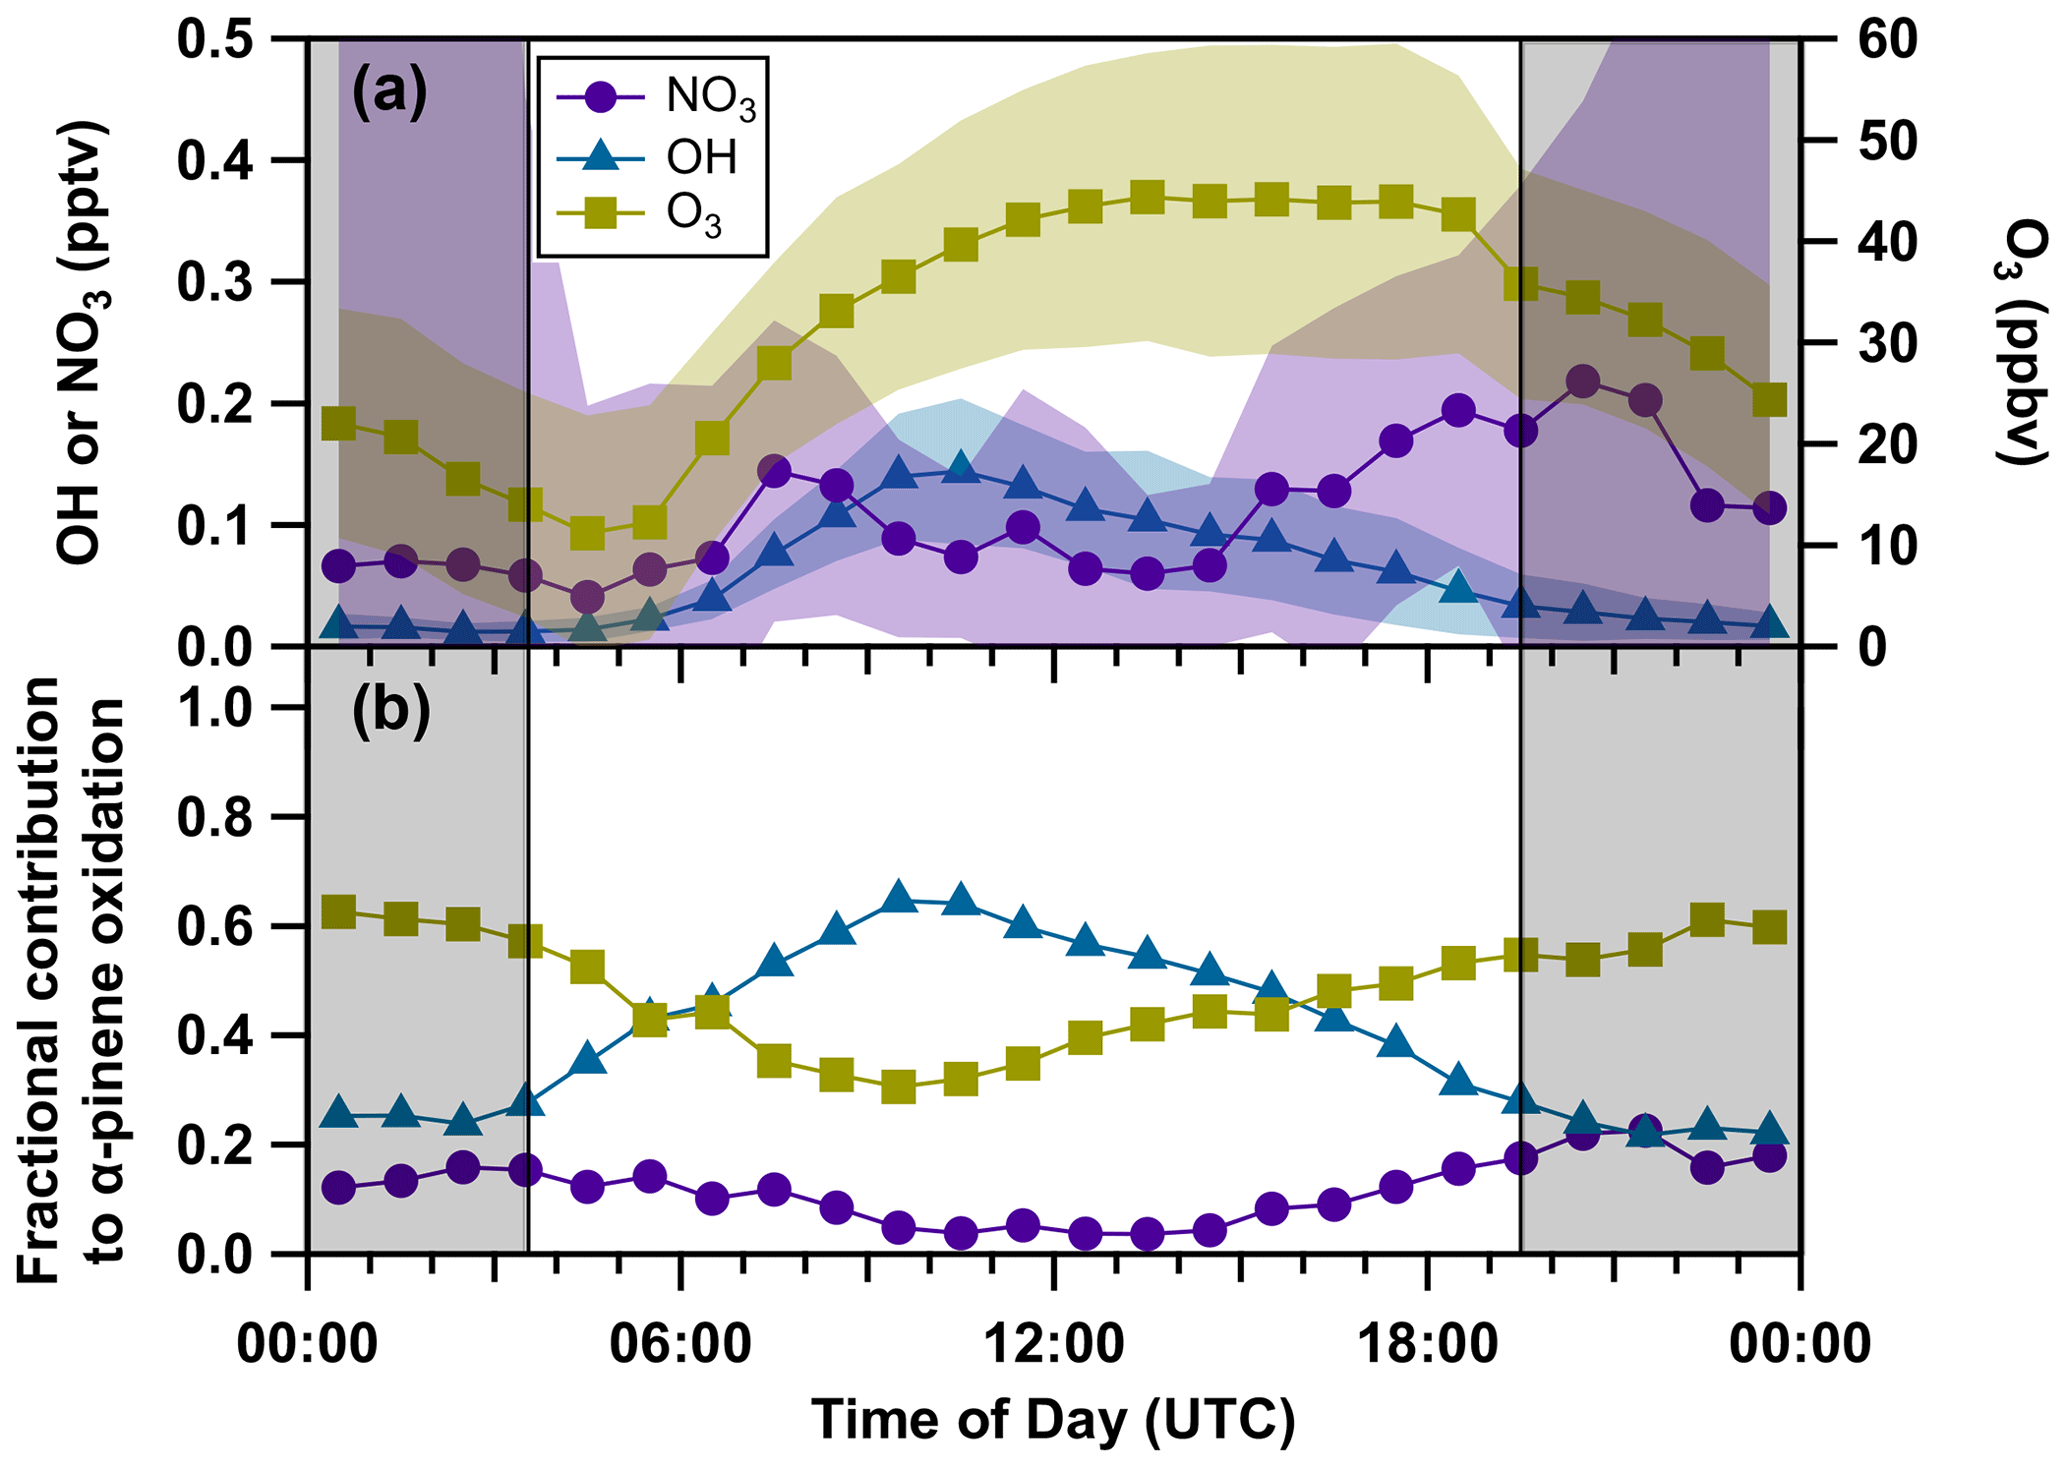
Figure 8Campaign-averaged median diel profiles (1 h) of the oxidants (a) [NO3]ss (violet circles), OH (blue triangles), and O3 (dark yellow squares) and their contribution to the overall loss rate coefficient of α-pinene according to Eq. (4) close to the ground (b). The nighttime period is grey-shaded. The shaded areas represent the standard deviation (1σ).
The fractional contribution of each oxidant to kα-pinene is presented as a median diel profile for the whole campaign in Fig. 8b. Based on the above analysis, in the summertime forested environment probed during ACROSS, NO3 contributed only ca. 17 % to the nighttime oxidation of α-pinene, a value that is exceeded by both OH (ca. 24 %) and O3 (60 %). The daytime dominance of OH and O3 (on average ca. 50 % and 41.5 %, respectively) is expected, whilst, with a contribution of 8.5 %, the diel- and campaign-averaged contribution of NO3 is still significant, which is in agreement with recent publications (Schulze et al., 2017; J. M. Liebmann et al., 2018; Mermet et al., 2021; Dewald et al., 2022) and model calculations showing that NO3 oxidizes BVOCs below the canopy level during daytime in both coniferous and deciduous forests (Forkel et al., 2006; Fuentes et al., 2007). We further note that the oxidation of BVOCs by OH, O3, and NO3 results in greatly different products so that in terms of formation of organic nitrates, NO3-initiated oxidation can still dominate (Liebmann et al., 2019). A detailed analysis on the role of NO3-initiated organic nitrate formation will be presented in a future publication from the ACROSS campaign. Recall that the fractional contributions are highly dependent on the ratios between the rate coefficients of the oxidants and are thus different for other monoterpenes. As shown in the Supplement (Sect. S6), this is reflected in lower fractional contributions of NO3 to the oxidation of β-pinene and limonene, with values of 12.4 % and 13.5 % at night and 4.4 % and 6.2 % during the day.
Our analysis is not consistent with the generally accepted textbook paradigm that OH-initiated oxidation processes are predominant during the day and NO3-initiated oxidation prevails at night. However, an important caveat to our analysis is the neglect of daytime transport (venting) of BVOCs out of the forest. If this proceeds at timescales that are short compared to the chemical lifetime of BVOCs, then in-canopy oxidation will be of reduced importance compared to oxidation once BVOCs have been transported to higher levels within the boundary layer and free troposphere (Bohn, 2006).
During a field campaign in a peri-urban temperate (oak and pine) forest in France during a summer period in 2022, the reactivity of the NO3 radical towards VOCs was measured within the canopy (height of 5.5 m), above the canopy (height of 40 m), and on one night at several heights between 0 and 24 m. NO3 lifetimes were generally short (1–3 s), which was driven mainly by the abundance of BVOCs. Diel cycles of NO3 at 5.5 and 40 m were distinct, with the highest reactivity at 40 m occurring during the day and the highest reactivity at 5.5 m measured at nighttime. The highest nighttime reactivities were associated with high temperatures (driving the BVOC emissions) and with strong nighttime temperature inversions (preventing mixing of BVOCs and NO out of the nocturnal surface layer). At 5.5 m, BVOCs represented the dominant loss term for NO3 both during the night (70 %–80 %) and during the day (∼ 50 %), which is partially a result of reduced NO3 (and NO2) photolysis frequencies at sub-canopy heights. NO3 reactivity decreased rapidly with height above the ground, with nocturnal lifetimes (with respect to reaction with VOCs) of >100 s at 40 m and as low as 2.5 s at ground level. This gradient is driven largely by BVOC and NO emissions into a shallow, stratified near-surface layer under canopy height.
The conventional wisdom that OH is a daytime oxidant and NO3 a nighttime oxidant appears not to apply to forested regions with significant BVOC emissions where both NO3 and OH have important roles throughout the diel cycle. Hence, NO3-initiated organic nitrate formation could become significant during the day, whereas OH-initiated nocturnal chemistry would be enhanced in such environments.
All data from the ACROSS campaign including NOx (Dewald and Crowley, 2023a, https://doi.org/10.25326/545; Dusanter and Jamar, 2023b, https://across.aeris-data.fr/catalogue/?uuid=5323c4a1-ec56-4cf2-a715-fd393e6cfba6; Xue et al., 2023, https://doi.org/10.25326/512), O3 (Crowley, 2023, https://across.aeris-data.fr/catalogue/?uuid=a42b1966-a01c-4d06-9912-8922ff41f9a4), NO3 reactivity (Dewald and Crowley, 2023b, https://doi.org/10.25326/546), meteorological quantities (Denjean, 2023, https://doi.org/10.25326/437; Dusanter and Jamar, 2023a, https://across.aeris-data.fr/catalogue/?uuid=c9ed7224-f678-4b98-a126-11b1f3ace0f7), peroxy radicals (Kukui, 2023b, https://doi.org/10.25326/509), and OH (Kukui, 2023a, https://doi.org/10.25326/510) can be found at https://across.aeris-data.fr/catalogue/ (last access: 6 August 2024).
The supplement related to this article is available online at: https://doi.org/10.5194/acp-24-8983-2024-supplement.
PD analysed the data and wrote the original draft of the manuscript and, together with JNC, revised it. CC and VM were responsible for the campaign organization with contributions from individual group leads. All authors provided measurements and commented on the paper.
At least one of the (co-)authors is a member of the editorial board of Atmospheric Chemistry and Physics. The peer-review process was guided by an independent editor, and the authors also have no other competing interests to declare.
Publisher's note: Copernicus Publications remains neutral with regard to jurisdictional claims made in the text, published maps, institutional affiliations, or any other geographical representation in this paper. While Copernicus Publications makes every effort to include appropriate place names, the final responsibility lies with the authors.
This article is part of the special issue “Atmospheric Chemistry of the Suburban Forest – multiplatform observational campaign of the chemistry and physics of mixed urban and biogenic emissions”. It is not associated with a conference.
John N. Crowley acknowledges Chemours for the provision of an FEPD 121 sample used to coat the flow tube and the Deutsche Forschungsgemeinschaft (project MONOTONS, project no. 522970430). Simone T. Andersen thanks the Alexander von Humboldt Foundation for funding her stay at the MPIC. The ACROSS project has received funding from the French National Research Agency (ANR) under the investment programme integrated into France 2030, with reference no. ANR-17-MPGA-0002, supported by the French National program Les Enveloppes Fluides et l'Environnement (LEFE) of the Centre National de la Recherche Scientifique/Institut National des Sciences de l'Univers (CNRS/INSU). IMT Nord Europe acknowledges financial support from the CaPPA project, which is funded by the French National Research Agency (ANR) through the Programme d'Investissement d'Avenir (PIA) under contract ANR-11-LABX-0005-01, the Regional Council of Hauts-de-France, and the European Regional Development Fund (ERDF). Data from the ACROSS campaign are hosted by the French national centre for atmospheric data and services, AERIS. Alexandre Kukui acknowledges financial support from the VOLTAIRE project (ANR-10-LABX-100-01) funded by ANR through the Programme d'Investissement d'Avenir (PIA). The scientific colour map Berlin (Crameri, 2023) is used in this study to prevent visual distortion of the data and exclusion of readers with colour vision deficiencies (Crameri et al., 2020).
This research has been supported by the Deutsche Forschungsgemeinschaft (grant no. 522970430), the Agence Nationale de la Recherche (grant nos. ANR-17-MPGA-0002, ANR-11-LABX-0005-01, and ANR-10-LABX-100-01), and the Alexander von Humboldt-Stiftung (postdoc fellowship).
The article processing charges for this open-access publication were covered by the Max Planck Society.
This paper was edited by Eleanor Browne and reviewed by Zachary Decker and one anonymous referee.
Andersen, S. T., McGillen, M. R., Xue, C., Seubert, T., Dewald, P., Türk, G. N. T. E., Schuladen, J., Denjean, C., Etienne, J.-C., Garrouste, O., Jamar, M., Harb, S., Cirtog, M., Michoud, V., Cazaunau, M., Bergé, A., Cantrell, C., Dusanter, S., Picquet-Varrault, B., Kukui, A., Mellouki, A., Carpenter, L. J., Lelieveld, J., and Crowley, J. N.: Measurement report: Sources, sinks and lifetime of NOx in a sub-urban temperate forest at night, EGUsphere [preprint], https://doi.org/10.5194/egusphere-2023-2848, 2024.
Ayres, B. R., Allen, H. M., Draper, D. C., Brown, S. S., Wild, R. J., Jimenez, J. L., Day, D. A., Campuzano-Jost, P., Hu, W., de Gouw, J., Koss, A., Cohen, R. C., Duffey, K. C., Romer, P., Baumann, K., Edgerton, E., Takahama, S., Thornton, J. A., Lee, B. H., Lopez-Hilfiker, F. D., Mohr, C., Wennberg, P. O., Nguyen, T. B., Teng, A., Goldstein, A. H., Olson, K., and Fry, J. L.: Organic nitrate aerosol formation via NO3 + biogenic volatile organic compounds in the southeastern United States, Atmos. Chem. Phys., 15, 13377–13392, https://doi.org/10.5194/acp-15-13377-2015, 2015.
Barger, N. N., Belnap, J., Ojima, D. S., and Mosier, A.: NO gas loss from biologically crusted soils in Canyonlands National Park, Utah, Biogeochemistry, 75, 373–391, https://doi.org/10.1007/s10533-005-1378-9, 2005.
Bates, K. H., Burke, G. J. P., Cope, J. D., and Nguyen, T. B.: Secondary organic aerosol and organic nitrogen yields from the nitrate radical (NO3) oxidation of alpha-pinene from various RO2 fates, Atmos. Chem. Phys., 22, 1467–1482, https://doi.org/10.5194/acp-22-1467-2022, 2022.
Bertram, T. H. and Thornton, J. A.: Toward a general parameterization of N2O5 reactivity on aqueous particles: the competing effects of particle liquid water, nitrate and chloride, Atmos. Chem. Phys., 9, 8351–8363, https://doi.org/10.5194/acp-9-8351-2009, 2009.
Bohn, B.: Solar spectral actinic flux and photolysis frequency measurements in a deciduous forest, J. Geophys. Res.-Atmos., 111, D15303, https://doi.org/10.1029/2005JD006902, 2006.
Brown, S. S. and Stutz, J.: Nighttime radical observations and chemistry, Chem. Soc. Rev., 41, 6405–6447, https://doi.org/10.1039/C2CS35181A, 2012.
Brown, S. S., Stark, H., Ryerson, T. B., Williams, E. J., Nicks, D. K., Trainer, M., Fehsenfeld, F. C., and Ravishankara, A. R.: Nitrogen oxides in the nocturnal boundary layer: Simultaneous in situ measurements of NO3, N2O5, NO2, NO, and O3, J. Geophys. Res.-Atmos., 108, 4299, https://doi.org/10.1029/2002JD002917, 2003.
Brown, S. S., Dube, W. P., Osthoff, H. D., Stutz, J., Ryerson, T. B., Wollny, A. G., Brock, C. A., Warneke, C., De Gouw, J. A., Atlas, E., Neuman, J. A., Holloway, J. S., Lerner, B. M., Williams, E. J., Kuster, W. C., Goldan, P. D., Angevine, W. M., Trainer, M., Fehsenfeld, F. C., and Ravishankara, A. R.: Vertical profiles in NO3 and N2O5 measured from an aircraft: Results from the NOAA P-3 and surface platforms during the New England Air Quality Study 2004, J. Geophys. Res.-Atmos., 112, D22304, https://doi.org/10.1029/2007jd008893, 2007a.
Brown, S. S., Dubé, W. P., Osthoff, H. D., Wolfe, D. E., Angevine, W. M., and Ravishankara, A. R.: High resolution vertical distributions of NO3 and N2O5 through the nocturnal boundary layer, Atmos. Chem. Phys., 7, 139–149, https://doi.org/10.5194/acp-7-139-2007, 2007b.
Burkholder, J. B., Sander, S. P., Abbatt, J., Barker, J. R, Huie, R. E., Kolb, C. E., Kurylo, M. J., Orkin, V. L., Wilmouth, D. M., and Wine, P. H.: Chemical Kinetics and Photochemical Data for Use in Atmospheric Studies, Evaluation No. 18, JPL Publication 15-10, Jet Propulsion Laboratory, Pasadena, https://jpldataeval.jpl.nasa.gov (last access: 23 July 2023), 2016.
Cantrell, C. and Michoud, V.: An Experiment to Study Atmospheric Oxidation Chemistry and Physics of Mixed Anthropogenic–Biogenic Air Masses in the Greater Paris Area, B. Am. Meteorol. Soc., 103, 599–603, https://doi.org/10.1175/BAMS-D-21-0115.1, 2022.
Crameri, F.: Scientific colour maps (8.0.1), Zenodo [data set], https://doi.org/10.5281/zenodo.8409685, 2023.
Crameri, F., Shephard, G. E., and Heron, P. J.: The misuse of colour in science communication, Nat. Commun., 11, 5444, https://doi.org/10.1038/s41467-020-19160-7, 2020.
Crowley, J.: ACROSS_MPIC_RambForest_O3_10min_L, Aeris [data set], https://across.aeris-data.fr/catalogue/?uuid=a42b1966-a01c-4d06-9912-8922ff41f9a4 (last access: 6 August 2024), 2023.
Crowley, J. N., Schuster, G., Pouvesle, N., Parchatka, U., Fischer, H., Bonn, B., Bingemer, H., and Lelieveld, J.: Nocturnal nitrogen oxides at a rural mountain-site in south-western Germany, Atmos. Chem. Phys., 10, 2795–2812, https://doi.org/10.5194/acp-10-2795-2010, 2010.
Crowley, J. N., Thieser, J., Tang, M. J., Schuster, G., Bozem, H., Beygi, Z. H., Fischer, H., Diesch, J.-M., Drewnick, F., Borrmann, S., Song, W., Yassaa, N., Williams, J., Pöhler, D., Platt, U., and Lelieveld, J.: Variable lifetimes and loss mechanisms for NO3 and N2O5 during the DOMINO campaign: contrasts between marine, urban and continental air, Atmos. Chem. Phys., 11, 10853–10870, https://doi.org/10.5194/acp-11-10853-2011, 2011.
Crutzen, P. J. and Lelieveld, J.: Human impacts on atmospheric chemistry, Annu. Rev. Earth Pl. Sc., 29, 17–45, https://doi.org/10.1146/annurev.earth.29.1.17, 2001.
Day, D. A., Fry, J. L., Kang, H. G., Krechmer, J. E., Ayres, B. R., Keehan, N. I., Thompson, S. L., Hu, W. W., Campuzano-Jost, P., Schroder, J. C., Stark, H., DeVault, M. P., Ziemann, P. J., Zarzana, K. J., Wild, R. J., Dube, W. P., Brown, S. S., and Jimenez, J. L.: Secondary Organic Aerosol Mass Yields from NO3 Oxidation of alpha-Pinene and Delta-Carene: Effect of RO2 Radical Fate, J. Phys. Chem. A, 126, 7309–7330, https://doi.org/10.1021/acs.jpca.2c04419, 2022.
Decker, Z. C. J., Robinson, M. A., Barsanti, K. C., Bourgeois, I., Coggon, M. M., DiGangi, J. P., Diskin, G. S., Flocke, F. M., Franchin, A., Fredrickson, C. D., Gkatzelis, G. I., Hall, S. R., Halliday, H., Holmes, C. D., Huey, L. G., Lee, Y. R., Lindaas, J., Middlebrook, A. M., Montzka, D. D., Moore, R., Neuman, J. A., Nowak, J. B., Palm, B. B., Peischl, J., Piel, F., Rickly, P. S., Rollins, A. W., Ryerson, T. B., Schwantes, R. H., Sekimoto, K., Thornhill, L., Thornton, J. A., Tyndall, G. S., Ullmann, K., Van Rooy, P., Veres, P. R., Warneke, C., Washenfelder, R. A., Weinheimer, A. J., Wiggins, E., Winstead, E., Wisthaler, A., Womack, C., and Brown, S. S.: Nighttime and daytime dark oxidation chemistry in wildfire plumes: an observation and model analysis of FIREX-AQ aircraft data, Atmos. Chem. Phys., 21, 16293–16317, https://doi.org/10.5194/acp-21-16293-2021, 2021.
Denjean, C.: ACROSS_CNRM_RambForest_MTO-1MIN_L2, Aeris [data set], https://doi.org/10.25326/437, 2023.
DeVault, M. P., Ziola, A. C., and Ziemann, P. J.: Products and Mechanisms of Secondary Organic Aerosol Formation from the NO3 Radical-Initiated Oxidation of Cyclic and Acyclic Monoterpenes, ACS Earth Space Chem., 6, 2076–2092, https://doi.org/10.1021/acsearthspacechem.2c00130, 2022.
Dewald, P. and Crowley, J. N.: ACROSS_MPIC_RambForest_KNO3_1min_L2, Aeris [data set], https://doi.org/10.25326/545, 2023a.
Dewald, P. and Crowley, J. N.: ACROSS_MPIC_RambForest_NO2(fromkNO3)_1min_L2, Aeris [data set], https://doi.org/10.25326/546, 2023b.
Dewald, P., Nussbaumer, C. M., Schuladen, J., Ringsdorf, A., Edtbauer, A., Fischer, H., Williams, J., Lelieveld, J., and Crowley, J. N.: Fate of the nitrate radical at the summit of a semi-rural mountain site in Germany assessed with direct reactivity measurements, Atmos. Chem. Phys., 22, 7051–7069, https://doi.org/10.5194/acp-22-7051-2022, 2022.
Dusanter, S. and Jamar, M.: ACROSS_IMTNE_RambForest_Jvalues_AboveCanopy_L2, Aeris [data set], https://across.aeris- data.fr/catalogue/?uuid=c9ed7224-f678-4b98-a126-11b1f3ace0f7 (last access: 6 August 2024), 2023a.
Dusanter, S. and Jamar, M.: ACROSS_IMTNE_RambForest_Nox_AboveCanopy_L2, Aeris [data set], https://across.aeris-data.fr/catalogue/?uuid=5323c4a1-ec56-4cf2-a715-fd393e6cfba6 (last access: 6 Auguat 2024), 2023b.
Finlayson-Pitts, B. J. and Pitts, J. N. (Eds.): Chapter 7 – Chemistry of Inorganic Nitrogen Compounds: Chemistry of the Upper and Lower Atmosphere, Academic Press, San Diego, 264–293, ISSN: 0-12-257060-x, 2000.
Fish, D. J., Shallcross, D. E., and Jones, R. L.: The vertical distribution of NO3 in the atmospheric boundary layer, Atmos. Environ., 33, 687–691, https://doi.org/10.1016/S1352-2310(98)00332-X, 1999.
Forkel, R., Klemm, O., Graus, M., Rappenglück, B., Stockwell, W. R., Grabmer, W., Held, A., Hansel, A., and Steinbrecher, R.: Trace gas exchange and gas phase chemistry in a Norway spruce forest:: A study with a coupled 1-dimensional canopy atmospheric chemistry emission model, Atmos. Environ., 40, S28–S42, https://doi.org/10.1016/j.atmosenv.2005.11.070, 2006.
Fry, J. L., Draper, D. C., Barsanti, K. C., Smith, J. N., Ortega, J., Winkle, P. M., Lawler, M. J., Brown, S. S., Edwards, P. M., Cohen, R. C., and Lee, L.: Secondary Organic Aerosol Formation and Organic Nitrate Yield from NO3 Oxidation of Biogenic Hydrocarbons, Environ. Sci. Technol., 48, 11944–11953, https://doi.org/10.1021/es502204x, 2014.
Fuentes, J. D., Wang, D., Bowling, D. R., Potosnak, M., Monson, R. K., Goliff, W. S., and Stockwell, W. R.: Biogenic hydrocarbon chemistry within and above a mixed deciduous forest, J. Atmos. Chem., 56, 165–185, https://doi.org/10.1175/1520-0477(2000)081<1537:BHITAB>2.3.CO;2, 2007.
Geyer, A., Alicke, B., Konrad, S., Schmitz, T., Stutz, J., and Platt, U.: Chemistry and oxidation capacity of the nitrate radical in the continental boundary layer near Berlin, J. Geophys. Res.-Atmos., 106, 8013–8025, https://doi.org/10.1029/2000jd900681, 2001.
Guenther, A. B., Zimmerman, P. R., Harley, P. C., Monson, R. K., and Fall, R.: Isoprene and Monoterpene Emission Rate Variability – Model Evaluations and Sensitivity Analyses, J. Geophys. Res.-Atmos., 98, 12609–12617, https://doi.org/10.1029/93jd00527, 1993.
Guenther, A. B., Jiang, X., Heald, C. L., Sakulyanontvittaya, T., Duhl, T., Emmons, L. K., and Wang, X.: The Model of Emissions of Gases and Aerosols from Nature version 2.1 (MEGAN2.1): an extended and updated framework for modeling biogenic emissions, Geosci. Model Dev., 5, 1471–1492, https://doi.org/10.5194/gmd-5-1471-2012, 2012.
Hakola, H., Tarvainen, V., Bäck, J., Ranta, H., Bonn, B., Rinne, J., and Kulmala, M.: Seasonal variation of mono- and sesquiterpene emission rates of Scots pine, Biogeosciences, 3, 93–101, https://doi.org/10.5194/bg-3-93-2006, 2006.
Hakola, H., Hellén, H., Tarvainen, V., Bäck, J., Patokoski, J., and Rinne, J.: Annual variations of atmospheric VOC concentrations in a boreal forest, Boreal Environ. Res., 14, 722–730, 2009.
Hakola, H., Hellén, H., Hemmilä, M., Rinne, J., and Kulmala, M.: In situ measurements of volatile organic compounds in a boreal forest, Atmos. Chem. Phys., 12, 11665–11678, https://doi.org/10.5194/acp-12-11665-2012, 2012.
Hallquist, M., Wangberg, I., Ljungstrom, E., Barnes, I., and Becker, K. H.: Aerosol and product yields from NO3 radical-initiated oxidation of selected monoterpenes, Environ. Sci. Technol., 33, 553–559, https://doi.org/10.1021/es980292s, 1999.
Heintz, F., Platt, U., Flentje, H., and Dubois, R.: Long-term observation of nitrate radicals at the tor station, Kap Arkona (Rügen), J. Geophys. Res.-Atmos., 101, 22891–22910, https://doi.org/10.1029/96JD01549, 1996.
IUPAC: Task Group on Atmospheric Chemical Kinetic Data Evaluation, edited by: Ammann, M., Cox, R. A., Crowley, J. N., Herrmann, H., Jenkin, M. E., McNeill, V. F., Mellouki, A., Rossi, M. J., Troe, J., and Wallington, T. J., https://iupac.aeris-data.fr/en/home-english/, last access: 29 January 2024.
Kalogridis, C., Gros, V., Sarda-Esteve, R., Langford, B., Loubet, B., Bonsang, B., Bonnaire, N., Nemitz, E., Genard, A.-C., Boissard, C., Fernandez, C., Ormeño, E., Baisnée, D., Reiter, I., and Lathière, J.: Concentrations and fluxes of isoprene and oxygenated VOCs at a French Mediterranean oak forest, Atmos. Chem. Phys., 14, 10085–10102, https://doi.org/10.5194/acp-14-10085-2014, 2014.
Kesselmeier, J. and Staudt, M.: Biogenic volatile organic compounds (VOC): An overview on emission, physiology and ecology, J. Atmos. Chem., 33, 23–88, https://doi.org/10.1023/a:1006127516791, 1999.
Kukui, A.: ACROSS_LPC2E_Rambforest_OH_L2, Aeris [data set], https://doi.org/10.25326/510, 2023a.
Kukui, A.: ACROSS_LPC2E_Rambforest_RO2_L2, Aeris [data set], https://doi.org/10.25326/509, 2023b.
Kukui, A., Ancellet, G., and Le Bras, G.: Chemical ionisation mass spectrometer for measurements of OH and Peroxy radical concentrations in moderately polluted atmospheres, J. Atmos. Chem., 61, 133–154, https://doi.org/10.1007/s10874-009-9130-9, 2008.
Lelieveld, J., Butler, T. M., Crowley, J. N., Dillon, T. J., Fischer, H., Ganzeveld, L., Harder, H., Lawrence, M. G., Martinez, M., Taraborrelli, D., and Williams, J.: Atmospheric oxidation capacity sustained by a tropical forest, Nature, 452, 737–740, https://doi.org/10.1038/nature06870, 2008.
Liebmann, J., Karu, E., Sobanski, N., Schuladen, J., Ehn, M., Schallhart, S., Quéléver, L., Hellen, H., Hakola, H., Hoffmann, T., Williams, J., Fischer, H., Lelieveld, J., and Crowley, J. N.: Direct measurement of NO3 radical reactivity in a boreal forest, Atmos. Chem. Phys., 18, 3799–3815, https://doi.org/10.5194/acp-18-3799-2018, 2018.
Liebmann, J., Sobanski, N., Schuladen, J., Karu, E., Hellén, H., Hakola, H., Zha, Q., Ehn, M., Riva, M., Heikkinen, L., Williams, J., Fischer, H., Lelieveld, J., and Crowley, J. N.: Alkyl nitrates in the boreal forest: formation via the NO3-, OH- and O3-induced oxidation of biogenic volatile organic compounds and ambient lifetimes, Atmos. Chem. Phys., 19, 10391–10403, https://doi.org/10.5194/acp-19-10391-2019, 2019.
Liebmann, J. M., Schuster, G., Schuladen, J. B., Sobanski, N., Lelieveld, J., and Crowley, J. N.: Measurement of ambient NO3 reactivity: design, characterization and first deployment of a new instrument, Atmos. Meas. Tech., 10, 1241–1258, https://doi.org/10.5194/amt-10-1241-2017, 2017.
Liebmann, J. M., Muller, J. B. A., Kubistin, D., Claude, A., Holla, R., Plass-Dülmer, C., Lelieveld, J., and Crowley, J. N.: Direct measurements of NO3 reactivity in and above the boundary layer of a mountaintop site: identification of reactive trace gases and comparison with OH reactivity, Atmos. Chem. Phys., 18, 12045–12059, https://doi.org/10.5194/acp-18-12045-2018, 2018.
Ludwig, J., Meixner, F. X., Vogel, B., and Förstner, J.: Soil-air exchange of nitric oxide: An overview of processes, environmental factors and modeling studies, Biogeochemistry, 52, 225–257, 2001.
Marchant, A., Le Coupanec, A., Joly, C., Perthame, E., Sertour, N., Garnier, M., Godard, V., Ferquel, E., and Choumet, V.: Infection of Ixodes ricinus by Borrelia sensu lato in peri-urban forests of France, PloS One, 12, e0183543, https://doi.org/10.1371/journal.pone.0183543, 2017.
Martinez, M., Perner, D., Hackenthal, E. M., Kulzer, S., and Schutz, L.: NO3 at Helgoland during the NORDEX campaign in October 1996, J. Geophys. Res.-Atmos., 105, 22685–22695, https://doi.org/10.1029/2000JD900255, 2000.
McLaren, R., Salmon, R. A., Liggio, J., Hayden, K. L., Anlauf, K. G., and Leaitch, W. R.: Nighttime chemistry at a rural site in the Lower Fraser Valley, Atmos. Environ., 38, 5837–5848, https://doi.org/10.1016/j.atmosenv.2004.03.074, 2004.
McLaren, R., Wojtal, P., Majonis, D., McCourt, J., Halla, J. D., and Brook, J.: NO3 radical measurements in a polluted marine environment: links to ozone formation, Atmos. Chem. Phys., 10, 4187–4206, https://doi.org/10.5194/acp-10-4187-2010, 2010.
Mermet, K., Perraudin, E., Dusanter, S., Sauvage, S., Léonardis, T., Flaud, P.-M., Bsaibes, S., Kammer, J., Michoud, V., Gratien, A., Cirtog, M., Al Ajami, M., Truong, F., Batut, S., Hecquet, C., Doussin, J.-F., Schoemaecker, C., Gros, V., Locoge, N., and Villenave, E.: Atmospheric reactivity of biogenic volatile organic compounds in a maritime pine forest during the LANDEX episode 1 field campaign, Sci. Total Environ., 756, 144129, https://doi.org/10.1016/j.scitotenv.2020.144129, 2021.
Mogensen, D., Gierens, R., Crowley, J. N., Keronen, P., Smolander, S., Sogachev, A., Nölscher, A. C., Zhou, L., Kulmala, M., Tang, M. J., Williams, J., and Boy, M.: Simulations of atmospheric OH, O3 and NO3 reactivities within and above the boreal forest, Atmos. Chem. Phys., 15, 3909–3932, https://doi.org/10.5194/acp-15-3909-2015, 2015.
Ng, N. L., Brown, S. S., Archibald, A. T., Atlas, E., Cohen, R. C., Crowley, J. N., Day, D. A., Donahue, N. M., Fry, J. L., Fuchs, H., Griffin, R. J., Guzman, M. I., Herrmann, H., Hodzic, A., Iinuma, Y., Jimenez, J. L., Kiendler-Scharr, A., Lee, B. H., Luecken, D. J., Mao, J., McLaren, R., Mutzel, A., Osthoff, H. D., Ouyang, B., Picquet-Varrault, B., Platt, U., Pye, H. O. T., Rudich, Y., Schwantes, R. H., Shiraiwa, M., Stutz, J., Thornton, J. A., Tilgner, A., Williams, B. J., and Zaveri, R. A.: Nitrate radicals and biogenic volatile organic compounds: oxidation, mechanisms, and organic aerosol, Atmos. Chem. Phys., 17, 2103–2162, https://doi.org/10.5194/acp-17-2103-2017, 2017.
Peräkylä, O., Vogt, M., Tikkanen, O. P., Laurila, T., Kajos, M. K., Rantala, P. A., Patokoski, J., Aalto, J., Yli-Juuti, T., Ehn, M., Sipila, M., Paasonen, P., Rissanen, M., Nieminen, T., Taipale, R., Keronen, P., Lappalainen, H. K., Ruuskanen, T. M., Rinne, J., Kerminen, V. M., Kulmala, M., Back, J., and Petaja, T.: Monoterpenes' oxidation capacity and rate over a boreal forest: temporal variation and connection to growth of newly formed particles, Boreal Environ. Res., 19, 293–310, 2014.
Pfannerstill, E. Y., Reijrink, N. G., Edtbauer, A., Ringsdorf, A., Zannoni, N., Araújo, A., Ditas, F., Holanda, B. A., Sá, M. O., Tsokankunku, A., Walter, D., Wolff, S., Lavrič, J. V., Pöhlker, C., Sörgel, M., and Williams, J.: Total OH reactivity over the Amazon rainforest: variability with temperature, wind, rain, altitude, time of day, season, and an overall budget closure, Atmos. Chem. Phys., 21, 6231–6256, https://doi.org/10.5194/acp-21-6231-2021, 2021.
Phillips, G. J., Thieser, J., Tang, M., Sobanski, N., Schuster, G., Fachinger, J., Drewnick, F., Borrmann, S., Bingemer, H., Lelieveld, J., and Crowley, J. N.: Estimating N2O5 uptake coefficients using ambient measurements of NO3, N2O5, ClNO2 and particle-phase nitrate, Atmos. Chem. Phys., 16, 13231–13249, https://doi.org/10.5194/acp-16-13231-2016, 2016.
Pilegaard, K.: Processes regulating nitric oxide emissions from soils, Philos. T. Roy. Soc. B, 368, 20130126, https://doi.org/10.1098/rstb.2013.0126, 2013.
Platt, U. and Heintz, F.: Nitrate radicals in tropospheric chemistry, Isr. J. Chem., 34, 289–300, https://doi.org/10.1002/ijch.199400033, 1994.
Pusede, S. E., Steiner, A. L., and Cohen, R. C.: Temperature and Recent Trends in the Chemistry of Continental Surface Ozone, Chem. Rev., 115, 3898–3918, https://doi.org/10.1021/cr5006815, 2015.
Romer Present, P. S., Zare, A., and Cohen, R. C.: The changing role of organic nitrates in the removal and transport of NOx, Atmos. Chem. Phys., 20, 267–279, https://doi.org/10.5194/acp-20-267-2020, 2020.
Saathoff, H., Naumann, K. H., Riemer, N., Kamm, S., Mohler, O., Schurath, U., Vogel, H., and Vogel, B.: The loss of NO2, HNO3, , and on soot aerosol: A chamber and modeling study, Geophys. Res. Lett., 28, 1957–1960, https://doi.org/10.1029/2000GL012619, 2001.
Schulze, B. C., Wallace, H. W., Flynn, J. H., Lefer, B. L., Erickson, M. H., Jobson, B. T., Dusanter, S., Griffith, S. M., Hansen, R. F., Stevens, P. S., VanReken, T., and Griffin, R. J.: Differences in BVOC oxidation and SOA formation above and below the forest canopy, Atmos. Chem. Phys., 17, 1805–1828, https://doi.org/10.5194/acp-17-1805-2017, 2017.
Smith, J. P., Solomon, S., Sanders, R. W., Miller, H. L., Perliski, L. M., Keys, J. G., and Schmeltekopf, A. L.: Atmospheric NO3: 4. Vertical Profiles at Middle and Polar Latitudes at Sunrise, J. Geophys. Res.-Atmos., 98, 8983–8989, https://doi.org/10.1029/93JD00041, 1993.
Stull, R. B. (Ed.): Stable Boundary Layer: An Introduction to Boundary Layer Meteorology, Springer Netherlands, Dordrecht, 499–543, 1988.
Stutz, J., Alicke, B., Ackermann, R., Geyer, A., White, A., and Williams, E.: Vertical profiles of NO3, N2O5, O3, and NOx in the nocturnal boundary layer: 1. Observations during the Texas Air Quality Study 2000, J. Geophys. Res.-Atmos., 109, D12306, https://doi.org/10.1029/2003JD004209, 2004.
Vermeuel, M. P., Novak, G. A., Kilgour, D. B., Claflin, M. S., Lerner, B. M., Trowbridge, A. M., Thom, J., Cleary, P. A., Desai, A. R., and Bertram, T. H.: Observations of biogenic volatile organic compounds over a mixed temperate forest during the summer to autumn transition, Atmos. Chem. Phys., 23, 4123–4148, https://doi.org/10.5194/acp-23-4123-2023, 2023.
von Friedeburg, C., Wagner, T., Geyer, A., Kaiser, N., Vogel, B., Vogel, H., and Platt, U.: Derivation of tropospheric NO3 profiles using off-axis differential optical absorption spectroscopy measurements during sunrise and comparison with simulations, J. Geophys. Res.-Atmos., 107, 4168, https://doi.org/10.1029/2001JD000481, 2002.
Wayne, R. P., Barnes, I., Biggs, P., Burrows, J. P., Canosa-Mas, C. E., Hjorth, J., Le Bras, G., Moortgat, G. K., Perner, D., Poulet, G., Restelli, G., and Sidebottom, H.: The nitrate radical: Physics, chemistry, and the atmosphere, Atmos. Environ. A-Gen., 25, 1–206, https://doi.org/10.1016/0960-1686(91)90192-A, 1991.
Xue, C., McGillen, M. R., and Mellouki, A.: ACROSS_ICARE_RambForest_NO_L2, Aeris [data set], https://doi.org/10.25326/512, 2023
Yan, Y. H., Wang, S. S., Zhu, J., Guo, Y. L., Tang, G. Q., Liu, B. X., An, X. X., Wang, Y. S., and Zhou, B.: Vertically increased NO3 radical in the nocturnal boundary layer, Sci. Total Environ., 763, 142969, https://doi.org/10.1016/j.scitotenv.2020.142969, 2021.