the Creative Commons Attribution 4.0 License.
the Creative Commons Attribution 4.0 License.
 | 16 Aug 2024
Impacts of atmospheric circulation patterns and cloud inhibition on aerosol radiative effect and boundary layer structure during winter air pollution in Sichuan Basin, China
Hua Lu
Bingliang Zhuang
Danyang Ma
Bojun Liu
Yangzhihao Zhan
Tijian Wang
Shu Li
Mengmeng Li
Kuanguang Zhu
Persistent winter aerosol pollution frequently occurs in the Sichuan Basin (SCB) due to its unfavourable weather conditions, such as low wind, wetness, and cloudiness. Based on long-term observational data analyses from 2015–2021, it has been found that the four representative stations in the SCB often simultaneously experience PM2.5 pollution accompanied by variations in meteorological conditions above 850 hPa, which indicates a connection between regional winter air pollution in the SCB and large-scale synoptic patterns. The dominant 850 hPa synoptic patterns of winter in the SCB were classified into six patterns using T-model principal component analysis: (1) strong high pressure in the north, (2) east high–west low (EHWL) pressure, (3) weak high pressure in the north, (4) a weak ridge of high pressure after the trough, (5) a low trough (LT), and (6) strong high pressure. Pattern 2 characterized by the EHWL pressure system, and Pattern 5, featured with LT, was identified as having key synoptic patterns for the beginning and accumulation of pollution processes. Pattern 1, characterized by a strong high pressure in the north, was the cleanest pattern associated with reduced PM2.5 concentrations. The EHWL and LT patterns were associated with a remarkably high cloud liquid content attributed to upper southerly winds introducing humid air. Clouds reduce solar radiation through reflection and scattering, resulting in more stable stratification and aerosol accumulation. This cloud radiation interaction (CRI) was more pronounced in the LT pattern due to denser isobaric lines and stronger southerly winds than in the EHWL pattern. Numerical simulation experiments utilizing WRF-Chem indicated that there is an upper-level heating during afternoon and surface cooling in the morning forced by the aerosol radiation interaction (ARI) under the EHWL and LT patterns. Additionally, strong surface cooling in the evening influenced by valley winds could be found. With wet and cloudy synoptic forcing, ARI directly affects the stability of the boundary layer and is modulated through CRI inhibition. For example, Chongqing exhibited lower PM2.5 concentrations and stronger ARI compared to the western and southern SCB due to lower cloud liquid content and weaker CRI inhibition on the ARI. The CRI inhibition caused a 50 % reduction in solar radiation and boundary layer height during the daytime under the LT pattern, which was larger than that under the EHWL pattern. This study comprehensively analysed the spatial disparities in cloud inhibition on the ARIs, their impacts on the boundary layer structure, and the discrepancies of these interactions under different synoptic patterns during pollution processes. The findings have important implications for the effective management of pollution processes in cloudy and foggy weather.
- Article
(12426 KB) - Full-text XML
-
Supplement
(1122 KB) - BibTeX
- EndNote


Particulate matter (PM) pollution has become a significant environmental concern in China (Xie et al., 2016a, b; Che et al., 2019). High concentrations of aerosols not only worsen air quality and pose serious health risks to residents but also have implications for weather and climate through their effects on radiation and clouds (Li et al., 2019; Zhao et al., 2020; Alexeeff et al., 2021; Yang et al., 2021). The interactions between aerosols and clouds present the largest uncertainty in anthropogenic radiative forcing of the Earth's climate (Zhao et al., 2017; Haywood et al., 2021). Studying interactions among cloud, aerosol, and radiation from an air quality perspective is crucial for a scientific understanding of the relationship between weather and pollution (Gao et al., 2023).
Excessive emissions are the essential cause of air pollution, with primary aerosol and secondary aerosol formation playing significant roles in comprehending the complete picture of air pollution (Peng et al., 2021). Besides, meteorological conditions not only influence on the formation of secondary aerosols but also govern the transportation and distribution of both primary and secondary aerosols and thereby impact regional and long-range air pollution (Zhu et al., 2018; Luo et al., 2018; Nichol et al., 2020; Zhang et al., 2020; Jiang et al., 2021). PM and gaseous pollutants, primarily transported by the planetary boundary layer (PBL), are directly or indirectly influenced by various meteorological factors such as wind, relative humidity, PBL height (PBLH), and solar radiation. These factors contribute to the multi-temporal and spatial distribution characteristics through vertical and horizontal diffusion, physicochemical reactions, and dry and wet deposition (Lee et al., 2017; Shu et al., 2017; Zhan et al., 2019; Huang et al., 2020). Large-scale synoptic forcing is considered the primary driving condition for meteorological factors, PBL structure, and the resulting distribution of atmospheric pollutants (Miao et al., 2020; Ning et al., 2019; Jiang et al., 2021; J. Li et al., 2021). Specific synoptic patterns can induce advection, which largely determines the local PBL structure and development. PBL, located at the bottom of the atmosphere, is responsible for the main exchange of heat, moisture, and matter between the surface and the free troposphere (Stull, 1988). The fate of pollutants emitted near the surface, a significant source of aerosols in the air, is largely controlled by the PBL (Garratt, 1994). The PBLH is often used as a metric to characterize the capacity and dilution of pollutants (Seidel et al., 2010). Synoptic patterns can directly determine the meteorological conditions of emitted pollutants and influence their transport by regulating PBL thermal stratification and mechanical turbulence (Stull, 1988; Ning et al., 2018; Zhan et al., 2019; Jiang et al., 2021; Zhang et al., 2022).
Unfavourable meteorological conditions play a significant role in contributing to aerosol pollution. When pollutants accumulate to a certain degree, aerosols can reduce surface solar radiation through backscattering or absorbing solar radiation, leading to surface cooling. This decrease in solar radiation and temperature near the ground weakens turbulent diffusion, suppresses the convective development of the PBL, and lowers PBLH, which in turn exacerbates aerosol pollution (Ding et al., 2016; Wang et al., 2018). Moreover, the increase in humidity caused by the decreased surface saturation vapour pressure and inhibited water vapour diffusion enhances aerosol hygroscopic growth accelerates liquid-phase and heterogeneous reactions and contributes to aerosol pollution (Pilinis et al., 1989). The positive feedback between unfavourable PBL meteorology and increasing aerosols was found to be responsible for the majority of the increase in PM2.5 during cumulative stages in various regions of eastern China affected by aerosol pollution, including the North China Plain, the Guanzhong Plain, the Yangtze River Delta, the Two Lakes Basin, the Pearl River Delta, and the northeastern China Plain. But in the Sichuan Basin (SCB), the feedback is weak due to the suppression of the cloudy mid–upper layer (Zhong et al., 2018, 2019). Moreover, the aerosol–cloud interactions which arise from increasing aerosols, acting as cloud condensation nuclei in-cloud and translating into larger concentrations of smaller cloud droplets, lead to an increased cloud albedo reflecting more radiation back to space (Twomey, 1977; Lohmann and Feichter, 2005). Even a marginal increase in cloud droplets above pristine conditions in deep-convective clouds causes more droplets to reach supercooled levels, which enhances latent heat release and invigorates convection (Rosenfeld et al., 2008; Possner et al., 2015). Further increases in cloud droplets result in direct radiative effects, reducing downward solar radiation, cooling the surface, and inhibiting convection (Archer-Nicholls et al., 2016).
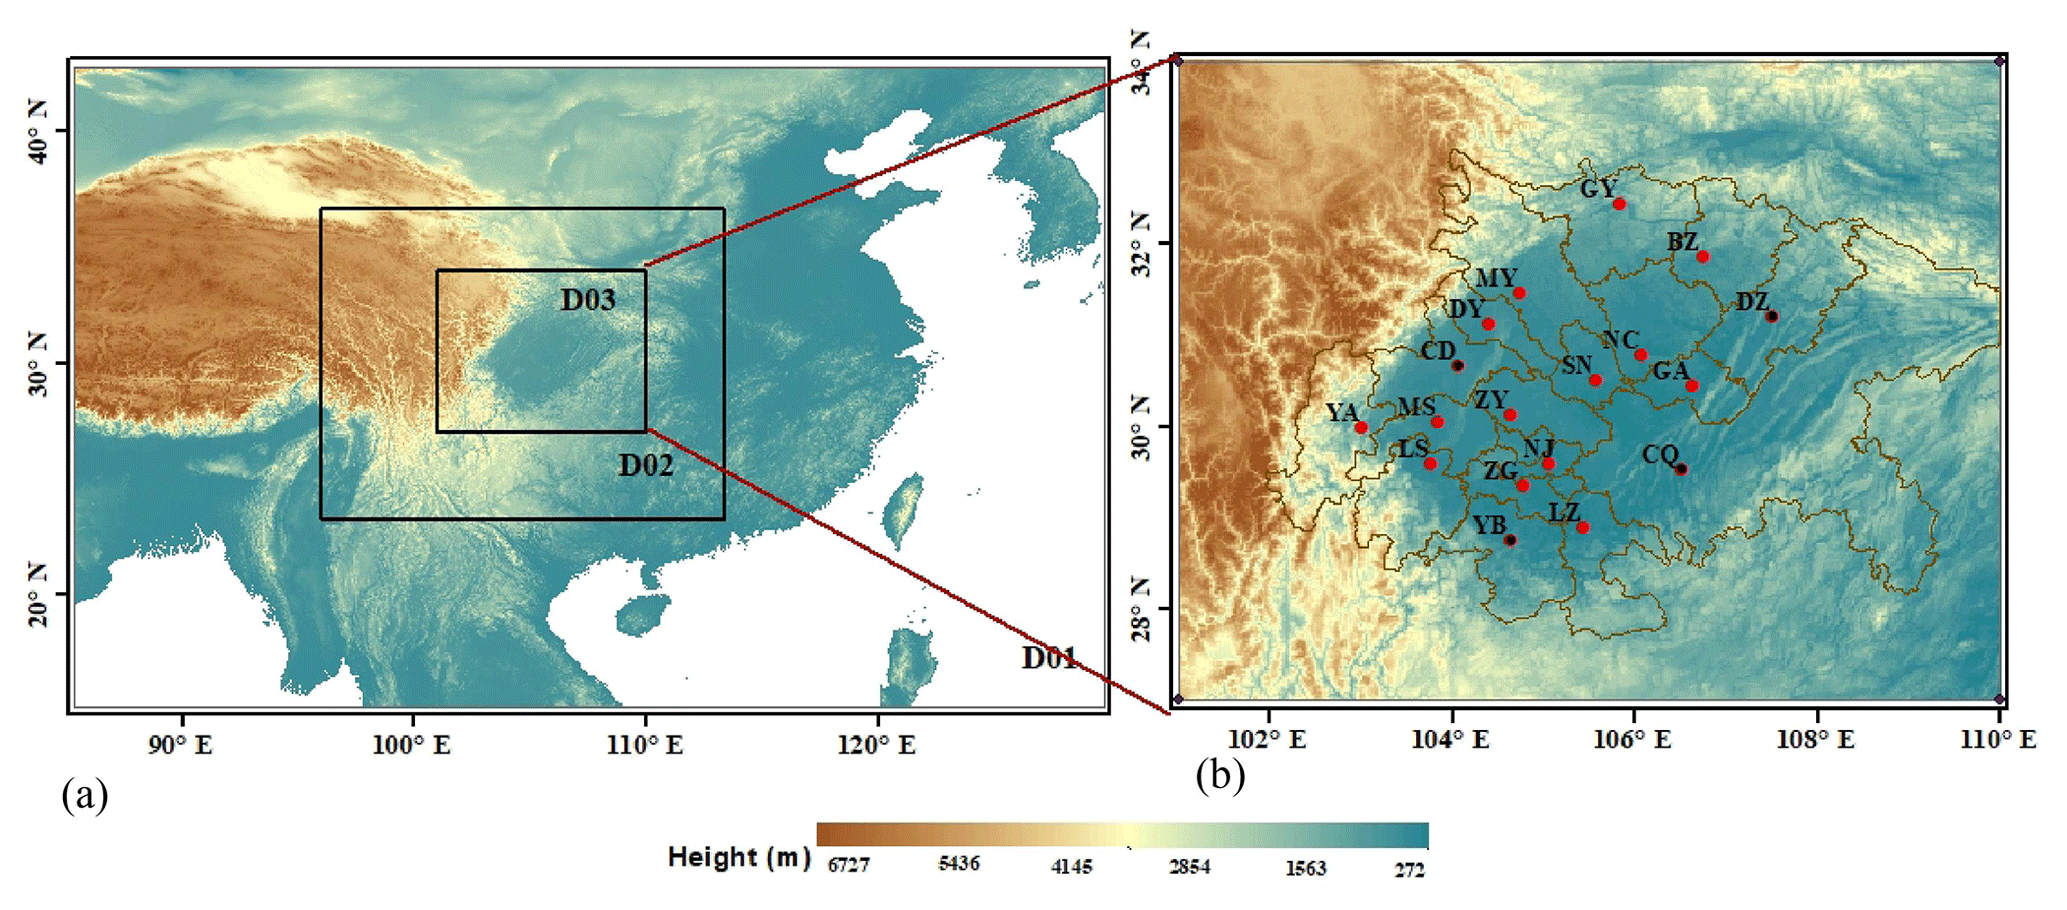
Figure 1(a) Three layers of simulation domains in WRF-Chem with topography map as shading; (b) the locations of 18 air quality monitoring stations (red dots) and 4 sounding stations (black dots) in Domain 3.
The SCB is surrounded by high mountains with cloudy and wet weather conditions. The mean annual relative humidity in the SCB is around 75 %, with cloud fraction exceeding 80 %, and an average of 1200 h of sunshine per year. The Chengdu–Chongqing city cluster in the SCB serves as the economic centre of the upper reaches of the Yangtze River in China, accounting for approximately 10 % of the country's population. However, rapid industrialization and urbanization in this region have resulted in severe air pollution. The SCB is recognized as one of the most polluted regions in China with its high black carbon concentrations (Li et al., 2016; Cao et al., 2021). The Qinghai–Tibet Plateau on the western edge of the SCB significantly influences the transport and accumulation of pollutants through thermal and dynamic effects (Ning et al., 2019; Shu et al., 2021). In addition, the Qinghai–Tibet topography leads to higher cloud water content over the SCB than the other regions (Yu et al., 2004; Yang and Wang, 2012). Many studies have emphasized the importance of the interactions between cloud, aerosols, and radiation in air pollution processes (Wang et al., 2018; Hu et al., 2021). High pollutant emissions, combined with the prevalence of cloudy and foggy weather, make these interactions in the SCB even more complex than those in other regions. The aerosol radiation interactions (ARIs) can be inhibited by clouds in cities like Chengdu (Zhong et al., 2019). However, there is a lack of in-depth quantitative discussion regarding these aspects in the SCB. On the one hand, the complex terrain in the SCB leads to differences in the meteorological conditions between them (Ning et al., 2018; Lu et al., 2022). For example, Chengdu is a typical basin city while Chongqing is a mountain city located on the basin slope, so they have markedly different climate conditions. It remains to be elucidated whether these conditions will result in spatial disparities in cloud inhibition on the ARI. On the other hand, synoptic forcing, as the primary driver of meteorological variations, undoubtedly plays a nonnegligible role in shaping cloud cover and boundary layer structures (Miao et al., 2020; Wang et al., 2022; Painemal et al., 2023). The discrepancies in cloud inhibition on the ARI under different synoptic patterns also need to be revealed. Addressing these issues is crucial for understanding the persistent pollution processes and the intricate interactions between weather and pollution in the SCB. It holds important implications for the effective management of pollution processes in cloudy and foggy weather.
Characterized with high aerosol loadings and semi-permanent cloudy weather, the SCB provides an ideal region for studying the complex interactions between clouds, aerosols, and the PBL. This study objectively classifies the synoptic patterns influencing the SCB based on long-term data. By conducting an integrated analysis of pollutants and meteorological factors, the primary pollution sources and clean synoptic patterns are identified. To further investigate the inhibition of cloud radiation interaction (CRI) on the ARI under different synoptic patterns in the SCB, WRF-Chem (Weather Research and Forecasting model coupled with Chemistry) simulation experiments are conducted. The results contribute to a deeper understanding of CRI, ARI, and the PBL interactions in regions influenced by plateau–basin topography with wet and cloudy weather. The data and method are presented in Sect. 2, whereas Sect. 3 describes the synoptic patterns and their corresponding impacts on clouds, aerosols, radiation, and PBL. Finally, the conclusions are presented in Sect. 4.
2.1 Observational data
Air quality monitoring data used in this study were obtained from air quality monitoring sites established by the Ministry of Ecology and Environment of China across the SCB. Hourly PM2.5 observations from 18 stations in the SCB were collected during the winter period from 2015 to 2021 for data analysis and model verification purposes (Fig. 1b). The abbreviations CQ, CD, MY, DY, LS, MS, YA, ZY, ZG, YB, LZ, NJ, GA, NC, SN, GY, DZ, and BZ represent the following cities: Chongqing, Chengdu, Mianyang, Deyang, Leshan, Meishan, Yaan, Ziyang, Zigong, Yibin, Luzhou, Neijiang, Guang'an, Nanchong, Suining, Guangyuan, Dazhou, and Bazhong, respectively.
The SCB has four sounding stations, Wenjiang (CD), YB, DZ, and Shapingba (CQ), situated in the western, southern, northwestern, and eastern regions of the basin, respectively (Fig. 1b); these stations represent different pollution and meteorological conditions in different regions within the SCB. In all, the air pollution over the SCB exhibits a gradual decrease from southwest to northeast. Statistical analysis indicates that the western and the southern basins experience the most severe pollution. The western basin shows the highest pollution proportion, while the southern basin exhibits the highest occurrence of heavy pollution. In the northeastern basin, specifically in DZ, heavy pollution is more likely to occur during winter, which verifies it to be the third-highest pollution zone outside the western and southern basins. This makes the spatial distribution during winter different from the overall annual pollution pattern in the SCB (Lu et al., 2022; Qi et al., 2022). Regarding meteorological conditions, research reveals that DZ has the lowest ventilation coefficient during winter, while CQ has the highest. The SCB experiences frequent temperature inversions, with CD having a higher occurrence of inversions compared to the other three cities. CD also exhibits the strongest inversion intensity and is prone to multi-layer inversions. On the other hand, YB and CQ have greater inversion thickness, while CD has the smallest inversion thickness (Feng et al., 2020). The vertical distribution of the meteorological factors used in the study was obtained from an L-band sounding radar, collecting temperature, pressure, humidity, and wind data at 00:00 and 12:00 coordinated universal time (UTC; hereafter all times are UTC unless indicated otherwise) on vertical levels every second from the surface up to 30 km. Ground observation data from the four cities, including temperature and dew point temperature, were used for meteorological factor simulation verification. All meteorological data were obtained from the China weather website platform maintained by the China Meteorological Administration. As for the calculation of PBLH, there are various methods to determine the PBLH, and differences in methods, data, or threshold values may yield quite different PBLH results (Seibert et al., 2000; Eresmaa et al., 2006; Jiang et al., 2021). The bulk Richardson number (Ri) method was adopted to calculate the PBLH with sounding data in the study by assuming that the PBLH is the height at which Ri reaches its critical value (Rc). Ri at a certain height h is calculated as follows:
where g is the acceleration in gravity, θv0 and θvh are the virtual potential temperature at the surface and the height h, respectively, and uh and vh are the meridional and zonal wind components at h. We adopted the Ri method and Rc to be 0.25 because European Centre for Medium-Range Weather Forecasts (ECMWF) Reanalysis v5 (ERA5) and the Yonsei University schemes use the same method and threshold value when calculating PBLH (Hong et al., 2006; ECMWF, 2017).
CD, YB, DZ, and CQ were selected as representative cities for analysis in the study. These four representative cities are located in the western, southern, northwestern, and eastern regions of the basin to capture diverse pollution and meteorological conditions within the SCB. These cities were chosen to represent the most polluted regions (Zhao et al., 2018; Lu et al., 2022), as well as typical basin and mountainous cities. Furthermore, there are only four sounding stations in the SCB available, which are located in these four representative cities. They can provide valuable vertical and surface meteorological observations, as well as pollution data, contributing to the comprehensive dataset used in this study.
ERA5 reanalysis data from the European Centre for Medium-Range Weather Forecasts (ECMWF), which assimilates comprehensive observation data, including ground observation, sounding data, aircraft observation data, and satellite observation data, were obtained for synoptic pattern classification and their impact on meteorological factors in four representative cities. The ERA5 data at the 850 hPa pressure level were collected for the synoptic pattern study. Additionally, cloud liquid water content and downward solar radiation derived from the ERA5 single-level datasets were obtained to assess the influences of synoptic forcing on CRI studies, while the PBLH was adopted to conduct a simulation verification. Previous studies have demonstrated the reliability of ERA5 data in estimating cloud properties, including the cloud liquid content (Yao et al., 2020; Nandan et al., 2022; Ojo et al., 2023).
2.2 Synoptic pattern classification
The objective classification was conducted on the synoptic patterns of the SCB using ERA5 data, including geopotential height, u, and v components of wind at the 850 hPa pressure level. The analysis covered an area of 24–37° N and 97–117° E with a horizontal resolution of 0.25° × 0.25°. Given that PM pollution in the SCB is primarily prevalent during winter months (Zhao et al., 2018; Lu et al., 2022), the synoptic pattern classification was performed for the winter seasons from 2015 to 2021 (December, January, and February) using the principal component analysis in the T-model (T-PCA) objective method. Compared with the subjective classification method, the objective method can process large amounts of data without relying on subjective experience (Huth et al., 2008; Miao et al., 2017). Among various classification methods, the T-PCA method accurately reflects the characteristics of the original synoptic circulations and exhibits spatial and temporal stability (Huth, 1996). Consequently, the T-PCA has been widely used in synoptic pattern classification research (Ning et al., 2019; Miao et al., 2020; X. Li et al., 2021).
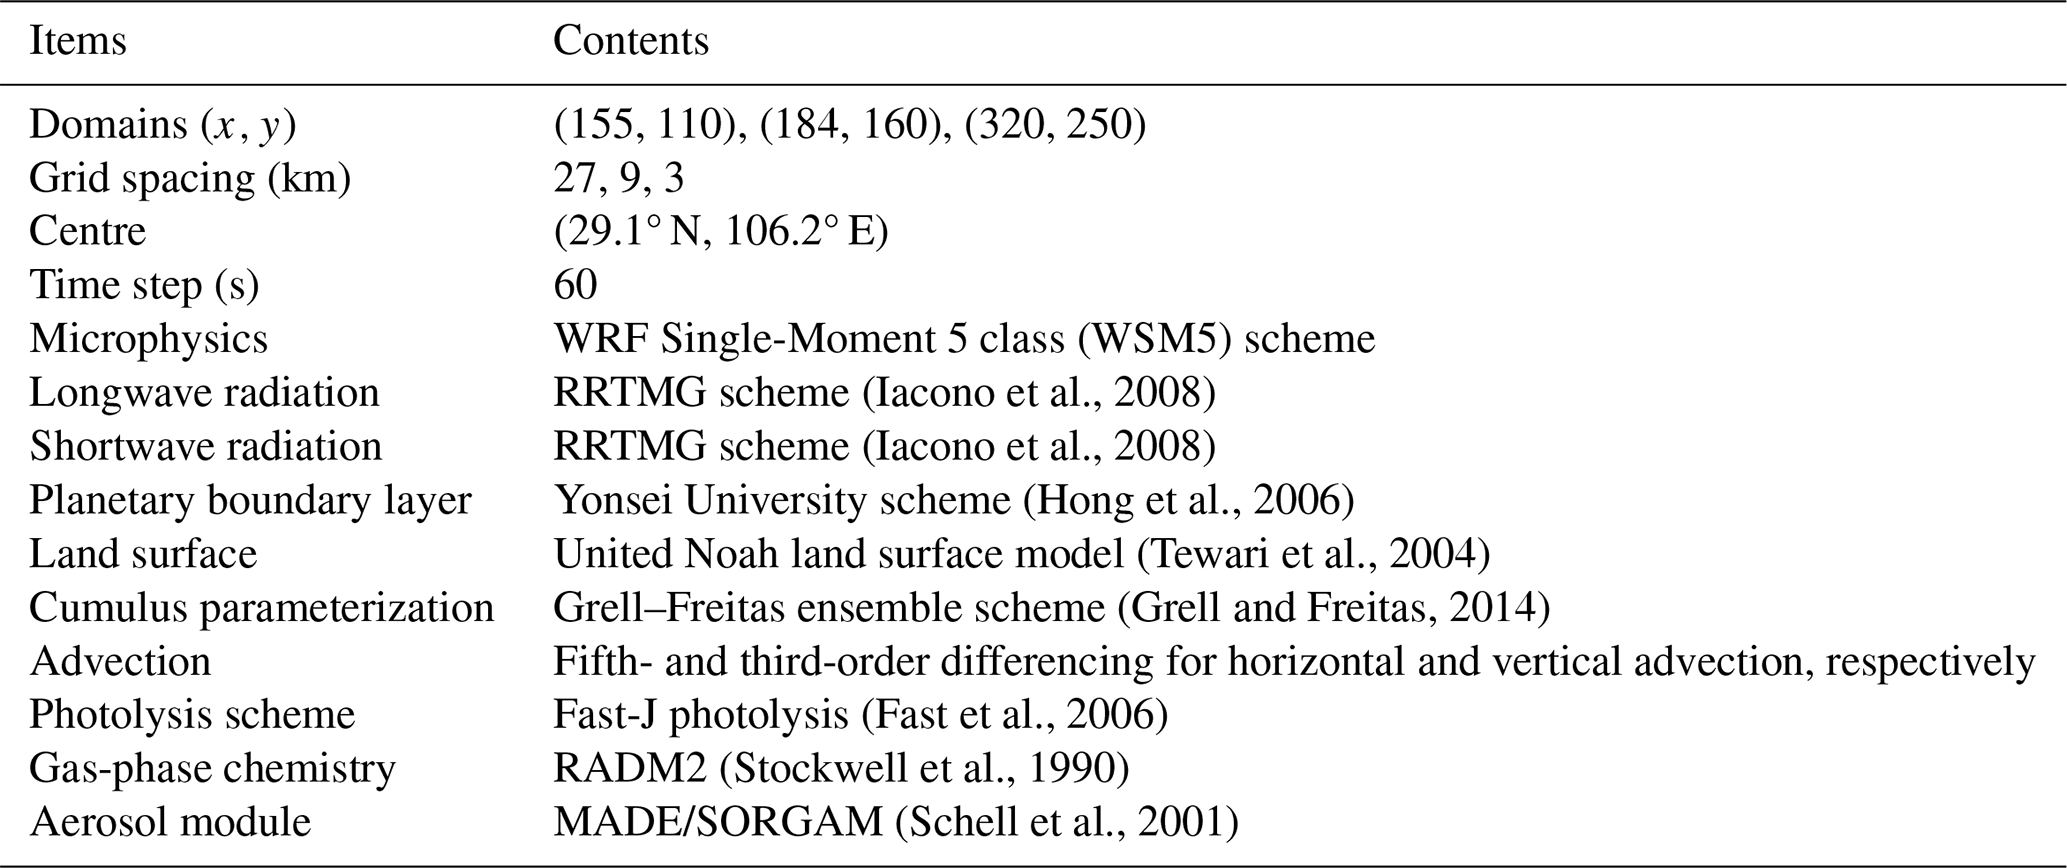
Table 2Four numerical simulation experiments are conducted in the study.
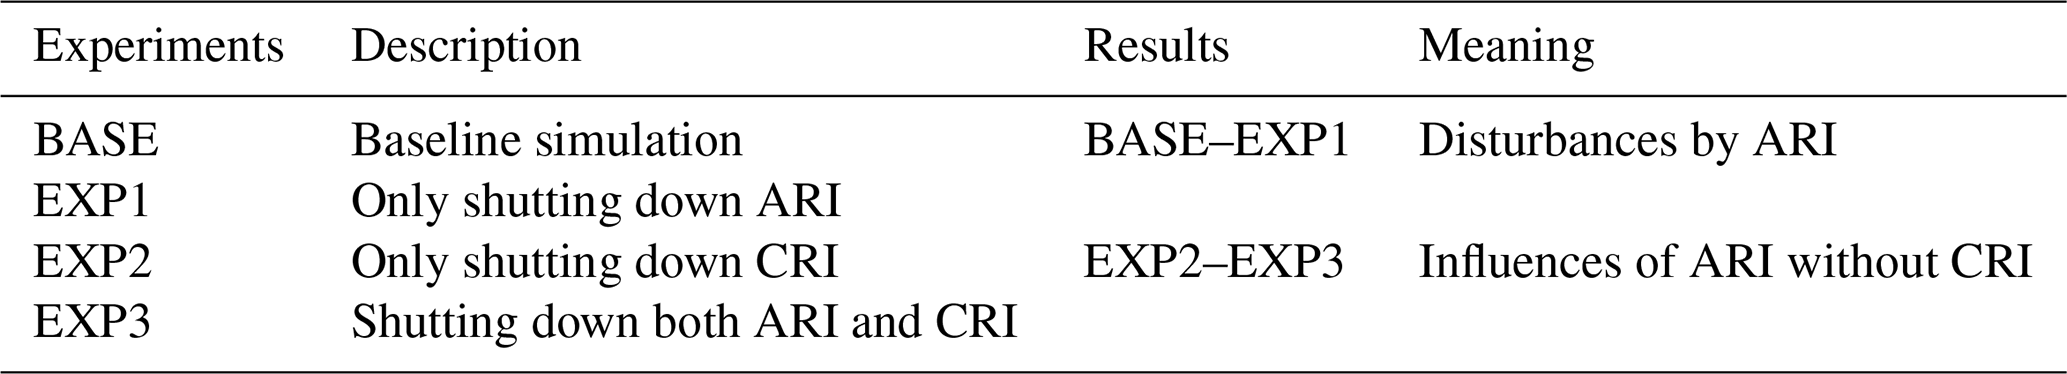
Note: ARI is for aerosol radiation interaction; CRI is for cloud radiation interaction.
2.3 Model configuration and simulation experiments
To understand the combined effects of synoptic patterns and CRI inhibition on the ARI and PBL, a series of parallel experiments were conducted on the simulation of a typical pollution episode using the WRF-Chem (v3.9.1) (Grell et al., 2005). The Advanced Research WRF (ARW) dynamics solver integrates the compressible, nonhydrostatic Euler equations, for example, the momentum equation, the continuity equation, the thermodynamic equation, the moisture equation, and the ideal-gas equation of the state (Skamarock et al., 2008). The model domain (Fig. 1a) was centred over the SCB and utilized three layers of nested grids with horizontal resolutions of 27, 9, and 3 km, respectively. A total of 32 vertical layers spanning from the surface to 100 hPa were defined. Initial and boundary meteorological fields were obtained from the National Centers for Environmental Prediction Final (NCEP FNL) reanalysis data with a horizontal resolution of 1° × 1° and 6 h time interval. For chemical process simulations, anthropogenic emissions were sourced from the Multi-resolution Emission Inventory model for Climate and air pollution research (MEIC) in 2016, featuring a grid resolution of 0.25° × 0.25°. To address the empirically overestimated PM2.5 emissions by the MEIC in the SCB (Zhan et al., 2023), the ensemble square root Kalman filter was implemented on the PM2.5 emission during the simulation (Wu et al., 2018; Lu et al., 2021). Biogenic emissions were calculated online using the Guenther scheme (Guenther et al., 2006). Table 1 provides a summary of the chosen physical and chemical parameterization schemes. The parameterization scheme employed in this study is the one used by the Chongqing Meteorological Bureau in the daily operational activities. The schemes have been obtained through multiple sets of control experiments and are considered suitable for the simulation in the SCB.
To assess the impact of CRI inhibition on the ARI under typical synoptic pollution patterns, four parallel experiments were conducted using simulation models. The selected simulation period for these experiments was 1–7 January 2017. The period was selected for two reasons: the Chinese government announced clean-air action in the year of 2013, aiming to reduce PM2.5 concentrations in the next 5 years. Specifically, the year of 2017 was identified as a key year for assessing PM2.5 pollution in China as significant practical actions were implemented during the period (Y. Wang et al., 2020), and the selected period encompassed both typical pollution and clean weather patterns.
The baseline experiment (BASE) included both CRI and ARI in the simulations. In contrast, the three sensitivity experiments focused on excluding either ARI or CRI. Experiment 1 (EXP1) did not consider ARI, Experiment 2 (EXP2) did not include CRI, and Experiment 3 (EXP3) omitted ARI when CRI was not included. The differences between BASE and EXP1 represented the disturbances caused by ARI, while EXP2 and EXP3 represented the influences of ARI without CRI inhibition. Detailed differences between the experiments can be found in Table 2. The numerical experiments were initiated at 00:00 on 30 December 2016, and ran until 00:00 on 8 January 2017, with the first 48 h designated as the model spin-up period.
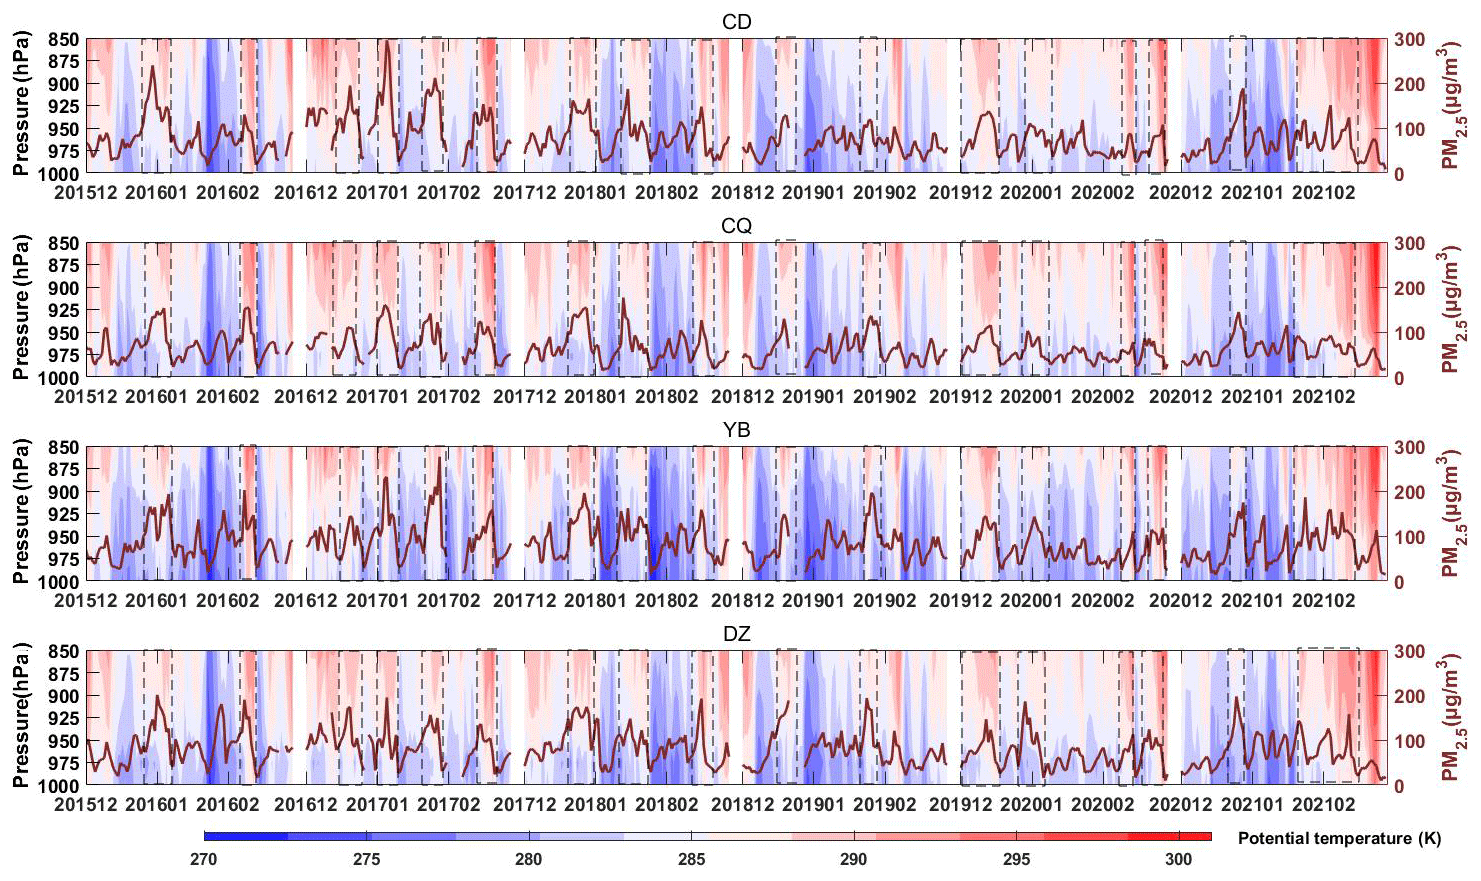
Figure 2Time series of daily mean PM2.5 and potential temperature derived from the sounding data during 2015–2021 winter months. The PM2.5 pollution episodes are marked with dotted black boxes.
3.1 Relationships between synoptic patterns and PM2.5 pollution in the SCB
Figure 2 illustrates the daily mean variations in PM2.5 concentration and vertical distributions of potential temperature (PT) during the winter period from 2015 to 2021, with a focus on the pollution episodes. The four sounding stations located in separate areas of the SCB (CD, YB, CQ, and DZ) consistently experienced pollution processes characterized by simultaneous changes in vertical thermal structures. For example, during the pollution events in January 2017 and December 2020, the PM2.5 concentrations in all four cities reached their peak levels at the same time before rapidly declining (Fig. 2). Interestingly, these pollution episodes were accompanied by warming in the upper-layer atmosphere, while a decrease in PM2.5 concentration correlated with cooling. Despite the significant distances between these cities (approximately 200–400 km), the synchronized changes in pollutant concentrations and vertical thermal structures could be attributed to large-scale synoptic patterns (Miao et al., 2020; X. Li et al., 2021). While the four cities with sounding stations were selected as representative of the vertical thermal structure analysis, other cities in the SCB also experienced pollution episodes and relevant physical processes, except for GY (Fig. S1 in the Supplement). GY is located at the northern edge of the SCB, bordering the Shaanxi and Gansu provinces. The proportion of heavy PM2.5 pollution in GY is the lowest in the basin, but the proportion of PM10 pollution is higher than other cities in the SCB (Lu et al., 2022). Due to the lower PM2.5 concentration, the two pollution processes in January 2017 in GY were not as significant as in other cities within the basin. However, the warming of the upper air that coincided with the PM2.5 increase could still be observed.
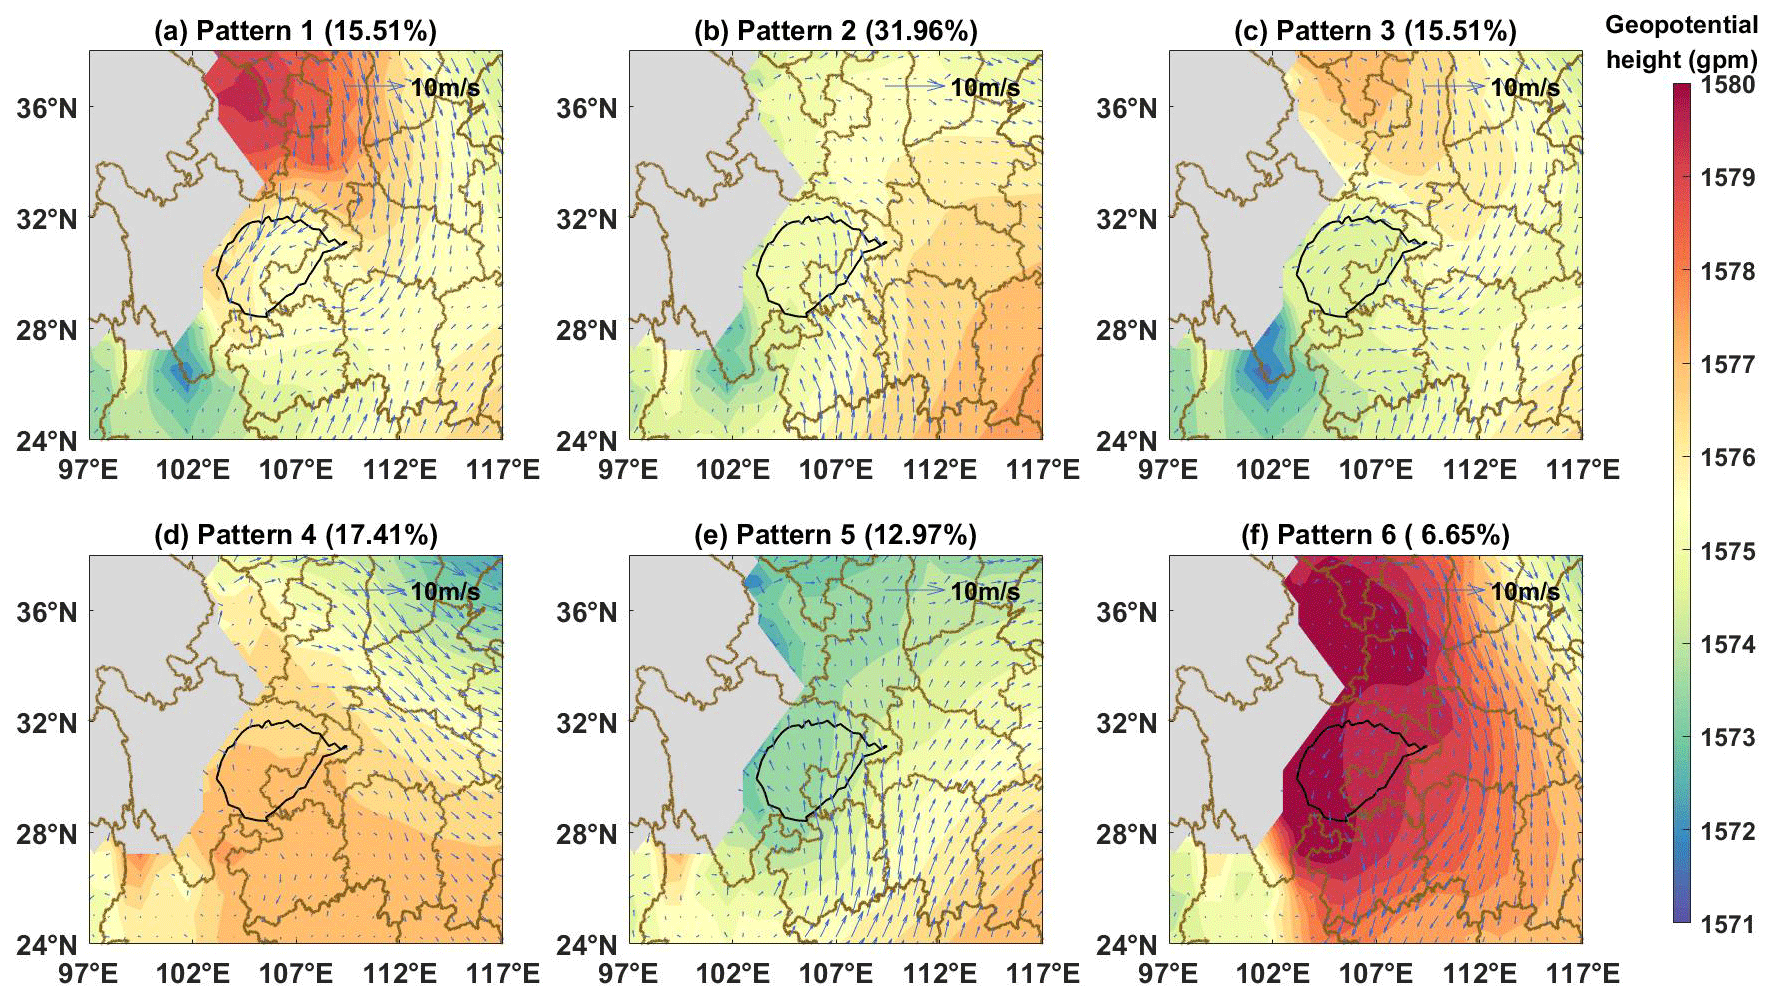
Figure 3The 850 hPa geopotential height field (shading) with wind vector fields (blue vectors) and the frequency of occurrence for six synoptic patterns during 2015–2021 winter months. The SCB was outlined with an altitude contour of 750 m terrain height (black lines).
The time series of daily mean PM2.5 from air quality monitoring sites and the accompanying vertical distributions of temperature, relative humidity, and wind in CD, CQ, YB, and DZ derived from the sounding stations are shown in Fig. S2, focusing on January 2017 as an example for analysis. During this month, two severe PM2.5 pollution episodes occurred: one from 1 to 7 January and another from 24 to 31 January 2017. These pollution episodes had a significant impact on air quality in all four cities. The highest daily PM2.5 concentrations recorded during these episodes were 291.17 µg m−3 in CD and 276.2 µg m−3 in YB. Pollution in early January exhibited a gradual increase in PM2.5 levels from 1 to 3 January, with upper-air warming and the emergence of an inversion above the PBL. Additionally, lower humidity and higher wind speeds above 1500 m were observed during the pollution accumulation period. Similarly, the late January pollution episode showed a rapid increase in PM2.5 from 24 to 27 January, together with warming, dryness, and high wind speed above 1500 m in all four cities. These consistent meteorological conditions during the pollution periods indicated significant synoptic forcing. The previous study has found that heavy winter pollution processes in the SCB are usually associated with abnormal warming above 850 hPa (Lu et al., 2022). The warming is induced by strong southerly airflow above the basin. The southerly airflow in winter over the SCB originates from the Yunnan–Guizhou Plateau or the Indian subcontinent, characterized by high temperature, dryness, and high wind speed. The strong southerly airflow forms a warm lid over the basin, suppressing the vertical exchange of pollutants within the basin. As a result, pollutants accumulate rapidly, which may explain the phenomenon of rapid PM2.5 growth accompanied by warming, dryness, and strong winds above 1500 m. Notably, the key layer for studying the connection between synoptic patterns and PM2.5 pollution is approximately 850 hPa, corresponding to a height of approximately 1500 m within the PBL, where changes in specific meteorological conditions primarily affect surface-emitted pollutants.
Using ERA5 reanalysis data for winter (December, January, and February) from 2015 to 2021, the 850 hPa synoptic patterns over the SCB were objectively classified into six types (Fig. 3). According to the relative positions of the high-pressure and low-pressure systems in the basin, these synoptic patterns could be described as follows: (1) strong high pressure in the north, (2) east high–west low (EHWL) pressure, (3) weak high pressure in the north, (4) a weak ridge of high pressure after the trough, (5) low trough (LT), and (6) strong high pressure. Patterns 1 and 3 exhibited high pressure in the northern SCB, which differed from the high-pressure intensity. With strong high pressure, the basin was primarily controlled by northerly airflow. Under weak high-pressure conditions, the basin was dominated by an easterly backflow. Patterns 2 and 5 had high and low pressures near the basin, forming a relatively dense isopotential altitude gradient and resulting in strong southerly winds over 850 hPa. Pattern 4 was a weak high-pressure ridge after a trough controlled the SCB with sparse isobaric lines and weak winds, leading to static and stable weather conditions. During Pattern 6, the SCB was controlled by the cold high-pressure system, accompanying weak northerly airflow over the basin. Pattern 6 usually evolved from either Pattern 1 or Pattern 3.
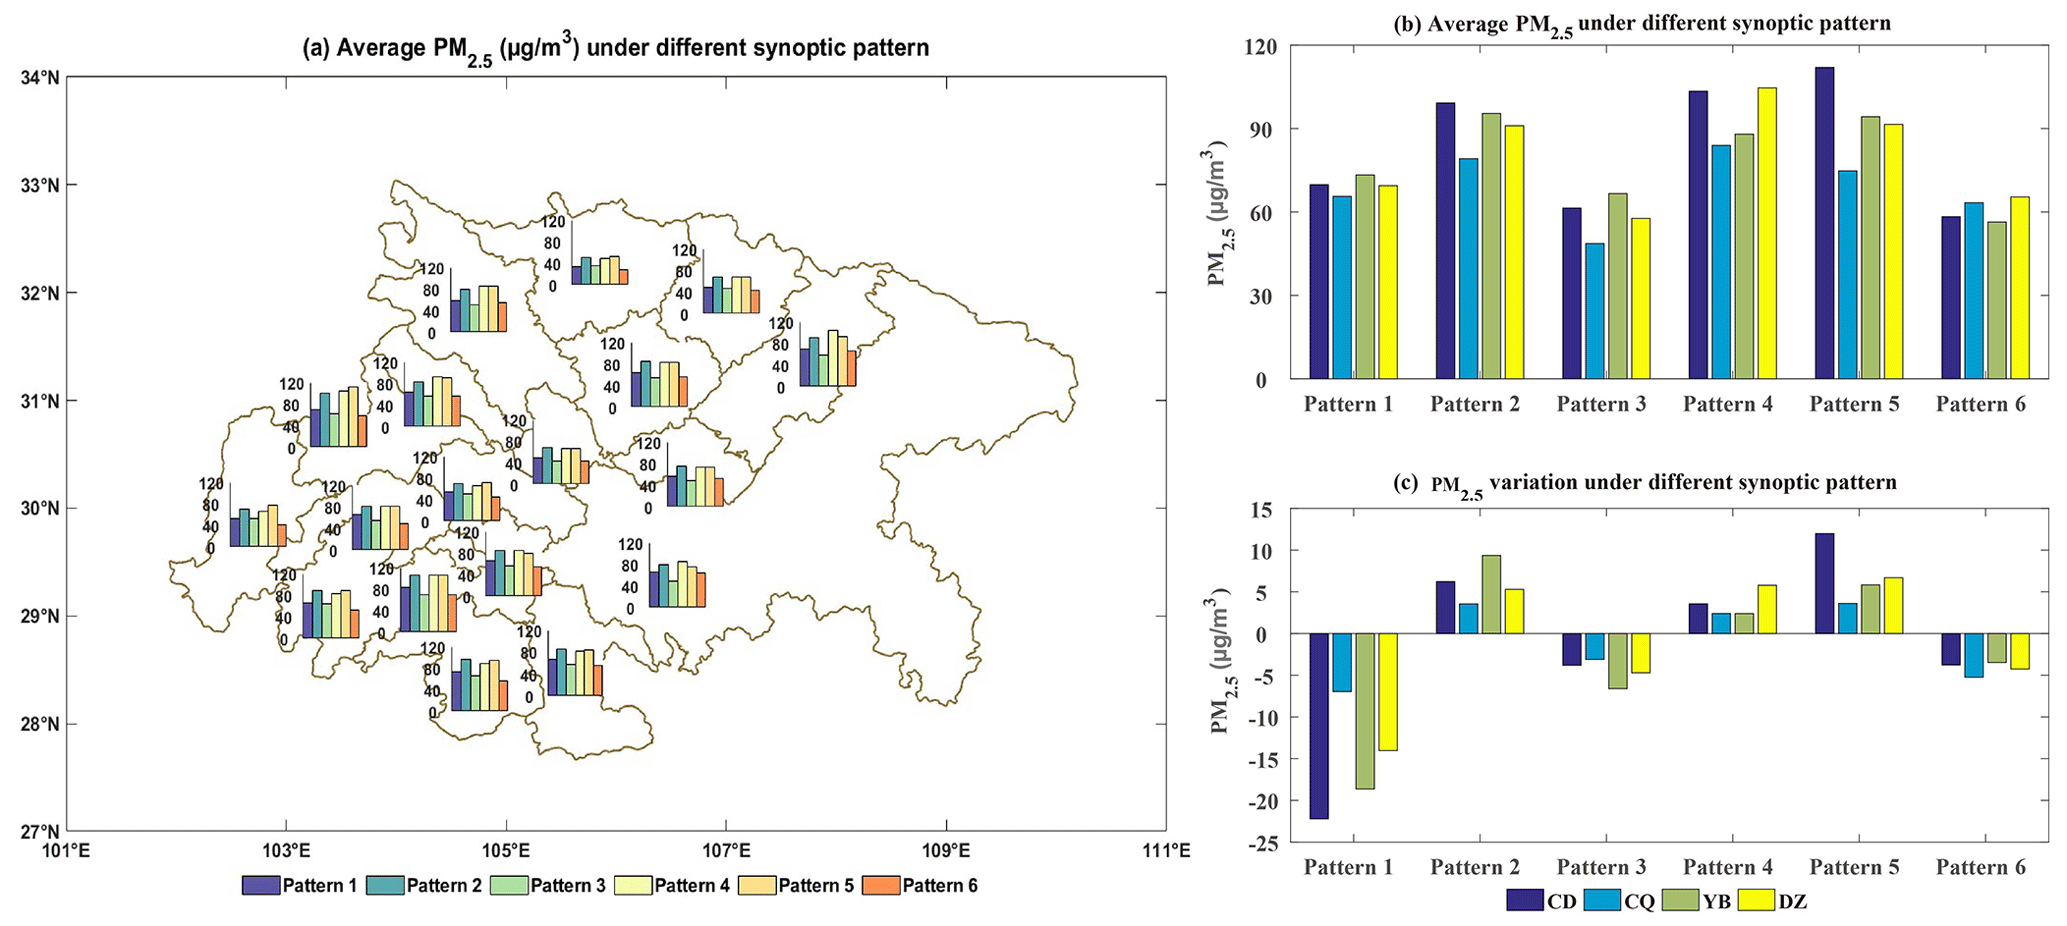
Figure 4(a) The pollution occurrence frequency at 18 air pollution stations in SCB. (b, c) Average PM2.5 concentrations and PM2.5 day-to-day variations at four representative SCB cities under six synoptic patterns.
Patterns 2, 4, and 5 exhibited higher frequencies of pollution occurrence (PM2.5 daily concentration ≥ 75 µg m−3) according to statistical results from 18 cities in the SCB during the 2015–2021 winters (Fig. 4a). These patterns were associated with high PM2.5 concentrations on 50 %–70 % of the days, including CD, DY, and MY in the northern SCB; 40 %–60 % for cities in the southern SCB, such as ZG and YB; and also 40 %–60 % of the days for cities in the northern SCB, such as CQ, DZ, NC, and GA. Furthermore, the average PM2.5 concentrations in the respective cities for the six synaptic patterns were calculated (Fig. 4b), aligning with the frequency of pollution occurrence. The days under Patterns 2, 4, and 5 exhibited higher average daily PM2.5 concentrations. The average concentrations under these three synoptic patterns were 99.19, 103.43, and 111.97 µg m−3 for CD; 95.44, 87.98, and 94.26 µg m−3 for YB; 79.14, 83.96, and 74.77 µg m−3 for CQ; and 91.02, 104.64, and 91.51 µg m−3 for DZ, respectively. Regarding the impact of synoptic patterns on the accumulation or dispersion of PM2.5, Fig. 4c illustrates the average daily changes in the PM2.5 concentration compared with the previous day for CD, CQ, YB, and DZ under the six synoptic patterns. Patterns 2 and 5 exhibited the most significant PM2.5 accumulation under the influence of southerly airflow. The average PM2.5 concentration under Patterns 1, 3, and 6 was lower in all cities of SCB than other three pollution patterns (Fig. 4a). Besides, the day-to-day PM2.5 variations under Patterns 1, 3 and 6 exhibited negative growth trend in the four representative cities (Fig. 4c). As a result, Patterns 1, 3, and 6 were identified as the “clean pattern”. In addition, the pollution occurrence frequency was found to be higher for cities located in the eastern part of the SCB than other parts. Under Pattern 6, the strongest northerly airflow affects the basin. The eastern part of the basin consists of parallel ridges and valleys which reduce the wind speed. The stronger the wind is, the more obvious the reduction in wind by terrain will be. In contrast, the western part is relatively flat, which can result in higher surface wind speeds. The difference in wind impacted by terrain led to a weaker pollution removal effect in the eastern region, thus contributing to a higher proportion of pollution days under Pattern 6. Besides, differences in precipitation rates between eastern cities and other regions were not significant (the proportion of rainfall with a daily accumulated precipitation exceeding 10 mm in CD, CQ, YB, and DZ under Pattern 6 was less than 3 %), which might not the main reason why eastern cities in the SCB experience higher pollution frequency.
The time series of daily mean PM2.5 and the day-to-day classification of 850 hPa synoptic patterns are shown in Fig. S3 from December 2016 to January 2017. Six pollution episodes occurred during this period (3–12 and 16–26 December 2016; 1–7, 16–19, and 20–28 January 2017; and 14–23 February). It is observed that pollution episodes consistently began with Pattern 2 and ended with Pattern 1, accompanied by a rapid decline in PM2.5. This finding suggests that Pattern 2 acted as a key synoptic forcing for the initiation of pollution episodes. Additionally, statistical results revealed that Pattern 2 accounted for a high proportion of PM2.5 increase during the six pollution episodes, reaching 48.48 %, while Pattern 5 had the second-highest proportion of 21.88 %, with Patterns 2 and 5 combined accounting for more than 70 % of the pollution episodes. For example, during the two heavy-pollution events in early and late January 2017, PM2.5 rapidly accumulated with the interplay of Patterns 2 and 5. These two patterns represented a substantial proportion of 31.96 % and 12.97 %, respectively, during the winters from 2015 to 2020 at the 850 hPa level in the SCB (Fig. 3). Based on this analysis, Patterns 2, 4, and 5 were identified as synoptic pollution patterns, whereas Patterns 1, 3, and 6 were identified as clean patterns. In summary, Patterns 2 and 5 played crucial roles in the initiation and accumulation of PM2.5 during pollution episodes.
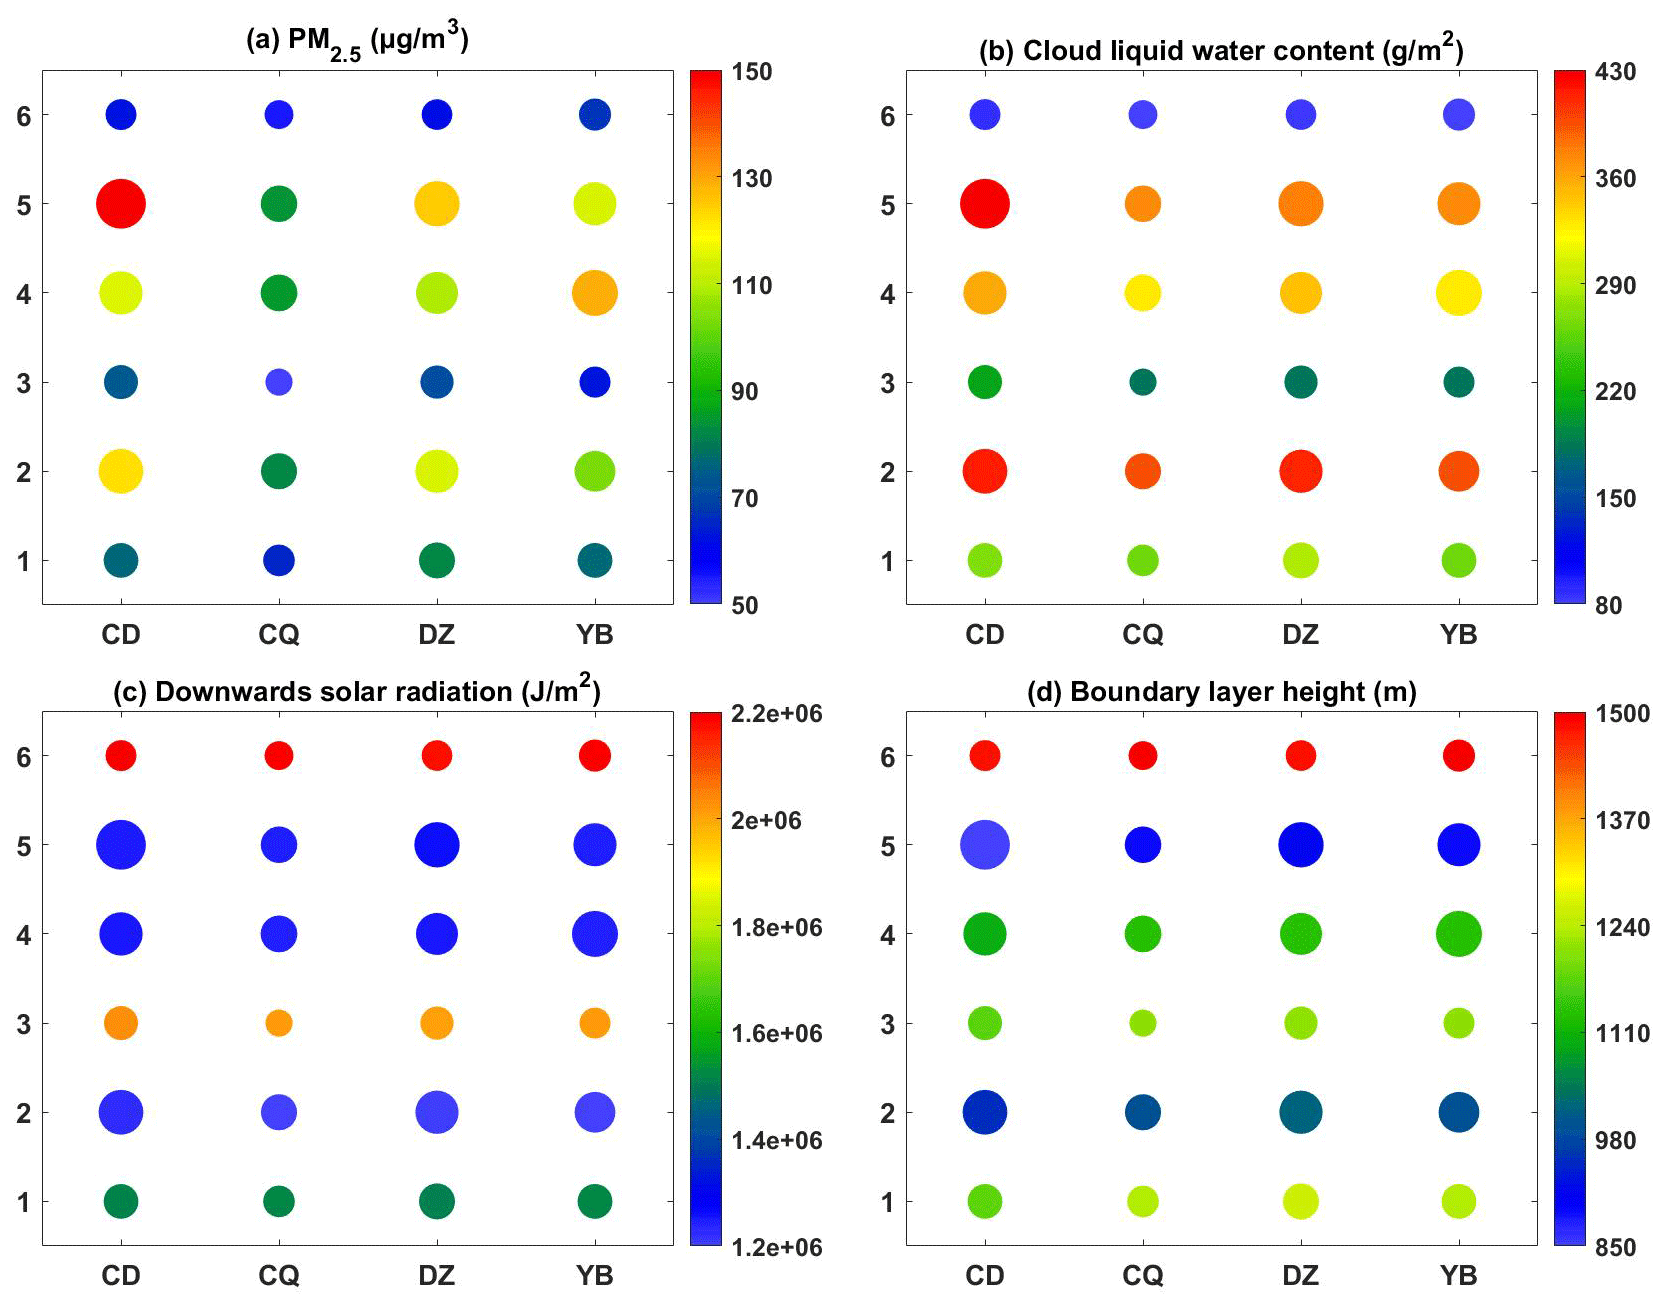
Figure 5The averaged (a) PM2.5 concentrations, (b) cloud liquid water contents, (c) downward solar radiation, and (d) boundary layer height derived from 2015–2021 winter month ERA5 reanalysis data at four representative SCB cities under six synoptic patterns. The dot sizes represent the PM2.5 concentrations.
The discussion above showed that pollution in the SCB tended to occur when southerly airflow controlled the upper layer of the basin (Patterns 2 and 5), while the dispersion of pollutants was accompanied by northerly winds, which aligns with the findings of Lu et al. (2022). This study indicated that southerly airflow in the upper layer could bring warm air, leading to warming above the basin and forming a “warm lid”. The surrounding mountains and plateau with the warm lid contributed to the formation of a relative enclosed space within the SCB, facilitating local circulation and allowing for the thorough mixing and secondary reactions of local emission and pollutants transported from outside. As a result, persistent and severe pollution often occurred under the influence of southerly airflow. When the northerly airflow began to dominate the SCB, the warm lid and local circulation were disrupted, leading to dispersion of pollutants through advection and vertical transport. Northerly winds were often associated with cold air and sometimes accompanied by weak precipitation, resulting in wet deposition and the removal of pollutants. Therefore, the arrival of northerly airflow often signified the ending of the pollution episode. The evolution of 850 hPa synoptic forcing and vertical meteorological conditions (Figs. 2 and 6) aligns with the study of Lu et al. (2022). Therefore, there are also similar pollution change mechanisms.
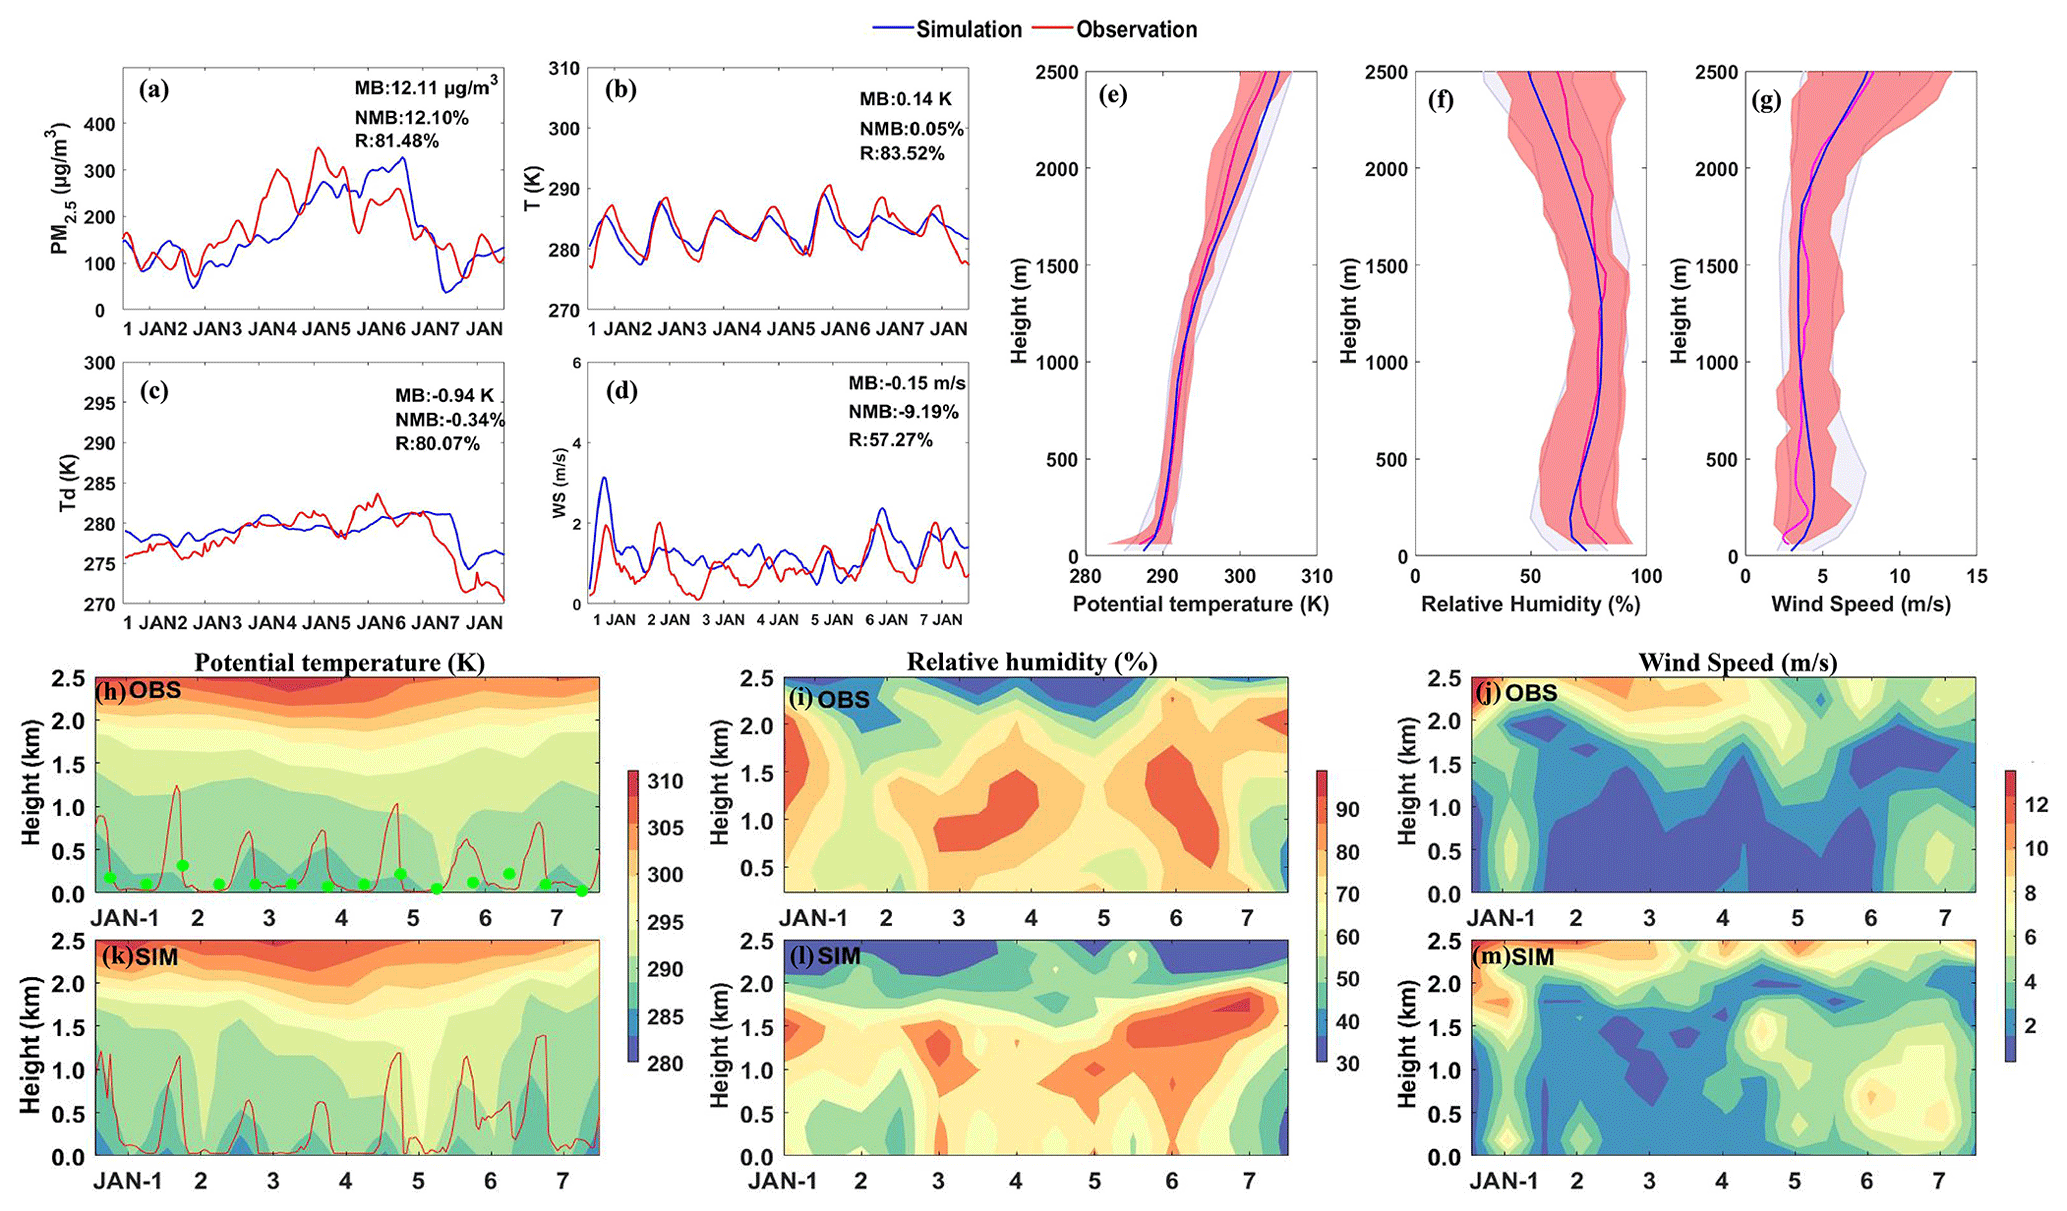
Figure 6Time series of hourly simulated and observed (a) PM2.5 concentrations, (b) temperatures at 2 m, (c) dew temperatures at 2 m, and (d) wind speed near the surface, as well as the comparison of simulated and observed mean vertical profiles of (e) potential temperature, (f) relative humidity, and (g) wind speed. The shaded red and grey areas represent deviations to the mean values of the observation and simulation, respectively. The simulated and observed time–height sections of (h, k) potential temperature, (i, l) relative humidity, and (j, m) wind speed are also given, while the red lines in panels (h) and (k) are the time series the boundary layer heights derived from ERA5 data and simulations, with green dots representing boundary layer heights calculated with sounding data. The upper figures display information from CD. Additionally, the model verification information regarding CQ, YB, and DZ can be found Figs. S4 and S5.
Due to the convergence of air moving eastward across the Tibetan Plateau, the SCB experiences frequent wet and cloudy weather, with the cloud cover fraction exceeding 80 % (Yu et al., 2004). Clouds undoubtedly play a nonnegligible role in the interactions of aerosols, radiation, and the PBL under typical synoptic forcing in this region. This study evaluated the average cloud liquid water content, downward solar radiation, and PBL under the influence of the six classified synoptic patterns in CD, CQ, DZ, and YB, using data from ERA5 (Fig. 5). The reanalysis data revealed significant higher cloud liquid water contents in Patterns 2 and 5, likely triggered by robust southerly air prevailing at 850 hPa over the SCB (Fig. 3). This southerly air brought warm and moist air, contributing to cloud formation. Dense clouds reduced solar radiation through reflection and scattering, resulting in surface cooling and inhibiting PBL development. The PBLH under Patterns 2 and 5 was approximately 900–1000 m, lower than that under the influence of the clean synoptic Pattern 6 at 1500 m or Patterns 1 and 3 at 1200–1300 m (Fig. 5). In contrast, the clean synoptic Pattern 1 was characterized by a strong northerly flow at 850 hPa, resulting in lower cloud liquid water content over the basin and increased solar radiation, promoting PBL development. The lower PBLH with more stable stratification caused by the CRI in Patterns 2 and 5 could partially explain the rapid accumulation of PM2.5 during these two pollution patterns.
3.2 Integrated impacts of synoptic patterns and the CRI inhibition on the ARI
Based on the above analysis, Patterns 2 and 5 were identified as the key pollution synoptic patterns accompanying dense clouds and, thus, strong CRI. However, the effects of pollution patterns on the ARI and their interaction with CRI in the SCB remain unclear and warrant further investigation. A typical pollution episode from 1–7 January 2017 was selected to understand these complex processes and simulated using WRF-Chem. The BASE simulations were verified with observations to determine the accuracy and reliability of the simulation results. The simulation and observation of PM2.5, temperature at 2 m, dew temperature at 2 m, and wind speed values with some statistical metrics in CD from 1–7 January are shown in Fig. 6a–d. Similar information at CQ, YB, and DZ can be found in Fig. S4. The mean bias (MB) of the simulated and observed PM2.5 concentrations was −15.59, −13.42, 2.10, and −13.11 µg m−3, with normalized MB (NMB) values of −4.12 %, −4.22 %, 6.01 %, and −0.68 % at four cities, respectively, which are within the acceptable standards (NMB < ± 15 %). The R of PM2.5 was 78.91 %, 57.23 %, 61.15 %, and 62.86 % for four representative cities, respectively. The statistical metrics for PM2.5 are consistent with previous studies (P. Wang et al., 2020; Shu et al., 2021; Zhan et al., 2023), indicating that our model results for PM2.5 are reasonable and acceptable. Regarding the surface meteorological factors, low MB and high R for both temperature and dew point temperature suggested good simulation performance for these variables. However, the simulation results for wind speed were poor, which was expected under conditions of low wind and complex terrain. The high observed calm wind frequency, influenced by the starting speed of the anemometer, led to an overestimation in the simulation (Shu et al., 2021; Zhan et al., 2023). Additionally, it could be argued that unresolved topographic features introduce additional drag beyond that generated by vegetation, which was not considered in the WRF model (Jiménez and Dudhia, 2012).
In addition, the temporal average and variations in vertical profiles for potential temperature, relative humidity, and wind speed in the model were compared with the sounding data in CD (Fig. 6e–m). Model evaluation of the vertical structures in CQ, YB, and DZ can be found in Fig. S5. The SCB is characterized by cloudy and foggy conditions which result in abundant water vapour and nearly 100 % relative humidity above the nocturnal boundary layer. Models often underestimate the humidity above the boundary layer during night in the SCB (Shu et al., 2021). Furthermore, due to the complex terrain and measurement bias of the anemometer for weak winds, the evaluation of simulation results for wind speed often exhibits certain deviations (Jiménez and Dudhia, 2012; Shu et al., 2021; Zhan et al., 2023). For the verification of PBLH, sounding data are commonly regarded as reliable vertical observation records, and the PBLH calculated based on sounding data can be used as the true values to compare with other data for long-term validation (Guo et al., 2016). However, for short-term studies, due to limited availability of sounding data at only 00:00 and 12:00, the ERA5 data were also incorporated for the model evaluation of PBLH in this study (Figs. 6 and S5). The simulation PBLH showed a consistent trend with those calculated from ERA5 and sounding data. Overall, the simulation results can capture the meteorological and PM2.5 variation trends. According to the simulation evaluation standards for the SCB in previous studies (P. Wang et al., 2020; Zhan et al., 2023), the results are acceptable and reasonable; thus, the simulation can be used for subsequent analysis and discussion.
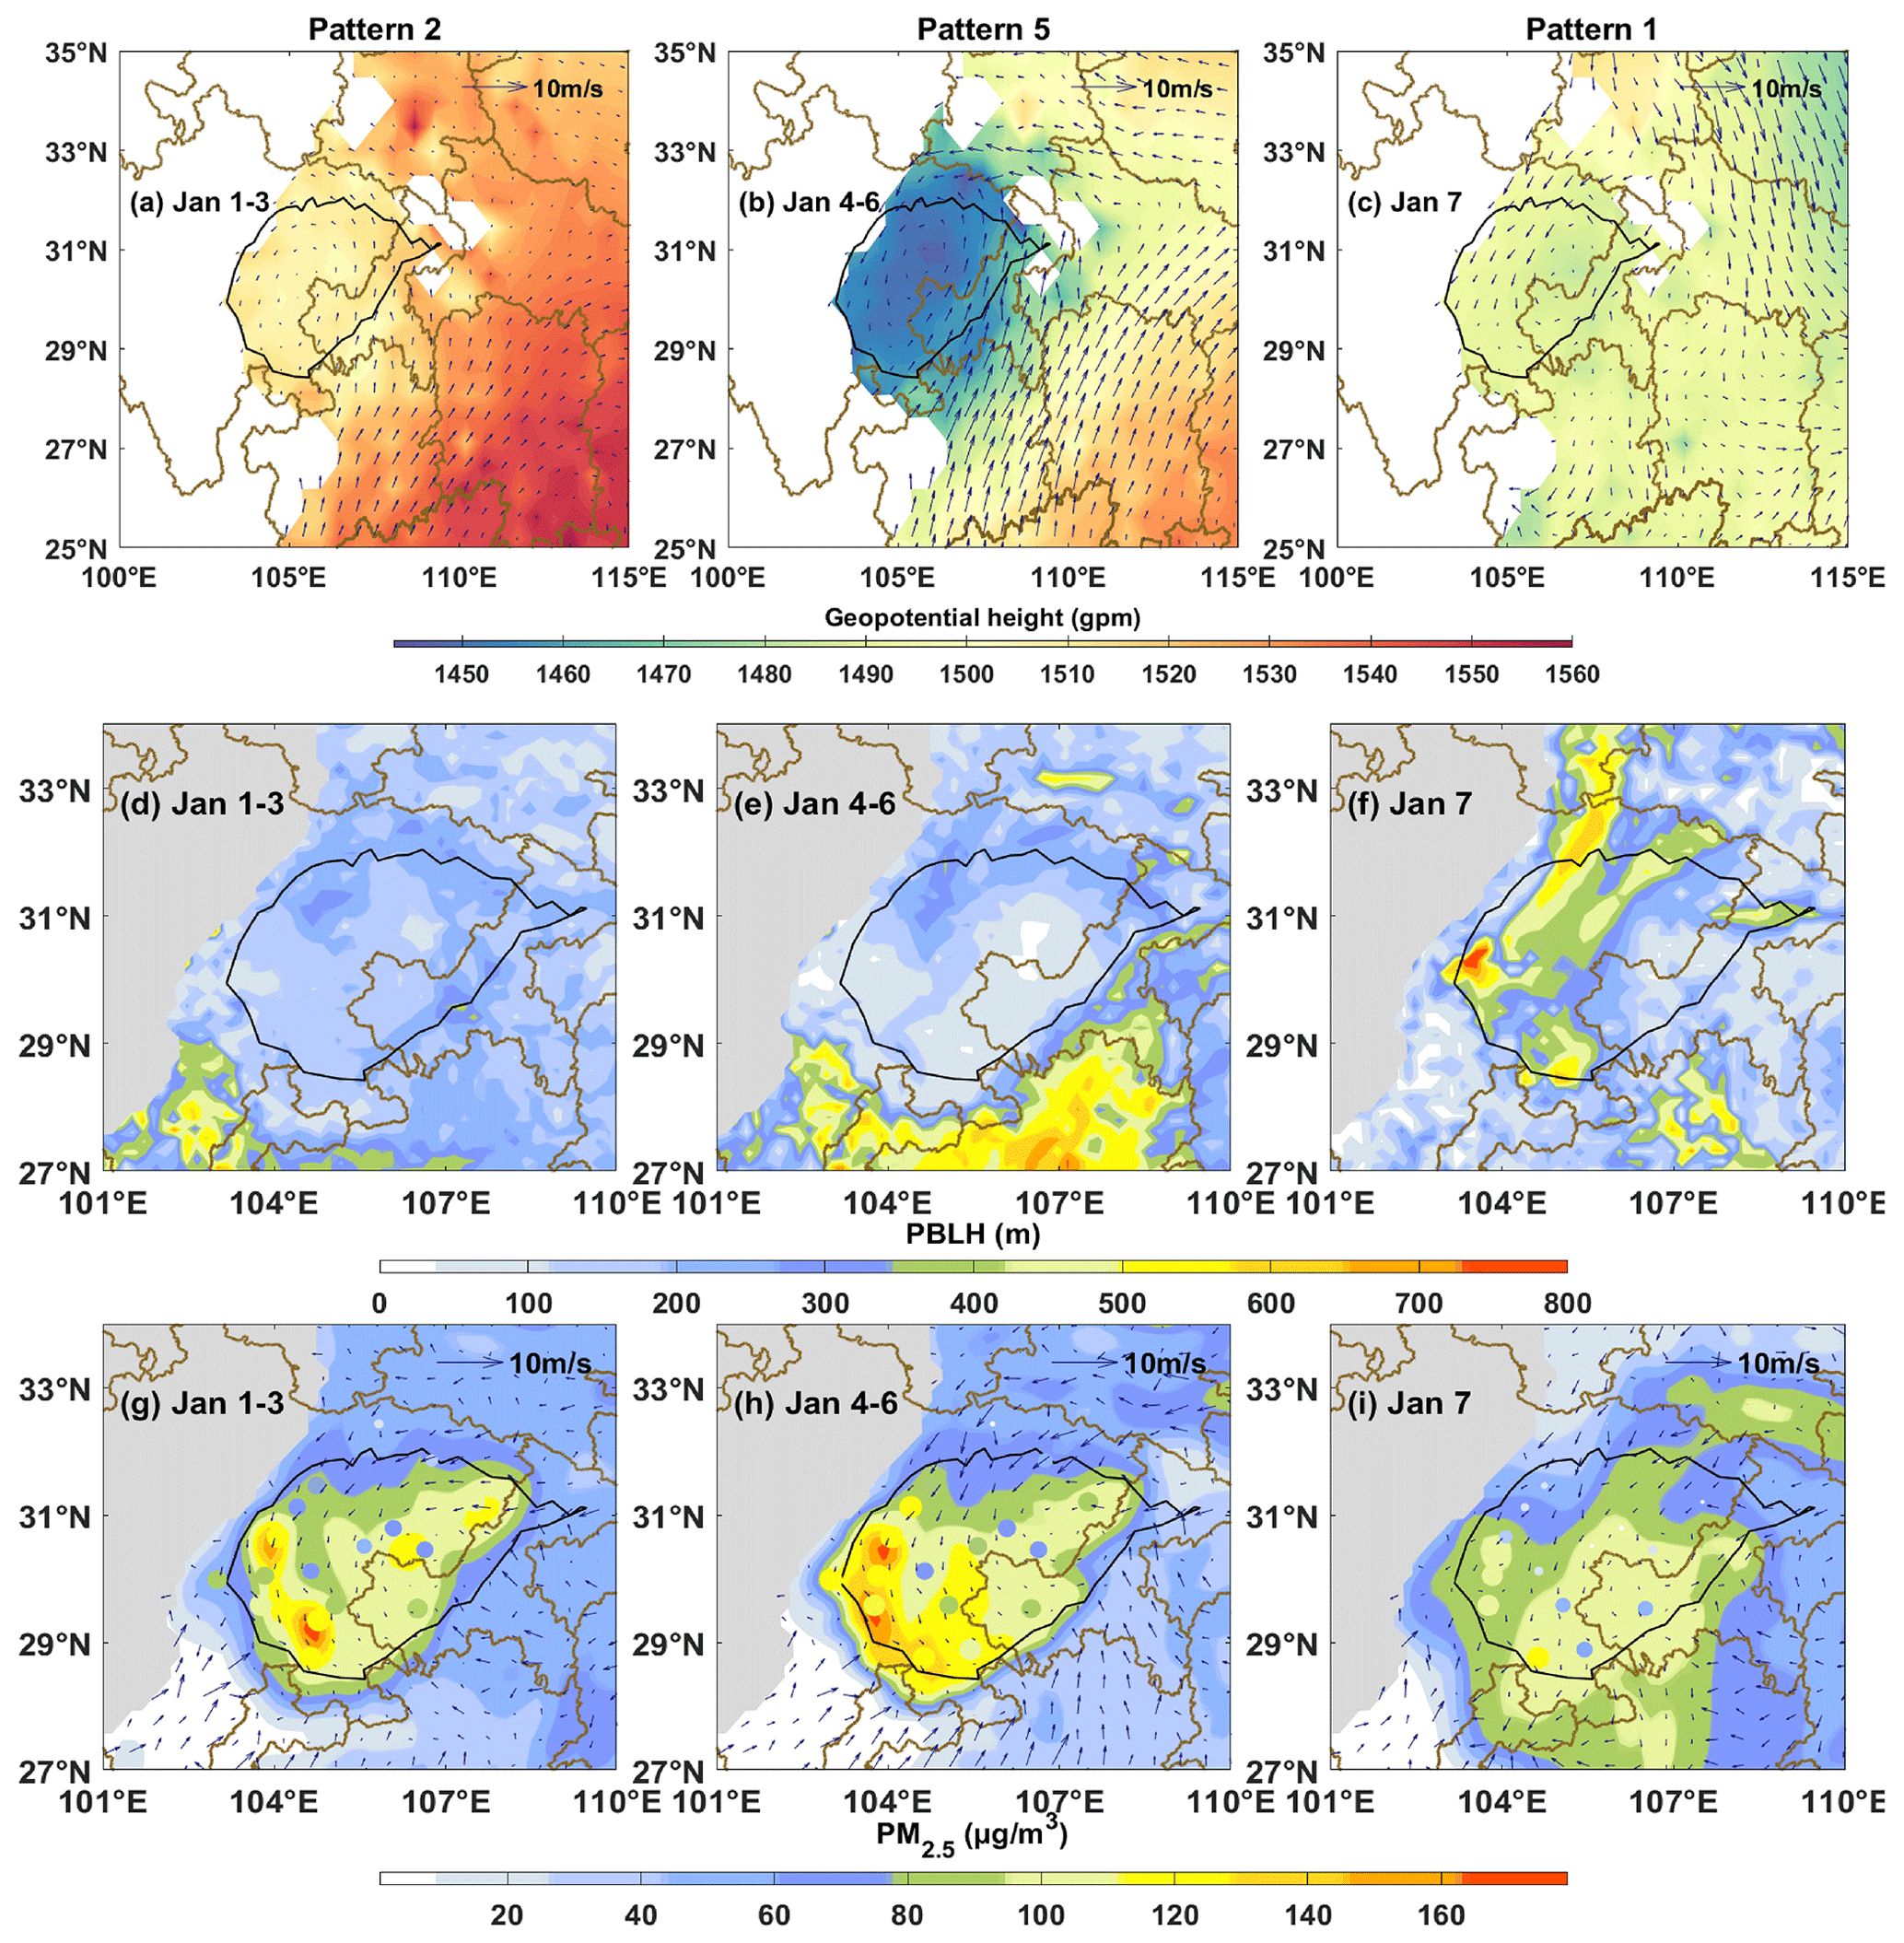
Figure 7The simulated (a–c) 850 hPa geopotential height field (shading) with wind vector fields (blue vectors), (d–f) boundary layer height, and (g–i) PM2.5 concentrations (shading) and wind vector fields at 900 hPa (blue vectors) for 1–3, 4–6 and 7 January. The size and colour of the scatters in panels (g–i) show corresponding observed PM2.5 concentrations at 18 air quality monitoring stations. The SCB was outlined with an altitude contour of 750 m terrain height (black lines).
During the pollution episode that occurred from 1 to 7 January 2017, the pollution synoptic patterns controlled the SCB as follows: Pattern 2 from 1 to 3 January, Pattern 5 from 4 to 6 January, and Pattern 1 on 7 January. Consequently, PM2.5 pollution in the SCB occurred on 1–6 January and rapidly dissipated on 7 January (Fig. 7). The mean geopotential height at 850 hPa derived from the simulation of 1–3 January under Pattern 2 showed EHWL, with a southerly flow prevailing over the SCB (Fig. 7a). The resulting upper-air warming suppressed PBL development (Fig. 7d). During 1–3 January under Pattern 2, the average PBL heights were lower (Fig. 7d), acting as a lid above the SCB and hindering the airflow within the basin due to the surrounding mountains. Low wind speeds provided adverse diffusion conditions for pollutants emitted into the basin, resulting in severe pollution in the western and southern SCB (Fig. 7g). From 4 to 6 January, the low pressure over the SCB evolved into a LT pattern, termed Pattern 5 in the previous analysis. Compared with Pattern 2, the isobaric lines were denser under the influence of the LT, leading to stronger southerly winds above the SCB (Fig. 7a and b). Lower average PBL heights were observed during 4–6 January under Pattern 5 when compared with those of 1–3 January under Pattern 2 (Fig. 7d and e), primarily due to stronger upper-air warming and more stable stratification. Pollutants that accumulated during 4–6 January from the earlier pollution episode (1–3 January) further increased (Fig. 7g–i). On 7 January, high pressure in the north dominated the SCB, with a prevailing northerly flow over the basin (Fig. 7c). The PBL height quickly increased due to upper-layer cold advection (Fig. 7f), resulting in a rapid decrease in PM2.5 (Fig. 7i). Overall, synoptic patterns play a key role in the accumulation and diffusion of PM2.5 during pollution episodes by modulating the PBL development and stratification stability.
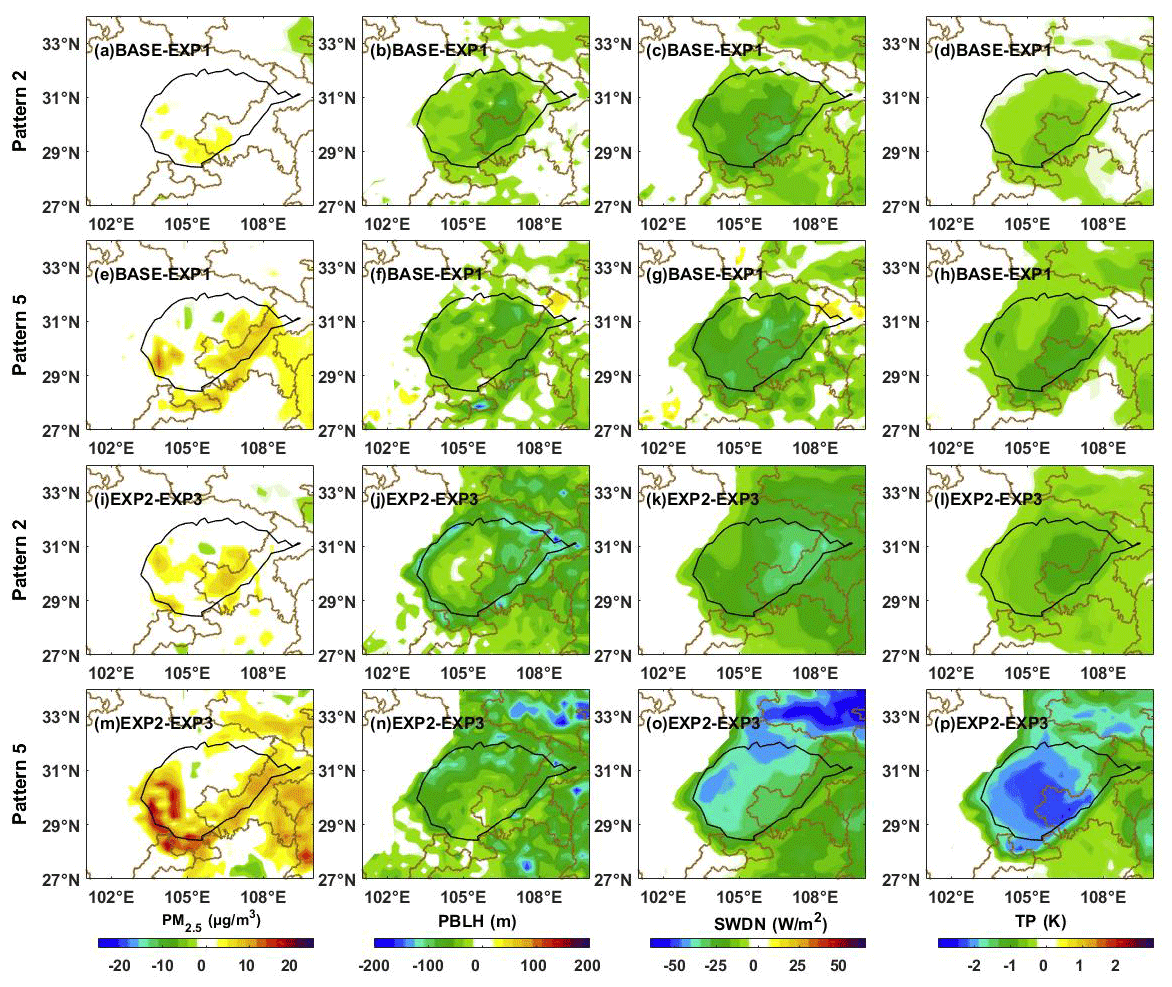
Figure 8Spatial distribution of perturbations induced by (a–h) aerosol radiation interactions (ARIs) and (i–p) ARI without the cloud radiation interaction (CRI) inhibition during 1–3 and 4–6 January, representing Pattern 2 and Pattern 5 synoptic forcing, respectively. The SCB was outlined with an altitude contour of 750 m terrain height (black lines).
Pollutant accumulation can regulate the PBL structure through the ARI, further exacerbating pollution (Wang et al., 2018; Miao et al., 2020). In the SCB, this positive feedback is weaker than in the other regions and may be inhibited by cloud radiation (Zhong et al., 2019). A series of simulation experiments were conducted to investigate the aerosol radiation feedback in the SCB under the influence of two typical synoptic pollution patterns, as described in Sect. 2.3. BASE–EXP1 represent the perturbations caused by ARI, whereas EXP2–EXP3 demonstrate changes through ARI without CRI inhibition. Aerosols led to surface cooling through absorbing and scattering solar radiation, thereby inhibiting the development of the PBL, which in turn facilitated pollutant accumulation (Fig. 8). Compared with Pattern 2, the aerosol concentrations in Pattern 5 were higher, resulting in greater reduction in downward solar radiation reduction due to ARI, leading to more pronounced cooling near the ground and a lower PBLH. Overall, the ARI in Pattern 5 was more significant than that in Pattern 2, regardless of CRI inhibition (Fig. 8).
Furthermore, parallel simulation experiments revealed that the CRI significantly attenuated the ARI in the SCB under both pollution synoptic patterns. When the CRI was not considered, more solar radiation penetrated the PBL. Dense aerosols accumulated near the surface, intercepting more downward shortwave radiation and resulting in stronger cooling near the ground. This suppressed the development of the PBL and contributed to a more remarkable ARI (Fig. 8). Regarding the horizontal spatial distribution, a strong ARI was primarily observed in CQ, as well as in the western and southern SCB, despite CQ experiencing lower pollutant concentrations compared to the other two regions (Figs. S4 and 7). This weaker ARI phenomenon in the western SCB was also reported by Zhong et al. (2019) and was attributed to CRI inhibition on the ARI. Considering the statistical results in Fig. 5, the average cloud liquid water content in CD and YB was significantly higher than that in CQ under the influence of Patterns 2 and 5. Consequently, a more remarkable CRI inhibition on the ARI would occur in the western and southern SCB compared to CQ, leading to a relatively weaker ARI distribution in these regions. Without considering the CRI, the ARI in the western and southern SCB would be much more pronounced than that in CQ. As for the northwestern SCB (DZ), the ARI in DZ is lower than in the other three regions. When the CRI is not considered, the ARI in DZ is higher than in CQ but lower than in CD and YB. This is because DZ has lower aerosol concentrations compared to CD and YB (Fig. 7) but exhibits higher cloud cover than CQ under Patterns 2 and 5 (Fig. 5).
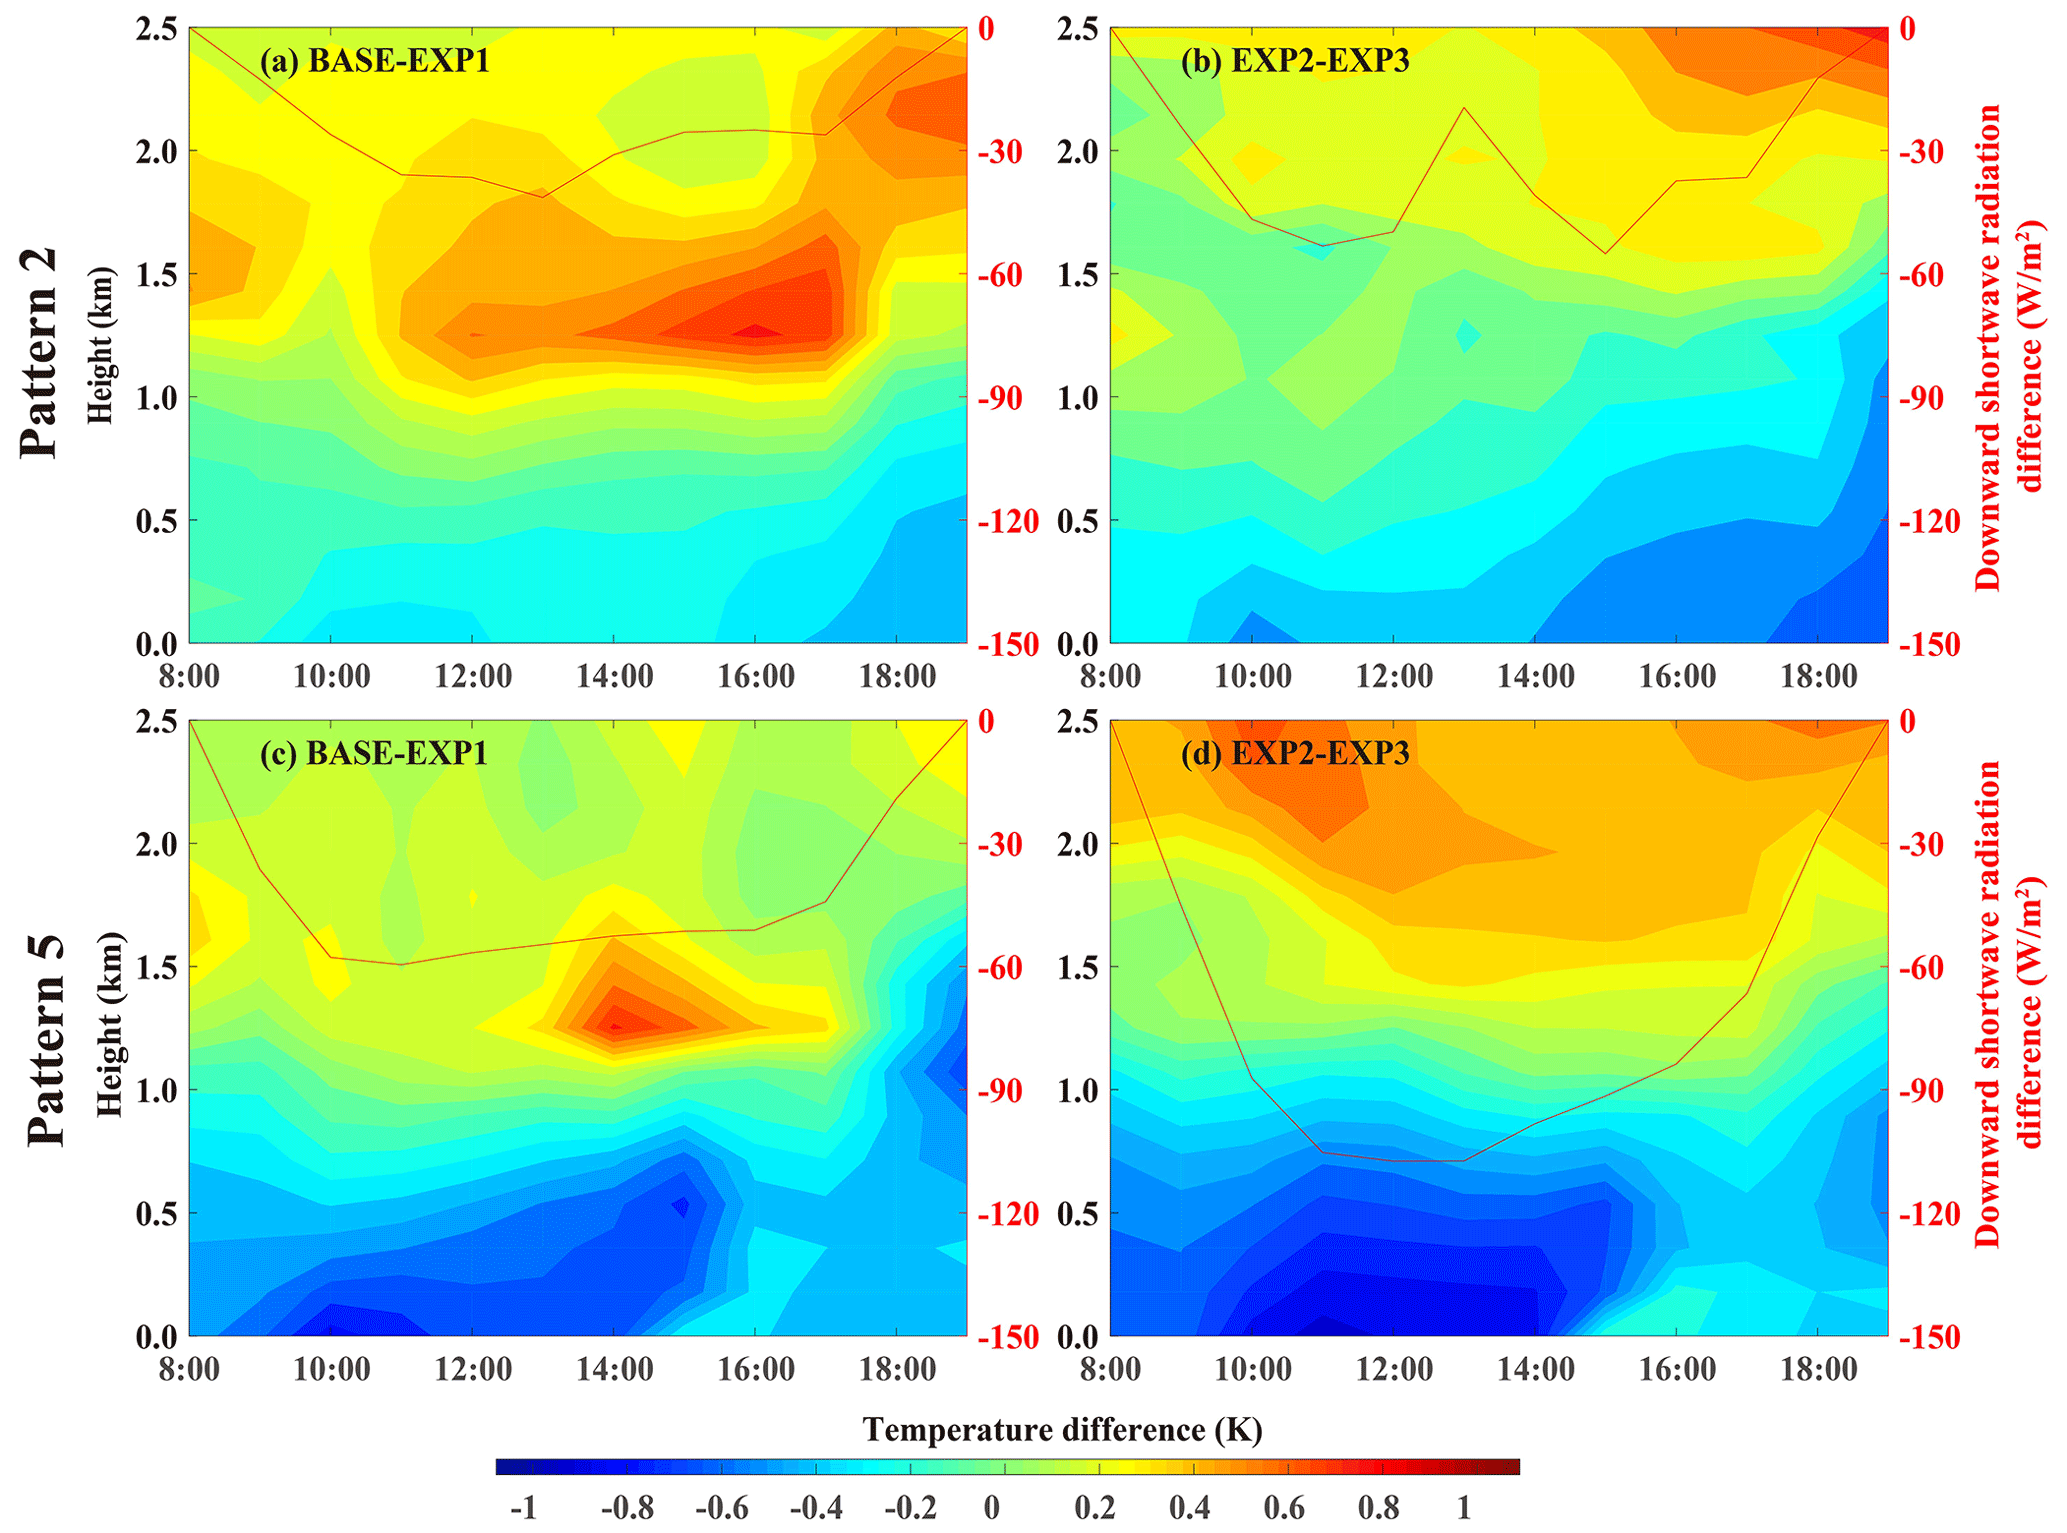
Figure 9Diurnal variations in vertical temperature perturbations and downward solar radiation under influences of Pattern 2 and Pattern 5 induced by (a, c) ARI and (b, d) ARI without CRI inhibition.
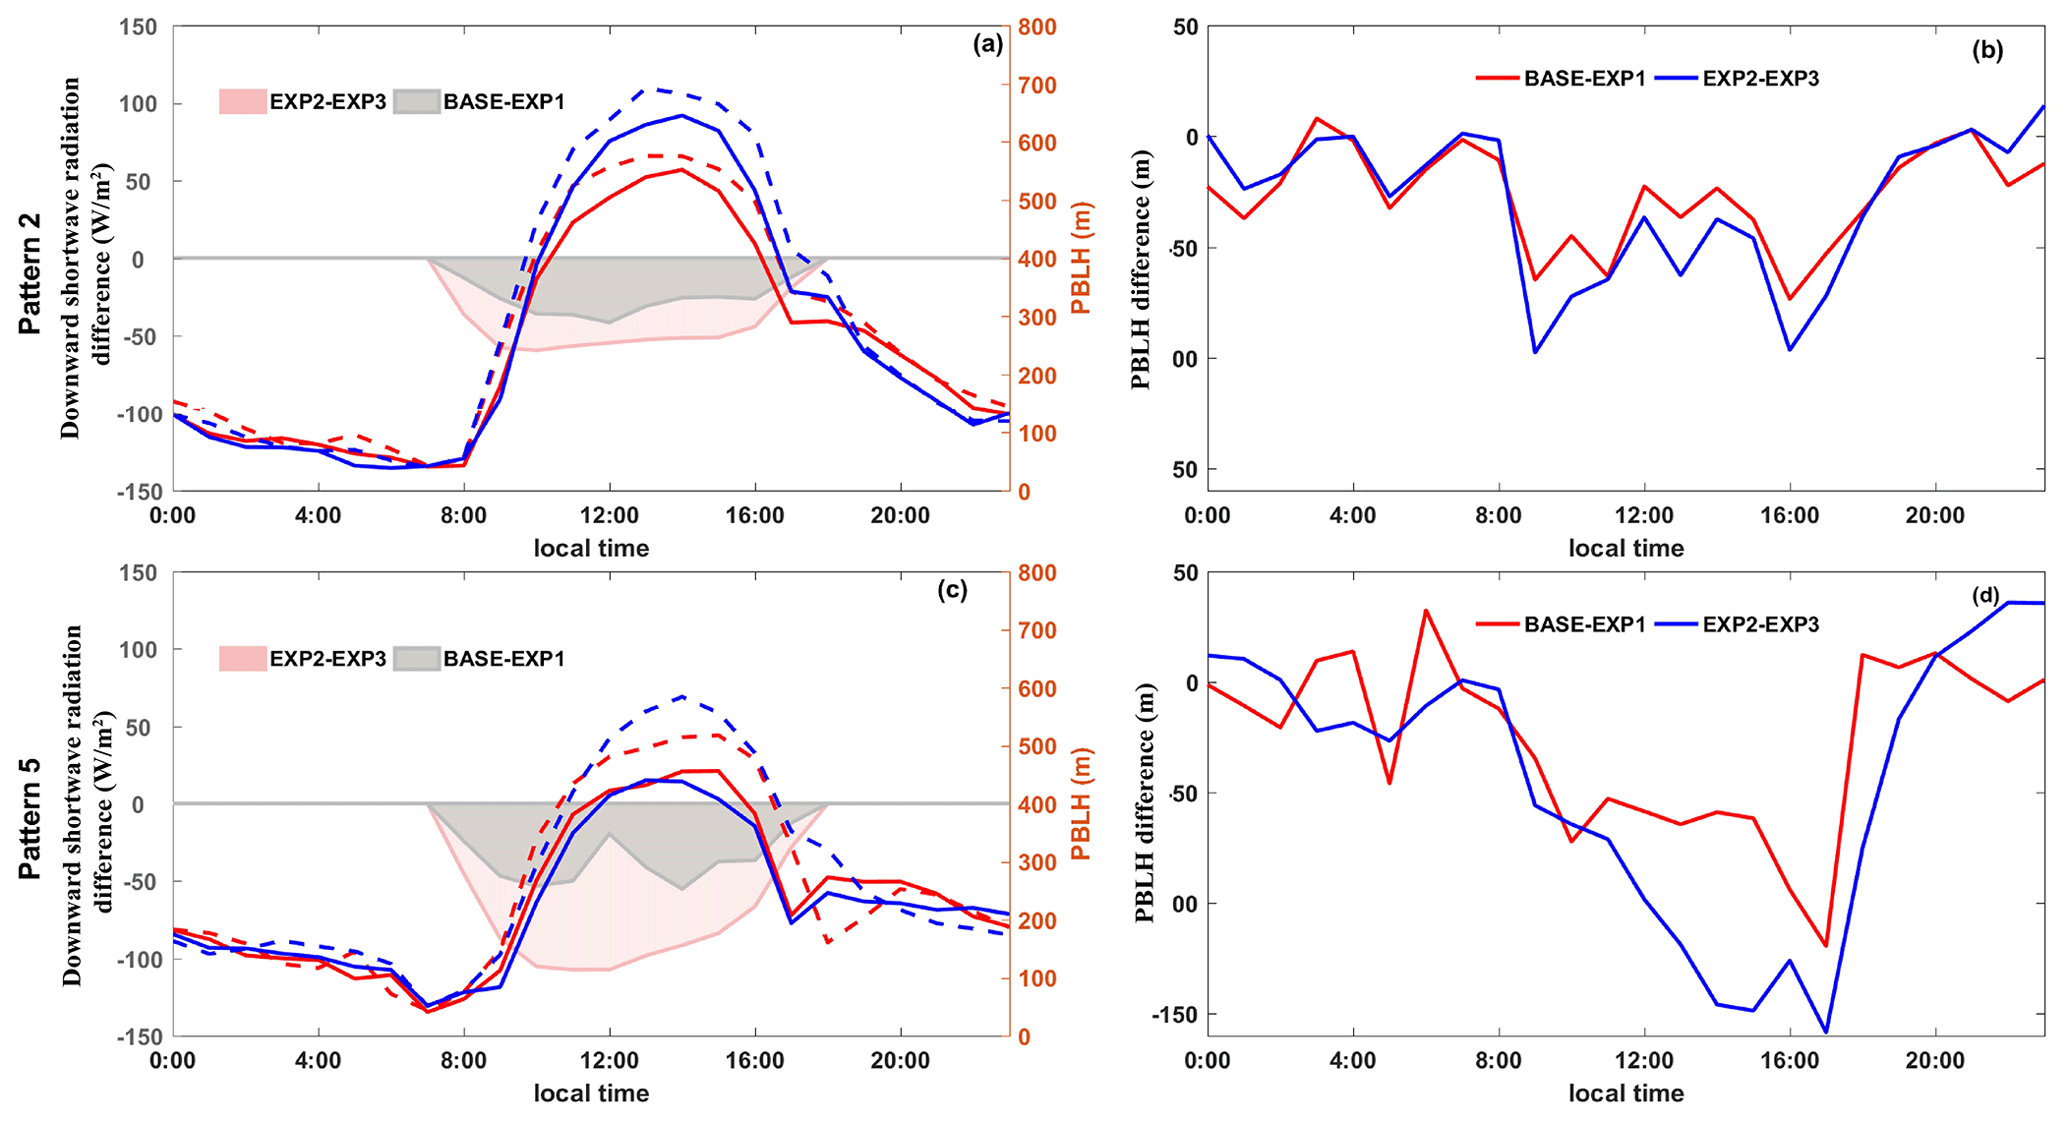
Figure 10Diurnal variations in (a, c) boundary layer height (lines) and downward solar radiation (shading), and (b, d) the perturbations of boundary layer height induced by ARI and ARI without CRI inhibition under Pattern 2 and Pattern 5 synoptic forcing, respectively.
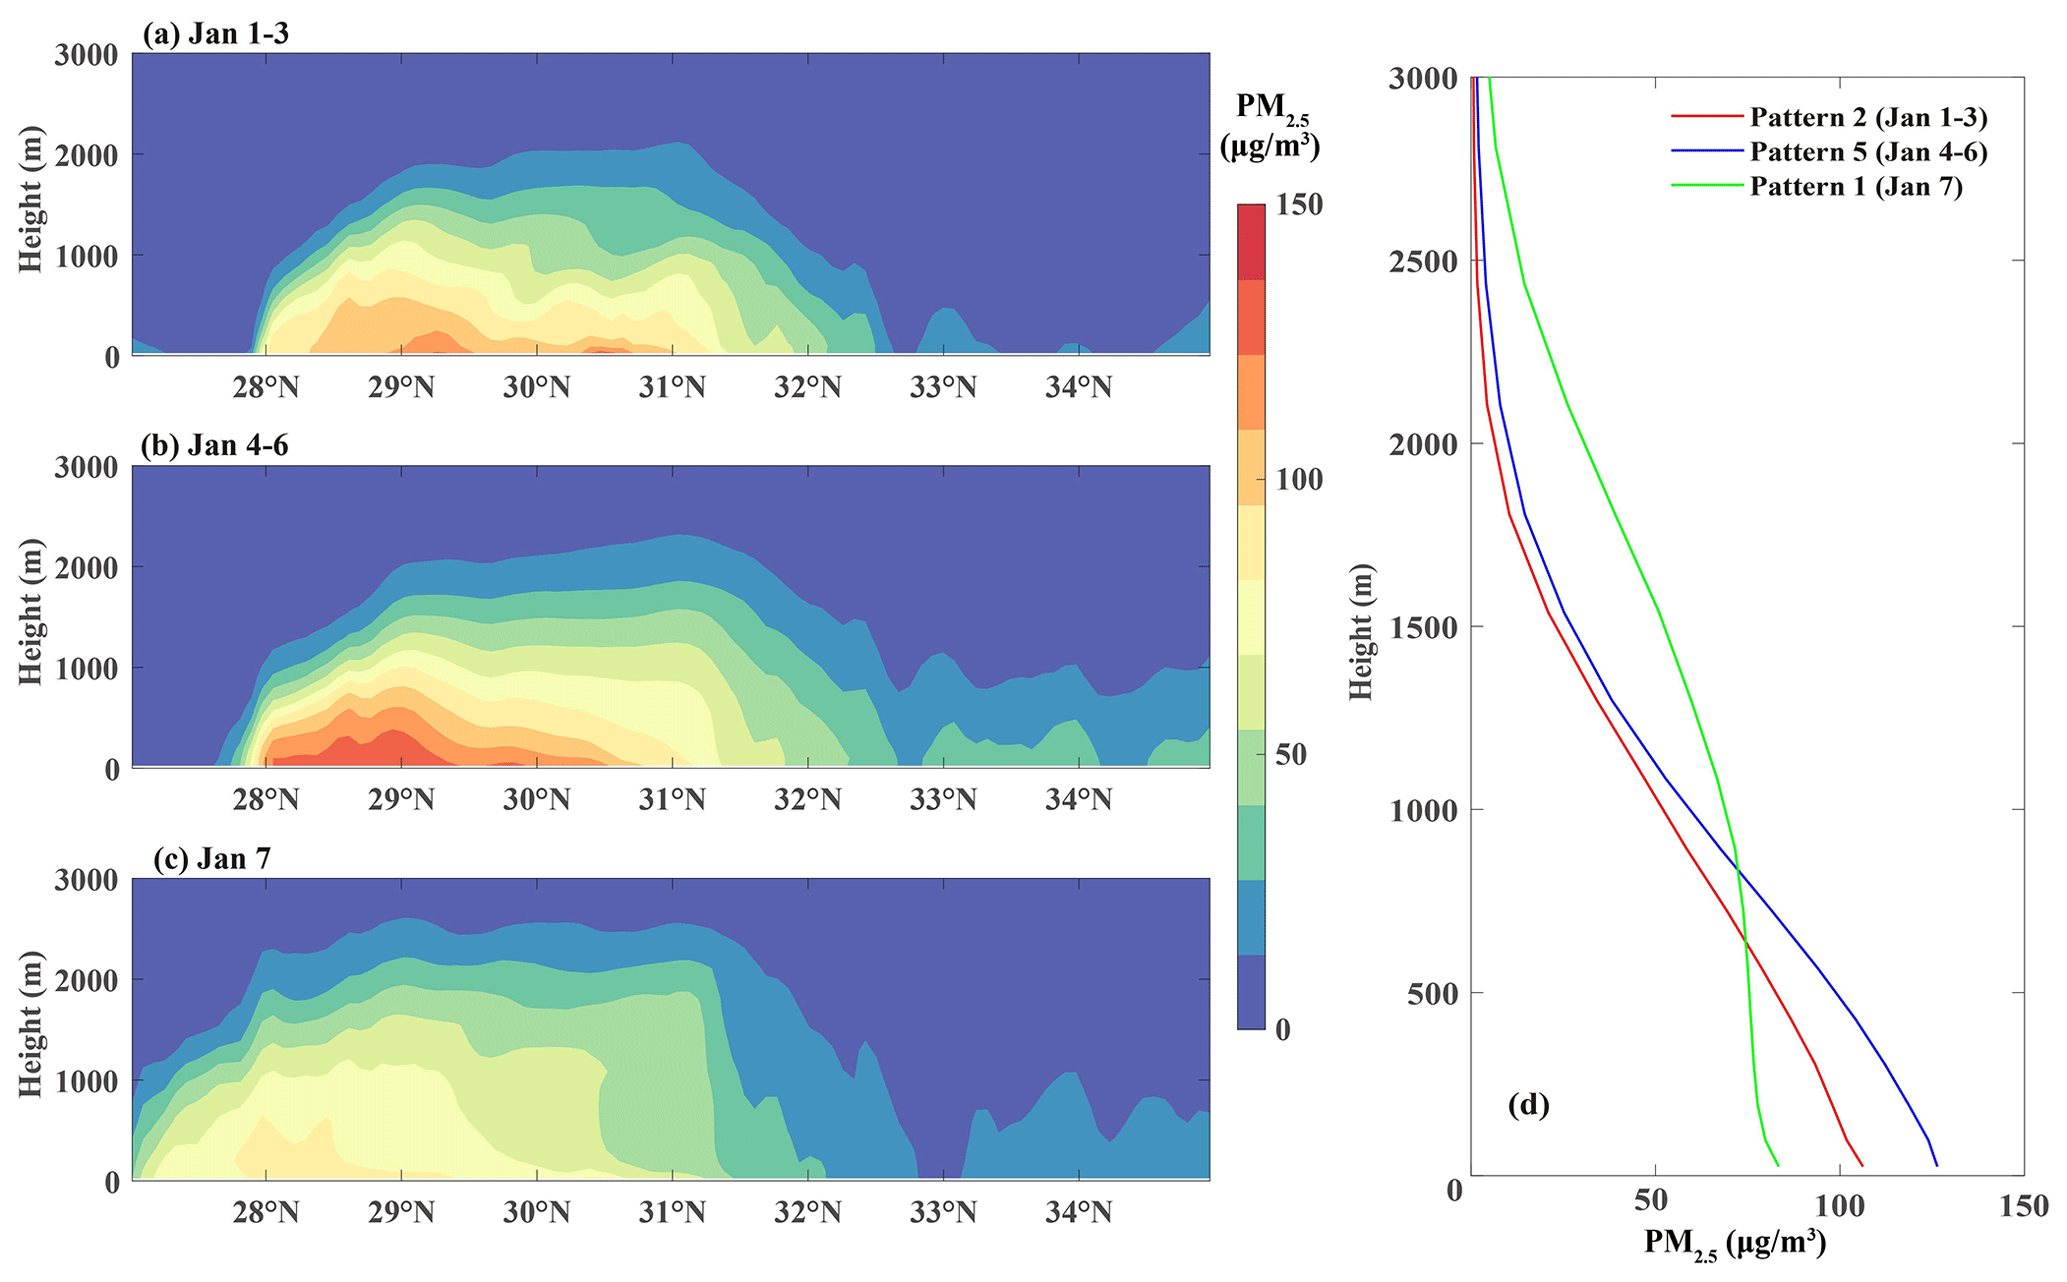
Figure 11Meridional vertical distribution of averaged PM2.5 between 104 and 105° E under (a) Pattern 2 and (b) Pattern 5 and (c) average profiles of PM2.5 within 28° and 31° N.
Using the western SCB, which exhibited the highest pollution concentration, as an example, Fig. 9 illustrates the vertical diurnal variations in temperature and solar radiation caused by the ARI. The results in Figs. 9–11 were derived from the simulation experiments in CD, as CD is one of the most polluted cities with typical meteorological and geographical characteristics of the western SCB. The ARI caused surface cooling in the morning and upper-air warming in the afternoon. As local solar radiation increased from 08:00 to 0:00, the reduction in solar radiation caused by the ARI also increased. Surface cooling reached its peak at approximately 10:00 to 0:00 and gradually weakened in the afternoon. This diurnal variation might be attributed to the enhanced turbulence during the morning PBL evolution (Wang et al., 2018). Afternoon surface cooling was partly compensated by the turbulent transport of warm air above the PBL. In addition, strong surface cooling between 17:00 and 20:00 in the SCB was possibly influenced by remarkable valley wind circulations forced by the Qinghai–Tibet Plateau adjacent to the western SCB (Lu et al., 2022). The evening cooling of the plateau induced strong mountain winds, promoting surface cooling, while the upper-layer warming mainly occurred around 1–1.5 km in the afternoon. In general, the ARI reduces solar radiation, causing surface cooling and upper-air warming, thereby regulating the vertical atmospheric thermal structure, suppressing convection, and consequently decreasing PBL heights (Fig. 10).
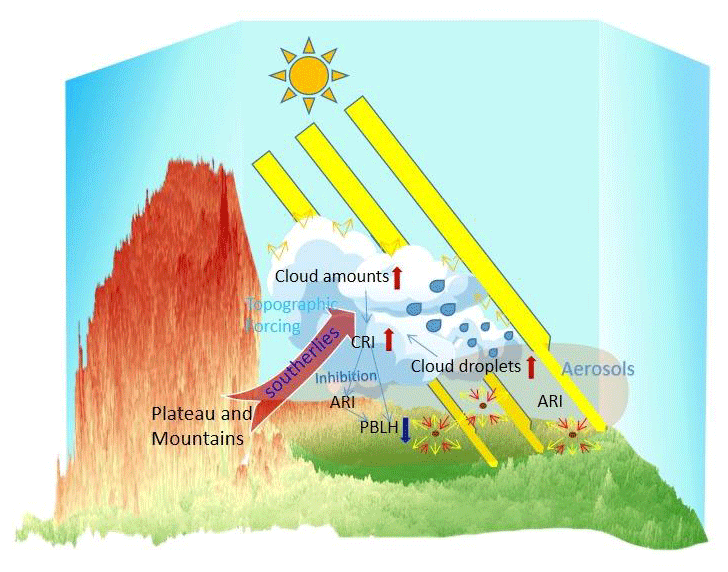
Figure 12The aerosol radiative effect can be significantly inhibited by clouds under the influence of pollution synoptic patterns with dense clouds.
Synoptic patterns play a role in the interaction between the ARI and PBL (Wang et al., 2018; Miao et al., 2020). Zonal average of PM2.5 concentration between 104 and 105° E was conducted, and the meridional vertical distribution of PM2.5 between 27 and 35° N was illustrated in Fig. 11a and b. Figure 11c provides an average of the PM2.5 concentration within 28 and 31° N, showing the vertical distribution profiles under Patterns 2 and 5. Due to the inhibition of the warm lid above the SCB, the vertical exchange was not prominent under both Patterns 2 and 5, and PM2.5 was more concentrated at the middle and lower levels. The PM2.5 concentration under Pattern 5 was higher than Pattern 2 throughout the atmospheric column, indicating stronger aerosol radiative forcing and a more significant impact on the boundary layer structure under Pattern 5. During 4–6 January, the surface cooling reached 1 K, with the cooling layers higher than those observed on 1–3 January. The differences in thermal structure modulations contributed to a lower diurnal PBLH in Pattern 5 than in Pattern 2 (Fig. 10a and c), indicating that Pattern 5 was more conducive to ARI. Based on the simulation experiments, this study further discussed the impact of synoptic forcing on the CRI inhibition of ARI. When the CRI was not considered, the solar radiation reduction at noon on 4–6 January by the ARI was nearly twice as high as when the CRI was considered. Correspondingly, surface cooling at noon was remarkably enhanced. In the evening, surface cooling occurred earlier and was stronger without the CRI (Fig. 9). The regulation of CRI on the ARI was further reflected by the changes in the PBLH. Without the CRI, the diurnal PBLH increased significantly, with the PBLH decreasing more with ARI without CRI inhibition. The PBLHs were decreased by the ARI during 13–17 January in the afternoon, reaching 2–3 times the decrease observed with CRI inhibition (Fig. 10). More significant CRI inhibition of ARI was revealed under Pattern 5 compared with that under Pattern 2, owing to the stronger ARI itself with higher aerosol concentrations in Pattern 5 and the more apparent CRI inhibition with denser cloud liquid water contents under the LT pattern (Fig. 5). Therefore, the intensity of CRI inhibition of ARI in the SCB was altered by synoptic forcing, with stronger effects under the influence of LT.
This study utilized synoptic classification and numerical simulation to gain insights in to the combined effects of synoptic patterns and CRI inhibition on the ARI and PBL structures in the wet and cloudy SCB. Based on the long-term PM2.5 observations and sounding data in the SCB, it was found that large-scale synoptic circulations at 850 hPa played crucial roles in the variations in PM2.5 pollution. Synoptic classification was performed with the T-PCA method, which revealed that Patterns 2 and 5 characterized with a low-pressure system and southerly airflow on 850 hPa were key synoptic patterns for the onset and accumulation of PM2.5, while Pattern 1 controlled by the northerly airflow represented a clean pattern associated with significant decrease in PM2.5. Moreover, it was indicated that Patterns 2 and 5 exhibited denser cloud liquid water content and were thus stronger compared to other patterns. Among these patterns, Pattern 5 exhibited the highest cloud liquid water content and CRI. This could be attributed to the robust southerly airflow induced by the dense isobaric lines which brought warm and humid air masses into the region.
To illustrate the interactions among cloud, aerosol, and PBL under pollution synoptic patterns, a pollution episode that occurred from 1 to 7 January 2017 was simulated using WRF-Chem. The simulation results showed that ARI remarkably reduced the solar radiation during the two pollution patterns. This reduction led to surface cooling in the morning and upper-air warming in the afternoon. Additionally, the enhanced evening surface cooling was impacted by the mountain–valley wind circulations forced by the plateau–basin topography of the SCB. This modulation in the vertical thermal structure by the ARI would then suppress the development of the PBL, favouring pollution outbreaks (Fig. 12). Furthermore, parallel simulation experiments indicated that CRI impacted the stratification stability and modulated the vertical thermal structure by inhibiting ARI (Fig. 12). Regarding the spatial distribution, a stronger ARI appeared in Chongqing, despite lower PM2.5 concentrations compared to the western and southern SCB. This was due to the lower cloud liquid water content and weaker CRI inhibition of ARI in Chongqing. When CRI inhibition was not considered, the ARI in the western and southern SCB was significantly stronger than that in Chongqing. In addition, under Pattern 5, the reduction in solar radiation and PBLH during the daytime due to ARI could be more than doubled when the CRI influence was neglected. This was primarily due to higher aerosol concentrations and cloud liquid water content associated with a low trough in Pattern 5. This study provided insights into the interaction among aerosols, clouds, and PBL under different synoptic patterns, considering the complex terrain and foggy/cloudy climate of the SCB. The findings highlighted the significant role of CRI inhibition on the ARI during wet and cloudy conditions, shedding light on the multi-scale atmospheric physical processes in the SCB.
The ERA5 pressure layer and single layer data can be, respectively, downloaded from https://cds.climate.copernicus.eu/cdsapp#!/dataset/reanalysis-era5-pressure-levels (ECMWF, 2024a) and https://cds.climate.copernicus.eu/cdsapp#!/dataset/reanalysis-era5-single-levels?tab=form (ECMWF, 2024b). The NCEP FNL data are available at https://rda.ucar.edu/datasets/ds083.2/ (NCEP, 2024). The MEIC data can be accessed at http://meicmodel.org/ (Tsinghua University, 2024). Air quality and meteorological monitoring data can be acquired from https://doi.org/10.7910/DVN/USX59F (Lu, 2023).
The supplement related to this article is available online at: https://doi.org/10.5194/acp-24-8963-2024-supplement.
HL and MX had the original idea for the study, designed the experiments, conducted the numerical simulation, and prepared the initial draft. BL, YZ, and KZ collected the data. DM helped to design the experiments and conduct the numerical simulation and reviewed the paper. TW and BZ helped perform the analysis with constructive discussions and reviewed and edited the paper. HL, MX, TW, and BL acquired financial support for the project leading to this publication. SL and ML reviewed the paper.
The contact author has declared that none of the authors has any competing interests.
Publisher's note: Copernicus Publications remains neutral with regard to jurisdictional claims made in the text, published maps, institutional affiliations, or any other geographical representation in this paper. While Copernicus Publications makes every effort to include appropriate place names, the final responsibility lies with the authors.
We would like to express our gratitude to the China National Environmental Monitoring Centre and China Meteorological Bureau for providing the monitoring data.
This work has been supported by the National Natural Science Foundation of China (grant nos. 42205186 and 42275102), the Chongqing Natural Science Foundation (grant no. cstc2021jcyj-msxmX1007), Special Science and Technology Innovation Program for Carbon Peak and Carbon Neutralization of Jiangsu Province (grant no. BE2022612), the Key Technology Research and Development of Chongqing Meteorological Bureau (grant nos. YWJSGG-202215 and YWJSGG-202303), the Natural Science Foundation of Jiangsu Province (grant no. BK20211158), and the Research Start-Up Fund for the Talented Person Recruitment of Nanjing Normal University (grant no. 184080H201B57).
This paper was edited by Zhanqing Li and reviewed by four anonymous referees.
Alexeeff, S. E., Deosaransingh, K., Liao, N. S., Van Den Eeden, S. K., Schwartz, J., and Sidney, S.: Particulate Matter and Cardiovascular Risk in Adults with Chronic Obstructive Pulmonary Disease, Am. J. Res. Crit. Care, 204, 159–167, https://doi.org/10.1164/rccm.202007-2901OC, 2021.
Archer-Nicholls, S., Lowe, D., Schultz, D. M., and McFiggans, G.: Aerosol–radiation–cloud interactions in a regional coupled model: the effects of convective parameterisation and resolution, Atmos. Chem. Phys., 16, 5573–5594, https://doi.org/10.5194/acp-16-5573-2016, 2016.
Cao, S., Zhang, S., Gao, C., Yan, Y., Bao, J., Su, L., Liu, M., Peng, N., and Liu, M.: A long-term analysis of atmospheric black carbon MERRA-2 concentration over China during 1980–2019, Atmos. Environ., 264, 118662, https://doi.org/10.1016/j.atmosenv.2021.118662, 2021.
Che, H., Xia, X., Zhao, H., Dubovik, O., Holben, B. N., Goloub, P., Cuevas-Agulló, E., Estelles, V., Wang, Y., Zhu, J., Qi, B., Gong, W., Yang, H., Zhang, R., Yang, L., Chen, J., Wang, H., Zheng, Y., Gui, K., Zhang, X., and Zhang, X.: Spatial distribution of aerosol microphysical and optical properties and direct radiative effect from the China Aerosol Remote Sensing Network, Atmos. Chem. Phys., 19, 11843–11864, https://doi.org/10.5194/acp-19-11843-2019, 2019.
Ding, A. J., Huang, X., Nie, W., Sun, J. N., Kerminen, V.-M., Petäjä, T., Su, H., Cheng, Y. F., Yang, X.-Q., Wang, M. H., Chi, X. G., Wang, J. P., Virkkula, A., Guo, W. D., Yuan, J., Wang, S. Y., Zhang, R. J., Wu, Y. F., Song, Y., Zhu, T., Zilitinkevich, S., Kulmala, M., and Fu, C. B.: Enhanced haze pollution by black carbon in megacities in China, Geophys. Res. Lett., 43, 2873–2879, https://doi.org/10.1002/2016GL067745, 2016.
ECMWF: Part IV: Physical processes, in: IFS documentation CY43R3, European Centre for Medium-Range Weather Forecasts, England, https://www.ecmwf.int/node/17736 (last access: 7 August 2024), 1–221, 2017.
ECMWF: The ERA5 pressure layer data set, ECMWF [data set], https://cds.climate.copernicus.eu/cdsapp#!/dataset/reanalysis-era5-pressure-levels, last access: 7 August 2024a.
ECMWF: The ERA5 single layer data set, ECMWF [data set], https://cds.climate.copernicus.eu/cdsapp#!/dataset/reanalysis-era5-single-levels?tab=form, last access: 7 August 2024b.
Eresmaa, N., Karppinen, A., Joffre, S. M., Räsänen, J., and Talvitie, H.: Mixing height determination by ceilometer, Atmos. Chem. Phys., 6, 1485–1493, https://doi.org/10.5194/acp-6-1485-2006, 2006.
Fast, J. D., Gustafson Jr., W. I., Easter, R. C., Zaveri, R. A., Barnard, J. C., Chapman, E. G., Grell, G. A., and Peckham, S. E.: Evolution of ozone, particulates, and aerosol direct radiative forcing in the vicinity of Houston using a fully coupled meteorology-chemistry-aerosol model, J. Geophys. Res.-Atmos., 111, D21305, https://doi.org/10.1029/2005JD006721, 2006.
Feng, X., Wei, S., and Wang, S.: Temperature inversions in the atmospheric boundary layer and lower troposphere over the Sichuan Basin, China: Climatology and impacts on air pollution, Sci. Total Environ., 726, 138579, https://doi.org/10.1016/j.scitotenv.2020.138579, 2020.
Gao, D., Zhao, B., Wang, S., Wang, Y., Gaudet, B., Zhu, Y., Wang, X., Shen, J., Li, S., He, Y., Yin, D., and Dong, Z.: Increased importance of aerosol–cloud interactions for surface PM2.5 pollution relative to aerosol–radiation interactions in China with the anthropogenic emission reductions, Atmos. Chem. Phys., 23, 14359–14373, https://doi.org/10.5194/acp-23-14359-2023, 2023.
Garratt, J. R.: Review: the atmospheric boundary layer, Earth-Sci. Rev., 37, 89-134, https://doi.org/10.1016/0012-8252(94)90026-4, 1994.
Grell, G. A. and Freitas, S. R.: A scale and aerosol aware stochastic convective parameterization for weather and air quality modeling, Atmos. Chem. Phys., 14, 5233–5250, https://doi.org/10.5194/acp-14-5233-2014, 2014.
Grell, G. A., Peckham, S. E., Schmitz, R., McKeen, S. A., Frost, G., Skamarock, W. C., and Eder, B.: Fully coupled “online” chemistry within the WRF model, Atmos. Environ., 39, 6957–6975, https://doi.org/10.1016/j.atmosenv.2005.04.027, 2005.
Guenther, A., Karl, T., Harley, P., Wiedinmyer, C., Palmer, P. I., and Geron, C.: Estimates of global terrestrial isoprene emissions using MEGAN (Model of Emissions of Gases and Aerosols from Nature), Atmos. Chem. Phys., 6, 3181–3210, https://doi.org/10.5194/acp-6-3181-2006, 2006.
Guo, J., Miao, Y., Zhang, Y., Liu, H., Li, Z., Zhang, W., He, J., Lou, M., Yan, Y., Bian, L., and Zhai, P.: The climatology of planetary boundary layer height in China derived from radiosonde and reanalysis data, Atmos. Chem. Phys., 16, 13309–13319, https://doi.org/10.5194/acp-16-13309-2016, 2016.
Haywood, J. M., Abel, S. J., Barrett, P. A., Bellouin, N., Blyth, A., Bower, K. N., Brooks, M., Carslaw, K., Che, H., Coe, H., Cotterell, M. I., Crawford, I., Cui, Z., Davies, N., Dingley, B., Field, P., Formenti, P., Gordon, H., de Graaf, M., Herbert, R., Johnson, B., Jones, A. C., Langridge, J. M., Malavelle, F., Partridge, D. G., Peers, F., Redemann, J., Stier, P., Szpek, K., Taylor, J. W., Watson-Parris, D., Wood, R., Wu, H., and Zuidema, P.: The CLoud–Aerosol–Radiation Interaction and Forcing: Year 2017 (CLARIFY-2017) measurement campaign, Atmos. Chem. Phys., 21, 1049–1084, https://doi.org/10.5194/acp-21-1049-2021, 2021.
Hong, S.-Y., Noh, Y., and Dudhia, J.: A New Vertical Diffusion Package with an Explicit Treatment of Entrainment Processes, Mon. Weather Rev., 134, 2318–2341, https://doi.org/10.1175/MWR3199.1, 2006.
Hu, J., Zhao, T., Liu, J., Cao, L., Xia, J., Wang, C., Zhao, X., Gao, Z., Shu, Z., and Li, Y.: Nocturnal surface radiation cooling modulated by cloud cover change reinforces PM2.5 accumulation: Observational study of heavy air pollution in the Sichuan Basin, Southwest China, Sci. Total Environ., 794, 148624, https://doi.org/10.1016/j.scitotenv.2021.148624, 2021.
Huang, H.-Y., Wang, S.-H., Huang, W. X., Lin, N.-H., Chuang, M.-T., Silva, A., and Peng, C. M.: Influence of Synoptic‐Dynamic Meteorology on the Long‐Range Transport of Indochina Biomass Burning Aerosols, J. Geophys. Res.-Atmos., 125, e2019JD031260, https://doi.org/10.1029/2019JD031260, 2020.
Huth, R.: AN INTERCOMPARISON OF COMPUTER-ASSISTED CIRCULATION CLASSIFICATION METHODS, Int. J. Climatol., 16, 893–922, https://doi.org/10.1002/(SICI)1097-0088(199608)16:8<893::AID-JOC51>3.0.CO;2-Q, 1996.
Huth, R., Beck, C., Philipp, A., Demuzere, M., Ustrnul, Z., Cahynová, M., Kyselý, J., and Tveito, O. E.: Classifications of Atmospheric Circulation Patterns, Ann. N. Y. Acad. Sci., 1146, 105–152, https://doi.org/10.1196/annals.1446.019, 2008.
Iacono, M. J., Delamere, J. S., Mlawer, E. J., Shephard, M. W., Clough, S. A., and Collins, W. D.: Radiative forcing by long-lived greenhouse gases: Calculations with the AER radiative transfer models, J. Geophys. Res.-Atmos., 113, D13103, https://doi.org/10.1029/2008JD009944, 2008.
Jiang, Y., Xin, J., Zhao, D., Jia, D., Tang, G., Quan, J., Wang, M., and Dai, L.: Analysis of differences between thermodynamic and material boundary layer structure: Comparison of detection by ceilometer and microwave radiometer, Atmos. Res., 248, 105179, https://doi.org/10.1016/j.atmosres.2020.105179, 2021.
Jiménez, P. A. and Dudhia, J.: Improving the Representation of Resolved and Unresolved Topographic Effects on Surface Wind in the WRF Model, J. Appl. Meteorol. Clim., 51, 300–316, https://doi.org/10.1175/JAMC-D-11-084.1, 2012.
Lee, K., Park, J., Kang, M., Kim, D., Batmunkh, T., Bae, M.-S., and Park, K.: Chemical Characteristics of Aerosols in Coastal and Urban Ambient Atmospheres, Aerosol Air Qual. Res., 17, 908–919, https://doi.org/10.4209/aaqr.2016.08.0342, 2017.
Li, J., Wu, M., Li, Y., Ma, S., Wang, Z., Zhao, Y., Lian, L., Song, S., Huang, T., Gao, H., Tao, S., Liu, J., Mao, X., and Ma, J.: Reinforcement of Secondary Circulation by Aerosol Feedback and PM2.5 Vertical Exchange in the Atmospheric Boundary Layer, Geophys. Res. Lett., 48, e2021GL094465, https://doi.org/10.1029/2021GL094465, 2021.
Li, K., Liao, H., Mao, Y., and Ridley, D. A.: Source sector and region contributions to concentration and direct radiative forcing of black carbon in China, Atmos. Environ., 124, 351–366, https://doi.org/10.1016/j.atmosenv.2015.06.014, 2016.
Li, X., Miao, Y., Ma, Y., Wang, Y., and Zhang, Y.: Impacts of synoptic forcing and topography on aerosol pollution during winter in Shenyang, Northeast China, Atmos. Res., 262, 105764, https://doi.org/10.1016/j.atmosres.2021.105764, 2021.
Li, Z., Wang, Y., Guo, J., Zhao, C., Cribb, M. C., Dong, X., Fan, J., Gong, D., Huang, J., Jiang, M., Jiang, Y., Lee, S. S., Li, H., Li, J., Liu, J., Qian, Y., Rosenfeld, D., Shan, S., Sun, Y., Wang, H., Xin, J., Yan, X., Yang, X., Yang, X.-q., Zhang, F., and Zheng, Y.: East Asian Study of Tropospheric Aerosols and their Impact on Regional Clouds, Precipitation, and Climate (EAST-AIRCPC), J. Geophys. Res.-Atmos., 124, 13026–13054, https://doi.org/10.1029/2019JD030758, 2019.
Lohmann, U. and Feichter, J.: Global indirect aerosol effects: a review, Atmos. Chem. Phys., 5, 715–737, https://doi.org/10.5194/acp-5-715-2005, 2005.
Lu, H.: Dataset-Cloud significantly inhibit aerosol radiative effect under typical pollution synopitc partterns in Sichuan Basin, China (V1), Harvard Dataverse [dataset], https://doi.org/10.7910/DVN/USX59F, 2023.
Lu, H., Xie, M., Liu, X., Liu, B., Jiang, M., Gao, Y., and Zhao, X.: Adjusting prediction of ozone concentration based on CMAQ model and machine learning methods in Sichuan-Chongqing region, China, Atmos. Pollut. Res., 12, 101066, https://doi.org/10.1016/j.apr.2021.101066, 2021.
Lu, H., Xie, M., Liu, B., Liu, X., Feng, J., Yang, F., Zhao, X., You, T., Wu, Z., and Gao, Y.: Impact of atmospheric thermodynamic structures and aerosol radiation feedback on winter regional persistent heavy particulate pollution in the Sichuan–Chongqing region, China, Sci. Total Environ., 842, 156575, https://doi.org/10.1016/j.scitotenv.2022.156575, 2022.
Luo, M., Hou, X., Gu, Y., Lau, N.-C., and Yim, S. H. L.: Trans-boundary air pollution in a city under various atmospheric conditions, Sci. Total Environ., 618, 132–141, https://doi.org/10.1016/j.scitotenv.2017.11.001, 2018.
Miao, Y., Guo, J., Liu, S., Liu, H., Li, Z., Zhang, W., and Zhai, P.: Classification of summertime synoptic patterns in Beijing and their associations with boundary layer structure affecting aerosol pollution, Atmos. Chem. Phys., 17, 3097–3110, https://doi.org/10.5194/acp-17-3097-2017, 2017.
Miao, Y., Che, H., Zhang, X., and Liu, S.: Integrated impacts of synoptic forcing and aerosol radiative effect on boundary layer and pollution in the Beijing–Tianjin–Hebei region, China, Atmos. Chem. Phys., 20, 5899–5909, https://doi.org/10.5194/acp-20-5899-2020, 2020.
Nandan, R., Ratnam, M. V., Kiran, V. R., and Naik, D. N.: Retrieval of cloud liquid water path using radiosonde measurements: Comparison with MODIS and ERA5, J. Atmos. Sol.-Terr. Phy., 227, 105799, https://doi.org/10.1016/j.jastp.2021.105799, 2022.
NCEP: FNL data set, NCEP [data set], https://rda.ucar.edu/datasets/ds083.2/, last access: 7 August 2024.
Nichol, J., Bilal, M., Ali, M., and Qiu, Z.: Air Pollution Scenario over China during COVID-19, Remote Sensing, 12, 2100, https://doi.org/10.3390/rs12132100, 2020.
Ning, G., Wang, S., Ma, M., Ni, C., Shang, Z., Wang, J., and Li, J.: Characteristics of air pollution in different zones of Sichuan Basin, China, Sci. Total Environ., 612, 975–984, https://doi.org/10.1016/j.scitotenv.2017.08.205, 2018.
Ning, G., Yim, S. H. L., Wang, S., Duan, B., Nie, C., Yang, X., Wang, J., and Shang, K.: Synergistic effects of synoptic weather patterns and topography on air quality: a case of the Sichuan Basin of China, Clim. Dynam., 53, 6729–6744, https://doi.org/10.1007/s00382-019-04954-3, 2019.
Ojo, J. S., Ayeni, D., and Ogunjo, S. T.: Comparative analysis between ERA5 reanalysis data and MRR observation data at different altitudes for fall velocity and liquid water content, Adv. Space Res., 72, 2217–2225, https://doi.org/10.1016/j.asr.2023.05.045, 2023.
Painemal, D., Chellappan, S., Smith Jr., W. L., Spangenberg, D., Park, J. M., Ackerman, A., Chen, J., Crosbie, E., Ferrare, R., Hair, J., Kirschler, S., Li, X.-Y., McComiskey, A., Moore, R. H., Sanchez, K., Sorooshian, A., Tornow, F., Voigt, C., Wang, H., Winstead, E., Zeng, X., Ziemba, L., and Zuidema, P.: Wintertime Synoptic Patterns of Midlatitude Boundary Layer Clouds Over the Western North Atlantic: Climatology and Insights From In Situ ACTIVATE Observations, J. Geophys. Res.-Atmos., 128, e2022JD037725, https://doi.org/10.1029/2022JD037725, 2023.
Peng, J., Hu, M., Shang, D., Wu, Z., Du, Z., Tan, T., Wang, Y., Zhang, F., and Zhang, R.: Explosive Secondary Aerosol Formation during Severe Haze in the North China Plain, Environ. Sci. Technol., 55, 2189–2207, https://doi.org/10.1021/acs.est.0c07204, 2021.
Pilinis, C., Seinfeld, J. H., and Grosjean, D.: Water content of atmospheric aerosols, Atmos. Environ., 23, 1601–1606, https://doi.org/10.1016/0004-6981(89)90419-8, 1989.
Possner, A., Zubler, E., Lohmann, U., and Schär, C.: Real-case simulations of aerosol–cloud interactions in ship tracks over the Bay of Biscay, Atmos. Chem. Phys., 15, 2185–2201, https://doi.org/10.5194/acp-15-2185-2015, 2015.
Qi, N., Tan, X., Wu, T., Tang, Q., Ning, F., Jiang, D., Xu, T., Wu, H., Ren, L., and Deng, W.: Temporal and Spatial Distribution Analysis of Atmospheric Pollutants in Chengdu–Chongqing Twin-City Economic Circle, J. Environ. Res. Public Health, 19, 4333, https://doi.org/10.3390/ijerph19074333, 2022.
Rosenfeld, D., Lohmann, U., Raga, G. B., O'Dowd, C. D., Kulmala, M., Fuzzi, S., Reissell, A., and Andreae, M. O.: Flood or Drought: How Do Aerosols Affect Precipitation?, Science, 321, 1309–1313, https://doi.org/10.1126/science.1160606, 2008.
Schell, B., Ackermann, I. J., Hass, H., Binkowski, F. S., and Ebel, A.: Modeling the formation of secondary organic aerosol within a comprehensive air quality model system, J. Geophys. Res.-Atmos., 106, 28275–28293, https://doi.org/10.1029/2001JD000384, 2001.
Seibert, P., Beyrich, F., Gryning, S.-E., Joffre, S., Rasmussen, A., and Tercier, P.: Review and intercomparison of operational methods for the determination of the mixing height, Atmos. Environ., 34, 1001–1027, https://doi.org/10.1016/S1352-2310(99)00349-0, 2000.
Seidel, D. J., Ao, C. O., and Li, K.: Estimating climatological planetary boundary layer heights from radiosonde observations: Comparison of methods and uncertainty analysis, J. Geophys. Res.-Atmos., 115, D16113, https://doi.org/10.1029/2009JD013680, 2010.
Shu, L., Xie, M., Gao, D., Wang, T., Fang, D., Liu, Q., Huang, A., and Peng, L.: Regional severe particle pollution and its association with synoptic weather patterns in the Yangtze River Delta region, China, Atmos. Chem. Phys., 17, 12871–12891, https://doi.org/10.5194/acp-17-12871-2017, 2017.
Shu, Z., Liu, Y., Zhao, T., Xia, J., Wang, C., Cao, L., Wang, H., Zhang, L., Zheng, Y., Shen, L., Luo, L., and Li, Y.: Elevated 3D structures of PM2.5 and impact of complex terrain-forcing circulations on heavy haze pollution over Sichuan Basin, China, Atmos. Chem. Phys., 21, 9253–9268, https://doi.org/10.5194/acp-21-9253-2021, 2021.
Skamarock, W. C., Klemp, J. B., Dudhia, J., Gill, D. O., Barker, D. M., Duda, M. G., Huang, X.-Y., Wang, W., and Powers, J. G.: A Description of the Advanced Research WRF Version 3, NCAR Technical Note NCAR/TN-475+STR, June 2008, Mesoscale and Microscale Meteorology Division, National Center for Atmospheric Research, Boulder, 475, 1, https://doi.org/10.5065/d68s4mvh, 2008.
Stockwell, W. R., Middleton, P., Chang, J. S., and Tang, X.: The second generation regional acid deposition model chemical mechanism for regional air quality modeling, J. Geophys. Res.-Atmos., 95, 16343–16367, https://doi.org/10.1029/JD095iD10p16343, 1990.
Stull, R. B. (Ed.): An Introduction to Boundary Layer Meteorology, Springer Netherlands, Dordrecht, 1988.
Tewari, M., Chen, F., Wang, W., Dudhia, J., LeMone, M., Mitchell, K., Ek, M., Gayno, G., and Wegiel, J.: Implementation and verification of the unified NOAH land surface model in the WRF model (Formerly Paper Number 17.5), Proceedings of the 20th conference on weather analysis and forecasting/16th conference on numerical weather prediction, Seattle, WA, USA, 11–15, 2004.
Tsinghua University: MEIC data set, Tsinghua University [data set], http://meicmodel.org/, last access: 7 August 2024.
Twomey, S.: The Influence of Pollution on the Shortwave Albedo of Clouds, J. Atmos. Sci., 34, 1149–1152, https://doi.org/10.1175/1520-0469(1977)034<1149:TIOPOT>2.0.CO;2, 1977.
Wang, D., Jensen, M. P., Taylor, D., Kowalski, G., Hogan, M., Wittemann, B. M., Rakotoarivony, A., Giangrande, S. E., and Park, J. M.: Linking Synoptic Patterns to Cloud Properties and Local Circulations Over Southeastern Texas, J. Geophys. Res.-Atmos., 127, e2021JD035920, https://doi.org/10.1029/2021JD035920, 2022.
Wang, P., Qiao, X., and Zhang, H.: Modeling PM2.5 and O3 with aerosol feedbacks using WRF/Chem over the Sichuan Basin, southwestern China, Chemosphere, 254, 126735, https://doi.org/10.1016/j.chemosphere.2020.126735, 2020.
Wang, Y., Gao, W., Wang, S., Song, T., Gong, Z., Ji, D., Wang, L., Liu, Z., Tang, G., Huo, Y., Tian, S., Li, J., Li, M., Yang, Y., Chu, B., Petäjä, T., Kerminen, V.-M., He, H., Hao, J., Kulmala, M., Wang, Y., and Zhang, Y.: Contrasting trends of PM2.5 and surface-ozone concentrations in China from 2013 to 2017, Natl. Sci. Rev., 7, 1331–1339, https://doi.org/10.1093/nsr/nwaa032, 2020.
Wang, Z., Huang, X., and Ding, A.: Dome effect of black carbon and its key influencing factors: a one-dimensional modelling study, Atmos. Chem. Phys., 18, 2821–2834, https://doi.org/10.5194/acp-18-2821-2018, 2018.
Wu, Z., Xie, M., Gao, Y., Lu, H., Zhao, L., and Gao, S.: Inversion of SO2 Emissions over Chongqing with Ensemble Square Root Kalman Filter, Res. Environ. Sci., 31, 25–33, https://doi.org/10.13198/j.issn.1001-6929.2017.03.47, 2018.
Xie, M., Liao, J., Wang, T., Zhu, K., Zhuang, B., Han, Y., Li, M., and Li, S.: Modeling of the anthropogenic heat flux and its effect on regional meteorology and air quality over the Yangtze River Delta region, China, Atmos. Chem. Phys., 16, 6071–6089, https://doi.org/10.5194/acp-16-6071-2016, 2016a.
Xie, M., Zhu, K., Wang, T., Feng, W., Gao, D., Li, M., Li, S., Zhuang, B., Han, Y., Chen, P., and Liao, J.: Changes in regional meteorology induced by anthropogenic heat and their impacts on air quality in South China, Atmos. Chem. Phys., 16, 15011–15031, https://doi.org/10.5194/acp-16-15011-2016, 2016b.
Yang, D. and Wang, P.: Characteristics of Vertical Distributions of Cloud Water Contents over China during Summer, Chinese Journal of Atmospheric Sciences, 36, 89–101, 2012.
Yang, T., Chen, R., Gu, X., Xu, J., Yang, L., Zhao, J., Zhang, X., Bai, C., Kang, J., Ran, P., Shen, H., Wen, F., Huang, K., Chen, Y., Sun, T., Shan, G., Lin, Y., Wu, S., Zhu, J., Wang, R., Shi, Z., Xu, Y., Ye, X., Song, Y., Wang, Q., Zhou, Y., Ding, L., Yang, T., Yao, W., Guo, Y., Xiao, F., Lu, Y., Peng, X., Zhang, B., Xiao, D., Wang, Z., Zhang, H., Bu, X., Zhang, X., An, L., Zhang, S., Cao, Z., Zhan, Q., Yang, Y., Liang, L., Cao, B., Dai, H., van Donkelaar, A., Martin, R. V., Wu, T., He, J., Kan, H., and Wang, C.: Association of fine particulate matter air pollution and its constituents with lung function: The China Pulmonary Health study, Environ. Int., 156, 106707, https://doi.org/10.1016/j.envint.2021.106707, 2021.
Yao, B., Liu, C., Yin, Y., Liu, Z., Shi, C., Iwabuchi, H., and Weng, F.: Evaluation of cloud properties from reanalyses over East Asia with a radiance-based approach, Atmos. Meas. Tech., 13, 1033–1049, https://doi.org/10.5194/amt-13-1033-2020, 2020.
Yu, R., Wang, B., and Zhou, T.: Climate Effects of the Deep Continental Stratus Clouds Generated by the Tibetan Plateau, J. Climate, 17, 2702–2713, https://doi.org/10.1175/1520-0442(2004)017<2702:CEOTDC>2.0.CO;2, 2004.
Zhan, C., Xie, M., Lu, H., Liu, B., Wu, Z., Wang, T., Zhuang, B., Li, M., and Li, S.: Impacts of urbanization on air quality and the related health risks in a city with complex terrain, Atmos. Chem. Phys., 23, 771–788, https://doi.org/10.5194/acp-23-771-2023, 2023.
Zhan, C.-C., Xie, M., Fang, D.-X., Wang, T.-J., Wu, Z., Lu, H., Li, M.-M., Chen, P.-L., Zhuang, B.-L., Li, S., Zhang, Z.-Q., Gao, D., Ren, J.-Y., and Zhao, M.: Synoptic weather patterns and their impacts on regional particle pollution in the city cluster of the Sichuan Basin, China, Atmos. Environ., 208, 34–47, https://doi.org/10.1016/j.atmosenv.2019.03.033, 2019.
Zhang, S., Zeng, G., Wang, T., Yang, X., and Iyakaremye, V.: Three dominant synoptic atmospheric circulation patterns influencing severe winter haze in eastern China, Atmos. Chem. Phys., 22, 16017–16030, https://doi.org/10.5194/acp-22-16017-2022, 2022.
Zhang, Z., Xue, T., and Jin, X.: Effects of meteorological conditions and air pollution on COVID-19 transmission: Evidence from 219 Chinese cities, Sci. Total Environ., 741, 140244, https://doi.org/10.1016/j.scitotenv.2020.140244, 2020.
Zhao, B., Liou, K.-N., Gu, Y., Li, Q., Jiang, J. H., Su, H., He, C., Tseng, H.-L. R., Wang, S., Liu, R., Qi, L., Lee, W.-L., and Hao, J.: Enhanced PM2.5 pollution in China due to aerosol–cloud interactions, Sci. Rep.-UK, 7, 4453, https://doi.org/10.1038/s41598-017-04096-8, 2017.
Zhao, C., Yang, Y., Fan, H., Huang, J., Fu, Y., Zhang, X., Kang, S., Cong, Z., Letu, H., and Menenti, M.: Aerosol characteristics and impacts on weather and climate over the Tibetan Plateau, Natl. Sci. Rev., 7, 492–495, https://doi.org/10.1093/nsr/nwz184, 2020.
Zhao, S., Yu, Y., Yin, D., Qin, D., He, J., and Dong, L.: Spatial patterns and temporal variations of six criteria air pollutants during 2015 to 2017 in the city clusters of Sichuan Basin, China, Sci. Total Environ., 624, 540–557, https://doi.org/10.1016/j.scitotenv.2017.12.172, 2018.
Zhong, J., Zhang, X., Dong, Y., Wang, Y., Liu, C., Wang, J., Zhang, Y., and Che, H.: Feedback effects of boundary-layer meteorological factors on cumulative explosive growth of PM2.5 during winter heavy pollution episodes in Beijing from 2013 to 2016, Atmos. Chem. Phys., 18, 247–258, https://doi.org/10.5194/acp-18-247-2018, 2018.
Zhong, J., Zhang, X., Wang, Y., Wang, J., Shen, X., Zhang, H., Wang, T., Xie, Z., Liu, C., Zhang, H., Zhao, T., Sun, J., Fan, S., Gao, Z., Li, Y., and Wang, L.: The two-way feedback mechanism between unfavorable meteorological conditions and cumulative aerosol pollution in various haze regions of China, Atmos. Chem. Phys., 19, 3287–3306, https://doi.org/10.5194/acp-19-3287-2019, 2019.
Zhu, W., Xu, X., Zheng, J., Yan, P., Wang, Y., and Cai, W.: The characteristics of abnormal wintertime pollution events in the Jing-Jin-Ji region and its relationships with meteorological factors, Sci. Total Environ., 626, 887–898, https://doi.org/10.1016/j.scitotenv.2018.01.083, 2018.