the Creative Commons Attribution 4.0 License.
the Creative Commons Attribution 4.0 License.
 | 15 Aug 2024
High-altitude aerosol chemical characterization and source identification: insights from the CALISHTO campaign
Olga Zografou
Maria Gini
Prodromos Fetfatzis
Konstantinos Granakis
Romanos Foskinis
Manousos Ioannis Manousakas
Fotios Tsopelas
Evangelia Diapouli
Eleni Dovrou
Christina N. Vasilakopoulou
Alexandros Papayannis
Spyros N. Pandis
Athanasios Nenes
Konstantinos Eleftheriadis
The Cloud-AerosoL InteractionS in the Helmos background TropOsphere (CALISHTO) campaign took place in autumn 2021 at the NCSR Demokritos background high-altitude Helmos Hellenic Atmospheric Aerosol and Climate Change station (HAC)2 to study the interactions between aerosols and clouds. The current study presents the chemical characterization of the non-refractory (NR) PM1 aerosol fraction using a time-of-flight aerosol chemical speciation monitor (ToF-ACSM). A comparative offline aerosol filter analysis by a high-resolution time-of-flight aerosol mass spectrometer (HR-ToF-AMS) showed consistent results regarding the species determined. Source apportionment applied on both datasets (ACSM-ToF and offline AMS analysis on filter extracts) yielded the same factors for the organic aerosol (one primary and two secondary factors). Additionally, the positive matrix factorization (PMF) model was applied on the total PM1 fraction by the ToF-ACSM (including both organic and inorganic ions). Five different types were identified, including a primary organic factor; ammonium nitrate; ammonium sulfate; and two secondary organic aerosols, one more oxidized and one less oxidized. The prevailing atmospheric conditions at the station, i.e., cloud presence, influence of emissions from the planetary boundary layer (PBL), and air mass origin, were also incorporated in the study. The segregation between PBL and free-troposphere (FT) conditions was made by combining data from remote sensing and in situ measurement techniques. The types of air masses arriving at the site were grouped as continental, marine, dust, and marine–dust based on back-trajectory data. Significant temporal variability in the aerosol characteristics was observed throughout the campaign; in September, air masses from within the PBL were sampled most of the time, resulting in much higher mass concentrations compared to October and November when concentrations were reduced by a factor of 5. Both in-cloud and FT measurement periods resulted in much lower concentration levels, while a similar composition was observed in PBL and FT conditions. We take advantage of using a recently developed “virtual-filtering” technique to separate interstitial from activated aerosol sampled from a PM10 inlet during cloudy periods. This allows the determination of the chemical composition of the interstitial aerosol during in-cloud periods. Ammonium sulfate, the dominant PMF factor in all conditions, contributed more when air masses were arriving at (HAC)2 during dust events, while a higher secondary organic aerosol contribution was observed when air masses arrived from continental Europe.
- Article
(2835 KB) - Full-text XML
-
Supplement
(1868 KB) - BibTeX
- EndNote


Atmospheric aerosols exhibit a large diversity in terms of their sources, size distribution, chemical composition, and lifetime across the globe. Clouds play a crucial role in climate, the hydrologic cycle, and the life cycle of gaseous species and particulate owing to their contribution to deposition pathways, offering the medium for aqueous-phase reactions (Seinfeld and Pandis, 2006). Atmospheric aerosols, serving as cloud condensation nuclei (CCN) and ice nuclei (IN), provide the seeds upon which droplets and ice crystals can form; modulations of aerosol abundance and type from anthropogenic or natural sources can therefore have important impacts on climate and the hydrological cycle. It has now been established that anthropogenic aerosols impact clouds and climate, leading to cooling, but large uncertainty impedes the ability to constrain the climate sensitivity to greenhouse gas warming (IPCC, 2023). Clouds are impacted by aerosol modulations, but clouds also affect aerosols as cloud microphysical processes (e.g., coagulation of droplets and ice crystals, collection of interstitial particles by droplets and ice crystals, in-cloud chemistry) lead to changes in the aerosol size distribution and chemical composition after the evaporation of cloud droplets, differing from the precursor aerosol particles (Roth et al., 2016). CCN usually originate from the accumulation mode and activate into cloud droplets that grow, in the absence of drizzle or precipitation, to sizes that range between 5 and 20 µm in radius (e.g., Seinfeld and Pandis, 2016). Interstitial particles are the smaller aerosol particles that remain inactivated. Coagulation takes place between cloud droplets and the interstitial particles, resulting in the so-called in-cloud scavenging of particles. Observational constraints of such in-cloud processes are key for constraining models of aerosol–cloud interactions. The study of aerosol–cloud interactions at the cloud microphysical scale requires relevant in situ measurements, which can be carried out using airborne platforms (tethered balloons, aircraft, UAV) – observations of orographic clouds with ground-based infrastructure also allow for the direct characterization of aerosol and cloud microphysical processes over extended periods of time. In such studies, a key issue is to understand the origin of aerosol upon which droplets and ice crystals form.
Mountainous atmospheric measurement stations are often influenced by aerosol of the planetary boundary layer (PBL), either because the station resides within the PBL at certain periods of the day or season or by aerosol convection from the PBL up into the free troposphere (FT). The PBL is the lowest part of the atmosphere and is characterized by turbulence that tends to mix the aerosol within it (Stull, 2016). The part of the atmosphere between 2 and 11 km from the ground is considered to be the FT, containing air unperturbed by turbulence (Stull, 2016). In general, within the PBL, solar heating of the ground surface during the daytime leads to intense mixing and growth of the PBL height, while cooling during the nighttime leads to a contraction of the PBL. In the case of mountainous regions, katabatic winds constitute another source of mixing in addition to the expansion and contraction of the PBL height. This diurnal cycle in the PBL's height has a great influence on the dispersion and vertical transport of pollutants in addition to horizontal wind. Specifically for Helmos mountain, Foskinis et al. (2024a) studied the PBL height (PBLH) for a 7-month period and showed that, starting from September, there is a pronounced diurnal trend in terms of PBLH which exceeds the station's height at noon. During November, the diurnal variability is rather flat, and the station appears to be in the entrainment zone, while in December to February, the PBL is mostly lower than the station's altitude. Starting in March, a diurnal variability appears again, and, more often, the PBLH exceeds that of the station. Removal of aerosols is slower in the FT than in the PBL since cloud presence is more common in the PBL (therefore, there is lower wet removal in the FT), and turbulent mixing is more important in the PBL, resulting in higher dry deposition. FT aerosols generally have longer lifetimes and contribute, with a more significant impact, to the direct effect on climate (e.g., Pandis et al., 1992) as opposed to aerosols within the PBL that strongly influence low-level clouds and, hence, the indirect climate effect (IPCC, 2023).
Fröhlich et al. (2015) introduced the time-of-flight aerosol chemical speciation monitor (ToF-ACSM) over a 14-month measurement campaign in the Jungfraujoch station and showed the great influence of anthropogenic activities despite the station's high altitude (3580 m a.s.l.). Other studies reporting particulate matter (PM) chemical composition by mass spectrometry from high-altitude stations include Ripoll et al. (2015) for Montsec (MSC) in Spain (1570 m a.s.l.), Farah et al. (2021) for Puy-de-Dôme (PUY) station (1465 m a.s.l.), Rinaldi et al. (2015) for Mt. Cimone (2165 m a.s.l.), Mukherjee et al. (2018) and Singla et al. (2019) for High Altitude Cloud Physics Laboratory (HACPL) in India (1378 m a.s.l.), and others. Great variability is observed concerning the mass loading in high-altitude stations, as well as the chemical composition of PM1 (Zhou et al., 2019), with respect not only to the height of each station and the season studied but also to the impact of PBL emissions on the measurements (Collaud Coen et al., 2018). However, none of these studies discussed aerosol–cloud interactions with respect to chemical composition.
The positive matrix factorization (PMF) model is most commonly applied to the organic fraction of real-time mass spectrometry datasets to identify prevailing sources of organic aerosol (OA). At Jungfraujoch (JFJ), Fröhlich et al. (2015) retrieved a hydrocarbon-related OA factor (HOA) and a local primary OA factor for all seasons, while one or two oxygenated OA (OOA) factors were retrieved depending on the season. At PUY, Farah et al. (2021) identified one HOA and one OOA factor in all seasons and one biomass-burning-related factor (BBOA) in spring only. The same factors were identified in winter at MSC (Ripoll et al., 2015), while HOAs with two OOAs were retrieved for the summer period at this site. Rinaldi et al. (2015) found only three OOAs and no influence from primary emissions. One HOA, one BBOA, and one to two OOA factors, depending on the season, were also identified at the HACPL station (Mukherjee et al., 2018). While in the same dataset, two factors were added when combined PMF analysis took place: one nitrate–OA and one sulfate–OA. Zhou et al. (2019) combined organic and inorganic ions for PMF analysis and presented a three-factor solution consisting of two OOAs, one of which contained sulfate ions and one sulfate-dominated OOA factor.
The Cloud-AerosoL InteractionS in the Helmos background TropOsphere (CALISHTO) campaign took place in autumn 2021 at the NCSR Demokritos background high-altitude Helmos Hellenic Atmospheric Aerosol and Climate Change (HAC)2 station to study the interactions between aerosols and clouds. Here, we focus on deepening our knowledge regarding the effect of aerosol–cloud interactions on the chemical composition of the background atmosphere to characterize the chemical fingerprint and sources of the air masses at a high-altitude station based on their origin and with respect to the PBLH. Finally, we aimed to establish trustworthy metrics for resolving the origin from within or above the PBL using observations at the (HAC)2 station that can be applied in the long-term in absence of remote sensing instrumentation. To differentiate between activated and interstitial particles, key to our analysis, we followed the “virtual-filtering” technique proposed by Foskinis et al. (2024b), in which a sensitivity analysis took place regarding the cut-off size of the effective diameter of the cloud droplets, as provided by the cloud probe, to determine the size up to which both interstitial and activated particles are being sampled. Results of our analysis are also compared with those derived from offline analysis of filter extracts that are aerosolized and introduced into an aerodyne aerosol mass spectrometer (AMS; Vasilakopoulou et al., 2023).
2.1 Measurement site
The (HAC)2 station (latitude: 37.984° N, longitude: 22.1969° E) is located at the top of Helmos (or Aroania) mountain, situated in northern Peloponnese, Greece (Fig. S1 in the Supplement). Helmos mountain is the only high-altitude station in the eastern Mediterranean region. At an altitude of 2314 m a.s.l., the location of the station allows the study of interactions between aerosols and clouds as it is often in-cloud, especially in the autumn and winter periods (Foskinis et al., 2024b). It is the station with the lowest ABL-TopoIndex in Europe, according to Collaud Coen et al. (2018), meaning that it has, compared to other mountaintop sites, fewer PBL influences and is therefore favorable for characterizing FT aerosols. Nevertheless, PBL influences do exist and can be very important depending on the season and time of day (Foskinis et al., 2024a) – which, if well-constrained, provides an additional advantage for studying aerosol–cloud interactions from aerosol types that are emitted nearby or regionally but that are aged in the boundary layer (e.g., bioaerosols from the nearby forest or regional biomass burning; Gao et al., 2024). Additionally, (HAC)2 is situated in a location where air masses from different origins arrive, including continental, Saharan, and long-range biomass burning origins. This facilitates the study of ambient PM with markedly different properties. It is also a contributing station within the Global Atmosphere Watch (GAW) program in addition to submitting data to ACTRIS (actris.eu) under the acronym HAC (Rose et al., 2021) and being part of several infrastructures, including the PANhellenic infrastructure for Atmospheric Composition and climatE chAnge (PANACEA).
2.2 Instrumentation
During the CALISHTO campaign (September–November 2021), a large suite of instrumentation including in situ and remote sensing instruments was deployed (https://calishto.panacea-ri.gr/, last access: 12 January 2024) at (HAC)2, as well as at the temporary site of Vathia Lakka (VL) (1850 m a.s.l.) and the nearby Kalavryta ski resort. Central to this study are the aerosol chemical composition data collected from the ToF-ACSM (Aerodyne Research Inc., Billerica, MA, USA) deployed at (HAC)2, which provide information on the aerosol chemical composition at a high temporal resolution. The ToF-ACSM carries many similarities to the aerosol mass spectrometer (AMS), and its operation principles are described in detail by Fröhlich et al. (2015). In summary, a PM2.5 cut-off inlet equipped with a Nafion drier is installed, and non-refractory species (NRS – organics, sulfate, nitrate, ammonium, and chloride) of PM1 are detected, after their vaporization and ionization, through a detector. The relative ionization efficiencies (RIEs) for organics, NO, and Cl− were 1.4, 1.1, and 1.3, respectively (Fröhlich et al., 2015). After performing calibrations at the (HAC)2 station, the RIEs for sulfate and ammonium were found to be 1.19 and 3.11, respectively. To maintain the inlet mass flow rates at relevant levels compared to those in low-altitude operations, a different orifice with a diameter of 120 µm was placed instead of the regular 100 µm orifice (Fröhlich et al., 2015). According to Middlebrook et al. (2012), a collection efficiency (CE) needs to be applied to correct for particle losses during collection and depends on the aerosol composition, such as the ammonium nitrate fraction, the acidity of the particles, and the water content. A Nafion drier is installed in the sampling line to eliminate CE variations from water content fluctuations. Based on Fröhlich et al. (2015) and after comparing the total mass of PM1 from a mobility particle size spectrometer (MPSS) with that of the ACSM plus the equivalent black carbon (eBC) (Fig. S2), the CE for this campaign was chosen to be 0.28. The resulting comparison between ACSM-derived sulfate with that from offline filters also provided consistent results (not shown).
The eBC concentrations were obtained from the absorption at 660 nm from the harmonized dataset of an AE31 Aethalometer (Aerosol Magee Scientific) and a continuous light absorption photometer (CLAP, NOAA), which sampled through a PM10 cut-off inlet. The concentration of the light-absorbing aerosol is generally calculated from the rate of change of the optical attenuation of light on a quartz filter at seven different wavelengths (370, 470, 520, 590, 660, 880, and 950 nm) after correcting for loading and multi-scattering effects (Backman et al., 2017; Stathopoulos et al., 2021). The number concentration at different size bins was determined using an MPSS (Rose et al., 2021). The PICARRO analyzer was deployed for measurements of the greenhouse gases (GHGs) CO2, CO, and CH4. A particulate volume monitor (PVM-100) (Gerber Scientific Inc., Reston, VA 20190, USA) (Gerber et al., 1999) was permanently installed at the station, which measures the liquid water content (LWC) and the effective droplet radius of clouds by directing a diode-emitted laser beam along a 40 cm path with 1 h time resolution. Meteorological data were obtained from a weather station installed at (HAC)2. Two high-volume samplers provided total suspended particles (TSPs) and PM2.5 on filters that were analyzed afterwards by a Sunset Laboratory EC–OC analyzer (Diapouli et al., 2017) and an XRF (X-ray fluorescence) spectrometer (Manousakas et al., 2018). Moreover, offline AMS analysis was performed on the TSP filters following the procedure of Vasilakopoulou et al. (2023) using a high-resolution time-of-flight aerosol mass spectrometer (HR-ToF-AMS), a state-of-the-art instrument that can provide continuous measurements of the atmospheric aerosol size distribution, concentration, and chemical composition (Jayne et al., 2010; Drewnick et al., 2005). A pulsed Doppler scanning lidar system (StreamLine Wind Pro model, HALO Photonics) (Newsom et al., 2022) emitting at 1.565 µm was deployed at the VL site to estimate the PBLH based on the standard deviation of the vertical velocity, combined with aerosol chemical composition metrics and humidity levels (Foskinis et al., 2024a).
3.1 Metrics for PBL influence at (HAC)2
Numerous methods are generally used to estimate the PBLH, including in situ observations, remote sensing techniques, and modeling based on meteorological data. The segregation between PBL-influenced and FT air masses is a challenging issue, and given that there is no specific method that applies at all high-altitude sites, the local topography, as well as the type of data available, can generally determine the suitable methods for resolving PBL and FT air mass influence at a specific point. Both in situ observations and modeling techniques have been used for this purpose. The most common approach is radiosonde measurements of temperature, humidity, and/or wind profiles, although they are lacking in terms of spatial and temporal resolution (de Arruda Moreira et al., 2018). The in situ approaches include measurements of the water vapor mixing ratio (McClure et al., 2016; Zhou et al., 2019), radon-222 (Fröhlich et al., 2015; Farah et al., 2021), the NOy CO ratio (Fröhlich et al., 2015), and the relative increase in specific humidity between a low- and a high-altitude station (Prévôt et al., 2000; Rinaldi et al., 2015); some statistical methods such as adaptive selection of diurnal minimum variation for CO2 (Yuan et al., 2018), or eBC (Sun et al., 2021); and remote sensing techniques (Doppler lidar, aerosol depolarization lidar). Trajectory models are also used to determine the boundary layer trajectories; FLEXTRA, based on data from the European Centre for Medium-Range Weather Forecasts (ECMWF), and HYSPLIT are two common models used to retrieve the PBLH from meteorological data.
For the same campaign, Foskinis et al. (2024a) retrieved the PBLH by means of the vertical profiles of the updrafts (σw) from the HALO Doppler lidar installed at the VL site and linked the type of atmospheric layers to in situ aerosol observations made on an hourly basis at (HAC)2. However, this dataset does not cover the whole period with ACSM data for the present study. We therefore examined a number of adjusted metrics to indicate the atmospheric layer, employing in situ data and evaluating their performance while using the PBLH retrieved by HALO as a reference. The selected metrics included the water vapor mixing ratio (water vapor mass divided by the mass of dry air at a given air volume), the eBC-to-CO ratio, and the accumulation-mode number concentration (particles with a diameter greater than 95 nm). Figure 1 shows the PBLH retrieved by HALO with respect to each metric: eBC CO (a), water vapor (b), and accumulation-mode number concentration (c).
FT air is generally very dry, and the PBL generally contains about 80 % of the water in the atmospheric column (Myhre et al., 2013); therefore, the water vapor mixing ratio is considered to be an accurate indicator of PBL influence (Henne et al., 2005), especially in regions without considerable convective activity. The ratio of equivalent BC (eBC) to CO is a suitable proxy for determining fresh pollution arriving at (HAC)2 from inside the PBL in place of the NOy-to-CO ratio (Fröhlich et al., 2015; Farah et al., 2021) owing to a lack of NOy data at (HAC)2 station. CO is a gas emitted during incomplete combustion, with a lifetime of several months in the atmosphere, and is slowly degraded by OH radicals (Worden et al., 2013). eBC has a lifetime of a few days. Their ratio in the FT is markedly different than the one in the PBL. Moreover, 90 nm is the average dry diameter threshold above which particles are activated to cloud droplets (Herrmann et al., 2015). Therefore, the number concentration of the particles in the accumulation mode (> 95 nm) was another indicator for FT air masses.
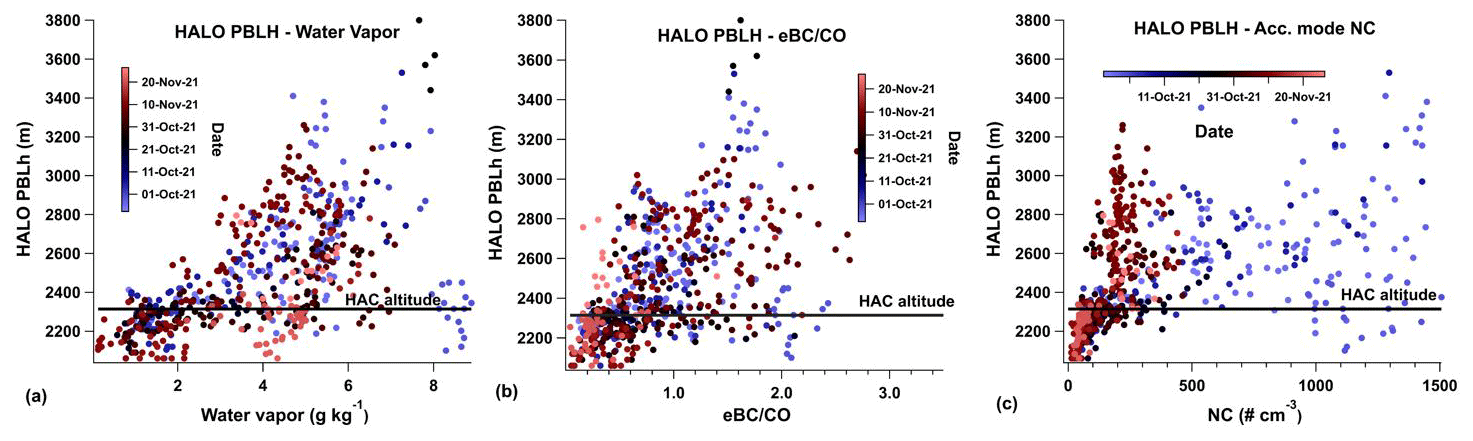
Figure 1PBLH as retrieved by the HALO Doppler lidar vs. (a) water vapor ratio as a function of date, (b) eBC CO ratio as a function of water vapor ratio, and (c) number concentration of accumulation-mode particles as a function of water vapor ratio.
The PBL and FT thresholds for each method were chosen as the values maximizing the agreement between the metrics and HALO at FT conditions during the overlapping period. A threshold of 3.2 g kg−1 was set on the water vapor mixing ratio based on the average of 5 years of measurements at (HAC)2 (2017–2021) including only the winter months (December–February), when minimum influence from the PBL is expected (Zhou et al., 2019). The ratio of eBC to CO was used with a threshold of 0.5, while the number concentration of the accumulation-mode-particle (NC) threshold was chosen to be 100 cm−3, in agreement with Gao et al. (2024), for (HAC)2. By applying as a criterion that two out of the three metrics meet the thresholds for FT conditions, an overall agreement of 85 % was achieved, and this combination was chosen for the segregation of FT from PBL conditions when remote sensing data were not available. The separation of PBL and FT air masses was conducted using HALO for 30 % of the campaign, while, for the remaining period, the set of metrics was utilized. Moreover, the proportion of FT to PBL air masses was 1:3.
3.2 Positive matrix factorization
The positive matrix factorization (PMF) technique was chosen to assign the NRS (both organic and inorganic ions) measured by the ToF-ACSM to different sources. PMF was performed on the combined ToF-ACSM dataset using the Source Finder Pro tool (SoFi Pro, Datalystica Ltd, Villigen, Switzerland) (Canonaco et al., 2021) that utilizes the multilinear engine ME-2 (Paatero, 1999) as a PMF solver. The PMF model aims to describe the initial matrix X that contains information on the concentration of each variable in time as a product of the matrices G and F, where G is the source emission factor contribution, and F is the spectral “fingerprint” (spectrum) associated with each factor. A residual matrix E is inevitably generated. The PMF principle is captured in Eq. (1):
PMF aims to find the minimum of the quantity Q (Qm), which is the sum of the square of the ratio , as shown in Eq. (2):
where e is the residual, and σ is the uncertainty of each data point; m is the number of rows of F, and n is the number of columns of G. This ensures that data with a low signal-to-noise ratio () will be discarded so as not to affect the result.
The issue of rotational ambiguity, which makes it difficult for the model to arrive at an optimal solution due to the fact that X can be described with many different combinations of G and F, can be solved by applying certain constraints to G or F through the use of a values. To assess the uncertainty of the solution, iterations with different starting points were performed using the bootstrap technique, which is described in more detail in Efron (2000).
At first, only the organic fraction of the ToF-ACSM was run in SoFi to identify the sources of organic aerosol at (HAC)2 since no previous information is available for this high-altitude site. The solution that best fit the data consisted of three factors: one related to primary organic aerosol (POA) and two related to oxidized secondary organic aerosol (OA) and one more oxidized and one less oxidized (MO-OOA and LO-OOA, respectively). The same solution was reached by applying the PMF model to the offline dataset measured by filters from the high-volume sampler during this campaign and analyzed offline with an HR-ToF-AMS. Figure S3 shows the absolute concentrations of each factor from both analyses for each common day. The absolute offline AMS concentrations were estimated from the percentage contribution of each factor from the offline analysis and the OA concentration reported by the ACSM. The MO-OOA factor contributed 50 %, on average, to the OA, in good agreement with the 54 % estimated by the online ACSM analysis for the same days. The offline results confirm the presence of primary OA contributing 32 % of OA. This value is a little higher than the 24 % contribution estimated by the analysis of the ACSM data; however, this difference can be explained by the uncertainty of the corresponding analysis. Finally, the LO-OOA contributed 14 % to the OA according to the offline analysis. These results provide additional support for the ACSM results and also demonstrate that the offline method can provide useful information for the average source contributions in an area. The predicted day-to-day variation of the source contributions by the two methods differs more than the averages (Fig. S3). Vasilakopoulou et al. (2022) showed that a significant part of this discrepancy is due to the low temporal resolution of the offline AMS analysis. The rest is due to experimental issues (e.g., different water solubilities of the various OA components). The details of the offline analysis can be found in Section S1 of the Supplement.
Subsequently, fully unconstrained simulations were performed on the combined ACSM dataset. The procedure for deconvoluting NRS sources was previously described in Zografou et al. (2022). In short, the variables of the inorganics that are characteristic for each species were added to the organics matrix, including 18, 32, 48, 64, 80, 81, and 98 for SO; 30 and 46 for NO; 16 and 17 for NH; and 35 and 36 for Cl−. The inorganic variables were down-weighed before PMF analysis by a factor of (Ulbrich et al., 2009), where N is the number of ions of each species that are duplicate according to the fragmentation table (Allan et al., 2004). The RIEs were applied separately for each species beforehand, followed by application of the CE.
The PMF analysis yielded five factors of the PM1 fraction at Helmos station during the CALISHTO campaign: a primary organic factor (POA), ammonium nitrate (AmNi), ammonium sulfate (AmSul), one less oxidized OA (LOA), and one more oxidized factor (MOA) (Fig. S4). The profiles of all the factors were extracted after unconstrained runs took place and were used as seed profiles for the next simulations. Five-factor simulations were then performed by constraining three of them (POA, AmNi, and AmSul) and allowing for a variability of 30 % from the anchor mass spectrum (random a values of 0.3) for 100 simulations, where the bootstrap technique was also enabled. This a value was selected as the value that resulted in minimum shift in the factors (Zografou et al., 2022). The POA and the secondary OAs presented extremely high correlations with the respective organic factors described before (time series correlation, R2=0.9–0.97). The POA consisted of 95 % organic ions, while MOA and LOA consisted of 80 % and 67 % organics, respectively. The MOA was mixed with 10 % SO4 and 9 % NH4 ions, while the LOA was mixed with 23 % SO4 and 7 % NH4 ions.
In order to evaluate the solution obtained, the residuals of the solution, as well as the errors of each factor, need to be addressed. The errors reported below are expressed as the spread of the factors in relation to their median concentrations and are measured as the ratio of the interquartile difference (75th–25th) to the median concentration; overall, low uncertainties were found. AmSul displayed the lower variability at 1 %, following which the secondary organic factors (both MOA and LOA) showed similar variability at 3.7 % and 3.8 %, respectively. The POA's mass error was at 4.7 %, and that of AmNi was at 2.3 %. The probability density function of the scaled residuals is shown in Fig. S5, in which it can be seen that most of the data fall into the suggested range of ± 3 % (Paatero and Hopke, 2003).
3.3 Analysis of back trajectories
Wind backward trajectories were obtained from the NOAA Air Sources Laboratory (ARL) Hybrid Single-Particle Lagrangian Integrated Trajectory (HYSPLIT-4) model (Draxler and Hess, 1998; Stein et al., 2015). The 120 h back trajectories were calculated using the Global Data Assimilation System (GDAS) meteorological dataset at 1° resolution for every hour at the (HAC)2 altitude. The Flexible Particle Dispersion Model (FLEXPART) was also used in order to obtain information on the geographical origin of the air masses at (HAC)2 station through the residence times of air parcels over geographic grid cells (Stohl et al., 2005). More details can be found in Vratolis et al. (2023).
4.1 PM1 characterization and source apportionment
4.1.1 Aerosol chemical characterization during CALISHTO
The chemical composition and concentration of PM1 species found in the FT or at the interface between the FT and PBL are expected to vary depending on different prevailing conditions, such as cloud formation, the influence of PBL emissions, and air mass origin. To account for this, a comprehensive characterization of PM1 at (HAC)2 during the CALISHTO campaign was initially conducted, and then the effects of clouds, PBL height, and air mass origin were examined separately.
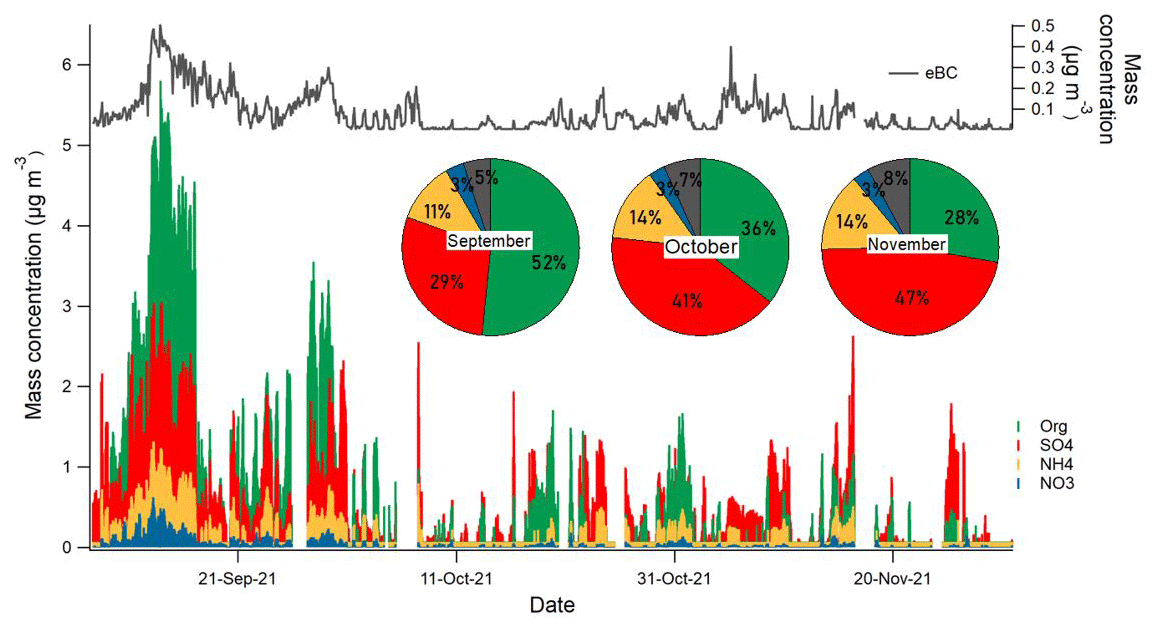
Figure 2Time series of non-refractory species as measured by the ToF-ACSM (organics: green, sulfate: red, ammonium: yellow, and nitrate: blue) and eBC (gray) for the campaign period and pie charts indicating the mass fraction and mass concentration of each PM1 component for each month: September, October, and November.
Figure 2 depicts the concentration of organics (green), sulfate (red), nitrate (blue), ammonium (yellow), and eBC (gray) in time, with pie charts representing the fractions of each species during each month. Chloride was not included in this analysis since it was close to or lower than the limit of detection for most of the campaign. In Table S1, the average mass concentrations of each species, together with their relative contribution to PM1, appear. Considerable variability was observed during the course of the campaign for the PM1 mass concentration levels and chemical composition, while concentration levels declined with time towards the end of the campaign. During September, which is a transitional month with characteristics similar to the summer months in Greece and which is more often influenced by PBL intrusions, the aerosol loading was up to 5 times higher than in October and November. Organics were the predominant aerosol species type during September, whereas higher sulfate levels were observed during October and November. In September, sulfate made up 29 % of the total PM1 mass. By October, it increased to 41 %, and in November, it reached 47 %. This reflects varying conditions at the Helmos station during the autumn months. The relative contribution of organics was 52 % during September and dropped to 36 % in October and 28 % in November. The ammonium contribution was fairly constant, varying between 11 % in September to 14 % in November. Aerosol nitrate was a minor contributor to mass (3 %). Equivalent black carbon progressively increased throughout autumn, from 5 % in September to 7 % in October and 8 % in November.
Figure S6 exhibits the diurnal variation of these species for each campaign month separately. The time in all plots is UTC+2 h. The ToF-ACSM was operating 86 % of the time during CALISHTO. In September, all species exhibited similar daily concentration trends, with an increase starting at midday. This pattern is consistent with the peak in the PBL height at midday, which leads to an enrichment of anthropogenic emissions in the lower FT. The shallower PBL during the early morning and nighttime results in a drop in concentration, as well as change in the chemical composition. During October and November, the organics and nitrate displayed similar patterns, as did ammonium with sulfate. The concentration of organics and nitrate rose at midday during October and November but with a longer duration in October and a narrower peak in November. The duration and magnitude of the midday maximum values in PM1 concentration show a gradual decline from September to November. This behavior can be explained by the gradual decline in the PBL influence at the (HAC)2 altitude. Ammonium and sulfate, on the other hand, exhibited a similar trend in October, while their concentration remained more stable throughout the day in November – reflective of the long-range transport influences controlling their levels.
4.1.2 Total NRS source apportionment through PMF
The POA factor retrieved by PMF is considered to include aerosol mixed from different primary sources that have had enough time to get mixed before reaching the (HAC)2 station. This factor appears mainly when the station is under the influence of PBL air masses, as will be discussed below, and when the winds favor its vertical transport; this provides valuable insights into how primary sources (although mixed) from anthropogenic pollution can reach the FT and transfer pollution to high altitudes. In Table S2, the correlation of this factor with external tracers is documented, showing that it is impossible for this factor to be related to one single source, such as traffic or biomass burning; this is representative of primary emissions mixed upon elevation at the station's altitude. Figure S7 depicts the time series and diurnal trends, as well as the mass fraction of each PMF factor for each campaign month, while Table S3 shows the monthly absolute concentration and the relative abundance of each factor. With an average mass concentration of 0.19 µg m−3, the relative contribution of POA at the end of the campaign drops to 7 % compared to 16 % at the beginning of the campaign. AmNi presented the lowest relative contribution to total PM1, contributing 3 %–4 %. In the span of the campaign, this factor decreased to be 7 times lower, from 0.14 µg m−3 in September to 0.02 µg m−3 in November, displaying the character of a short-lived species. The AmSul concentration shows the least variability during the course of the campaign, regardless of the PBLH, with respect to the station altitude due to its originating from long-range transport and its long lifetime. This factor is the main contributor during the campaign, representing 33 % of PM1 in September, while in October and November, its contribution increases to 53 % and 60 %, respectively. Concerning MOA and LOA, their mass decreased over the course of the campaign, from 46 % relative abundance in total in September to 30 % in November. The diurnal pattern of the PMF factors during these 3 months is influenced by aerosol originating within the PBL, as will also be discussed in Sect. 4.3.
To elucidate the dominant mechanisms leading to changes in concentration, a number of processes need to be examined. Firstly, cloud processing can significantly impact the aerosol concentration by activation of particles into cloud droplets, as well as through processes such as in-cloud scavenging. A second factor is the PBLH in relation to the station altitude, which determines whether the station was influenced by aerosol originating from within the PBL or by those lying within the free troposphere, where low concentrations of background aerosol are found. Finally, it is important to consider the origin of air masses. The above effects on the observed PM1 aerosol composition are discussed in the following sections.
4.2 Aerosol composition during in-cloud periods
The cloud periods were determined by the LWC given by a PVM-100 cloud probe, which also provided the effective radius of the cloud droplets, together with the relative humidity (RH) using a threshold of 97 %, where cloud presence was presumed for higher values. The LWC of typical clouds is in the range of 0.1 to 3 g m−3; hence, a threshold of 0.1 g m−3 was used to determine in-cloud conditions (Seinfeld and Pandis, 2006; Roth et al., 2016).
As a first proxy for the influence of cloud periods on aerosol mass concentration, in Fig. 3, the bar graphs represent the mass concentration of NRS and eBC (Fig. 3a) and the PMF factors (Fig. 3b) for both in-cloud (referred to as IN-C) and no-cloud conditions (referred to as OUT), along with the relative abundance of each species and each factor, respectively. Significant differences are observed both in concentration levels and in chemical composition. Table S4 contains the respective average concentrations in these two conditions for each species and each factor. Under clear-sky conditions, the organics present a more important contributor to PM1, while, under cloud conditions, SO4 is more important. In the same way, the factor AmSul is more important than the organic PMF factors (44 % as a sum) in-cloud, while, under no cloud conditions, the organic factors are dominant (59 % as a sum over 38 % AmSul). Compared to the organics, whose concentrations are 3 times lower during cloud periods than under no-cloud conditions (similarly to those of ammonium), sulfate removal, due to the collision of particles with existing cloud droplets (in-cloud scavenging) and/or activation to cloud droplets, is less effective, presenting 2-times-lower concentrations during cloud periods. However, this could also be related to simultaneous production of SO4 due to SO2 oxidation under aqueous conditions in clouds. The eBC shows a similar decrease in-cloud as the organics, with a 3-times-lower concentration compared to during no-cloud periods, while NH4 and NO3 are 2 times lower in clouds.
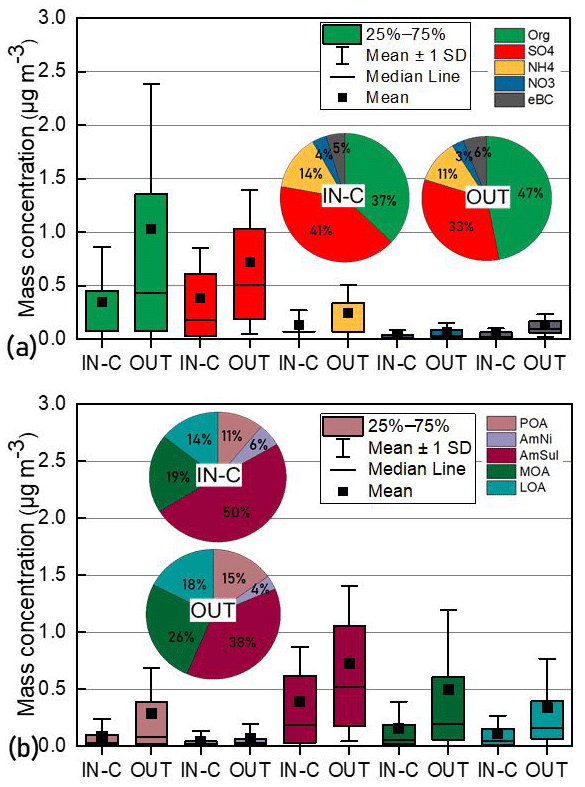
Figure 3Boxplots and relative contribution of each NRS and eBC (a) and each PMF factor (b) during cloud periods (IN-C) and under non-cloud (OUT) conditions. The box ranges are the 25th and 75th percentiles, while the whisker ranges are the ± standard deviation. The median is described as a horizontal line, while the rectangular box represents the average value.
Although Fig. 3 gives a general picture of cloud influence on the chemical composition of PM1, more specific details are provided by Fig. S8, which presents the mass concentration of each species and factor for three conditions: pre-cloud aerosol (1 h before cloud formation), during cloud presence, and post-cloud aerosol (1 h after cloud). The respective graphs for the PMF factors appear in Fig. S9. The in-cloud scavenging of aerosol is found to cause a reduction in their concentration by a factor of 2.5–3. Organics and sulfate show the highest decrease during in-cloud periods due to the high hygroscopicity and scavenging of some organics and sulfate. In contrast, these two species are found to display a concentration increase in post-cloud time periods, possibly related to SO4 and secondary organic aerosol (SOA) production from aqueous oxidation of SO2 and volatile organic compounds (VOCs), respectively, which is consistent with Ervens et al. (2018). LOA is the PMF factor with the highest increase post-cloud. It is notable that AmNi shows a negligible increase after cloud processing, which is related to the negligible uptake of N2O5 and NO3 in clouds (Hauglustaine et al., 2014) that would result in AmNi formation in the presence of ammonia. It has to be noted, though, that the in-cloud instances include both interstitial and activated aerosol.
In order to separate between the activated droplets that were sampled and those that were interstitial (particles that remained non-activated during the in-cloud periods due to chemical composition, small dry size, or insufficient vertical velocity, resulting in cloud maximum supersaturation below the critical value required), a virtual-filtering technique (Foskinis et al., 2024b) was used. Studying the average particle distribution during pre-, post-, and in-cloud conditions, Foskinis et al. (2024b) exploited the PM10 sampling lines at (HAC)2 used for the aerosol in situ measurements and found that cloud droplets with diameters that are less than what is empirically observed by the PVM-100 threshold of ambient effective droplet diameter (Deff) at 13.5 µm were susceptible to enter the sampling line, get dried, and return to the actual size before activation and therefore be detected as part of the measured number size distribution. The following general rule was followed: when the Deff was lower than 13.5 µm, the aerosol measured was considered to contain both activated and interstitial aerosol, while, at certain periods, when the Deff was higher than 13.5 µm, only interstitial aerosol could be measured. Considering this, an approximation of the activated fraction could be estimated as the difference between cloud-free aerosol (1 h before cloud formation) and interstitial aerosol. To this end, in Fig. 4, the boxplots of the free and interstitial aerosol are plotted together with the average value as approximated for the activated part for the NRS and eBC. The respective graphs for the PMF factors appear in Fig. S10. The most efficiently activated species is SO4, with an 84 % activation rate (determined here as the ratio between activated and cloud-free mass concentration), which is reasonable considering the fact that sulfate is a highly hygroscopic component. The lowest activation rate appears for NH4 at 67 %. This difference is explained by the different size distribution of activated particles. Foskinis et al. (2024b) showed that activated particles present a shift in the size distribution towards higher diameters, where ammonium and sulfate are mainly in the ammonium bisulfate form rather than in the ammonium sulfate form, which is more dominant in lower size distributions (Mészáros and Vissy, 1974). In addition, entrainment of FT air, which is more acidic, can also explain this behavior. Looking at the respective plots for the PMF factors, those with the highest activation rates are AmSul and MOA.
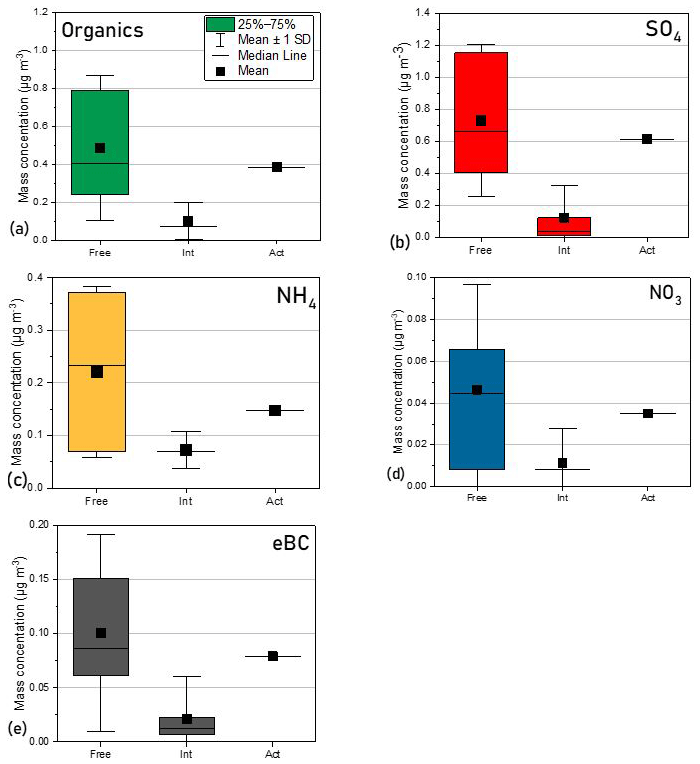
Figure 4Organics (a), SO4 (b), NH4 (c), NO3 (d), and eBC (e) boxplots for cloud-free (1 h before cloud formation) (free), interstitial (int), and activated aerosol (act) (only the average value as the difference between the mass concentration before cloud formation minus the mass concentration of the interstitial part of the aerosol). The box ranges are the 25th and 75th percentiles, while the whisker ranges are the ± standard deviation. The median is described as a horizontal line, while the rectangular box represents the average value.
In order to eliminate the influence of cloud events on the subsequent analysis, the results presented in Sect. 4.3 and 4.4 refer to non-cloud periods only.
4.3 PBL influence on chemical composition
In Fig. 5, the boxplots of the concentration of NRS and eBC (Fig. 5a) and the PMF factors (Fig. 5b), together with their relative abundance, appear to be segregated between PBL and FT conditions for the whole campaign. The respective mean values appear in Table S6. There are great differences observed in the loadings of PM1 in PBL and FT conditions. The total PM1 concentration reaches an average value of 2.8 µg m−3 when the station is influenced by PBL, while it drops to only 0.5 µg m−3 under FT conditions. Nitrate yielded the highest ratio of PBL to FT concentrations, being close to 8. The measured NO3 by ACSM is particulate nitrate formed by the conversion of NOx to the particle phase. NOx is quickly depleted; therefore, nitrate is only formed inside the PBL, resulting in a much lower concentration in the FT, arising from injections from the PBL. Organics and SO4 followed with a ratio close to 6, followed by NH4 with a PBL-to-FT ratio equal to 4; finally, the lowest ratio (PBL/FT = 3) was observed for eBC.
Organics are the dominant species in both conditions (which is in agreement with Zhou et al., 2019), followed by SO4. NO3 contributes the same in both conditions, NH4 shows higher relative abundance in the FT than in the PBL (16 % over 11 %), while eBC is twice as high in relative terms in the FT than in the PBL (10 % of PM1 in the FT over 5 % in the PBL).
Overall, during the CALISHTO campaign, the NRS composition (that is, excluding eBC) did not change much, as is also made evident by the very similar composition of the PMF factors in both PBL and FT conditions. It is possible that a difference in the composition would be observed in wintertime when the station would stay for longer times in the FT and when a higher sulfate relative abundance would possibly be observed. During autumn, there are no clean periods, which are where the station stays at the FT for several days; there is repeated injection of PBL pollution into the FT. This is interrupted by some continuous FT periods; however, these last less than the lifetime of the species introduced. Therefore, the chemical composition does not vary significantly inside and outside the PBL, although the PM loading does vary depending on whether there is exposure to PBL air masses. Thus, it can be seen that the factors contribute equally in both conditions regardless of whether they originate from long-range transport, like AmSul, or have longer lifetimes, like MOA. Nevertheless, the increased relative persistence of eBC levels at higher ratios than other species in the FT when compared to PBL levels can have serious climatic implications since the direct radiative forcing caused by the eBC is more important than that of other species. This is consistent with the study by Zhang et al. (2017), where this increase was related to brown carbon absorbance. This deserves further study for carbonaceous aerosol at (HAC)2.
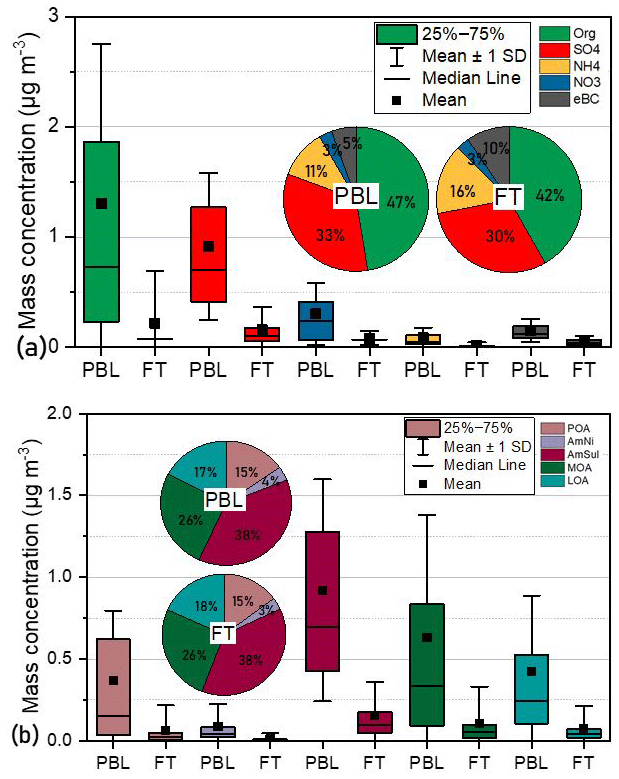
Figure 5Boxplots of NRS and eBC (a) and PMF factors (b) for PBL and FT conditions, separated based on the criterion of two out of three metrics. The box ranges are the 25th and 75th percentiles, while the whisker ranges are the ± standard deviation. The median is described as a horizontal line, while the rectangular box represents the average value.
Figure 6 depicts the diurnal trend of the mass concentration of the NRS and eBC, separated by whether the station was inside the PBL or in the FT, together with the diurnal PBLH variation from HALO, while, in Fig. S11, the same plots appear for each PMF factor. It is obvious that all species, as well as the PMF factors, in PBL conditions follow the same diurnal trend as the PBLH, except for SO4 and AmSul, which is expected since AmSul is mainly constituted by long-range-transported aerosol and is therefore not that sensitive to daily fluctuations in the PBLH; moreover, SO4 can also be produced in the FT. The midday peak is observed between 10:00 and 18:00 (UTC+2), driven by greater convection related to increased solar radiation at this time. In the FT, small fluctuations are observed that are rather random and do not follow a standard pattern between the species or factors.
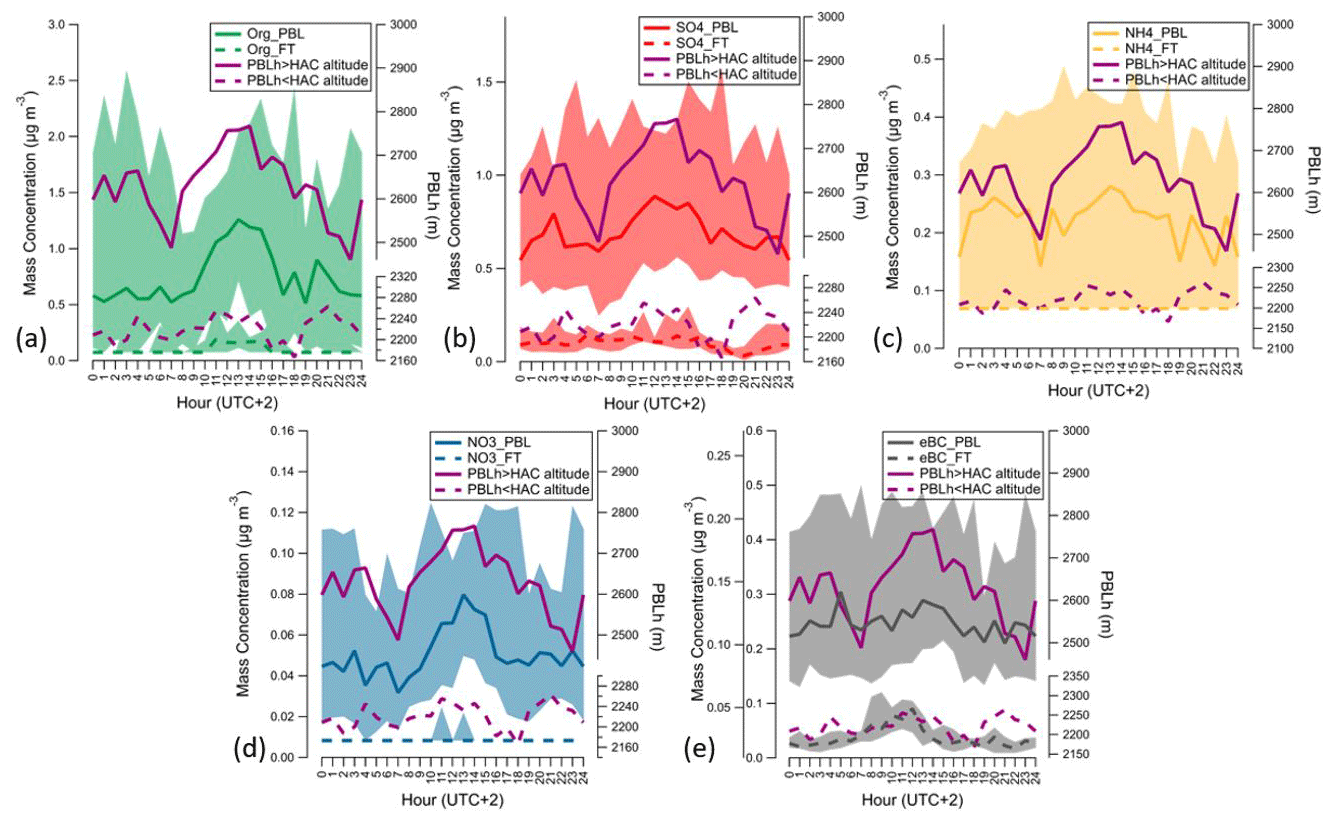
Figure 6Median and interquartile (10th and 90th) diurnal trends for each NRS species ((a) organics, (b): SO4, (c) NH4, and (d) NO3) and (e) eBC for the whole campaign, segregated between PBL-influenced days and days in the FT based on the criterion of at least 2 methods.
4.4 Air mass origin influence on chemical composition
The (HAC)2 station lies in a crossroad of different incoming air masses, and the aerosol presents different characteristics depending on the incoming origin. The back-trajectory analysis allows the differentiation of the air masses arriving at the (HAC)2 into four different categories, which appear indicatively in Fig. S12: dust (D) when the air masses arrive from northern Africa, continental (C) when arriving from Europe and mainly from western Europe, marine (M) when arriving from either the Mediterranean Sea or the Adriatic Sea, and the combination of marine and dust (M–D). The difference between D and M–D is that D back trajectories show higher residence times over northern Africa, while the M–D combination shows equally shared residence times over northern Africa and either the Adriatic Sea or the Mediterranean Sea. In Fig. 7, the bar graphs show the mass concentration of PM1 species (Fig. 7a) and the PMF factors (Fig. 7b), together with the respective percentage that represents their relative abundance, for each of the previously described origins.
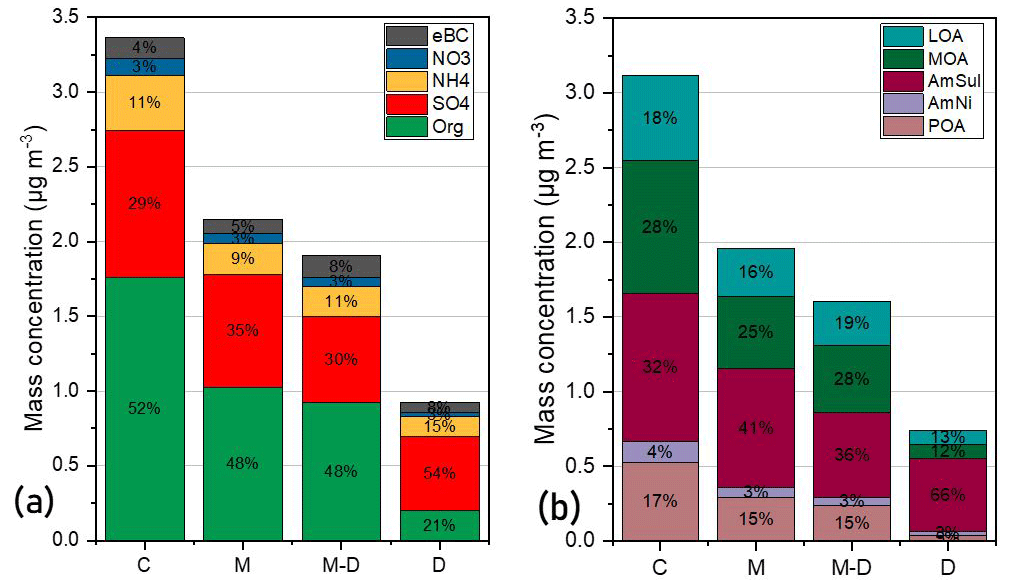
Figure 7Bar graphs representing the mass concentration of the PM1 species and PM1 factors, where C is continental, D is Saharan D dust, M is marine aerosol, and M–D is marine and dust.
In general, great differences were observed between dust air mass origins and the other aerosol types in terms of both PM loading and aerosol composition. The aerosol with the highest mass loading was continental, with 3.4 µg m−3. Marine and marine–dust followed, with total PM1 equal to 2.2 and 1.9 µg m−3, respectively, and then there were dust events at 0.9 µg m−3. This in accordance with Carbone et al. (2014), who found the northern African air mass origin at Mount Cimone (2165 m a.s.l.) to carry less PM mass loading. An interesting finding is that dust events are related with the highest sulfate fraction and the lowest organic fraction, and, together with marine–dust aerosol, these exhibit the highest relative abundance of eBC at 8 %. In absolute terms, eBC is higher in continental aerosol, which is known to carry important amounts of pollution from industrial and biomass burning plumes and, in this case, is richer in organics than all the other origins and shows the lowest AmSul relative abundance. M–D is shown to be mainly affected by marine aerosol, with the closest concentration levels and more similar composition. Ammonium sulfate is greatly important in aerosol originating from northern Africa, with 66 % relative abundance. This is probably related to aerosol passing through the Mediterranean while being transferred from northern Africa, getting enriched with non-sea-salt sulfate, which commonly appears in marine environments, while transformation processes during transport result in ammonium sulfate formation. Consistently, marine and marine–dust aerosols also carry important fractions of ammonium sulfate (41 % and 36 %, respectively). MOA is again the prevalent OA factor in all aerosol types, followed by POA and LOA. AmNi is not seen to be affected by air mass origin.
This is the first study presenting results on the chemical characteristics of PM1 aerosols at the (HAC)2 station, the only high-altitude station in the Mediterranean, where measurements and analysis of this kind were conducted during the CALISHTO campaign. The PMF analysis apportioned the PM1 mass as follows: two secondary inorganic aerosol components, ammonium nitrate (AmNi) and ammonium sulfate (AmSul), and one primary (POA) and two secondary organic aerosol components, one more oxidized aerosol (MOA) and one less oxidized aerosol (LOA). The results of the OA PMF were also supported by the results of the PMF after offline AMS analysis on filter extracts took place. The POA factor identified here was linked to a mixture of primary sources that arrive at the station before undergoing oxidization but could not be attributed to a single primary emission source. The PM1 characterization was carried out using three classifications of sampled air masses: in-cloud or cloud-free, interstitial PBL or FT conditions, and air mass type. Cloud presence resulted in lower PM1 concentrations due to particle activation and cloud scavenging. Sulfate, although dominant both in and out of cloud conditions, is more influenced by clouds than organic species (greater concentration decrease). SO4 and organics were found to replenish their concentrations faster after cloud events compared to the other species (ammonium, nitrate, and eBC), pointing to the formation of SO4 and organics in-cloud following aqueous-phase oxidation of SO2 and VOCs, respectively. The separation of interstitial and activated particles during cloud events led to the conclusion that interstitial aerosol is richer in low-hygroscopicity organics and more acidic inorganics. Some metrics were evaluated regarding their ability to identify FT-over-PBL conditions at (HAC)2 station, taking as reference the PBLH from parallel measurements by a HALO Doppler wind lidar. PBL conditions, in comparison to the FT, were related to much higher mass concentrations of all species. Concerning aerosol origin, it was found that air masses coming from continental Europe (C) carried the highest levels of PM1 pollution, twice as high as marine (M) and marine enriched with dust (M–D) and thrice as high as dust from northern Africa (D). Sulfate was the most abundant species in dust aerosol (and AmSul was therefore the most abundant PMF factor), indicating the influence of marine non-sea-salt SO4 uptake during transport from northern Africa to (HAC)2, passing through the Mediterranean Sea.
As an overview, it was found that cloud processing influences both aerosol loading and chemical composition. Aerosol loadings within the PBL were 5 times higher on average compared to those in the FT, while the chemical composition or the source-apportioned components for the inorganic and organic fractions remained rather unchanged. An exception was the eBC concentrations, with a higher relative abundance in the FT. This is a key finding that needs to be studied further.
Data are available upon request to the author (o.zografou@ipta.demokritos.gr).
The supplement related to this article is available online at: https://doi.org/10.5194/acp-24-8911-2024-supplement.
AN, AP, and KE organized the CALISHTO campaign. OZ, KE, and AN conceived and led this study. OZ led the data analysis and interpreted the results, with contributions from KE, AN, MG, RF, SNP, and ED. OZ wrote the original paper with inputs from KE, AN, RF, SNP, ED, and CNV. OZ, KG, PF, MG, KE, RF, AP, and AN conducted experiments and collected the raw data. SNP, ED, and CNV did the offline AMS analysis and ran the PMF for the AMS data. SV performed FLEXPART simulations, and OZ performed HYSPLIT simulations. All the authors discussed, reviewed, and edited the paper.
The contact author has declared that none of the authors has any competing interests.
Publisher’s note: Copernicus Publications remains neutral with regard to jurisdictional claims made in the text, published maps, institutional affiliations, or any other geographical representation in this paper. While Copernicus Publications makes every effort to include appropriate place names, the final responsibility lies with the authors.
The authors gratefully acknowledge the NOAA Air Resources Laboratory (ARL) for the provision of the HYSPLIT transport and dispersion model used in this publication.
This research has been supported by the PyroTRACH (grant no. ERC-2016-COG) project funded by H2020-EU.1.1 (ERC). The paper was partially supported by the “PANhellenic infrastructure for Atmospheric Composition and climatE change” project (grant no. 953426), implemented under the “Reinforcement of the Research and Innovation Infrastructure” action, funded by the “Competitiveness, Entrepreneurship and Innovation” operational program (grant no. NSRF 2014-2020) and co-financed by Greece and the European Union (European Regional Development Fund).
This paper was edited by Allison C. Aiken and reviewed by two anonymous referees.
Allan, J. D., Delia, A. E., Coe, H., Bower, K. N., Alfarra, M. R., Jimenez, J. L., Middlebrook, A. M., Drewnick, F., Onasch, T. B., Canagaratna, M. R., Jayne, J. T., and Worsnop, D. R.: A generalised method for the extraction of chemically resolved mass spectra from Aerodyne aerosol mass spectrometer data, J. Aerosol Sci., 35, 909–922, https://doi.org/10.1016/j.jaerosci.2004.02.007, 2004.
Backman, J., Schmeisser, L., Virkkula, A., Ogren, J. A., Asmi, E., Starkweather, S., Sharma, S., Eleftheriadis, K., Uttal, T., Jefferson, A., Bergin, M., Makshtas, A., Tunved, P., and Fiebig, M.: On Aethalometer measurement uncertainties and an instrument correction factor for the Arctic, Atmos. Meas. Tech., 10, 5039–5062, https://doi.org/10.5194/amt-10-5039-2017, 2017.
Canonaco, F., Tobler, A., Chen, G., Sosedova, Y., Slowik, J. G., Bozzetti, C., Daellenbach, K. R., El Haddad, I., Crippa, M., Huang, R.-J., Furger, M., Baltensperger, U., and Prévôt, A. S. H.: A new method for long-term source apportionment with time-dependent factor profiles and uncertainty assessment using SoFi Pro: application to 1 year of organic aerosol data, Atmos. Meas. Tech., 14, 923–943, https://doi.org/10.5194/amt-14-923-2021, 2021.
Carbone, C., Decesari, S., Paglione, M., Giulianelli, L., Rinaldi, M., Marinoni, A., Cristofanelli, P., Didiodato, A., Bonasoni, P., Fuzzi, S., and Facchini, M. C.: 3-year chemical composition of free tropospheric PM1 at the Mt. Cimone GAW global station – South Europe – 2165 m a.s.l., Atmos. Environ., 87, 218–227, https://doi.org/10.1016/j.atmosenv.2014.01.048, 2014.
Collaud Coen, M., Andrews, E., Aliaga, D., Andrade, M., Angelov, H., Bukowiecki, N., Ealo, M., Fialho, P., Flentje, H., Hallar, A. G., Hooda, R., Kalapov, I., Krejci, R., Lin, N.-H., Marinoni, A., Ming, J., Nguyen, N. A., Pandolfi, M., Pont, V., Ries, L., Rodríguez, S., Schauer, G., Sellegri, K., Sharma, S., Sun, J., Tunved, P., Velasquez, P., and Ruffieux, D.: Identification of topographic features influencing aerosol observations at high altitude stations, Atmos. Chem. Phys., 18, 12289–12313, https://doi.org/10.5194/acp-18-12289-2018, 2018.
de Arruda Moreira, G., Guerrero-Rascado, J. L., Bravo-Aranda, J. A., Benavent-Oltra, J. A., Ortiz-Amezcua, P., Róman, R., Bedoya-Velásquez, A. E., Landulfo, E., and Alados-Arboledas, L.: Study of the planetary boundary layer by microwave radiometer, elastic lidar and Doppler lidar estimations in Southern Iberian Peninsula, Atmos. Res., 213, 185–195, https://doi.org/10.1016/j.atmosres.2018.06.007, 2018.
Diapouli, E., Kalogridis, A.-C., Markantonaki, C., Vratolis, S., Fetfatzis, P., Colombi, C., and Eleftheriadis, K.: Annual Variability of Black Carbon Concentrations Originating from Biomass and Fossil Fuel Combustion for the Suburban Aerosol in Athens, Greece, Atmosphere, 8, 234, https://doi.org/10.3390/atmos8120234, 2017.
Drewnick, F., Hings, S. S., Decarlo, P., Jayne, J. T., Gonin, M., Fuhrer, K., Weimer, S., Jimenez, J. L., Demerjian, K. L., Borrmann, S., and Worsnop, D. R.: Aerosol Science and Technology A New Time-of-Flight Aerosol Mass Spectrometer (TOF-AMS) Instrument Description and First Field Deployment, Aeros. Sci. Technol., 39, 637–658, 2005.
Draxler, R. R. and Hess, G. D.: An overview of the HYSPLIT4 modeling system of trajectories, dispersion, and deposition, Aust. Meteorol. Mag., 47, 295–308, 1998.
Efron, B.: The Bootstrap and Modern Statistics, J. Am. Stat. Assoc., 95, 1293–1296, https://doi.org/10.1080/01621459.2000.10474333, 2000.
Ervens, B., Sorooshian, A., Aldhaif, A. M., Shingler, T., Crosbie, E., Ziemba, L., Campuzano-Jost, P., Jimenez, J. L., and Wisthaler, A.: Is there an aerosol signature of chemical cloud processing?, Atmos. Chem. Phys., 18, 16099–16119, https://doi.org/10.5194/acp-18-16099-2018, 2018.
Farah, A., Freney, E., Canonaco, F., Prévôt, A. S. H., Pichon, J., Abboud, M., Farah, W., and Sellegri, K.: Altitude Aerosol Measurements in Central France: Seasonality, Sources and Free-Troposphere/Boundary Layer Segregation, Earth Space Sci., 8, e2019EA001018, https://doi.org/10.1029/2019EA001018, 2021.
Foskinis, R., Gao, K., Gini, M. I., Diapouli, E., Vratolis, S., Granakis, K., Zografou, O., Kokkalis, P., Komppula, M., Vakkari, V., Eleftheriadis, K., Nenes, A., and Papayannis, A.: The Influence of the Planetary Boundary Layer on the Atmospheric State at an Orographic Site at the Eastern Mediterranean, Tellus B, 76, 19–31, https://doi.org/10.16993/tellusb.1876, 2024a.
Foskinis, R., Motos, G., Gini, M. I., Zografou, O., Gao, K., Vratolis, S., Granakis, K., Vakkari, V., Violaki, K., Aktypis, A., Kaltsonoudis, C., Shi, Z., Komppula, M., Pandis, S. N., Eleftheriadis, K., Papayannis, A., and Nenes, A.: Drivers of Droplet Formation in East Mediterranean Orographic Clouds, EGUsphere [preprint], https://doi.org/10.5194/egusphere-2024-490, 2024b.
Fröhlich, R., Cubison, M. J., Slowik, J. G., Bukowiecki, N., Canonaco, F., Croteau, P. L., Gysel, M., Henne, S., Herrmann, E., Jayne, J. T., Steinbacher, M., Worsnop, D. R., Baltensperger, U., and Prévôt, A. S. H.: Fourteen months of on-line measurements of the non-refractory submicron aerosol at the Jungfraujoch (3580 m a.s.l.) – chemical composition, origins and organic aerosol sources, Atmos. Chem. Phys., 15, 11373–11398, https://doi.org/10.5194/acp-15-11373-2015, 2015.
Gao, K., Vogel, F., Foskinis, R., Vratolis, S., Gini, M. I., Granakis, K., Billault-Roux, A.-C., Georgakaki, P., Zografou, O., Fetfatzis, P., Berne, A., Papagiannis, A., Eleftheridadis, K., Möhler, O., and Nenes, A.: Biological and dust aerosol as sources of ice nucleating particles in the Eastern Mediterranean: source apportionment, atmospheric processing and parameterization, EGUsphere [preprint], https://doi.org/10.5194/egusphere-2024-511, 2024.
Gerber, H., Frick, G., and Rodi, A. R.: Ground-Based FSSP and PVM Measurements of Liquid Water Content, J. Atmos. Ocean. Technol., 16, 1143–1149, https://doi.org/10.1175/1520-0426(1999)016<1143:GBFAPM>2.0.CO;2, 1999.
Hauglustaine, D. A., Balkanski, Y., and Schulz, M.: A global model simulation of present and future nitrate aerosols and their direct radiative forcing of climate, Atmos. Chem. Phys., 14, 11031–11063, https://doi.org/10.5194/acp-14-11031-2014, 2014.
Henne, S., Furger, M., and Prévôt, A. S. H.: Climatology of mountain venting induced moisture layers in the lee of the Alps, J. Appl. Meteorol. Climatol., 44, 620–633, 2005.
Herrmann, E., Gysel, M., Weingartner, E., Henne, S., Bukowiecki, N., Hammer, E., Juranyi, Z., Collaud Coen, M., Vuilleumier, L., Steinbacher, M., Conen, F., and Baltensperger, U.: Analysis of long-term aerosol size distribution data from Jungfraujoch with emphasis on free tropospheric conditions, cloud influence, and air mass transport, J. Geophys. Res., 120, 9459–9480, https://doi.org/10.1002/2015JD023660, 2015.
IPCC: Climate Change 2021: The Physical Science Basis, Contribution of Working Group I to the Sixth Assessment Report of the Intergovernmental Panel on Climate Change, edited by: Masson-Delmotte, V., Zhai, P., Pirani, A., Connors, S. L., Péan, C., Berger, S., Caud, N., Chen, Y., Goldfarb, L., Gomis, M. I., Huang, M., Leitzell, K., Lonnoy, E., Matthews, J. B. R., Maycock, T. K., Waterfield, T., Yelekçi, O., Yu, R., and Zhou, B., Cambridge University Press, Cambridge, United Kingdom and New York, NY, USA, https://doi.org/10.1017/9781009157896, 2023.
Jayne, J. T., Leard, D. C., Zhang, X., Davidovits, P., Smith, K. A., Kolb, C. E., and Worsnop, D. R.: Development of an Aerosol Mass Spectrometer for Size and Composition Analysis of Submicron Particles, Aeros. Sci. Technol., 33, 49–70, 2000.
Manousakas, M., Diapouli, E., Papaefthymiou, H., Kantarelou, V., Zarkadas, C., Kalogridis, A.-C., Karydas, A.-G., and Eleftheriadis, K.: XRF characterization and source apportionment of PM10 samples collected in a coastal city, X-Ray Spectrometry, 47, 190–200, https://doi.org/10.1002/xrs.2817, 2018.
McClure, C. D., Jaffe, D. A., and Gao, H.: Carbon Dioxide in the Free Troposphere and Boundary Layer at the Mt. Bachelor Observatory, Aerosol Air Qual. Res., 16, 717–728, https://doi.org/10.4209/aaqr.2015.05.0323, 2016.
Mészáros, A. and Vissy, K.: Concentration, size distribution and chemical nature of atmospheric aerosol particles in remote oceanic areas, J. Aerosol Sci., 5, 101–109, https://doi.org/10.1016/0021-8502(74)90011-1, 1974.
Middlebrook, A. M., Bahreini, R., Jimenez, J. L., and Canagaratna, M. R.: Evaluation of composition-dependent collection efficiencies for the aerodyne aerosol mass spectrometer using field data, 46, 258–271, https://doi.org/10.1080/02786826.2011.620041, 2012.
Mukherjee, S., Singla, V., Pandithurai, G., Safai, P. D., Meena, G. S., Dani, K. K., and Anil Kumar, V.: Seasonal variability in chemical composition and source apportionment of sub-micron aerosol over a high altitude site in Western Ghats, India, Atmos. Environ., 180, 79–92, https://doi.org/10.1016/j.atmosenv.2018.02.048, 2018.
Myhre, G., Shindell, D., Bréon, F.-M., Collins, W., Fuglestvedt, J., Huang, J., Koch, D., Lamarque, J.-F., Lee, D., Mendoza, B., Nakajima, T., Robock, A., Stephens, G., Takemura, T., and Zhang, H.: Climate Change 2013: The Physical Science Basis. Contribution of Working Group I to the Fifth Assessment Report of the Intergovernmental Panel on Climate Change, edited by: Tignor, M., Allen, S. K., Boschung, J., Nauels, A., Xia, Y., Bex, V., and Midgley, P. M., Cambridge University Press: Cambridge, UK, New York, NY, USA, 2013.
Newsom, R. and Krishnamurthy, R.: Doppler Lidar (DL) Instrument Handbook, U.S. Department of Energy, Atmospheric Radiation Measurement user facility, Richland, Washington, DOE/SCARM-TR-101, https://doi.org/10.2172/1034640, 2022.
Paatero, P.: The Multilinear Engine: A Table-Driven, Least Squares Program for Solving Multilinear Problems, including the n-Way Parallel Factor Analysis Model, J. Comput. Graph. Stat., 8, 854–888, https://doi.org/10.2307/1390831, 1999.
Paatero, P. and Hopke, P. K.: Discarding or downweighting high-noise variables in factor analytic models, Anal. Chim. Acta, 490, 277–289, https://doi.org/10.1016/S0003-2670(02)01643-4, 2003.
Pandis, S. N., Harley, R. A., Cass, G. R., and Seinfeld, J. H.: Secondary organic aerosol formation and transport, Atmos. Environ. Pt. A, 26, 2269–2282, 1992.
Prévôt, A. S. H., Dommen, J., and Baumle, M.: Influence of road traffic on volatile organic compound concentrations in and above a deep Alpine valley, Atmos. Environ., 34, 4719–4726, https://doi.org/10.1016/s1352-2310(00)00254-5, 2000
Rinaldi, M., Gilardoni, S., Paglione, M., Sandrini, S., Fuzzi, S., Massoli, P., Bonasoni, P., Cristofanelli, P., Marinoni, A., Poluzzi, V., and Decesari, S.: Organic aerosol evolution and transport observed at Mt. Cimone (2165 m a.s.l.), Italy, during the PEGASOS campaign, Atmos. Chem. Phys., 15, 11327–11340, https://doi.org/10.5194/acp-15-11327-2015, 2015.
Ripoll, A., Minguillón, M. C., Pey, J., Jimenez, J. L., Day, D. A., Sosedova, Y., Canonaco, F., Prévôt, A. S. H., Querol, X., and Alastuey, A.: Long-term real-time chemical characterization of submicron aerosols at Montsec (southern Pyrenees, 1570 m a.s.l.), Atmos. Chem. Phys., 15, 2935–2951, https://doi.org/10.5194/acp-15-2935-2015, 2015.
Rose, C., Collaud Coen, M., Andrews, E., Lin, Y., Bossert, I., Lund Myhre, C., Tuch, T., Wiedensohler, A., Fiebig, M., Aalto, P., Alastuey, A., Alonso-Blanco, E., Andrade, M., Artíñano, B., Arsov, T., Baltensperger, U., Bastian, S., Bath, O., Beukes, J. P., Brem, B. T., Bukowiecki, N., Casquero-Vera, J. A., Conil, S., Eleftheriadis, K., Favez, O., Flentje, H., Gini, M. I., Gómez-Moreno, F. J., Gysel-Beer, M., Hallar, A. G., Kalapov, I., Kalivitis, N., Kasper-Giebl, A., Keywood, M., Kim, J. E., Kim, S.-W., Kristensson, A., Kulmala, M., Lihavainen, H., Lin, N.-H., Lyamani, H., Marinoni, A., Martins Dos Santos, S., Mayol-Bracero, O. L., Meinhardt, F., Merkel, M., Metzger, J.-M., Mihalopoulos, N., Ondracek, J., Pandolfi, M., Pérez, N., Petäjä, T., Petit, J.-E., Picard, D., Pichon, J.-M., Pont, V., Putaud, J.-P., Reisen, F., Sellegri, K., Sharma, S., Schauer, G., Sheridan, P., Sherman, J. P., Schwerin, A., Sohmer, R., Sorribas, M., Sun, J., Tulet, P., Vakkari, V., Van Zyl, P. G., Velarde, F., Villani, P., Vratolis, S., Wagner, Z., Wang, S.-H., Weinhold, K., Weller, R., Yela, M., Zdimal, V., and Laj, P.: Seasonality of the particle number concentration and size distribution: a global analysis retrieved from the network of Global Atmosphere Watch (GAW) near-surface observatories, Atmos. Chem. Phys., 21, 17185–17223, https://doi.org/10.5194/acp-21-17185-2021, 2021.
Roth, A., Schneider, J., Klimach, T., Mertes, S., van Pinxteren, D., Herrmann, H., and Borrmann, S.: Aerosol properties, source identification, and cloud processing in orographic clouds measured by single particle mass spectrometry on a central European mountain site during HCCT-2010, Atmos. Chem. Phys., 16, 505–524, https://doi.org/10.5194/acp-16-505-2016, 2016.
Seinfeld, J. H. and Pandis, S. N.: Atmospheric chemistry and physics: from air pollution to climate change, Wiley, 1236 pp., ISBN: 1118947401, 9781118947401, 2006.
Singla, V., Mukherjee, S., Pandithurai, G., Dani, K. K., and Safai, P. D.: Evidence of Organonitrate Formation at a High Altitude Site, Mahabaleshwar, during the Pre-monsoon Season, Aerosol Air Qual. Res., 19, 1241–1251, https://doi.org/10.4209/aaqr.2018.03.0110, 2019.
Stathopoulos, V. K., Evangeliou, N., Stohl, A., Vratolis, S., Matsoukas, C., and Eleftheriadis, K.: Large Circulation Patterns Strongly Modulate Long-Term Variability of Arctic Black Carbon Levels and Areas of Origin, Geophys. Res. Lett., 48, e2021GL092876, https://doi.org/10.1029/2021GL092876, 2021.
Stein, A. F., Draxler, R. R., Rolph, G. D., Stunder, B. J., Cohen, M. D., and Ngan, F.: NOAA's HYSPLIT atmospheric transport and dispersion modeling system, 96, 2059–2077, https://doi.org/10.1175/BAMS-D-14-00110.1, 2015.
Stohl, A., Forster, C., Frank, A., Seibert, P., and Wotawa, G.: Technical note: The Lagrangian particle dispersion model FLEXPART version 6.2, Atmos. Chem. Phys., 5, 2461–2474, https://doi.org/10.5194/acp-5-2461-2005, 2005.
Stull, R.: Practical meteorology: an algebra-based survey of atmospheric science, University of British Columbia, ISBN-10: 0888651767, ISBN-13: 978-0888651761, 2016.
Sun, J., Hermann, M., Yuan, Y., Birmili, W., Collaud Coen, M., Weinhold, K., Madueño, L., Poulain, L., Tuch, T., Ries, L., Sohmer, R., Couret, C., Frank, G., Brem, B. T., Gysel-Beer, M., Ma, N., and Wiedensohler, A.: Long-term trends of black carbon and particle number concentration in the lower free troposphere in Central Europe, Environ. Sci. Europ., 33, 47, https://doi.org/10.1186/s12302-021-00488-w, 2021.
Ulbrich, I. M., Canagaratna, M. R., Zhang, Q., Worsnop, D. R., and Jimenez, J. L.: Interpretation of organic components from Positive Matrix Factorization of aerosol mass spectrometric data, Atmos. Chem. Phys., 9, 2891–2918, https://doi.org/10.5194/acp-9-2891-2009, 2009.
Vasilakopoulou, C. N., Florou, K., Kaltsonoudis, C., Stavroulas, I., Mihalopoulos, N., and Pandis, S. N.: Development and evaluation of an improved offline aerosol mass spectrometry technique, Atmos. Meas. Tech., 16, 2837–2850, https://doi.org/10.5194/amt-16-2837-2023, 2023.
Vratolis, S., Diapouli, E., Manousakas, M. I., Almeida, S. M., Beslic, I., Kertesz, Z., Samek, L., and Eleftheriadis, K.: A new method for the quantification of ambient particulate-matter emission fluxes, Atmos. Chem. Phys., 23, 6941–6961, https://doi.org/10.5194/acp-23-6941-2023, 2023.
Worden, H. M., Deeter, M. N., Frankenberg, C., George, M., Nichitiu, F., Worden, J., Aben, I., Bowman, K. W., Clerbaux, C., Coheur, P. F., De Laat, A. T. J., Detweiler, R., Drummond, J. R., Edwards, D. P., Gille, J. C., Hurtmans, D., Luo, M., Martínez-Alonso, S., Massie, S., Pfister, G., and Warner, J. X.: Decadal record of satellite carbon monoxide observations, Atmos. Chem. Phys., 13, 837–850, https://doi.org/10.5194/acp-13-837-2013, 2013.
Yuan, Y., Ries, L., Petermeier, H., Steinbacher, M., Gómez-Peláez, A. J., Leuenberger, M. C., Schumacher, M., Trickl, T., Couret, C., Meinhardt, F., and Menzel, A.: Adaptive selection of diurnal minimum variation: a statistical strategy to obtain representative atmospheric CO2 data and its application to European elevated mountain stations, Atmos. Meas. Tech., 11, 1501–1514, https://doi.org/10.5194/amt-11-1501-2018, 2018.
Zhang, Y., Forrister, H., Liu, J., Dibb, J., Anderson, B., Schwarz, J. P., Perring, A. E., Jimenez, J. L., Campuzano-Jost, P., Wang, Y., Nenes A., and Weber, R. J.: Top-of-Atmosphere Radiative Forcing Affected by Brown Carbon in the Upper Troposphere, Nat. Geosci., 10, 486–489, https://doi.org/10.1038/ngeo2960, 2017.
Zhou, S., Collier, S., Jaffe, D. A., and Zhang, Q.: Free tropospheric aerosols at the Mt. Bachelor Observatory: more oxidized and higher sulfate content compared to boundary layer aerosols, Atmos. Chem. Phys., 19, 1571–1585, https://doi.org/10.5194/acp-19-1571-2019, 2019.
Zografou, O., Gini, M., Manousakas, M. I., Chen, G., Kalogridis, A. C., Diapouli, E., Pappa, A., and Eleftheriadis, K.: Combined organic and inorganic source apportionment on yearlong ToF-ACSM dataset at a suburban station in Athens, Atmos. Meas. Tech., 15, 4675–4692, https://doi.org/10.5194/amt-15-4675-2022, 2022.