the Creative Commons Attribution 4.0 License.
the Creative Commons Attribution 4.0 License.
 | 29 Jul 2024
Measurement report: Impact of cloud processes on secondary organic aerosols at a forested mountain site in southeastern China
Zijun Zhang
Weiqi Xu
Yi Zhang
Xiangyu Xu
Aodong Du
Yinzhou Zhang
Hongqin Qiao
Xiaole Pan
Zifa Wang
Xueling Cheng
Lanzhong Liu
Qingyan Fu
Douglas R. Worsnop
Jie Li
Aerosol particles play critical roles in climate and human health. However, aerosol composition and evolution, particularly secondary organic aerosol (SOA), and aerosol interactions with clouds in high-altitude background areas in China remain less understood. Here, we conducted real-time measurements of submicron aerosols (PM1) using aerosol mass spectrometers at a forested mountain site (1128 m a.s.l.) in southeastern China in November 2022. The average (±1σ) PM1 mass concentration was 4.3±4.8 µg m−3, which was ubiquitously lower than that at other mountain sites in China. Organic aerosol (OA) constituted the largest fraction of PM1 (42.9 %) and was predominantly secondary, as indicated by the high oxygen-to-carbon (O C) ratio (0.85–0.96) and carbon oxidation state (0.21–0.49). Notably, the remarkably enhanced PM1 concentrations observed during the daytime on cloudless days were identified to be likely to be produced from cloud evaporation. While more oxidized oxygenated OA was scavenged efficiently during cloud events, cloud evaporation was found to release a significant amount of less oxidized oxygenated OA from air masses transported from polluted regions. The distinct decrease in OA ΔCO with the increase in O C during the cloud evaporative period further demonstrates that OA remaining in cloud droplets is generally in a moderate oxidation state. Moreover, organic nitrates were also estimated and showed a higher contribution to the total nitrate during the cloudy period (27 %) than during the evaporative period (3 %). Overall, our results demonstrate the importance of SOA and the influences of cloud processes in regional mountain areas in southeastern China.
- Article
(8991 KB) - Full-text XML
-
Supplement
(7592 KB) - BibTeX
- EndNote


Aerosol particles play essential roles in regional and global climate (Ramanathan et al., 2001; Kanakidou et al., 2005), as well as in air pollution (Huang et al., 2014) and public health (Kampa and Castanas, 2008). Submicron aerosol (PM1) from both natural and anthropogenic sources can be transported to the upper level of the atmospheric boundary layer or even the lower free troposphere through convection and frontal uplift (Huang et al., 2020; Carbone et al., 2014). At high altitudes, aerosol species can be transported over longer distances, depending on their particle sizes and compositions (Pokorná et al., 2022; Tang et al., 2016; Zhong et al., 2022), and the aging processes during transport results in continuous changes in chemical and physical properties (Calvo et al., 2013; Hallquist et al., 2009). Aerosols can have an important impact on cloud condensation nuclei (CCN) properties at high altitudes where atmospheric conditions favor the formation of clouds, thereby affecting the lifetime and optical properties of clouds through aerosol–cloud interactions (Haywood and Boucher, 2000; Asmi et al., 2012; Rejano et al., 2021). On the other hand, aerosol–cloud interactions also modify the chemical composition of aerosols within cloud droplets. This modification, in turn, affects the characteristics of surrounding aerosols after the cloud has evaporated (Roth et al., 2016). As a result, measurements of high-altitude regional aerosols are of great importance for a better understanding of aerosol–cloud interactions and their impacts on air pollution and climate.
Mountain sites are crucial platforms for studying aerosol characteristics over regional scales and the influences of diverse emission sources (e.g., biomass burning, industrial process, and biogenic emissions) and atmospheric processes (e.g., in-cloud processing and new particle formation). Compared to balloon and aircraft observations, mountain sites have advantages in continuous and long-term observations because of low costs, a stable geographic location, and accessibility for instrument maintenance. In addition, the different meteorological conditions at mountain sites can have great impacts on aerosol formation, aging, and scavenging patterns. For example, Gao et al. (2023) showed that cloud processes can promote the formation of secondary organic aerosol (SOA) by multiphase oxidation. Li et al. (2013) found that high relative humidity at Mt. Hua can lead to a reduction in particle acidity and can thus reduce the formation of biogenic SOA by suppressing the acid catalysis reaction. Chen et al. (2021) reported that fog scavenging was more efficient for particles with aerodynamic diameters larger than 700 nm in Taiwanese mountain regions, while the majority of smaller particles remained unscavenged and could grow into larger particles through gas-to-aqueous partitioning. Although several mountain stations have been established in China to gain more information on the chemical composition and sources (Zhang et al., 2014, 2018, 2019; Du et al., 2015), optical properties (Wang et al., 2015), and hygroscopic properties of aerosols (Ding et al., 2021), most of these studies are conducted on the Qinghai–Tibetan Plateau and in the North China Plain (NCP), while the studies in southeastern China remain scarce.
In this work, a high-resolution time-of-flight aerosol mass spectrometer (AMS hereafter) and a quadruple aerosol chemical speciation monitor (ACSM hereafter) were deployed at a forested mountain site in southeastern China. The chemical composition and properties of PM1 are characterized, the elemental composition and oxidation state of OA are determined, and the potential transport pathways of PM1 are also investigated using back trajectory analysis. Furthermore, the effect of cloud processes on aerosol species is discussed. The sources of organic aerosol are investigated using positive matrix factorization (PMF) analysis of combined high-resolution organic and inorganic aerosol mass spectra. Particularly, particulate organic nitrates (ONs) are determined and quantified based on PMF results.
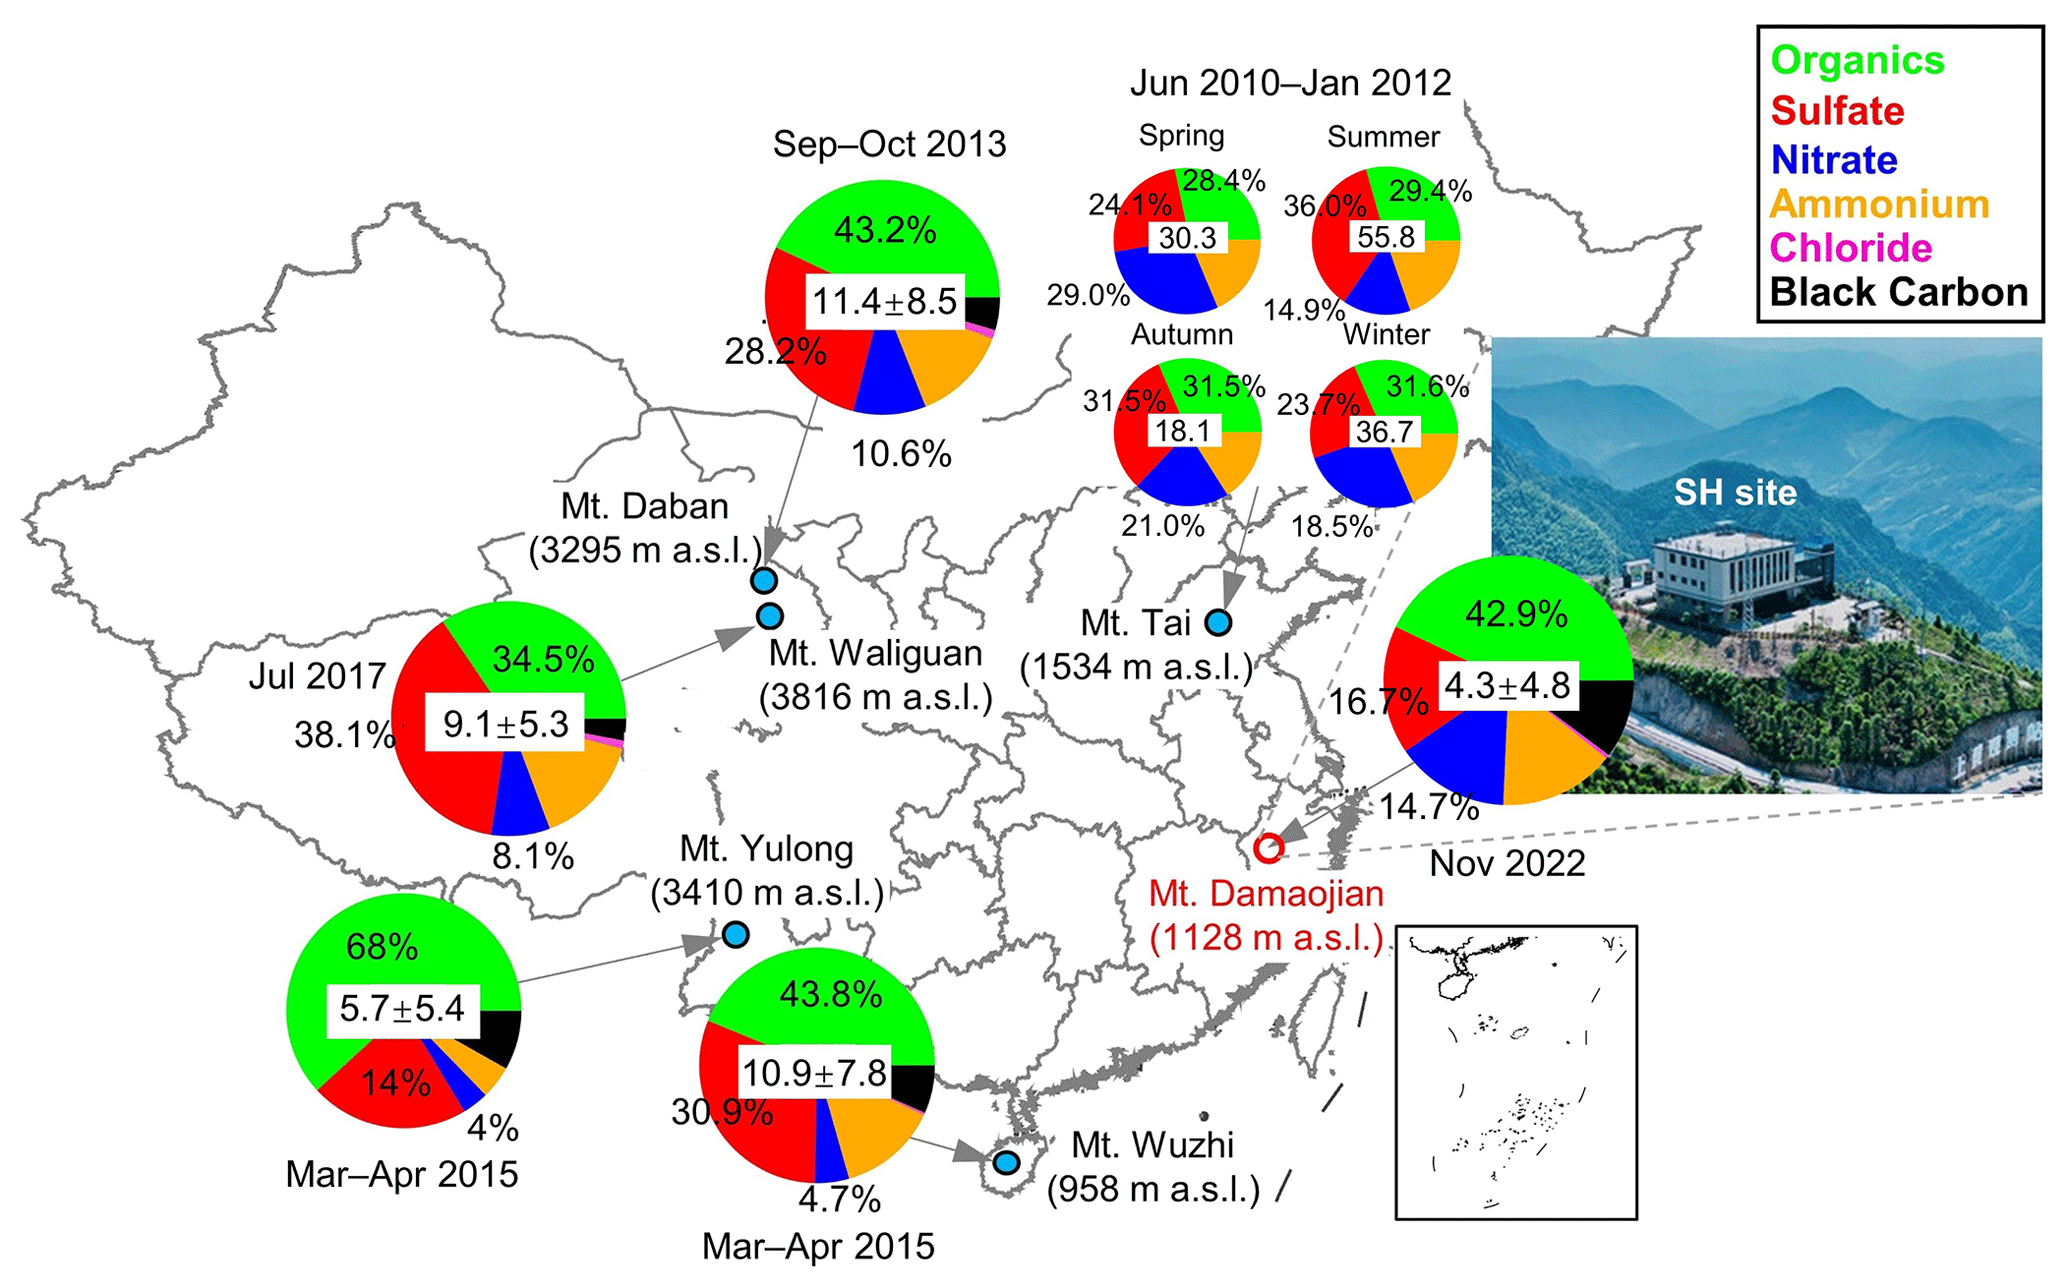
Figure 1Location of the sampling site (Mt. Damaojian). The mean concentration (µg m−3) and chemical composition of submicron aerosols (NR-PM1 + BC) measured at selected mountain sites in China are also shown. Note that BC and chloride are not accounted for at Mt. Tai due to the lack of measurements. Detailed information on these sampling sites is presented in Table S3 in the Supplement. Publisher's remark: please note that the above figure contains disputed territories.
2.1 Site and instrumentation
The campaign was carried out from 1 November to 30 November 2022 at Shanghuang Eco-Environmental Observatory of the Chinese Academy of Sciences (SH), located at Mt. Damaojian (28.58° N, 119.51° E; 1128 m a.s.l.) in Wuyi County, Zhejiang Province (Fig. 1). This site is a typical background site in southeastern China that is surrounded by mountains and forests, and there are no strong local anthropogenic sources nearby.
PM1 species were measured using a suite of real-time instruments with 1–20 min time resolution, including an AMS operated under the V-mode and a quadrupole ACSM for non-refractory (NR)-PM1 composition, together with a seven-wavelength aethalometer (AE33, Magee Scientific Corp.) for equivalent black carbon (BC) mass concentration. The AMS measurements were only conducted during two periods (15–20 and 24–28 November) in this study due to the malfunctioning of the instrument. Briefly, ambient aerosol particles were sampled into an air-conditioned room through a stainless-steel tube (outside diameter in.), and the residence time was estimated to be 5 s. A Nafion dryer was placed upstream of the ACSM and AMS to remove the moisture; after that, aerosol particles were sampled into the AMS, ACSM, and AE33. Because there was no size cutoff in front of the sampling line, the AMS and ACSM may report slightly higher concentrations than expected due to measuring some cloud droplets larger than 2.5 µm. According to a previous study during three fog episodes at a rural site in the North China Plain, the influence of fog droplets on submicron aerosol measurements was less than 20 % (Kuang et al., 2024). Simultaneously, air pollutants including NOx and O3 were measured by a suite of gas analyzers (Thermo Scientific Inc., USA); PM2.5 and PM10 were measured using continuous ambient particulate monitors, with PM2.5 and PM10 being cut off before the sampling inlet (Model 5014i, Thermo Scientific., USA); and CO was measured by a Picarro greenhouse gas analyzer (G2401, Picarro Inc., USA). Meteorological parameters including temperature (T), relative humidity (RH), wind speed (WS), wind direction (WD), and pressure (P) were measured by an automatic weather station. In addition, the particle depolarization ratio (PDR) was measured by a particle monitoring lidar (CAS-EO Co., Ltd) to analyze the vertical distribution of aerosol particles, and the hourly boundary layer height (BLH) was obtained from European Reanalysis 5 (ERA5) reanalysis dataset. More details and descriptions of the instruments and data are provided in Table S1.
2.2 Data analysis
2.2.1 ACSM and AMS
ACSM data were analyzed using ACSM standard data analysis software (v2.5.13), and AMS data were analyzed using SQUIRREL v1.65F and PIKA v1.25F. A composition-dependent collection efficiency (CDCE) was applied to the ACSM and AMS data according to Middlebrook et al. (2012). Elemental analysis of high-resolution mass spectra (HRMS) was performed using the “Improved-Ambient” (I-A) method (Canagaratna et al., 2015). The default relative ionization efficiency (RIE) values of 1.1, 1.4, and 1.3 were applied for nitrate, organics, and chloride (Nault et al., 2023). According to the ion efficiency (IE) calibration results using ammonium sulfate, the RIE values of ammonium and sulfate were 5.05 and 0.73 for the ACSM and 5.26 and 1.28 for the AMS. Additionally, the detection limits of the ACSM and AMS for different NR-PM1 species are determined to be 3 times the standard deviation of mass concentrations during a period (16–20 November) with low particle concentration (Table S2). Detailed comparisons of the concentrations of NR-PM1 species measured by the AMS and ACSM are shown in Fig. S1. The concentrations of NR-PM1 species measured by the ACSM correlated well with those measured by the AMS (r2= 0.35–0.97), except for chloride (r2=0.18). This is likely due to the low ambient chloride masses at this background site, which are close to or below the ACSM detection limit. Also, the non-ideal vaporization behavior of chloride in the ACSM may be another reason. Notably, similar slopes (0.62–0.74) were found for organics, sulfate, nitrate, and ammonium measured by the AMS and ACSM, indicating a general overestimation by the ACSM. The possible systematic bias in IE calibration of the ACSM using ammonium sulfate could be a potential cause. Therefore, the ACSM data collected during the sampling period were scaled to the AMS data using these linear regression slopes. As shown in Figs. S1g and h, after this adjustment, the concentrations of NR-PM1 tracked well with PM2.5 (r2=0.60 and slope = 0.48 for the ACSM, r2=0.93 and slope = 0.54 for the AMS) and PM10 (r2=0.53 and slope = 0.27 for the ACSM, r2=0.99 and slope = 0.39 for the AMS) measured by the particle monitor, suggesting that the AMS and ACSM quantification was reasonable.
The PMF evaluation tool (PET v3.04) was employed to further deconvolve the HRMS derived from the AMS into different source factors following the procedures reported by Ulbrich et al. (2009) and Zhang et al. (2011). In addition to organic fragment ions, the major fragment ions of inorganic species – i.e., SO+ (), SO (), SO (), HSO (), and H2SO () for sulfate; NO+ () and NO () for nitrate; NH+ (), NH (), and NH () for ammonium; and Cl+ () and HCl+ () for chloride – were also included in the HR data and error matrices for PMF. A more detailed description of the procedures was given in Sun et al. (2012). After checking the key diagnostic plots (Fig. S2), mass spectra, and the correlations with related tracers, a four-factor solution was considered to be the optimal solution in this study (Sect. S1).
2.2.2 Estimation of organic nitrates
ONs were estimated from the PMF results (Zhang et al., 2011; Xu et al., 2015). Briefly, NO (i.e., NO+ and NO) are major fragments of nitrate functionality (−ONO2), which can be referred to as the total nitrate measured by AMS. Combining inorganic with organic mass spectra in PMF, NO+ and NO can be separated into different organic aerosol (OA) factors and an inorganic nitrate aerosol (INA) factor. According to previous studies, the ratios of NO+ NO for ONs are approximately 2.25–3.7 times higher than pure NH4NO3 (Fry et al., 2009, 2013). Consistently, the PMF results in our study (Fig. 6) show that the average NO+ NO ratios of less oxidized oxygenated OA (LO-OOA) and more oxidized oxygenated OA MO-OOA were 13.19 and 11.2, falling within the range of ONs. In contrast, a NO+ NO ratio of 3.56 was observed for INA, reflecting the characteristics of inorganic nitrates. Therefore, the PMF analysis of nitrate is reasonable, and, based on this result, the mass concentration of ONs (NO3,org) can be calculated by summing these two ion signals distributed in all OA factors as follows:
where [OA factor]i represents the mass concentration of the OA factor i resolved by PMF, and and are the mass fractions of NO+ and NO in the OA factor i, respectively.
2.2.3 Backward trajectory analysis
The Hybrid Single-Particle Lagrangian Integrated Trajectories (HYSPLIT) model and meteorological data from the NOAA Global Data Assimilation System (GDAS) were used to calculate 72 h backward trajectories at the SH site. The trajectory arrival time was set to be from 00:00 to 23:00 (UTC+8) at 1 h intervals, and the arrival height at the site was set to be 1100 m. To further show the aerosol particle concentration levels in different regions, the map containing the back trajectory (Fig. S7) was colored according to the time-averaged organic carbon surface mass concentration from the M2T1NXAER v5.12.4 dataset (0.5×0.625°, hourly). This dataset, part of the Modern-Era Retrospective analysis for Research and Applications version 2 (MERRA-2) model (Gelaro et al., 2017), was sourced from the NASA Giovanni website (https://giovanni.gsfc.nasa.gov, last access: 23 July 2024).
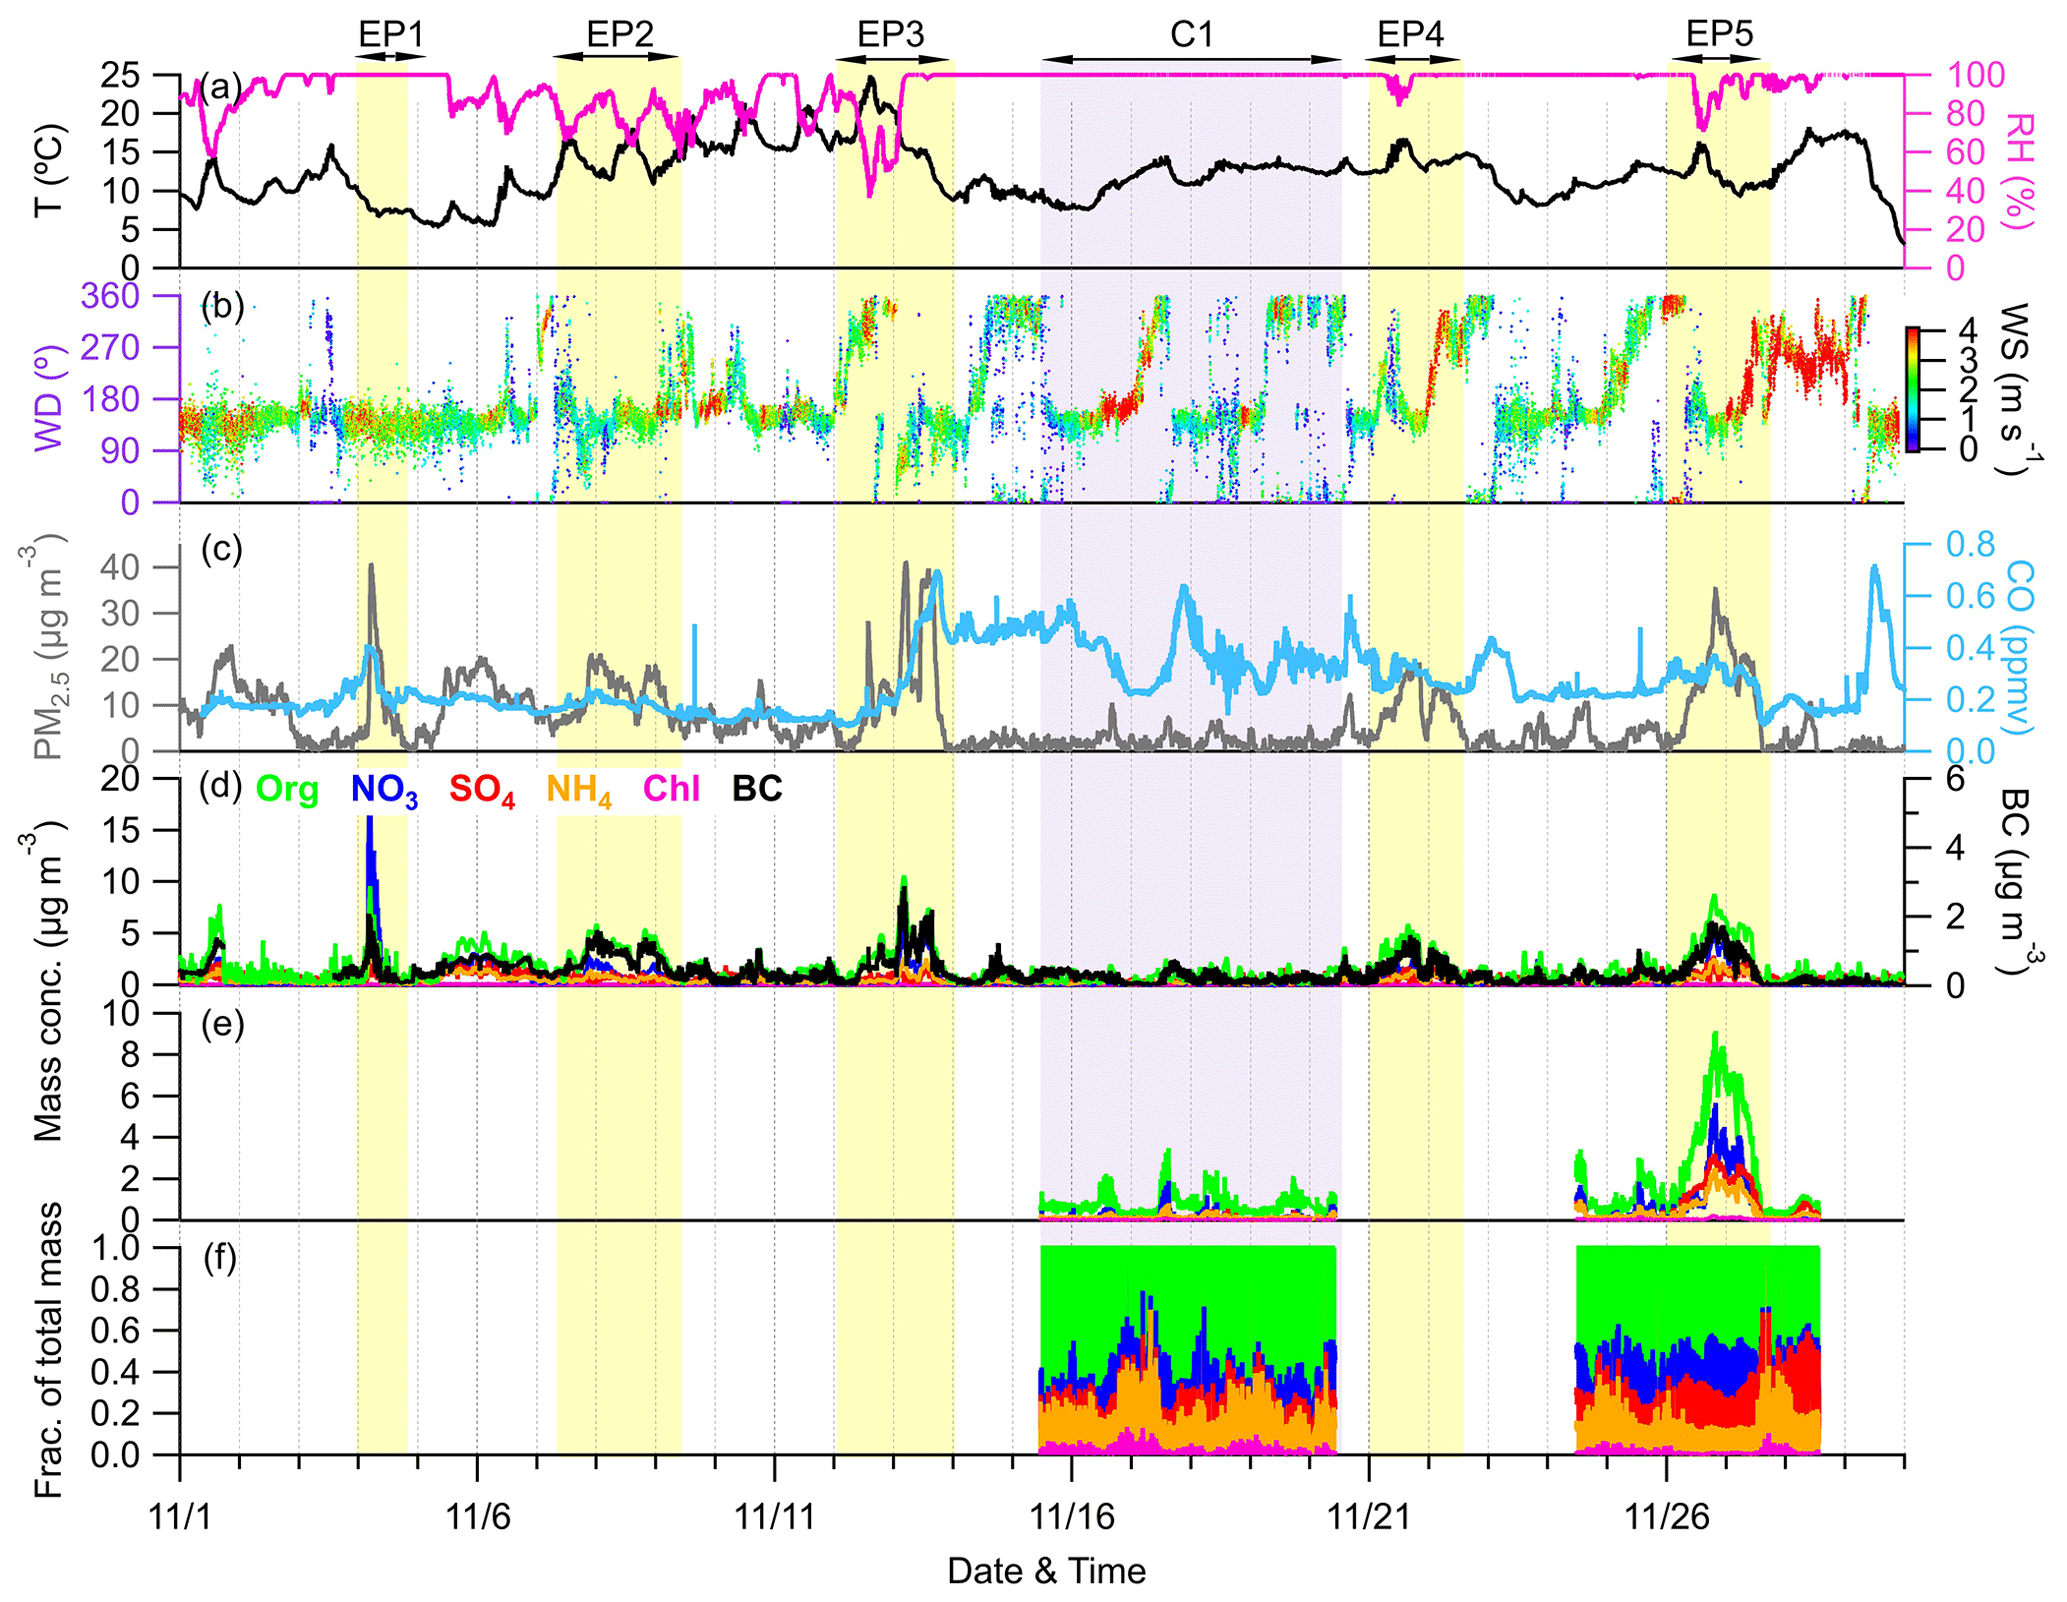
Figure 2Time series of (a) T and RH, (b) WD colored according to WS, (c) mass concentration of PM2.5 and mixing ratio of CO, (d) mass concentrations of NR-PM1 species measured by ACSM together with BC measured by AE33, and (e, f) mass concentrations and contributions of NR-PM1 species measured by the AMS. The yellow- and purple-shaded areas represent six selected episodes (EP1–EP5 and C1, respectively).
3.1 Mass concentration and chemical composition of submicron aerosols
Figure 2 shows the time series of meteorological parameters (T, RH, WD, and WS) and air pollutants (PM2.5 and CO), along with PM1 (NR-PM1 + BC) species, during the campaign. The total PM1 concentration varied dynamically from 0.3 µg m−3 to 39.8 µg m−3 during the whole sampling period, with an average (±1σ) of 4.3±4.8 µg m−3. As shown in Fig. 1, organics accounted for the largest contribution (42.9 %) to the total PM1 during the sampling period, followed by sulfate (16.7 %), ammonium (15.0 %), nitrate (14.7 %), BC (10.2 %), and chloride (0.5 %). In addition, BC was observed to correlate well with PM1 and PM2.5 (r2=0.59 and 0.62, respectively), suggesting the potential influences of regional biomass burning plumes in the Yangtze River Delta (YRD) on aerosol particles at this site (Zhang et al., 2015). The concentration and composition of PM1 are quite different from those observed at other Chinese mountain sites in different seasons (Fig. 1). For example, the average PM1 concentration here was much lower compared to at Mt. Wuzhi (10.9±7.8 µg m−3) at a similar altitude and was also slightly lower than that at higher-altitude mountains such as Mt. Yulong (5.7±5.4 µg m−3) and Mt. Waliguan (9.1±5.3 µg m−3). Although PM1 concentration has a strong seasonal dependence, such as in Mt. Tai, with a low concentration in autumn (18.1 µg m−3) and a high concentration in summer (33.5 µg m−3), the average PM1 concentration at our site was still much lower than at Mt. Daban (11.4 µg m−3) and Mt. Tai in the same season (autumn). Considering the occurrence of frequent cloud events during the sampling period, the low PM1 concentration might be mainly associated with cloud scavenging, which will be further validated in subsequent sections. Notably, a relatively lower contribution of sulfate to PM1 was observed (16.7 %) at this site compared to at other mountain sites, except for Mt. Yulong (23.7 %–38.1 %), which is likely to be attributable to the significant reduction in SO2 emissions in China over the past decade (Wen et al., 2023). The decrease in sulfate contribution was associated with an elevation of nitrate contribution. This shift suggests that most NH4 will probably be in the form of ammonium nitrate, which is more volatile than ammonium sulfate and is thus unlikely to transport over a large scale. Additionally, at Mt. Tai, even though the contributions of sulfate were high, nitrate still accounted for considerable fractions (14.9 %–29.0 %) that were comparable to or higher than this site (20.9 %). Taken together, PM1 at this site is more likely to be influenced by anthropogenic emissions over a smaller regional scale, consistently with the high urban density in eastern China (Li et al., 2018).
Figure S3a shows the relative contribution of each PM1 component as a function of PM1 concentration. The fraction of nitrate increased significantly with PM1 concentration; meanwhile, the fraction of organics and BC exhibited a decreasing trend. We noted that a nitrate-dominant peak of PM1 mass loading was observed during the nighttime of 4 November (EP1, Fig. 2d), and the concentrations of organics and nitrate as a function of PM1 mass during this event and during the rest of the campaign are shown in Fig. S4. Almost all the data points with PM1 concentrations above 20 µg m−3 were from this event. During EP1, a steeper slope for nitrate relative to PM1 was found compared to that for organics, which was contrary to slopes found during the rest period, resulting in significant contributions of nitrate to PM1 across all PM1 concentrations (Figs. S3b and S4). These distinct differences in slopes for nitrate and organics implied different mechanisms of PM1 elevation during these two periods. Consequently, we also excluded EP1 from the statistics of Fig. S3a, and the result is presented in Fig. S3c. After removing EP1, organics became the dominant contributor (>40 %) across all PM1 concentrations. Despite this, there was still an increasing trend for nitrate and a decreasing trend for sulfate, along with increased PM1, yet the contribution of ammonium remained relatively constant. This further supported our previous hypothesis that there was a conversion of ammonium sulfate to ammonium nitrate with the increase in PM1 concentration. Overall, these results suggested that high levels of PM1 at the SH site might be mainly attributed to the formation or transport of organics; meanwhile, nitrate also plays a non-negligible role.
The diurnal cycles of PM1 species, air pollutants, and meteorological parameters during the entire campaign are illustrated in Fig. S5. The mean and median values of organics and nitrate both showed distinct noon peaks at around 14:00, which could be attributed to the daytime photochemical production and the low wind speed (Tang et al., 2022; Xu et al., 2018b). In addition, as depicted in Fig. S6, these noon peaks coincided closely with the diurnal variation in BLH (reaching up to ∼1450 m at around 13:00). Consequently, the relatively elevated concentrations of organics and nitrate at noon might also be related to the development of the atmospheric boundary layer, which facilitates the mixing of air masses transported from polluted areas. The high nighttime peak of nitrate was mainly due to the influences of the nitrate event on 4 November. Comparatively, sulfate, chloride, and BC showed relatively flat diurnal variations, suggesting the regional characteristics of these species (Zhang et al., 2015).
3.2 Meteorological conditions and air mass origin
The entire study period was characterized by five elevated PM1 episodes (EP1–EP5), as marked in Fig. 2. These five elevated PM1 episodes exhibited mean PM1 concentrations ranging from 5.2 to 9.8 µg m−3; these values were close to or exceeded the 75th percentile of the overall PM1 concentration distribution (5.6 µg m−3). Meanwhile, a clean period (C1) with a mean PM1 concentration of 1.3 µg m−3, falling below the 25th percentile of the distribution (1.6 µg m−3), was also selected for comparison. The relationship between the PM1 species concentration, meteorology, and air mass transport during these six periods is shown in Figs. 3 and S7. EP1 exhibited a nitrate-dominant PM1 peak, with nitrate concentration rapidly increasing by ∼18 µg m−3 within 1 h. In addition, a CO peak was also observed at that time, suggesting potential contributions of pollution transport to nitrate. Given the lack of anthropogenic activities near the sampling site, the enhanced nitrate concentrations likely originated from NOx transported from adjacent towns in the northeast, as indicated by the non-parametric wind (NWR) regression polar plot for nitrate (Fig. S8), showing high levels of nitrate mainly associated with northeastern wind directions. This was further supported by the back trajectory analysis, in which air masses on 4 November were also from the northeast. Moreover, the RH was stable at 100 % during EP1, which could favor the heterogenous uptake of N2O5 and subsequent nitrate formation in the aqueous phase at night (Brown et al., 2006; Li et al., 2020).
In contrast to EP1, PM1 in other episodes (EP2–5) was dominated by organics. EP2 was associated with low concentrations of CO, indicating relatively slight pollution transport influence. In addition, clear and similar diurnal variation patterns were found in aerosol species and RH, suggesting that PM1 in this period was mainly affected by the evolution of the atmospheric boundary layer. EP3 was initiated by an organic-only increase under high temperatures (∼ 15–25° C) and low RH (∼40 %–80 %), while other aerosol species remained at very low levels. Considering the low CO levels in this period, the increasing trend of OA could be attributed to the local biogenic emissions. The concentrations of organics, together with other PM1 species and CO, were further elevated after air mass sources shifted from southwest to northwest on 13 November, which may bring a large amount of aerosols from megacities such as Zhengzhou and Hangzhou to the SH site (Fig. S7c). EP4 and EP5 were two similar episodes, where PM1 concentrations were generally associated with the changes in RH and WD. During these two periods, air masses both originated from the west and southwest, but the trajectory distances during EP5 were shorter, suggesting that the air masses transported more slowly in EP5.
Overall, although these episodes had different mechanisms of PM1 variation, they were mostly influenced by the transport of western and southwestern air masses, indicating a substantial impact of anthropogenic emissions from big cities like Nanchang and Fuzhou. These areas are marked by higher pollution according to the organic carbon distribution in Fig. S7. However, we have also identified similar transport pathways and even higher CO concentrations during C1 (0.37 ppm on average) than during EP2–5 (0.18–0.31 ppm on average), while the PM1 concentration stayed at very low levels for the whole period. It is worth noting that PM1 peaks in EP2, EP4, and EP5 all occurred along with RH below 100 %. When the RH returned to 100 %, PM1 concentrations gradually diminished to levels comparable to those observed during the clean period (C1). Furthermore, as shown in Fig. S9, after omitting EP1 and EP3 to exclude the effect of air mass change, there were notable reductions in the mean and median mass concentrations of all PM1 species over the campaign, ranging between 15.5 %–63.4 % and 6.8 %–61.0 % when RH reached 100 % following conditions of lower RH. Considering the frequently occurring cloud events at this site, it was most likely that these variations in RH were affected by the cloud process, which may further play an important role in PM1 concentrations.
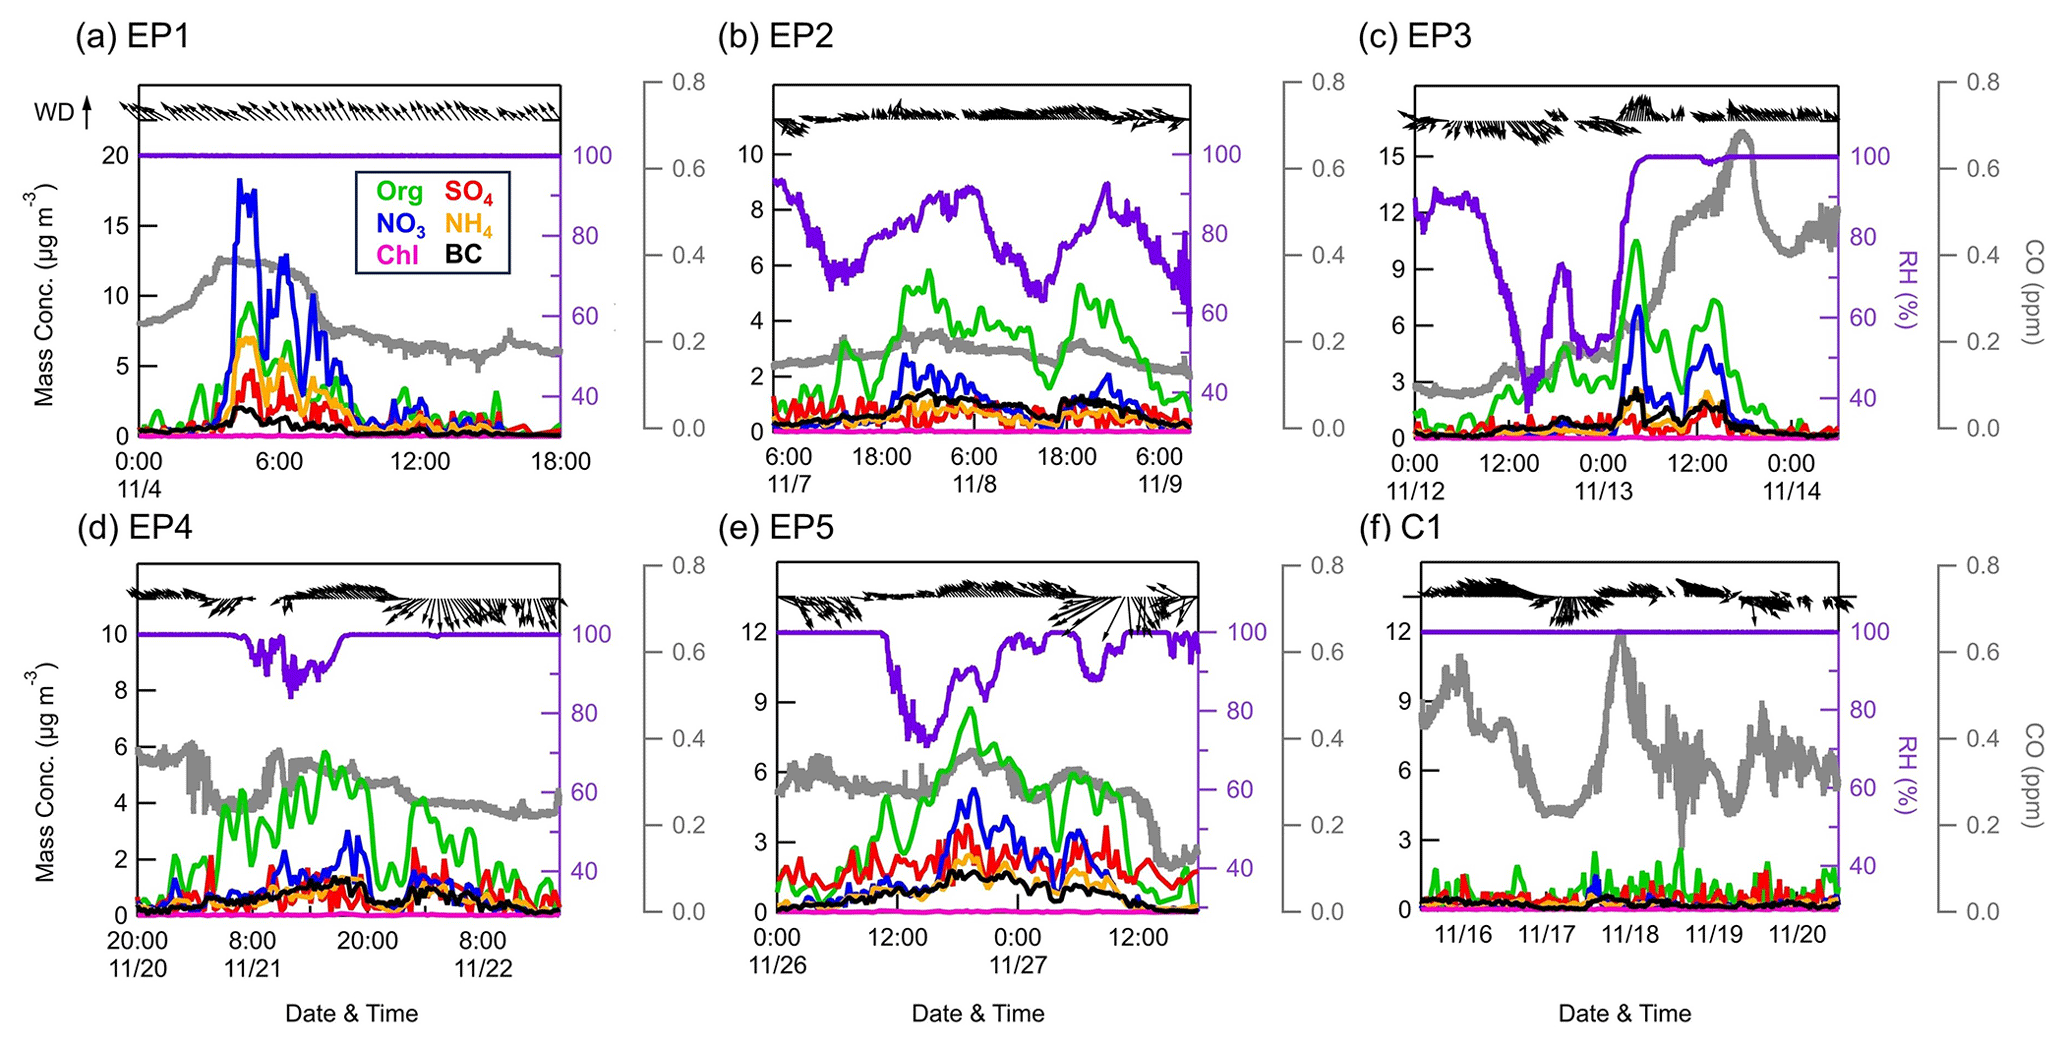
Figure 3Temporal variations in the concentrations of PM1 species measured by the ACSM, as well as CO (gray lines), RH (purple lines), and WD and WS (black arrows) during six events.
Figure S10 shows the particle depolarization ratio measured by the particle lidar during EP5 and C1. During EP5, clouds were identified at ∼1 km above the sampling site from 02:00 to 12:00 on 26 November (Fig. S10a). As expected, these clouds gradually disappeared afterward, possibly owing to strong solar radiation at noon on the mountaintop causing cloud droplet evaporation. Meanwhile, a large number of aerosol particles (PDR = ∼0.15) were released from the clouds, which exhibited a strong agreement with the timing of the PM1 peak. These particles were then removed by the strong winds (WS > 4 m s−1) that dispersed the entire air mass. This cloud evaporation phenomenon was also found in urban Guangzhou, which caused a remarkably enhanced nitrate mass concentration at noon (Tao et al., 2018). In contrast, no such evaporation process was observed during C1 (Fig. S10b). Instead, high PDR values were generally found at around 0 km, which means that clouds constantly existed near the sampling area during this period, coinciding with the constant 100 % RH. Therefore, PM1 transported to this site was likely to be scavenged by the cloud during C1. These findings were also evidenced by the photos taken at this site at ∼ 15:00 LT on 19 and 26 November, where severe cloud cover was observed in C1 (Fig. S11a), yet the weather was generally sunny and cloudless in EP5 (Fig. S11b). As a result, besides regional transport, cloud processes can also have significant impacts on aerosol particles at this site.
However, we also observed several phenomena during the sampling period that cannot be conclusively explained by the current data. First, it should be noted that there was a difference in cloud height between C1 (∼0 km) and EP5 (∼1 km, before evaporation), indicating that aerosol particles were sampled within and below the cloud during C1 and EP5, respectively. With no cloud evaporation occurring during C1 with low-level clouds, this raises the question of how evaporation processes are affected by cloud height. Tao et al. (2018) found that cloud evaporation could occur at 500–1000 m above the ground, and the released aerosols can be transported to low levels through strong turbulent mixing. This finding agrees with our observation during EP5, where the development of the boundary layer likely promoted the vertical transport of released aerosols to this site (Fig. S12). In contrast, during C1, the thick cloud layer hindered solar radiation, leading to generally lower boundary layer heights. These clouds might be identified as orographic clouds formed by the moist air masses lifted and saturated under the influence of complex mountain terrain (Houze, 2012). If the solar radiation and other environmental conditions are sufficient to evaporate the cloud at this site, the boundary layer would also develop correspondingly, enhancing the vertical mixing of released aerosols during the daytime. Therefore, we hypothesized that clouds with heights lower than the developed boundary layer heights (up to ∼2 km, Fig. S12) may all show the probability of evaporating and increasing the observed aerosol mass at this site. Second, as discussed in Sect. 2.1, the sampling uncertainties caused by cloud droplets accounted for up to 20 % in our study; yet, significantly more aerosol particles were observed to be released after the evaporation of the cloud above this site during EP5. This was likely to be attributable to the polluted air mass transported and entering the cloud at higher altitudes. In contrast, at altitudes near the sampling inlet, the continuous uplift of clean moist air masses from lower elevations might be unfavorable for aerosol accumulation. Moreover, the evaporation itself could also trigger some aqueous SOA formation processes such as oligomerization (Lim et al., 2010; Brégonzio-Rozier et al., 2016), thereby contributing additional aerosol mass within the cloud droplets. Third, these selected periods were all under the influence of anthropogenic-emission-related air masses, while the fact of whether or not the evaporation of a clean air mass cloud can impact the aerosol concentrations at this site remains unknown. However, we noticed a period (from 10 to 12 November) that seemed to contain a cloud evaporation process, as indicated by the suddenly reduced RH (from 100 % to 70 %) during the daytime on 11 November, but still exhibited relatively low PM1 levels (2.6 µg m−3 on average). The back trajectory analysis further showed that the air mass during this period originated from the sea, which was less influenced by anthropogenic emissions. As a result, it is likely that a small number of aerosols can also be released even if a clean air mass enters the cloud and evaporates. Despite these issues that need to be addressed through future long-term measurements and model studies, the cloud evaporation phenomenon we observed might still be a plausible mechanism to explain certain aerosol episodes in this and other similar regions.
3.3 Impacts of cloud processes on submicron aerosols
To further explore the impacts of cloud scavenging and cloud evaporation on aerosol characteristics, we selected C1 and EP5, during which NR-PM1 was also measured by the AMS, for additional investigations regarding aerosol size distributions, elemental ratios, and HRMS in this section.
3.3.1 Size distributions and composition
The average chemically resolved size distributions of NR-PM1 during C1 and EP5 are shown in Fig. 4. Generally, all species were distributed in accumulation mode in both periods. However, a smaller peak size (300–500 nm) and a broader size distribution were observed during C1 when compared to those of EP5 (∼700 nm), probably owing to the wet removal of larger and more hygroscopic particles in C1 (Ge et al., 2012). Also, the complex and broad size distribution observed in C1 suggests that the aerosol is likely to be externally mixed with small particles dominated by organics, which may further imply the potential formation of SOA from local biogenic sources. In contrast, the uniform size distribution across all particulate species in EP5 indicates their well-mixed and highly aged characteristics. Moreover, ammonium showed similar size distributions with sulfate and nitrate during EP5, while in C1, it was mixed mainly with sulfate and exhibited a rather different size distribution with nitrate, indicating the potential contribution of organic nitrate.
Clear differences were also found in aerosol composition during C1 and EP5. Organics were the dominant contributor to total NR-PM1 mass during C1 (68 %), followed by nitrate (12 %), ammonium (11 %), and sulfate (8 %). In contrast, despite the decreased contribution of organics (51 %), the mass fractions of sulfate and nitrate increased considerably during EP5 (by 9.4 % and 7.0 %, respectively). These changes in the mass fraction of species were attributed to the lower mass scavenging efficiency of organics compared to inorganic species (Gilardoni et al., 2014). The average HRMS values of OA during C1 and EP5 are presented in Fig. S14. The HRMS values of OA were quite similar for the two periods, with a significant peak at (mainly for CO. The OA was highly oxidized, with CxHyO dominating the total OA during C1 and EP5 by 41 % and 40 %, followed by CxH (31 % and 32 %) and CxHyO (20 % and 19 %). The contributions of the two major oxygen-containing ion fragments (CxHyO and CxHyO) at the SH site were much higher than those at various urban or suburban sites in China, e.g., 37.4 % in urban Nanjing (Wang et al., 2016) and 52.9 % in suburban Lanzhou (Tang et al., 2022). Note that a higher fraction of CO (3 % higher) was found during C1 than during EP5 (Fig. S14c), indicating a higher oxidation degree of OA in C1 (Xu et al., 2014). This is consistent with the higher O C and carbon oxidation state (OSc) during C1 (0.96 and 0.49) than during EP5 (0.85 and 0.21).
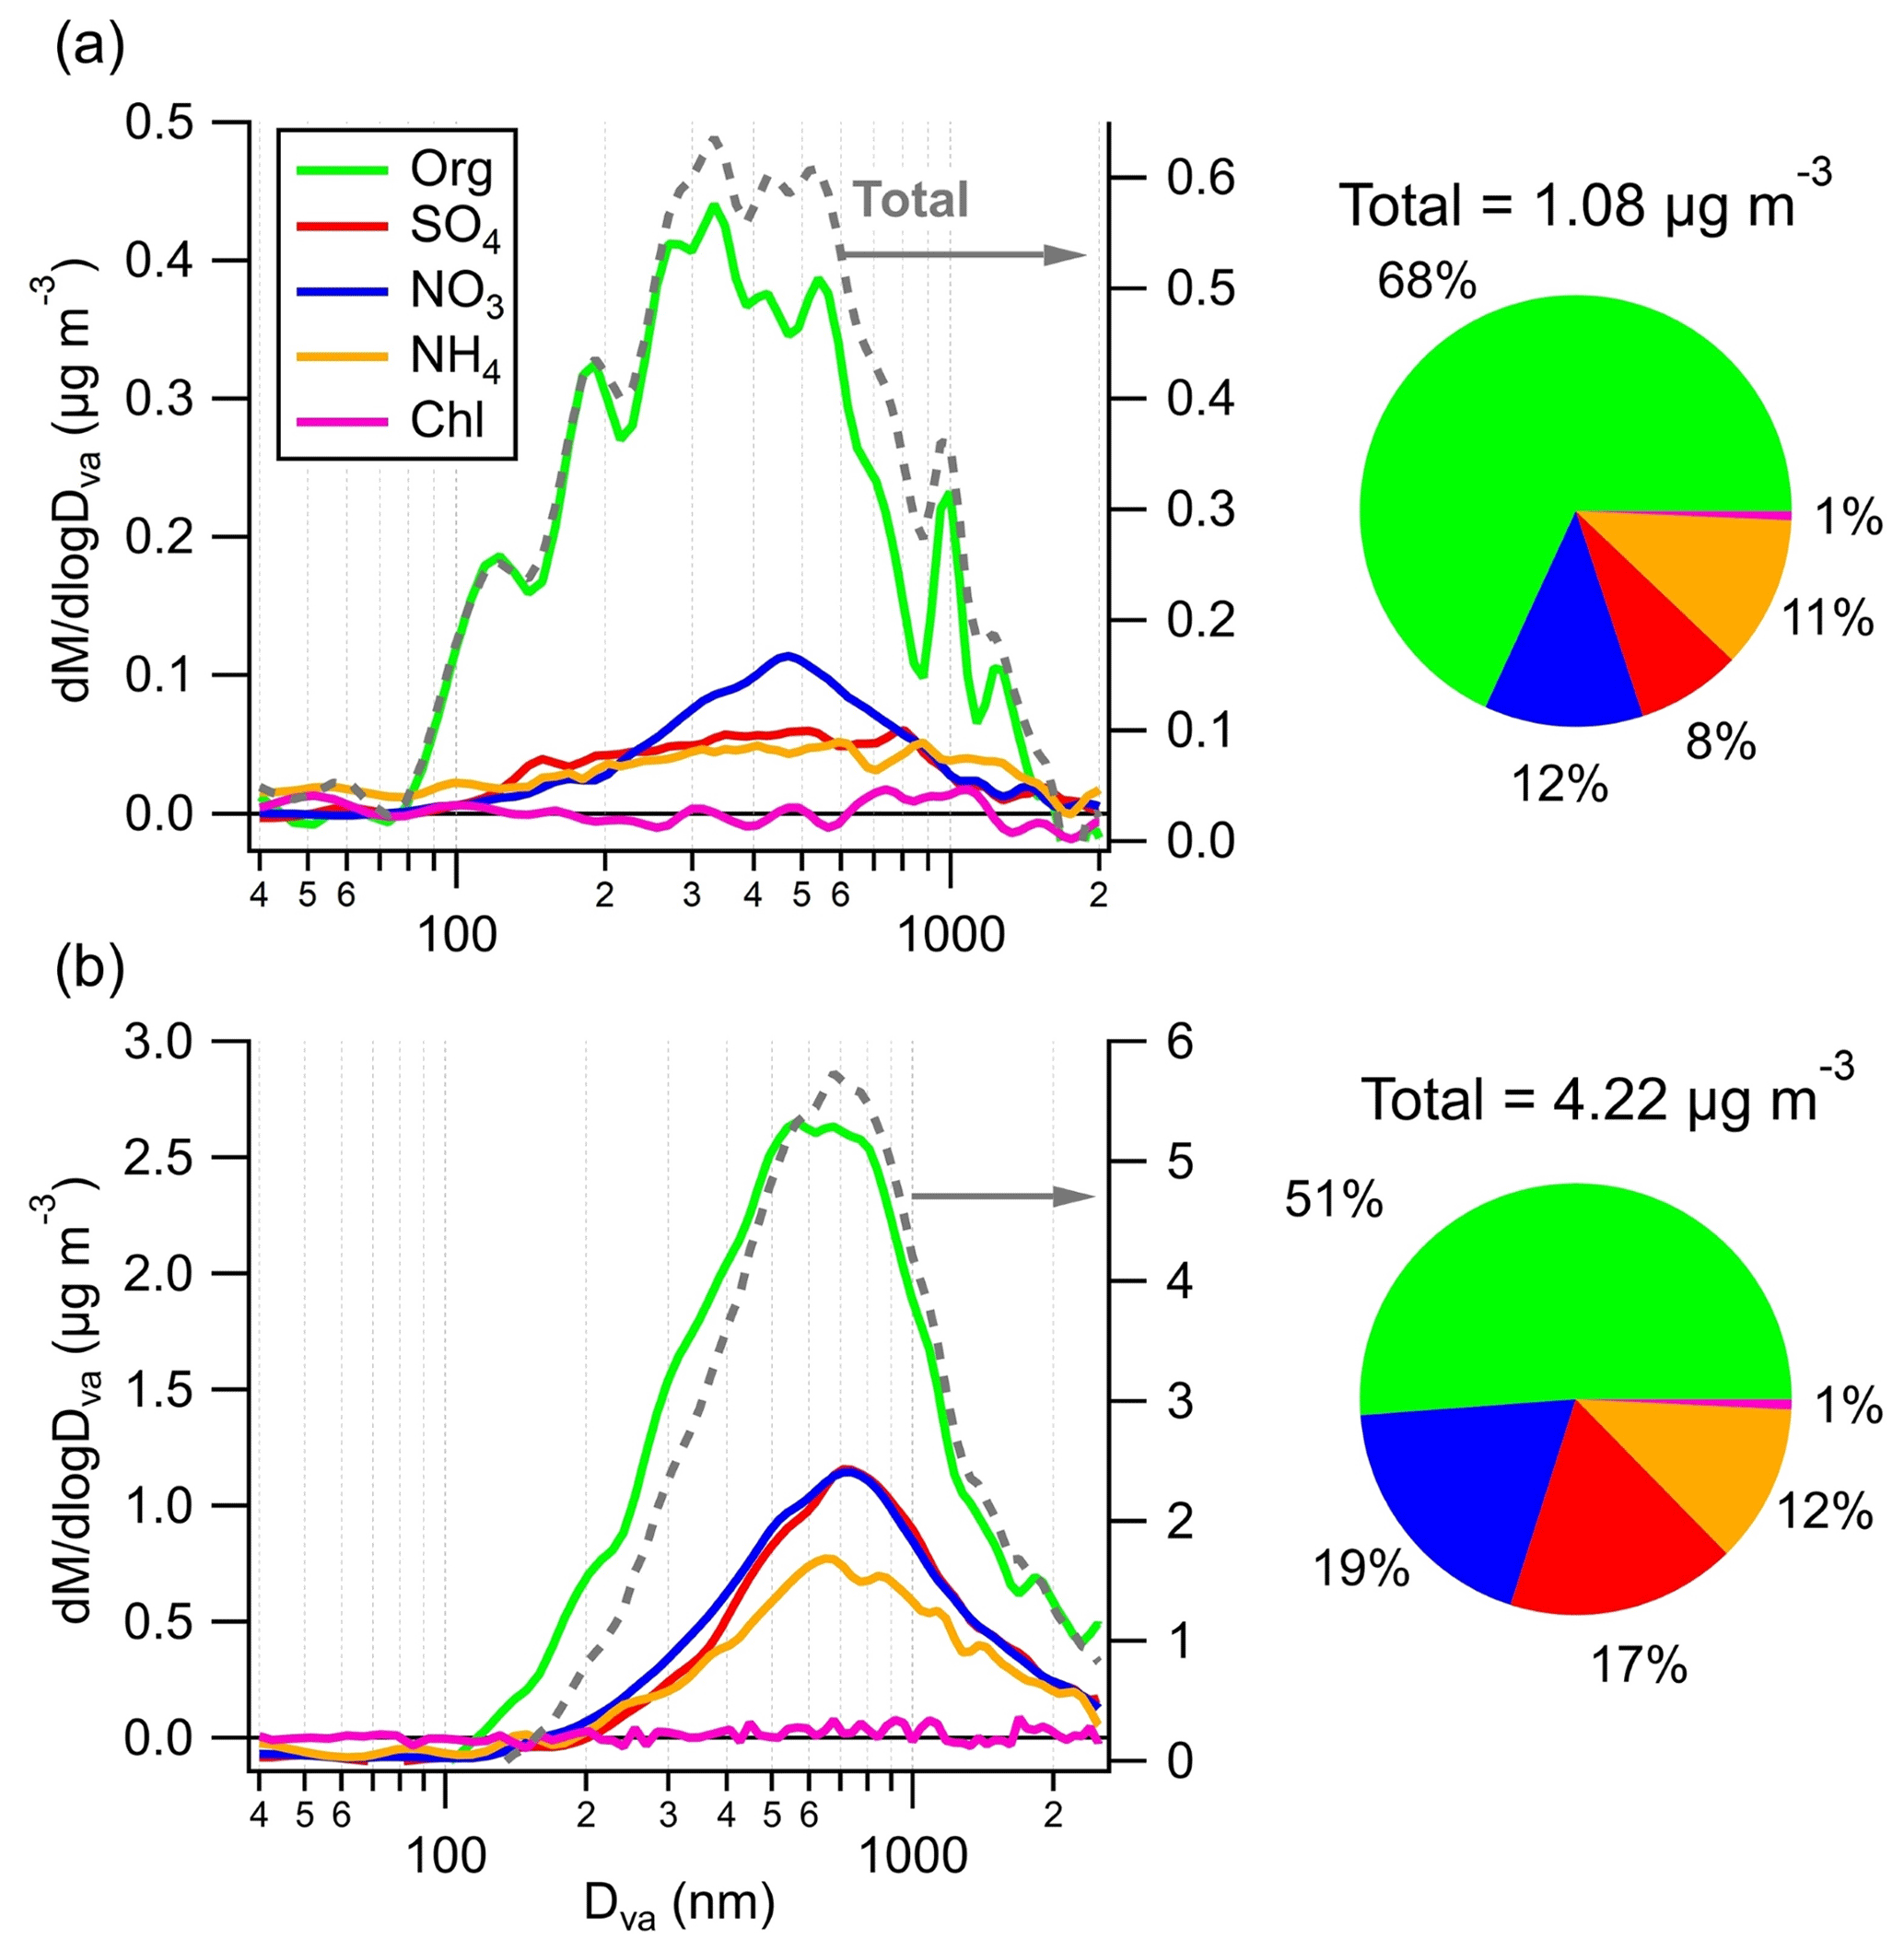
Figure 4Averaged size distributions and chemical composition of NR-PM1 during (a) C1 and (b) EP5.
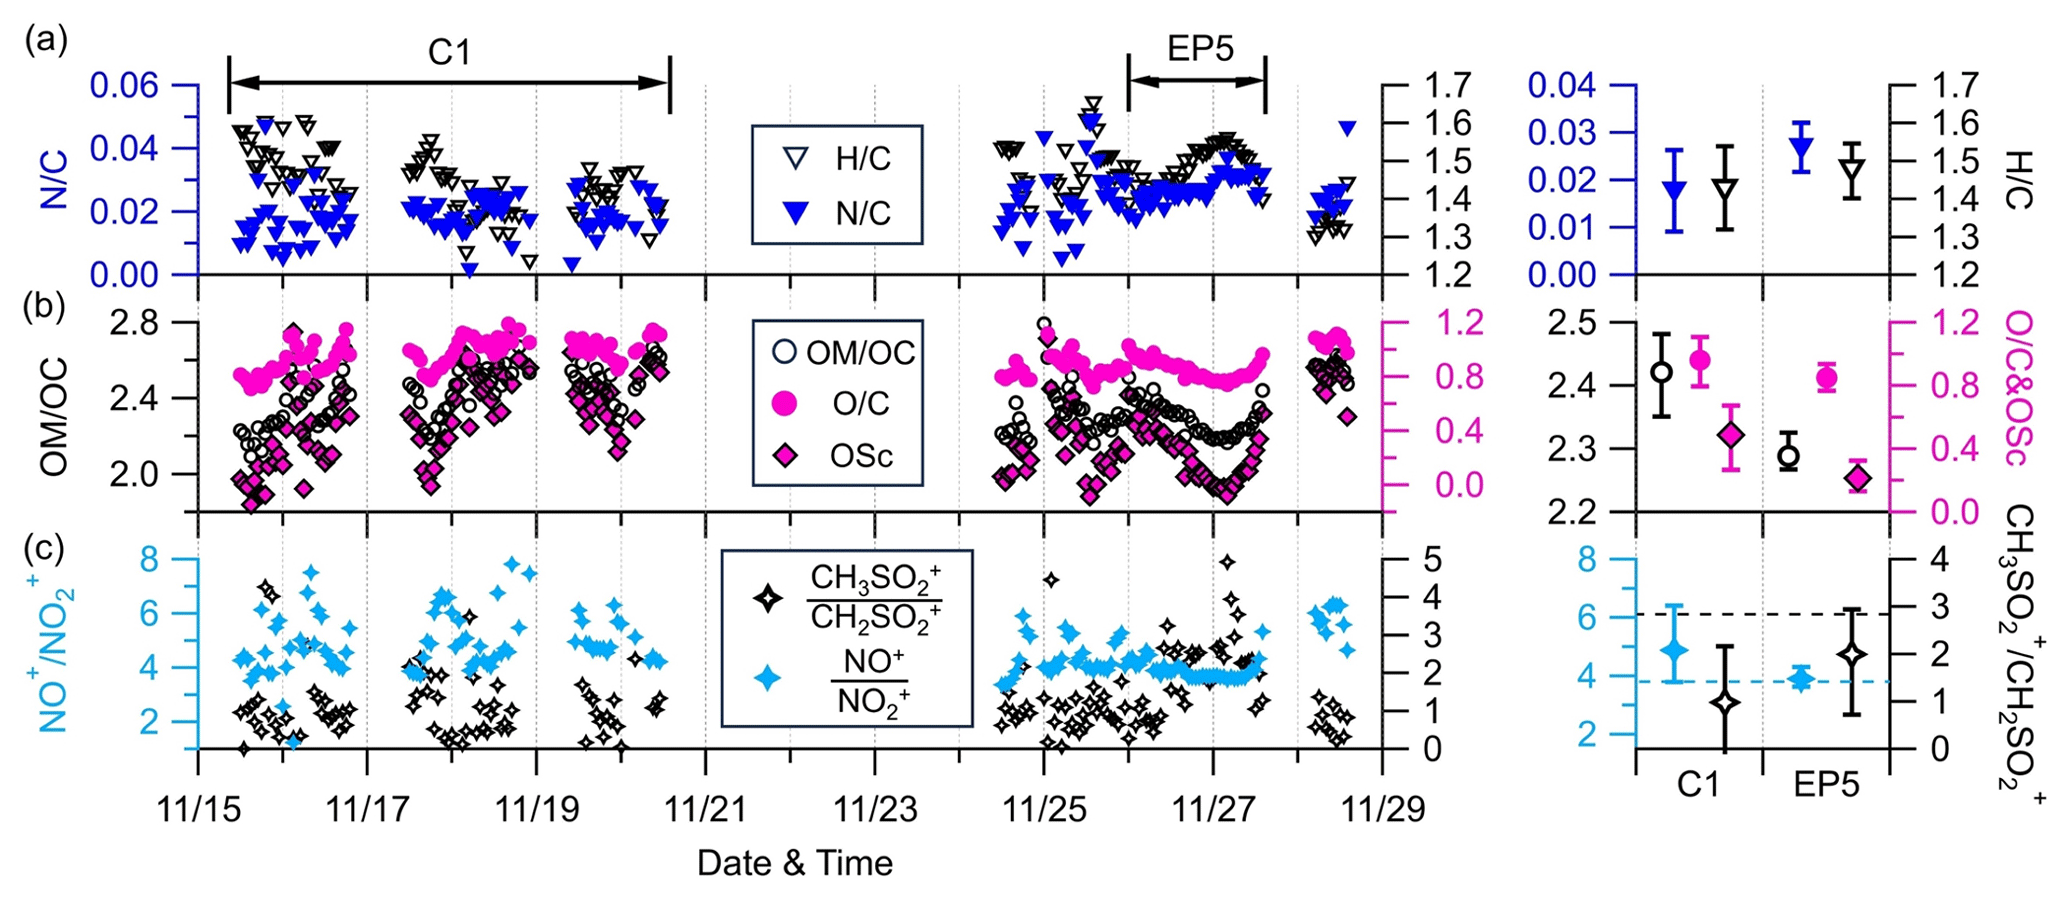
Figure 5Time series of 1 h averaged (a) N C and H C; (b) OM OC, OSc, and O C; and (c) NO+ NO and CH3SO CH2SO at the AMS sampling site (left) and their mean values during C1 and EP5 (right). Only ratios determined to have good S N (i.e., organics >0.7 µg m−3) are shown. The horizontal dashed black and blue lines in the bottom-right plot represent the CH3SO CH2SO value for pure MSA (2.9) and the NO+ NO value for pure NH4NO3 (3.88), respectively.
3.3.2 Elemental ratios
Figure 5 shows the time series of N C, H C, OM OC, O C, and carbon oxidation state (OSc) of OA, as well as two ion ratios at the SH site. The hourly averaged ratios were only reported for periods with OA concentrations above 0.7 µg m−3. The average N/C ratios were 0.018 for C1 and 0.027 for EP5, which is consistent with the higher fraction of CxHyN in OA during EP5. OA had a slightly lower H C ratio (1.44 vs. 1.48) and higher average ratios of O C (0.96 vs. 0.85), OM OC (2.42 vs. 2.29), and OSc (0.49 vs. 0.21) during C1 than during EP5, indicating more oxidized OA during C1. The O C ratios were, overall, within the range of 0.94±0.18 at regional background sites (Zhou et al., 2020); yet, these were much higher than those observed at urban and suburban sites. These results suggest that OA at the SH site was relatively aged.
The ratio of fragment ions NO+ () to NO () is a good indicator for identifying the presence of ONs (Farmer et al., 2010; Lin et al., 2021). The mean ratio of NO+ NO during C1 was 4.9, which exceeds the value of 3.88 for pure ammonium nitrate (NH4NO3) obtained from the AMS IE calibration, indicating a potential contribution of ONs. Conversely, the mean NO+ NO during EP5 (3.9) was almost identical to that of NH4NO3, implying the dominance of inorganic nitrates (INs). Additionally, the CH2SO () and CH3SO) ions were used as signature fragments of methanesulfonate, a typical organic sulfur species generated in marine and remote coastal regions (Chen et al., 2019). However, the mean ratios of CH3SO and CH2SO during C1 and EP5 (0.98 and 1.99, respectively) were lower than the value of 2.9 reported in previous studies for methanesulfonic acid (MSA), indicating the minimal contribution of MSA (Song et al., 2019). The low contributions of MSA further suggest that aerosols over this region are likely to have negligible oceanic influences. This is also consistent with the back trajectory results in Sect. 3.2, which demonstrate that PM1 levels at this site are dominantly influenced by continental sources in the west and southwest.
3.4 Source apportionment of OA and contribution of organic nitrates
Four factors were resolved by PMF, including three types of SOA and one inorganic factor: less oxidized oxygenated OA (LO-OOA), more oxidized oxygenated OA (MO-OOA), OA associated with sulfate ions (SO4-OA), and inorganic nitrate aerosol (INA). Together, on average, these four factors accounted for 87.5 % of the total NR-PM1 mass. The mass spectra profiles and OA ion family composition of the four factors are shown in Figs. 6 and 7.
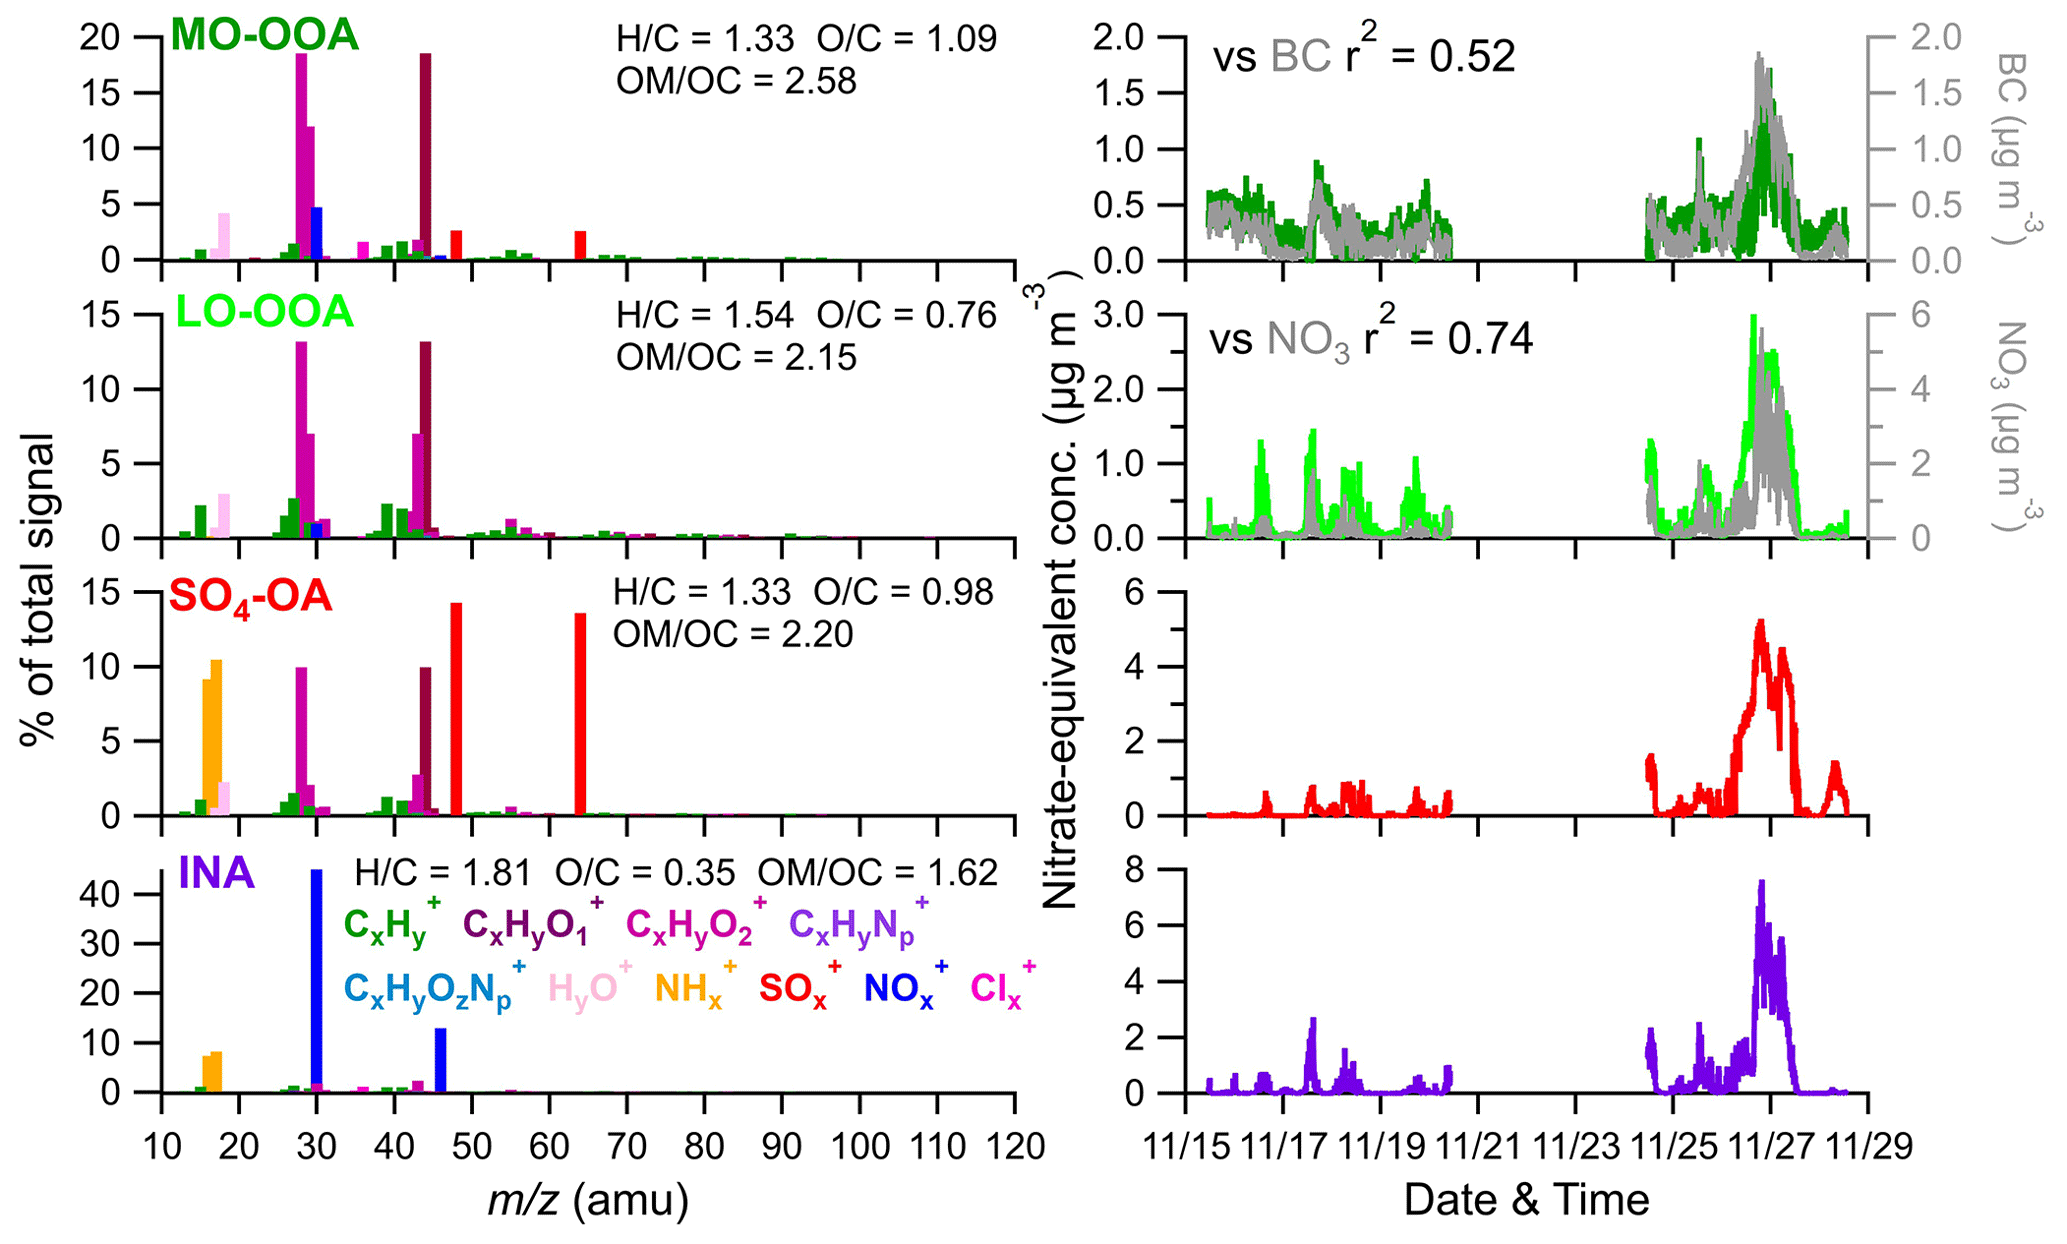
Figure 6High-resolution mass spectral profiles (left) and time series (right) of four factors. The correlations of the four factors with corresponding tracers are also shown.
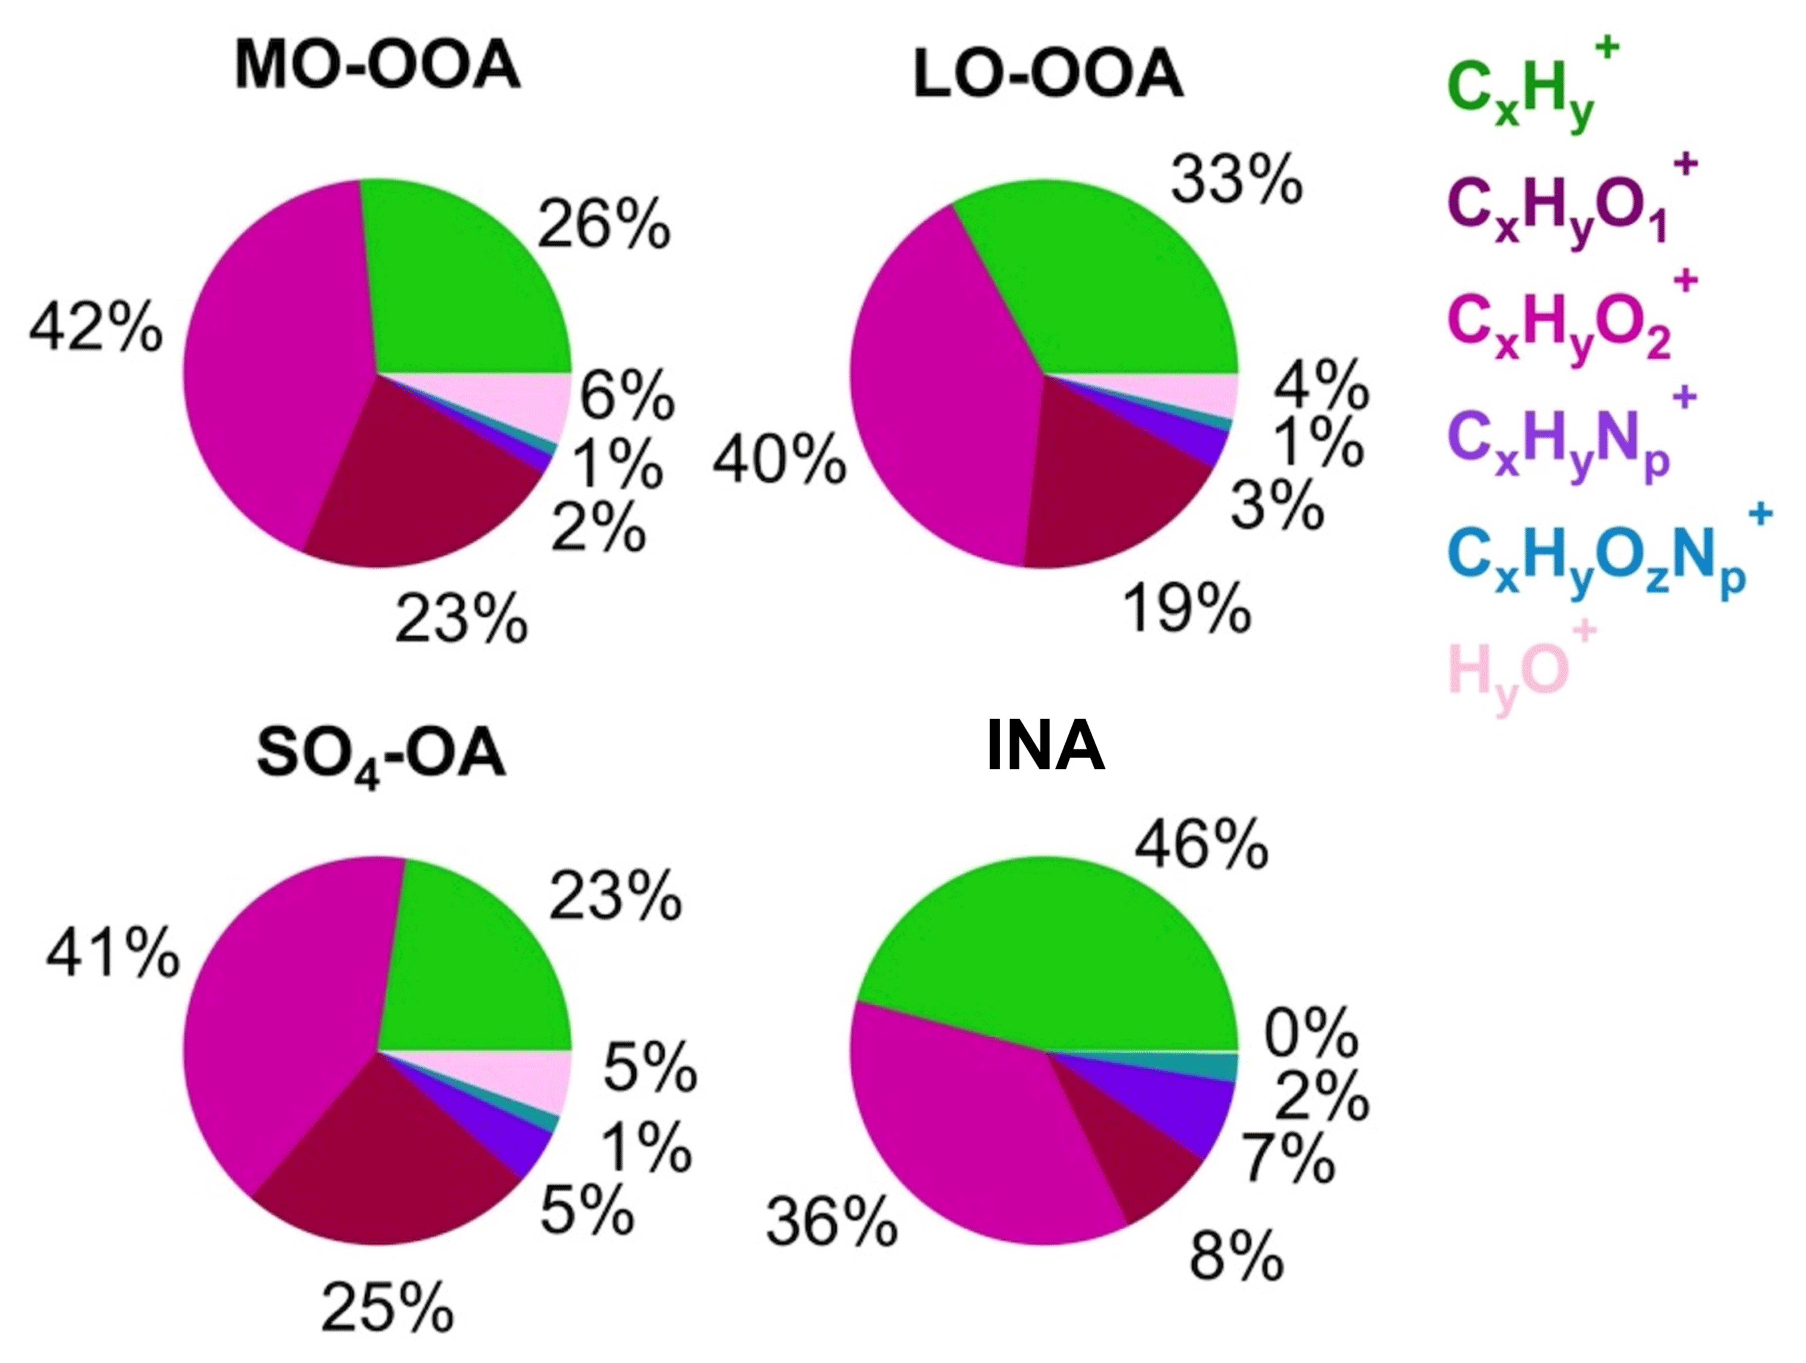
LO-OOA and MO-OOA were identified by prominent peaks of CO+ and CO in the mass spectra. LO-OOA had a high fraction of C2H3O+ (, 6.8 % of the total signal), while MO-OOA, corresponding to more oxidized and aged components, had a higher abundance of CO (17.6 % vs. 12.8 %), CxHyO (23 % vs. 19 %), and O C ratios (1.09 vs. 0.76) than LO-OOA. The average O C ratios of these two OOA factors are similar to those at Mt. Bachelor Observatory, where the O C ratios of SV-OOA and LV-OOA were 0.67 and 1.17, respectively (Zhou et al., 2019). LO-OOA correlate well with NO3 (r2=0.74), coinciding with its secondary nature. However, unlike in numerous previous studies, there was a limited correlation between MO-OOA and sulfate (r2=0.32) during the sampling period. Instead, MO-OOA exhibited a moderate correlation with BC (r2=0.52). This correlation between OOA and BC was also observed at a mountain site in southern China (Zhu et al., 2016), suggesting common air masses for MO-OOA and BC, such as biomass burning. Given that biomass burning plays an important role in aerosol composition in southeastern China (Fang et al., 2023; Liang et al., 2020), it is plausible that MO-OOA may have coated or mixed with BC particles emitted from biomass burning, undergoing extensive aging processes during long-range transport. Overall, the LO-OOA and MO-OOA components account for 39.1 % and 29.4 % of the total measured OA mass, respectively (Fig. S15). The mass spectra of the SO4-OA factor had a large amount of NH and SO, together accounting for 48.5 % of the total mass of this factor. Meanwhile, organic components also made up a considerable fraction, contributing, on average, 51 %. It is also noticed that the O C ratio of the organic fraction of this factor is 0.98, which was even higher than LO-OOA and comparable to MO-OOA, suggesting that this factor experienced aging processes during the regional transport. As expected, no primary OA factor (e.g., hydrocarbon-like OA, biomass burning OA, etc.) was resolved during this study due to the negligible influences of local emissions, which was consistent with the PMF results from other background sites (Zhou et al., 2019; Zhu et al., 2016).
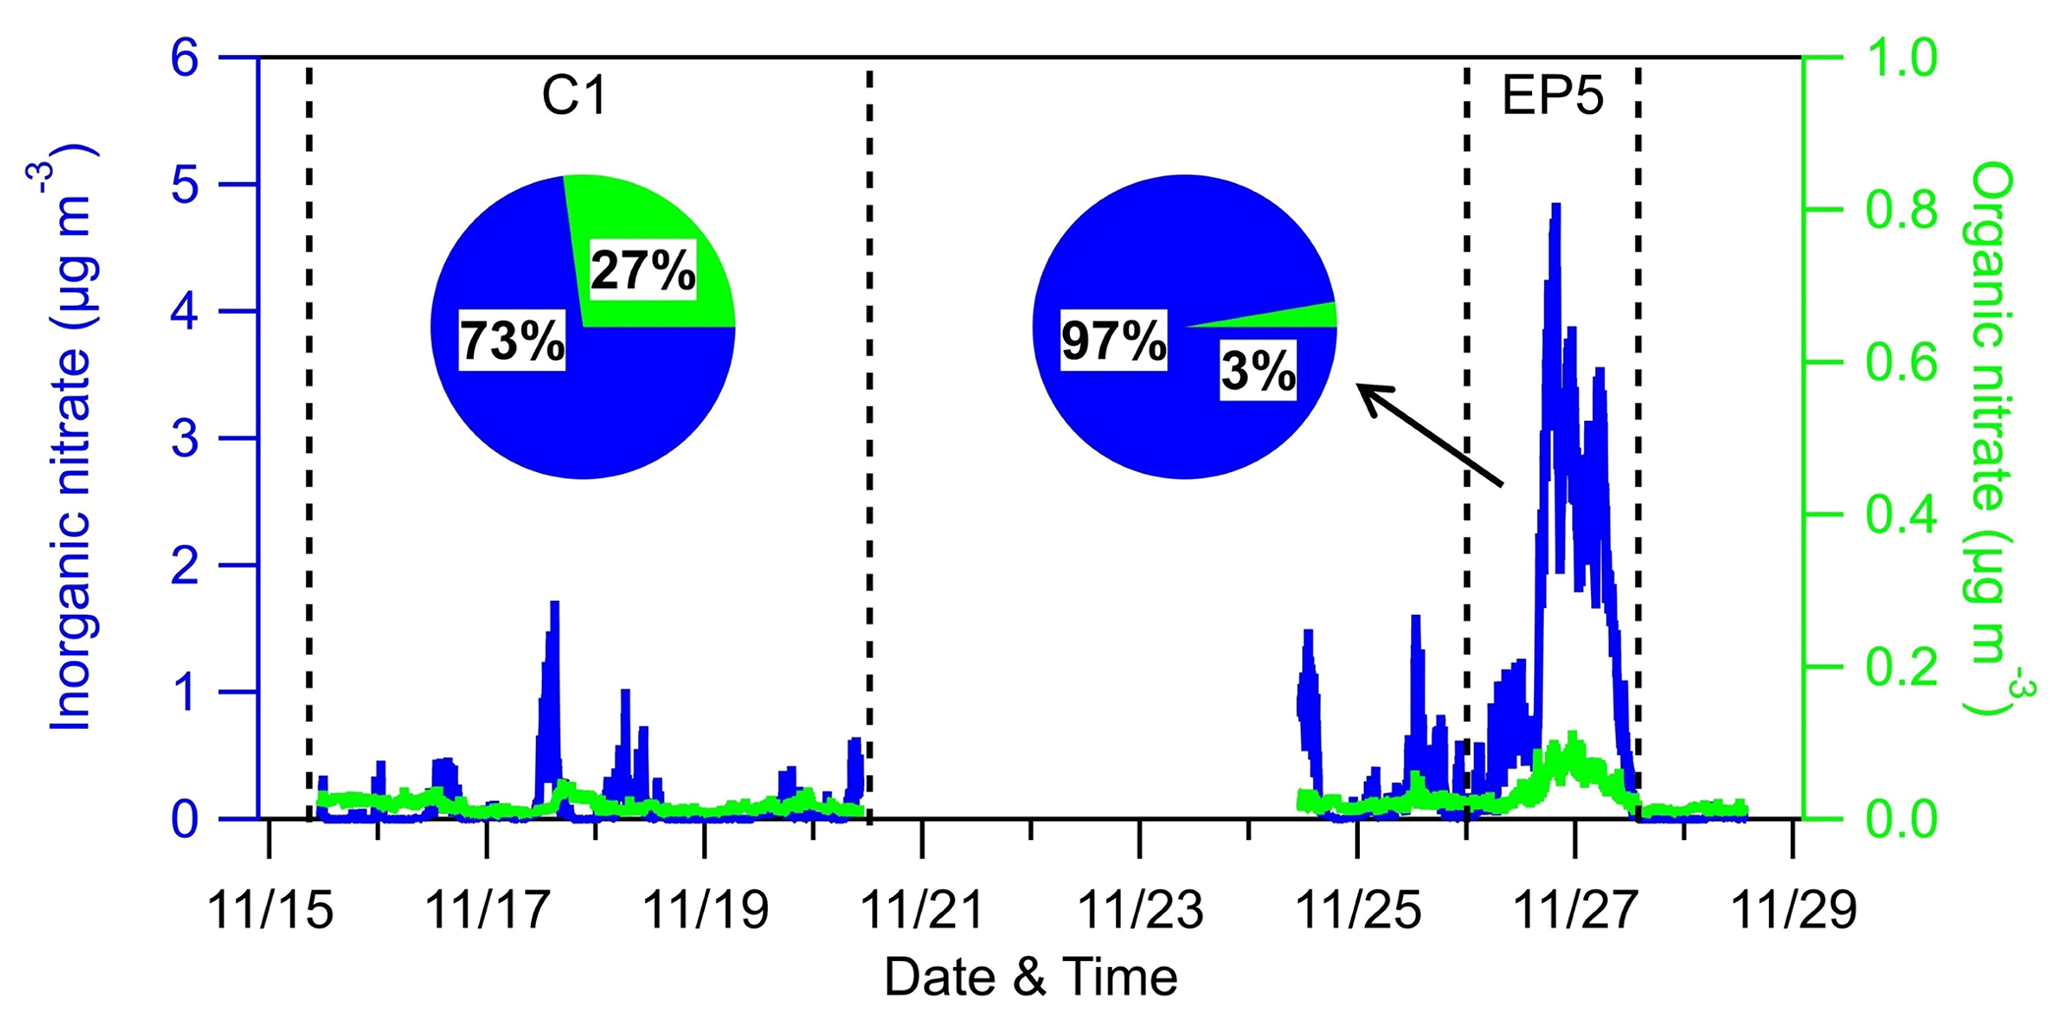
Figure 8Time series and relative contributions of inorganic nitrate and organic nitrate during the AMS sampling period.
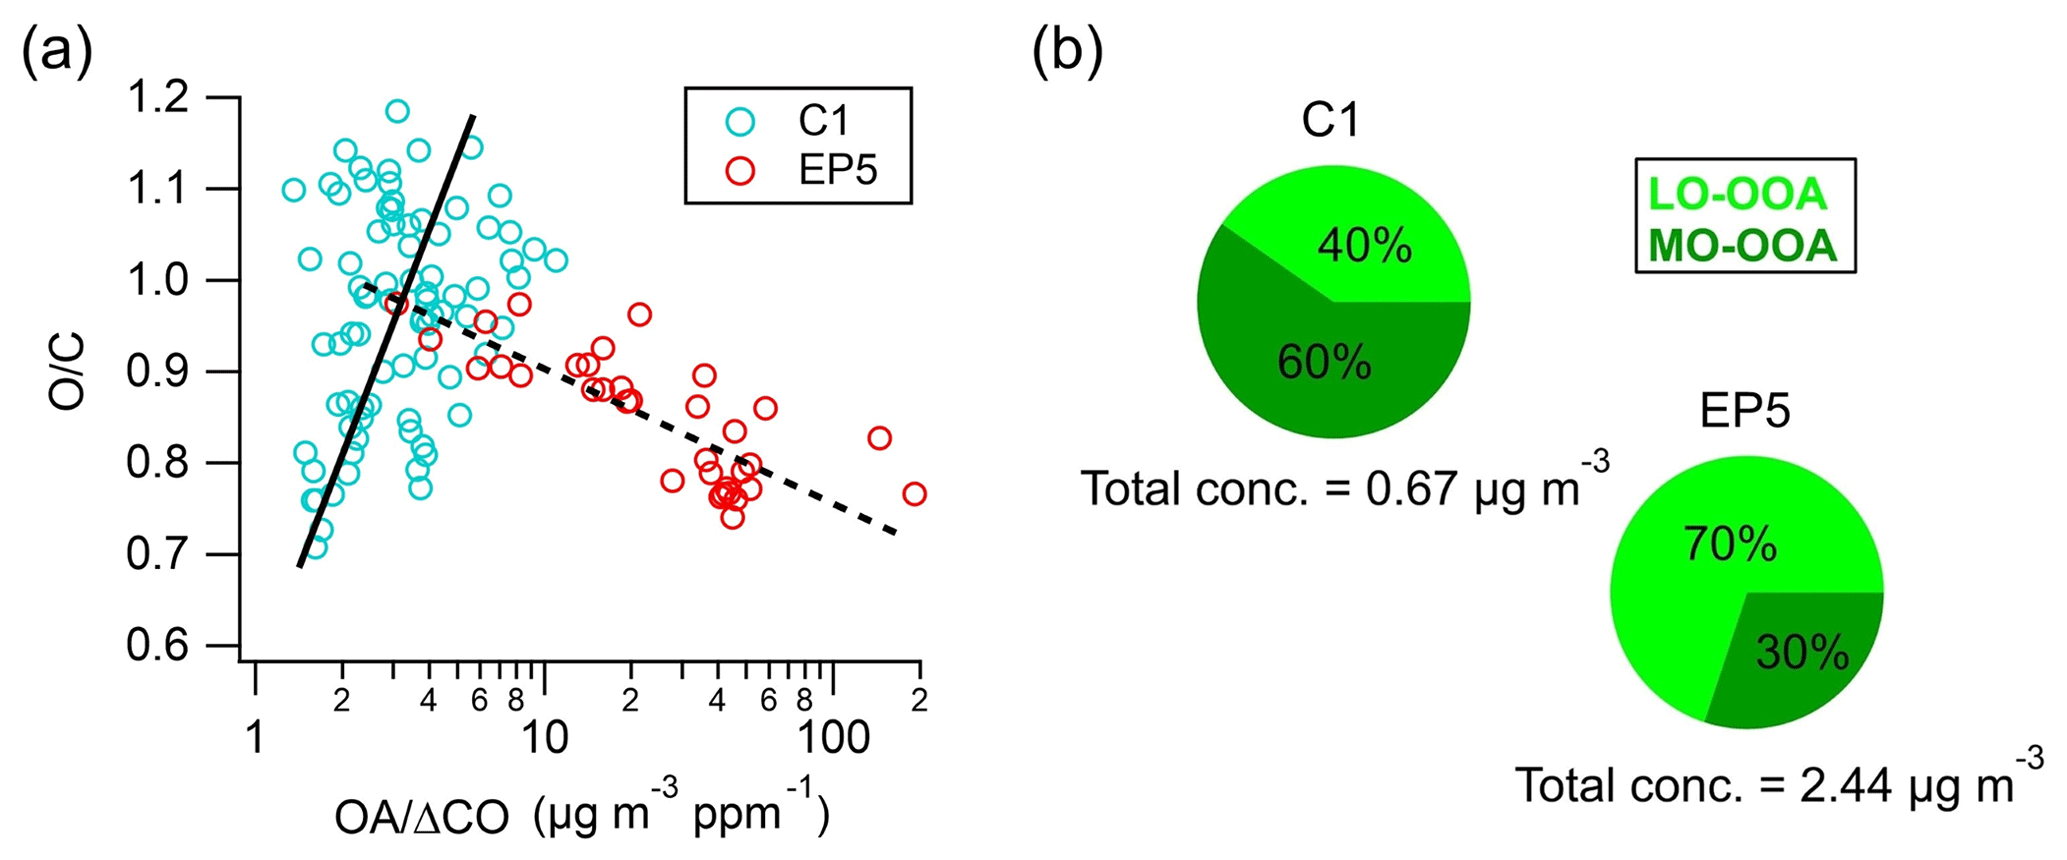
Figure 9(a) Scatter plot of O C as a function of OA Δ CO values and (b) mass concentrations and proportions of MO-OOA and LO-OOA during C1 and EP5.
An inorganic nitrate aerosol factor was also separated from these OA factors, with nitrates in this factor accounting for 92.6 % of the total NO ions. Apart from INA, NO ions were more assigned in MO-OOA (6.0 % of the total NO) than in LO-OOA (1.4 % of the total NO), suggesting that ONs were more associated with MO-OOA. This is contrary to other studies, which reported that ONs were more correlated with less oxidized OA (Zhang et al., 2016; Yu et al., 2019). MO-OOA also correlated moderately with BC; one possible reason for this was that ONs formed and mixed with MO-OOA components during the aqueous aging processes of MO-OOA-coated BC particles. This hypothesis is supported by Cao et al. (2022), who demonstrated that ONs exhibit similar volatility to MO-OOA when coating BC. Based on the PMF results above, the mass concentrations of ONs during the AMS sampling period were estimated (Fig. 8). Considering ONs to be part of organics, we chose an RIE value of 1.4 for the estimated ONs, while a nitrate RIE value (1.1) was correspondingly applied for INs. The average mass concentration of ONs during C1 was 30±22 ng m−3, which was lower than that during EP5 (40±23 ng m−3), which can also be explained by the evaporative release of ONs during EP5. However, considering the slightly elevated values (10 ng m−3) between these two periods, we cannot rule out the possible formation of ON from aqueous-phase processes (Xian et al., 2023) and gas-phase reactions initiated by NO3 during the nighttime (Ayres et al., 2015). Also, the low levels of ON might cause uncertainties in the estimation. Since ONs at this site were close to the value (40 ng m−3) reported by Hao et al. (2014) for a forest–urban mixed site in Finland, we considered our quantification of ONs to be reasonable. However, significant differences were observed between the IN mass concentrations during C1 and EP5 (0.08 µg m−3 vs.1.47 µg m−3). This could be attributed to the fact that water-soluble HNO3 and/or NH4NO3 were scavenged by cloud droplets and removed by precipitation before transportation to this site during C1; on the other hand, during EP5, these INs dominated the elevation of total nitrate during cloud evaporation. These differences in INs also led to a greater contribution of ONs to total nitrate during C1 than during EP5 (27 % vs. 3 %).
3.5 Evolution of OA
The formation and evolution of OA can be investigated using the ratio of OA to ΔCO (CO minus background CO) to remove the atmospheric dilution effects (DeCarlo et al., 2010). In this study, 0.12 ppm (average of the lowest 5 % concentration) was used as the background mixing ratio of CO (Fig. S16), which is close to the 0.1 ppm used in Hu et al. (2013) and in Yuan et al. (2013). OA ΔCO was 28.3±26.3 µg m−3 ppm−1 during the study period, which is comparable to the value (41.7±23.0 µg m−3 ppm−1) observed in the suburban Sichuan Basin (Hu et al., 2016) but is much lower than the mean value (70±20 µg m−3 ppm−1) in worldwide urban air (De Gouw and Jimenez, 2009). The scatter plot of O C as a function of OA ΔCO values during C1 and EP5 is shown in Fig. 9a. Interestingly, different O C trends were found with the increasing OA ΔCO during C1 and EP5. During C1, O C tended to increase with the increase in the OA ΔCO value, indicating that the aging process produced SOA (Hu et al., 2017). In contrast, a remarkable decreasing trend in O C was observed with the increasing OA ΔCO during EP5, suggesting that less oxidized OA may contribute more significantly to the high OA concentration during this period. Moreover, considering the cloud evaporation process in this period (as discussed in Sect. 3.2), the negative correlation between OA ΔCO and O C in EP5 also implies that the less oxidized OA previously formed or incorporated into cloud droplets can be released during cloud evaporation. Another possible mechanism was that, after the cloud was evaporated, SOA formation from biogenic volatile organic compounds (VOCs) could then be strengthened by stronger solar radiation, which may also contribute to the increase in less oxidized OA. Conversely, more oxidized OA in cloud droplets may have undergone further fragmentation reactions that decrease the carbon content of particles, resulting in their mass loss (Kroll et al., 2009; Lee et al., 2012). This made MO-OOA much less likely to be released through cloud evaporation. Similarly, significant increases in the LO-OOA concentration (0.27 to 1.70 µg m−3) and fraction (40 % to 70 %) were observed from C1 to EP5, while the MO-OOA concentration (0.40 vs. 0.74 µg m−3) did not show large variations (Fig. 9b), further supporting our conclusion.
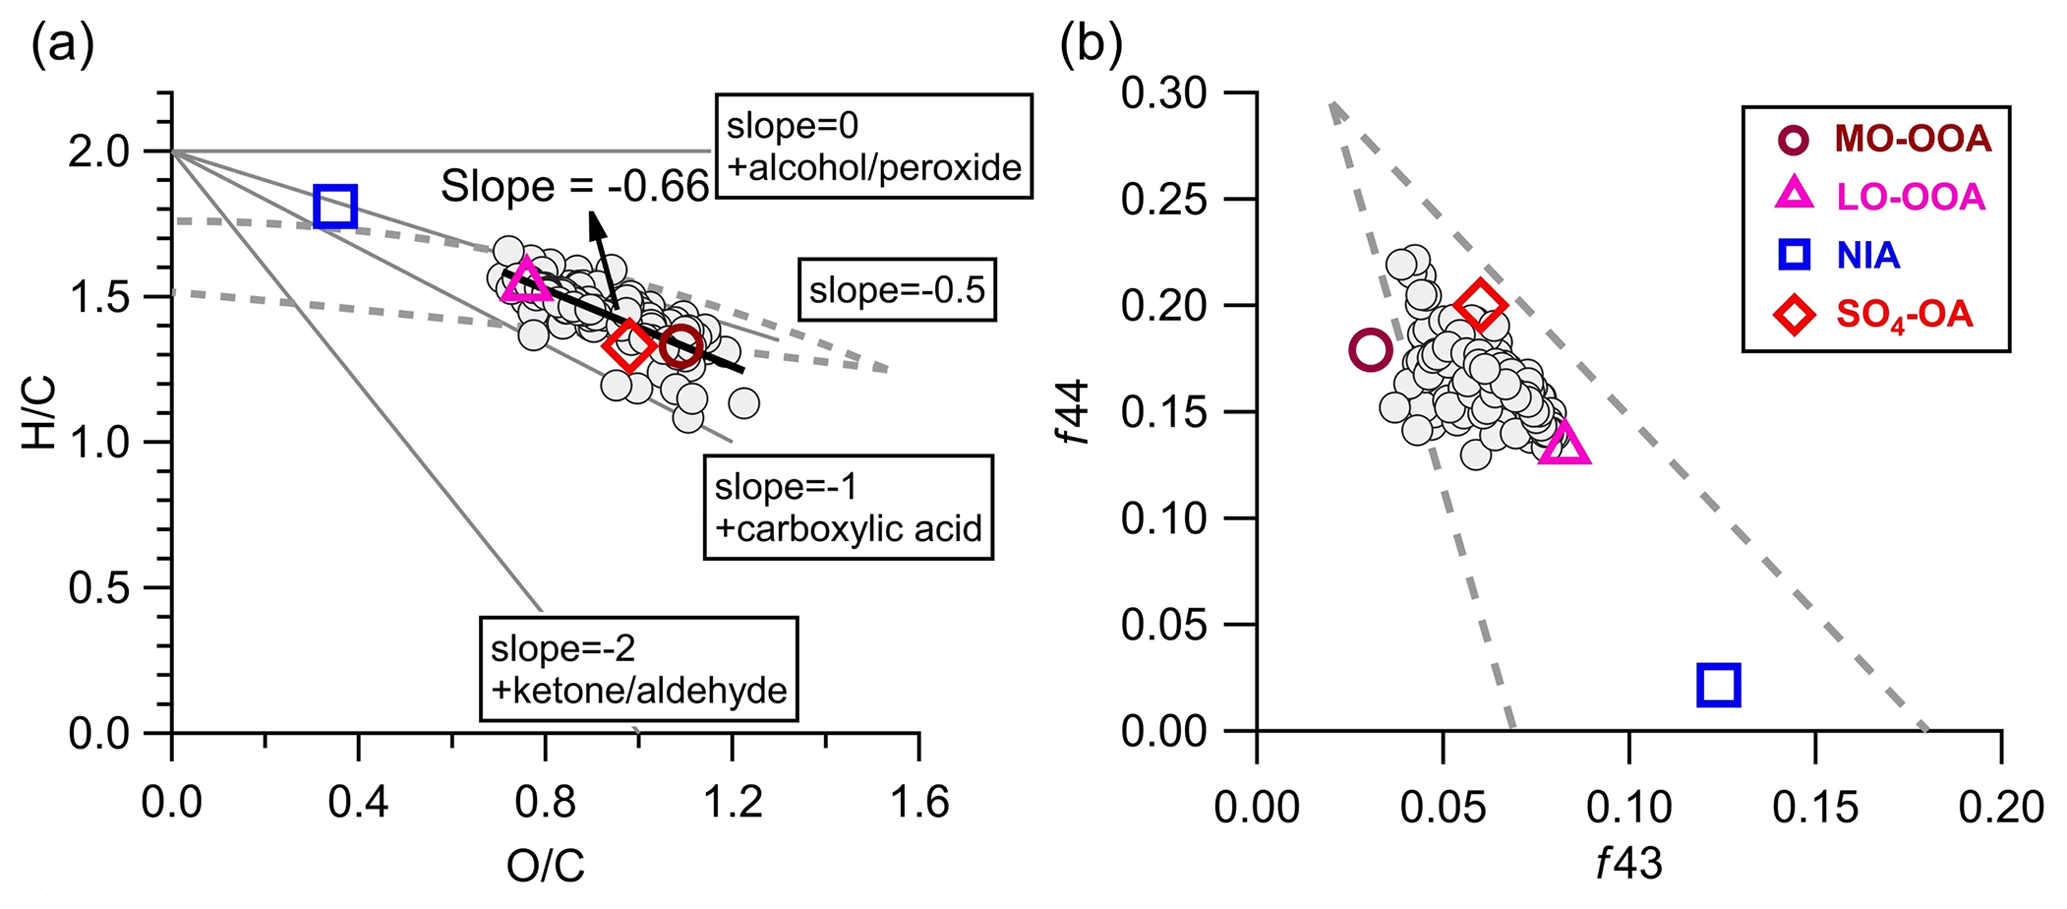
Figure 10(a) Van Krevelen diagram (H C vs. O C) and (b) f43 vs. f44 of OA (gray circles, hourly averaged) and four aerosol factors identified by the PMF analyses during the AMS sampling period.
Figure 10a shows the van Krevelen diagrams of OA in this study. The slope of H C to O C in the present study was −0.66 (r2=0.64). Despite potential variations in the relative contributions of different types of OAs transported to this site, this slope still suggests the addition of carboxyl functional groups during OA evolution to some extent (Heald et al., 2010). This slope is slightly flatter than those (−0.7 to −1.0) of other remote and/or rural regions across the world (Chen et al., 2015), indicating that the oxidation processes of OA at this site were more associated with fragmentation reactions. Consistent evolution trends are also shown in the f43 vs. f44 space (Fig. 10b). The SO4-OA and MO-OOA showed similar high oxidation degrees, with f43 and f44 being located at the upper part of the triangular region because of the larger fractional contribution of CO in the organic mass spectrum. The LO-OOA was situated in the middle region of the triangle, while INA resided near the bottom right. Moreover, the mass spectra of LO-OOA and MO-OOA resemble those of the aged OAs observed at other elevated sites (Fig. S17) (Xu et al., 2018a; Zhou et al., 2019). Together, these results reveal that OA observed at the SH site is representative of the background-aged SOA in the YRD region in China.
The chemical composition and sources of PM1 at a forested mountain site in southeastern China in November 2022 were characterized by two different aerosol mass spectrometers. Overall, the average mass concentration of total PM1 (4.3±4.8 µg m−3) was lower than that at other mountain sites in China; yet, it was similarly dominated by organics (41.1 %). Remarkably, sulfate exhibited lower contributions (16.7 %) to PM1 compared to at other mountain sites, which is in contrast to the higher contributions of nitrate (14.7 %), indicating the influences of anthropogenic emissions over a relatively small regional scale in southeastern China. Back trajectory analysis revealed that higher concentrations of submicron aerosols at this mountain site were associated with the transport from the western and southwestern regions. OA was dominantly secondary and highly aged, as suggested by the high O C (0.85–0.96) and OSc (0.21–0.49) ratios. PMF analysis of combined organic and inorganic spectra identified two types of OOA and an OA factor associated with SO4. Most importantly, we found that cloud scavenging and evaporation processes influence LO-OOA and MO-OOA differently. The cloud scavenging showed a greater efficiency in removing MO-OOA, consistently with the smaller size distributions of interstitial particles during cloud events. In contrast, the evaporation of clouds tended to release a large amount of LO-OOA, highlighting that the SOA remaining in cloud droplets was mostly in a moderate oxidation state. Overall, this study illustrates the importance of SOA in forested mountain sites in southeastern China, where aerosol concentrations, composition, size distributions, and oxidation state are affected substantially by aerosol–cloud interactions. Moreover, our study provides valuable data and insights into the aerosol–cloud interactions in mountainous areas that often experience cloudy conditions; considering this, cloud evaporation can be considered to be a plausible mechanism to explain certain aerosol episodes in these regions.
Data used in this study can be accessed from the Zenodo repository at https://doi.org/10.5281/zenodo.10312334 (Zhang et al., 2023).
The supplement related to this article is available online at: https://doi.org/10.5194/acp-24-8473-2024-supplement.
WX and YS designed the research. WX, WZ, and HQ conducted the measurements. ZZ, YZ, WZ, XX, AD, YZ, XC, and YS analyzed the data. YK, XP, ZW, LL, QF, DRW, and YS reviewed and commented on the paper. ZZ and YS wrote the paper.
Douglas R. Worsnop is the manufacturer of the AMS and ACSM utilized in this study. The peer-review process was guided by an independent editor, and the authors also have no other competing interests to declare.
Publisher’s note: Copernicus Publications remains neutral with regard to jurisdictional claims made in the text, published maps, institutional affiliations, or any other geographical representation in this paper. While Copernicus Publications makes every effort to include appropriate place names, the final responsibility lies with the authors.
This research has been supported by the National Key Research and Development Program of China (grant no. 2022YFC3703500), the Strategic Priority Research Program of the Chinese Academy of Sciences (grant no. XDB0760200), and the National Natural Science Foundation of China (grant no. 42377101).
This paper was edited by Barbara Ervens and reviewed by Angela Buchholz and two anonymous referees.
Asmi, E., Freney, E., Hervo, M., Picard, D., Rose, C., Colomb, A., and Sellegri, K.: Aerosol cloud activation in summer and winter at puy-de-Dôme high altitude site in France, Atmos. Chem. Phys., 12, 11589–11607, https://doi.org/10.5194/acp-12-11589-2012, 2012.
Ayres, B. R., Allen, H. M., Draper, D. C., Brown, S. S., Wild, R. J., Jimenez, J. L., Day, D. A., Campuzano-Jost, P., Hu, W., de Gouw, J., Koss, A., Cohen, R. C., Duffey, K. C., Romer, P., Baumann, K., Edgerton, E., Takahama, S., Thornton, J. A., Lee, B. H., Lopez-Hilfiker, F. D., Mohr, C., Wennberg, P. O., Nguyen, T. B., Teng, A., Goldstein, A. H., Olson, K., and Fry, J. L.: Organic nitrate aerosol formation via NO3 + biogenic volatile organic compounds in the southeastern United States, Atmos. Chem. Phys., 15, 13377–13392, https://doi.org/10.5194/acp-15-13377-2015, 2015.
Brégonzio-Rozier, L., Giorio, C., Siekmann, F., Pangui, E., Morales, S. B., Temime-Roussel, B., Gratien, A., Michoud, V., Cazaunau, M., DeWitt, H. L., Tapparo, A., Monod, A., and Doussin, J.-F.: Secondary organic aerosol formation from isoprene photooxidation during cloud condensation–evaporation cycles, Atmos. Chem. Phys., 16, 1747–1760, https://doi.org/10.5194/acp-16-1747-2016, 2016.
Brown, S. S., Ryerson, T. B., Wollny, A. G., Brock, C. A., Peltier, R., Sullivan, A. P., Weber, R. J., Dubé, W. P., Trainer, M., Meagher, J. F., Fehsenfeld, F. C., and Ravishankara, A. R.: Variability in Nocturnal Nitrogen Oxide Processing and Its Role in Regional Air Quality, Science, 311, 67–70, https://doi.org/10.1126/science.1120120, 2006.
Calvo, A. I., Alves, C., Castro, A., Pont, V., Vicente, A. M., and Fraile, R.: Research on aerosol sources and chemical composition: Past, current and emerging issues, Atmos. Res., 120–121, 1–28, https://doi.org/10.1016/j.atmosres.2012.09.021, 2013.
Canagaratna, M. R., Jimenez, J. L., Kroll, J. H., Chen, Q., Kessler, S. H., Massoli, P., Hildebrandt Ruiz, L., Fortner, E., Williams, L. R., Wilson, K. R., Surratt, J. D., Donahue, N. M., Jayne, J. T., and Worsnop, D. R.: Elemental ratio measurements of organic compounds using aerosol mass spectrometry: characterization, improved calibration, and implications, Atmos. Chem. Phys., 15, 253–272, https://doi.org/10.5194/acp-15-253-2015, 2015.
Cao, L.-M., Wei, J., He, L.-Y., Zeng, H., Li, M.-L., Zhu, Q., Yu, G. H., and Huang, X. F.: Aqueous aging of secondary organic aerosol coating onto black carbon: Insights from simultaneous L-ToF-AMS and SP-AMS measurements at an urban site in southern China, J. Clean. Prod., 330, 129888, https://doi.org/10.1016/j.jclepro.2021.129888, 2022.
Carbone, C., Decesari, S., Paglione, M., Giulianelli, L., Rinaldi, M., Marinoni, A., Cristofanelli, P., Didiodato, A., Bonasoni, P., Fuzzi, S., and Facchini, M. C.: 3-year chemical composition of free tropospheric PM1 at the Mt. Cimone GAW global station – South Europe – 2165 m a.s.l., Atmos. Environ., 87, 218–227, https://doi.org/10.1016/j.atmosenv.2014.01.048, 2014.
Chen, Q., Heald, C. L., Jimenez, J. L., Canagaratna, M. R., Zhang, Q., He, L.-Y., Huang, X.-F., Campuzano-Jost, P., Palm, B. B., Poulain, L., Kuwara, M., Martin, S. T., Abbatt, J. P. D., Lee, A. K. Y., and Liggio, J.: Elemental composition of organic aerosol: The gap between ambient and laboratory measurements, Geophys. Res. Lett., 42, 4182–4189, https://doi.org/10.1002/2015GL063693, 2015.
Chen, Y., Xu, L., Humphry, T., Hettiyadura, A. P. S., Ovadnevaite, J., Huang, S., Poulain, L., Schroder, J. C., Campuzano-Jost, P., Jimenez, J. L., Herrmann, H., O'Dowd, C., Stone, E. A., and Ng, N. L.: Response of the Aerodyne Aerosol Mass Spectrometer to Inorganic Sulfates and Organosulfur Compounds: Applications in Field and Laboratory Measurements, Environ. Sci. Technol., 53, 5176–5186, https://doi.org/10.1021/acs.est.9b00884, 2019.
Chen, C.-L., Chen, T.-Y., Hung, H.-M., Tsai, P.-W., Chou, C. C.-K., and Chen, W.-N.: The influence of upslope fog on hygroscopicity and chemical composition of aerosols at a forest site in Taiwan, Atmos. Environ., 246, 118150, https://doi.org/10.1016/j.atmosenv.2020.118150, 2021.
DeCarlo, P. F., Ulbrich, I. M., Crounse, J., de Foy, B., Dunlea, E. J., Aiken, A. C., Knapp, D., Weinheimer, A. J., Campos, T., Wennberg, P. O., and Jimenez, J. L.: Investigation of the sources and processing of organic aerosol over the Central Mexican Plateau from aircraft measurements during MILAGRO, Atmos. Chem. Phys., 10, 5257–5280, https://doi.org/10.5194/acp-10-5257-2010, 2010.
De Gouw, J. and Jimenez, J. L.: Organic Aerosols in the Earth's Atmosphere, Environ. Sci. Technol., 43, 7614–7618, https://doi.org/10.1021/es9006004, 2009.
Ding, S., Liu, D., Hu, K., Zhao, D., Tian, P., Wang, F., Li, R., Chen, Y., He, H., Huang, M., and Ding, D.: Optical and hygroscopic properties of black carbon influenced by particle microphysics at the top of the anthropogenically polluted boundary layer, Atmos. Chem. Phys., 21, 681–694, https://doi.org/10.5194/acp-21-681-2021, 2021.
Du, W., Sun, Y. L., Xu, Y. S., Jiang, Q., Wang, Q. Q., Yang, W., Wang, F., Bai, Z. P., Zhao, X. D., and Yang, Y. C.: Chemical characterization of submicron aerosol and particle growth events at a national background site (3295 m a.s.l.) on the Tibetan Plateau, Atmos. Chem. Phys., 15, 10811–10824, https://doi.org/10.5194/acp-15-10811-2015, 2015.
Fang, W. Z., Evangeliou, N., Eckhardt, S., Xing, J., Zhang, H. L., Xiao, H., Zhao, M. X., and Kim, S-W.: Increased contribution of biomass burning to haze events in Shanghai since China's clean air actions, Commun. Earth Environ., 4, 310, https://doi.org/10.1038/s43247-023-00979-z, 2023.
Farmer, D. K., Matsunaga, A., Docherty, K. S., Surratt, J. D., Seinfeld, J. H., Ziemann, P. J., and Jimenez, J. L.: Response of an aerosol mass spectrometer to organonitrates and organosulfates and implications for atmospheric chemistry, P. Natl. Acad. Sci. USA, 107, 6670–6675, https://doi.org/10.1073/pnas.0912340107, 2010.
Fry, J. L., Kiendler-Scharr, A., Rollins, A. W., Wooldridge, P. J., Brown, S. S., Fuchs, H., Dubé, W., Mensah, A., dal Maso, M., Tillmann, R., Dorn, H.-P., Brauers, T., and Cohen, R. C.: Organic nitrate and secondary organic aerosol yield from NO3 oxidation of β-pinene evaluated using a gas-phase kinetics/aerosol partitioning model, Atmos. Chem. Phys., 9, 1431–1449, https://doi.org/10.5194/acp-9-1431-2009, 2009.
Fry, J. L., Draper, D. C., Zarzana, K. J., Campuzano-Jost, P., Day, D. A., Jimenez, J. L., Brown, S. S., Cohen, R. C., Kaser, L., Hansel, A., Cappellin, L., Karl, T., Hodzic Roux, A., Turnipseed, A., Cantrell, C., Lefer, B. L., and Grossberg, N.: Observations of gas- and aerosol-phase organic nitrates at BEACHON-RoMBAS 2011, Atmos. Chem. Phys., 13, 8585–8605, https://doi.org/10.5194/acp-13-8585-2013, 2013.
Gao, M., Zhou, S. Z., He, Y., Zhang, G. H., Ma, N., Li, Y., Li, F. H., Yang, Y. X., Peng, L., Zhao, J., Bi, X. H., Hu, W. W., Sun, Y. L., Wang, B. G., and Wang, X. M.: In Situ Observation of Multiphase Oxidation-Driven Secondary Organic Aerosol Formation during Cloud Processing at a Mountain Site in Southern China, Environ. Sci. Technol. Lett., 10, 573–581, https://doi.org/10.1021/acs.estlett.3c00331, 2023.
Ge, X. L., Zhang, Q., Sun, Y. L., Ruehl, C. R., and Setyan, A.: Effect of aqueous-phase. processing on aerosol chemistry and size distributions in Fresno, California, during wintertime, Environ. Chem., 9, 221–235, 2012.
Gelaro, R., McCarty, W., Suárez, M. J., Todling, R., Molod, A., Takacs, L., Randles, C. A., Darmenov, A., Bosilovich, M. G., Reichle, R., Wargan, K., Coy, L., Cullather, R., Draper, C., Akella, S., Buchard, V., Conaty, A., de Silva, A. M., Gu, W., Kim, G.-K., Koster, R., Merkova, D., Nielsen, J. E., Partyka, G., Pawson, S., Putman, W., Rienecker, W., Rienecker, M., Schubert, S. D., Sienkiewicz, M., and Zhao, B.: The Modern-Era Retrospective Analysis for Research and Applications, Version 2 (MERRA-2), J. Climate, 30, 5419–5454, https://doi.org/10.1175/JCLI-D-16-0758.1, 2017.
Gilardoni, S., Massoli, P., Giulianelli, L., Rinaldi, M., Paglione, M., Pollini, F., Lanconelli, C., Poluzzi, V., Carbone, S., Hillamo, R., Russell, L. M., Facchini, M. C., and Fuzzi, S.: Fog scavenging of organic and inorganic aerosol in the Po Valley, Atmos. Chem. Phys., 14, 6967–6981, https://doi.org/10.5194/acp-14-6967-2014, 2014.
Hallquist, M., Wenger, J. C., Baltensperger, U., Rudich, Y., Simpson, D., Claeys, M., Dommen, J., Donahue, N. M., George, C., Goldstein, A. H., Hamilton, J. F., Herrmann, H., Hoffmann, T., Iinuma, Y., Jang, M., Jenkin, M. E., Jimenez, J. L., Kiendler-Scharr, A., Maenhaut, W., McFiggans, G., Mentel, Th. F., Monod, A., Prévôt, A. S. H., Seinfeld, J. H., Surratt, J. D., Szmigielski, R., and Wildt, J.: The formation, properties and impact of secondary organic aerosol: current and emerging issues, Atmos. Chem. Phys., 9, 5155–5236, https://doi.org/10.5194/acp-9-5155-2009, 2009.
Hao, L. Q., Kortelainen, A., Romakkaniemi, S., Portin, H., Jaatinen, A., Leskinen, A., Komppula, M., Miettinen, P., Sueper, D., Pajunoja, A., Smith, J. N., Lehtinen, K. E. J., Worsnop, D. R., Laaksonen, A., and Virtanen, A.: Atmospheric submicron aerosol composition and particulate organic nitrate formation in a boreal forestland–urban mixed region, Atmos. Chem. Phys., 14, 13483–13495, https://doi.org/10.5194/acp-14-13483-2014, 2014.
Haywood, J. and Boucher, O.: Estimates of the direct and indirect radiative forcing. due to tropospheric aerosols: A review, Rev. Geophys., 38, 513–543, https://doi.org/10.1029/1999rg000078, 2000.
Heald, C. L., Kroll, J. H., Jimenez, J. L., Docherty, K. S., DeCarlo, P. F., Aiken, A. C., Chen, Q., Martin, S. T., Farmer, D. K., and Artaxo, P.: A simplified description of the evolution of organic aerosol composition in the atmosphere, Geophys. Res. Lett., 37, L08803, https://doi.org/10.1029/2010GL042737, 2010.
Houze, R. A. Jr.: Orographic effects on precipitating clouds, Rev. Geophys., 50, RG1001, https://doi.org/10.1029/2011RG000365, 2012.
Hu, W., Hu, M., Hu, W.-W., Niu, H., Zheng, J., Wu, Y., Chen, W., Chen, C., Li, L., Shao, M., Xie, S., and Zhang, Y.: Characterization of submicron aerosols influenced by biomass burning at a site in the Sichuan Basin, southwestern China, Atmos. Chem. Phys., 16, 13213–13230, https://doi.org/10.5194/acp-16-13213-2016, 2016.
Hu, W., Hu, M., Hu, W.-W., Zheng, J., Chen, C., Wu, Y., and Guo, S.: Seasonal variations in high time-resolved chemical compositions, sources, and evolution of atmospheric submicron aerosols in the megacity Beijing, Atmos. Chem. Phys., 17, 9979–10000, https://doi.org/10.5194/acp-17-9979-2017, 2017.
Hu, W. W., Hu, M., Yuan, B., Jimenez, J. L., Tang, Q., Peng, J. F., Hu, W., Shao, M., Wang, M., Zeng, L. M., Wu, Y. S., Gong, Z. H., Huang, X. F., and He, L. Y.: Insights on organic aerosol aging and the influence of coal combustion at a regional receptor site of central eastern China, Atmos. Chem. Phys., 13, 10095–10112, https://doi.org/10.5194/acp-13-10095-2013, 2013.
Huang, R. J., Zhang, Y. L., Bozzetti, C., Ho, K. F., Cao, J. J., Han, Y. M., Daellenbach, K. R., Slowik, J. G., Platt, S. M., Canonaco, F., Zotter, P., Wolf, R., Pieber, S. M., Bruns, E. A., Crippa, M., Ciarelli, G., Piazzalunga, A., Schwikowski, M., Abbaszade, G., Schnelle-Kreis, J., Zimmermann, R., An, Z. S., Szidat, S., Baltensperger, U., El Haddad, I., and Prevot, A. S. H.: High secondary aerosol contribution to particulate pollution during haze events in China, Nature, 514, 218–222, https://doi.org/10.1038/nature13774, 2014.
Huang, X., Ding, A. J., Wang, Z. L., Ding, K., Gao, J., Chai, F. H., and Fu, C. B.: Amplified transboundary transport of haze by aerosol-boundary layer interaction in China, Nat. Geosci., 13, 428–434, https://doi.org/10.1038/s41561-020-0583-4, 2020.
Kampa, M. and Castanas, E.: Human health effects of air pollution, Environ. Pollut., 151, 362–367, https://doi.org/10.1016/j.envpol.2007.06.012, 2008.
Kanakidou, M., Seinfeld, J. H., Pandis, S. N., Barnes, I., Dentener, F. J., Facchini, M. C., Van Dingenen, R., Ervens, B., Nenes, A., Nielsen, C. J., Swietlicki, E., Putaud, J. P., Balkanski, Y., Fuzzi, S., Horth, J., Moortgat, G. K., Winterhalter, R., Myhre, C. E. L., Tsigaridis, K., Vignati, E., Stephanou, E. G., and Wilson, J.: Organic aerosol and global climate modelling: a review, Atmos. Chem. Phys., 5, 1053–1123, https://doi.org/10.5194/acp-5-1053-2005, 2005.
Kroll, J. H., Smith, J. D., Che, D. L., Kessler, S. H., Worsnop, D. R., and Wilson, K. R.: Measurement of fragmentation and functionalization pathways in the heterogeneous oxidation of oxidized organic aerosol, Phys. Chem. Chem. Phys., 11, 8005–8014, https://doi.org/10.1039/b905289e, 2009.
Kuang, Y., Xu, W. Q., Tao, J. C., Luo, B., Liu, L., Xu, H. B., Xu, W. Y., Xue, B., Zhai, M. M., Liu, P. F., and Sun, Y. L.: Divergent Impacts of Biomass Burning and Fossil Fuel Combustion Aerosols on Fog-Cloud Microphysics and Chemistry: Novel Insights From Advanced Aerosol-Fog Sampling, Geophys. Res. Lett., 51, e2023GL107147, https://doi.org/10.1029/2023GL107147, 2024.
Lee, A. K. Y., Hayden, K. L., Herckes, P., Leaitch, W. R., Liggio, J., Macdonald, A. M., and Abbatt, J. P. D.: Characterization of aerosol and cloud water at a mountain site during WACS 2010: secondary organic aerosol formation through oxidative cloud processing, Atmos. Chem. Phys., 12, 7103–7116, https://doi.org/10.5194/acp-12-7103-2012, 2012.
Li, J. J., Wang, G. H., Cao, J. J., Wang, X. M., and Zhang, R. J.: Observation of biogenic secondary organic aerosols in the atmosphere of a mountain site in central China: temperature and relative humidity effects, Atmos. Chem. Phys., 13, 11535–11549, https://doi.org/10.5194/acp-13-11535-2013, 2013.
Li, X. M. and Zhou, W. Q.: Dasymetric mapping of urban population in China based on radiance corrected DMSP-OLS nighttime light and land cover data, Sci. Total Environ., 643, 1248–1256, https://doi.org/10.1016/j.scitotenv.2018.06.244, 2018.
Li, Z. Y., Xie, P. H, Hu, R. Z., Wang, D., Jin, H. W., Chen, H., Lin, C., and Liu, W. Q: Observations of N2O5 and NO3 at a suburban environment in Yangtze river delta in China: Estimating heterogeneous N2O5 uptake coefficients, J. Environ. Sci., 95, 248–255, https://doi.org/10.1016/j.jes.2020.04.041, 2020.
Liang, L. L., Engling G., Cheng, Y., Liu, X. Y., Du, Z. Y., Ma, Q. L., Zhang, X. Y., Sun, J. Y., Xu, W. Y., Liu, C., Zhang, G., and Xu, H.: Biomass burning impacts on ambient aerosol at a background site in East China: Insights from a yearlong study, Atmos. Res., 231, 104660, https://doi.org/10.1016/j.atmosres.2019.104660, 2020.
Lim, Y. B., Tan, Y., Perri, M. J., Seitzinger, S. P., and Turpin, B. J.: Aqueous chemistry and its role in secondary organic aerosol (SOA) formation, Atmos. Chem. Phys., 10, 10521–10539, https://doi.org/10.5194/acp-10-10521-2010, 2010.
Lin, C., Huang, R.-J., Duan, J., Zhong, H., and Xu, W.: Primary and Secondary Organic Nitrate in Northwest China: A Case Study, Environ. Sci. Technol. Lett., 8, 947–953, https://doi.org/10.1021/acs.estlett.1c00692, 2021.
Middlebrook, A. M., Bahreini, R., Jimenez, J. L., and Canagaratna, M. R.: Evaluation of Composition-Dependent Collection Efficiencies for the Aerodyne Aerosol Mass Spectrometer using Field Data, Aerosol Sci. Tech., 46, 258–271, https://doi.org/10.1080/02786826.2011.620041, 2012.
Nault, B. A., Croteau, P., Jayne, J., Williams, A., Williams, L., Worsnop, D. R., Katz, E. F., DeCarlo, P. F., and Canagaratna, M.: Laboratory evaluation of organic aerosol relative ionization efficiencies in the aerodyne aerosol mass spectrometer and aerosol chemical speciation monitor, Aerosol Sci. Tech., 57, 981–997, https://doi.org/10.1080/02786826.2023.2223249, 2023.
Pokorná, P., Zíková, N., Vodička, P., Lhotka, R., Mbengue, S., Holubová Šmejkalová, A., Riffault, V., Ondráček, J., Schwarz, J., and Ždímal, V.: Chemically speciated mass size distribution, particle density, shape and origin of non-refractory PM1 measured at a rural background site in central Europe, Atmos. Chem. Phys., 22, 5829–5858, https://doi.org/10.5194/acp-22-5829-2022, 2022.
Ramanathan, V., Crutzen, P. J., Kiehl, J. T., and Rosenfeld, D.: Atmosphere – Aerosols, climate, and the hydrological cycle, Science, 294, 2119–2124, https://doi.org/10.1126/science.1064034, 2001.
Rejano, F., Titos, G., Casquero-Vera, J. A., Lyamani, H., Andrews, E., Sheridan, P., Cazorla, A., Castillo, S., Alados-Arboledas, L., and Olmo, F.: Activation properties of aerosol particles as cloud condensation nuclei at urban and high-altitude remote sites in southern Europe, Sci. Total Environ., 762, 143100, https://doi.org/10.1016/j.scitotenv.2020.143100, 2021.
Roth, A., Schneider, J., Klimach, T., Mertes, S., van Pinxteren, D., Herrmann, H., and Borrmann, S.: Aerosol properties, source identification, and cloud processing in orographic clouds measured by single particle mass spectrometry on a central European mountain site during HCCT-2010, Atmos. Chem. Phys., 16, 505–524, https://doi.org/10.5194/acp-16-505-2016, 2016.
Song, S., Gao, M., Xu, W., Sun, Y., Worsnop, D. R., Jayne, J. T., Zhang, Y., Zhu, L., Li, M., Zhou, Z., Cheng, C., Lv, Y., Wang, Y., Peng, W., Xu, X., Lin, N., Wang, Y., Wang, S., Munger, J. W., Jacob, D. J., and McElroy, M. B.: Possible heterogeneous chemistry of hydroxymethanesulfonate (HMS) in northern China winter haze, Atmos. Chem. Phys., 19, 1357–1371, https://doi.org/10.5194/acp-19-1357-2019, 2019.
Sun, Y. L., Zhang, Q., Schwab, J. J., Yang, T., Ng, N. L., and Demerjian, K. L.: Factor analysis of combined organic and inorganic aerosol mass spectra from high resolution aerosol mass spectrometer measurements, Atmos. Chem. Phys., 12, 8537–8551, https://doi.org/10.5194/acp-12-8537-2012, 2012.
Tang, C. G., Zhang, X. H., Tian, P. F., Guan, X., Lin, Y. J., Pang, S. T., Guo, Q., Du, T., Zhang, Z. D, Zhang, M., Xu, J. Z., and Zhang, L.: Chemical characteristics and regional transport of submicron particulate matter at a suburban site near Lanzhou, China, Environ. Res., 212, 113179, https://doi.org/10.1016/j.envres.2022.113179, 2022.
Tang, L. L, Yu, H. X., Ding, A. J, Zhang, Y. J., Qin, W., Wang, Z., Chen, W. T, Hua, Y., and Yang, X. X.: Regional contribution to PM1 pollution during winter haze in Yangtze River Delta, China, Sci. Total Environ., 541, 161–166, https://doi.org/10.1016/j.scitotenv.2015.05.058, 2016.
Tao, J., Zhang, Z. S., Tan, H. B., Zhang, L. M., Wu, Y. F., Sun, J. R., Che, H. Z., Cao, J. J., Cheng, P., Chen, L. G., and Zhang, R. J.: Observational evidence of cloud processes contributing to daytime elevated nitrate in an urban atmosphere, Atmos. Environ., 186, 209–215, https://doi.org/10.1016/j.atmosenv.2018.05.040, 2018.
Ulbrich, I. M., Canagaratna, M. R., Zhang, Q., Worsnop, D. R., and Jimenez, J. L.: Interpretation of organic components from Positive Matrix Factorization of aerosol mass spectrometric data, Atmos. Chem. Phys., 9, 2891–2918, https://doi.org/10.5194/acp-9-2891-2009, 2009.
Wang, J., Ge, X., Chen, Y., Shen, Y., Zhang, Q., Sun, Y., Xu, J., Ge, S., Yu, H., and Chen, M.: Highly time-resolved urban aerosol characteristics during springtime in Yangtze River Delta, China: insights from soot particle aerosol mass spectrometry, Atmos. Chem. Phys., 16, 9109–9127, https://doi.org/10.5194/acp-16-9109-2016, 2016.
Wang, Q. Y., Huang, R.-J., Cao, J. J., Tie, X. X., Ni, H. Y., Zhou, Y. Q., Han, Y. M., Hu, T. F., Zhu, C. S., Feng, T., Li, N., and Li, J. D.: Black carbon aerosol in winter northeastern Qinghai–Tibetan Plateau, China: the source, mixing state and optical property, Atmos. Chem. Phys., 15, 13059–13069, https://doi.org/10.5194/acp-15-13059-2015, 2015.
Wen, L., Xue, L. K., Dong, C., Wang, X. F., Chen, T. S., Jiang, Y., Gu, R. R., Zheng, P. G., Li, H. Y., Shan, Y., Zhu, Y. J., Zhao, Y., Yin, X. K., Liu, H. D., Gao, J., Wu, Z. J., Wang, T., Herrmann, H., and Wang, W. X.: Reduced atmospheric sulfate enhances fine particulate nitrate formation in eastern China, Sci. Total Environ., 898, 165303, https://doi.org/10.1016/j.scitotenv.2023.165303, 2023.
Xian, J., Cui, S., Chen, X., Wang, J., Xiong, Y., Gu, C., Wang, Y., Zhang, Y. J., Li, H. W., Wang, J. F., and Ge, X. L.: Online chemical characterization of atmospheric fine secondary aerosols and organic nitrates in summer Nanjing, China, Atmos. Res., 290, 106783, https://doi.org/10.1016/j.atmosres.2023.106783, 2023.
Xu, J., Zhang, Q., Chen, M., Ge, X., Ren, J., and Qin, D.: Chemical composition, sources, and processes of urban aerosols during summertime in northwest China: insights from high-resolution aerosol mass spectrometry, Atmos. Chem. Phys., 14, 12593–12611, https://doi.org/10.5194/acp-14-12593-2014, 2014.
Xu, J., Zhang, Q., Shi, J., Ge, X., Xie, C., Wang, J., Kang, S., Zhang, R., and Wang, Y.: Chemical characteristics of submicron particles at the central Tibetan Plateau: insights from aerosol mass spectrometry, Atmos. Chem. Phys., 18, 427–443, https://doi.org/10.5194/acp-18-427-2018, 2018a.
Xu, L., Suresh, S., Guo, H., Weber, R. J., and Ng, N. L.: Aerosol characterization over the southeastern United States using high-resolution aerosol mass spectrometry: spatial and seasonal variation of aerosol composition and sources with a focus on organic nitrates, Atmos. Chem. Phys., 15, 7307–7336, https://doi.org/10.5194/acp-15-7307-2015, 2015.
Xu, P., Zhang, J. K., Ji, D. S., Liu, Z. R., Tang, G. Q., Jiang, C. S., and Wang, Y. S.: Characterization of submicron particles during autumn in Beijing, China, J. Environ. Sci., 63, 16–27, https://doi.org/10.1016/j.jes.2017.03.036, 2018b.
Yu, K., Zhu, Q., Du, K., and Huang, X.-F.: Characterization of nighttime formation of particulate organic nitrates based on high-resolution aerosol mass spectrometry in an urban atmosphere in China, Atmos. Chem. Phys., 19, 5235–5249, https://doi.org/10.5194/acp-19-5235-2019, 2019.
Yuan, B., Hu, W. W., Shao, M., Wang, M., Chen, W. T., Lu, S. H., Zeng, L. M., and Hu, M.: VOC emissions, evolutions and contributions to SOA formation at a receptor site in eastern China, Atmos. Chem. Phys., 13, 8815–8832, https://doi.org/10.5194/acp-13-8815-2013, 2013.
Zhang, Q., Jimenez, J. L., Canagaratna, M. R., Ulbrich, I. M., Ng, N. L., Worsnop, D. R., and Sun, Y. L.: Understanding atmospheric organic aerosols via factor analysis of aerosol mass spectrometry: a review, Anal. Bioanal. Chem., 401, 3045–3067, https://doi.org/10.1007/s00216-011-5355-y, 2011.
Zhang, X., Xu, J., Kang, S., Liu, Y., and Zhang, Q.: Chemical characterization of long-range transport biomass burning emissions to the Himalayas: insights from high-resolution aerosol mass spectrometry, Atmos. Chem. Phys., 18, 4617–4638, https://doi.org/10.5194/acp-18-4617-2018, 2018.
Zhang, X., Xu, J., Kang, S., Zhang, Q., and Sun, J.: Chemical characterization and sources of submicron aerosols in the northeastern Qinghai–Tibet Plateau: insights from high-resolution mass spectrometry, Atmos. Chem. Phys., 19, 7897–7911, https://doi.org/10.5194/acp-19-7897-2019, 2019.
Zhang, Y. J., Tang, L. L., Wang, Z., Yu, H. X., Sun, Y. L., Liu, D., Qin, W., Canonaco, F., Prévôt, A. S. H., Zhang, H. L., and Zhou, H. C.: Insights into characteristics, sources, and evolution of submicron aerosols during harvest seasons in the Yangtze River delta region, China, Atmos. Chem. Phys., 15, 1331–1349, https://doi.org/10.5194/acp-15-1331-2015, 2015.
Zhang, J. K., Cheng, M. T., Ji, D. S., Liu, Z. R., Hu, B., Sun, Y. L., and Wang, Y. S.: Characterization of submicron particles during biomass burning and coal combustion periods in Beijing, China, Sci. Total Environ., 562, 812–821, https://doi.org/10.1016/j.scitotenv.2016.04.015, 2016.
Zhang, Y. M., Zhang, X. Y., Sun, J. Y., Hu, G. Y., Shen, X. J., Wang, Y. Q., Wang, T. T., Wang, D. Z., and Zhao, Y.: Chemical composition and mass size distribution of PM1 at an elevated site in central east China, Atmos. Chem. Phys., 14, 12237–12249, https://doi.org/10.5194/acp-14-12237-2014, 2014.
Zhang, Z., Xu, W., Zhang, Y., Zhou, W., Xu, X., Du, A., Zhang, Y., Qiao, H., Kuang, Y., Pan, X., Wang, Z., Cheng, X., Liu, L., Fu, Q., Worsnop, D. R., Li, J., and Sun, Y.: Measurement report: Secondary organic aerosols at a forested mountain site in southeastern China, Zenodo [data set], https://doi.org/10.5281/zenodo.10312334, 2023.
Zhong, H., Huang, R.-J., Lin, C., Xu, W., Duan, J., Gu, Y., Huang, W., Ni, H., Zhu, C., You, Y., Wu, Y., Zhang, R., Ovadnevaite, J., Ceburnis, D., and O'Dowd, C. D.: Measurement report: On the contribution of long-distance transport to the secondary aerosol formation and aging, Atmos. Chem. Phys., 22, 9513–9524, https://doi.org/10.5194/acp-22-9513-2022, 2022.
Zhou, S., Collier, S., Jaffe, D. A., and Zhang, Q.: Free tropospheric aerosols at the Mt. Bachelor Observatory: more oxidized and higher sulfate content compared to boundary layer aerosols, Atmos. Chem. Phys., 19, 1571–1585, https://doi.org/10.5194/acp-19-1571-2019, 2019.
Zhou, W., Xu, W. Q, Kim, H., Zhang, Q., Fu, P. Q., Worsnop, D. R., and Sun, Y. L.: A review. of aerosol chemistry in Asia: insights from aerosol mass spectrometer measurements, Environ. Sci.-Proc. Imp., 22, 1616–1653, https://doi.org/10.1039/D0EM00212G, 2020.
Zhu, Q., He, L.-Y., Huang, X.-F., Cao, L.-M., Gong, Z.-H., Wang, C., Zhuang, X., and Hu, M.: Atmospheric aerosol compositions and sources at two national background sites in northern and southern China, Atmos. Chem. Phys., 16, 10283–10297, https://doi.org/10.5194/acp-16-10283-2016, 2016.