the Creative Commons Attribution 4.0 License.
the Creative Commons Attribution 4.0 License.
 | 16 Jul 2024
Diverging trends in aerosol sulfate and nitrate measured in the remote North Atlantic in Barbados are attributed to clean air policies, African smoke, and anthropogenic emissions
Joseph M. Prospero
Kristen Foley
Havala O. T. Pye
Lillian Custals
Edmund Blades
Peter Sealy
James A. Christie
Sulfate and nitrate aerosols degrade air quality, modulate radiative forcing and the hydrological cycle, and affect biogeochemical cycles, yet their global cycles are poorly understood. Here, we examined trends in 21 years of aerosol measurements made at Ragged Point, Barbados, the easternmost promontory on the island located in the eastern Caribbean Basin. Though the site has historically been used to characterize African dust transport, here we focused on changes in nitrate and non-sea-salt (nss) sulfate aerosols from 1990–2011. Nitrate aerosol concentrations averaged over the entire period were stable at 0.59 µg m−3 ± 0.04 µg m−3, except for elevated nitrate concentrations in the spring of 2010 and during the summer and fall of 2008 due to the transport of biomass burning emissions from both northern and southern Africa to our site. In contrast, from 1990 to 2000, nss-sulfate decreased 30 % at a rate of 0.023 µg m−3 yr−1, a trend which we attribute to air quality policies enacted in the United States (US) and Europe. From 2000–2011, sulfate gradually increased at a rate of 0.021 µg m−3 yr−1 to pre-1990s levels of 0.90 µg m−3. We used the Community Multiscale Air Quality (CMAQ) model simulations from the EPA's Air QUAlity TimE Series (EQUATES) to better understand the changes in nss-sulfate after 2000. The model simulations estimate that increases in anthropogenic emissions from Africa explain the increase in nss-sulfate observed in Barbados. Our results highlight the need to better constrain emissions from developing countries and to assess their impact on aerosol burdens in remote source regions.
- Article
(9520 KB) - Full-text XML
-
Supplement
(8873 KB) - BibTeX
- EndNote


Sulfate and nitrate aerosols, formed from gaseous sulfur dioxide (SO2), nitrogen oxides (e.g., NOx ≡ NO + NO2), and reactive nitrogen (e.g., NOy), contribute to aerosol direct and indirect radiative forcing, impact biogeochemical cycles (Jickells et al., 2017), and degrade air quality (Adams et al., 1999; Appel et al., 1978; Charlson et al., 1992; Lelieveld and Heintzenberg, 1992; Murphy et al., 2006). An outstanding question is, how have sulfate and nitrate aerosol burdens in remote regions changed in response to air quality policies, economic growth, and changing frequency of wildfires – all of which have affected SO2 and NOx emissions? Answering this question is important, as remote regions are an important barometer of changing global emission inventories, contain ecosystems sensitive to changing chemical inputs (Galloway et al., 2008; Mahowald et al., 2017), and are most sensitive to fluctuations in aerosol burdens that alter aerosol–cloud interactions (Carslaw et al., 2013). Long-term measurement records in remote regions can provide insight into this question and further advance current chemical transport and global climate models. However, there are few long-term measurement records in remote regions. In this work, we leverage 21 years of nitrate and sulfate aerosol concentrations measured at Ragged Point, Barbados, a remote site in the eastern North Atlantic marine boundary layer, and use simulations from a hemispheric chemical transport model – the Community Multiscale Air Quality (CMAQ) model within the EPA's Air QUAlity TimE Series (EQUATES) (Foley et al., 2023) – to link our observed changes in nitrate and sulfate to changing emissions inventories and meteorological conditions. In turn, comparing the EQUATES model output to our time series provides guidance on where in situ measurements are needed to improve emissions inventories and measurement–model agreement.
Ragged Point, Barbados, provides a unique opportunity to understand changes in the nitrate and sulfate aerosol burden in the remote North Atlantic marine boundary layer. Aerosol sampling began in 1971 and continues to this day, generating a 50-year measurement record – the longest modern speciated aerosol record, to the best of our knowledge (Prospero et al., 2021; Prospero and Mayol-Bracero, 2013). The site serves as a linchpin for understanding the impact of long-range aerosol transport on the remote North Atlantic marine boundary layer and the Caribbean. The site's primary objective has been to understand the factors affecting the long-range transport of African dust to the Caribbean and North America, which peaks in boreal summer in association with the seasonal northward shift in the intertropical convergence zone (ITCZ). Summer dust events are caused by the strong heating of northern Africa, which causes hot, dry, dust-laden desert air to be carried to high altitudes, e.g., 4–6 km. African easterly waves propagate dust westward within an elevated air layer known as the Saharan Air Layer (SAL) that overrides the cool, moist marine boundary layer (Adams et al., 2012; Carlson and Prospero, 1972; Goudie and Middleton, 2001; Tsamalis et al., 2013). Background emissions at the site are dominated by sea spray and marine biogenic emissions of dimethyl sulfide (DMS) that contribute non-sea-salt (nss) sulfate (Andreae et al., 1985; Barnes et al., 2006; Savoie et al., 2002). Along with dust, anthropogenic emissions from Europe (Lelieveld et al., 2002), North America, and northern Africa are also transported to Barbados (Savoie et al., 2002). Transport from Africa takes ∼ 5–7 d to reach our site, while transport from the United States (US) and Europe takes longer, typically 7–10 d.
Anthropogenic emissions of SO2 and NOx that impact Ragged Point have changed in recent decades due to the opposing effects of decreasing emissions mandated by national air quality policies, implemented mostly in developed countries, and increasing emissions linked to rapid economic growth in developing countries. The US curbed emissions of NOx and SO2 with the implementation of the Clean Air Act (amended in 1990), resulting in a 92 % reduction in SO2 and a 71 % reduction in NOx emissions from 1990–2022 (Aas et al., 2019; Hand et al., 2012; https://gispub.epa.gov/air/trendsreport/2023/, EPA, 2023a; Smith et al., 2011; Zhao et al., 2017). Countries within the European Union (EU) passed similar policies resulting in analogous reductions (Aas et al., 2019; Rafaj et al., 2015; Smith et al., 2011; Yang et al., 2020). Notably, reductions in SO2 can reduce aerosol acidity, resulting in increased nitrate aerosols. Furthermore, reductions in pollutant gases can relieve oxidant limitations, leading to more efficient oxidation; therefore, reductions in SO2 and NOx may not reduce sulfate and nitrate aerosols as much as expected (Shah et al., 2018). In contrast to the US and EU, emissions in regions such as the Middle East, India, and Africa are continuing to increase due to rapid economic growth, with emissions from India predicted to overtake China as the world's largest emitter of SO2 (Lelieveld et al., 2009; Li et al., 2017; McDuffie et al., 2020). Due to a lack of in situ measurements in many of these regions, chemical transport and emissions inventory models combined with remote sensing have been key tools to understand changing pollutants.
In addition to fossil fuel emissions, biomass burning is also a major source of SO2 and NOx that can impact the Atlantic (Andreae, 2019; Andreae and Merlet, 2001; Rickly et al., 2022; Roberts et al., 2009; Zuidema et al., 2018). Wildfire activity has a distinct seasonality linked to the dry seasons in Africa. Burning is most intense in sub-Saharan Africa from the Equator to 20° N from November through May, while, from May through October, the savanna regions of sub-Saharan Africa from the Equator to 25° S are the most active fire sources (Giglio et al., 2006; Kganyago and Shikwambana, 2019; Roberts et al., 2009; Van der Werf et al., 2003). African smoke can be transported to Barbados from sub-Saharan Africa north of the Equator in winter and spring (Quinn et al., 2022; Royer et al., 2023; Wex et al., 2016) and, less frequently, from southern hemispheric Africa in the fall (Trapp et al., 2010). Conditions thought to be related to African climate (e.g., the North Atlantic Oscillation and the position of the Azores High) can cause large quantities of northern African dust (and smoke) to be transported during the winter and spring in elevated mixed aerosol layers (Chiapello et al., 2005; Doherty et al., 2008, 2012; Gutleben et al., 2022) when dust is also carried to northeastern South America (Barkley et al., 2019; Prospero et al., 1981, 2014). Prescribed burns in the southeastern US in winter and spring may also contribute biomass burning emissions to the aerosol burden observed in Barbados (Nowell et al., 2018).
Here we highlight different trends in nitrate and sulfate aerosols over the remote North Atlantic marine boundary layer and relate them to changing emissions. We then compare our observations to simulated concentrations of nitrate and sulfate aerosols using the CMAQ model from EQUATES, which was chosen due to its skill in modeling changes in nitrate and sulfate chemistry within the US (Benish et al., 2022) and its ability to simulate constituents and sources of air pollution in remote regions, such as Dhaka, Bangladesh (Sarwar et al., 2023). Our results highlight the importance of long-term atmospheric observations to understand the net outcome of changing global SO2 and NOx emissions on both the aerosol burden and the air quality in distant populations.
2.1 Aerosol collection at the Barbados Atmospheric Chemistry Observatory
Aerosols were collected daily at the University of Miami's Barbados Atmospheric Chemistry Observatory (UM BACO: https://baco.rsmas.miami.edu/, last access: 10 July 2024) located at Ragged Point, Barbados – the easternmost promontory on the east coast of the island (13.16504° N, 59.43207° W). The site has been operated by UM since 1971, and aerosol data have been used to document the long-range transport of African dust to the Caribbean and the Americas carried by the easterly trade winds, as it is the first landmass encountered by African emissions transported across the Atlantic Ocean (Prospero et al., 2021). The site is approximately 4500 km from the west coast of northern Africa, 3000 km from the east coast of the US, and 6000 km from the west coast of the EU. Since 1989, aerosols have been collected at the top of a 17 m sampling tower that stands atop a 30 m bluff (see Fig. 1).
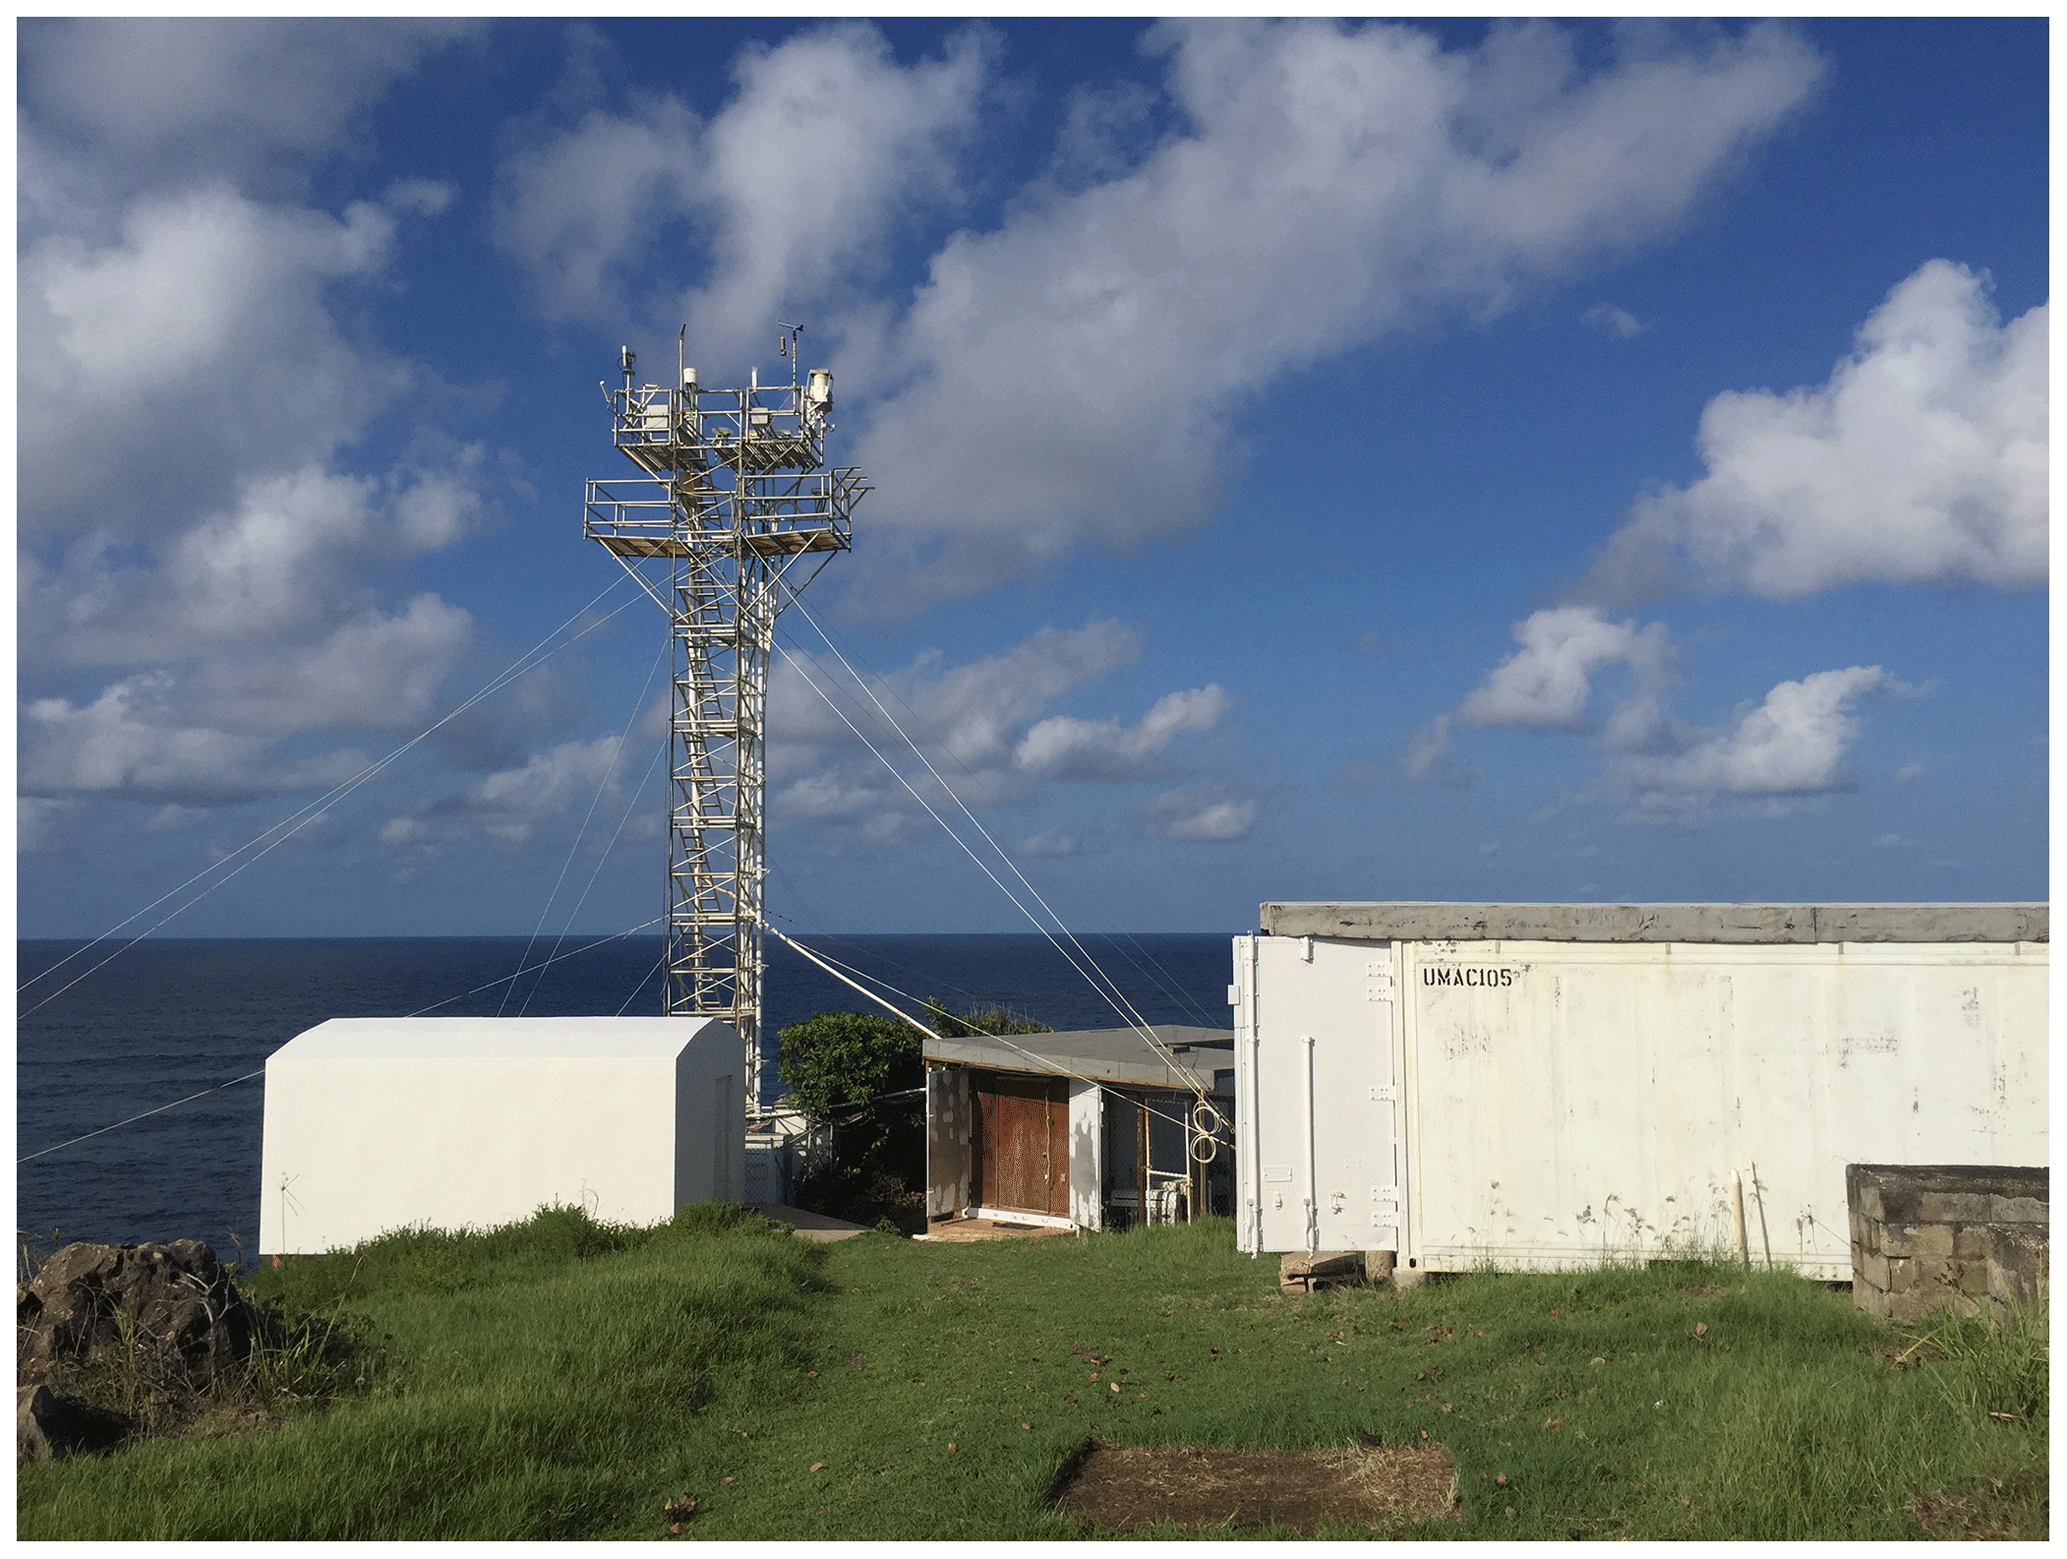
Figure 1Photo of the Barbados Atmospheric Chemistry Observatory (BACO), including the 17 m sampling tower, two shipping container laboratories, and an Advanced Global Atmospheric Gases Experiment (AGAGE) laboratory.
A high-volume sampler pulled air at a nominal rate of 0.75 m3 min−1 across a 20 cm × 25 cm Whatman 41 filter. The upper particle size limit for our filter collection method was approximately 80–100 µm or greater based on the geometry of our sampling rain hat (Barkley et al., 2021). Filters were collected daily (e.g., every 24 h); however, a few multiday samples that typically spanned 2 d were also collected. Mass collection efficiencies were 90 % for sulfate, 95 % for nitrate, and 99 % for dust (Savoie and Prospero, 1982). Filters were then folded into quarters under a laminar flow hood, placed in a clean Ziploc bag, and periodically shipped to UM for processing. To ensure that local island emissions were not sampled, the sampling pump was only operational when the wind blew directly from the ocean (from 335 degrees through N and E to 130 degrees) with speeds greater than 1 m s−1. A timer was used to record the “run time”, the total amount of time that the sampling pumps were on during the sampling interval between filter changes. Data with a run time less than 10 % of the sampling interval were discarded to minimize the impact of low-speed and flukey wind conditions that might have carried aerosols from local sources. These deletions accounted for less than 10 % of all data collected over the record, highlighting the steady easterly winds measured at the site year-round. Procedural blanks were collected weekly by placing a Whatman 41 filter in the filter cassette with the sampling pump off for 15 min then placing the filter in a clean Ziploc bag; the blank was subsequently processed along with the daily filter samples.
This work focuses on aerosol measurements conducted over 1990–2011, a period that overlaps with the implementation of more stringent air quality policies in the US and Europe. Seasonal trends are also shown, where winter is represented by December (from the previous year), January, and February (DJF); spring is March, April, and May (MAM); summer is June, July, and August (JJA); and fall is September, October, and November (SON). African dust peaks annually at BACO in JJA with episodic transport in DJF and MAM in some years (Prospero and Mayol-Bracero, 2013; Quinn et al., 2022; Royer et al., 2023). Trends presented in this work are derived from Theil–Sen regression. Significance is calculated using paired-sample t tests.
2.2 Quantification of dust and soluble ion mass concentrations:
A one-quarter filter section was extracted 3 times with a total volume of 20 mL of Milli-Q water to remove soluble material. The extracted filter was placed in a combustion oven (500 °C) overnight. The resulting ash was weighed (mfilter ash) and subsequently corrected for the filter background by subtracting the ash measured from performing the same technique on the procedural blank (mprocedural blank). The gross ash weight was adjusted by a factor of 1.3 to account for losses during the extraction and combustion process (Prospero, 1999; Zuidema et al., 2019). This corrected ash mass concentration was equated to mineral dust concentrations present on the filter based on previous comparisons between filter ash and concentrations of aluminum, a tracer for mineral dust (Prospero, 1999; Trapp et al., 2010).
The filtrate from the sample extraction process and procedural blanks was used to quantify soluble ion concentrations. Anions (e.g., chloride (Cl−), nitrate (NO), and sulfate (SO)) were measured using ion chromatography (IC). Cations (sodium (Na+), potassium (K+), and calcium (Ca2+)) were measured with a flame photometer after 2004, while flame atomic absorption spectrophotometry was used prior to 2004, limiting cation analysis to sodium (Savoie et al., 2002). In addition to total soluble ion concentrations, we also report concentrations of non-sea-salt (nss) sulfate, which is a useful tracer of sulfur from marine biogenic and pollution emissions, and nss-potassium, a tracer of biomass burning emissions (Andreae, 1983; Keene et al., 1986). Concentrations of nss-SO and nss-K+ were calculated using the following mass-based equations and assuming that Na+ is a conservative tracer of sea spray aerosols.
Filter samples with undetectable amounts of dust and soluble ions compared to procedural blanks are removed from our analysis.
2.3 EQUATES model products
EPA's Air QUAlity TimE Series (EQUATES) project uses the Community Multiscale Air Quality (CMAQ) model, a 3-D chemical transport air quality model, to simulate air quality over a continuous 2002–2019 period (Foley et al., 2023). CMAQ accounts for gas, cloud, and aerosol chemistry, including processes such as in-cloud sulfate formation from the oxidation of SO2. EQUATES uses CMAQv5.3.2 (Appel et al., 2021) to model the Northern Hemisphere using 108 km resolution and 44 vertical layers (Mathur et al., 2017). Meteorological data are derived from the Weather Research and Forecasting model (WRFv.4.1.1). Emissions from outside the contiguous US and China are generated using the Hemispheric Transport of Air Pollution version 2 (HTAPv2.2) inventory for the year 2010 and are scaled to other years using the Community Emissions Data System (CEDS) for the years 2002–2019. The Fire INventory from NCAR (FINN) is used to generate biomass burning emissions (Wiedinmyer et al., 2011), lightning NOx emissions are derived from the Global Emissions InitiAtive (GEIA), biogenic volatile organic compounds (VOCs) are from MEGAN2, and soil NOx is from CAMSv2.1.
In this study, EQUATES was used to better understand observed trends, namely in nss-sulfate, after 2000 when observed concentrations unexpectedly increased. EQUATES also simulated concentrations of locally emitted gases, including SO2(g) and NOx(g), which are not measured at Ragged Point. The model product is not available for the years prior to 2000. The analysis focused on dust, sea spray, nitrate, sulfate, and gaseous SO2 and NO2. In addition to anthropogenic sources of SO2, natural sources from the oxidation of DMS were included in model runs. Species predictions were extracted from the lowest CMAQ model layer (∼ 10 m in thickness) for a source area over the Atlantic Ocean to the east of the island from 14.3989 to 11.45667° N latitude and 59.5627 to 56.54487° W longitude (equivalent to 16 grid cells with 1 cell over Ragged Point and the others to the east of the site). Simulated concentrations of aerosol sulfate, nitrate, calcium, potassium, and sodium were obtained for fine-mode aerosols (e.g., Aitken and accumulation mode, PMF model outputs) and coarse-mode aerosols (total PM–PM2.5, PMC model outputs). Previous studies have shown that most of the aerosol mass at Ragged Point is below 10 µm diameter (Prospero et al., 2001). Because aerosol filters collected at BACO capture total suspended particulate matter, model outputs of fine- and coarse-mode aerosol concentrations were combined (e.g., PMF + PMC model outputs) to give total aerosol mass concentrations of sulfate, nitrate, sodium, potassium, and calcium. Total concentrations of nss-sulfate and nss-potassium were calculated using Eqs. (2) and (3), respectively, and model outputs of total sodium mass concentrations, total sulfate mass concentrations, and total potassium mass concentrations were calculated from combined coarse- and fine-mode aerosol model outputs. We calculated concentrations of nss-calcium, which has been shown to be a good tracer for mineral dust in Barbados (Savoie and Prospero, 1980), and dust mass concentrations were then calculated using the average upper-crustal abundance of calcium in soil (an average of 4.1 %) (Scheuvens et al., 2013; Taylor and McLennan, 1985) as shown in Eqs. (4) and (5).
We first assessed the ability of the EQUATES CMAQ simulations to capture trends in different aerosol types observed at Ragged Point. Simulations of sodium and dust from EQUATES (see Figs. S1 and S2 in the Supplement) capture seasonal and monthly observed trends in dust. However, the model overpredicts sodium (Na+, a proxy for sea spray) by a factor of 3–4 (Fig. S1) and underpredicts dust by an average factor of ∼7. This low bias for dust in CMAQv5.3.2 is consistent with CMAQ development that occurred after the EQUATES simulations were complete. A bug fix to the online dust emissions module in CMAQv5.4 increases dust emissions by a factor of 3–7 over the Sahara and parts of Asia (see the CMAQv5.4 release notes for further information; https://www.epa.gov/cmaq/cmaq-documentation#release-notes, last access: 10 July 2024).
In addition to simulating observed aerosol concentrations, EQUATES was also used to examine trends in gaseous indicators of anthropogenic and biomass burning emissions, oxidant concentrations and oxidant ratios important for investigating changes in the oxidation efficiency of locally emitted pollutant gases, and the subsequent formation of nitrate and sulfate aerosols. Furthermore, EQUATES was used to investigate whether the oxidation efficiency of SO2(g) changed during the 2002–2011 period. The oxidation ratio was calculated from Eq. (6) (Shah et al., 2018):
For this calculation, we used EQUATES model data for SO2(g) concentrations and filter-based observations of nss-sulfate.
2.4 HYSPLIT back-trajectory analysis
Air mass back-trajectory analysis was performed using NOAA's Hybrid Single-Particle Lagrangian Integrated Trajectory (HYSPLIT) model (Draxler and Rolph, 2011; Rolph et al., 2017; Stein et al., 2015). Back-trajectories of 13 d were initiated at heights of 500, 1000, and 2000 m to capture both SAL and boundary layer transport. Frequency plots were also generated for the entire sampling period (1990–2011) to illustrate seasonal differences in air mass transport and origin and to explore any interannual variability. We used the global National Centers for Environmental Prediction (NCEP) reanalysis data that extend back to the beginning of our dataset in 1990 (Kramer et al., 2020). The finer-resolution Global Data Assimilation System (GDAS) dataset (1° resolution) was used to examine trends in air mass back-trajectories in 2008, 2009, and 2010 when transport conditions strongly impacted nitrate aerosol concentrations. We emphasize the challenges in characterizing long-range-transported aerosols due to the remoteness of the site, the location of Barbados in the middle of the ocean, and the fact that air layers of smoke and dust change in height during transport. As such, we caution against the over-reliance on HYSPLIT analysis to extensively characterize long-range transport aerosol dynamics and instead use this analysis to quantitatively describe major changes in transport patterns.
3.1 Measured trends from 1990–2011 at Ragged Point
Figure 2 shows yearly averaged mass concentrations of non-sea-salt (nss) sulfate and nitrate from 1990 through 2011. Nitrate concentrations are remarkably stable from 1990 to 2011 (R2=0.006, p>0.05 (not significant)) with an average concentration of 0.59 µg m−3 ± 0.04 µg m−3. However, two anomalous peaks in nitrate are observed in 2008 and 2010 with annual average nitrate concentrations of 0.73 and 0.81 µg m−3, respectively. Similarly, dust mass concentrations also show no trend over this period (R2=0.06). In contrast, nss-sulfate decreases by 30 % from an average concentration of 0.84 µg m−3 starting in 1990 to a minimum of 0.64 µg m−3 in 2000 at a rate of −0.023 µg m−3 yr−1. Subsequently, sulfate gradually increased to 0.91 µg m−3 in 2010 and 0.90 µg m−3 in 2011, maximums across the entire record. The trends in the yearly average mass concentrations of nitrate and nss-sulfate are significantly different (p value < 0.005), which can be explained either by different sources or different rates of change for precursor NOx and SO2 emissions or by different responses in nitrate and sulfate aerosol production to changing emissions of NOx and SO2, as has been shown in North America (Shah et al., 2018; Vasilakos et al., 2018).
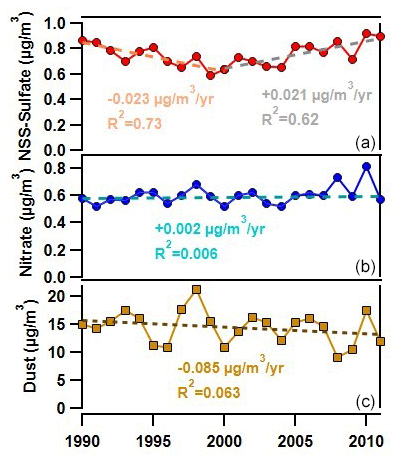
Figure 2Yearly averages of (a) non-sea-salt sulfate (nss-sulfate; red line), (b) nitrate (blue line), and (c) dust (brown line) measured at Ragged Point, Barbados, from 1990–2011. Dashed lines show changes in nss-sulfate pre-2000 (orange) and post-2000 (gray), nitrate (teal) without the spikes in 2008 and 2010 considered, and dust (brown) over the 1990–2011 period.
The Barbados yearly concentrations differ from long-term observations of aerosol and precipitation chemistry measured at Tudor Hill, a site on the west coast of Bermuda, from 1989–1997 and from 2006–2009 as part of the same program as that in Barbados (AEROCE) and using the same protocols including sampling only when winds are over the ocean (Keene et al., 2014; Savoie et al., 2002). At the Bermuda site, the prevailing winds come from the west so that the sampling sector extends from 180° through west to 330°. Aerosol nitrate is constant at both sites. However, the nitrate annual mean in Bermuda is ∼ 1.05 µg m−3, roughly double the nitrate observed at Ragged Point (Keene et al., 2014; Savoie et al., 2002). Also, the decline in nss-sulfate observed in Bermuda, from ∼ 2.59 µg m−3 in 1989 to ∼ 1.63 µg m−3 in 2009, is greater than our observations at Ragged Point (Keene et al., 2014). Furthermore, sulfate aerosols in Bermuda decline over the entire record and do not exhibit the same reversal in the 2000s that we observe in Barbados. The differences in concentration and trend in nss-sulfate observed at Ragged Point compared to in Bermuda are not surprising given that the Bermuda site is located 1100 km from the east coast of the US and is more directly influenced by anthropogenic emissions compared to Barbados, which is more remote and could be influenced by a multitude of emission sources (Savoie et al., 2002). Also, the trend in nss-sulfate in Barbados differs from long-term observations measured at an IMPROVE site in the US Virgin Islands. Sulfate shows no trend from 2004–2021 (Hand et al., 2024). The difference in trend in nss-sulfate between Ragged Point and the IMPROVE site in the US Virgin Islands is likely due to more influence from the US and less influence from African emissions. Furthermore, the IMPROVE site does not follow a sector-controlled sampling protocol as the site in Barbados does.
To assess whether annual trends in nss-sulfate and nitrate observed in Barbados are associated with African aerosol transport conditions, annual average measured dust mass concentrations are also shown in Fig. 2 and show no appreciable increase or decrease from 1990–2011 (R2=0.06). Therefore, annual trends in nss-sulfate aerosols, which show a decrease from 1990–2000 and an increase from 2000–2011, are not correlated with African dust mass concentrations (R2=0.001). This suggests that the increase in nss-sulfate after the year 2000 is not due to an increase in sulfate associated with heterogeneous reactions between SO2(g) and dust or to more favorable transport from Africa. Nitrate aerosols, in contrast, are modestly correlated with dust (R2=0.30). Comparing seasonal nitrate and dust mass concentrations by year reveals tighter correlations between nitrate and dust for DJF and MAM (0.46 and 0.4, respectively; see Fig. S3). DJF and MAM are not the peak dust transport seasons to the Caribbean, but they are the seasons that favor co-transport of dust and biomass burning emissions from sub-Saharan Africa north of the Equator (Royer et al., 2023). Transport of African smoke to Barbados has been shown to be associated with elevated concentrations of nitrate, which likely explains the association between winter- and springtime dust and nitrate (Quinn et al., 2021; Savoie and Prospero, 1982).
3.1.1 Seasonal patterns in air mass trajectories and nitrate concentrations
HYSPLIT air mass back-trajectories reveal similar seasonal patterns each year with predominantly easterly transport to the site year-round (see Fig. S4, which shows 5 d air mass back-trajectory frequency plots for the entire 1990–2011 period and similar patterns year to year). As has been documented in prior work (Prospero et al., 2021), the dominant transport pathways are over the ocean and traverse the African continent. Some trajectories do intercept North America and come close to Europe, while few (< 10 %) air masses come near South America, which is outside of our sampling sector. Air masses typically take 5–7 d to be transported from northern Africa and longer than 7 d to intercept the EU and North America. According to Fig. S4, DJF has some trajectories that intercept North America and some from the northern part of the Atlantic Ocean toward Europe, MAM trajectories are easterly, JJA trajectories are from the west coast of Africa, and SON trajectories are from the east (with some from the southeast). We note that the directional tendencies of the trajectories did not noticeably change in 2000, when the concentration trends in nss-sulfate changed.
Figure 3 shows trends in nss-sulfate and nitrate during different seasons (e.g., DJF, MAM, JJA, and SON). Increases in nitrate in 2008 are driven by high nitrate concentrations in JJA and SON, with most of the increase in September, while high nitrate levels in 2010 are primarily observed during MAM. In 2010, a transition from El Niño to the strongest La Niña event on record occurred (Wolter and Timlin, 2011; Zhang et al., 2019), and long-range transport from Africa was anomalously high during the springtime as evidenced by high mass concentrations of dust in the spring of 2010 (Zuidema et al., 2019). Daily air mass back-trajectories passed more frequently over the African continent in MAM of 2010 compared to MAM of 2009 (26 vs. 6 d) (Fig. 4a and b), and nitrate levels exceeded 1 µg m−3 on over half of those days when trajectories traversed the northern African continent. Figure 4 focuses on trajectories initiated at 500 m height. If trajectories initiated at 1000 m are also included, then transport over the northern African continent occurs on 36 d in MAM of 2010; i.e., on 82 % of the days, nitrate levels exceeded 1 µg m−3. However, during the summertime peak (JJA) in African dust transport in 2010, nitrate does not show the same increase as dust despite frequent transport from northern Africa (see Fig. 4d). Furthermore, Fig. 4c and d compare daily and monthly mean concentrations of nitrate, dust, and non-sea-salt potassium (e.g., nss-K+), which is a marker for biomass burning emissions (Andreae and Merlet, 2001). Nitrate and nss-K+ clearly track each other and are both elevated in the spring of 2010. Although biomass burning peaks in December and January, while MAM is the tail end of the burning season in northern sub-Saharan Africa (Giglio et al., 2013; Roberts et al., 2009), the high nitrate loadings observed in spring 2010 are likely due to strongly favorable transport conditions that transported both dust and smoke to Barbados during this year.
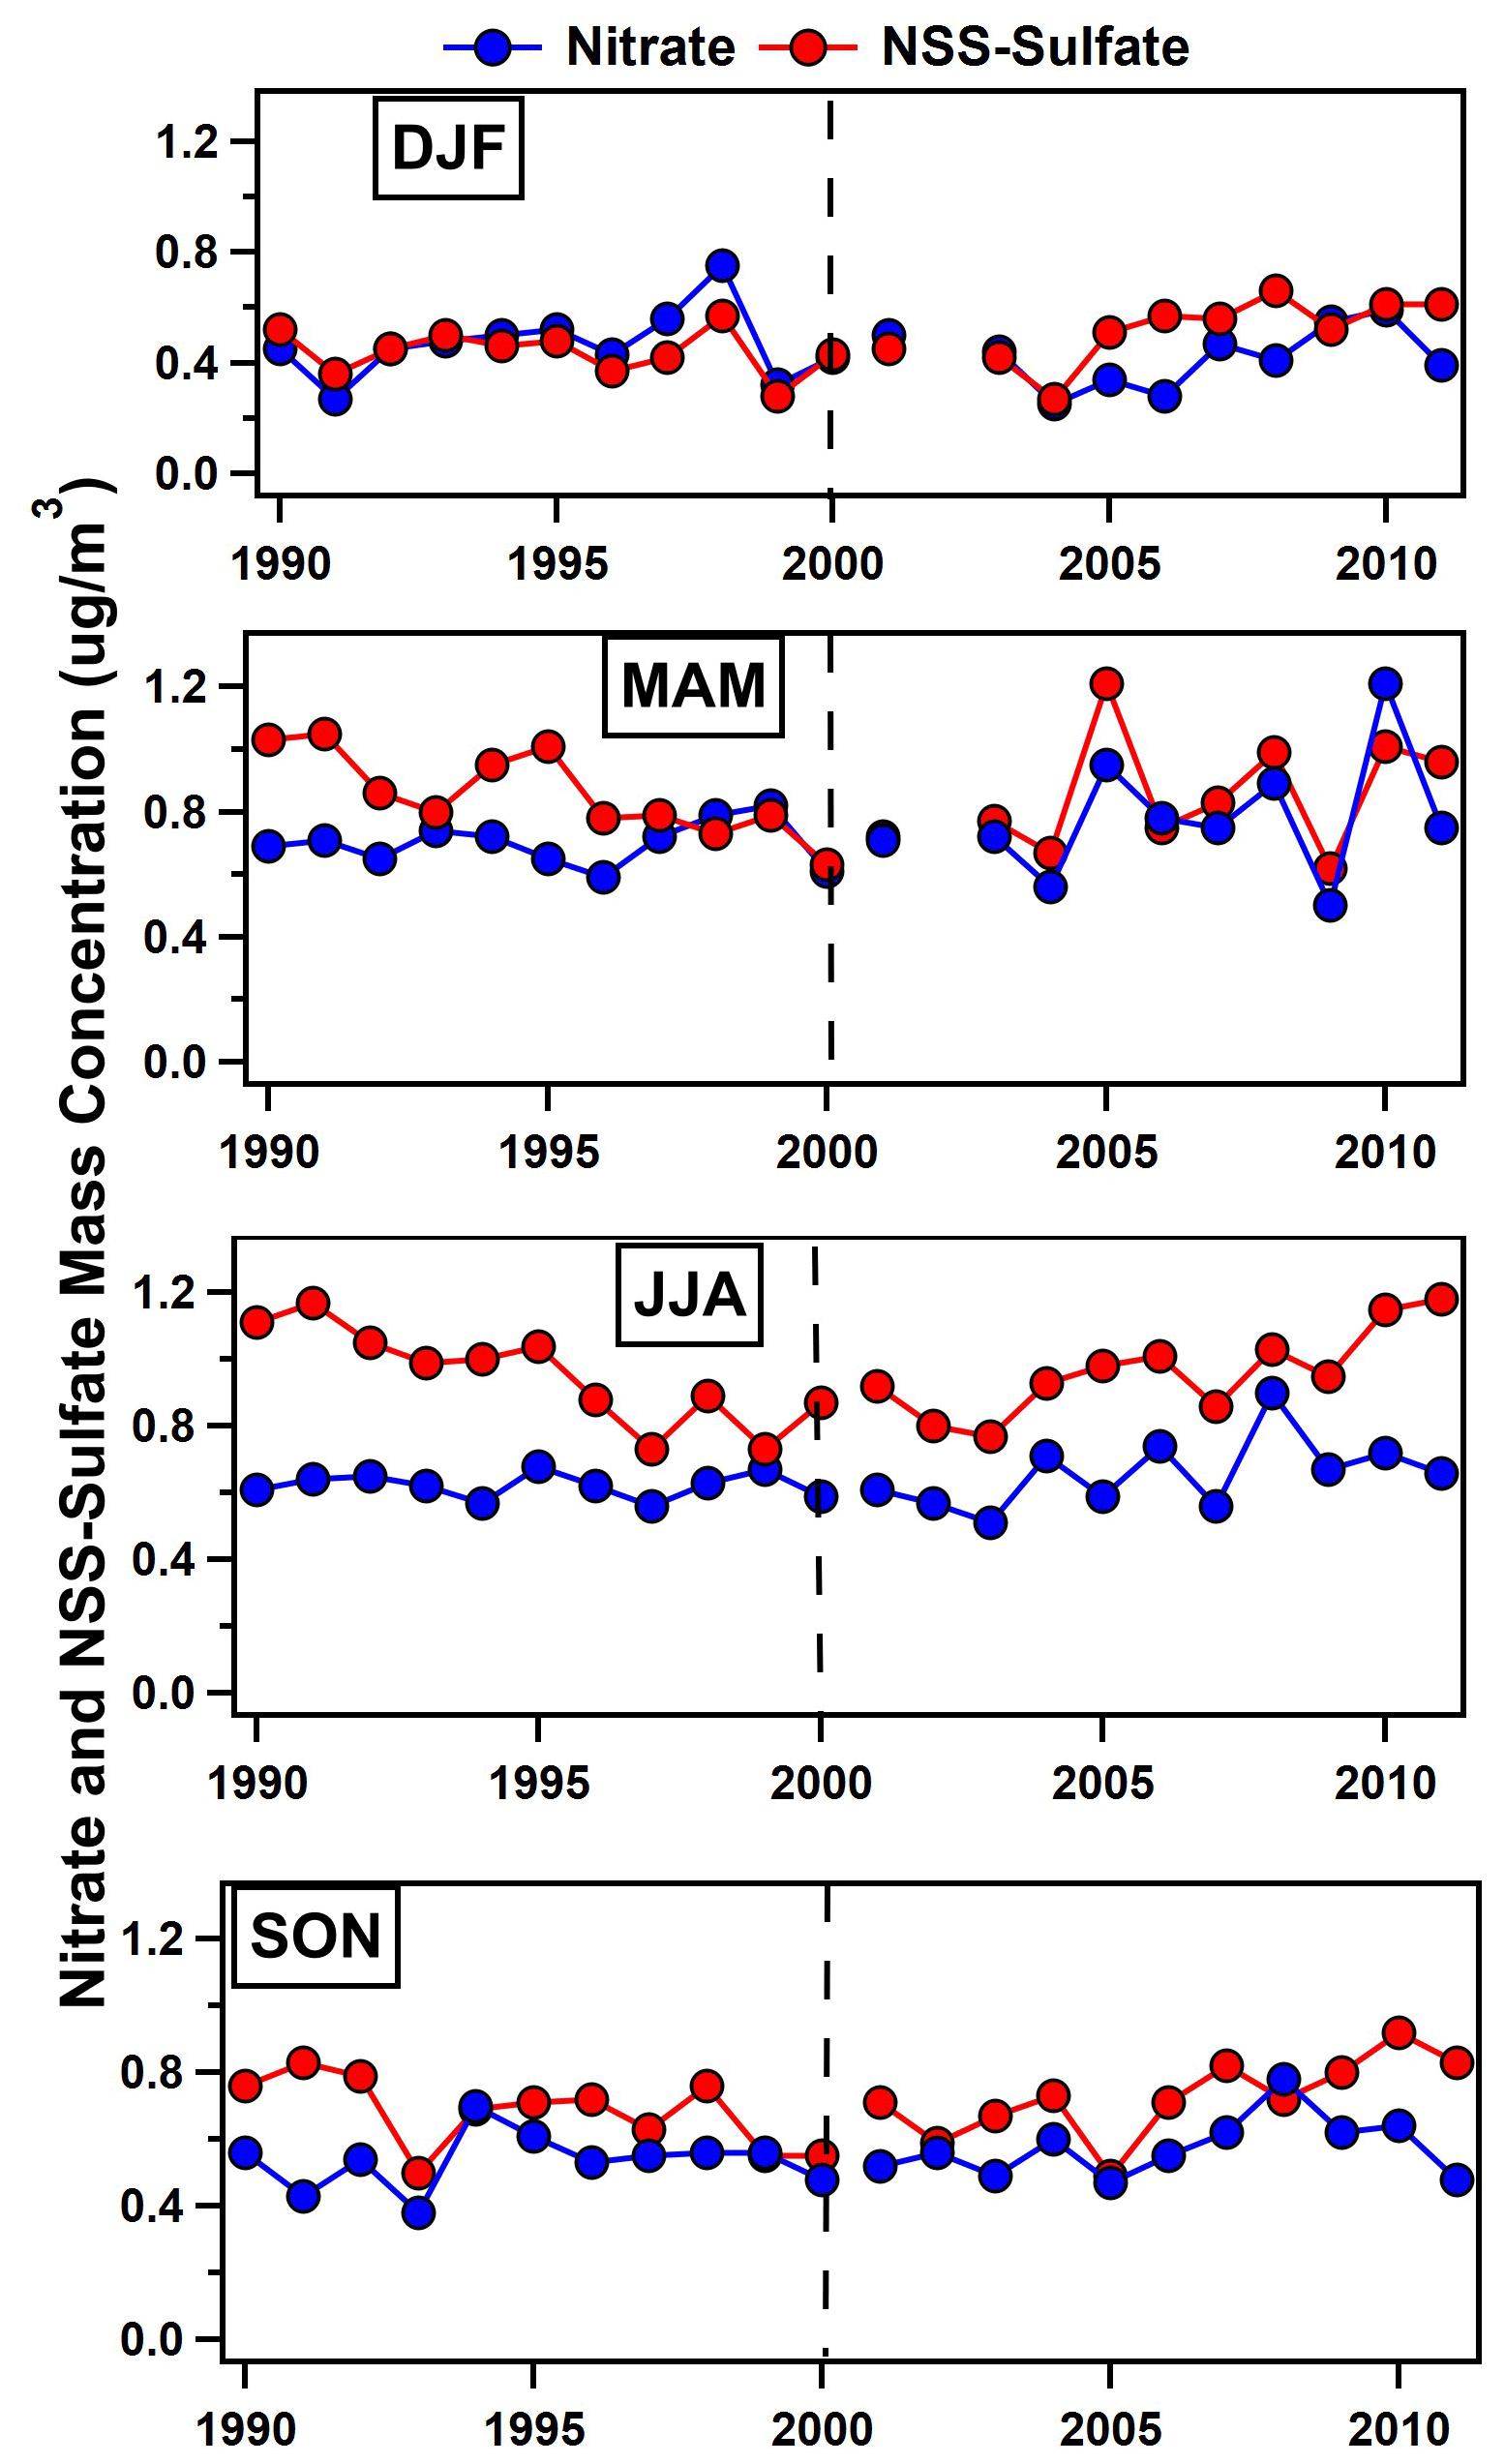
Figure 3Average concentrations of nitrate (blue markers) and nss-sulfate (red markers) for winter (DJF), spring (MAM), summer (JJA), and fall (SON). The vertical dashed black line denotes the year 2000 when nss-sulfate trends shifted from decreasing to increasing.
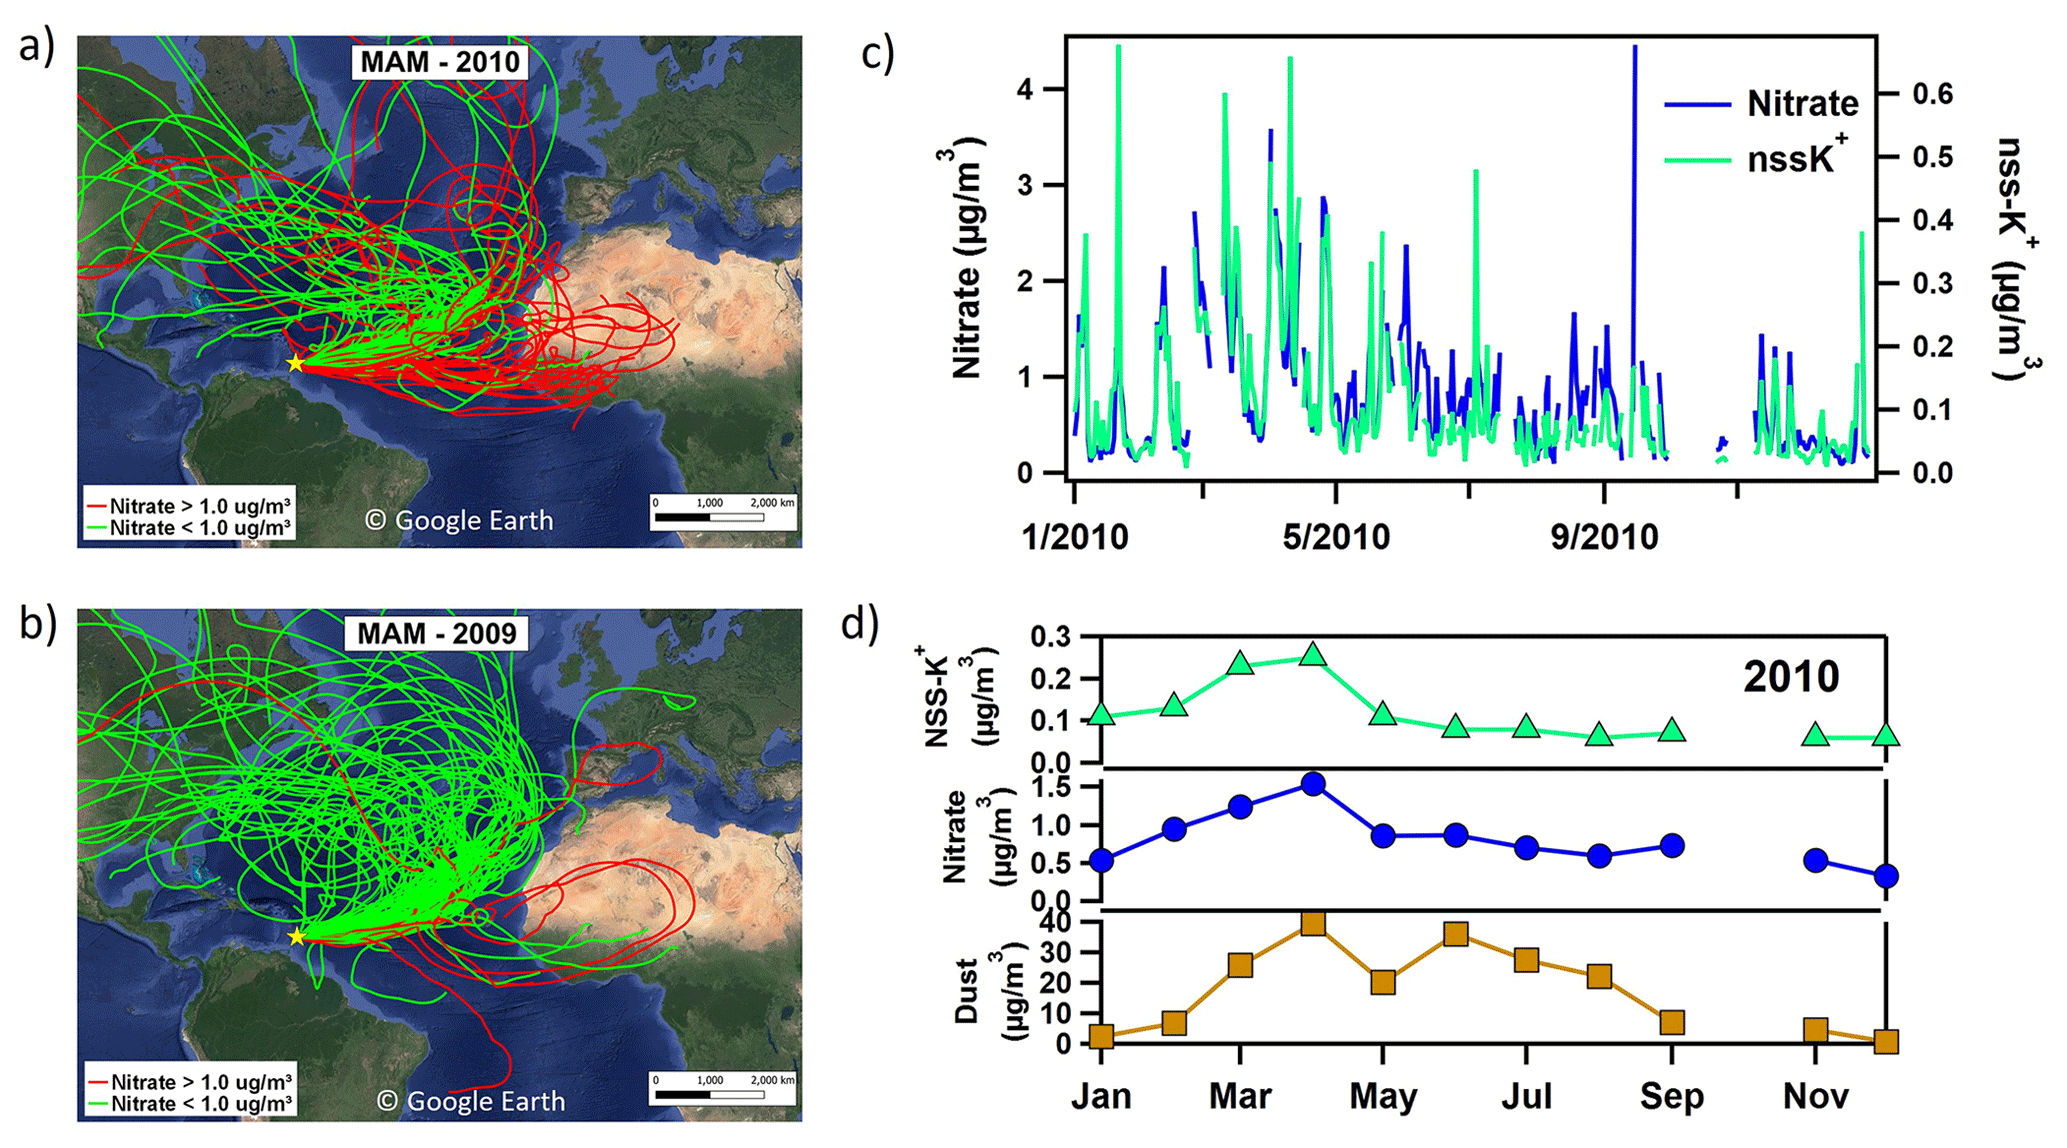
Figure 413 d air mass back-trajectories initiated at 500 m for MAM 2010 (a) and 2009 (b). Back-trajectories labeled in green are for days where nitrate concentrations measured at Ragged Point were < 1 µg m−3, while trajectories labeled in red had nitrate > 1 µg m−3. Maps are from Google Earth (©Google Earth). (c) Daily comparison of nitrate and non-sea-salt potassium (nss-K+), a biomass burning marker, shows a tight correlation (R2=0.62). (d) Monthly average concentrations of dust (brown), nitrate (blue), and nss-K+ (green) for 2010.
Similarly to 2010, air mass back-trajectories traversed the African continent on just 40 % of the days in JJA but 82 % of the days in September of 2008 with nitrate concentrations > 1 µg m−3 (Figs. S5 and 5a). If trajectories initiated at the 1000 m level are included, then African transport occurs on 64 % of the days in JJA with nitrate concentrations > 1 µg m−3, consistent with higher-level transport in JJA. In JJA, most of the air mass back-trajectories pass through Africa north of the Equator. However, in September, trajectories take a more southerly route, traversing near the South American coast and sub-Saharan Africa south of the Equator (Fig. 5a). Figure 5b shows trajectories for September but in 2009, when fewer trajectories take a southerly route and nitrate concentrations rarely exceed 1 µg m−3. September is during the peak of the burning season in sub-Saharan Africa south of the Equator and also dovetails with strong smoke transport over the Atlantic Ocean due to the increased intensity of the African easterly jet (Adams et al., 2012; Adebiyi and Zuidema, 2016; Zuidema et al., 2018). Air mass back-trajectories in September from sub-Saharan Africa south of the Equator to our measurement sites in Barbados and Cayenne have been linked with African smoke transport (Barkley et al., 2019; Trapp et al., 2010), further suggesting a link between elevated concentrations of nitrate measured in Barbados with transported African smoke. Biomass burning in the Amazon also peaks in SON (Adams et al., 2012) and could also explain some of the increase in nitrate in this season in 2008.
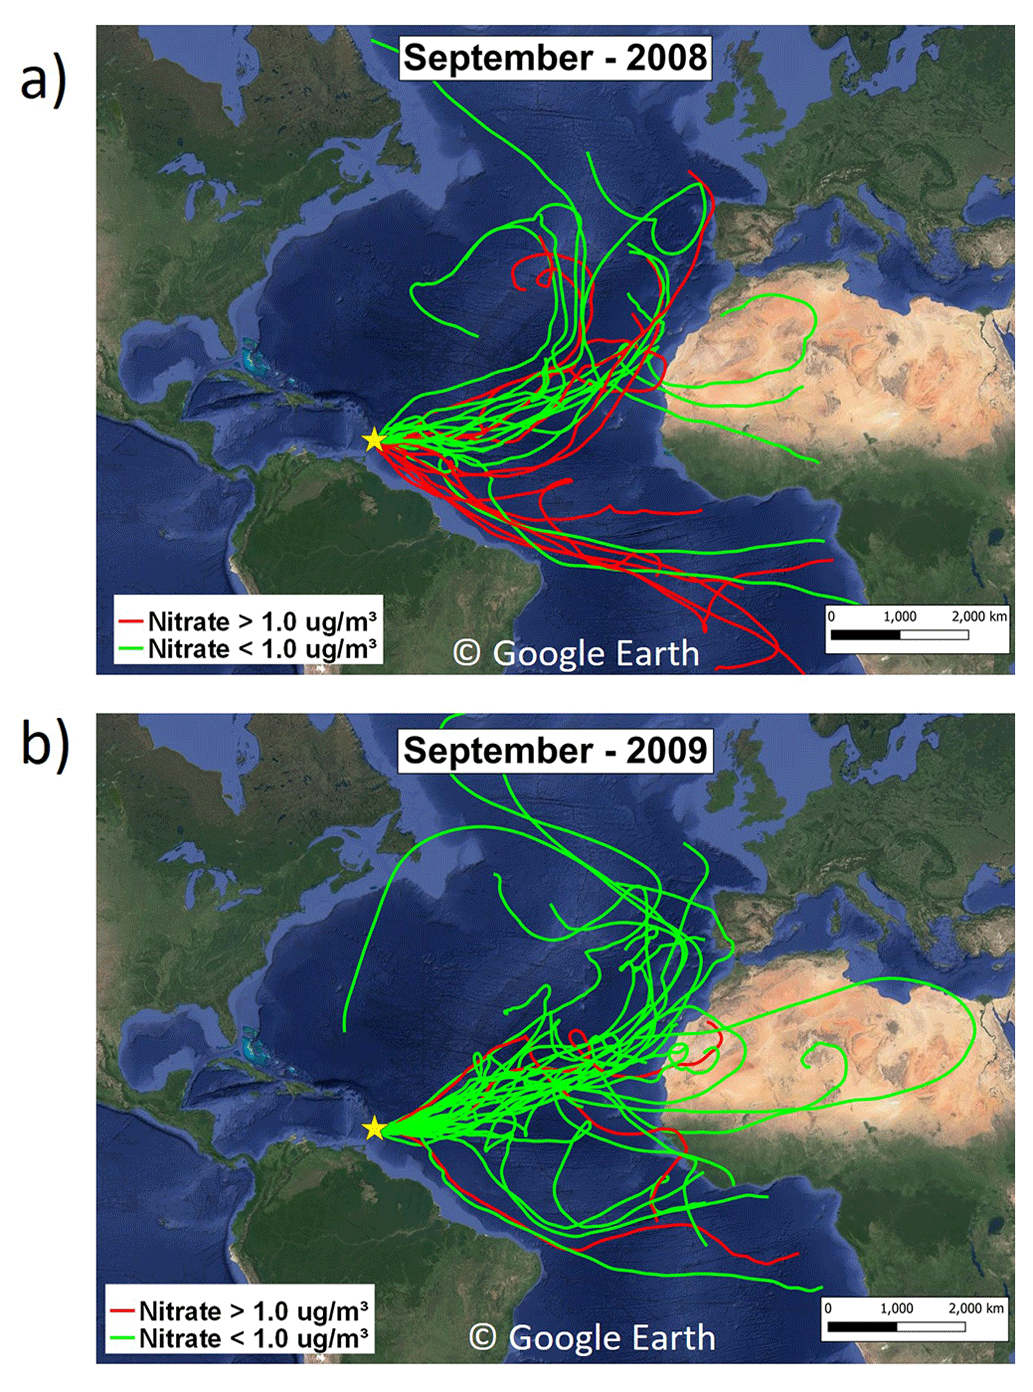
Figure 5Air mass back-trajectories of 13 d initiated at 500 m for September 2008 (a) and 2009 (b). Back-trajectories labeled in green are for days when nitrate concentrations measured at Ragged Point were < 1 µg m−3, while trajectories labeled in red had nitrate > 1 µg m−3. The maps are from Google Earth (©Google Earth).
3.1.2 Trends in non-sea-salt sulfate and emissions of SO2
Figure 3 reveals that the decrease in sulfate and subsequent increase are measured during most seasons. Table 1 further provides correlation coefficients and the rate of change in either nitrate or sulfate in µg m−3 yr−1 for data collected pre- and post-2000 when the trend in nss-sulfate changed. Pre-2000, nss-sulfate shows a consistent decline in each season, with the weakest decline in winter and the strongest reduction measured in JJA at −0.036 µg m−3 yr−1 (R2=0.72; Table 1). Post-2000, nss-sulfate increased during every season, with comparable increases in every season. In JJA, nss-sulfate increased at +0.028 µg m−3 yr−1 (R2=0.61; Table 1). In contrast, nitrate shows no trend (e.g., R2<0.2) in any season except a slight increase of +0.012 µg m−3 yr−1 post-2000 in JJA. Unlike nitrate, which showed intermittent spikes associated with increased biomass burning aerosol transport periods, the persistent increases in nss-sulfate observed during all seasons more likely reflect either increased emissions or more efficient oxidation of SO2.
Table 1Seasonal trends in nitrate and nss-sulfate shown pre- and post-2000. The rate of change in µg m−3 yr−1 is shown, and the correlation coefficient is also included. Values of R2<0.2 are denoted as having “no trend”. DJF represents winter, MAM represents spring, JJA represents summer, and SON represents fall.
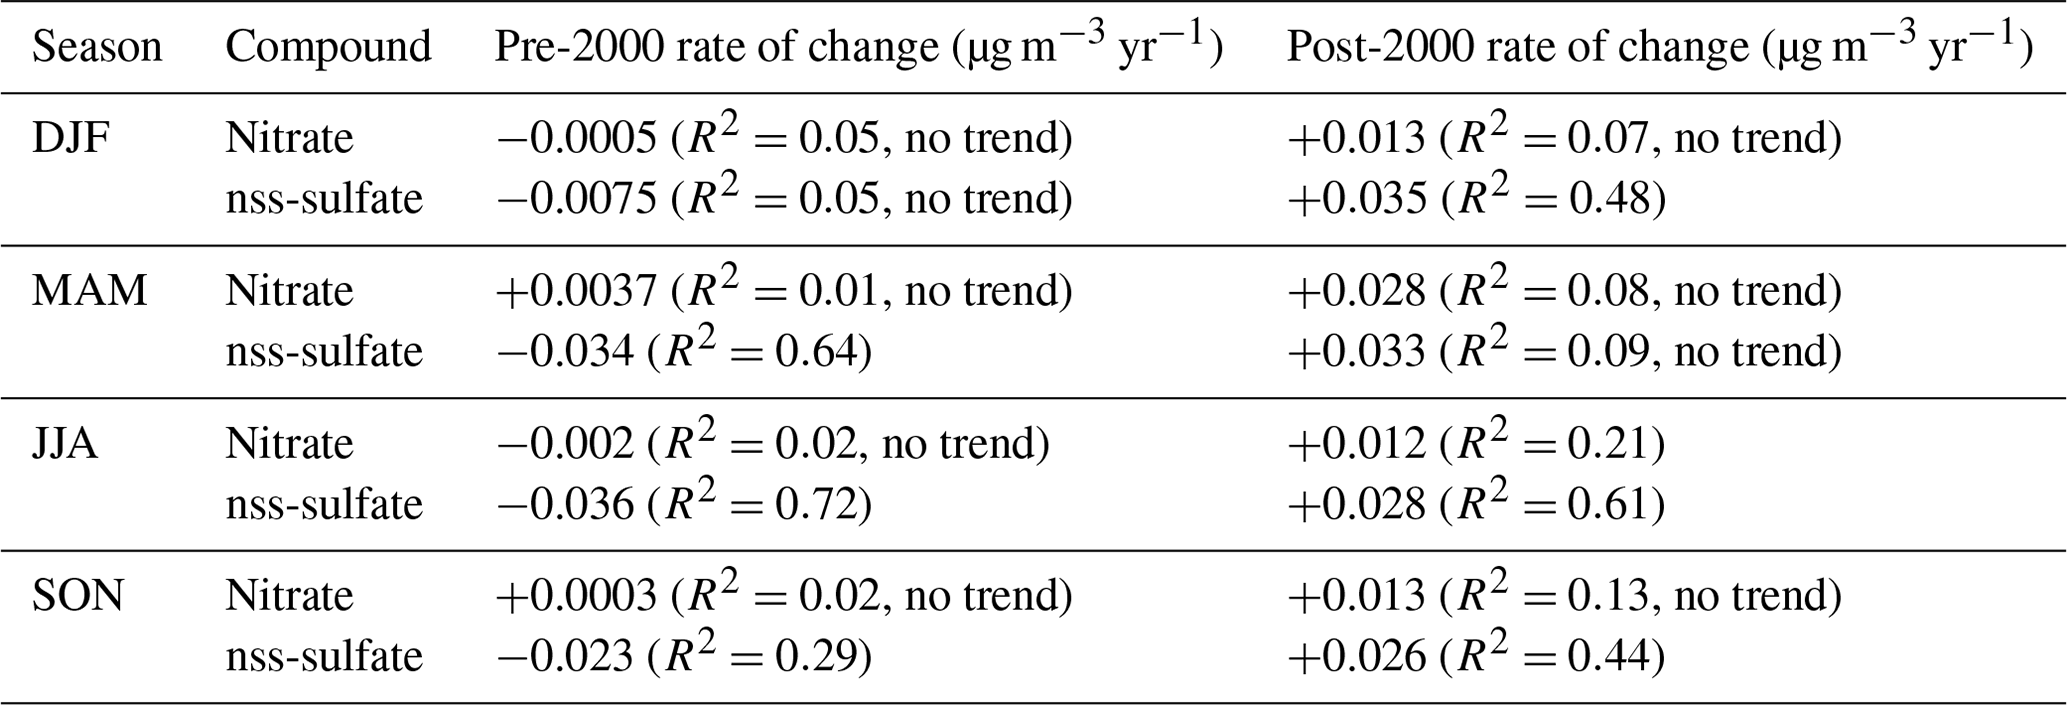
Figure 6 compares yearly trends in Ragged Point nss-sulfate along with SO2 emissions reported from the Community Emissions Data System (CEDS) (McDuffie et al., 2020). We focus on the most likely sources to impact Ragged Point: the US, the EU, and Africa. A similar figure comparing nitrate concentrations measured at Ragged Point and nitrogen dioxide (NO2) emissions from CEDS can be found in the Supplement (Fig. S6). Our near-constant nitrate mass concentrations do not match the decline in NO2 observed in the EU and US and the increase in NO2 in Africa. In contrast, decreases in nss-sulfate observed from 1990–2000 at Ragged Point closely follow the 32 % and 58 % reductions in SO2 emissions in the US and Europe, respectively (Fig. 6) (Aas et al., 2019; Hand et al., 2012; McDuffie et al., 2020; Rafaj et al., 2015; Yang et al., 2020). Our finding that changing SO2 emissions in the EU and US are reflected in our record at Ragged Point agrees with previous work examining both anthropogenic and biogenic sulfate (Savoie et al., 2002). Figure 6 also compares the trends of nss-sulfate observed at Ragged Point to increasing emissions of SO2 from Africa (McDuffie et al., 2020). Before 2000, SO2 emissions from Africa oscillated around 4.44±0.19 Tg S yr−1 but show no consistent trend (R2=0.027). However, after 2000, emissions of SO2 from Africa steadily increased by 37 % from 2000–2011 (4.33 Tg S yr−1 in 2000 and 5.95 Tg S yr−1 in 2011; R2=0.88). The rate of increase in SO2 is on par with the rate of increase in nss-sulfate of 29 % observed in Barbados, suggesting that anthropogenic emissions from Africa are affecting the nss-sulfate trends measured in Barbados.
We next utilized the CMAQ model results from EQUATES to gain further insight into the observed recovery of nss-sulfate (post-2000). We first note that EQUATES also predicts an increase in SO2 emissions from northern hemispheric Africa after 2002 (see Fig. S7). However, we use EQUATES to determine if other factors, such as changes in the oxidation efficiency of locally emitted SO2 and meteorological changes, affected our observations.
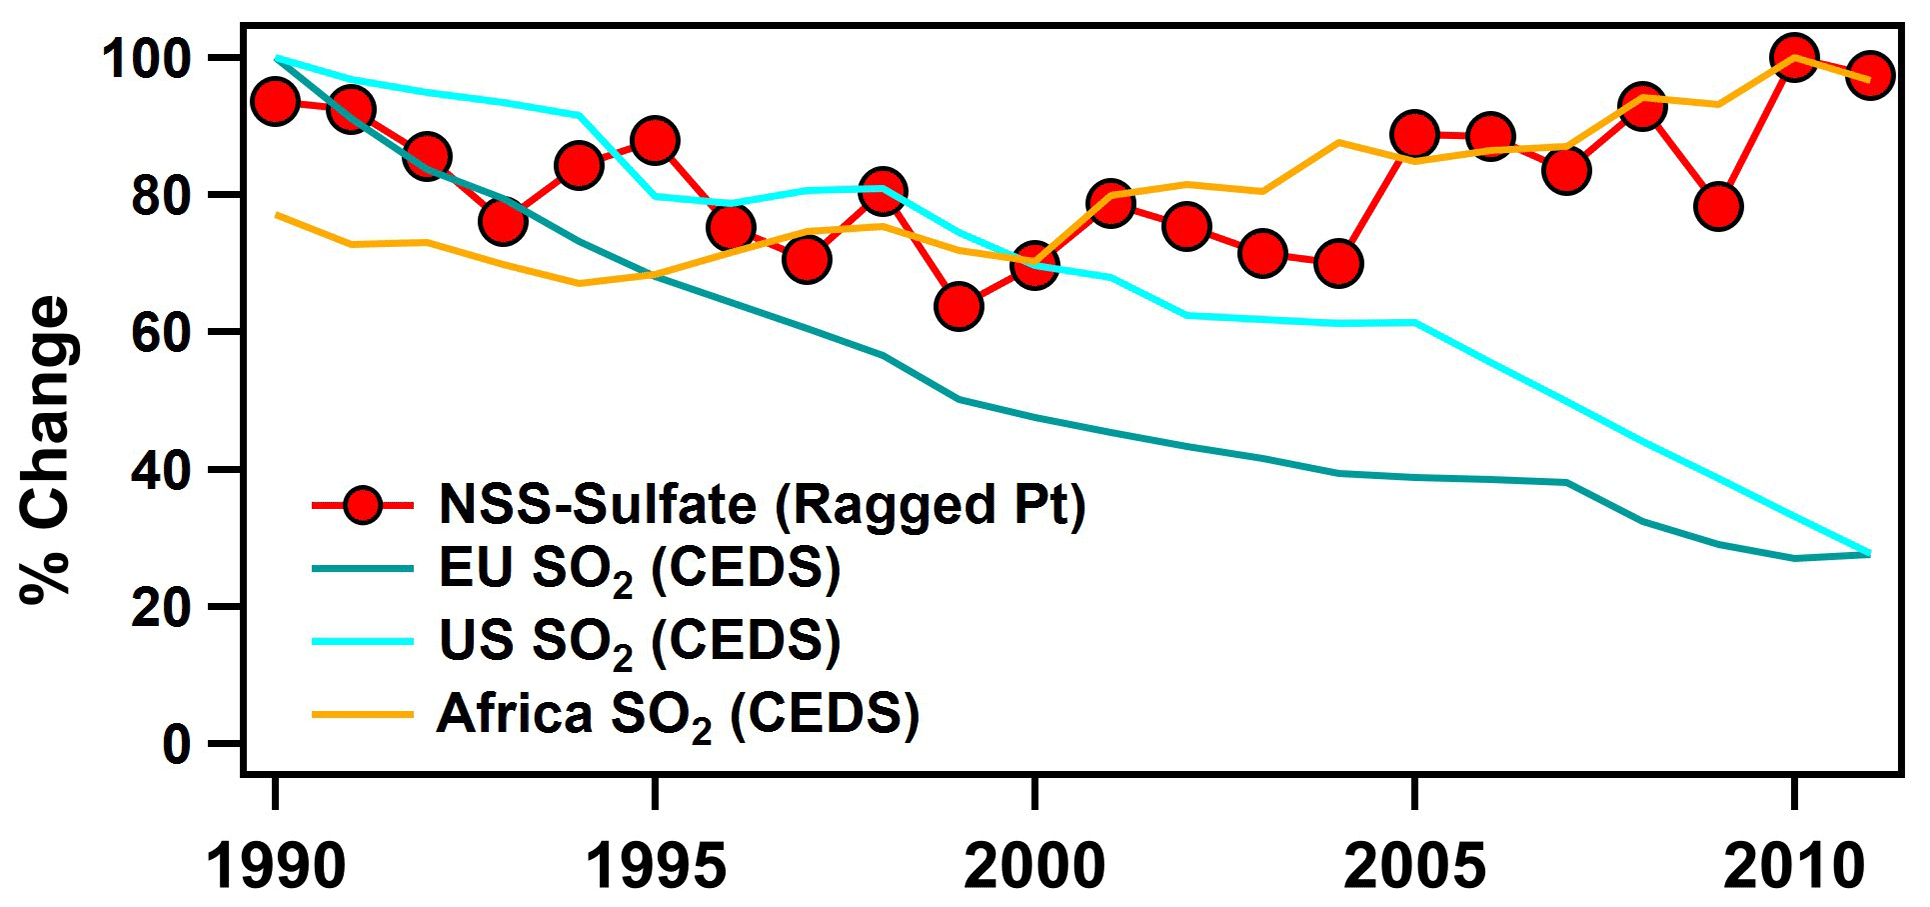
Figure 6Percent changes in nss-sulfate mass concentrations measured at Ragged Point from 1990–2011 are shown in red. nss-sulfate mass decreases from 0.87 µg m−3 in 1990 to 0.64 µg m−3 in 2000 and subsequently increases to 0.90 µg m−3 in 2011. The data are normalized to the maximum nss-sulfate mass concentration, 0.92 µg m−3, measured in 2010. The percent changes in emissions of sulfur dioxide (SO2) from the CEDS emissions inventory from McDuffie et al. (2020) are included for comparison. Decreasing emissions of SO2 from the US and EU are shown with blue lines. US SO2 reduces from 21.12 to 5.85 Tg S yr−1, and EU SO2 reduces from 28.06 to 7.74 Tg S yr−1. Percentages are calculated by normalizing to the maximum values in SO2 emissions observed in 1990 for both the US and EU. SO2 emissions from Africa increased from 4.13 to 5.95 Tg S yr−1; they are normalized to the maximum SO2 emissions observed in 2010 at 6.16 Tg S yr−1.
3.2 Comparison of measured and modeled trends of nitrate and sulfate aerosols
Monthly concentrations of simulated nss-sulfate and nitrate (for both the fine and coarse modes combined) were compared with mass concentrations measured on filters collected at Ragged Point (see Figs. 7 and 8, respectively). The model simulates similar concentrations at both Ragged Point and the area to the east of the site, implying that emissions in Barbados are minimal. EQUATES predicts nitrate concentrations in fine and coarse aerosol sizes. A greater proportion of fine nitrate is predicted in DJF (40 % of the total modeled nitrate) and MAM (26 % of the total modeled nitrate) during all years compared to JJA and SON (18 % of the total modeled nitrate for both seasons; see Fig. S8). This seasonality is likely due to increased contributions of nitrate from fine biomass burning aerosols produced in sub-Saharan Africa north of the Equator in winter and spring. This point is highlighted in MAM of 2010 when the amount of modeled fine nitrate was elevated (35 % of total modeled nitrate). nss-sulfate is predicted to be almost exclusively in fine-mode aerosols. While previous observations have shown that nss-sulfate dominates the fine mode in Barbados, some of the nss-sulfate is also present in the coarse mode likely due to heterogeneous reactions between SO2 and coarse sea spray and mineral dust aerosols (Adams et al., 2005; Alexander et al., 2005; Li-Jones and Prospero, 1998). EQUATES does not seem to capture this minor yet important budget of nss-sulfate.
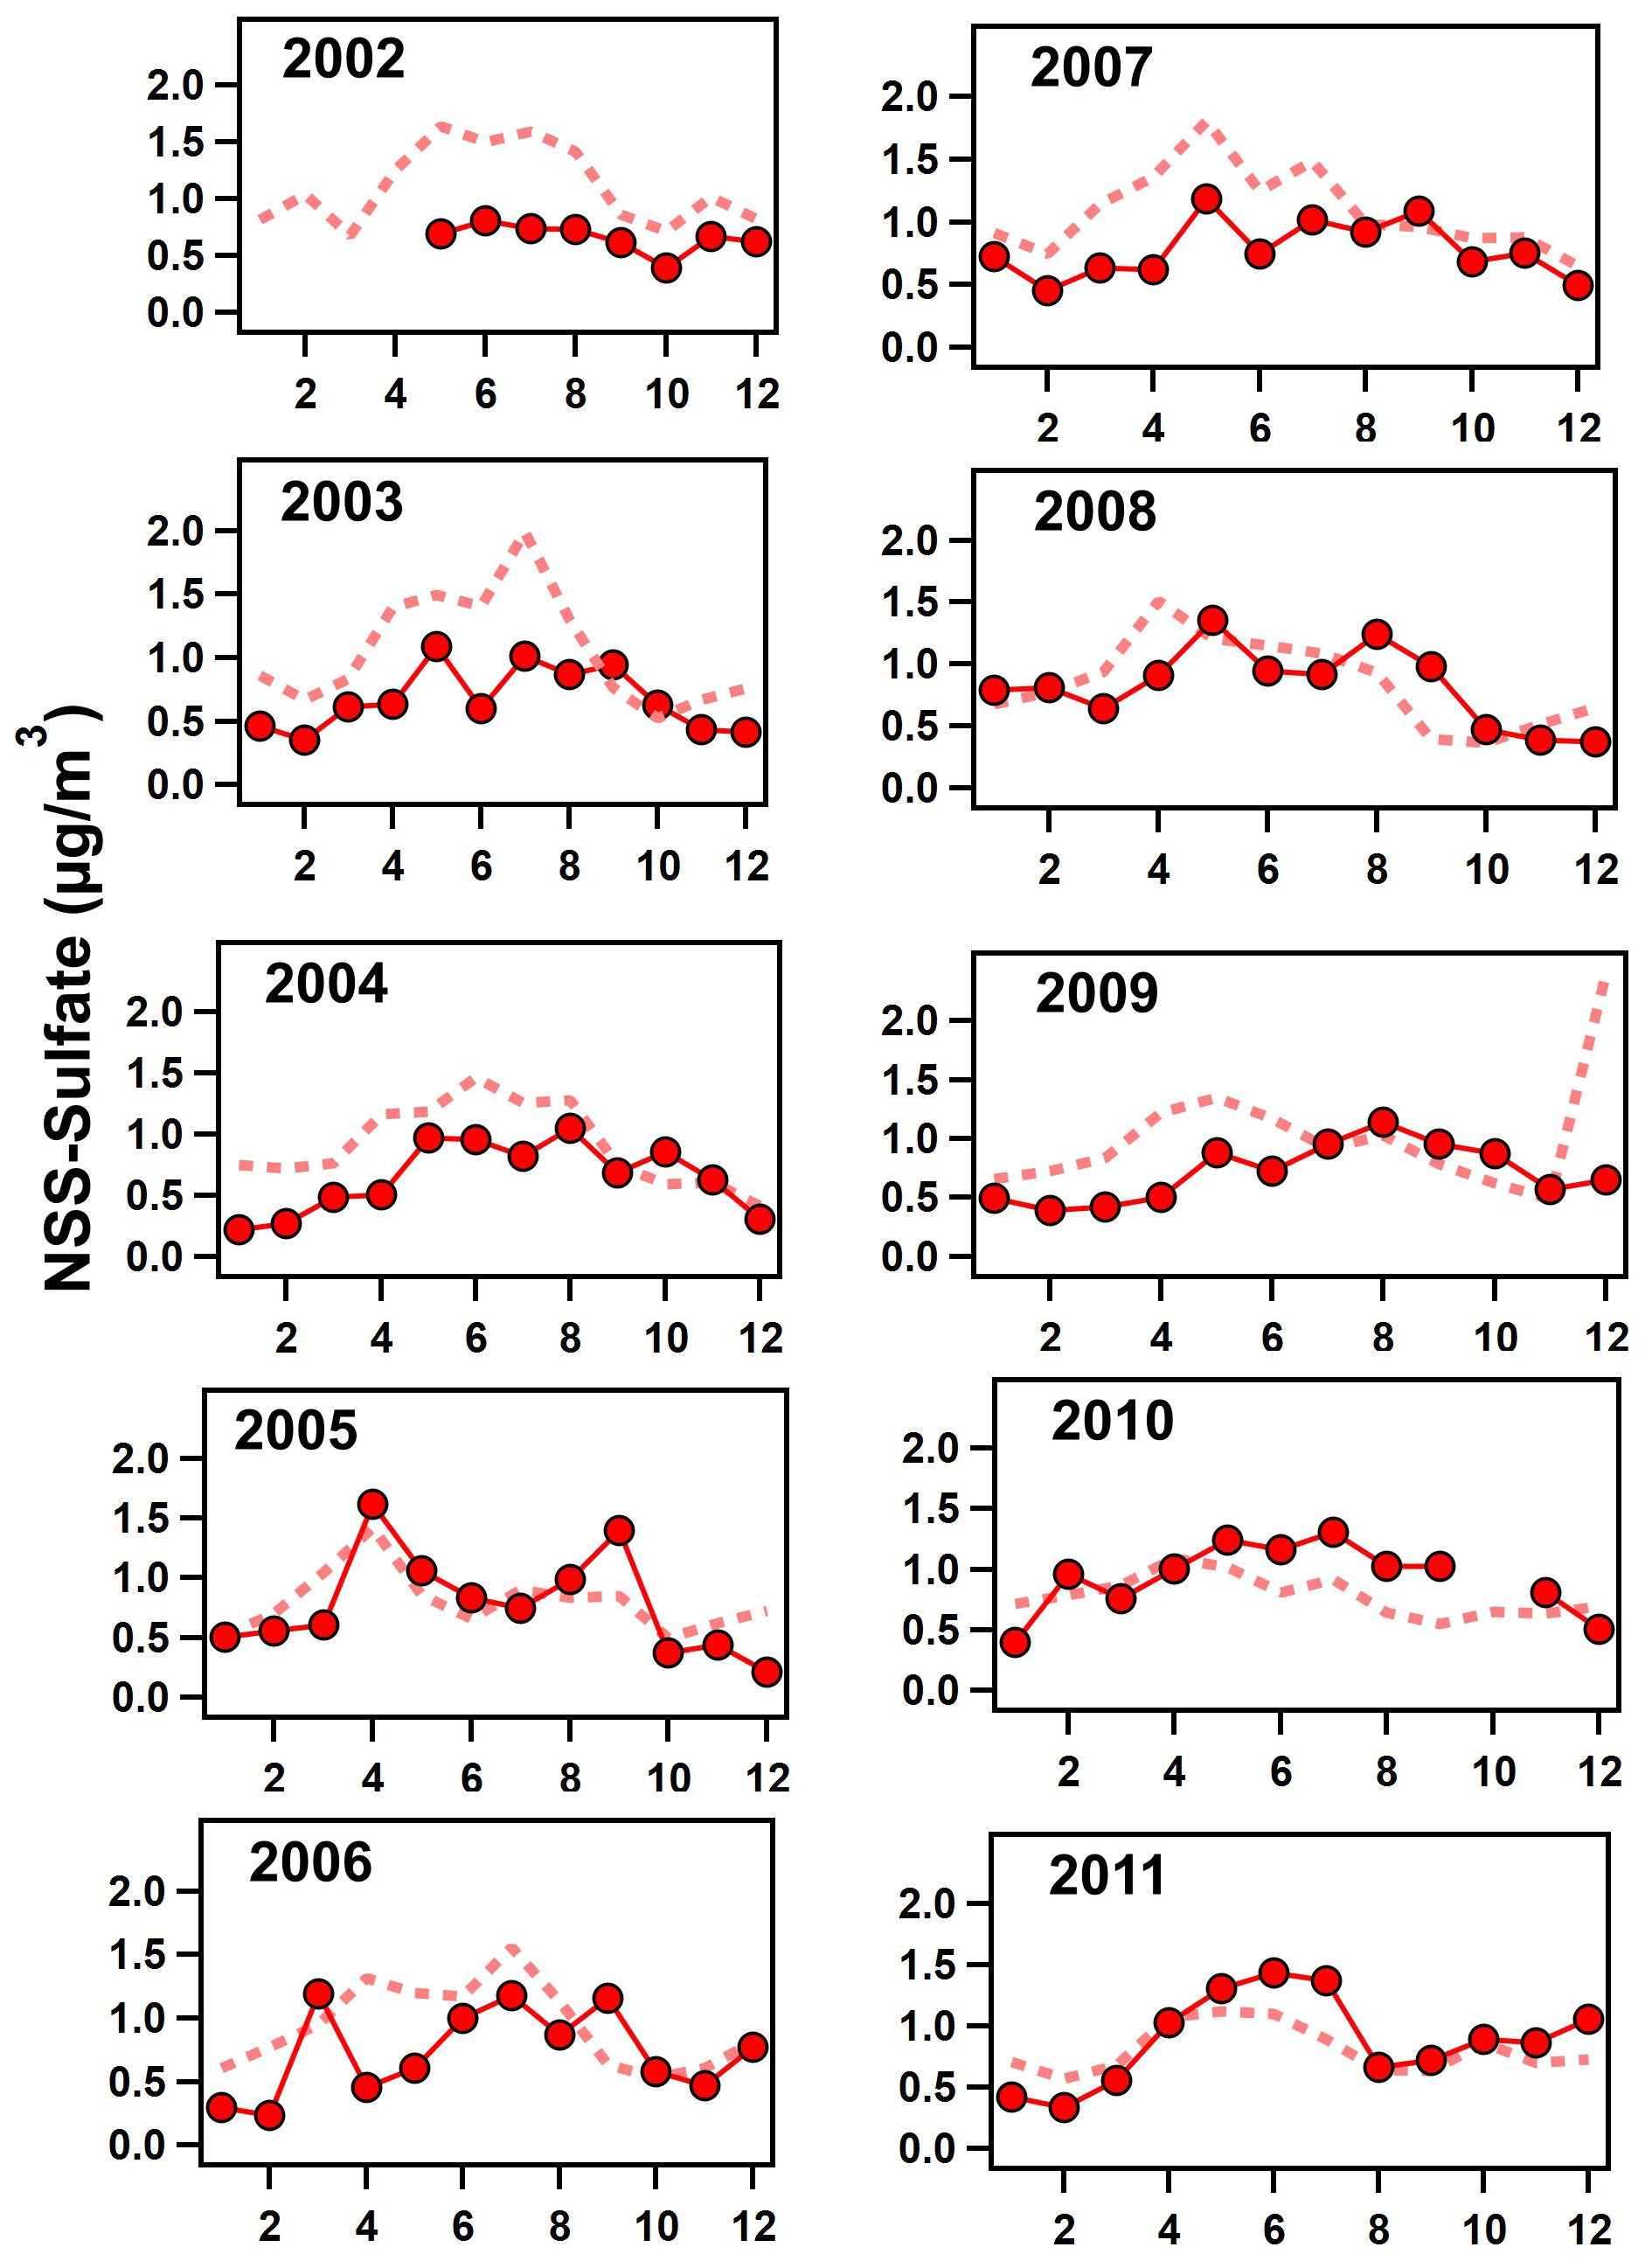
Figure 7Monthly averages of non-sea-salt sulfate (nss-sulfate) mass concentrations measured in Barbados on filters (solid red line with red circles) compared to monthly averages of nss-sulfate calculated from EQUATES model simulations of combined fine- and coarse-mode sodium (Na) and sulfate using Eq. (2) (dashed red line) for 2002–2011.
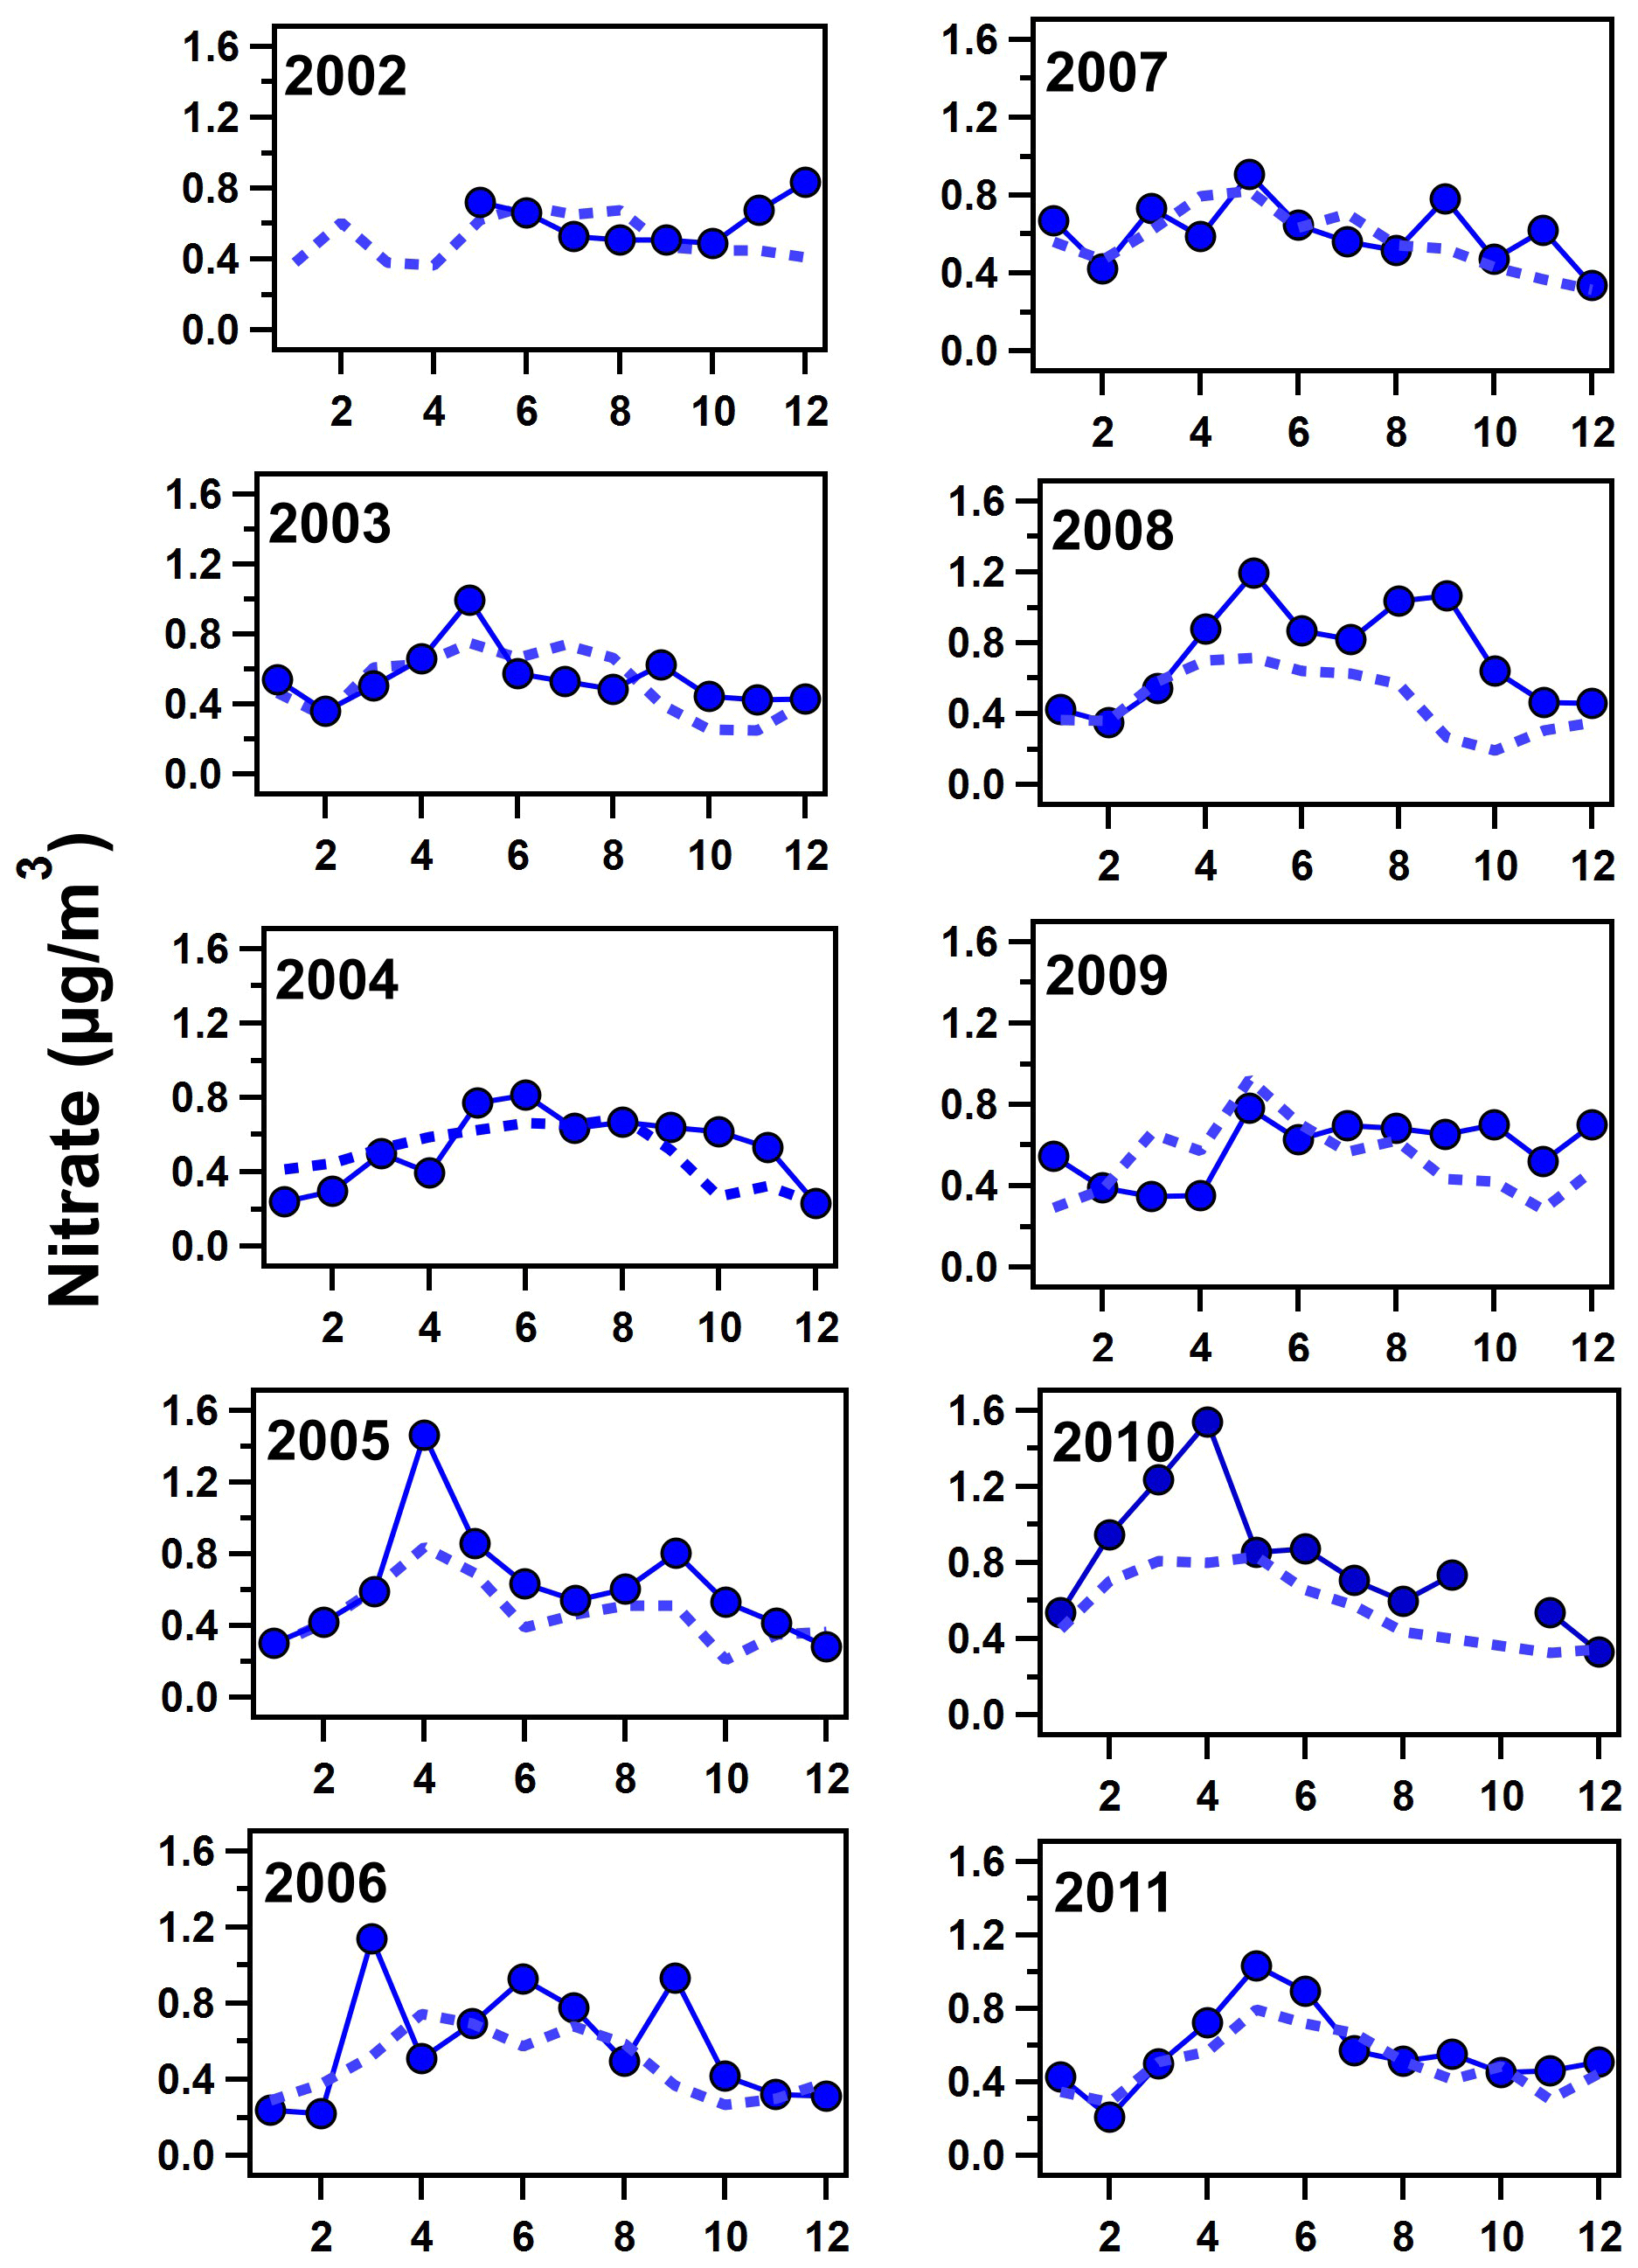
Figure 8Monthly averages of nitrate mass concentrations measured in Barbados on filters (solid blue line with blue circles) compared to monthly averages of combined fine- and coarse-mode nitrate calculated from EQUATES model simulations (dashed blue line) for 2002–2011.
To assess the performance of the model compared to our observations, we calculated the normalized mean bias (NMB) and Pearson correlation coefficient (r) for monthly averaged concentrations of nss-sulfate and nitrate (see Table S1; Boylan and Russell, 2006). Additional calculations of the mean bias (MB) and root-mean-square error (RMSE) can also be found in Table S1 of the Supplement. The NMB for nitrate was generally within ± 20 %, better than predictions of nitrate within the US (Kelly et al., 2019), except for 2005 (−24.18 %), 2008 (−35.06 %), and 2010 (−28.72 %), when the model underpredicted measurements likely due to the elevated African smoke transport events. The model overpredicts nss-sulfate in the earlier years (2002–2007) then converges closer to our measurements at Ragged Point after 2008, as shown in Fig. 7. Because trends in sea salt (e.g., sodium from EQUATES; Fig. S1) show a constantly high bias in all years, the overprediction of nss-sulfate reflects biases in sources of sulfate (other than sea spray) or biases in the conversion of SO2 to sulfate. Furthermore, the NMB for nss-sulfate also reflects the model overprediction of nss-sulfate, as high values are observed in 2002 (+81.45 %), then the model begins to fall within ± 20 % starting in 2008 (see Table S1). As such, trends in nss-sulfate simulated by EQUATES show a decrease over time rather than an increase post-2000 (see Fig. S9). The decrease in EQUATES simulations of nss-sulfate post-2000 compared to the increase observed in Barbados could be related to a changing bias over time. For example, recent predictions for 2019 indicate CMAQ underpredicts sulfate by about 50 % in the eastern US (45 % underestimation across the entire US) (Vannucci et al., 2024). Previous simulations for 2002 and 2016 indicated more modest normalized mean biases of 20 % or less (Appel et al., 2021; Sarwar et al., 2011). As a result, EQUATES may simulate a stronger decline in transported US sulfate over 2002–2019 than observations indicate. This overestimation of declining sulfate in the US may mask trends (including stronger increases in sulfate) in other regions. Pearson correlation coefficients range from −0.22 to 0.88 by year for nitrate with a mean of 0.54. The poorest correlation (−0.22) occurs for 2002 when Barbados filter measurements were unavailable from January until May. For nss-sulfate, r ranges from 0.23 to 0.82 by year with a mean of 0.59. The greatest variation between the model and measurements is for 2009 (see Fig. 7), which was also the year that had an erroneously high model concentration of sea spray aerosols in winter. Overall, the model captures both the magnitude of and the seasonal and interannual variation in nss-sulfate and nitrate at our remote location in the tropical North Atlantic.
3.2.1 Using EQUATES to determine contributions to aerosol sulfate
Figure 9 shows a decrease in SO2 simulated by EQUATES within the modeled grid space over Ragged Point and to the east of the site. Consistent with a predicted decrease in SO2 and the observed increase in nss-sulfate, the oxidation ratio of SO2 increases in the region near Barbados. We note that, because the lifetime of SO2 is predicted to be ∼ 20 h and as much as ∼ 40 h depending on the latitude of the source of SO2 and the season (Green et al., 2019; Lee et al., 2011), our oxidation ratio estimates here are most relevant for local emissions, including sulfur emitted from marine phytoplankton (e.g., DMS). However, prior measurements in Bermuda suggest a longer lifetime for long-range-transported SO2 compared to local oceanic emissions from DMS, which are subject to strong condensational losses to sea spray in the marine boundary layer (Keene et al., 2014). As such, long-range-transported sources from Africa, the US, and the EU were likely converted to sulfate upwind of Barbados, and SO2 concentrations shown here most likely reflect oceanic sources with some contribution from long-range transport. Locally emitted hydrogen peroxide (H2O2) concentrations also increased over this period (see Fig. 10) and are likely linked to decreases in locally emitted SO2, which is a major sink of H2O2 during the aqueous-phase formation of sulfate (Manktelow et al., 2007). We note that the predicted oxidation ratios are likely an overestimation because EQUATES overpredicts nss-sulfate compared to observations, and the overprediction decreases with time. As such, the increase in the oxidation ratio (Fig. 9), which is small, likely has minimal influence on the trends in nss-sulfate observed at our site.
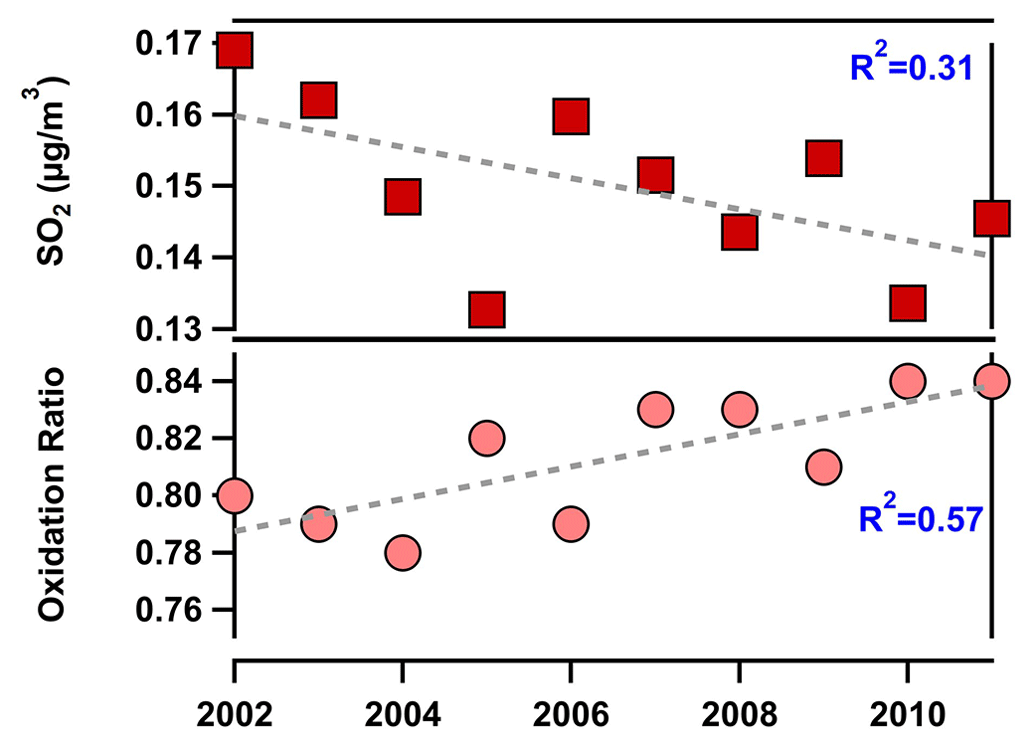
Figure 9Annual trends in locally emitted sulfur dioxide (SO2) simulated by the EQUATES model and the calculated oxidation ratio at Ragged Point. Linear fits and corresponding correlation coefficients are also shown.
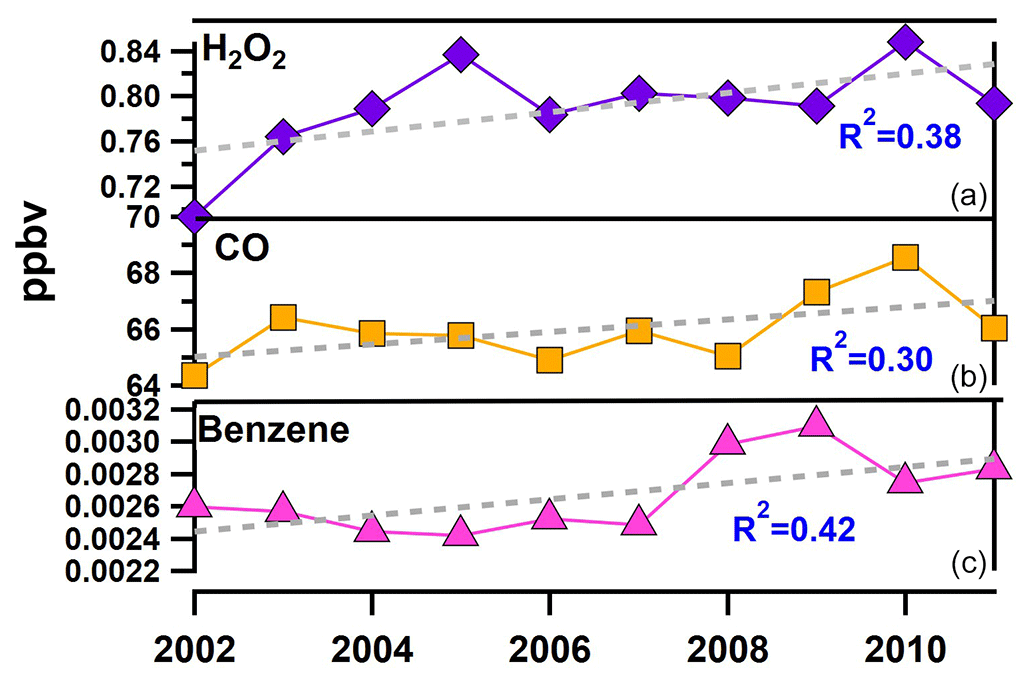
Figure 10Annual trends in select gas-phase species including (a) hydrogen peroxide (H2O2) (purple line), (b) carbon monoxide (CO) (orange line), and (c) benzene (pink line) simulated by the EQUATES model at Ragged Point. Linear fits and corresponding correlation coefficients are also shown.
Changes in biomass burning, anthropogenic emissions, oxidant concentrations, and meteorological parameters were also investigated using EQUATES. Fine-mode non-sea-salt potassium (nss-K+) was used as our tracer for smoke emissions. We used EQUATES data rather than our nss-K+ observations, which were non-existent for most years from 2002–2011. Also, our measurements included total (i.e., fine- and coarse-mode) nss-K+, including contributions from African dust (Savoie and Prospero, 1980). EQUATES simulations of nss-K+ were a factor of 2–3 higher than our measurements except for the dust and smoke transport event that occurred in MAM of 2010. No significant increase in simulated nss-K+ was estimated (Fig. S10). Meteorological parameters (temperature, relative humidity (RH), wind speed, and wind direction) were constant over time, showing no shift in rainfall, winds, temperature, or RH (Fig. S10). Concentrations of the hydroxyl radical (•OH) did not show a significant change from 2002–2011 (Fig. S10). EQUATES concentrations of benzene (a tracer for fossil fuel combustion) and carbon monoxide (CO; a tracer for combustion from fossil fuels and biomass burning) both increased modestly from 2002–2011 (Fig. 10). Our results suggest that an increase in the oxidation efficiency of locally emitted SO2 to sulfate may contribute to the increase in nss-sulfate post-2000, but the contribution is likely small compared to long-range-transported sulfate.
Our 21-year record (1990–2011) of nitrate and nss-sulfate aerosols shows two distinct trends over the tropical North Atlantic. Nitrate shows no significant change other than two spikes in JJA and September of 2008 and MAM of 2010. Variations in winter- and springtime dust transport explained interannual oscillations in nitrate concentrations, while increased transport of smoke from sub-Saharan Africa north of the Equator in MAM 2010 and from south of the Equator, and possibly South America, in September 2008 caused the increased levels of nitrate observed in those years. Nitrate has been shown to be enhanced in smoke by up to 5-fold over background due to high emissions of NOx that are rapidly converted to nitrate (Adon et al., 2010; Hickman et al., 2021; Perron et al., 2022; Schlosser et al., 2017). Notably, nitrate was not enhanced in JJA of 2010 even though high quantities of dust were transported to Barbados. We speculate that the lack of enhanced nitrate during the summer of 2010 is due to the lack of nitrate contribution from African smoke emissions during this season. This finding, in addition to our observations of enhanced nitrate associated with dust in DJF and MAM, suggests that the nitrate associated with African aerosol transport primarily originates from NOx emissions from African wildfires that are rapidly converted to nitrate prior to transport.
In contrast to the relatively flat trend in aerosol nitrate, nss-sulfate decreased by 30 % from 1990–2000 then increased from 2000–2011, increasing to concentrations measured in the early 1990s. Reductions in nss-sulfate observed in Barbados are most likely due to decreased emissions of SO2 in the US and EU due to clean air policies implemented via technologies such as flue-gas desulfurization devices installed in power plants (Aas et al., 2019; Kharol et al., 2017; Smith et al., 2011). Thus, our results highlight that regulations aimed to improve national and regional air quality also impact more distant locations such as the remote North Atlantic marine boundary layer and the Caribbean.
As shown in Fig. 6, increases in SO2 in Africa, namely from anthropogenic sources, are the most probable cause for the increase in nss-sulfate levels from 2000–2011 in Barbados. Simulations from both CEDS and EQUATES reveal an increase in anthropogenic emissions of SO2. Further evidence for this speculation stems from the lack of change in air mass back-trajectories before and after 2000, suggesting that emissions rather than meteorological trends are driving our observed patterns in nss-sulfate. Industrial contributions of sulfate from oil refineries, coal-fired power plants, and fertilizer plants along the north and northwestern coast of Africa were also observed in Cabo Verde (Salvador et al., 2015). Anthropogenic sources of SO2 in Africa include emissions from electricity generation, diesel combustion and transportation (Assamoi and Liousse, 2010; Keita et al., 2021; Liousse et al., 2014), refineries, gas flaring, and smelting (Doumbia et al., 2019; Osuji and Avwiri, 2005). Levels of pollution in African cities are on par with Asian megacities, with the largest rate of increases in SO2 observed in western Africa (Adon et al., 2016; Hopkins et al., 2009; Liousse et al., 2014; Val et al., 2013). The industrial sector in the Highveld region of South Africa also shows some of the highest increases in SO2, with observed increases starting in 1980 due to an increase in the number of coal-fired power plants arising from an increased demand for electricity (Keita et al., 2021; Liousse et al., 2014; Shikwambana et al., 2020). From 1990–2011, the CEDS inventory shows the largest increase in SO2 emissions in Africa starting in 2000, coincident with the increase in nss-sulfate observed at our site (see Fig. 6). The emissions inventory for Africa is also likely underestimated due to a lack of measurements (McDuffie et al., 2020). Therefore, we speculate that anthropogenic SO2 emissions are likely higher than shown in the CEDS model and are driving the observed increases in nss-sulfate in Barbados.
In addition to sources of SO2 within Africa, SO2 emissions from other nearby countries and regions have been shown to be exported to Africa (Koch et al., 2007). In particular, SO2 emissions in India have rapidly risen and overtaken China as the largest emitter of SO2 (Li et al., 2017), while remote-sensing observations have highlighted that SO2 emitted from oil and gas operations in the Persian Gulf have been greatly underestimated in emissions inventories (McLinden et al., 2016). While it is possible that these two regions may also contribute to the increase in nss-sulfate observed at our measurement site, we can only speculate on their importance to the remote North Atlantic marine boundary layer.
While some of the increases in nss-sulfate after 2000 could be due, in part, to marine biogenic, shipping, biomass burning, and volcanic emissions, their contributions are likely not the dominant cause of the observed trends. Marine biogenic sulfate is estimated to contribute up to 50 % of nss-sulfate at Ragged Point during non-dust transport conditions (Li-Jones and Prospero, 1998; Royer et al., 2023; Savoie et al., 2002). However, our predictions of nss-sulfate and SO2 concentrations with EQUATES include DMS chemistry that does not explain our observed trends. In fact, locally emitted SO2, most likely from the ocean, is simulated to decrease from 2002–2011. Furthermore, while recent studies have shown links between climate change and increased DMS emissions at high latitudes, these trends have not been demonstrated at lower latitudes. Instead, DMS is predicted to decrease with increasing temperature at low latitudes due to stratification (Kloster et al., 2007) and increasing ocean acidification (Zhao et al., 2024), while a recent modeling study, factoring in changes in phytoplankton dynamics, found that DMS emissions have not appreciably changed from the preindustrial period to the present day (Wang et al., 2018). As such, DMS emissions do contribute to the sulfate burden but likely do not explain the recent increases in sulfate, which would also agree with findings in Bermuda where changes in the nss-sulfate burden were explained by anthropogenic rather than biogenic emissions (Keene et al., 2014). Shipping emissions likely do not explain our trends in nss-sulfate because Barbados is somewhat isolated from proximal shipping impacts – heavy shipping is concentrated in the Caribbean west of Barbados and along the north coast of South America (Czermański et al., 2021). Biomass burning has declined in northern sub-Saharan Africa starting in the early 2000s (Andela et al., 2017; Andela and Van Der Werf, 2014; Zubkova et al., 2019). Furthermore, increased nss-sulfate has been observed year-round rather than just during the main burning seasons, suggesting that this source alone is likely not responsible for the major increases in nss-sulfate observed at our site. The largest natural source of SO2 in Africa is volcanic emissions from Mount Nyiragongo in the Goma region of the Democratic Republic of Congo, which has been shown to impact sulfate aerosols at the Amazon Tall Tower Observatory (ATTO) in Brazil (Opio et al., 2021; Saturno et al., 2018). Volcanic emissions likely do impact nss-sulfate measured in Barbados, but there is no evidence that emissions from this source are increasing. These lines of evidence further support an anthropogenic source as the cause of the increase in nss-sulfate observed in Barbados.
In addition to increased sulfate transported from Africa, the oxidation ratio was simulated to increase from 2002–2011, which would more efficiently convert locally emitted SO2 to sulfate and may represent a minor addition to the budget of nss-sulfate. Furthermore, concentrations of H2O2 increased in the post-2000 period, indicating a potential increase in the efficiency of aqueous-phase oxidation. We would expect that, even if the total burden of SO2 has been reduced globally (McDuffie et al., 2020; Smith et al., 2011), SO2 emitted locally is more efficiently converted to sulfate due to the greater availability of oxidants at lower latitudes (Manktelow et al., 2007). It is important to note, however, that the oxidation ratio calculated is most appropriate for accounting for changing oxidation efficiencies of SO2 and sulfate formation near the site, and the oxidation ratio does not account for changes in the oxidation efficiency of already-formed sulfate aerosols that have been transported to the site. For example, SO2 emitted from Africa is likely already oxidized to sulfate prior to being transported to our site.
One question that persists is why nitrate did not increase from 2000–2011 alongside the increase in nss-sulfate. One possible explanation is a combination of reduced NOx from smoke concurrent with increased dust and smoke transport that offset any changes in nitrate other than the observed spikes in 2008 and 2010. In the 2000s, biomass burning emissions declined in northern equatorial Africa due to a combination of increased precipitation in DJF associated with a shift from more frequent El Niño events in the 1990s to more frequent La Niña events in the 2000s and land use practices converting tropical savanna to cropland (Andela et al., 2017; Andela and Van Der Werf, 2014; Hickman et al., 2021; Zubkova et al., 2019). The recently updated Barbados dust record highlights that dust is being transported to the Caribbean earlier in the year and arriving more frequently in spring (Zuidema et al., 2019), which would increase the transport of biomass burning emissions and associated nitrate to the Caribbean and remote North Atlantic, which may effectively cancel out the impact of reduced smoke emissions.
The Ragged Point site in Barbados has historically been associated with research on African dust transport (Prospero et al., 2021). However, this work highlights that the site is also an excellent indicator of long-term and large-scale changes in emissions and the impact of air quality policies or the lack of them or poor compliance to them. Looking forward, building upon the existing time series of nitrate and sulfate aerosols while also expanding the measurement capabilities at Ragged Point to incorporate measurements of metals will increase our ability to apportion aerosol sources. Further, measurements of carbonaceous aerosols will provide needed insight into the impact of anthropogenic and biomass burning on sulfate and nitrate burdens over the remote North Atlantic that complements recent work performed in the South Atlantic (Zuidema et al., 2016, 2018).
Measured nitrate, nss-sulfate, and sea salt concentrations can be found in the University of Miami's repository in addition to EQUATES simulations of nitrate, nss-sulfate, sea salt, gaseous tracers (SO2, benzene, CO, and H2O2), and meteorological parameters (https://doi.org/10.17604/k869-9c71; Gaston et al., 2024). Dust mass concentrations from Barbados can be found at https://doi.org/10.17604/q3vf-8m31 (Zuidema, 2019). EQUATES data are available via the Remote Sensing Information Gateway (RSIG): https://www.epa.gov/hesc/remote-sensing-information-gateway (EPA, 2024).
The supplement related to this article is available online at: https://doi.org/10.5194/acp-24-8049-2024-supplement.
CJG analyzed measurement and model data and wrote the paper. JMP, LC, EB, and PS collected data; operated the site; and analyzed filters for dust, sea salt, sulfate, and nitrate mass concentrations. KF and HOTP provided EQUATES model simulations and helped with their interpretation. JAC performed the HYSPLIT analysis. All authors read and edited the paper.
The contact author has declared that none of the authors has any competing interests.
The views expressed in this paper are those of the authors and do not necessarily represent the views or policies of the US Environmental Protection Agency.
Publisher's note: Copernicus Publications remains neutral with regard to jurisdictional claims made in the text, published maps, institutional affiliations, or any other geographical representation in this paper. While Copernicus Publications makes every effort to include appropriate place names, the final responsibility lies with the authors.
Cassandra J. Gaston acknowledges funding from an NSF CAREER grant (1944958) and an NSF MRI grant (2215875). The authors acknowledge the NOAA Air Resources Laboratory (ARL) for the provision of the HYSPLIT transport and dispersion model and the READY website (https://www.ready.noaa.gov/HYSPLIT.php, last access: 21 May 2024). The authors acknowledge the family of H. C. Manning and the Herbert C. Manning Trust for providing access to their land at Ragged Point. The authors acknowledge the contributions of Dennis L. Savoie for his efforts to measure soluble ions and dust mass concentrations from the AEROCE network. We thank Wyat Appel, Kathleen Fahey, and Jeff Willison for helpful comments that improved the quality of this paper. We thank the two anonymous reviewers for the thoughtful reviews that improved this paper.
This research has been supported by the National Science Foundation (grant nos. 2215875 and 1944958).
This paper was edited by Leiming Zhang and reviewed by two anonymous referees.
Aas, W., Mortier, A., Bowersox, V., Cherian, R., Faluvegi, G., Fagerli, H., Hand, J., Klimont, Z., Galy-Lacaux, C., Lehmann, C. M. B., Myhre, C. L., Myhre, G., Olivié, D., Sato, K., Quaas, J., Rao, P. S. P., Schulz, M., Shindell, D., Skeie, R. B., Stein, A., Takemura, T., Tsyro, S., Vet, R., and Xu, X.: Global and regional trends of atmospheric sulfur, Sci. Rep., 9, 1–11, https://doi.org/10.1038/s41598-018-37304-0, 2019.
Adams, A. M., Prospero, J. M., and Zhang, C. D.: CALIPSO-derived three-dimensional structure of aerosol over the Atlantic Basin and adjacent continents, J. Climate, 25, 6862–6879, 2012.
Adams, J. W., Rodriguez, D., and Cox, R. A.: The uptake of SO2 on Saharan dust: a flow tube study, Atmos. Chem. Phys., 5, 2679–2689, https://doi.org/10.5194/acp-5-2679-2005, 2005.
Adams, P. J., Seinfeld, J. H., and Koch, D. M.: Global concentrations of tropospheric sulfate, nitrate, and ammonium aerosol simulated in a general circulation model, J. Geophys. Res., 104, 13791–13823, https://doi.org/10.1029/1999JD900083, 1999.
Adebiyi, A. A. and Zuidema, P.: The role of the southern African easterly jet in modifying the southeast Atlantic aerosol and cloud environments, Q. J. Roy., 142, 1574–1589, 2016.
Adon, M., Galy-Lacaux, C., Yoboué, V., Delon, C., Lacaux, J. P., Castera, P., Gardrat, E., Pienaar, J., Al Ourabi, H., Laouali, D., Diop, B., Sigha-Nkamdjou, L., Akpo, A., Tathy, J. P., Lavenu, F., and Mougin, E.: Long term measurements of sulfur dioxide, nitrogen dioxide, ammonia, nitric acid and ozone in Africa using passive samplers, Atmos. Chem. Phys., 10, 7467–7487, https://doi.org/10.5194/acp-10-7467-2010, 2010.
Adon, M., Yobou, V., Galy-Lacaux, C., Liousse, C., Diop, B., Hadji, E., Doumbia, T., Gardrat, E., Ndiaye, S. A., and Jarnot, C.: Measurements of NO2, SO2, NH3, HNO3 and O3 in West African urban environments, Atmos. Environ., 135, 31–40, https://doi.org/10.1016/j.atmosenv.2016.03.050, 2016.
Alexander, B., Park, R. J., Jacob, D. J., Li, Q. B., Yantosca, R. M., Savarino, J., Lee, C. C. W., and Thiemens, M. H.: Sulfate formation in sea-salt aerosols: Constraints from oxygen isotopes, J. Geophys. Res., 110, 1–12, https://doi.org/10.1029/2004JD005659, 2005.
Andela, N. and Van Der Werf, G. R.: Recent trends in African fires driven by cropland expansion and El Niño to La Niña transition, Nat. Clim. Change, 4, 791–795, https://doi.org/10.1038/NCLIMATE2313, 2014.
Andela, N., Morton, D. C., Giglio, L., Chen, Y., Van Der Werf, G. R., Kasibhatla, P. S., DeFries, R. S., Collatz, G. J., Hantson, S., Kloster, S., Bachelet, D., Forrest, M., Lasslop, G., Li, F., Mangeon, S., Melton, J. R., Yue, C., and Randerson, J. T.: A human-driven decline in global burned area, Science, 356, 1356–1362, https://doi.org/10.1126/science.aal4108, 2017.
Andreae, M. O., Ferek, R. J., Bermond, F., Byrd, K. P., Engstrom, R. T., Hardin, S., Houmere, P. D., LeMarrec, F., and Raemdonck, H.: Dimethyl sulfide in the marine atmosphere, J. Geophys. Res., 90, 12891–12900, 1985.
Andreae, M. O.: Soot carbon and excess fine potassium: Long-range transport of combustion-derived aerosols, Science, 220, 1148–1151, https://doi.org/10.1126/SCIENCE.220.4602.1148, 1983.
Andreae, M. O.: Emission of trace gases and aerosols from biomass burning – an updated assessment, Atmos. Chem. Phys., 19, 8523–8546, https://doi.org/10.5194/acp-19-8523-2019, 2019.
Andreae, M. O. and Merlet, P.: Emission of trace gases and aerosols from biomass burning, Global Biogeochem. Cy., 15, 955–966, 2001.
Appel, B. R., Kothny, E. L., Hoffer, E. M., Hidy, G. M., and Wesolowski, J. J.: Sulfate and nitrate data from California Aerosol Characterization Experiment (ACHEX), Environ. Sci. Technol., 12, 418–425, 1978.
Appel, K. W., Bash, J. O., Fahey, K. M., Foley, K. M., Gilliam, R. C., Hogrefe, C., Hutzell, W. T., Kang, D., Mathur, R., Murphy, B. N., Napelenok, S. L., Nolte, C. G., Pleim, J. E., Pouliot, G. A., Pye, H. O. T., Ran, L., Roselle, S. J., Sarwar, G., Schwede, D. B., Sidi, F. I., Spero, T. L., and Wong, D. C.: The Community Multiscale Air Quality (CMAQ) model versions 5.3 and 5.3.1: system updates and evaluation, Geosci. Model Dev., 14, 2867–2897, https://doi.org/10.5194/gmd-14-2867-2021, 2021.
Assamoi, E. M. and Liousse, C.: A new inventory for two-wheel vehicle emissions in West Africa for 2002, Atmos. Environ., 44, 3985–3996, https://doi.org/10.1016/J.ATMOSENV.2010.06.048, 2010.
Barkley, A. E., Prospero, J. M., Mahowald, N., Hamilton, D. S., Popendorf, K. J., Oehlert, A. M., Pourmand, A., Gatineau, A., Panechou-Pulcherie, K., Blackwelder, P., and Gaston, C. J.: African biomass burning is a substantial source of phosphorus deposition to the Amazon, Tropical Atlantic Ocean, and Southern Ocean, P. Natl. Acad. Sci. USA, 116, 16216–16221, https://doi.org/10.1073/pnas.1906091116, 2019.
Barkley, A. E., Olson, N. E., Prospero, J. M., Gatineau, A., Panechou, K., Maynard, N. G., Blackwelder, P., China, S., Ault, A. P., and Gaston, C. J.: Atmospheric transport of North African dust-bearing supermicron freshwater diatoms to South America: Implications for iron transport to the equatorial North Atlantic Ocean, Geophys. Res. Lett., 48, e2020GL090476, https://doi.org/10.1029/2020GL090476, 2021.
Barnes, I., Hjorth, J., and Mihalopoulos, N.: Dimethyl sulfide and dimethyl sulfoxide and their oxidation in the atmosphere, Chem. Rev., 106, 940–975, 2006.
Benish, S. E., Bash, J. O., Foley, K. M., Appel, K. W., Hogrefe, C., Gilliam, R., and Pouliot, G.: Long-term regional trends of nitrogen and sulfur deposition in the United States from 2002 to 2017, Atmos. Chem. Phys., 22, 12749–12767, https://doi.org/10.5194/acp-22-12749-2022, 2022.
Boylan, J. W. and Russell, A. G.: PM and light extinction model performance metrics, goals, and criteria for three-dimensional air quality models, Atmos. Environ., 40, 4946–4959, https://doi.org/10.1016/j.atmosenv.2005.09.087, 2006.
Carlson, T. N. and Prospero, J. M.: The large-scale movement of Saharan air outbreaks over the Northern Equatorial Atlantic, J. Appl. Meteorol., 11, 283–297, 1972.
Carslaw, K. S., Lee, L. A., Reddington, C. L., Pringle, K. J., Rap, A., Forster, P. M., Mann, G. W., Spracklen, D. V., Woodhouse, M. T., Regayre, L. A., and Pierce, J. R.: Large contribution of natural aerosols to uncertainty in indirect forcing, Nature, 503, 67–71, https://doi.org/10.1038/nature12674, 2013.
Charlson, R. J., Schwartz, S. E., Hales, J. M., Cess, R. D., Coakley, J. A., Hansen, J. E., and Hofmann, D. J.: Climate forcing by anthropogenic aerosols, Science, 255, 423–430, https://doi.org/10.1126/SCIENCE.255.5043.423, 1992.
Chiapello, I., Moulin, C., and Prospero, J. M.: Understanding the long-term variability of African dust transport across the Atlantic as recorded in both Barbados surface concentrations and large-scale Total Ozone Mapping Spectrometer (TOMS) optical thickness, J. Geophys. Res., 110, 1–9, https://doi.org/10.1029/2004JD005132, 2005.
Czermański, E., Cirella, G. T., Notteboom, T., Oniszczuk-Jastrzabek, A., and Pawłowska, B.: An energy consumption approach to estimate air emission reductions in container shipping, Energies, 14, 278, https://doi.org/10.3390/EN14020278, 2021.
Doherty, O. M., Riemer, N., and Hameed, S.: Saharan mineral dust transport into the Caribbean: Observed atmospheric controls and trends, J. Geophys. Res., 113, D07211, https://doi.org/10.1029/2007JD009171, 2008.
Doherty, O. M., Riemer, N., and Hameed, S.: Control of Saharan mineral dust transport to Barbados in winter by the Intertropical Convergence Zone over West Africa, J. Geophys. Res., 117, 19117, https://doi.org/10.1029/2012JD017767, 2012.
Doumbia, E. H. T., Liousse, C., Keita, S., Granier, L., Granier, C., Elvidge, C. D., Elguindi, N., and Law, K.: Flaring emissions in Africa: Distribution, evolution and comparison with current inventories, Atmos. Environ., 199, 423–434, https://doi.org/10.1016/J.ATMOSENV.2018.11.006, 2019.
Draxler, R. R. and Rolph, G. D.: HYSPLIT (HYbrid Single-Particle Lagrangian Integrated Trajectory) Model access via NOAA ARL READY Website (http://ready.arl.noaa.gov/HYSPLIT.php, last access: 21 May 2024), NOAA Air Resources Laboratory, Silver Spring, MD, 2011.
EPA: Our Nation's Air, Trends through 2022, https://gispub.epa.gov/air/trendsreport/2023/ (last access: 21 May 2024), 2023a.
EPA: High-End Scientific Computing, Remote Sensing Information Gateway, https://www.epa.gov/hesc/remote-sensing-information-gateway (last access: 10 July 2024), 2024.
Foley, K. M., Pouliot, G. A., Eyth, A., Aldridge, M. F., Allen, C., Appel, K. W., Bash, J. O., Beardsley, M., Beidler, J., Choi, D., Farkas, C., Gilliam, R. C., Godfrey, J., Henderson, B. H., Hogrefe, C., Koplitz, S. N., Mason, R., Mathur, R., Misenis, C., Possiel, N., Pye, H. O. T., Reynolds, L., Roark, M., Roberts, S., Schwede, D. B., Seltzer, K. M., Sonntag, D., Talgo, K., Toro, C., Vukovich, J., Xing, J., and Adams, E.: 2002–2017 anthropogenic emissions data for air quality modeling over the United States, Data in Brief, 47, 109022, https://doi.org/10.1016/J.DIB.2023.109022, 2023.
Galloway, J. N., Townsend, A. R., Erisman, J. W., Bekunda, M., Cai, Z., Freney, J. R., Martinelli, L. A., Seitzinger, S. P., and Sutton, M. A.: Transformation of the nitrogen cycle: Recent trends, questions, and potential solutions, Science, 320, 889–892, https://doi.org/10.1126/SCIENCE.1136674, 2008.
Gaston, C. J., Prospero, J. M., Foley, K., Pye, H. O. T., Custals, L., Blades, E., Sealy, P. and Christie, J. A.: Daily nitrate, sulfate, and sea salt aerosol mass concentrations measured at Ragged Point, Barbados from 1990–2011 and aerosol and meteorological model predictions from EQUATES, University of Miami Libraries [data set], https://doi.org/10.17604/k869-9c71, 2024.
Giglio, L., Randerson, J. T., and van der Werf, G. R.: Analysis of daily, monthly, and annual burned area using the fourth-generation global fire emissions database (GFED4), J. Geophys. Res., 118, 317–328, 2013.
Giglio, L., Csiszar, I., and Justice, C. O.: Global distribution and seasonality of active fires as observed with the Terra and Aqua Moderate Resolution Imaging Spectroradiometer (MODIS) sensors, J. Geophys. Res., 111, G02016, https://doi.org/10.1029/2005JG000142, 2006.
Goudie, A. S. and Middleton, N. J.: Saharan dust storms: nature and consequences, Earth-Sci. Rev., 56, 179–204, https://doi.org/10.1016/S0012-8252(01)00067-8, 2001.
Green, J. R., Fiddler, M. N., Holloway, J. S., Fibiger, D. L., McDuffie, E. E., Campuzano-Jost, P., Schroder, J. C., Jimenez, J. L., Weinheimer, A. J., Aquino, J., Montzka, D. D., Hall, S. R., Ullmann, K., Shah, V., Jaeglé, L., Thornton, J. A., Bililign, S., and Brown, S. S.: Rates of wintertime atmospheric SO2 oxidation based on aircraft observations during clear-sky conditions over the Eastern United States, J. Geophys. Res., 124, 6630–6649, https://doi.org/10.1029/2018JD030086, 2019.
Gutleben, M., Groß, S., Heske, C., and Wirth, M.: Wintertime Saharan dust transport towards the Caribbean: an airborne lidar case study during EUREC4A, Atmos. Chem. Phys., 22, 7319–7330, https://doi.org/10.5194/acp-22-7319-2022, 2022.
Hand, J. L., Schichtel, B. A., Malm, W. C., and Pitchford, M. L.: Particulate sulfate ion concentration and SO2 emission trends in the United States from the early 1990s through 2010, Atmos. Chem. Phys., 12, 10353–10365, https://doi.org/10.5194/acp-12-10353-2012, 2012.
Hand, J. L., Prenni, A. J., and Schichtel, B. A.: Trends in seasonal mean speciated aerosol composition in remote areas of the United States From 2000 through 2021, J. Geophys. Res., 129, e2023JD039902. https://doi.org/10.1029/2023JD039902, 2024.
Hickman, J. E., Andela, N., Tsigaridis, K., Galy-Lacaux, C., Ossohou, M., and Bauer, S. E.: Reductions in NO2 burden over north equatorial Africa from decline in biomass burning in spite of growing fossil fuel use, 2005 to 2017, P. Natl. Acad. Sci. USA, 118, e2002579118, https://doi.org/10.1073/pnas.2002579118, 2021.
Hopkins, J. R., Evans, M. J., Lee, J. D., Lewis, A. C., H Marsham, J., McQuaid, J. B., Parker, D. J., Stewart, D. J., Reeves, C. E., and Purvis, R. M.: Direct estimates of emissions from the megacity of Lagos, Atmos. Chem. Phys., 9, 8471–8477, https://doi.org/10.5194/acp-9-8471-2009, 2009.
Jickells, T. D., Buitenhuis, E., Altieri, K., Baker, A. R., Capone, D., Duce, R. A., Dentener, F., Fennel, K., Kanakidou, M., LaRoche, J., Lee, K., Liss, P., Middelburg, J. J., Moore, J. K., Okin, G., Oschlies, A., Sarin, M., Seitzinger, S., Sharples, J., Singh, A., Suntharalingam, P., Uematsu, M., and Zamora, L. M.: A reevaluation of the magnitude and impacts of anthropogenic atmospheric nitrogen inputs on the ocean, Global Biogeochem. Cycles, 31, 289–305, https://doi.org/10.1002/2016GB005586, 2017.
Keene, W. C., Pszenny, A. A. P., Galloway, J. N., and Hawley, M. E.: Sea-salt corrections and interpretation of constituent ratios in marine precipitation, J. Geophys. Res., 91, 6647, https://doi.org/10.1029/JD091ID06P06647, 1986.
Keene, W. C., Moody, J. L., Galloway, J. N., Prospero, J. M., Cooper, O. R., Eckhardt, S., and Maben, J. R.: Long-term trends in aerosol and precipitation composition over the western North Atlantic Ocean at Bermuda, Atmos. Chem. Phys., 14, 8119–8135, https://doi.org/10.5194/acp-14-8119-2014, 2014.
Keita, S., Liousse, C., Assamoi, E.-M., Doumbia, T., N'Datchoh, E. T., Gnamien, S., Elguindi, N., Granier, C., and Yoboué, V.: African anthropogenic emissions inventory for gases and particles from 1990 to 2015, Earth Syst. Sci. Data, 13, 3691–3705, https://doi.org/10.5194/essd-13-3691-2021, 2021.
Kelly, J. T., Koplitz, S. N., Baker, K. R., Holder, A. L., Pye, H. O. T., Murphy, B. N., Bash, J. O., Henderson, B. H., Possiel, N. C., Simon, H., Eyth, A. M., Jang, C., Phillips, S., and Timin, B.: Assessing PM2.5 model performance for the conterminous U.S. with comparison to model performance statistics from 2007–2015, Atmos. Environ., 214, 116872, https://doi.org/10.1016/j.atmosenv.2019.116872, 2019.
Kganyago, M. and Shikwambana, L.: Assessing spatio-temporal variability of wildfires and their impact on Sub-Saharan ecosystems and air quality using multisource remotely sensed data and trend analysis, Sustainability, 11, 6811, https://doi.org/10.3390/su11236811, 2019.
Kharol, S. K., McLinden, C. A., Sioris, C. E., Shephard, M. W., Fioletov, V., van Donkelaar, A., Philip, S., and Martin, R. V.: OMI satellite observations of decadal changes in ground-level sulfur dioxide over North America, Atmos. Chem. Phys., 17, 5921–5929, https://doi.org/10.5194/acp-17-5921-2017, 2017.
Kloster, S., Six, K. D., Feichter, J., Maier-Reimer, E., Roeckner, E., Wetzel, P., Stier, P., and Esch, M.: Response of dimethylsulfide (DMS) in the ocean and atmosphere to global warming, J. Geophys. Res., 112, G03005, https://doi.org/10.1029/2006JG000224, 2007.
Koch, D., Bond, T. C., Streets, D., Unger, N., and van der Werf, G. R.: Global impacts of aerosols from particular source regions and sectors, J. Geophys. Res., 112, 2205, https://doi.org/10.1029/2005JD007024, 2007.
Kramer, S. J., Kirtman, B. P., Zuidema, P., and Ngan, F.: Subseasonal variability of elevated dust concentrations over South Florida, J. Geophys. Res., 125, e2019JD031874, https://doi.org/10.1029/2019JD031874, 2020.
Lee, C., Martin, R. V., Van Donkelaar, A., Lee, H., Dickerson, R. R., Hains, J. C., Krotkov, N., Richter, A., Vinnikov, K., and Schwab, J. J.: SO2 emissions and lifetimes: Estimates from inverse modeling using in situ and global, space-based (SCIAMACHY and OMI) observations, J. Geophys. Res., 116, D06304, https://doi.org/10.1029/2010JD014758, 2011.
Lelieveld, J. and Heintzenberg, J.: Sulfate cooling effect on climate through in-cloud processing of anthropogenic SO2, Science, 258, 117–120, 1992.
Lelieveld, J., Berresheim, H., Borrmann, S., Crutzen, P. J., Dentener, F. J., Fischer, H., Feichter, J., Flatau, P. J., Heland, J., Holzinger, R., Korrmann, R., Lawrence, M. G., Levin, Z., Markowicz, K. M., Mihalopoulos, N., Minikin, A., Ramanathan, V., De Reus, M., Roelofs, G. J., Scheeren, H. A., Sciare, J., Schlager, H., Schultz, M., Siegmund, P., Steil, B., Stephanou, E. G., Stier, P., Traub, M., Warneke, C., Williams, J., and Ziereis, H.: Global air pollution crossroads over the Mediterranean, Science, 298, 794–799, 2002.
Lelieveld, J., Hoor, P., Jöckel, P., Pozzer, A., Hadjinicolaou, P., Cammas, J.-P., and Beirle, S.: Severe ozone air pollution in the Persian Gulf region, Atmos. Chem. Phys., 9, 1393–1406, https://doi.org/10.5194/acp-9-1393-2009, 2009.
Li, C., McLinden, C., Fioletov, V., Krotkov, N., Carn, S., Joiner, J., Streets, D., He, H., Ren, X., Li, Z., and Dickerson, R. R.: India is overtaking China as the world's largest emitter of anthropogenic sulfur dioxide, Sci. Rep., 7, 1–7, https://doi.org/10.1038/s41598-017-14639-8, 2017.
Li-Jones, X. and Prospero, J. M.: Variations in the size distribution of non-sea-salt sulfate aerosol in the marine boundary layer at Barbados: Impact of African dust, J. Geophys. Res., 103, 16073–16084, 1998.
Liousse, C., Assamoi, E., Criqui, P., Granier, C., and Rosset, R.: Explosive growth in African combustion emissions from 2005 to 2030, Environ. Res. Lett., 9, 035003, https://doi.org/10.1088/1748-9326/9/3/035003, 2014.
Mahowald, N., Scanza, R., Brahney, J., Goodale, C. L., Hess, P. G., Moore, J. K., and Neff, J.: Aerosol deposition impacts on land and ocean carbon cycles, Curr. Clim. Change Rep., 3, 16–31, 2017.
Manktelow, P. T., Mann, G. W., Carslaw, K. S., Spracklen, D. V., and Chipperfield, M. P.: Regional and global trends in sulfate aerosol since the 1980s, Geophys. Res. Lett., 34, 14803, https://doi.org/10.1029/2006GL028668, 2007.
Mathur, R., Xing, J., Gilliam, R., Sarwar, G., Hogrefe, C., Pleim, J., Pouliot, G., Roselle, S., Spero, T. L., Wong, D. C., and Young, J.: Extending the Community Multiscale Air Quality (CMAQ) modeling system to hemispheric scales: overview of process considerations and initial applications, Atmos. Chem. Phys., 17, 12449–12474, https://doi.org/10.5194/acp-17-12449-2017, 2017.
McDuffie, E. E., Smith, S. J., O'Rourke, P., Tibrewal, K., Venkataraman, C., Marais, E. A., Zheng, B., Crippa, M., Brauer, M., and Martin, R. V.: A global anthropogenic emission inventory of atmospheric pollutants from sector- and fuel-specific sources (1970–2017): an application of the Community Emissions Data System (CEDS), Earth Syst. Sci. Data, 12, 3413–3442, https://doi.org/10.5194/essd-12-3413-2020, 2020.
McLinden, C. A., Fioletov, V., Shephard, M. W., Krotkov, N., Li, C., Martin, R. V, Moran, M. D., and Joiner, J.: Space-based detection of missing sulfur dioxide sources of global air pollution, Nat. Geosci., 9, 496–500, https://doi.org/10.1038/NGEO2724, 2016.
Murphy, D. M., Cziczo, D. J., Froyd, K. D., Hudson, P. K., Matthew, B. M., Middlebrook, A. M., Peltier, R. E., Sullivan, A., Thomson, D. S., and Weber, R. J.: Single-particle mass spectrometry of tropospheric aerosol particles, J. Geophys. Res., 111, D23S32, https://doi.org/10.1029/2006JD007340, 2006.
Nowell, H. K., Holmes, C. D., Robertson, K., Teske, C., and Hiers, J. K.: A new picture of fire extent, variability, and drought interaction in prescribed fire landscapes: Insights from Florida Government Records, Geophys. Res. Lett., 45, 7874–7884, https://doi.org/10.1029/2018GL078679, 2018.
Opio, R., Mugume, I., and Nakatumba-Nabende, J.: Understanding the trend of NO2, SO2 and CO over East Africa from 2005 to 2020, Atmosphere, 12, 1283, https://doi.org/10.3390/ATMOS12101283, 2021.
Osuji, L. C. and Avwiri, G. O.: Flared gases and other pollutants associated with air quality in industrial areas of Nigeria: An overview, Chem. Biodiversity, 2, 1277–1289, https://doi.org/10.1002/CBDV.200590099, 2005.
Perron, M. M. G., Meyerink, S., Corkill, M., Strzelec, M., Proemse, B. C., Gault-Ringold, M., Sanz Rodriguez, E., Chase, Z., and Bowie, A. R.: Trace elements and nutrients in wildfire plumes to the southeast of Australia, Atmos. Res., 270, 106084, https://doi.org/10.1016/J.ATMOSRES.2022.106084, 2022.
Prospero, J. M.: Long-term measurements of the transport of African mineral dust to the southeastern United States: Implications for regional air quality, J. Geophys. Res., 104, 15917–15927, 1999.
Prospero, J. M. and Mayol-Bracero, O. L.: Understanding the transport and impact of African dust on the Caribbean Basin, B. Am. Meteor. Soc., 94, 1329–1337, 2013.
Prospero, J. M., Glaccum, R. A., and Nees, R. T.: Atmospheric transport of soil dust from Africa to South America, Nature, 289, 570–572, 1981.
Prospero, J. M., Olmez, I., and Ames, M.: Al and Fe in PM2.5 and PM10 suspended particles in South-Central Florida: The impact of the long range transport of African mineral dust, Wat. Air Soil Poll., 125, 291–317, 2001.
Prospero, J. M., Collard, F.-X., Molinie, J., and Jeannot, A.: Characterizing the annual cycle of African dust transport to the Caribbean Basin and South America and its impact on the environment and air quality, Global Biogeochem. Cy., 29, 757–773, https://doi.org/10.1111/1462-2920.13280, 2014.
Prospero, J. M., Delany, A. C., Delany, A. C., and Carlson, T. N.: The discovery of African dust transport to the western hemisphere and the Saharan Air Layer: A history, B. Am. Meteor. Soc., 102, E1239–E1260, https://doi.org/10.1175/BAMS-D-19-0309.1, 2021.
Quinn, P. K., Thompson, E. J., Coffman, D. J., Baidar, S., Bariteau, L., Bates, T. S., Bigorre, S., Brewer, A., de Boer, G., de Szoeke, S. P., Drushka, K., Foltz, G. R., Intrieri, J., Iyer, S., Fairall, C. W., Gaston, C. J., Jansen, F., Johnson, J. E., Krüger, O. O., Marchbanks, R. D., Moran, K. P., Noone, D., Pezoa, S., Pincus, R., Plueddemann, A. J., Pöhlker, M. L., Pöschl, U., Quinones Melendez, E., Royer, H. M., Szczodrak, M., Thomson, J., Upchurch, L. M., Zhang, C., Zhang, D., and Zuidema, P.: Measurements from the RV Ronald H. Brown and related platforms as part of the Atlantic Tradewind Ocean-Atmosphere Mesoscale Interaction Campaign (ATOMIC), Earth Syst. Sci. Data, 13, 1759–1790, https://doi.org/10.5194/essd-13-1759-2021, 2021.
Quinn, P. K., Bates, T. S., Coffman, D. J., Upchurch, L. M., Johnson, J. E., Brewer, A., Baidar, S., McCoy, I. L., and Zuidema, P.: Wintertime observations of tropical northwest Atlantic aerosol properties during ATOMIC: Varying mixtures of dust and biomass burning, J. Geophys. Res., 127, e2021JD036253, https://doi.org/10.1029/2021JD036253, 2022.
Rafaj, P., Amann, M., Siri, J., and Wuester, H.: Changes in European greenhouse gas and air pollutant emissions 1960–2010: decomposition of determining factors (Uncertainties in Greenhouse Gas Inventories), edited by: Ometto, J., Bun, R., Jonas, M., Nahorski, Z., Springer, Cham, 27–54, https://doi.org/10.1007/978-3-319-15901-0_3, 2015.
Rickly, P. S., Guo, H., Campuzano-Jost, P., Jimenez, J. L., Wolfe, G. M., Bennett, R., Bourgeois, I., Crounse, J. D., Dibb, J. E., DiGangi, J. P., Diskin, G. S., Dollner, M., Gargulinski, E. M., Hall, S. R., Halliday, H. S., Hanisco, T. F., Hannun, R. A., Liao, J., Moore, R., Nault, B. A., Nowak, J. B., Peischl, J., Robinson, C. E., Ryerson, T., Sanchez, K. J., Schöberl, M., Soja, A. J., St. Clair, J. M., Thornhill, K. L., Ullmann, K., Wennberg, P. O., Weinzierl, B., Wiggins, E. B., Winstead, E. L., and Rollins, A. W.: Emission factors and evolution of SO2 measured from biomass burning in wildfires and agricultural fires, Atmos. Chem. Phys., 22, 15603–15620, https://doi.org/10.5194/acp-22-15603-2022, 2022.
Roberts, G., Wooster, M. J., and Lagoudakis, E.: Annual and diurnal african biomass burning temporal dynamics, Biogeosciences, 6, 849–866, https://doi.org/10.5194/bg-6-849-2009, 2009.
Rolph, G., Stein, A., and Stunder, B.: Real-time Environmental Applications and Display sYstem: READY, Environ. Model. Softw., 95, 210–228, 2017.
Royer, H. M., Pöhlker, M. L., Krüger, O., Blades, E., Sealy, P., Lata, N. N., Cheng, Z., China, S., Ault, A. P., Quinn, P. K., Zuidema, P., Pöhlker, C., Pöschl, U., Andreae, M., and Gaston, C. J.: African smoke particles act as cloud condensation nuclei in the wintertime tropical North Atlantic boundary layer over Barbados, Atmos. Chem. Phys., 23, 981–998, https://doi.org/10.5194/acp-23-981-2023, 2023.
Salvador, P., Almeida, S. M., Cardoso, J., Almeida-Silva, M., Nunes, T., Cerqueira, M., Alves, C., Reis, M. A., Chaves, P. C., Artínano, B., and Pio, C.: Composition and origin of PM10 in Cape Verde: Characterization of long-range transport episodes, Atmos. Environ., 127, 326–339, 2015.
Sarwar, G., Fahey, K. M., Napelenok, S. L., Roselle, S. J., and Mathur, R.: Examining the impact of CMAQ model updates on aerosol sulfate predictions, in: The 10th Annual CMAS Models-3 User's Conference (p. vol 775), Chapel Hill, NC, https://cmascenter.org/conference/2011/slides/sarwar_examining_impact_2011.pdf (last access: 10 July 2024), 2011.
Sarwar, G., Hogrefe, C., Henderson, B. H., Foley, K., Mathur, R., Murphy, B., and Ahmed, S.: Characterizing variations in ambient PM2.5 concentrations at the U.S. Embassy in Dhaka, Bangladesh using observations and the CMAQ modeling system, Atmos. Environ., 296, 119587, https://doi.org/10.1016/J.ATMOSENV.2023.119587, 2023.
Saturno, J., Ditas, F., Penning de Vries, M., Holanda, B. A., Pöhlker, M. L., Carbone, S., Walter, D., Bobrowski, N., Brito, J., Chi, X., Gutmann, A., Hrabe de Angelis, I., Machado, L. A. T., Moran-Zuloaga, D., Rüdiger, J., Schneider, J., Schulz, C., Wang, Q., Wendisch, M., Artaxo, P., Wagner, T., Pöschl, U., Andreae, M. O., and Pöhlker, C.: African volcanic emissions influencing atmospheric aerosols over the Amazon rain forest, Atmos. Chem. Phys., 18, 10391–10405, https://doi.org/10.5194/acp-18-10391-2018, 2018.
Savoie, D. L. and Prospero, J. M.: Water-soluble potassium, calcium, and magnesium in the aerosols over the tropical North Atlantic, J. Geophys. Res., 85, 385–392, https://doi.org/10.1029/JC085IC01P00385, 1980.
Savoie, D. L. and Prospero, J. M.: Particle size distribution of nitrate and sulfate in the marine atmosphere, Geophys. Res. Lett., 9, 1207–1210, 1982.
Savoie, D. L., Arimoto, R., Keene, W. C., Prospero, J. M., Duce, R. A., and Galloway, J. N.: Marine biogenic and anthropogenic contributions to non-sea-salt sulfate in the marine boundary layer over the North Atlantic Ocean, J. Geophys. Res., 107, 4356, https://doi.org/10.1029/2001JD000970, 2002.
Scheuvens, D., Schutz, L., Kandler, K., Ebert, M., and Weinbruch, S.: Bulk composition of northern African dust and its source sediments – A compilation, Earth-Sci. Rev., 116, 170–194, 2013.
Schlosser, J. S., Braun, R. A., Bradley, T., Dadashazar, H., MacDonald, A. B., Aldhaif, A. A., Aghdam, M. A., Mardi, A. H., Xian, P., and Sorooshian, A.: Analysis of aerosol composition data for western United States wildfires between 2005 and 2015: Dust emissions, chloride depletion, and most enhanced aerosol constituents, J. Geophys. Res., 122, 8951–8966, https://doi.org/10.1002/2017JD026547, 2017.
Shah, V., Jaeglé, L., Thornton, J. A., Lopez-Hilfiker, F. D., Lee, B. H., Schroder, J. C., Campuzano-Jost, P., Jimenez, J. L., Guo, H., Sullivan, A. P., Weber, R. J., Green, J. R., Fiddler, M. N., Bililign, S., Campos, T. L., Stell, M., Weinheimer, A. J., Montzka, D. D., and Brown, S. S.: Chemical feedbacks weaken the wintertime response of particulate sulfate and nitrate to emissions reductions over the eastern United States, P. Natl. Acad. Sci. USA, 115, 8110–8115, https://doi.org/10.1073/PNAS.1803295115, 2018.
Shikwambana, L., Mhangara, P., and Mbatha, N.: Trend analysis and first time observations of sulphur dioxide and nitrogen dioxide in South Africa using TROPOMI/Sentinel-5 P data, Int. J. Appl. Earth Obs. Geoinf., 91, 102130, https://doi.org/10.1016/J.JAG.2020.102130, 2020.
Smith, S. J., van Aardenne, J., Klimont, Z., Andres, R. J., Volke, A., and Delgado Arias, S.: Anthropogenic sulfur dioxide emissions: 1850–2005, Atmos. Chem. Phys., 11, 1101–1116, https://doi.org/10.5194/acp-11-1101-2011, 2011.
Stein, A. F., Draxler, R. R., Rolph, G. D., Stunder, B. J. B., Cohen, M. D., and Ngan, F.: NOAA's HYSPLIT Atmospheric Transport and Dispersion Modeling System, B. Am. Meteor. Soc., 96, 2059–2077, 2015.
Taylor, S. R. and McLennan, S. M.: The continental crust: Its composition and evolution, Oxford, Blackwell Scientific Publications, ISBN 0632011483, 1985.
Trapp, J. M., Millero, F. J., and Prospero, J. M.: Trends in the solubility of iron in dust-dominated aerosols in the equatorial Atlantic trade winds: Importance of iron speciation and sources, Geochem. Geophys., 11, Q03014, https://doi.org/10.1029/2009GC002651, 2010.
Tsamalis, C., Chédin, A., Pelon, J., and Capelle, V.: The seasonal vertical distribution of the Saharan Air Layer and its modulation by the wind, Atmos. Chem. Phys., 13, 11235–11257, https://doi.org/10.5194/acp-13-11235-2013, 2013.
Val, S., Liousse, C., Doumbia, E. H. T., Galy-Lacaux, C., Cachier, H., Marchand, N., Badel, A., Gardrat, E., Sylvestre, A., and Baeza-Squiban, A.: Physico-chemical characterization of African urban aerosols (Bamako in Mali and Dakar in Senegal) and their toxic effects in human bronchial epithelial cells: Description of a worrying situation, Part. Fibre Toxicol., 10, 1–16, http://www.particleandfibretoxicology.com/content/10/1/10 (last access: 10 July 2024), 2013.
Van der Werf, G. R., Randerson, J. T., Collatz, G. J., and Giglio, L.: Carbon emissions from fires in tropical and subtropical ecosystems, Glob. Change Biol., 9, 547–562, https://doi.org/10.1046/J.1365-2486.2003.00604.X, 2003.
Vannucci, P. F., Foley, K., Murphy, B. N., Hogrefe, C., Cohen, R. C., and Pye, H. O. T.: Temperature-dependent composition of summertime PM2.5 in observations and model predictions across the Eastern U.S., ACS Earth Space Chem., 8, 381–392, 2024.
Vasilakos, P., Russell, A., Weber, R., and Nenes, A.: Understanding nitrate formation in a world with less sulfate, Atmos. Chem. Phys., 18, 12765–12775, https://doi.org/10.5194/acp-18-12765-2018, 2018.
Wang, S., Maltrud, M., Elliott, S., Cameron-Smith, P., and Jonko, A.: Influence of dimethyl sulfide on the carbon cycle and biological production, Biogeochemistry, 138, 49–68, https://doi.org/10.1007/s10533-018-0430-5, 2018.
Wex, H., Dieckmann, K., Roberts, G. C., Conrath, T., Izaguirre, M. A., Hartmann, S., Herenz, P., Schäfer, M., Ditas, F., Schmeissner, T., Henning, S., Wehner, B., Siebert, H., and Stratmann, F.: Aerosol arriving on the Caribbean island of Barbados: physical properties and origin, Atmos. Chem. Phys., 16, 14107–14130, https://doi.org/10.5194/acp-16-14107-2016, 2016.
Wiedinmyer, C., Akagi, S. K., Yokelson, R. J., Emmons, L. K., Al-Saadi, J. A., Orlando, J. J., and Soja, A. J.: The Fire INventory from NCAR (FINN): a high resolution global model to estimate the emissions from open burning, Geosci. Model Dev., 4, 625–641, https://doi.org/10.5194/gmd-4-625-2011, 2011.
Wolter, K. and Timlin, M. S.: El Niño/Southern Oscillation behaviour since 1871 as diagnosed in an extended multivariate ENSO index (MEI.ext), Int. J. Climatol., 31, 1074–1087, https://doi.org/10.1002/JOC.2336, 2011.
Yang, Y., Lou, S., Wang, H., Wang, P., and Liao, H.: Trends and source apportionment of aerosols in Europe during 1980–2018, Atmos. Chem. Phys., 20, 2579–2590, https://doi.org/10.5194/acp-20-2579-2020, 2020.
Zhang, T., Hoell, A., Perlwitz, J., Eischeid, J., Murray, D., Hoerling, M., and Hamill, T. M.: Towards probabilistic multivariate ENSO monitoring, Geophys. Res. Lett., 46, 10532–10540, https://doi.org/10.1029/2019GL083946, 2019.
Zhao, B., Jiang, J. H., Gu, Y., Diner, D., Worden, J., Liou, K. N., Su, H., Xing, J., Garay, M., and Huang, L.: Decadal-scale trends in regional aerosol particle properties and their linkage to emission changes, Environ. Res. Lett., 12, 054021, https://doi.org/10.1088/1748-9326/AA6CB2, 2017.
Zhao, J., Zhang, Y., Bie, S., Bilsback, K. R., Pierce, J. R., and Chen, Y.: Changes in global DMS production driven by increased CO2 levels and its impact on radiative forcing, NPJ Clim. Atmos. Sci., 7, 1–8, https://doi.org/10.1038/s41612-024-00563-y, 2024.
Zubkova, M., Boschetti, L., Abatzoglou, J. T., and Giglio, L.: Changes in fire activity in Africa from 2002 to 2016 and their potential drivers, Geophys. Res. Lett., 46, 7643–7653, https://doi.org/10.1029/2019GL083469, 2019.
Zuidema, P.: Data contributing to Zuidema et al., 2019: Ïs summer African dust arriving earlier at Barbados? The updated long-term in-situ dust mass concentration time series from Ragged Point, Barbados and Miami, Florida,̈ B. Am. Meteorol. Soc. [data set], University of Miami Libraries, https://doi.org/10.17604/q3vf-8m31, 2019.
Zuidema, P., Redemann, J., Haywood, J., Wood, R., Piketh, S., Hipondoka, M., and Formenti, P.: Smoke and clouds above the Southeast Atlantic: Upcoming field campaigns probe absorbing aerosol's impact on climate, B. Am. Meteor. Soc., 97, 1131–1135, https://doi.org/10.1175/BAMS-D-15-00082.1, 2016.
Zuidema, P., Sedlacek, A. J., Flynn, C., Springston, S., Delgadillo, R., Zhang, J., Aiken, A. C., Koontz, A., and Muradyan, P.: The Ascension Island boundary layer in the remote Southeast Atlantic is often smoky, Geophys. Res. Lett., 45, 4456–4465, https://doi.org/10.1002/2017GL076926, 2018.
Zuidema, P., Alvarez, C., Kramer, S. J., Custals, L., Izaguirre, M., Sealy, P., Prospero, J. M., and Blades, E.: Is summer African dust arriving earlier to Barbados? The updated long-term in situ dust mass concentration time series from Ragged Point, Barbados, and Miami, Florida, B. Am. Meteor. Soc., 100, 1981–1986, https://doi.org/10.1175/BAMS-D-18-0083.1, 2019.