the Creative Commons Attribution 4.0 License.
the Creative Commons Attribution 4.0 License.
 | 15 Jul 2024
Contrasting extremely warm and long-lasting cold air anomalies in the North Atlantic sector of the Arctic during the HALO-(𝒜 𝒞)3 campaign
Janosch Michaelis
Sebastian Becker
Henning Dorff
Kerstin Ebell
Irina Gorodetskaya
Bernd Heinold
Benjamin Kirbus
Melanie Lauer
Nina Maherndl
Marion Maturilli
Johanna Mayer
Hanno Müller
Roel A. J. Neggers
Fiona M. Paulus
Johannes Röttenbacher
Janna E. Rückert
Imke Schirmacher
Nils Slättberg
André Ehrlich
Manfred Wendisch
Susanne Crewell
How air masses transform during meridional transport into and out of the Arctic is not well represented by numerical models. The airborne field campaign HALO-(𝒜𝒞)3 applied the High Altitude and Long-range Research Aircraft (HALO) within the framework of the collaborative research project on Arctic amplification (𝒜𝒞)3 to address this question by providing a comprehensive observational basis. The campaign took place from 7 March to 12 April 2022 in the North Atlantic sector of the Arctic, a main gateway of atmospheric transport into and out of the Arctic. Here, we investigate to which degree the meteorological and sea ice conditions during the campaign align with the long-term climatology (1979–2022). For this purpose, we use the European Centre for Medium-Range Weather Forecasts (ECMWF) reanalysis v5 (ERA5), satellite data, and measurements at Ny-Ålesund, including atmospheric soundings. The observations and reanalysis data revealed two distinct periods with different weather conditions during HALO-(𝒜𝒞)3: the campaign started with a warm period (11–20 March 2022) where strong southerly winds prevailed that caused poleward transport of warm and moist air masses, so-called moist and warm air intrusions (WAIs). Two WAI events were identified as atmospheric rivers (ARs), which are narrow bands of strong moisture transport. These warm and moist air masses caused the highest measured 2 m temperatures (5.5 °C) and daily precipitation rates (42 mm d−1) at Ny-Ålesund for March since the beginning of the record (1993). Over the sea ice northwest of Svalbard, ERA5 indicated record-breaking rainfall. After the passage of a strong cyclone on 21 March 2022, a cold period followed. Northerly winds advected cold air into the Fram Strait, causing marine cold air outbreaks (MCAOs) until the end of the campaign. This second phase included one of the longest MCAO events found in the ERA5 record (19 d). On average, the entire campaign period was warmer than the climatological mean due to the strong influence of the ARs. In the Fram Strait, the sea ice concentration was well within the climatological variability over the entire campaign duration. However, during the warm period, a large polynya opened northeast of Svalbard, untypical for this season. Compared to previous airborne field campaigns focusing on the evolution of (mixed-phase) clouds, a larger variety of MCAO conditions was observed during HALO-(𝒜𝒞)3. In summary, air mass transport into and out of the Arctic was more pronounced than usual, providing exciting prospects for studying air mass transformation using HALO-(𝒜𝒞)3.
- Article
(17070 KB) - Full-text XML
- BibTeX
- EndNote


Currently, the Arctic is experiencing a drastic temperature increase, which is up to 4 times stronger compared to the rest of the globe (Rantanen et al., 2022). This enhanced Arctic warming is one of the most obvious signs of Arctic amplification, which is caused by numerous feedback mechanisms (Serreze et al., 2009; Screen and Simmonds, 2010; Serreze and Barry, 2011). While the contributions of some feedback mechanisms to Arctic amplification can be regarded as scientific consensus (e.g., sea ice–albedo feedback, Serreze et al., 2009), others are not yet sufficiently explored (e.g., influence of clouds, lapse-rate feedback, Wendisch et al., 2023). The role of linkages between Arctic and mid latitudes especially is still under debate. Moist and warm air intrusions (WAIs) transport large amounts of heat and moisture into the Arctic through the Atlantic sector (Woods and Caballero, 2016). Over the past decades, the frequency of meridional transports through the North Atlantic has increased due to more frequent atmospheric blocking over the Barents Sea (Mewes and Jacobi, 2019; You et al., 2022). Woods et al. (2013) and Woods and Caballero (2016) found that intense WAIs may have a large effect on the downward thermal-infrared radiation at the surface, contributing to the enhanced warming of the Arctic. Furthermore, WAIs precondition the sea ice for the melting season, resulting in a lower sea ice extent at the end of the summer (Kapsch et al., 2013, 2019). Numerical models struggle to accurately represent mixed-phase clouds and the transformation processes of the meridionally transported air masses (Pithan et al., 2014; Cohen et al., 2020).
WAIs are often linked with filaments of strong moisture transport, known as atmospheric rivers (ARs, Newell et al., 1992). ARs are responsible for over 90 % of the poleward moisture transport across the mid latitudes and are frequently accompanied by strong winds and precipitation (Nash et al., 2018). While the precipitation related to ARs can cause snow accumulation in the Arctic, the enhanced emission of downward thermal-infrared radiation by clouds can lead to melting of snow and sea ice (Neff et al., 2014; Komatsu et al., 2018; Mattingly et al., 2018, 2020; Bresson et al., 2022; Viceto et al., 2022). In a warming climate, ARs are expected to shift polewards and to intensify due to the increased moisture load (Ma et al., 2020).
Cold air outbreaks (CAOs) are often responsible for severe weather events at the high and mid latitudes and mainly occur in winter and spring (Fletcher et al., 2016; Pithan et al., 2018). During marine CAOs (MCAOs), cold and dry air is advected southwards from the sea ice to the ice-free (open) ocean. Over the open ocean, the strong temperature contrast between the surface and the lower-tropospheric air leads to intense fluxes of sensible and latent heat, responsible for 60 %–80 % of the oceanic heat losses in that region (Papritz and Spengler, 2017). This heat and moisture transfer into the atmosphere destabilizes the atmospheric boundary layer and leads to the formation of cloud streets, which later develop into open cloud structures. This cloud evolution is difficult to capture by atmospheric models (Pithan et al., 2018), motivating dedicated measurement campaigns (Geerts et al., 2022; Lloyd et al., 2018).
So far, observations of air mass transformations in the Arctic have mostly been conducted from a fixed local position (Eulerian view). Only a few aircraft-based samplings of air mass properties over a limited regional area have been reported (e.g., Wendisch et al., 2019; Mech et al., 2022). To observe air mass transformations along their meridional pathway in a Eulerian view, multiple stations that are aligned with the wind direction would be needed. Therefore, Pithan et al. (2018) proposed a quasi-Lagrangian approach following air masses to and from the Arctic. This motivated the field campaign HALO-(𝒜𝒞)3 within the Transregional Collaborative Research Center TRR 172 “Arctic amplification: Climate Relevant Atmospheric and Surface Processes and Feedback Mechanisms (𝒜𝒞)3”. The campaign was designed to obtain quasi-Lagrangian observational data of air mass transformations during WAIs and MCAOs to gain process understanding and evaluate the performance of weather and climate models (Wendisch et al., 2021, 2024).
During HALO-(𝒜𝒞)3, extensive remote sensing and in situ measurements of surface, cloud, and thermodynamic properties were performed between the Norwegian Sea and the North Pole from 11 March to 12 April 2022 using three research aircraft (HALO, Polar 5, and Polar 6). The High Altitude and Long-range Research Aircraft (HALO) operated by the German Aerospace Centre (Ziereis and Gläßer, 2006; Stevens et al., 2019) is a modified Gulfstream G550. It has an operating range of 9000 km at altitudes up to 15 km, which is beneficial for quasi-Lagrangian air mass observations, and was based in Kiruna during HALO-(𝒜𝒞)3. It was equipped with a similar instrumental payload to that during the EUREC4A campaign (Stevens et al., 2019, 2021; Konow et al., 2021). Polar 5 and Polar 6 (P5 and P6) were based in Longyearbyen and operated by the Alfred Wegener Institute, Helmholtz Center for Polar and Marine Research (Wesche et al., 2016).
This study aims to investigate whether the atmospheric and sea ice conditions encountered during HALO-(𝒜𝒞)3 were suitable for studying air mass transformation. Herein we analyze which types of air mass transport occurred and how representative the conditions were. Therefore, the conditions are analyzed in the climatological context. In this way, our study serves as a comprehensive reference for future studies analyzing the HALO-(𝒜𝒞)3 campaign. After introducing the data and methods in Sect. 2, we provide a general overview of the weather conditions during HALO-(𝒜𝒞)3 (Sect. 3), which leads to the identification of a warm period (Sect. 4) and a cold period (Sect. 5). Both periods are assessed in the climatological context. For the unusually strong warm phase, we further investigate how the associated precipitation might have influenced sea ice conditions (Sect. 6). Finally, we conclude our study in Sect. 7.
Our study concentrates on the North Atlantic sector of the Arctic, the major pathway of WAIs (Johansson et al., 2017; You et al., 2022). Around the Fram Strait, we define a central region including the marginal sea ice zone (Fig. 1) where the air mass transfer from the ocean to the sea ice during WAIs and vice versa during MCAOs is most pronounced. Within this region, most airborne measurements were performed. To better illustrate how the meridional air mass transition progresses, we also include a southerly domain over the ocean including the Greenland and Norwegian seas between Svalbard and Norway and a northerly one in the central Arctic over sea ice. Note that circulation weather type analysis has shown that the flow in this area is generally meridional, while zonal flow hardly occurs (Schirmacher et al., 2023; von Lerber et al., 2022).
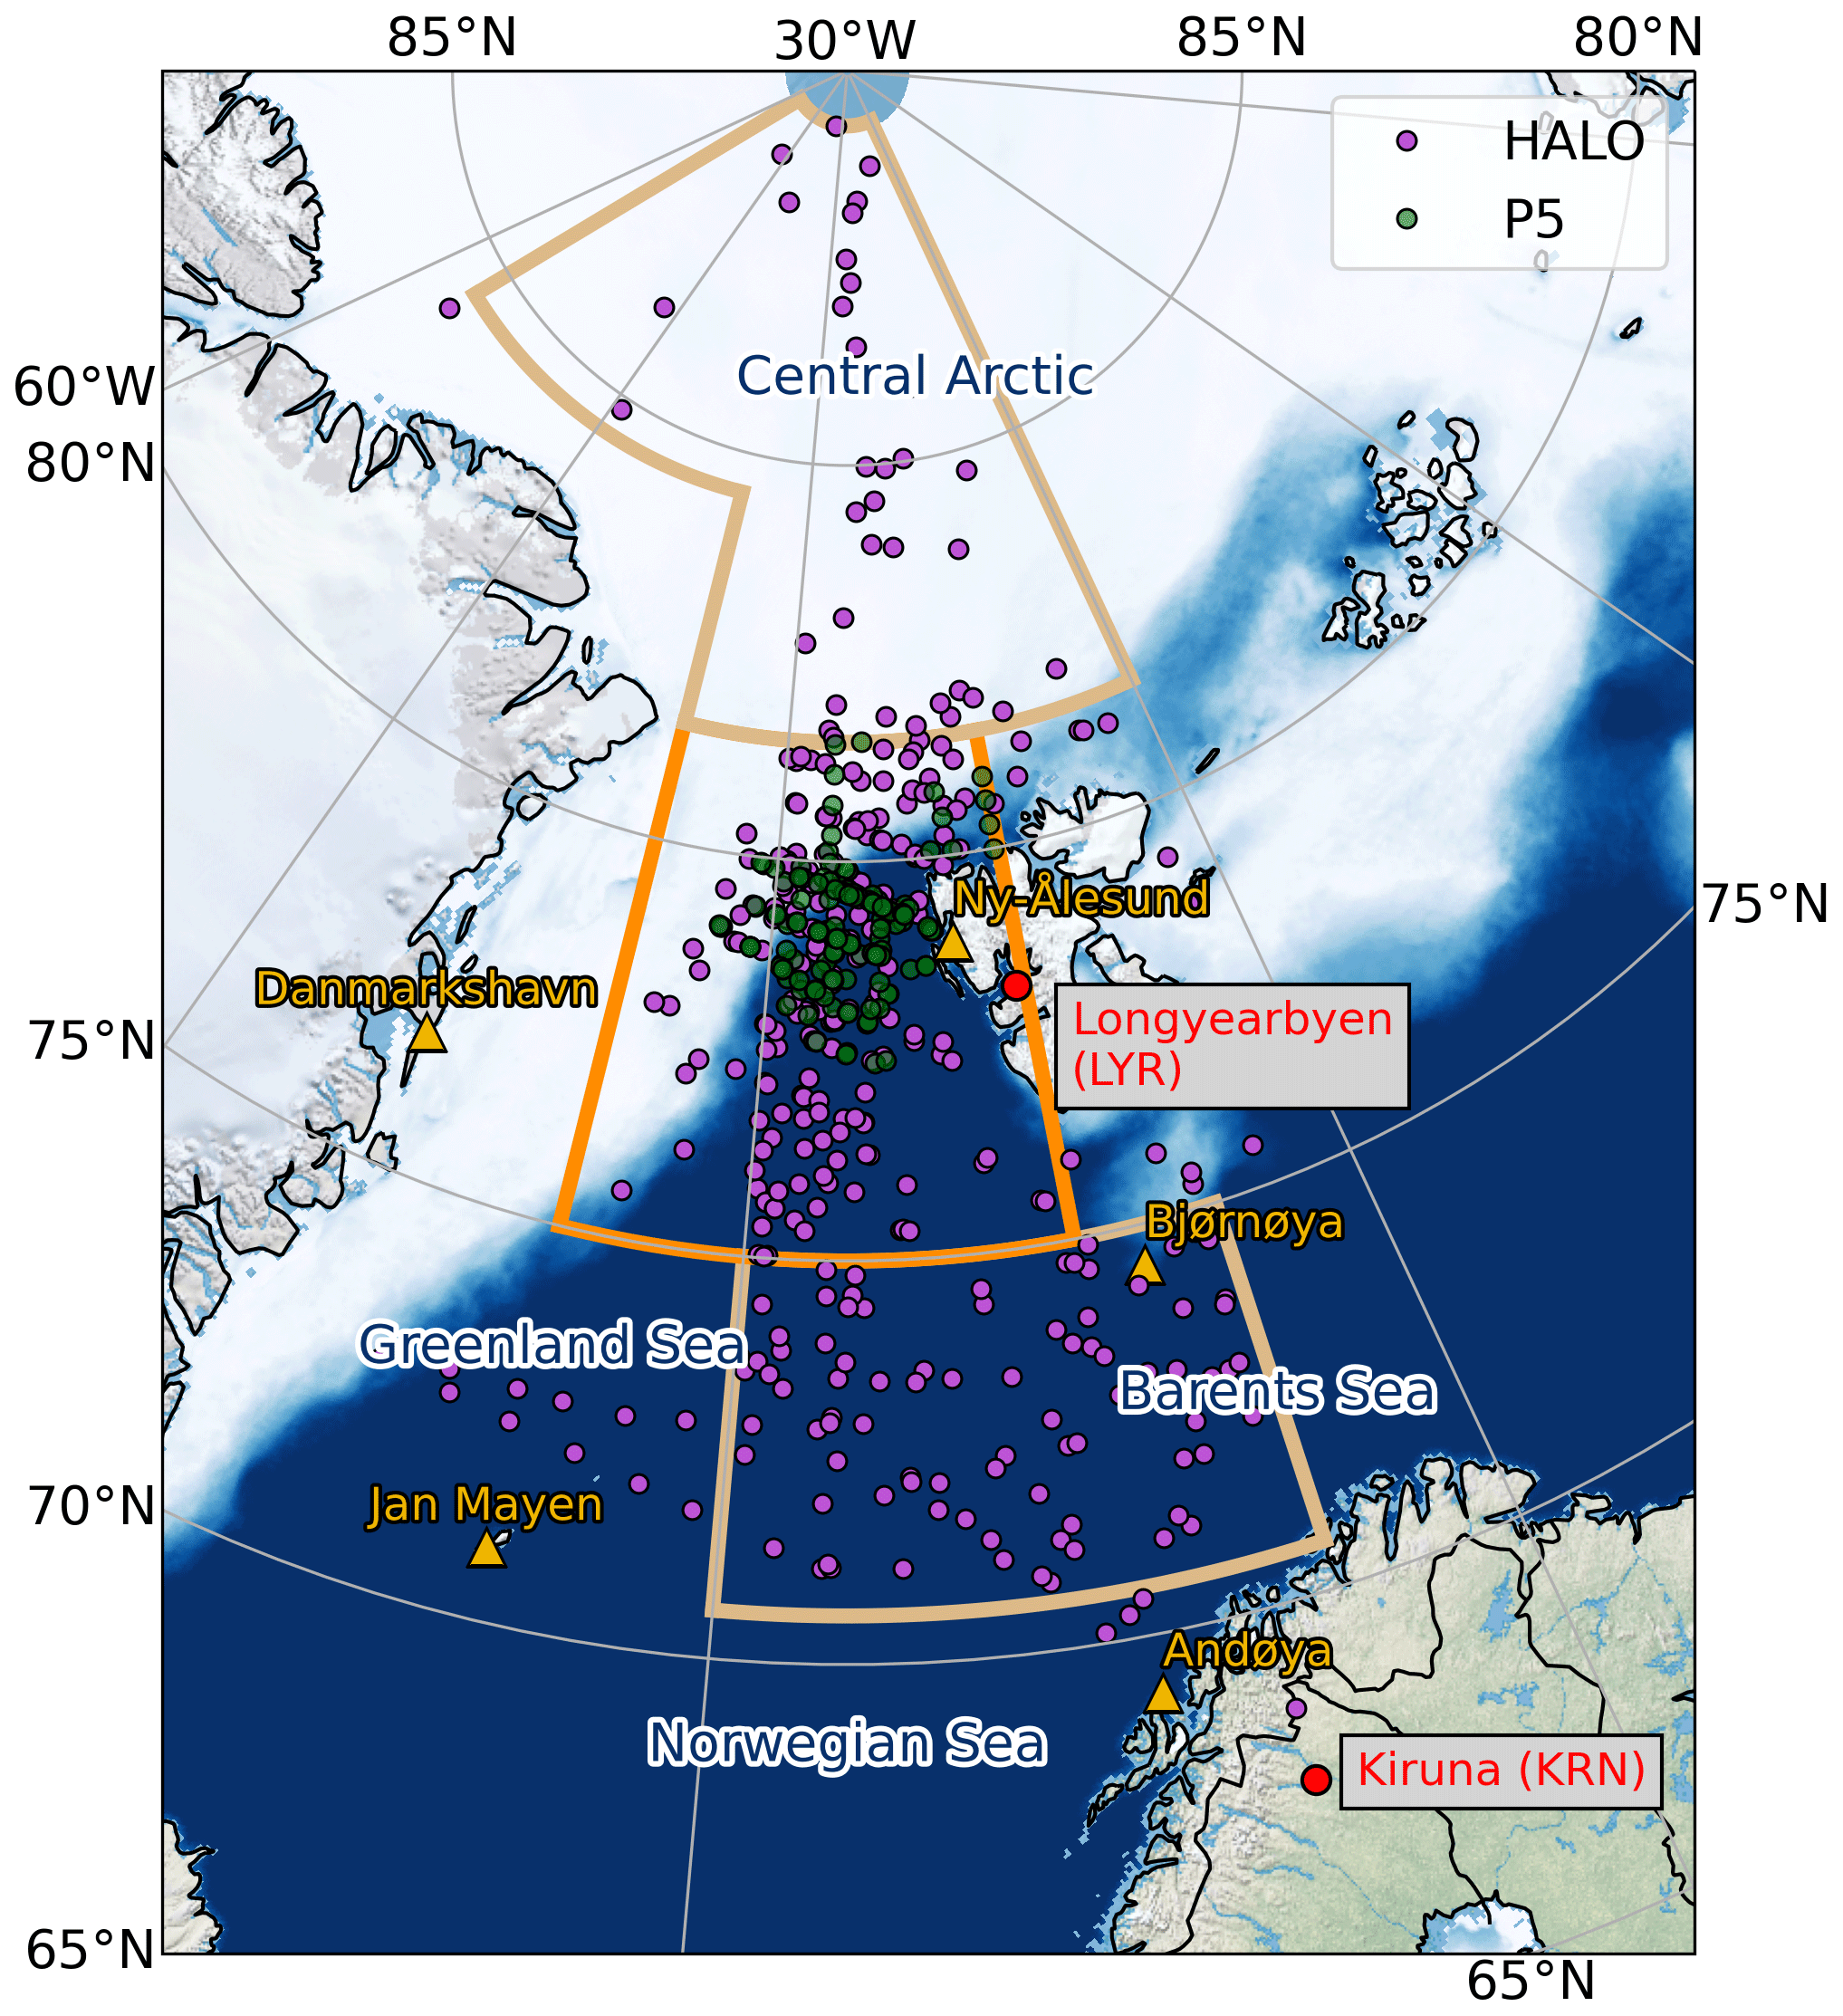
Figure 1Study area with the corresponding domains (southern region, central region, and northern region) and mean sea ice concentration (7 March to 12 April 2022) based on MODIS–AMSR2 satellite data (Ludwig et al., 2020). The locations of the dropsondes launched by HALO (P5) are marked as purple (green) circles. Operational radiosonde stations are indicated with yellow triangles.
2.1 Atmospheric measurements
Only very few permanent radiosonde stations exist in the Arctic. Therefore, the French–German AWIPEV research base in Ny-Ålesund (Svalbard), which is the only station within our central domain, plays a key role in observing atmospheric conditions in the region. We use the 6-hourly soundings at Ny-Ålesund (Vaisala RS41, Maturilli, 2020b) performed during HALO-(𝒜𝒞)3 to assess vertical profiles of temperature, relative humidity, pressure and wind. Similar in situ profiling data are available from dropsondes (Hock and Franklin, 1999; George et al., 2021) launched by HALO and the Polar aircraft. In total, 330 dropsondes from HALO and 141 from Polar 5 and Polar 6, distributed over 18 and 13 research flights, respectively, provide profiles in otherwise unsampled areas (Fig. 1).
From the radiosonde profiles, we identified the thermal tropopause according to the World Meteorological Organization (WMO) definition as the lowest level at which the temperature lapse rate falls below 2 K km−1 and does not exceed this value for the next 2 km. The integrated water vapor (IWV) was calculated from profiles of air pressure and specific humidity. Ground-based meteorological measurements at AWIPEV have been available since 1993 and provide an additional view of the environmental conditions during HALO-(𝒜𝒞)3 (Maturilli et al., 2013; Maturilli, 2020a). Here, the CL–51 ceilometer is used to assess the cloud conditions at Ny-Ålesund (Maturilli and Ebell, 2018; Maturilli, 2022). The detection of a cloud base is used to derive the frequency of cloud occurrence on a daily basis. Long-term precipitation observations are performed manually by the Norwegian Meteorological Institute (MET Norway). For Ny-Ålesund (station no. SN99910), daily precipitation totals (06:00 to 06:00 UTC) have been available since 1 January 1974 and have been analyzed in this study for March and April of the years 1974 to 2022.
2.2 Satellite observations of sea ice
Sea ice concentration (SIC), i.e., the percentage of a satellite pixel covered by sea ice, is obtained from the Ocean and Sea Ice (OSI) Satellite Application Facility (SAF) Global Sea Ice Concentration Climate Data Record (SIC CDR v2.0), i.e., the product OSI–450 from 1979 to 2015, and the complementary Interim Climate Data Record OSI–430–b from 2016 onwards (OSI SAF, 2017; Copernicus Climate Change Service (C3S), 2020). The product is based on low-frequency passive microwave satellite data and is described in Lavergne et al. (2019). The data sets are available on a daily basis with a grid spacing of 25 km × 25 km. For a higher spatial resolution (1 km), i.e., for the analysis of how SIC changed during HALO-(𝒜𝒞)3, the merged MODIS–AMSR2 SIC product (Ludwig et al., 2020) is used.
2.3 Reanalysis data and diagnostics
The European Centre for Medium-Range Weather Forecasts (ECMWF) reanalysis v5 (ERA5) (Hersbach et al., 2018a, b, 2020) has offered hourly data output since 1950 with a horizontal resolution of 31 km and 137 vertical model levels. For our region, ERA5 has been found to be superior compared to other global reanalysis (Graham et al., 2019a, b; Avila-Diaz et al., 2021). With very few ground-based stations in our study area, the assimilation of satellite data plays a major role in the quality of ERA5. Therefore, our climatological analysis uses the years 1979–2022, starting with the onset of the satellite era. Note that, during HALO-(𝒜𝒞)3, 216 dropsondes were used in the Global Telecommunication System data assimilation, likely resulting in improved reanalysis quality.
Domain averages of the regularly gridded ERA5 data were calculated as area averages weighted by the cosine of the latitude to respect the increasing data point density with increasing latitudes. Grid points with a land fraction > 0 have been excluded from our analysis. ERA5 data serve to detect WAI, ARs, and MCAOs.
-
WAIs are identified by positive daily means of the vertically integrated meridional moisture flux (IVTnorth) averaged over the central region. Guided by the study of Woods and Caballero (2016), a WAI is considered weak (strong) when IVTnorth is below (equal to or above) 100 kg m−1 s−1.
-
ARs are detected by the global algorithm from Guan and Waliser (2015) in its revised version (Guan et al., 2018), adapted to the lower moisture content of the Arctic by reducing moisture transport thresholds. The data set at 1 h resolution is available in Lauer et al. (2023).
-
MCAOs are characterized by their strong temperature decrease with increasing height over the open ocean. The MCAO index M is calculated following Papritz and Spengler (2017) and Dahlke et al. (2022):
with θSKT (θ850) as the potential skin temperature (potential temperature at 850 hPa). Grid points with skin temperatures below 271.5 K (i.e., over sea ice) were excluded from further processing as in Dahlke et al. (2022). Following Papritz and Spengler (2017), MCAO conditions are present when M>0 K, and its strength can be classified as weak (0 K 4 K), moderate (4 K K), strong (8 K 12 K) or very strong (M > 12 K).
For climatological assessment, we average over each region and compute the temporal mean and 25th–75th and 10th–90th percentiles of IVTnorth and M over the climatology period.
3.1 Ny-Ålesund
Radiosoundings from Ny-Ålesund provide the only continuous source of information on the vertical structure of the atmosphere in our study region and are therefore frequently used to characterize the climate of the whole North Atlantic sector of the Arctic (Maturilli et al., 2013). The temperature and moisture profiles measured by radiosondes at Ny-Ålesund during HALO-(𝒜𝒞)3 are shown in Fig. 2 and indicate a high temporal variability at all the altitudes. Temperatures near the surface (5 km) vary between −20 and +5 °C (−45 and −20 °C), indicating the presence of different air masses. This is confirmed by wind measurements, which reveal episodes of strong southerly winds associated with warm temperatures in the first half of the campaign, while in the second half of the campaign weaker, mainly northerly winds associated with lower temperatures prevail. The strongest episode of warm air advection on 12–13 March led to an increase in 2 m temperature from about −14 to +2 °C within 19 h (meteorological tower measurements, not shown). This air mass lifted the tropopause up to 13 km (Fig. 2a), and the 2 m temperature remained above freezing for 5 d. The 2 m temperature even reached a new maximum for March on 15 March (5.5 °C) since the beginning of the data record in 1993.
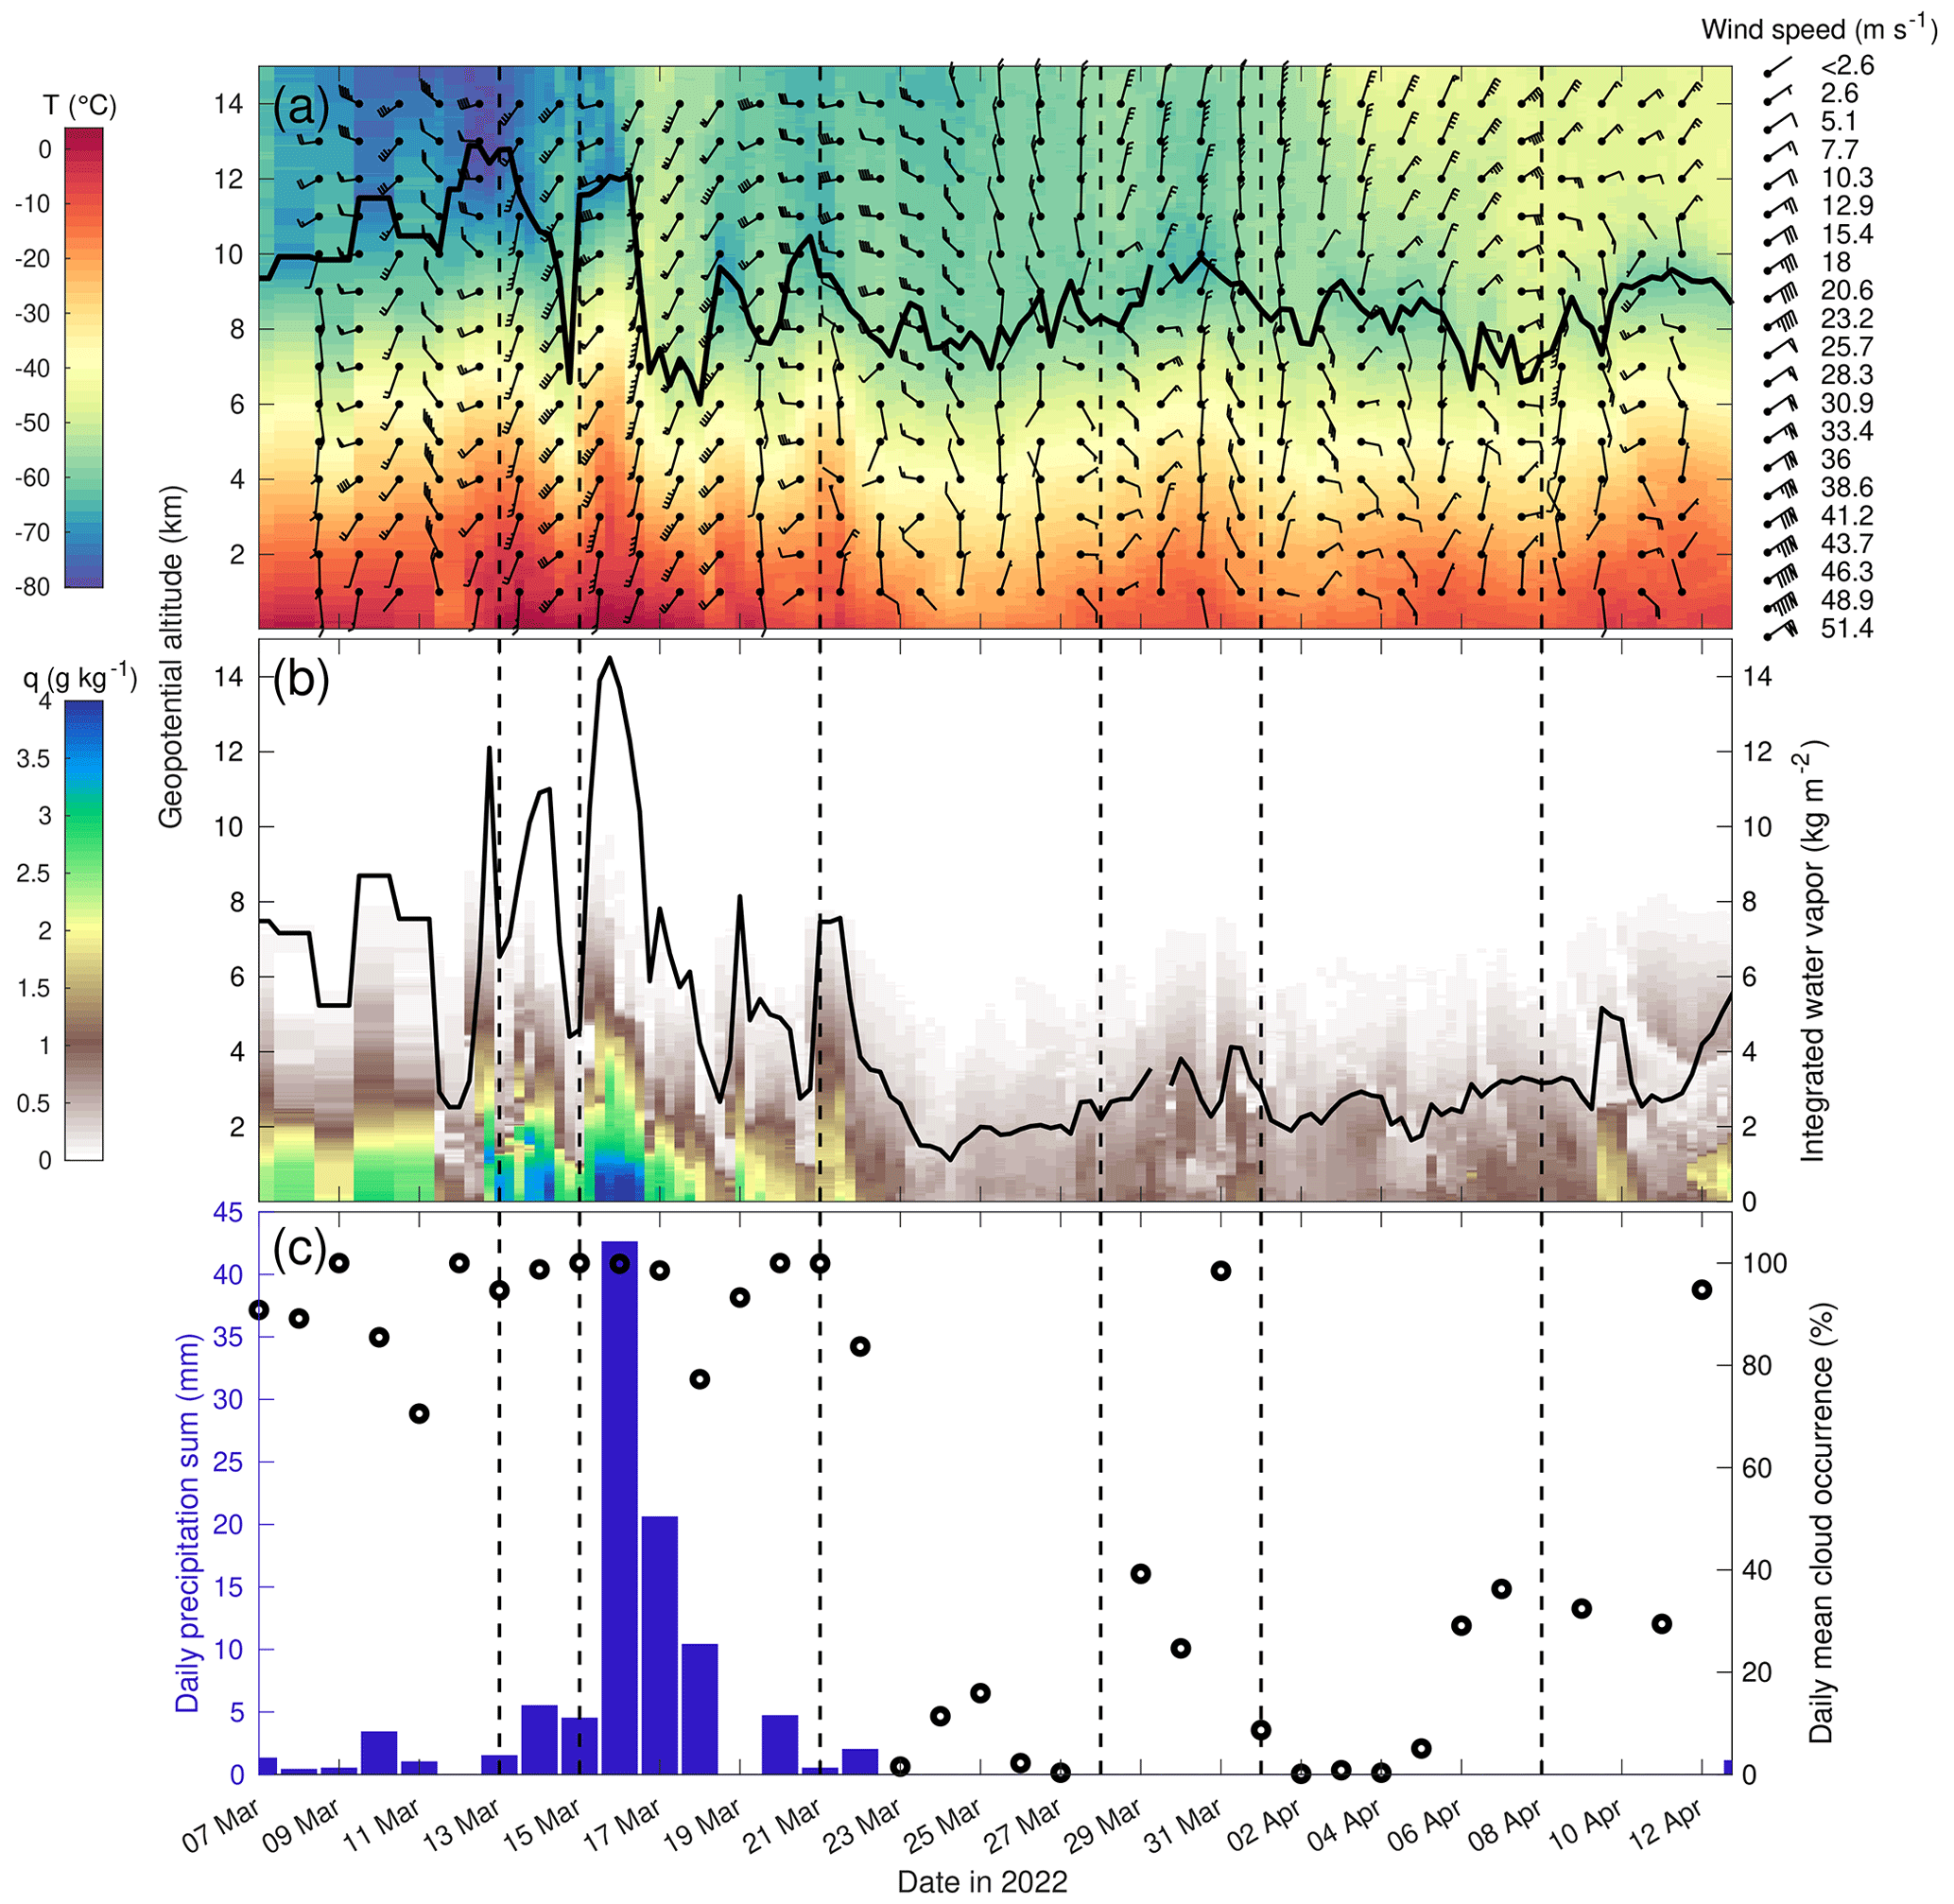
Figure 2Time series of Ny-Ålesund radiosondes of (a) temperature profiles (shading), height of the thermal tropopause (black line), and wind barbs at selected levels as well as (b) specific humidity profiles (shading) and the resulting IWV (black line, right axis). Panel (c) shows daily accumulated precipitation (06:00 to 06:00 UTC) from gauge measurements and daily mean cloud occurrence from ceilometer measurements.
To investigate whether the observed warm air advection was related to ARs, we analyze humidity profiles. The first half of the campaign featured a number of short-term events of high IWV as shown in Fig. 2b. On 15 March, a radiosonde measured an IWV of 14.6 kg m−2, which is the highest value recorded between 7 March and 12 April from 1993 to 2022. The rapid doubling of IWV within 1 d already gives an indication of the presence of ARs. Applying the detection algorithm to reanalysis (Sect. 2) confirms that two ARs passed over Ny-Ålesund. AR I arrived at Ny-Ålesund on 12 March at 13:00 UTC and lasted until 14 March at 13:00 UTC. However, in the AR detection algorithm this AR consisted of two parts with enhanced moisture transport and IWV, which can also be seen in the IWV dip on 13 March between two peaks (12 and 14 March) in Fig. 2b. AR II reached Ny-Ålesund on 15 March at 03:00 UTC and was only detected until 22:00 UTC of the same day, although IWV and the moisture transport stayed at high levels until 16 March at 15:00 UTC (not shown).
The second half of the campaign was drier, featuring the lowest IWV of less than 1.2 kg m−2 on 24 March at 06:00 UTC. This IWV is below the 3rd percentile of all radiosondes between 7 March and 12 April from 1993 to 2022 (Maturilli and Kayser, 2016, 2017; Maturilli, 2020b). Afterwards, IWV varied less and stayed below 4 kg m−2 throughout the second half of the campaign. Only on 10 April did enhanced moisture values indicate a weak moist air advection that was relevant for the formation of cirrus clouds over sea ice observed by HALO (not shown).
The ceilometer at Ny-Ålesund reveals high cloud occurrence until 23 March (Fig. 2c). The high cloudiness is accompanied by precipitation and related to the WAIs and ARs passing over Ny-Ålesund. From 15 March at 06:00 UTC to 16 March at 06:00 UTC, 42 mm of precipitation was recorded, which is the second highest daily accumulated precipitation for March since the beginning of the measurements. The situation changed during the course of 17 March, when the cloud deck started to dissolve, and the 2 m temperature dropped below 0 °C. No further precipitation was observed after 23 March, and cloud occurrence generally remained low at Ny-Ålesund until the end of the campaign. However, note that Ny-Ålesund is located within a fjord on the western coast of Svalbard, and measurements, especially within the atmospheric boundary layer, may be influenced by the local orography (Gierens et al., 2020). For example, the relatively cloud-free second part of the campaign was associated with lee effects.
3.2 Reanalysis
Given the scarcity of measurements, e.g., no permanent radiosonde stations north of 82.5° N (Rinke et al., 2019), reanalysis data (ERA5) are used to characterize the conditions over the whole study domain. However, ERA5 assimilated dropsonde measurements from HALO (details will be given in a dedicated study presenting all HALO-(𝒜𝒞)3 measurements), influencing its performance: in Fig. 3, we show the agreement between ERA5 and HALO dropsondes in terms of root mean square deviation (RMSD) and bias profiles. Over the ocean, the ERA5 temperature agrees with the dropsonde measurements within 0.5–0.9 K (Fig. 3a, b). Over sea ice, we see the expected warm bias of ERA5 in the lower troposphere, which was also found by Yu et al. (2021), leading to higher biases and an RMSD of up to 1.5 K. The RMSD of relative humidity is between 10 % and 20 %, while wind and pressure deviations are 1.5–2 m s−1 and less than 1 hPa, respectively. Deviations can be higher for single dropsondes because of the spatiotemporal variability of humidity and temperature close to the sea ice edge and ARs and because of measurement errors of the dropsondes (especially humidity under dry conditions and at low temperatures). The temperature, relative humidity and wind speed deviations found here agree well with those in Graham et al. (2019b). Note that the deviations would probably be higher if dropsonde measurements were not assimilated. Given the good performance of ERA5, we analyze the environmental conditions in the following.
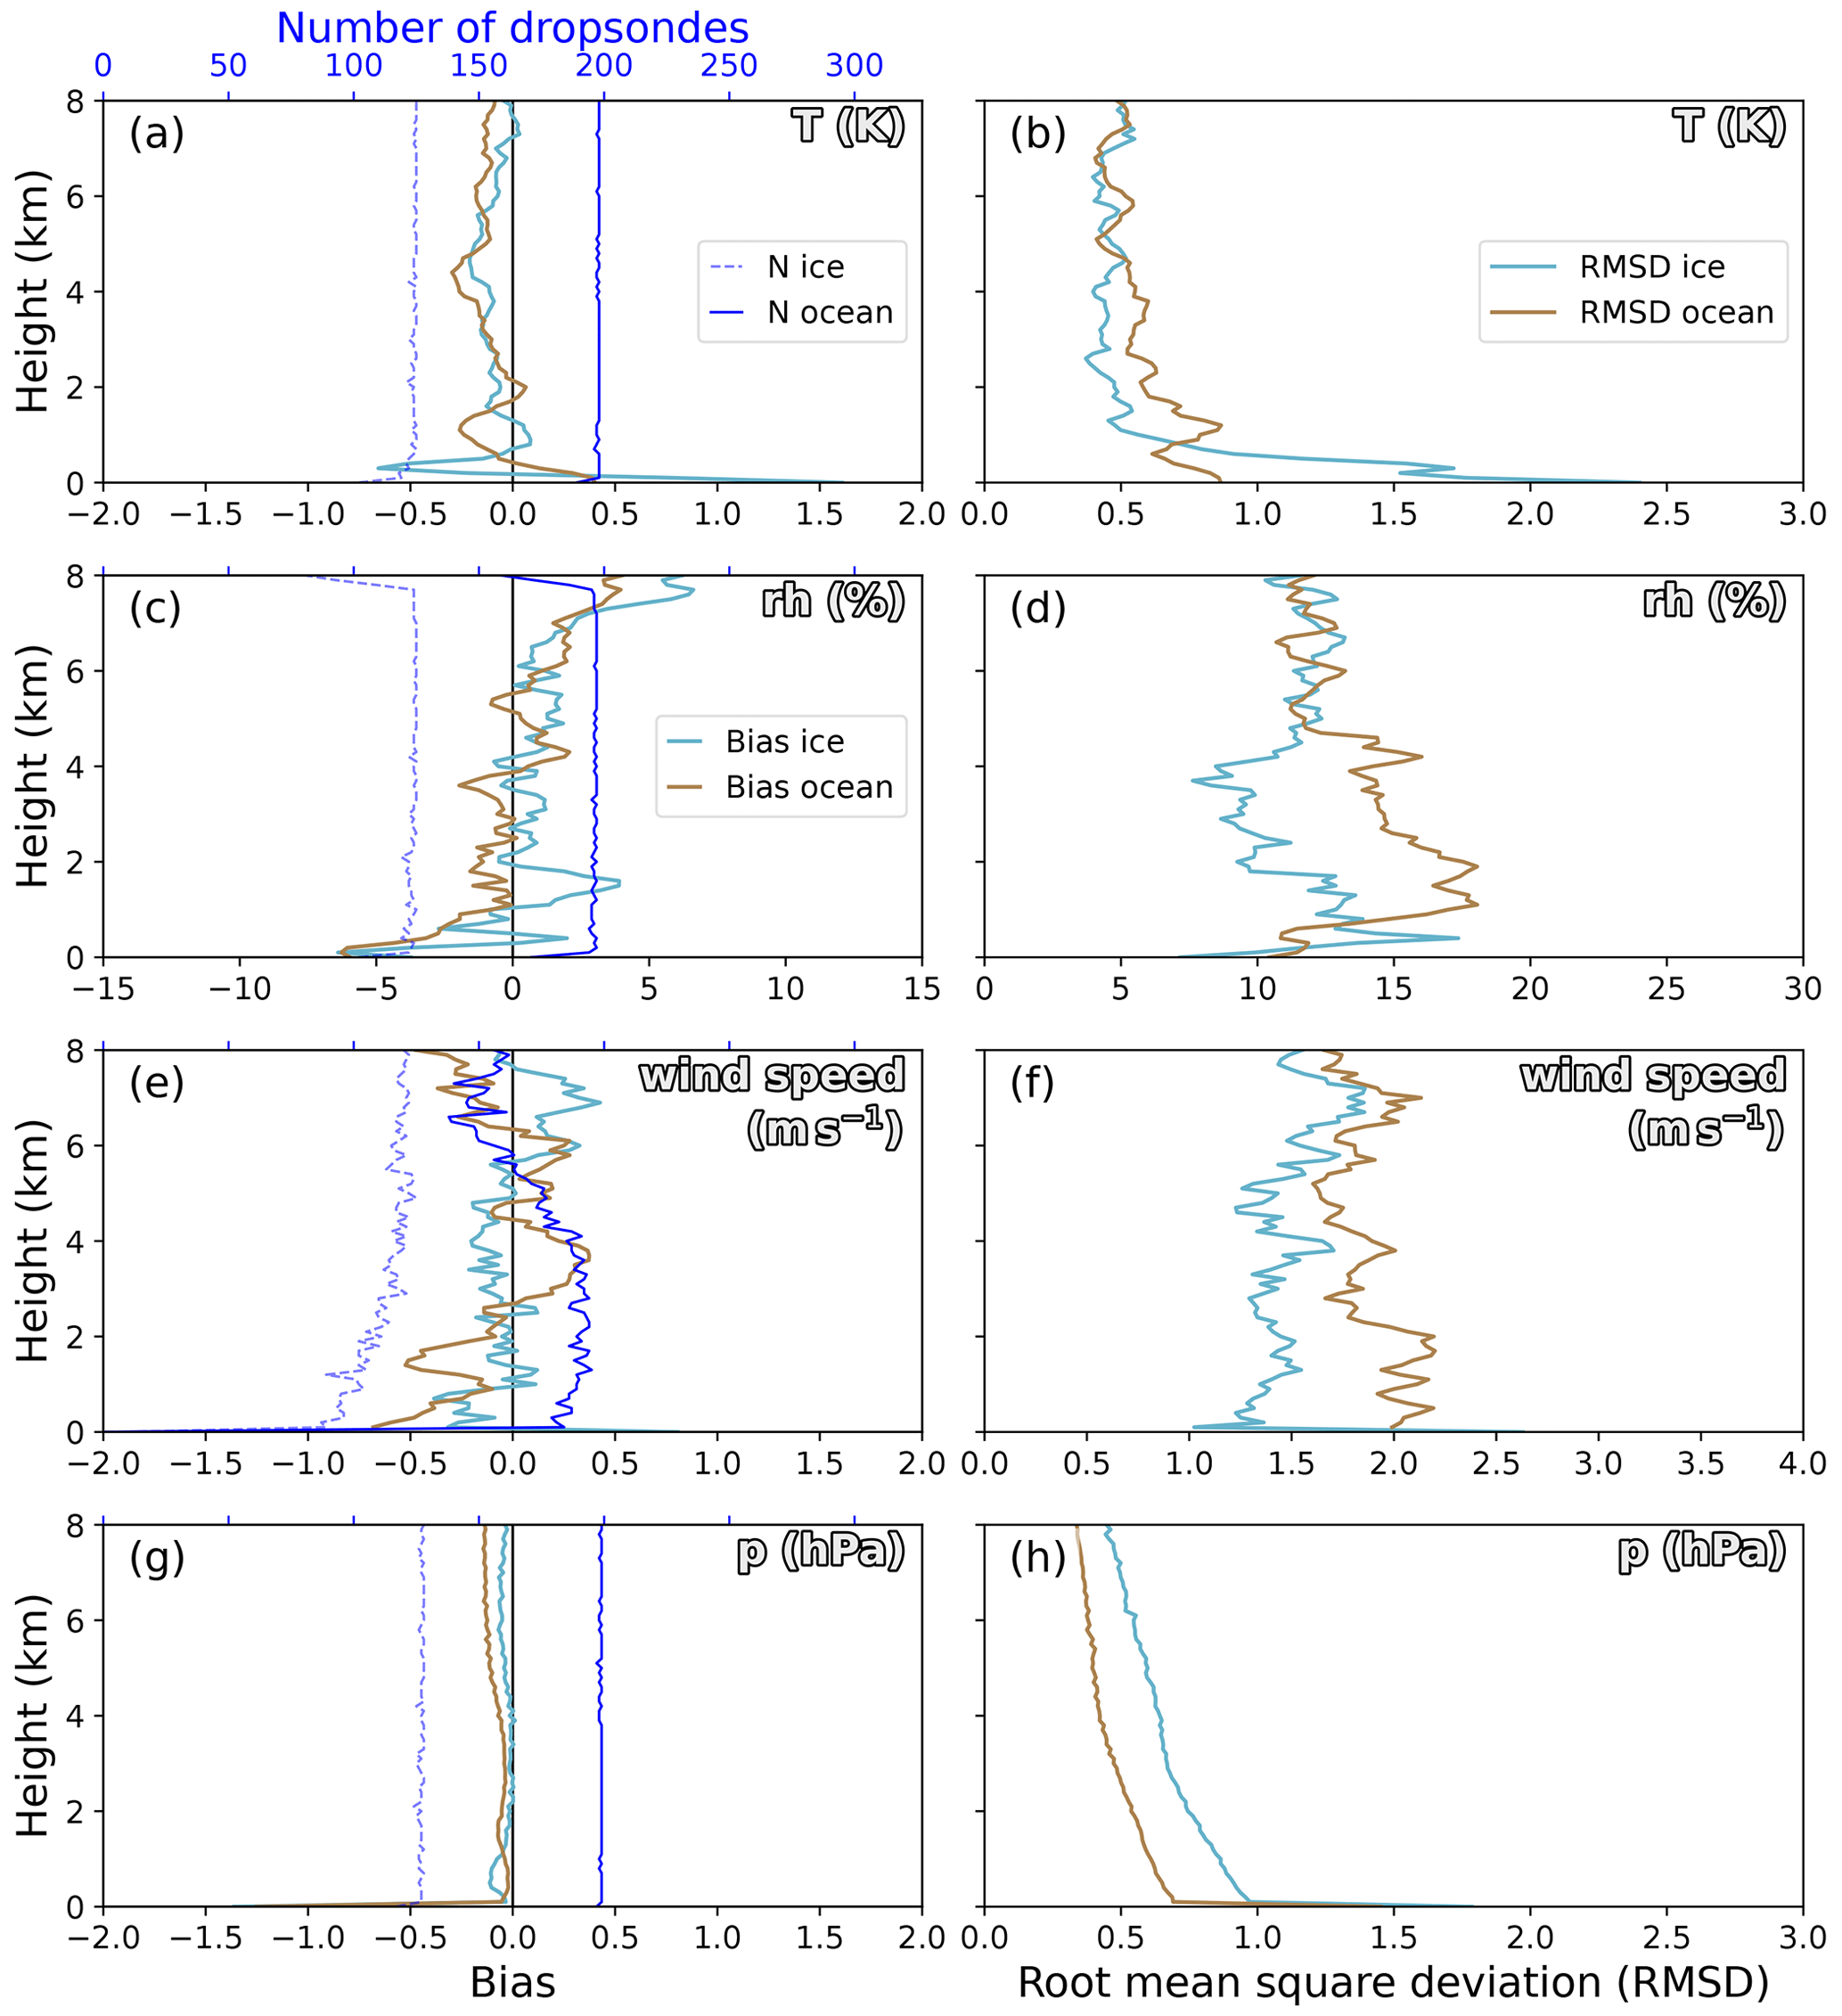
Figure 3ERA5 errors (bias and root mean square deviation, RMSD) of (a, b) temperature (T), (c, d) relative humidity (RH), (e, f) wind speed and (g, h) pressure (p) using dropsonde observations as a reference. The errors are separated into open ocean and sea ice using the ERA5 sea ice concentration. Additionally, we added the number of available dropsonde observations at each height level. Note that the number of dropsondes in the wind speed comparison is lower than for other variables due to gaps in the GPS communication necessary for determining the sonde position.
Time series of area-averaged mean sea level pressure (MSLP), 10 m wind, 2 m temperature, 850 hPa temperature, and IWV (Fig. 4) illustrate that the major features of warm and moist conditions in mid-March and the cooler and drier conditions observed later on at Ny-Ålesund also apply to the central domain. We also look at the spatial distribution of mean sea level pressure, 500 hPa geopotential height, and 850 hPa equivalent-potential temperature in the North Atlantic sector of the Arctic (Fig. 5) to investigate the driving conditions for synoptic events, such as ARs and MCAOs.
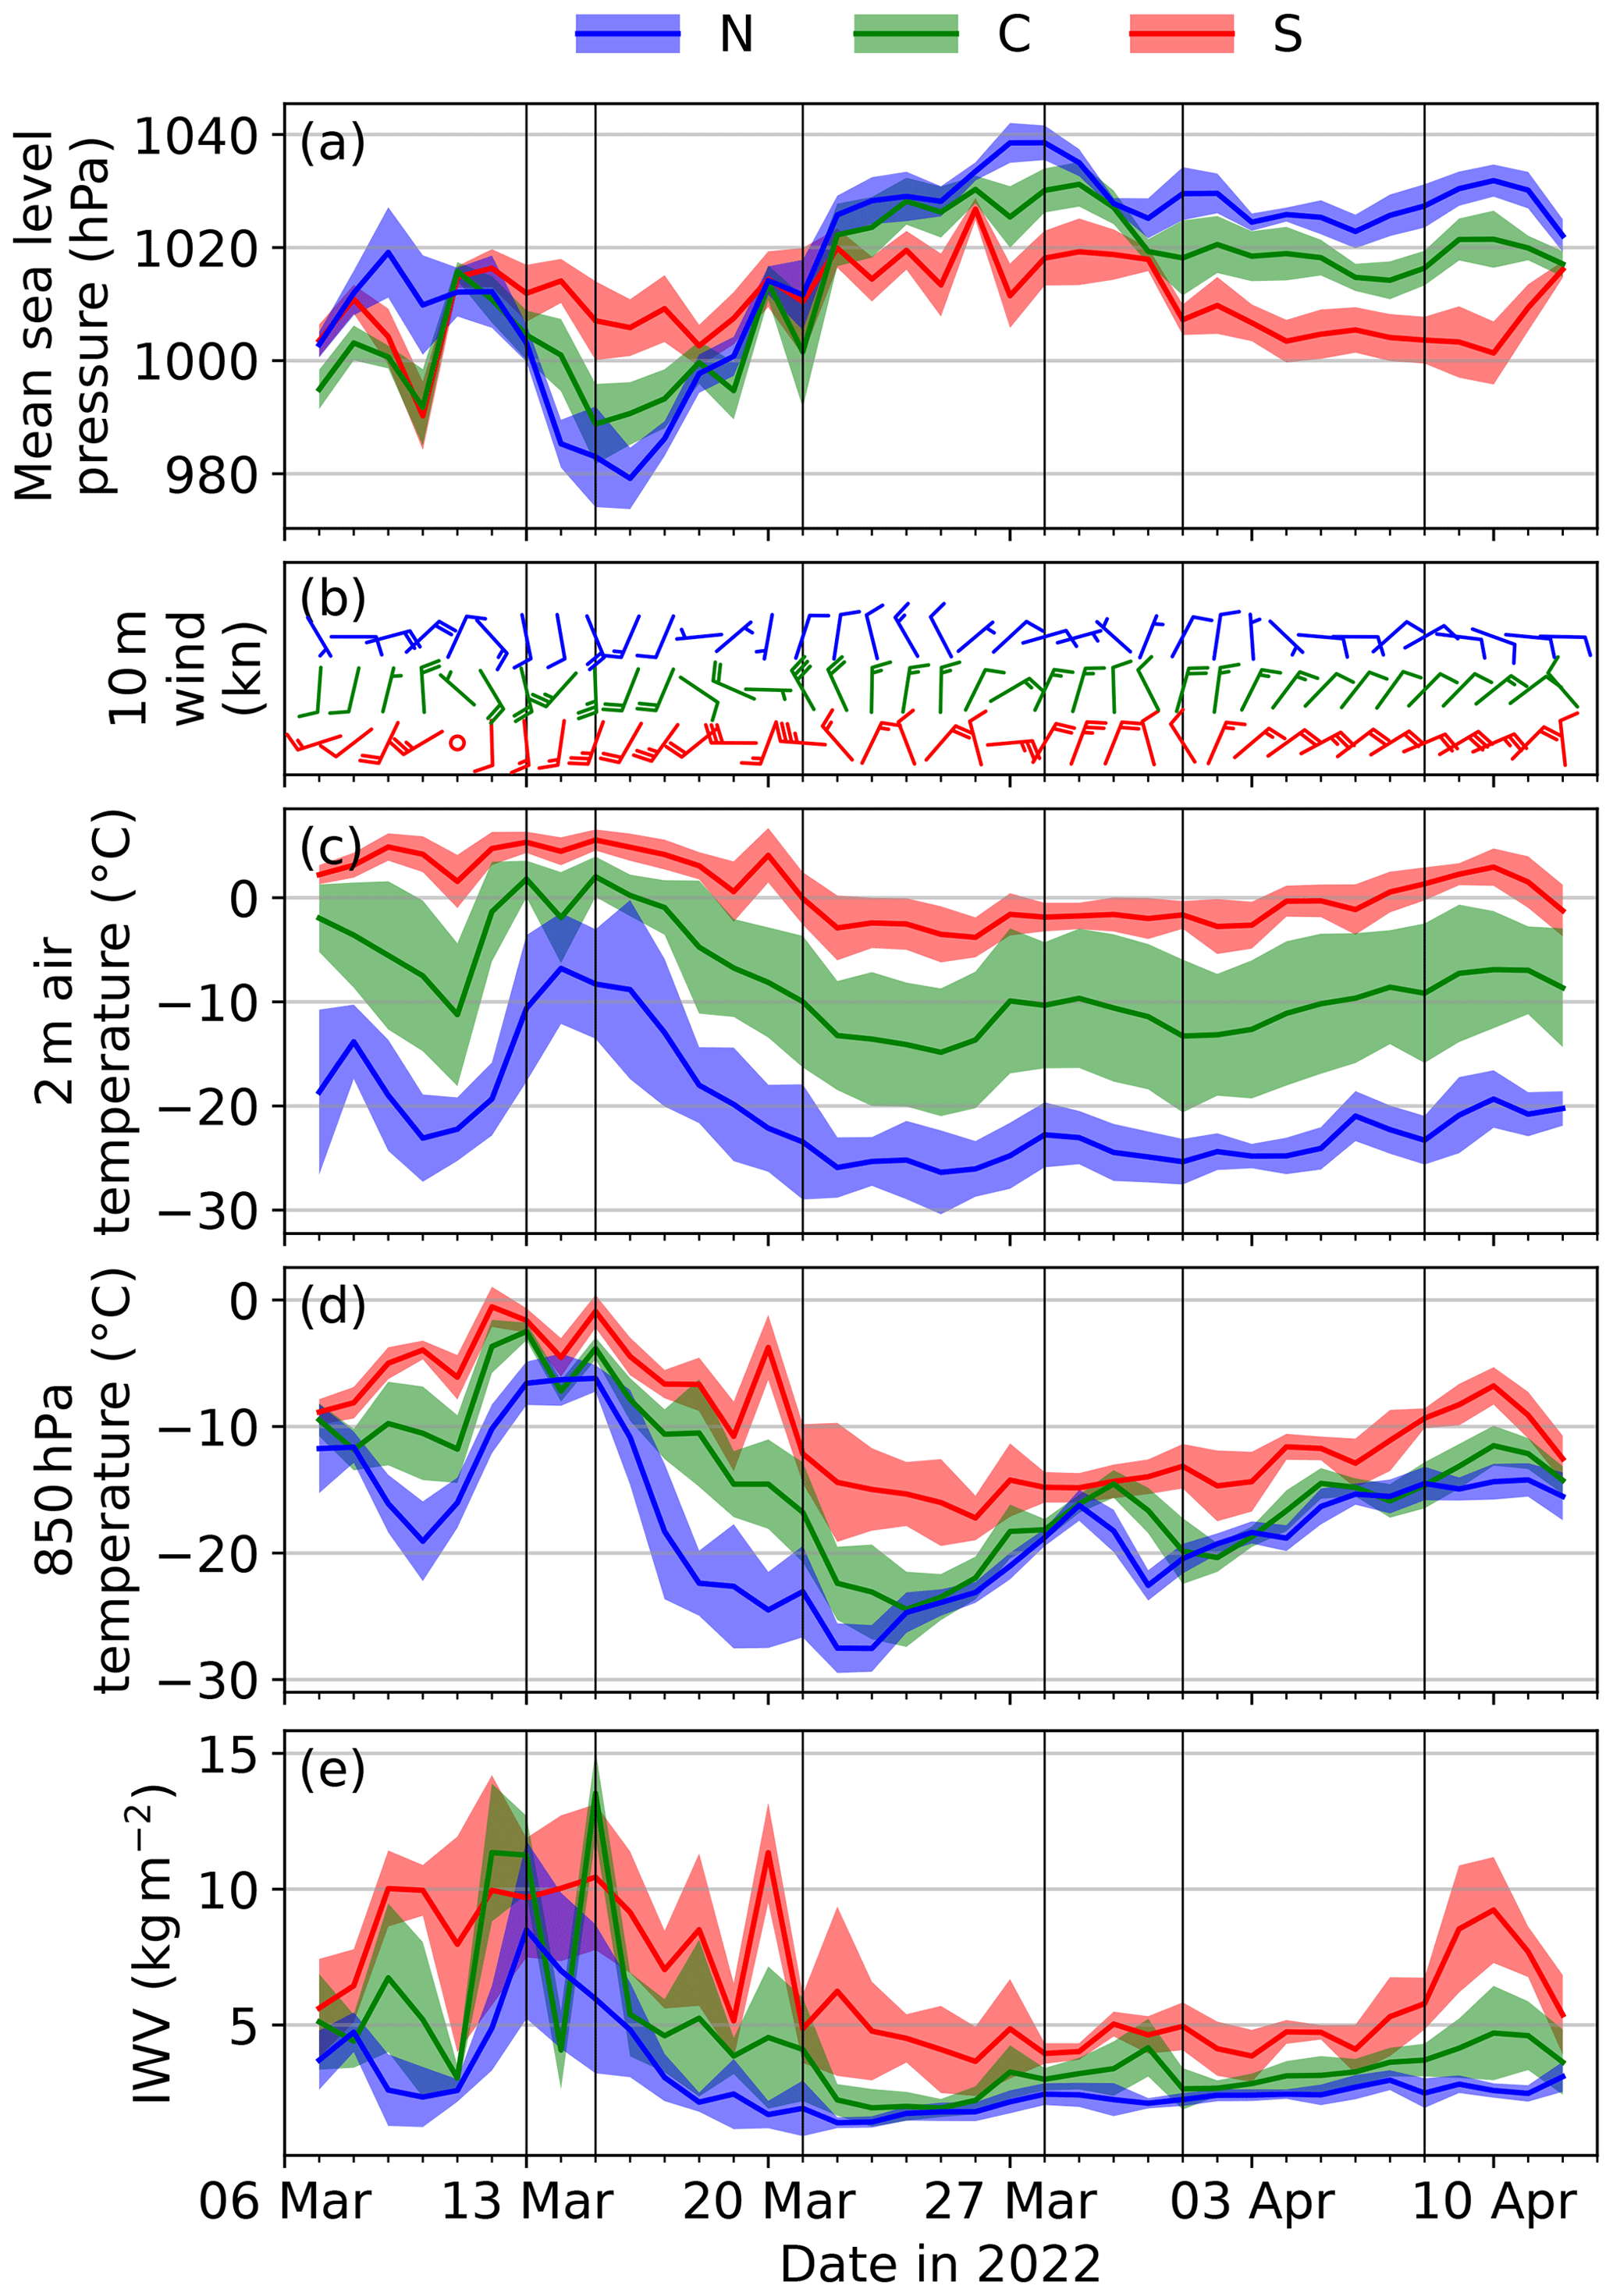
Figure 4Regional averages (colored lines) and standard deviation (shading) of ERA5-based daily means of (a) mean sea level pressure, (b) 10 m wind speed (wind barbs), (c) 2 m temperature, (d) 850 hPa temperature and (e) integrated water vapor. Regional averages are performed for the southern (S, red), central (C, green) and northern (N, blue) regions shown in Fig. 1. Vertical black lines indicate the days shown in Fig. 5.
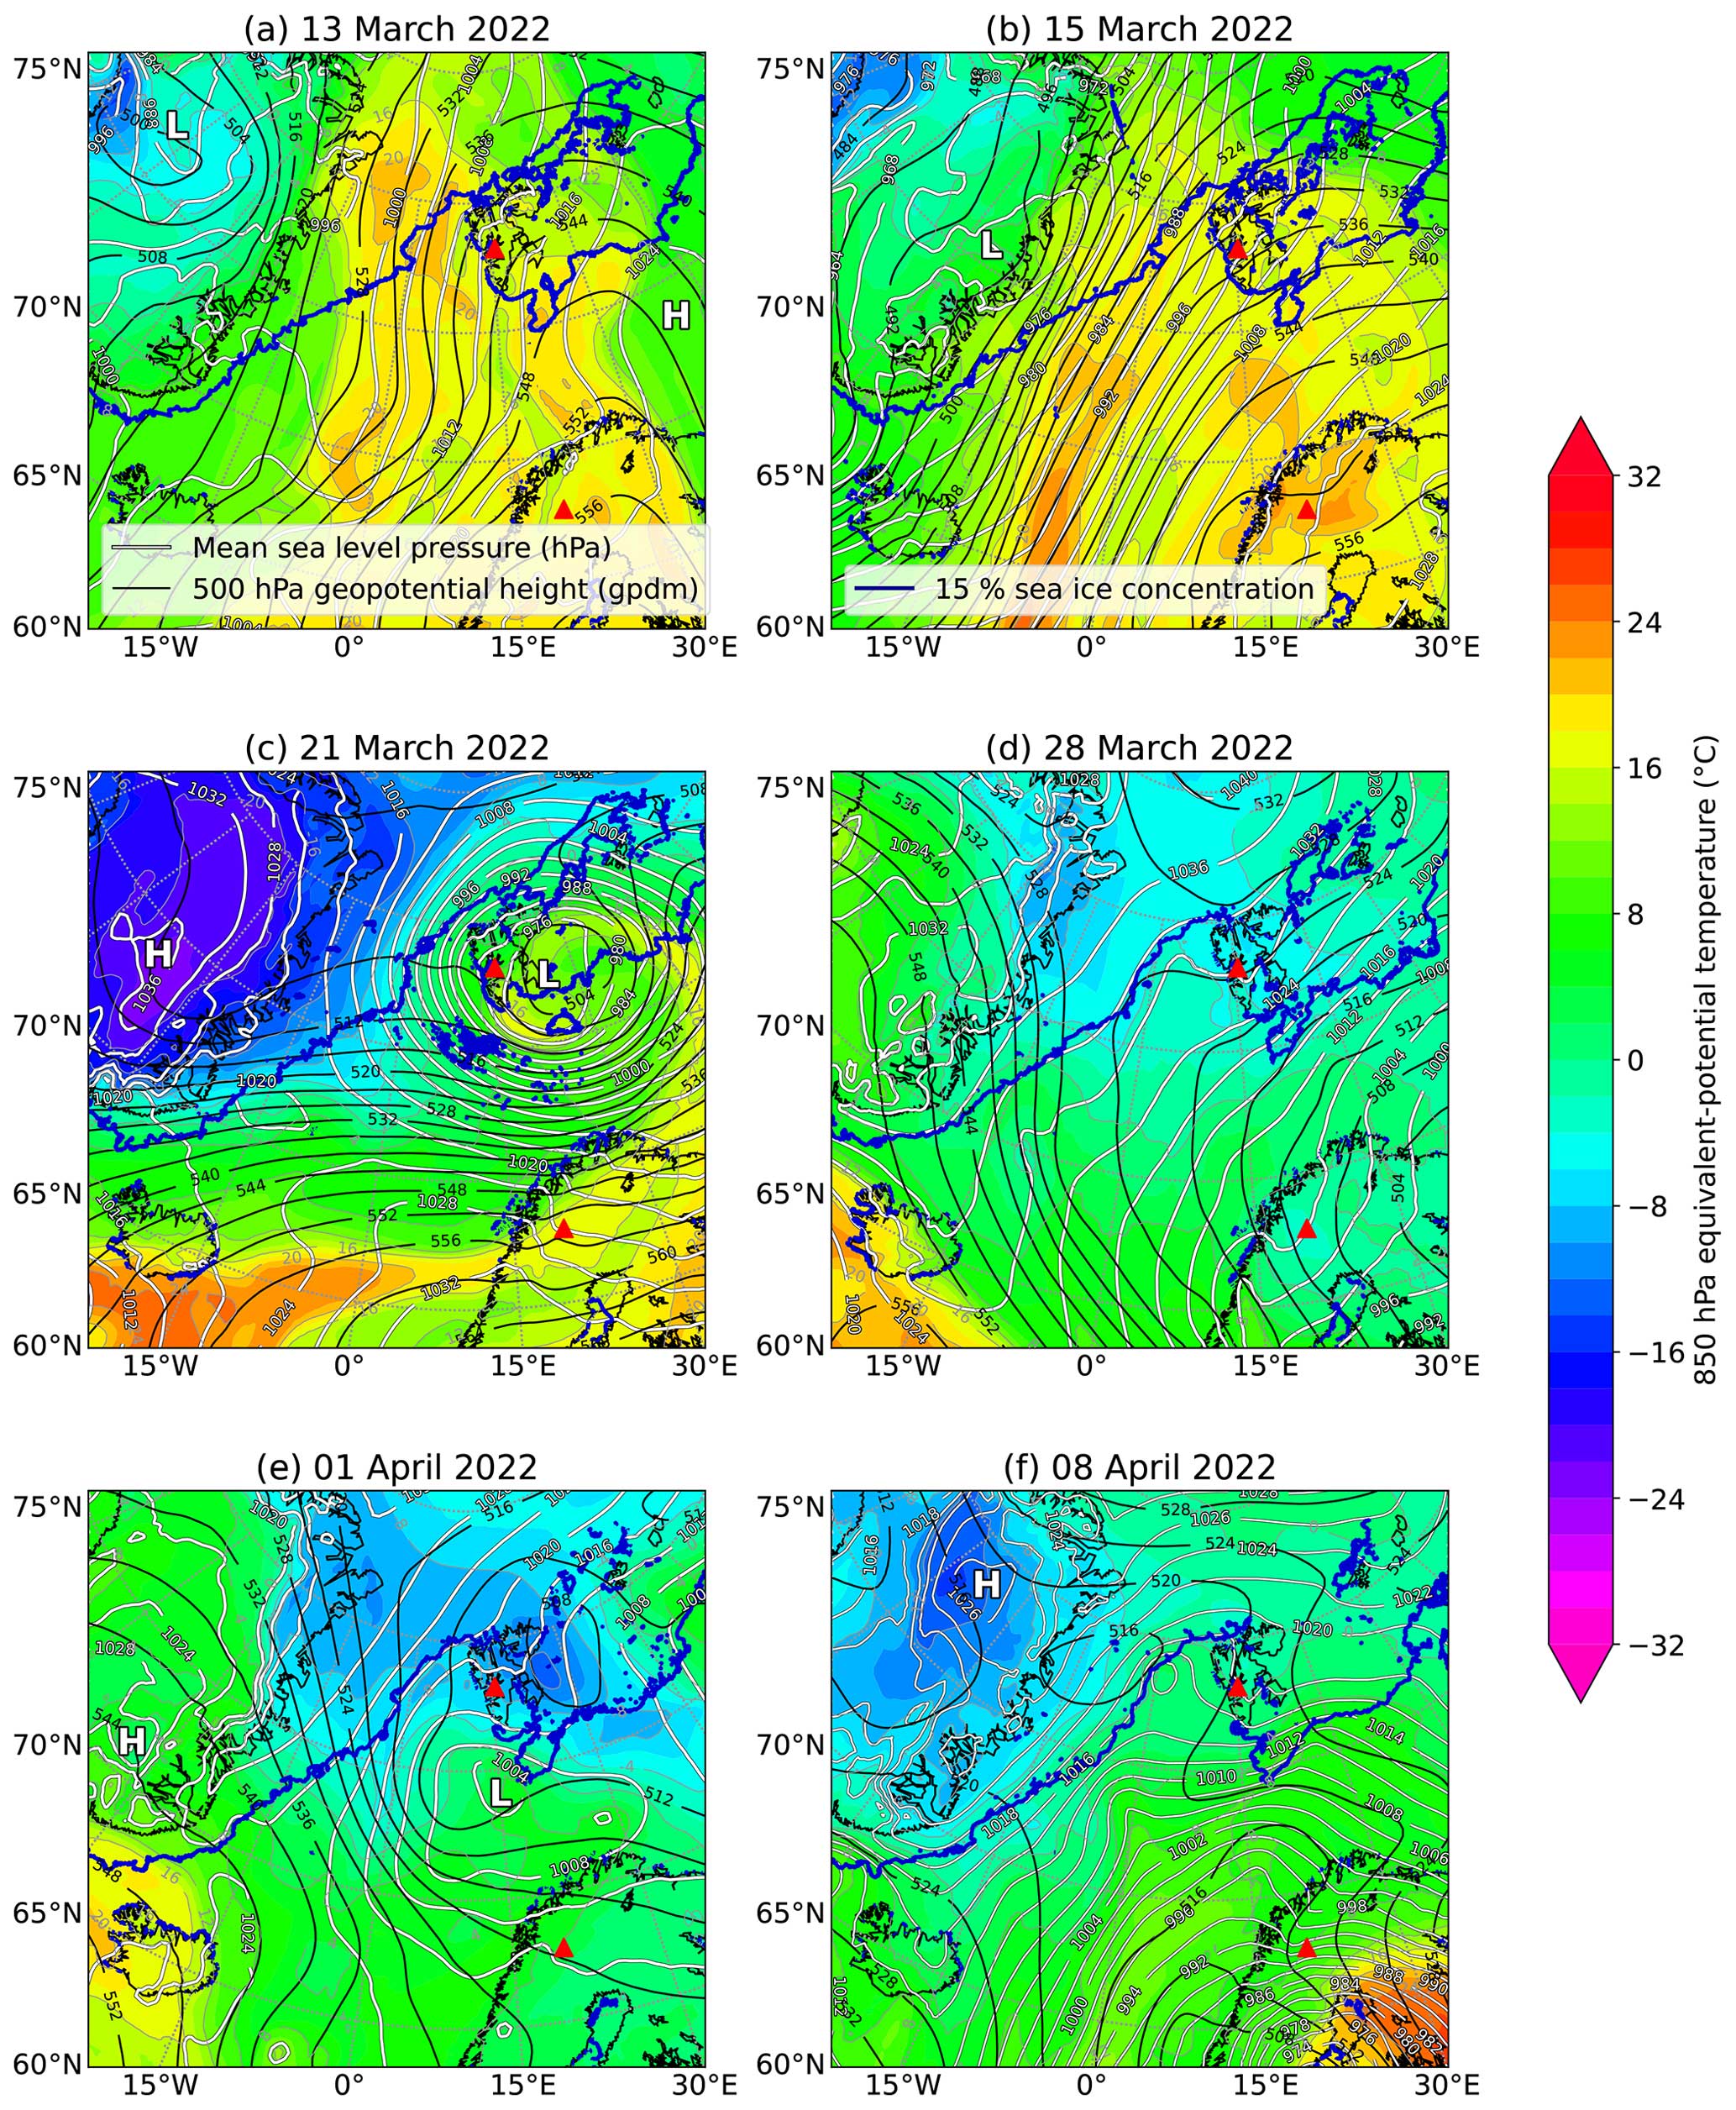
Figure 5Maps of mean sea level pressure (white contour lines with black outlines), 500 hPa geopotential height (black contour lines), and 850 hPa equivalent-potential temperature (shading and grey contours) from ERA5 data for representative days of the main weather conditions at 12:00 UTC. The 15 % sea ice concentration from AMSR2 is displayed as a blue contour line. “H” and “L” illustrate the centers of high- and low-pressure systems, respectively.
The strong warming events observed at Ny-Ålesund between 12 and 16 March are related to a low-pressure system over Greenland, which drives southerly winds through the North Atlantic (Fig. 5a). From 13 to 15 March, the zonal pressure gradient across the North Atlantic intensifies, leading to stronger southerly winds in all three domains (Figs. 5b and 4b). In this period, the IWV is very high in the central and northern domains, with daily area averages of 12–14 and 6–8 kg m−2, respectively (Fig. 4e). At the same time, ERA5 indicates 2 m temperatures above freezing in the central domain, which agrees with the time series observed at Ny-Ålesund (Fig. 4c). Around 20 March, the MSLP gradient between the three domains reverses due to changes in the large-scale pressure constellation (Fig. 5c). The central Arctic now shows typical conditions with the highest MSLP of all the regions and the strongest static stability, as can be judged from the difference between temperatures at 850 hPa and at 2 m (Fig. 4a, c, d). The high MSLP of the central Arctic agrees well with the climatological pressure shown for April in Fig. 4.8 of Serreze and Barry (2014). In this second part of the campaign, northerly winds typical of MCAO activity led to extremely dry conditions, with IWV down to 1.4 kg m−2 in the northern domain (Fig. 4e), clearly indicating a polar air mass.
Motivated by the clear differences between the first and second halves of the campaign, we separate the campaign into two major periods based on the northward component of the integrated water vapor transport (IVTnorth) and the MCAO index (M) in the central region (see Fig. 6). From 11 to 20 March, from here on called the warm period, IVTnorth is positive, indicating warm air advection into the Arctic. In the subsequent period (21 March to 12 April, hereafter referred to as the cold period), IVTnorth turns slightly negative, indicating a moisture flux out of the Arctic. This is connected to MCAO activity, as quantified by the positive MCAO index in the cold period. In the following, we assess the weather conditions of warm and cold periods in the climatological context separately.
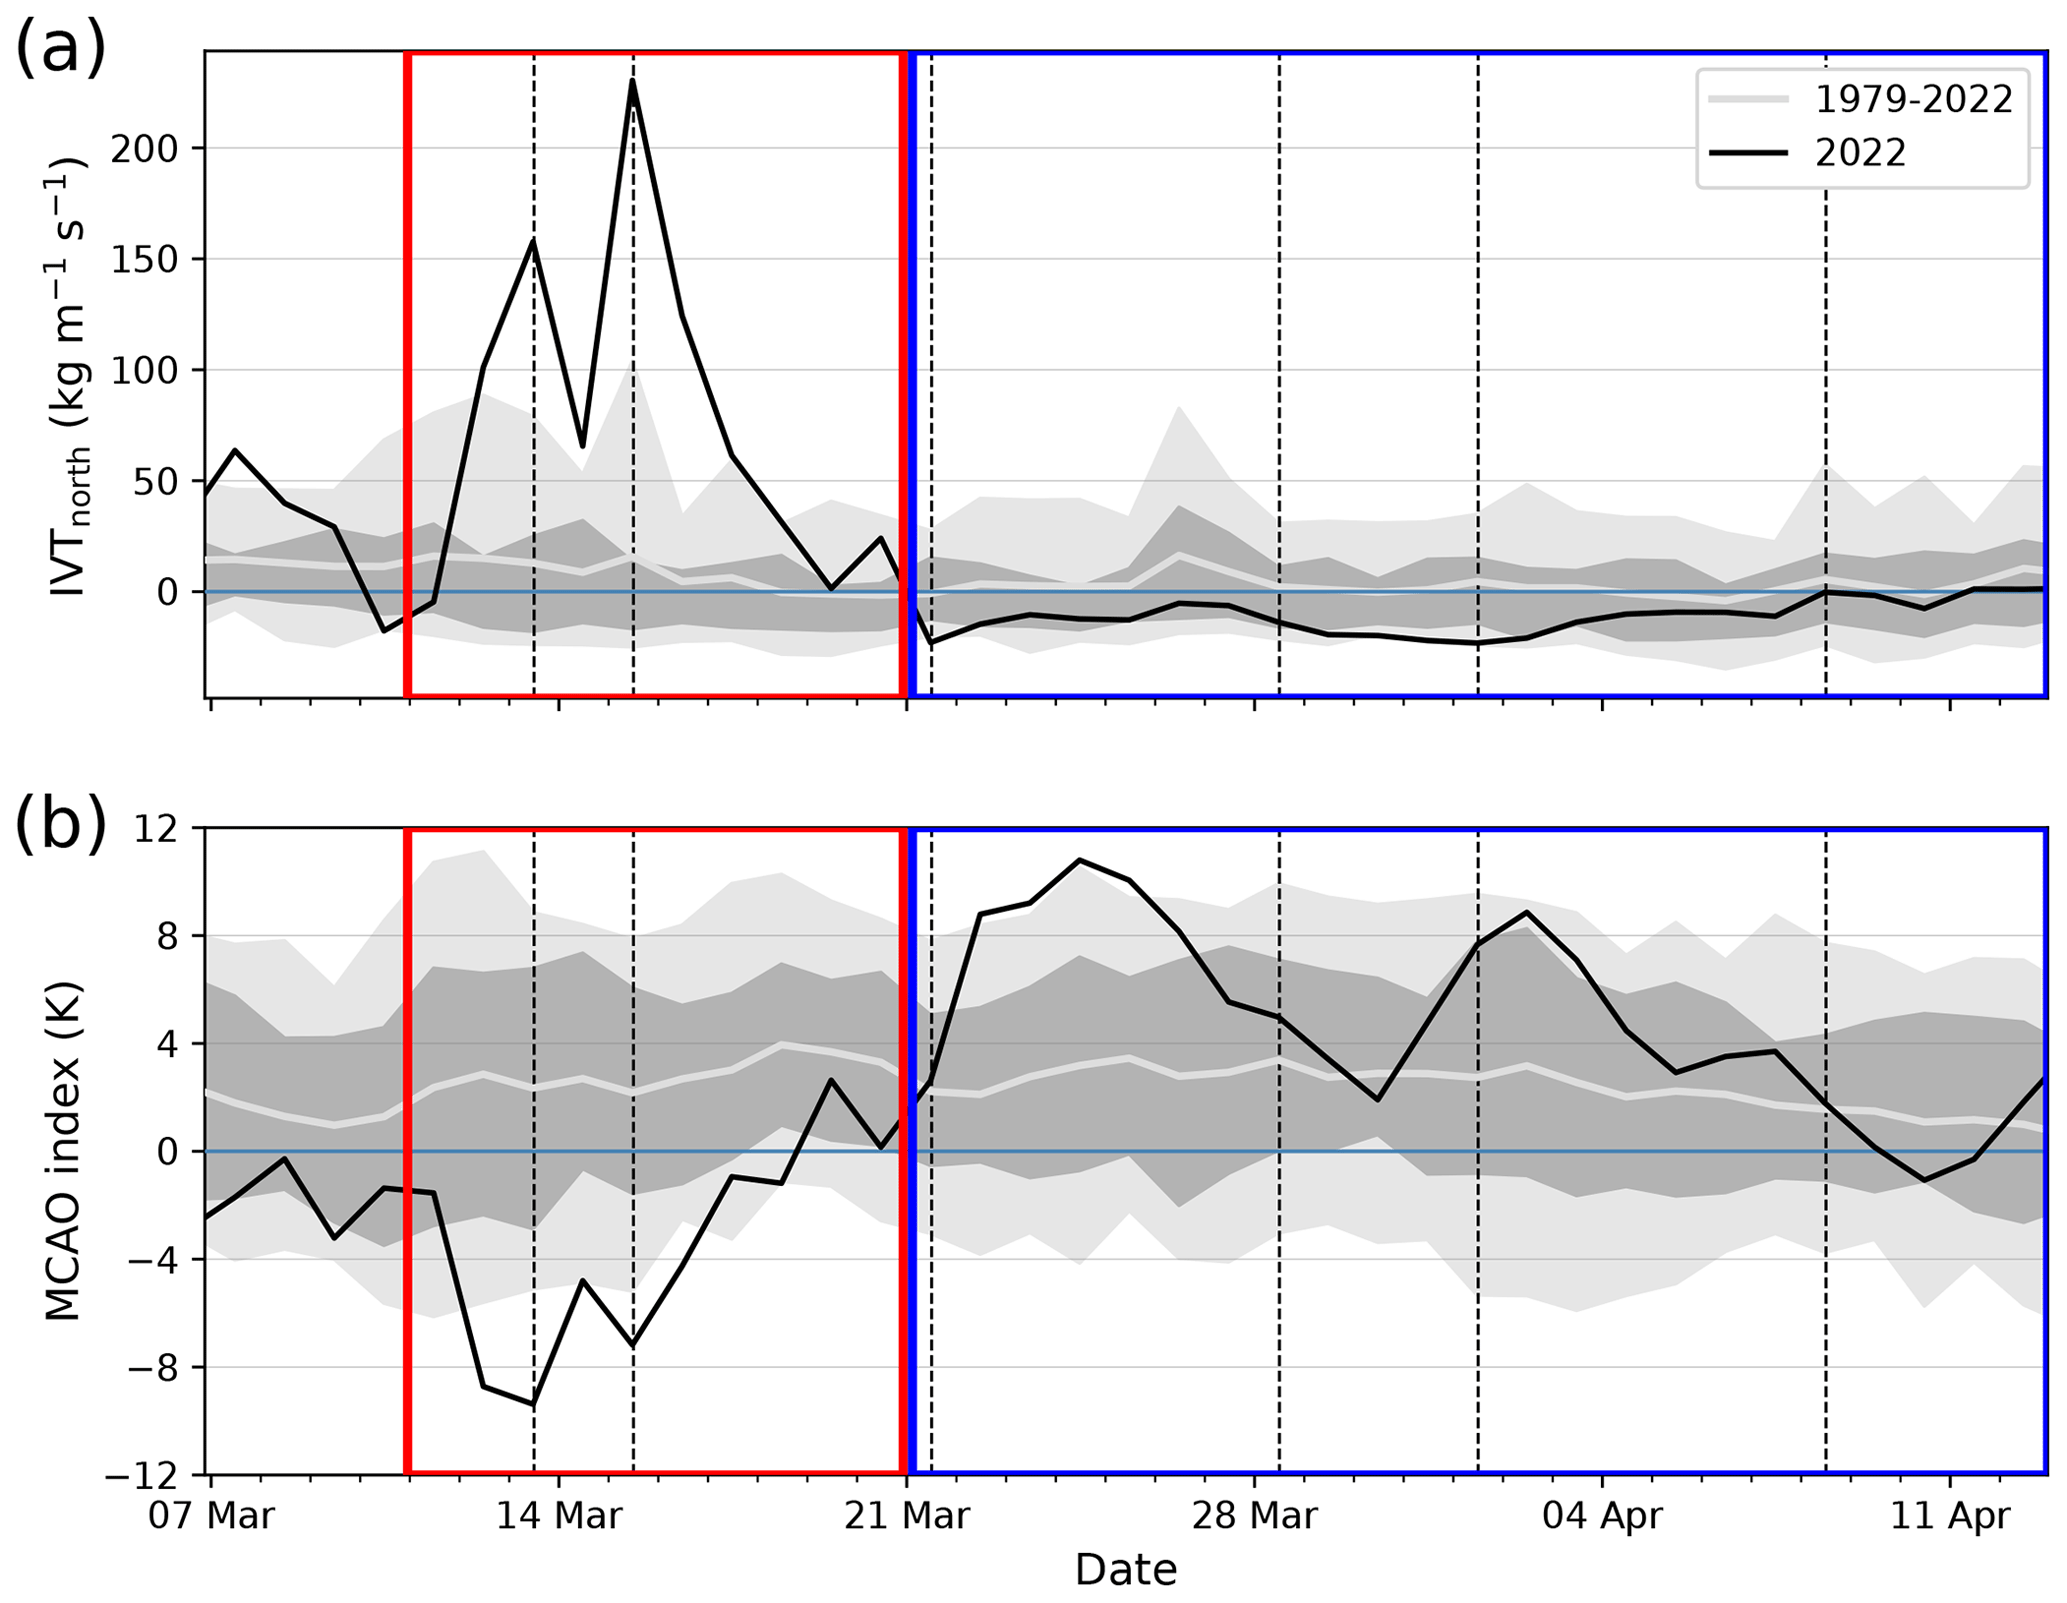
Figure 6Daily mean time series of the (a) northward component of integrated water vapor transport (IVTnorth) and the (b) marine cold air outbreak (MCAO) index (M) based on ERA5 and averaged over the central region for HALO-(𝒜𝒞)3 (black line). The mean as well as the 10th–90th and 25th–75th percentiles of the climatology (1979–2022) are illustrated as grey lines and light- and dark-grey shadings. The red (blue) box indicates the warm (cold) period dominated by moist and warm air intrusions (marine cold air outbreaks). Vertical dashed black lines mark the days shown in Fig. 5.
To answer what caused the occurrence of the strong WAIs, we analyze the general circulation pattern. A high-surface-pressure system over Scandinavia was connected to a ridge at 500 hPa geopotential height, resulting in a blocking situation (Fig. 5a, b). The blocking is evident in Fig. 7b (and also Fig. B1a in Appendix B), showing the strong anomalies of more than 10 hPa in the MSLP field over the whole warm period with lower pressure over Greenland and the central Arctic and higher pressure over Scandinavia. The strength of the pressure anomalies over Scandinavia suggests the presence of an unusual blocking situation. Intense WAIs are often connected to blocking situations over the eastern border of a large basin (here, the North Atlantic), redirecting cyclones northward as the typical eastward propagation is blocked (Woods et al., 2013). Consequently, warm and moist air masses originating from the North Atlantic were transported towards the Fram Strait, driven by several low-pressure systems that formed between Iceland and eastern Greenland. All days of the warm period passed the criteria for WAI occurrence (Sect. 2), and from 12 to 17 March IVTnorth exceeded the 90th percentile of the ERA5 climatology on each day (Fig. 6a).
Not surprisingly, temperatures at 2 m and 850 hPa show positive anomalies over all the domains during the warm period (Fig. 7e, h). However, with far above 8 K, the strongest 2 m temperature anomalies occur over sea ice surfaces. Together with the weaker positive anomaly at 850 hPa (up to 7 K in the three domains), this demonstrates the decreased stability of the lower atmosphere during this period over sea ice. The warm period was also moister than average, as indicated by the positive IWV anomalies over all the domains (Fig. 7k). Note that, although the highest IWV anomalies occurred in the southern region, the relative effect increases with higher latitudes as IWV mean values generally decline towards the north along with the decreasing temperatures. The highest relative IWV anomalies (up to 90 %) occurred over sea ice northwest and northeast of Svalbard (not shown). Note that this latitudinal effect also makes it difficult to diagnose ARs based on IWV only.
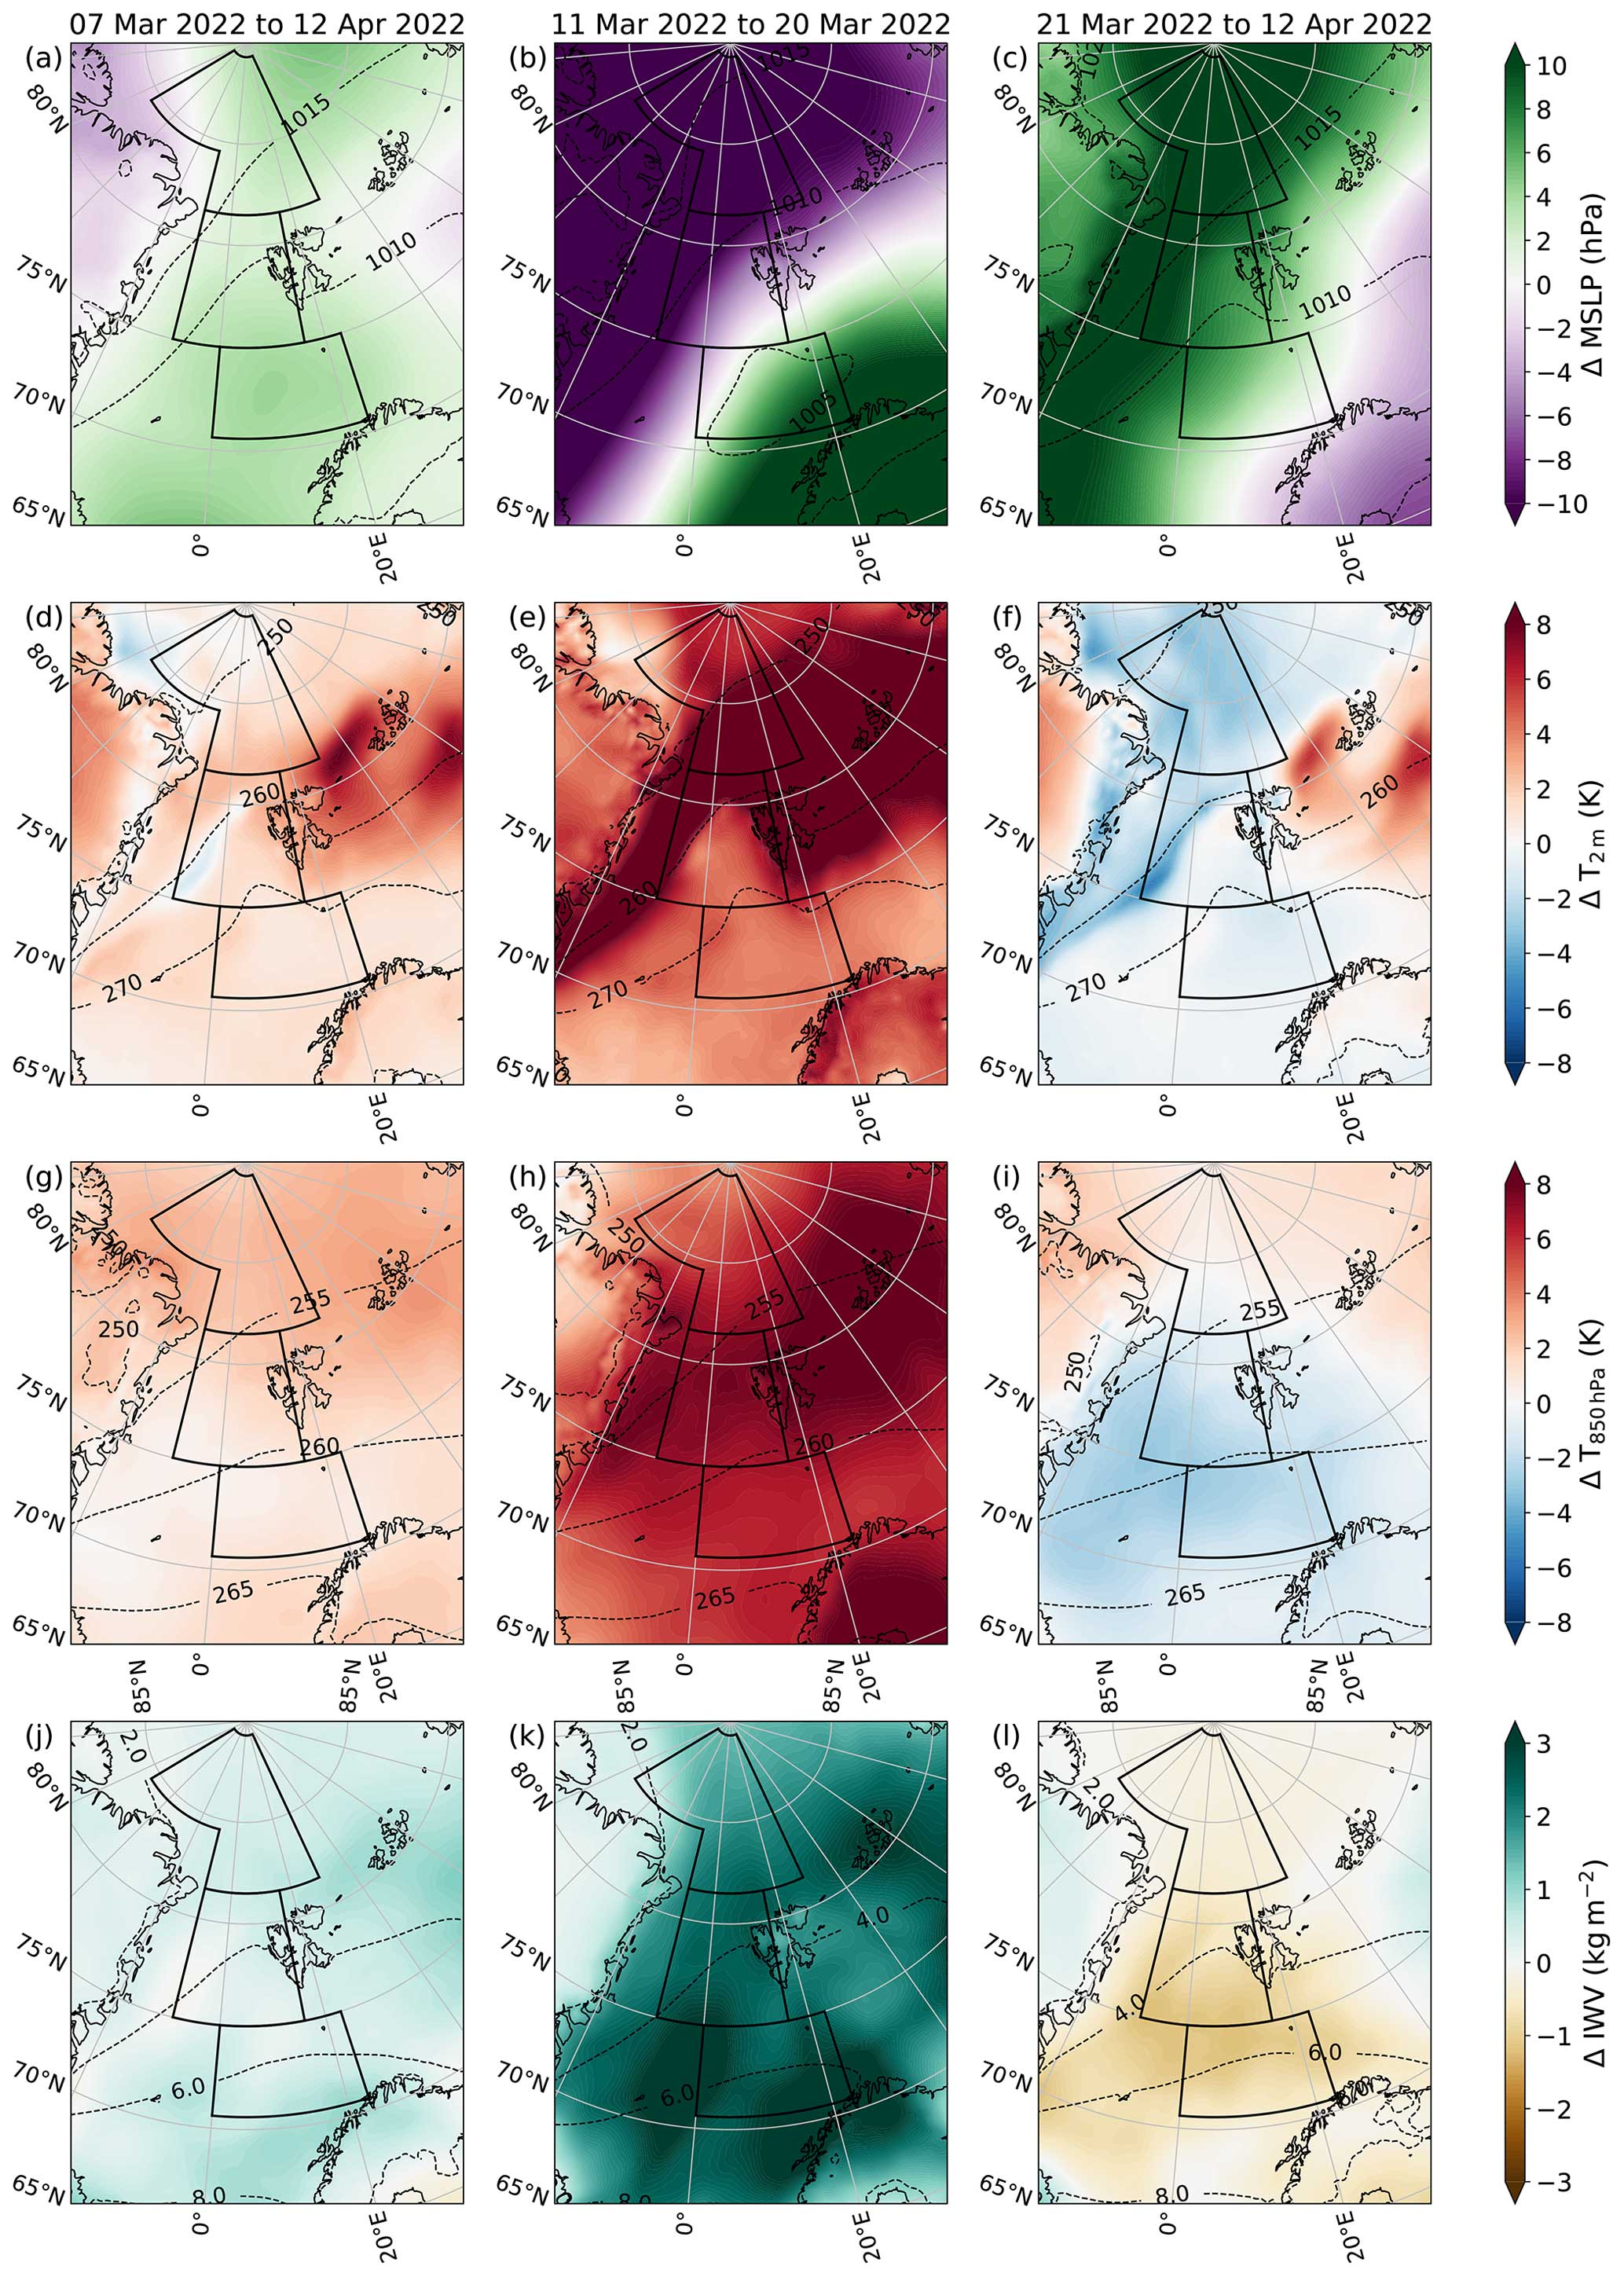
Figure 7From top to bottom: anomaly maps of mean sea level pressure (MSLP), 2 m temperature (ΔT2 m), 850 hPa temperature (ΔT850 hPa) and integrated water vapor (ΔIWV) based on ERA5 for the entire campaign (a, d, g, j), the warm period (b, e, h, k), and the cold period (c, f, i, l). The long-term mean (1979–2022) is subtracted from the mean of the respective time period. Dashed black isolines describe the long-term climatology for the respective period in each panel. The three measurement regions (shown in Fig. 1) are illustrated as black boxes.
The two AR events detected at Ny-Ålesund also affected the entire measurement area of HALO-(𝒜𝒞)3. However, the timing might be different, depending on the exact location. AR I passed through the measurement regions on 12–14 March (Figs. 2b and 5a). In the northern domain, IWV reached its campaign maximum (8 kg m−2) on 13 March and declined afterwards, while the 850 hPa and 2 m temperature in the northern domain continued to increase until the following day (Fig. 4c–e). AR II, which arrived on 15 March (Fig. 5b), had slightly less IWV over the central domain (Fig. 4e). This shows that Ny-Ålesund is not representative of the whole region, because here AR II had the highest IWV. The strong northward moisture transport related to these ARs can be seen in area averages of IVTnorth, which reached 225 kg m−1 s−1 due to AR II in the central domain (Fig. 6a).
We compare the strength of the ARs during HALO-(𝒜𝒞)3 to the long-term climatology in Fig. 8. For this purpose, the mean IVT over the detected AR area and the AR's central latitude are shown in relation to all 6-hourly ERA5 time steps since 1979. Note that a slightly different region over the North Atlantic and Arctic oceans was selected to extend the view southwards to cover the major pathways of ARs (Guan and Waliser, 2017; Nash et al., 2018). The number of strong AR events decreases meridionally (Fig. 8) because of two effects: firstly, along their northward propagation, ARs generally decline in intensity. Secondly, within the Arctic Circle, the likelihood of new AR formation strongly decays, as the moisture uptake from the ocean is substantially reduced (Papritz et al., 2022).
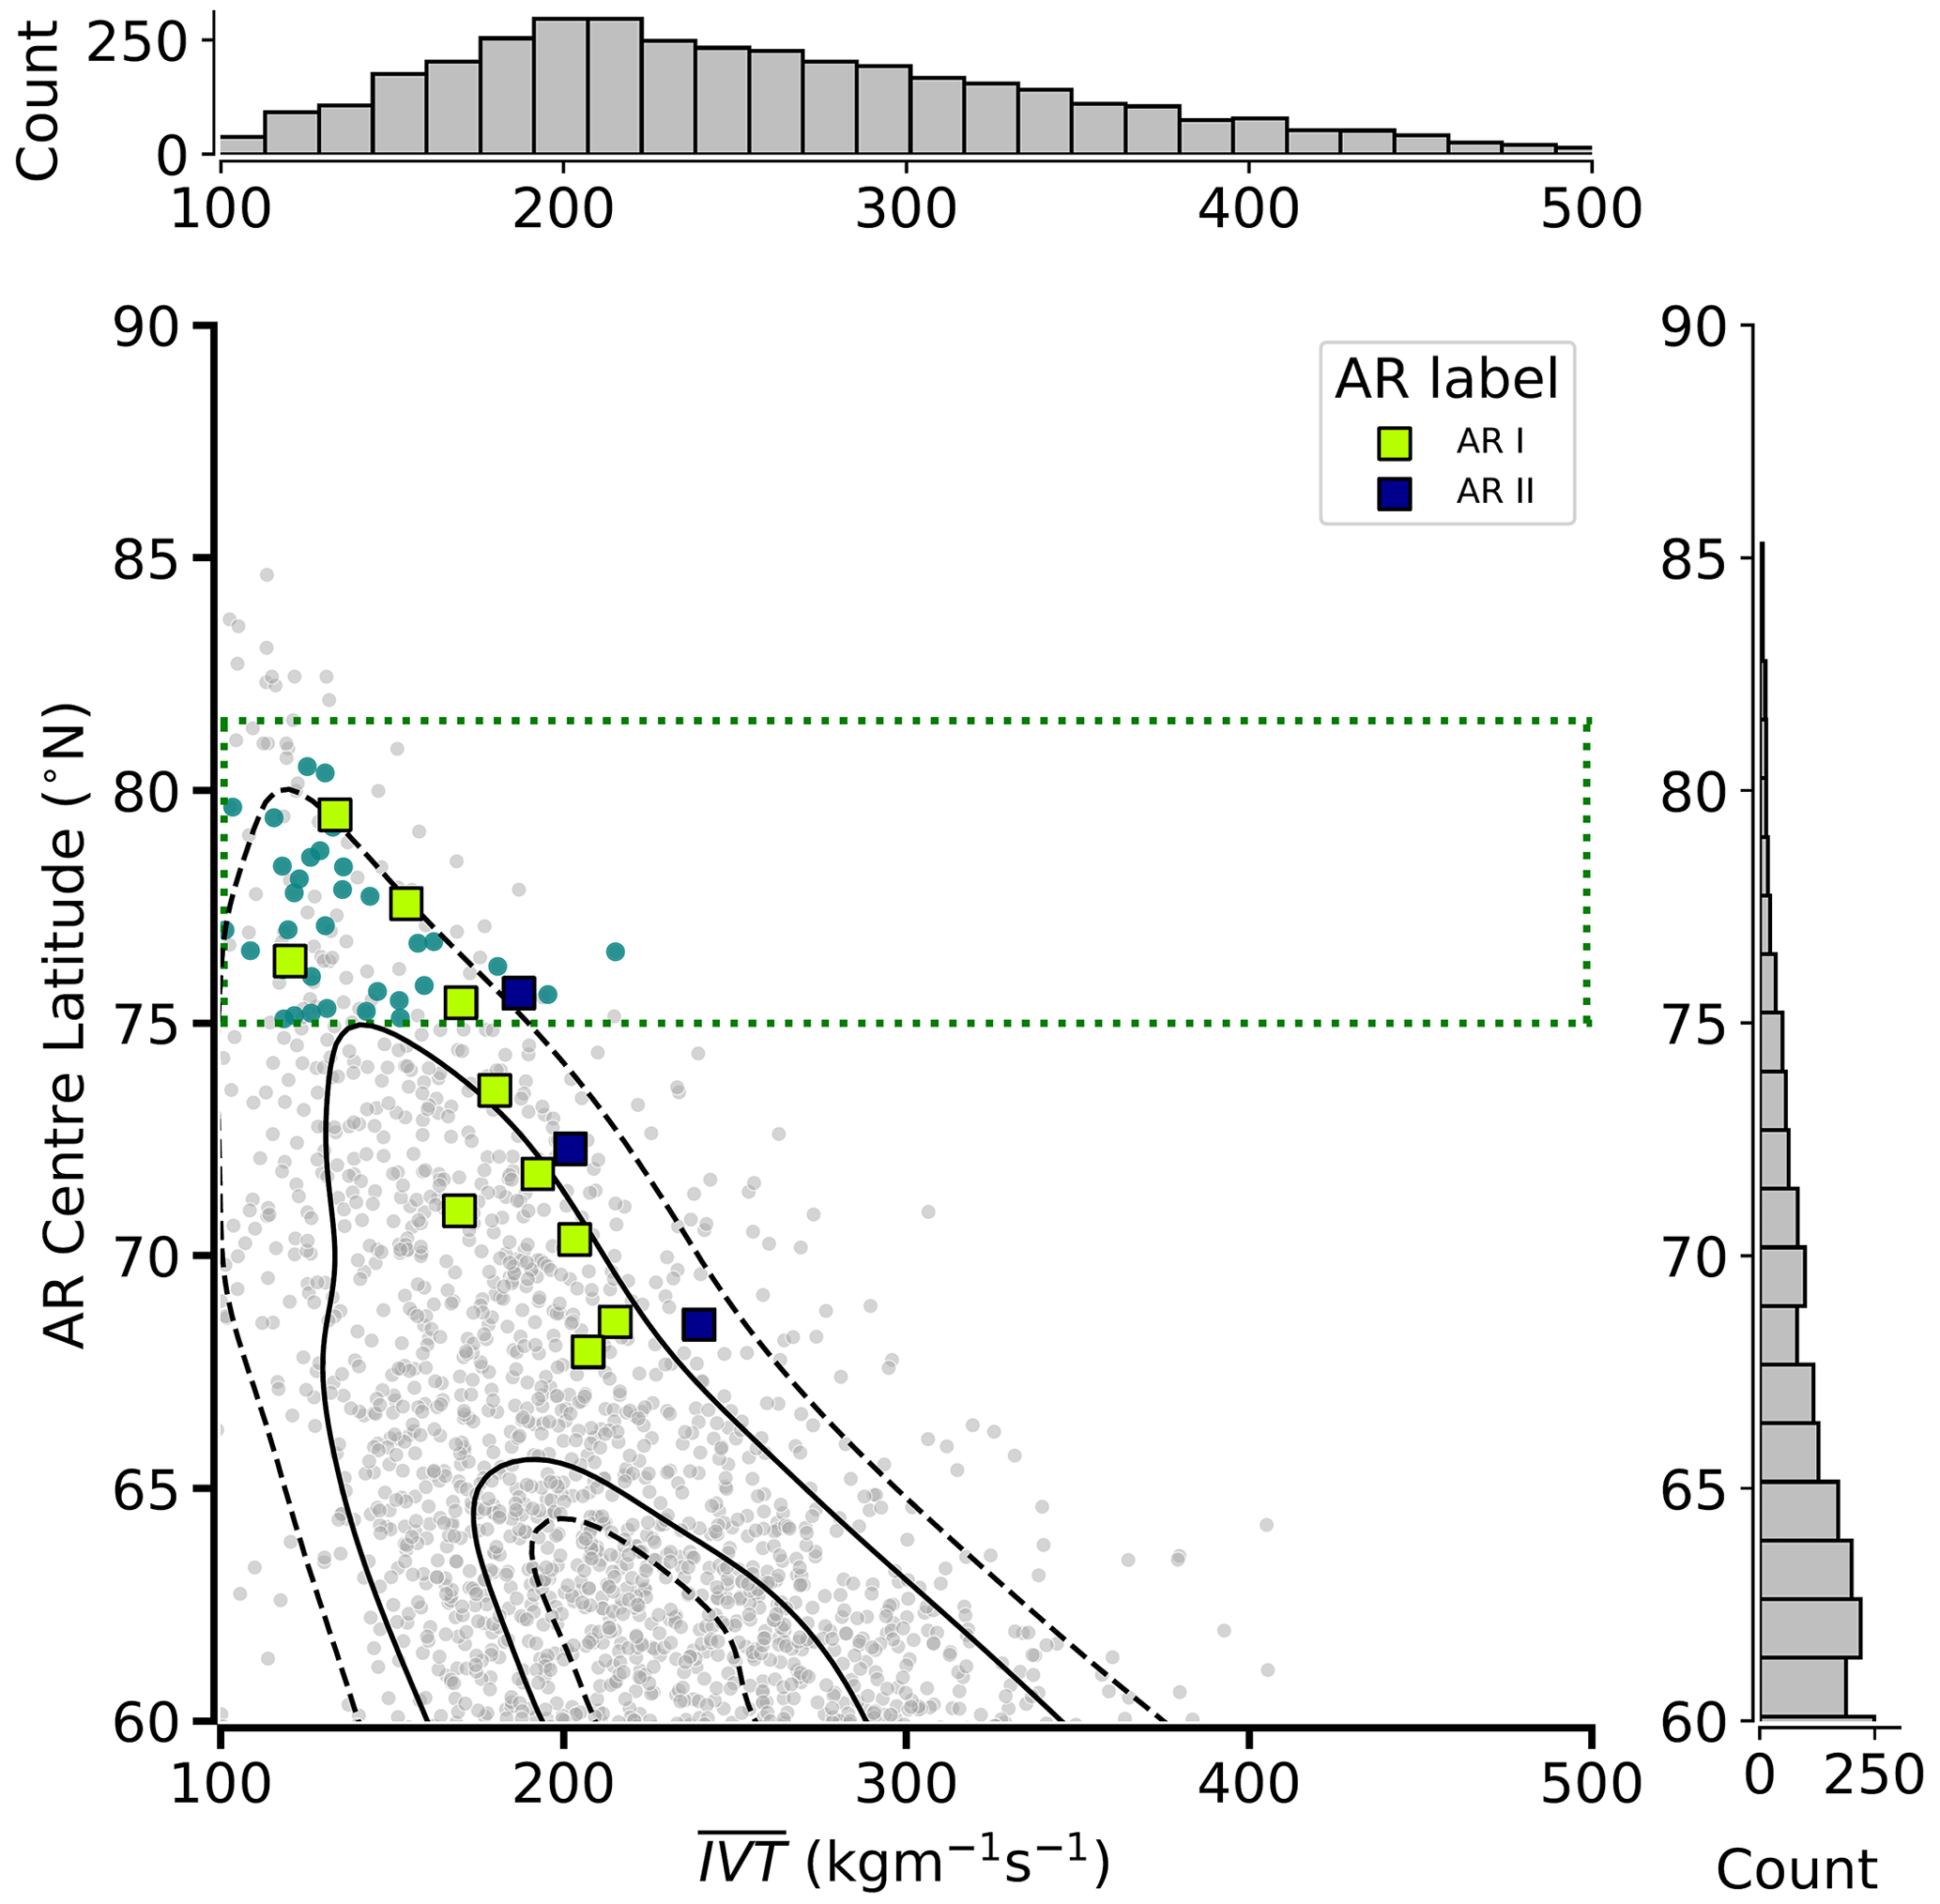
Figure 8Six-hourly climatological (1979–2022) distribution of central latitudes of atmospheric rivers (ARs) as a function of mean AR integrated water vapor transport (IVT) using an ERA5-based AR catalog based on Guan and Waliser (2015). The analyzed area covers 60–90° N and 60° W–40° E. Blue dots mark ARs whose center was within the latitudes and longitudes of the central domain. Cases categorized as ARs during HALO-(𝒜𝒞)3 are illustrated by colored squares. Black (dashed) lines indicate the 25th and 75th (10th and 90th) percentiles of a kernel density estimation to visualize the shape of the histogram. The green rectangle marks the latitudes of the central domain.
AR I and AR II both represent strong cases in terms of mean IVT as they partly lie outside the 25th percentile in latitude–IVT space (Fig. 8). At its northernmost position with a central latitude of 80° N, AR I had a stronger mean IVT than 90 % of all ARs in the climatology. However, AR II was characterized by even stronger moisture transport but did not reach as far north as AR I. When AR II was at its northernmost position (centered at 76° N), its area-averaged IVT was just below 200 kg m−1 s−1 and therefore also higher than 90 % of all ARs in the climatology (Fig. 8). The maximum IVT of AR II (meridional and zonal) slightly exceeded 400 kg m−1 s−1 on 15 March in the central region (Fig. A1 in Appendix A). HALO's dropsonde measurements showed a maximum IVT of 490 kg m−1 s−1 on 15 March, suggesting that ERA5 underestimates the moisture flux at the local scale. As all AR events had meridionally elongated structures, the outflow region reached far up to the central Arctic, while their centers were located at 68–80° N (Fig. 8). During their poleward propagation, the moisture transport decreased, so that they no longer fulfilled the detection requirements.
The northward transport of warm and moist air was associated with anomalous amounts of precipitation (Fig. 9). In particular, when the ARs made landfall in Scandinavia, Svalbard, and eastern Greenland, strong anomalies of up to 8 mm d−1 compared to the climatology were observed. The strongest anomalies found on the eastern coast of Greenland relate to 6 times higher precipitation compared to the climatology. For Svalbard, the ERA5 data are in line with the record precipitation measured at Ny-Ålesund (Fig. 2) coming from AR II. The area of increased precipitation reaches up to the North Pole, where precipitation is enhanced by more than a factor of 2.
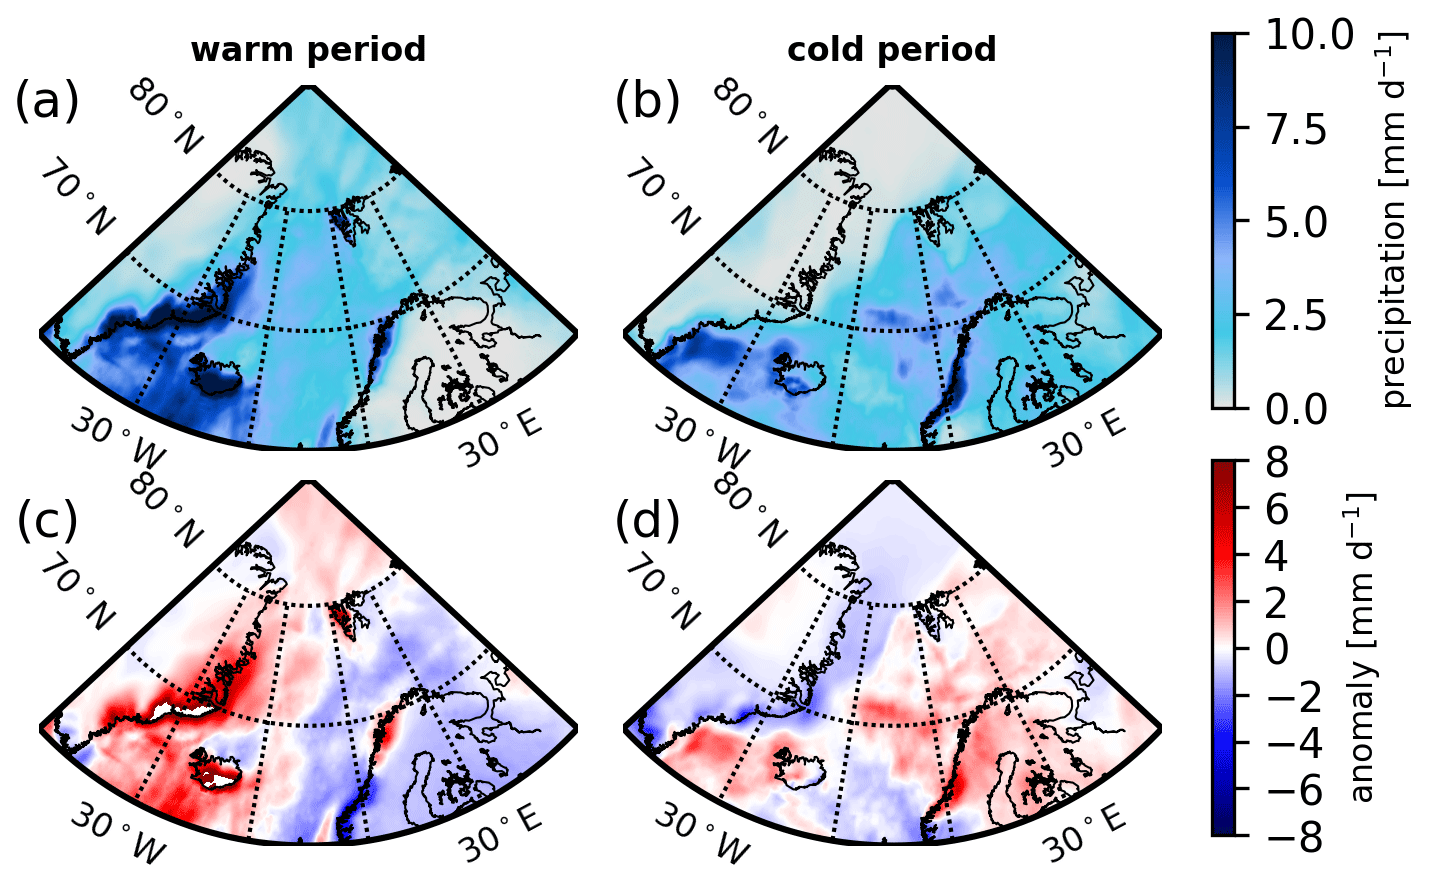
Figure 9Hourly averaged total precipitation (sum of snowfall and rain rate) (mm h−1) (a, b) and absolute deviations from the climatology (c, d) derived from ERA5 for (a, c) the warm period and (b, d) the cold period.
The phase of the precipitation is highly important for its climate effect, and the transition of Arctic precipitation from snowfall to rain is heavily discussed (Serreze et al., 2021). While we note the difficulties of correctly differentiating the precipitation phase, it is important to note that, northwest of Svalbard, ERA5 showed record-breaking rainfall connected with near-surface temperatures above zero. Liquid precipitation at high latitudes over sea ice was also observed by the cloud radar on board HALO, as we detected a distinct bright band in the linear depolarization ratio at about 0.5–1 km height on 13 March (Fig. 10). Thus, the observations confirm the presence of liquid precipitation, at least in some regions over sea ice. This motivated us to examine the impact of this AR on the sea ice later on (Sect. 6).
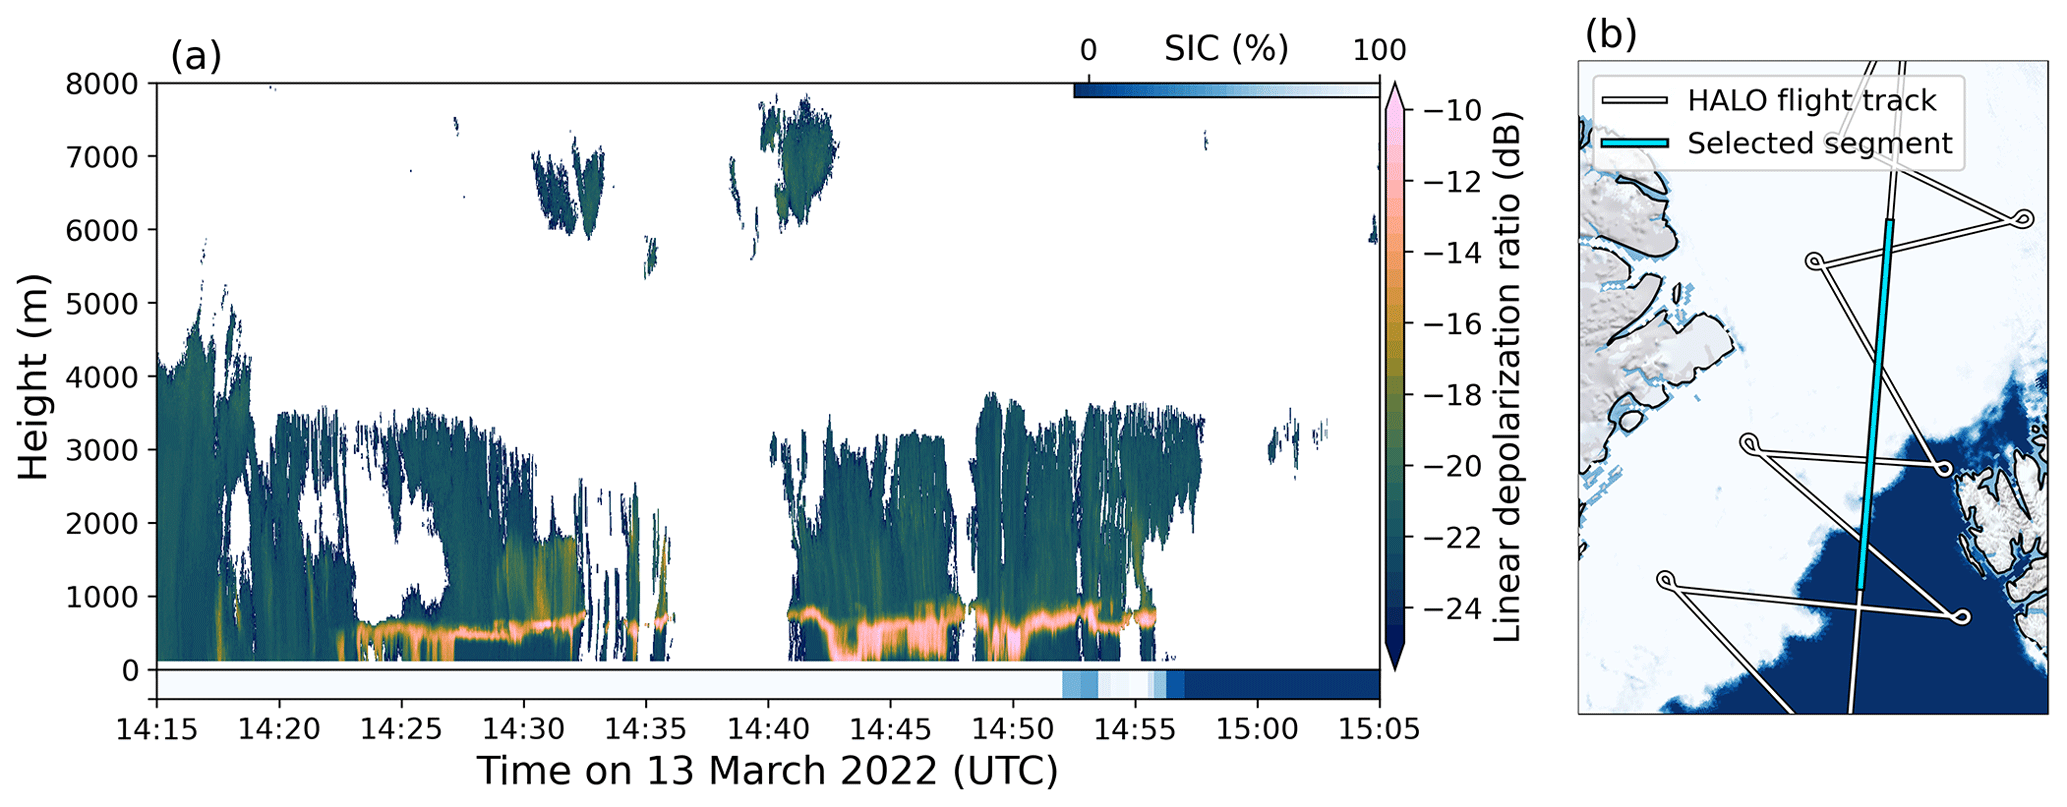
Figure 10(a) Linear depolarization ratio measured by HALO's radar during research flight 3 on 13 March 2022 and the collocated sea ice concentration (SIC) from AMSR2, which is included in the published radar data. (b) Map showing the flight track (white line with black outline) and the sea ice concentration from the MODIS–AMSR2 product. The segment of the flight track shown in panel (a) is highlighted in blue.
In summary, the warm period observed during HALO-(𝒜𝒞)3 featured ARs with averaged IVT values higher than 90 % of all ARs in the climatology. This transport was related to a blocking event affecting the Arctic up to the North Pole with heat and anomalously high precipitation, including record-breaking rainfall rates over the sea ice northwest of Svalbard.
The warm period was followed by a cold and dry period from 21 March until the end of the campaign, where IVTnorth (M) was almost exclusively negative (positive) (Fig. 6). The transition from the warm to cold periods was initiated on 21 March, when an intense cyclone centered east of Svalbard began to draw cold air from the central Arctic into the Fram Strait (Fig. 5c), which caused snowfall on the western coast of Svalbard. In its aftermath, the MSLP anomaly reversed compared to the warm period, with positive values in the northwest and negative values in the southeast (Fig. 7c). Consequently, the southward flow of cold Arctic air led to cold and dry anomalies at 850 hPa over the open ocean (Fig. 7i, l).
Within the cold period, two periods of strong MCAO conditions (21–26 March and 1–2 April) were identified whose strength exceeded the 90th (25 March) and 75th (2 April) percentiles of the climatology (Fig. 6b). Under these strong MCAO conditions, we found the maximum values of turbulent surface sensible and latent heat fluxes, which coincided with the highest wind speeds and lowest temperatures of the cold period (not shown). Low-level cloud cover remained high in the central domain until 7 April, reflecting the presence of the convective boundary layer clouds typically associated with MCAOs. Interestingly, while most parameters have reversed anomalies compared to the warm period, precipitation in the central domain also shows a positive anomaly. ERA5 produces an extensive region of enhanced precipitation over open water, extending far east and being highest at the Scandinavian coast (Fig. 9).
To compare the MCAOs encountered in the cold period to the climatology, we apply a metric established by Knudsen et al. (2018) and characterize each event by its strength and duration in Fig. 11. Herein the duration is defined as the time the MCAO index stays above zero, and the strength is given by its maximum MCAO index M, as indicated in the time series of M in Fig. 11b. Note that we used the central domain for the computation of M, while Knudsen et al. (2018) considered a smaller area that lies within our central domain.
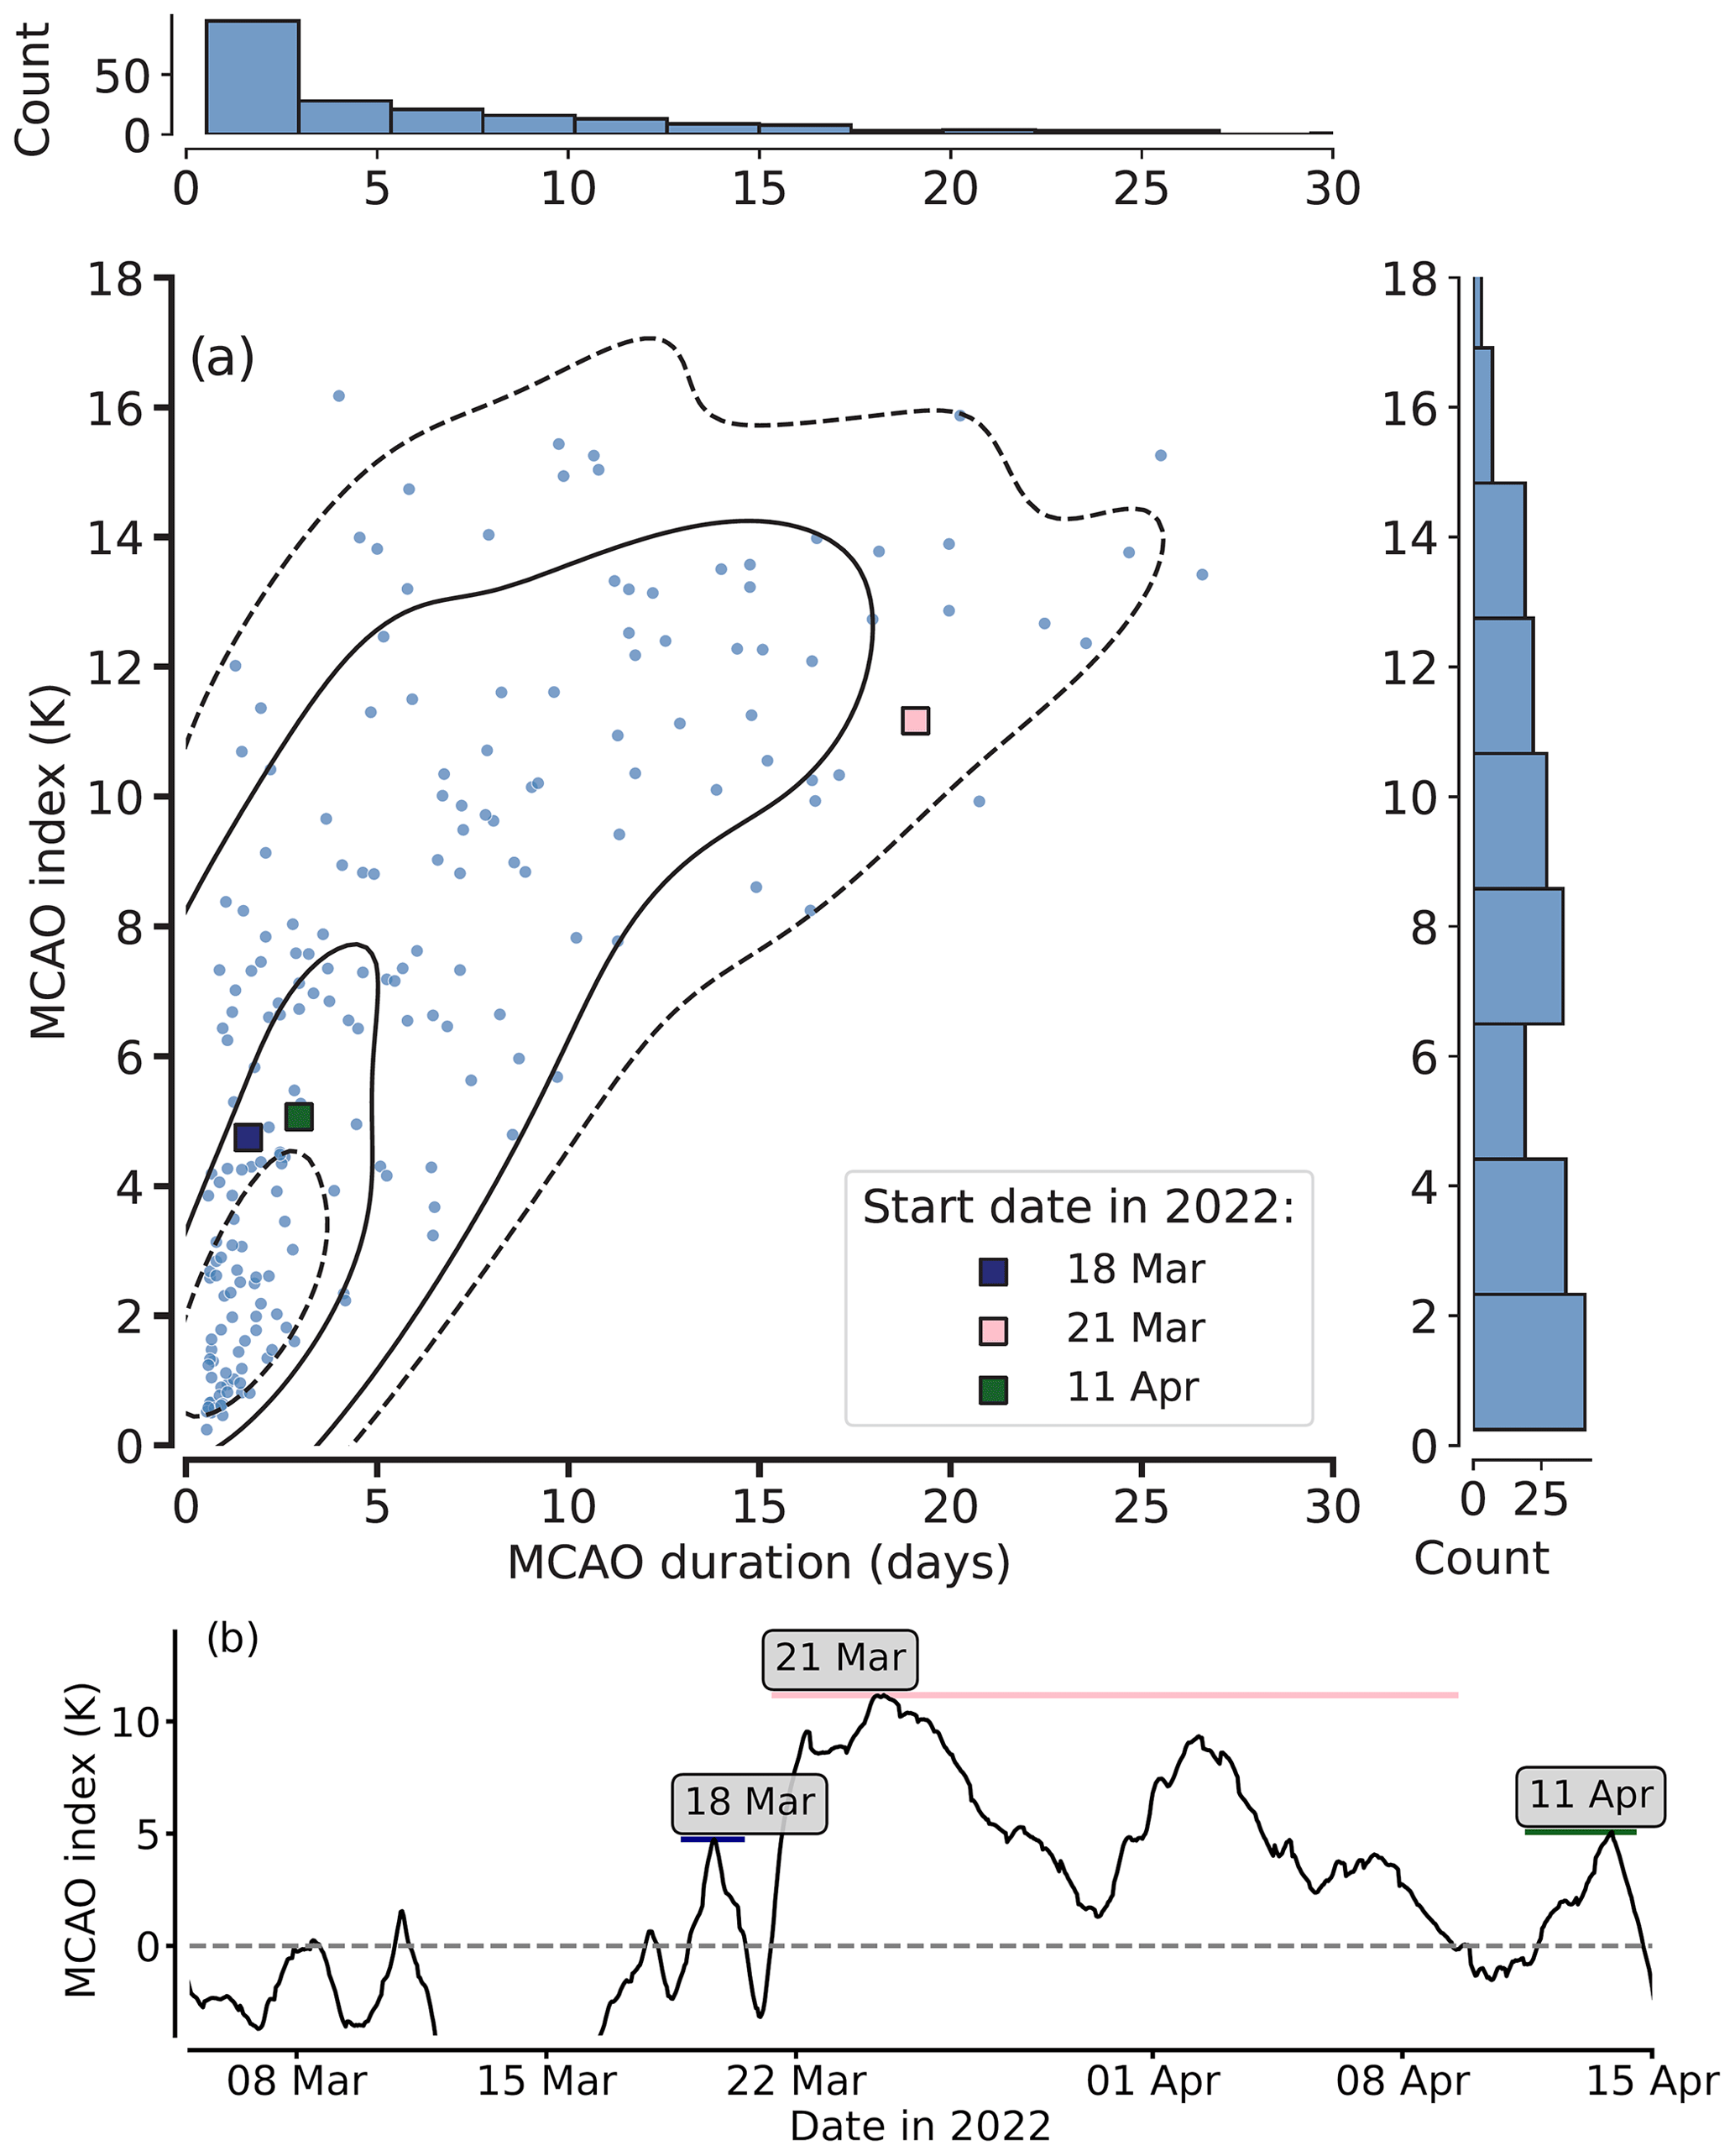
Figure 11(a) Two-dimensional histogram showing the ERA5-based duration and strength of MCAOs in the central domain for the period 1979–2022. Cases categorized during HALO-(𝒜𝒞)3 are illustrated by colored squares, and the legend entries of these cases indicate the start date. Black (dashed) lines indicate the 25th and 75th (10th and 90th) percentiles of a kernel density estimation to visualize the shape of the histogram. (b) MCAO index time series with higher temporal resolution and indicating the MCAO periods marked in panel (a).
The statistics over the long-term ERA5 climatology (Fig. 11a) generally show that longer MCAO events are also more intense (higher peak M). During the HALO-(𝒜𝒞)3 period, distinct MCAO events could be identified separated by short phases with M<0 K visible at high temporal resolution only. The first and third events, starting on 18 March and 11 April, respectively, were relatively short-lived (2–3 d) and had a moderate strength (M of about 5 K). Most notably, the second event, which started on 21 March after the passage of the strong cyclone, was unusually long (19 d) and had a maximum M of about 11 K. The longevity of the MCAO conditions can be explained by the persistence of low pressure over Scandinavia, the Barents Sea, and Russia and high pressure over Greenland and the central Arctic during the cold period (Fig. B1b in Appendix B). Analyzing the time series with hourly resolution (Fig. 11b), the 21 March MCAO event consists of multiple waves of strong MCAO conditions, which were associated with the presence of cyclones near Svalbard influencing the atmosphere over the Fram Strait (e.g., Fig. 5c, e, f). Lower-tropospheric winds were stronger and more northerly during the stronger MCAOs. When the cyclones dissipated or propagated away from the area, winds were weaker and the MCAO strength decreased (e.g., Fig. 5d).
Since 1979, only 9 of the 179 events over the HALO-(𝒜𝒞)3 period have had a longer duration.
The different atmospheric conditions likely affected the sea ice conditions in the measurement area. To understand the impact on sea ice, we examine the spatial distribution of SIC before (9–11 March) and during (14–16 March) the WAIs and ARs as well as after the MCAO period (10–12 April), as shown in Fig. 12a–c. SIC was > 90 % in almost the entire northern region in the first period (Fig. 12a). In the central region, the sea ice covered 30 %–40 % of the area with a southwest–northeast-oriented edge. The southern region was almost completely ice-free over the entire campaign duration (Fig. 12a–c).
The WAIs and ARs caused a reduction of SIC in the northwestern part of the central region, resulting in the lowest SIC values of the entire campaign period (Fig. 12b, d). While the main sea ice boundary stayed at the same location, the SIC in the marginal ice zone declined. SIC was below the climatological mean but remained within the 10th–90th percentiles. Furthermore, an unusually large polynya opened from north of Svalbard to Franz Josef Land, which resulted in the below-average static stability and stronger turbulent surface heat fluxes during the cold period in this region (Fig. 12b). We assume that ice dynamics related to strong winds caused the SIC decrease in the central region, but ice melt cannot be excluded either because temperatures were above freezing and liquid precipitation was observed over sea ice (Sect. 4). Rapid ice melt has been attributed to warm air advection and induced increases in heat flux in summer (Tjernström et al., 2015; Woods and Caballero, 2016). Liquid precipitation on snow alters the signal of the microwave radiometry and increases the uncertainty of SIC products (Stroeve et al., 2022; Rückert et al., 2023). However, SIC reduction was obvious in visual satellite images as well (e.g., NASA Worldview, not shown). After the WAIs, the sea ice conditions recovered as temperatures fell below the freezing point, and northerly winds were established during the MCAOs (Fig. 12c, d). The polynya was also closed again, mostly due to sea ice transport from the central Arctic.
With respect to the long-term climatology, the SIC during HALO-(𝒜𝒞)3 was mostly above the climatological mean in our central domain (Fig. 12d). The positive SIC anomaly was related to a further eastward expansion of the sea ice off Greenland, which overlaps well with the negative 2 m temperature anomalies shown in Fig. 7d, f. In contrast, the western coast of Svalbard used to be covered by ice in the climatology but was completely ice-free during HALO-(𝒜𝒞)3. Similarly, southwest of 75° N and 0° E as well as northeast and southeast of Svalbard, SIC anomalies were negative (Fig. 12e), in line with the strongest warm anomalies of the campaign.
Note that uncertainties of the derived SIC in the marginal ice zone are especially large as a result of temporal and spatial interpolation (smearing uncertainty) and so-called weather filters. Weather filters remove the atmospheric contribution from the satellite signal to remove false sea ice in open-water regions but run the risk of removing true sea ice as well, especially in the marginal ice zone (MIZ). This mainly affects the central region, where the estimated uncertainties of the OSI–SAF SIC product (total standard uncertainty) can reach up to 40 % at the ice edge, mostly due to smearing uncertainty and different satellite footprints at different frequency channels.
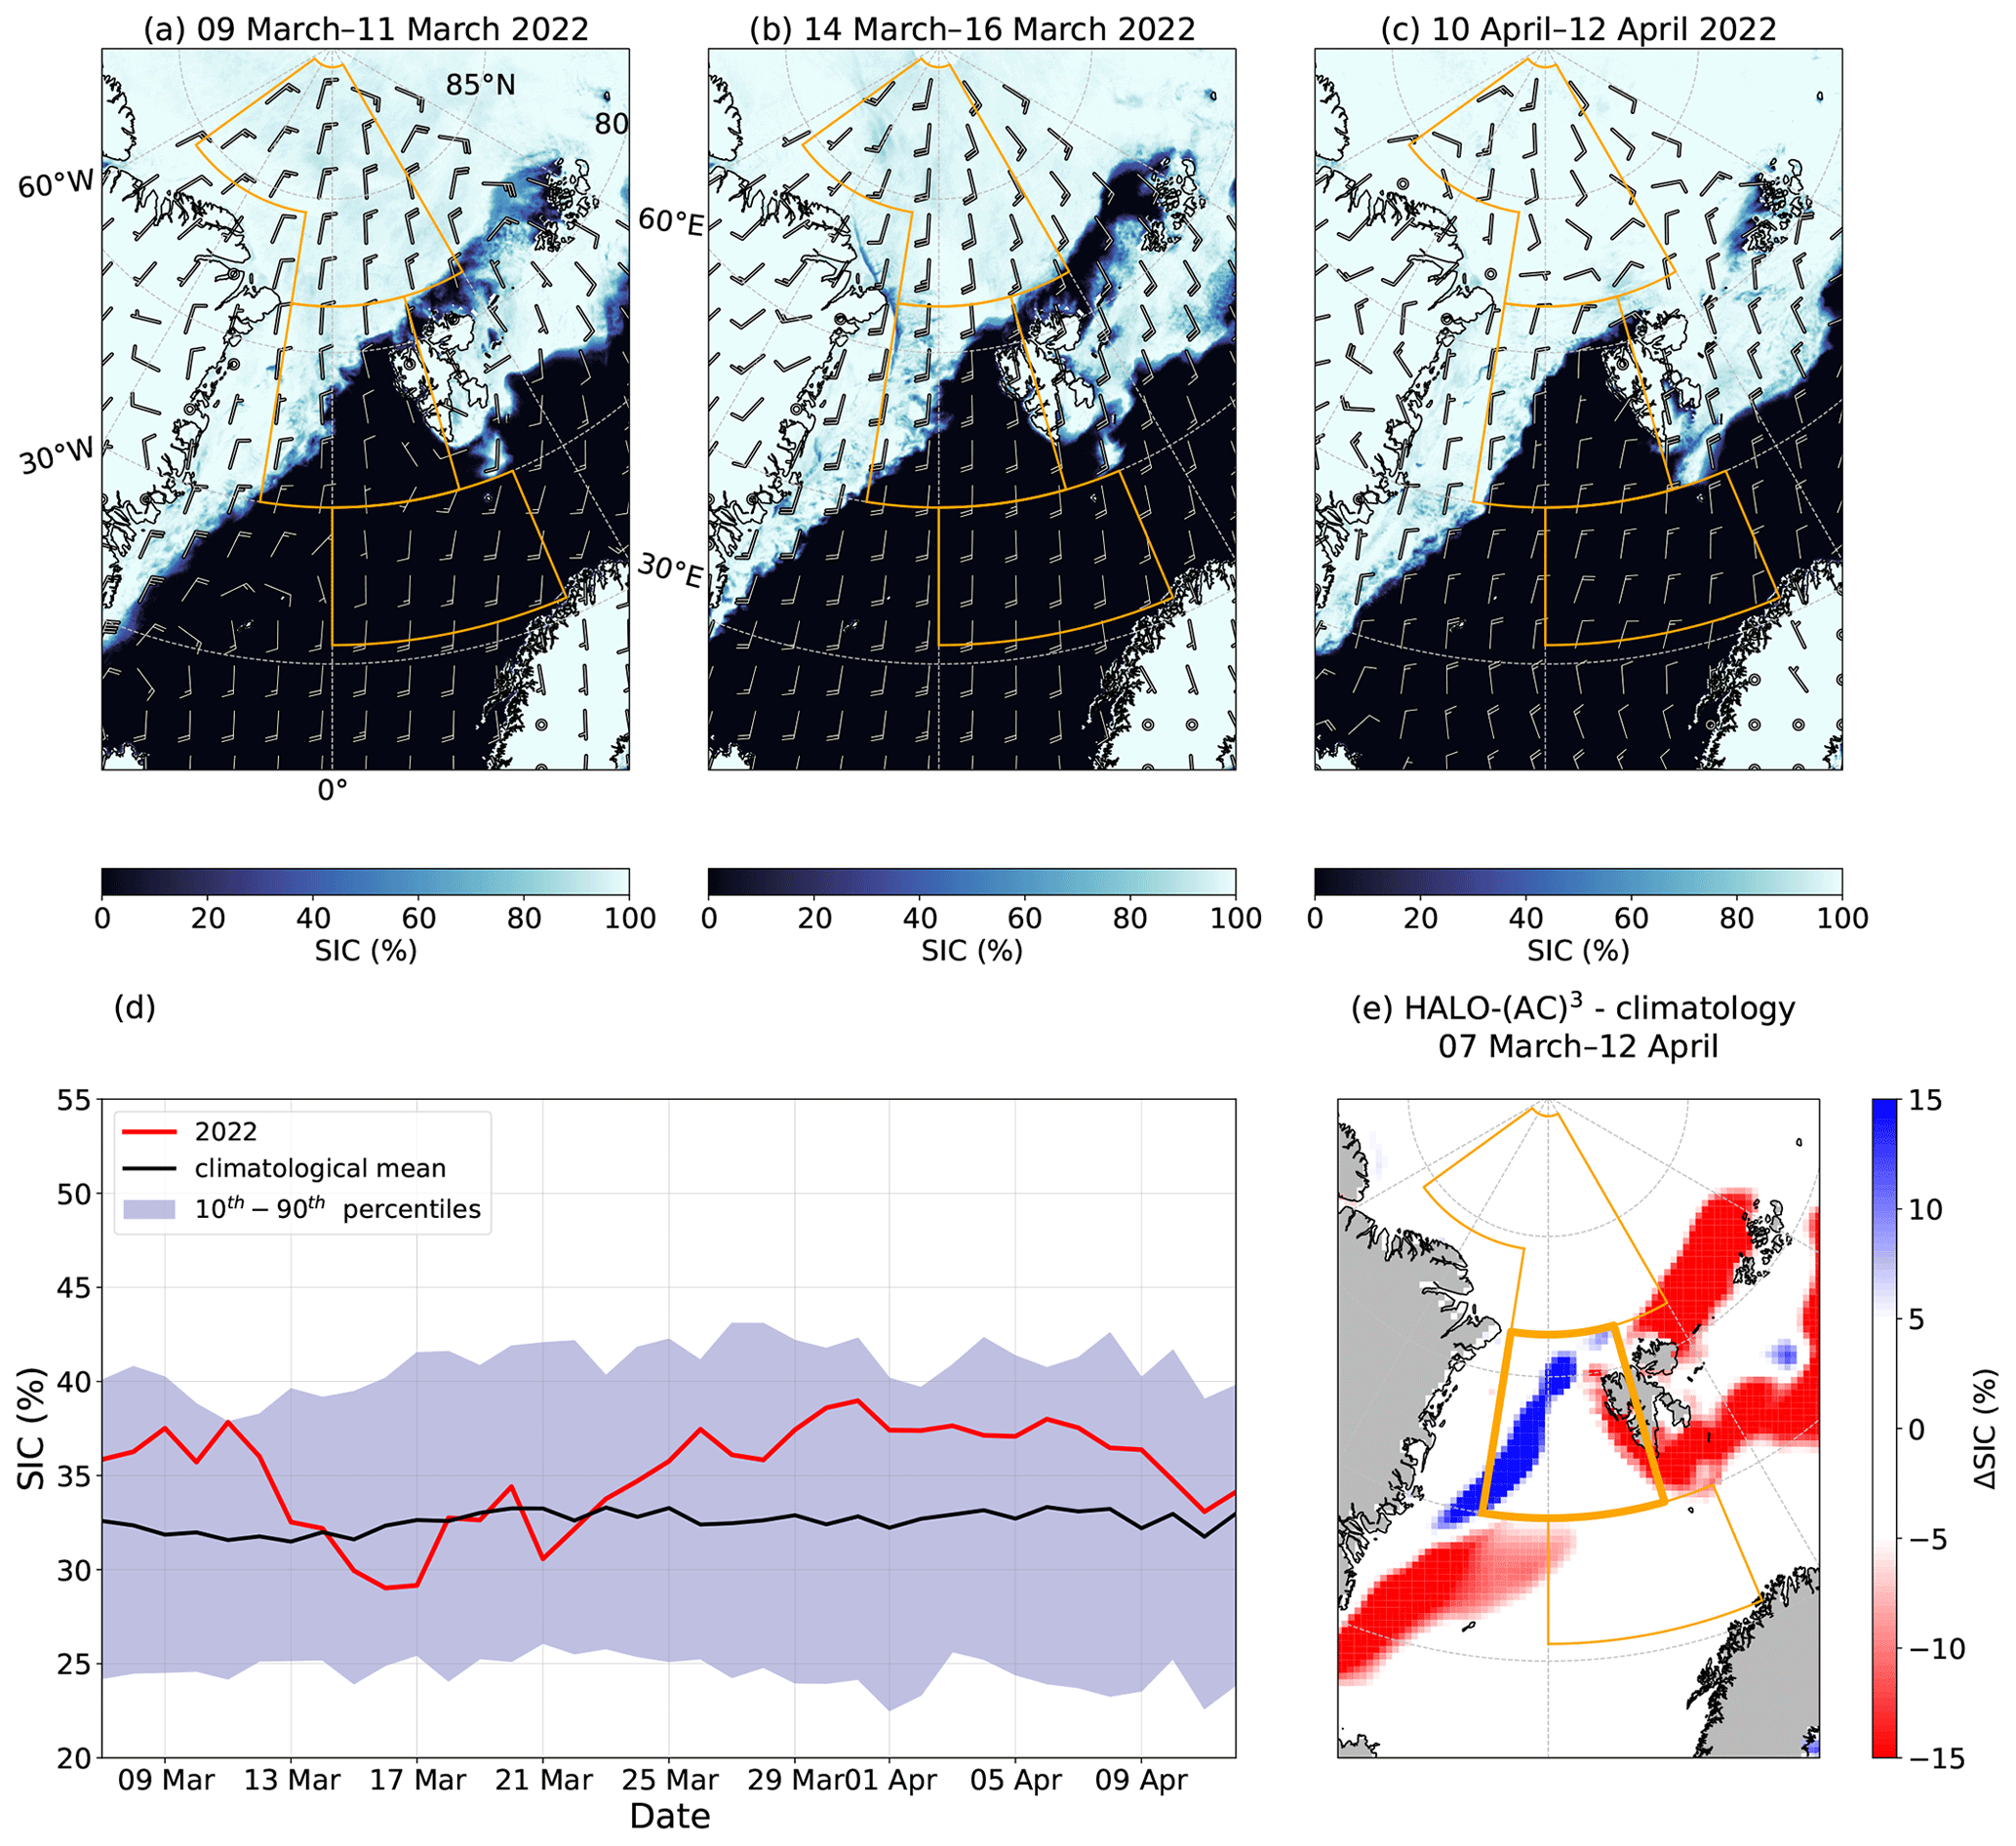
Figure 12Average SIC from the MODIS–AMSR2 product at 1 km grid resolution and 10 m wind speed (in knots) from ERA5 for (a) 9–11 March (prior to the first AR event), (b) 14–16 March (during the second AR event) and (c) 10–12 April (at the end of the campaign). Short (long) wind barbs represent wind speeds of 5 (10) kn. (d) SIC time series averaged over the central region for the campaign period as well as the mean and 10th–90th percentiles of the 1979–2022 climatology. (e) SIC anomalies from the climatological mean averaged over the entire campaign period. Note that only differences larger than 5 % are considered due to the uncertainties of the satellite product in the marginal ice zone. Data for panels (d) and (e) are from the OSI–SAF sea ice concentration climate data record.
In this study, we analyzed the atmospheric and sea ice conditions during the HALO-(𝒜𝒞)3 campaign, whose focus lies on studying transformation processes of air masses on their way into and out of the Arctic. The campaign took place in the North Atlantic sector of the Arctic from 7 March to 12 April 2022. Within this area, we defined three domains over which we investigate whether the conditions were well suited for the campaign's research objectives. The central domain, which lies in the marginal sea ice zone west of Svalbard, represents the area with the highest research flight activity of the campaign. For our analysis, we relate the conditions during HALO-(𝒜𝒞)3 to the long-term record of Ny-Ålesund measurements, ERA5 reanalysis, and satellite-derived sea ice conditions.
The radiosonde and surface observations at Ny-Ålesund showed two main periods with different atmospheric conditions. The beginning of the campaign was dominated by extremely warm and moist air masses, resulting in new maximum 2 m temperatures, record-breaking precipitation, and integrated water vapor (IWV) for March since the beginning of the measurements. The second half of the campaign was much colder and drier, with mostly clear-sky conditions at Ny-Ålesund because of orographic effects. Reanalysis data, which were shown to agree well with dropsonde measurements from HALO-(𝒜𝒞)3, confirmed these general conditions with northward transport of warm and moist air in the first part and southward flow of cold Arctic air in the second part of the campaign. Based on this clear temporal change in conditions, we divided the campaign into a warm period (11–20 March) and a cold period (21 March–12 April) and analyzed both in detail.
During the warm period, an atmospheric blocking situation diverted cyclones northwards into the Arctic, resulting in strong northward heat and moisture transports (moist and warm air intrusions, WAIs). Two WAIs were identified as atmospheric rivers (ARs). At their northernmost positions, both ARs were stronger than 90 % of all ARs at the latitudes of the central domain in the climatology. The ARs led to unusually high precipitation amounts at the coasts of Greenland and Svalbard. Over the sea ice northwest of Svalbard, the rainfall indicated by ERA5 was a record-breaking event for mid-March.
The cold period was initialized after the passage of a strong cyclone on 21 March. Northerly winds pulled cold and dry air from the central Arctic into the North Atlantic, resulting in marine cold air outbreaks (MCAOs). We identified three MCAO events separated by negative values of the MCAO index M. The second MCAO event, which started at the beginning of the cold period, lasted for 19 d, making it the 10th-longest MCAO event in the climatology. The strength of the MCAO conditions in the central domain was related to the cyclone activity in the vicinity of this region.
Despite the longer cold period, the entire campaign was on average warmer than the climatological mean. Thus, the short-lived ARs and WAIs dominated the anomaly signal, highlighting the importance of these events for the warming of the Arctic (Johansson et al., 2017). However, it must be noted that the ERA5 climatology may have systematic differences in 2022 compared to previous years as measurements from HALO-(𝒜𝒞)3 dropsondes were assimilated. Furthermore, the quality and quantity of satellite measurements to be included in the assimilation improved over the years. Nevertheless, due to the low density of observations in the Arctic, using reanalyses is currently a well-suited option for climatological comparisons.
Interestingly, precipitation was higher than the climatology for both periods, as MCAOs also led to enhanced precipitation in the Fram Strait. Precipitation associated with MCAOs has been discussed as being responsible for differences between climate models and observations (von Lerber et al., 2022). However, precipitation is also difficult to measure accurately, as MCAOs are mostly within the blind zone of satellite measurements (Schirmacher et al., 2023). Therefore, the quality of precipitation in reanalyses is of high interest. The detailed HALO-(𝒜𝒞)3 remote sensing and in situ measurements can help to further constrain the representation of precipitation, including its phase, in the reanalysis.
Finally, we looked at the sea ice conditions and how they changed due to the different circulation patterns during the campaign. Overall, the marginal ice zone in the Fram Strait had higher sea ice concentrations (SICs) compared to the climatological mean, while the regions around Svalbard had lower SICs. WAIs and ARs resulted in a reduction of SIC in the marginal ice zone below the climatological mean. The reduction was probably dominated by ice dynamics associated with the strong southerly winds, but melt was also possible because of temperatures above freezing. During the long period of MCAO conditions, the northerly winds and low temperatures led to a recovery of the SIC.
Compared to previous aircraft campaigns in the Arctic within (𝒜𝒞)3 that focused on the evolution of (mixed-phase) clouds (ACLOUD; AFLUX and MOSAiC-ACA, Wendisch et al., 2019; Mech et al., 2022), we observed a larger variety of MCAO conditions during HALO-(𝒜𝒞)3. The long phase of MCAOs with varying strength and different wind regimes provides opportunities for detailed MCAO studies making use of airborne measurements. Also, the sea ice edge was closer to Svalbard than during AFLUX (March–April 2019), so that ocean–ice transects could be performed more easily. HALO-(𝒜𝒞)3 captured several WAIs or ARs with unusual or even record-breaking strength. With regard to the changing climate when exchanges between the mid latitudes and the Arctic become more frequent, the campaign provides a unique opportunity to study stronger-than-average WAIs or ARs. Thus, the weather conditions were well suited to achieving the objectives of the HALO-(𝒜𝒞)3 campaign.
We show the total IVT from ERA5 for two snapshots of the ARs on 12–15 March and for the weak WAI on 10 April in Fig. A1. While the ARs on 12–15 March were meridionally aligned, the WAI on 10 April had a rather zonal orientation. The strongest total IVT is found on 15 March, exceeding 400 kg m−1 s−1.
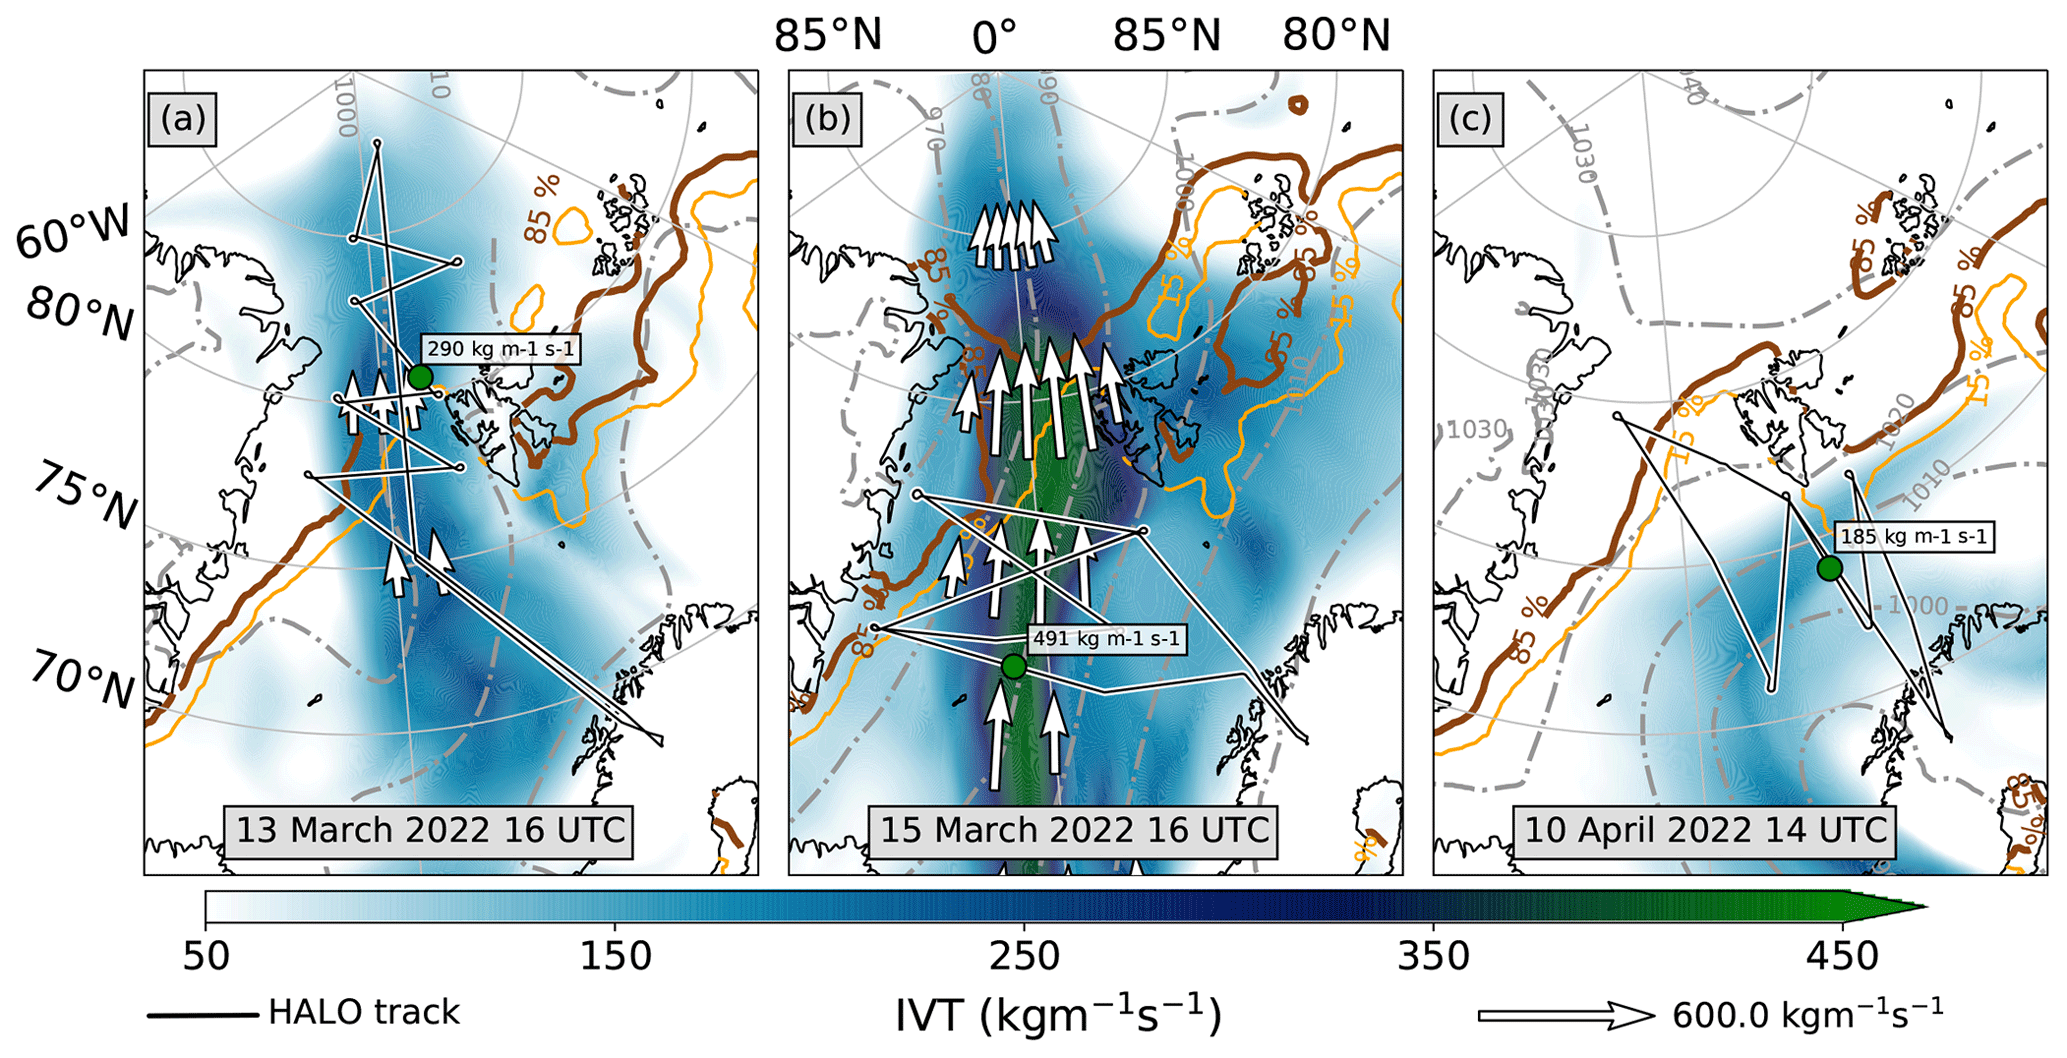
Figure A1Total integrated water vapor transport (IVT, zonal and meridional components) from ERA5 (colors) and dropsondes (circular marker) for moist and warm air intrusions or atmospheric rivers: (a) 13 March 2022 16:00 UTC, (b) 15 March 2022 16:00 UTC and (c) 10 April 2022 14:00 UTC. Quivers indicate the flow direction and strength, while black line with white outline shows the HALO flight track. The orange (brown) line indicates the 15 % (85 %) sea ice concentration isoline. Grey dash-dotted contours show the mean sea level pressure. The data are based on ERA5.
To illustrate the contrast of the two periods, we show an Arctic-wide average pressure constellation for the warm and cold periods in Fig. B1. The warm period featured this extended 500 hPa geopotential height trough and several low-pressure systems over Greenland and the geopotential height ridge and high pressure over Scandinavia. During the cold period, strong highs over Greenland and the central Arctic persisted, while low-pressure systems were located over Scandinavia, northern Russia or the Barents Sea.
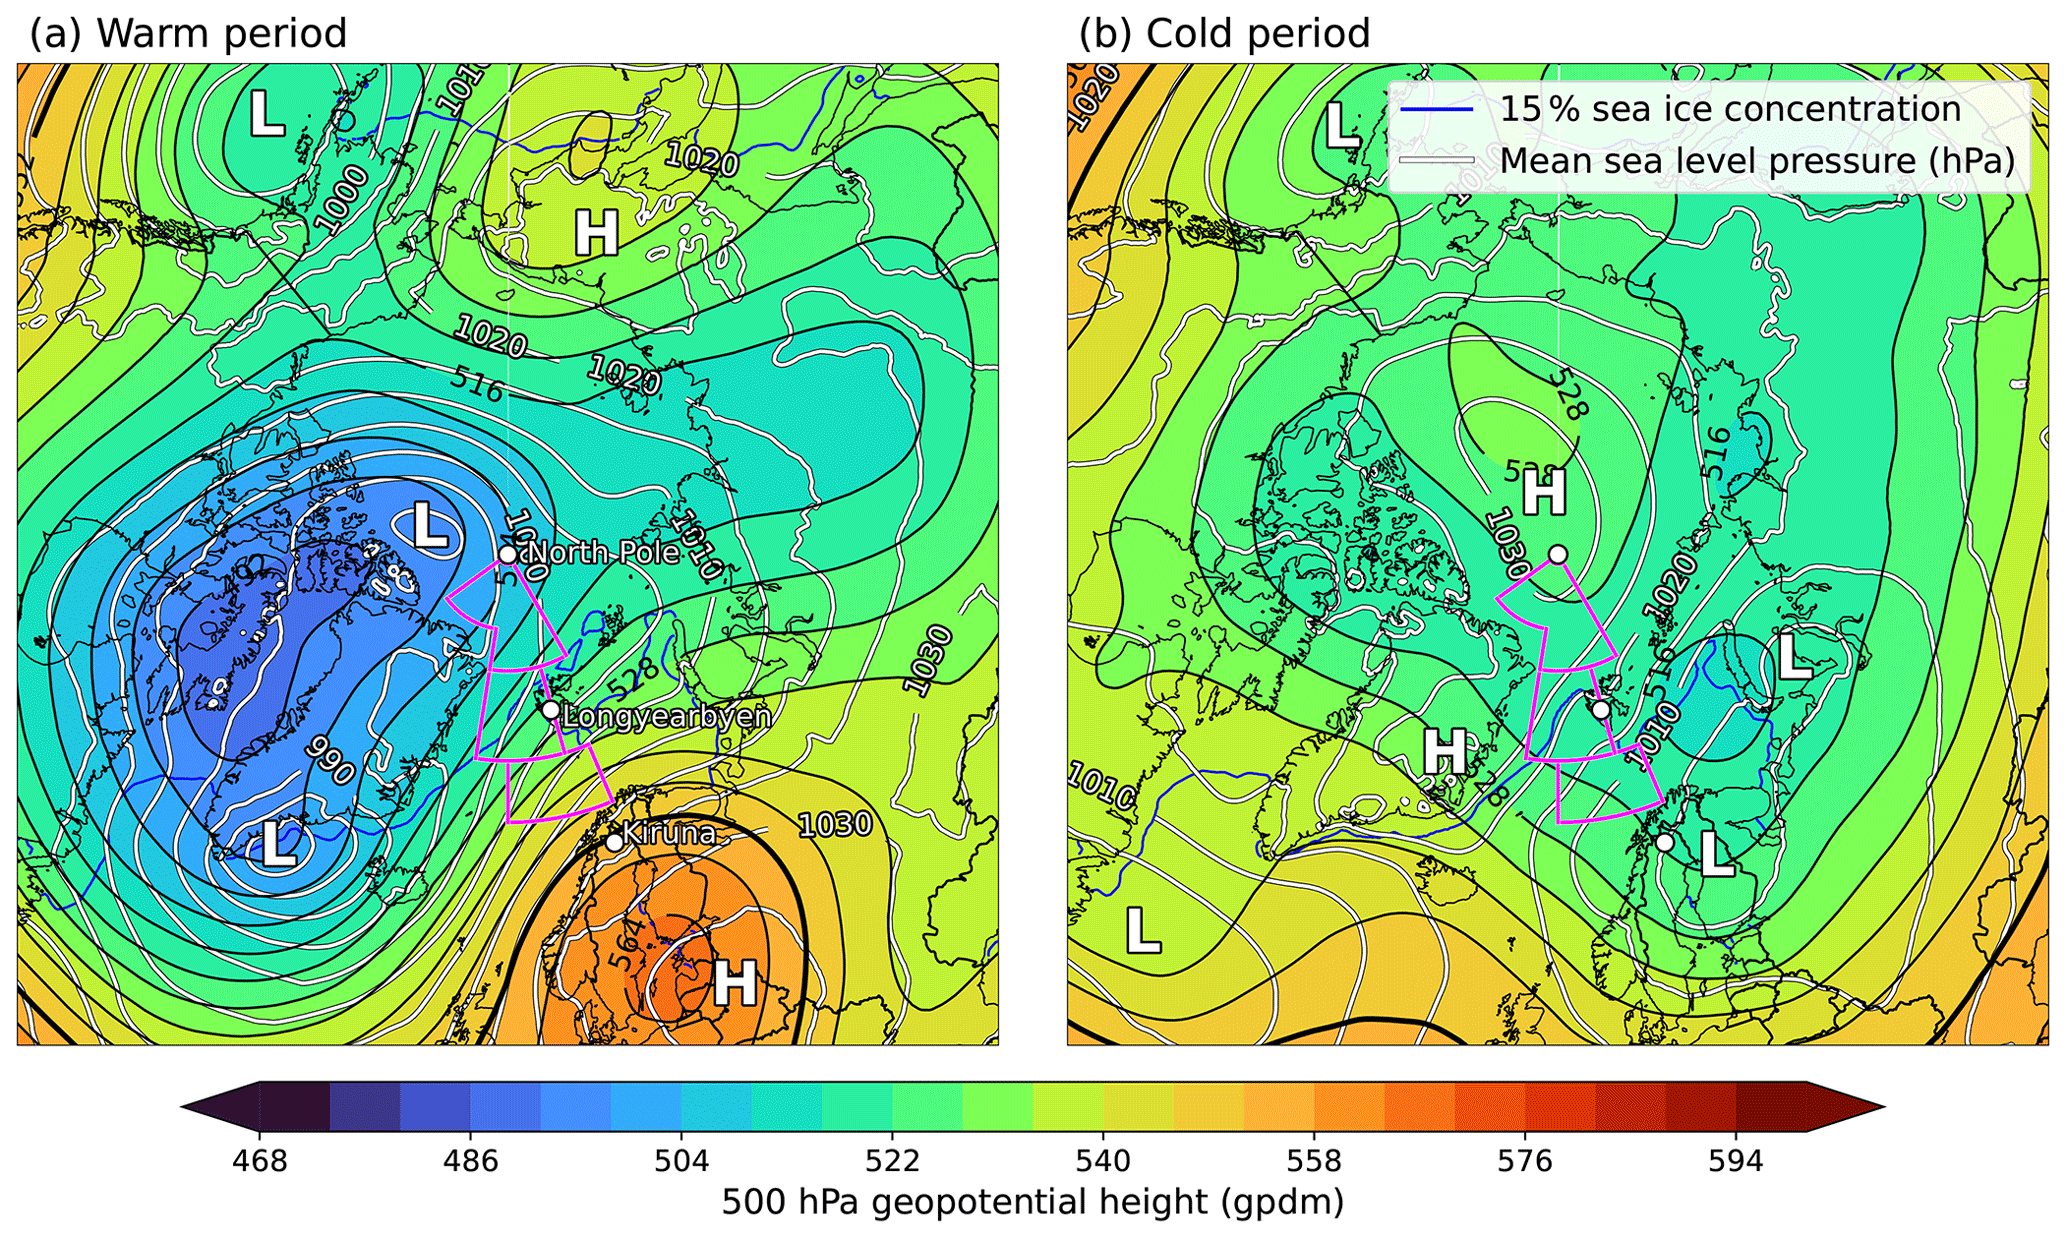
Figure B1Maps of mean sea level pressure (white contour lines with black outlines) and 500 hPa geopotential height (shading and black contour lines) from ERA5 data averaged over (a) the warm period (11–20 March 2022) and (b) the cold period (21 March–12 April 2022). The 15 % sea ice concentration from ERA5 is displayed as a blue contour line. “H” and “L” illustrate the centers of high- and low-pressure systems, respectively. The measurement domains are displayed as purple boxes.
All codes used for the analyses presented in this study have been published on Zenodo for public access at https://doi.org/10.5281/zenodo.11300722 (Mayer et al., 2024). Sea ice concentration climatology data are found at https://doi.org/10.15770/EUM_SAF_OSI_0008 (OSI SAF, 2017) and https://doi.org/10.24381/CDS.3CD8B812 (Copernicus Climate Change Service (C3S), 2020). The high-resolution sea ice concentration data set used for 7 March–12 April 2022 is based on the product from the Institute of Environmental Physics, University of Bremen. The data are available at https://data.seaice.uni-bremen.de/modis_amsr2/netcdf/Arctic/2022/ (Ludwig et al., 2020). ERA5 data at single and pressure levels can be accessed at Hersbach et al. (2018b, https://doi.org/10.24381/cds.adbb2d47) and Hersbach et al. (2018a, https://doi.org/10.24381/cds.bd0915c6). Ny-Ålesund radiosondes and ceilometer data have been published on PANGAEA (https://doi.org/10.1594/PANGAEA.845373, Maturilli and Kayser, 2016; https://doi.org/10.1594/PANGAEA.875196, Maturilli and Kayser, 2017; https://doi.org/10.1594/PANGAEA.914973, Maturilli, 2020b; https://doi.org/10.1594/PANGAEA.942331, Maturilli, 2022). The Ny-Ålesund precipitation data are provided by MET Norway and have been downloaded from https://seklima.met.no/ (MET Norway, 2023). Near-surface meteorology data from Ny-Ålesund are available on PANGAEA as well (https://doi.org/10.1594/PANGAEA.914979, Maturilli, 2020a). Radar measurements from HALO during HALO-(𝒜𝒞)3 are available on PANGAEA (https://doi.org/10.1594/PANGAEA.963250, Dorff et al., 2023). Dropsonde measurements during HALO-(𝒜𝒞)3 are currently being processed and will be published on PANGAEA, searchable via the tag “HALO-(𝒜𝒞)3”. A full description of the data set is in preparation.
SC, AE, IG, JaM, MW, and AW conceptualized the manuscript. MW and AW formulated the introduction with comments and input from AE, JaM, and SC. HD, BK, ML, NM, MM, JaR, and AW prepared the description of the Data and methods chapter. SB, HD, BK, ML, JaM, HM, RN, FP, JoR, JaR, IS, NS, and AW provided visualizations and analyzed the figures. JoM and AW collected codes from the co-authors and made them publicly available. AW is the main author of this paper and ensured validation. All the co-authors reviewed the manuscript.
The contact author has declared that none of the authors has any competing interests.
Publisher’s note: Copernicus Publications remains neutral with regard to jurisdictional claims made in the text, published maps, institutional affiliations, or any other geographical representation in this paper. While Copernicus Publications makes every effort to include appropriate place names, the final responsibility lies with the authors.
This article is part of the special issue “HALO-(AC)3 – an airborne campaign to study air mass transformations during warm-air intrusions and cold-air outbreaks”. It is not associated with a conference.
We gratefully acknowledge the funding by the Deutsche Forschungsgemeinschaft (DFG, German Research Foundation) for the ArctiC amplification: Climate Relevant Atmospheric and SurfaCe Processes, and Feedback Mechanisms (𝒜𝒞)3 project no. 268020496 – TRR 172 within the Transregional Collaborative Research Center. We are further grateful for funding of project grant no. 316646266 by the DFG within the framework of Priority Programme SPP 1294 to promote research with HALO. We thank the Institute of Environmental Physics, University of Bremen, for the provision of the merged MODIS–AMSR2 sea ice concentration data at https://seaice.uni-bremen.de/data/modis_amsr2 (last access: 4 April 2023). Hersbach et al. (2018a) and Hersbach et al. (2018b) were downloaded from the Copernicus Climate Change Service (C3S) Climate Data Store. The results contain modified Copernicus Climate Change Service information for 2022. Neither the European Commission nor the ECMWF is responsible for any use that may be made of the Copernicus information or data it contains. We thank the Alfred Wegener Institute for providing and operating the two aircraft (Polar 5 and Polar 6), the crew, and also the technicians of the Polar 5 and Polar 6 aircraft. We are also grateful for the research aircraft HALO, the pilots, and the technicians operated and provided by the German Aerospace Centre (Deutsches Zentrum für Luft- und Raumfahrt).
This research has been supported by the Deutsche Forschungsgemeinschaft (grant nos. 268020496 and no. 316646266).
This open-access publication was funded by Universität zu Köln.
This paper was edited by Johannes Quaas and reviewed by two anonymous referees.
Avila-Diaz, A., Bromwich, D. H., Wilson, A. B., Justino, F., and Wang, S.-H.: Climate Extremes across the North American Arctic in Modern Reanalyses, J. Climate, 34, 2385–2410, https://doi.org/10.1175/JCLI-D-20-0093.1, 2021. a
Bresson, H., Rinke, A., Mech, M., Reinert, D., Schemann, V., Ebell, K., Maturilli, M., Viceto, C., Gorodetskaya, I., and Crewell, S.: Case study of a moisture intrusion over the Arctic with the ICOsahedral Non-hydrostatic (ICON) model: resolution dependence of its representation, Atmos. Chem. Phys., 22, 173–196, https://doi.org/10.5194/acp-22-173-2022, 2022. a
Cohen, J., Zhang, X., Francis, J., Jung, T., Kwok, R., Overland, J., Ballinger, T. J., Bhatt, U. S., Chen, H. W., Coumou, D., Feldstein, S., Gu, H., Handorf, D., Henderson, G., Ionita, M., Kretschmer, M., Laliberte, F., Lee, S., Linderholm, H. W., Maslowski, W., Peings, Y., Pfeiffer, K., Rigor, I., Semmler, T., Stroeve, J., Taylor, P. C., Vavrus, S., Vihma, T., Wang, S., Wendisch, M., Wu, Y., and Yoon, J.: Divergent consensuses on Arctic amplification influence on midlatitude severe winter weather, Nat. Clim. Change, 10, 20–29, https://doi.org/10.1038/s41558-019-0662-y, 2020. a
Copernicus Climate Change Service (C3S): Sea ice concentration daily gridded data from 1979 to present derived from satellite observations, Copernicus Climate Change Service (C3S) Climate Data Store (CDS) [data set], https://doi.org/10.24381/CDS.3CD8B812, 2020. a, b
Dahlke, S., Solbès, A., and Maturilli, M.: Cold air outbreaks in Fram Strait: Climatology, trends, and observations during an extreme season in 2020, J. Geophys. Res.-Atmos., 127, e2021JD035741, https://doi.org/10.1029/2021JD035741, 2022. a, b
Dorff, H., Aubry, C., Ewald, F., Hirsch, L., Jansen, F., Konow, H., Mech, M., Ori, D., Ringel, M., Walbröl, A., Crewell, S., Ehrlich, A., Wendisch, M., and Ament, F.: Unified Airborne Active and Passive Microwave Measurements over Arctic Sea Ice and Ocean during the HALO-(AC)3 Campaign in Spring 2022, PANGAEA [data set], https://doi.org/10.1594/PANGAEA.963250, 2023. a
Fletcher, J., Mason, S., and Jakob, C.: The Climatology, Meteorology, and Boundary Layer Structure of Marine Cold Air Outbreaks in Both Hemispheres, J. Climate, 29, 1999–2014, https://doi.org/10.1175/JCLI-D-15-0268.1, 2016. a
Geerts, B., Giangrande, S. E., McFarquhar, G. M., Xue, L., Abel, S. J., Comstock, J. M., Crewell, S., DeMott, P. J., Ebell, K., Field, P., Hill, T. C. J., Hunzinger, A., Jensen, M. P., Johnson, K. L., Juliano, T. W., Kollias, P., Kosovic, B., Lackner, C., Luke, E., Lüpkes, C., Matthews, A. A., Neggers, R., Ovchinnikov, M., Powers, H., Shupe, M. D., Spengler, T., Swanson, B. E., Tjernström, M., Theisen, A. K., Wales, N. A., Wang, Y., Wendisch, M., and Wu, P.: The comble campaign: A study of marine boundary layer clouds in arctic cold-air outbreaks, B. Am. Meteorol. Soc. 103, E1371–E1389, 2022. a
George, G., Stevens, B., Bony, S., Pincus, R., Fairall, C., Schulz, H., Kölling, T., Kalen, Q. T., Klingebiel, M., Konow, H., Lundry, A., Prange, M., and Radtke, J.: JOANNE: Joint dropsonde Observations of the Atmosphere in tropical North atlaNtic meso-scale Environments, Earth Syst. Sci. Data, 13, 5253–5272, https://doi.org/10.5194/essd-13-5253-2021, 2021. a
Gierens, R., Kneifel, S., Shupe, M. D., Ebell, K., Maturilli, M., and Löhnert, U.: Low-level mixed-phase clouds in a complex Arctic environment, Atmos. Chem. Phys., 20, 3459–3481, https://doi.org/10.5194/acp-20-3459-2020, 2020. a
Graham, R. M., Cohen, L., Ritzhaupt, N., Segger, B., Graversen, R. G., Rinke, A., Walden, V. P., Granskog, M. A., and Hudson, S. R.: Evaluation of Six Atmospheric Reanalyses over Arctic Sea Ice from Winter to Early Summer , J. Climate, 32, 4121–4143, https://doi.org/10.1175/JCLI-D-18-0643.1, 2019a. a
Graham, R. M., Hudson, S. R., and Maturilli, M.: Improved Performance of ERA5 in Arctic Gateway Relative to Four Global Atmospheric Reanalyses, Geophys. Res. Lett., 46, 6138–6147, https://doi.org/10.1029/2019GL082781, 2019b. a, b
Guan, B. and Waliser, D. E.: Detection of atmospheric rivers: Evaluation and application of an algorithm for global studies: Detection of Atmospheric Rivers, J. Geophys. Res.-Atmos., 120, 12514–12535, https://doi.org/10.1002/2015JD024257, 2015. a, b
Guan, B. and Waliser, D. E.: Atmospheric rivers in 20 year weather and climate simulations: A multimodel, global evaluation, J. Geophys. Res.-Atmos., 122, 5556–5581, https://doi.org/10.1002/2016JD026174, 2017. a
Guan, B., Waliser, D. E., and Ralph, F. M.: An Intercomparison between Reanalysis and Dropsonde Observations of the Total Water Vapor Transport in Individual Atmospheric Rivers, J. Hydrometeorol., 19, 321–337, https://doi.org/10.1175/JHM-D-17-0114.1, 2018. a
Hersbach, H., Bell, B., Berrisford, P., Biavati, G., Horányi, A., Muñoz Sabater, J., Nicolas, J., Peubey, C., Radu, R., Rozum, I., Schepers, D., Simmons, A., Soci, C., Dee, D., and Thépaut, J.-N.: ERA5 hourly data on pressure levels from 1959 to present, Copernicus Climate Change Service (C3S) Climate Data Store (CDS) [data set], https://doi.org/10.24381/cds.bd0915c6, 2018a. a, b, c
Hersbach, H., Bell, B., Berrisford, P., Biavati, G., Horányi, A., Muñoz Sabater, J., Nicolas, J., Peubey, C., Radu, R., Rozum, I., Schepers, D., Simmons, A., Soci, C., Dee, D., and Thépaut, J.-N.: ERA5 hourly data on single levels from 1959 to present, Copernicus Climate Change Service (C3S) Climate Data Store (CDS) [data set], https://doi.org/10.24381/cds.adbb2d47, 2018b. a, b, c
Hersbach, H., Bell, B., Berrisford, P., Hirahara, S., Horányi, A., Muñoz‐Sabater, J., Nicolas, J., Peubey, C., Radu, R., Schepers, D., Simmons, A., Soci, C., Abdalla, S., Abellan, X., Balsamo, G., Bechtold, P., Biavati, G., Bidlot, J., Bonavita, M., Chiara, G., Dahlgren, P., Dee, D., Diamantakis, M., Dragani, R., Flemming, J., Forbes, R., Fuentes, M., Geer, A., Haimberger, L., Healy, S., Hogan, R. J., Hólm, E., Janisková, M., Keeley, S., Laloyaux, P., Lopez, P., Lupu, C., Radnoti, G., Rosnay, P., Rozum, I., Vamborg, F., Villaume, S., and Thépaut, J.: The ERA5 global reanalysis, Q. J. Roy. Meteor. Soc., 146, 1999–2049, https://doi.org/10.1002/qj.3803, 2020. a
Hock, T. F. and Franklin, J. L.: The NCAR GPS Dropwindsonde, B. Am. Meteorol. Soc., 80, 407–420, https://doi.org/10.1175/1520-0477(1999)080<0407:TNGD>2.0.CO;2, 1999. a
Johansson, E., Devasthale, A., Tjernström, M., Ekman, A. M. L., and L'Ecuyer, T.: Response of the lower troposphere to moisture intrusions into the Arctic, Geophys. Res. Lett., 44, 2527–2536, https://doi.org/10.1002/2017GL072687, 2017. a, b
Kapsch, M.-L., Graversen, R. G., and Tjernström, M.: Springtime atmospheric energy transport and the control of Arctic summer sea-ice extent, Nat. Clim. Change, 3, 744–748, https://doi.org/10.1038/nclimate1884, 2013. a
Kapsch, M.-L., Skific, N., Graversen, R. G., Tjernström, M., and Francis, J. A.: Summers with low Arctic sea ice linked to persistence of spring atmospheric circulation patterns, Clim. Dynam., 52, 2497–2512, https://doi.org/10.1007/s00382-018-4279-z, 2019. a
Knudsen, E. M., Heinold, B., Dahlke, S., Bozem, H., Crewell, S., Gorodetskaya, I. V., Heygster, G., Kunkel, D., Maturilli, M., Mech, M., Viceto, C., Rinke, A., Schmithüsen, H., Ehrlich, A., Macke, A., Lüpkes, C., and Wendisch, M.: Meteorological conditions during the ACLOUD/PASCAL field campaign near Svalbard in early summer 2017, Atmos. Chem. Phys., 18, 17995–18022, https://doi.org/10.5194/acp-18-17995-2018, 2018. a, b
Komatsu, K. K., Alexeev, V. A., Repina, I. A., and Tachibana, Y.: Poleward upgliding Siberian atmospheric rivers over sea ice heat up Arctic upper air, Sci. Rep., 8, 2872, https://doi.org/10.1038/s41598-018-21159-6, 2018. a
Konow, H., Ewald, F., George, G., Jacob, M., Klingebiel, M., Kölling, T., Luebke, A. E., Mieslinger, T., Pörtge, V., Radtke, J., Schäfer, M., Schulz, H., Vogel, R., Wirth, M., Bony, S., Crewell, S., Ehrlich, A., Forster, L., Giez, A., Gödde, F., Groß, S., Gutleben, M., Hagen, M., Hirsch, L., Jansen, F., Lang, T., Mayer, B., Mech, M., Prange, M., Schnitt, S., Vial, J., Walbröl, A., Wendisch, M., Wolf, K., Zinner, T., Zöger, M., Ament, F., and Stevens, B.: EUREC4A's HALO, Earth Syst. Sci. Data, 13, 5545–5563, https://doi.org/10.5194/essd-13-5545-2021, 2021. a
Lauer, M., Mech, M., and Guan, B.: Global Atmospheric Rivers catalog for ERA5 reanalysis, PANGAEA, [data set], https://doi.org/10.1594/PANGAEA.957161, 2023. a
Lavergne, T., Sørensen, A. M., Kern, S., Tonboe, R., Notz, D., Aaboe, S., Bell, L., Dybkjær, G., Eastwood, S., Gabarro, C., Heygster, G., Killie, M. A., Brandt Kreiner, M., Lavelle, J., Saldo, R., Sandven, S., and Pedersen, L. T.: Version 2 of the EUMETSAT OSI SAF and ESA CCI sea-ice concentration climate data records, The Cryosphere, 13, 49–78, https://doi.org/10.5194/tc-13-49-2019, 2019. a
Lloyd, G., Choularton, T. W., Bower, K. N., Gallagher, M. W., Crosier, J., O'Shea, S., Abel, S. J., Fox, S., Cotton, R., and Boutle, I. A.: In situ measurements of cloud microphysical and aerosol properties during the break-up of stratocumulus cloud layers in cold air outbreaks over the North Atlantic, Atmos. Chem. Phys., 18, 17191–17206, https://doi.org/10.5194/acp-18-17191-2018, 2018. a
Ludwig, V., Spreen, G., and Pedersen, L. T.: Evaluation of a New Merged Sea-Ice Concentration Dataset at 1 km Resolution from Thermal Infrared and Passive Microwave Satellite Data in the Arctic, Remote Sens.-Basel, 12, 3183, https://doi.org/10.3390/rs12193183, 2020 (data available: https://data.seaice.uni-bremen.de/modis_amsr2/netcdf/Arctic/2022/, last access: 11 July 2024). a, b
Ma, W., Chen, G., and Guan, B.: Poleward Shift of Atmospheric Rivers in the Southern Hemisphere in Recent Decades, Geophys. Res. Lett., 47, e2020GL089934, https://doi.org/10.1029/2020GL089934, 2020. a
Mattingly, K. S., Mote, T. L., and Fettweis, X.: Atmospheric River Impacts on Greenland Ice Sheet Surface Mass Balance, J. Geophys. Res.-Atmos., 123, 8538–8560, https://doi.org/10.1029/2018JD028714, 2018. a
Mattingly, K. S., Mote, T. L., Fettweis, X., van As, D., Van Tricht, K., Lhermitte, S., Pettersen, C., and Fausto, R. S.: Strong Summer Atmospheric Rivers Trigger Greenland Ice Sheet Melt through Spatially Varying Surface Energy Balance and Cloud Regimes, J. Climate, 33, 6809–6832, https://doi.org/10.1175/JCLI-D-19-0835.1, 2020. a
Maturilli, M.: Continuous meteorological observations at station Ny-Ålesund (2011-08 et seq), PANGAEA [data set], https://doi.org/10.1594/PANGAEA.914979, 2020a. a, b
Maturilli, M.: High resolution radiosonde measurements from station Ny-Ålesund (2017-04 et seq), PANGAEA [data set], https://doi.org/10.1594/PANGAEA.914973, 2020b. a, b, c
Maturilli, M.: Ceilometer cloud base height from station Ny-Ålesund (2017-08 et seq), PANGAEA [data set], https://doi.org/10.1594/PANGAEA.942331, 2022. a, b
Maturilli, M. and Ebell, K.: Twenty-five years of cloud base height measurements by ceilometer in Ny-Ålesund, Svalbard, Earth Syst. Sci. Data, 10, 1451–1456, https://doi.org/10.5194/essd-10-1451-2018, 2018. a
Maturilli, M. and Kayser, M.: Homogenized radiosonde record at station Ny-Ålesund, Spitsbergen, 1993-2014, PANGAEA [data set], https://doi.org/10.1594/PANGAEA.845373, 2016. a, b
Maturilli, M. and Kayser, M.: Homogenized radiosonde record at station Ny-Ålesund, Spitsbergen, 2015–016, PANGAEA [data set], https://doi.org/10.1594/PANGAEA.875196, 2017. a, b
Maturilli, M., Herber, A., and König-Langlo, G.: Climatology and time series of surface meteorology in Ny-Ålesund, Svalbard, Earth Syst. Sci. Data, 5, 155–163, https://doi.org/10.5194/essd-5-155-2013, 2013. a, b
Mayer, J., Walbröl, A., Becker, S., Dorff, H., Kirbus, B., Lauer, M., Müller, H., Rückert, J. E., and Slättberg, N.: Codes for: Contrasting extremely warm and long- lasting cold air anomalies in the North Atlantic sector of the Arctic during the HALO-(AC)3 campaign, Version v1.0.0, Zenodo [code], https://doi.org/10.5281/zenodo.11300722, 2024. a
Mech, M., Ehrlich, A., Herber, A., Lüpkes, C., Wendisch, M., Becker, S., Boose, Y., Chechin, D., Crewell, S., Dupuy, R., Gourbeyre, C., Hartmann, J., Jäkel, E., Jourdan, O., Kliesch, L.-L., Klingebiel, M., Kulla, B. S., Mioche, G., Moser, M., Risse, N., Ruiz-Donoso, E., Schäfer, M., Stapf, J., and Voigt, C.: MOSAiC-ACA and AFLUX - Arctic airborne campaigns characterizing the exit area of MOSAiC, Scientific Data, 9, 790, https://doi.org/10.1038/s41597-022-01900-7, 2022. a, b
MET Norway: Seklima, Observations and weather statistics, Norwegian Centre for Climate Services, https://seklima.met.no/ (last access: 30 November 2023), 2023.
Mewes, D. and Jacobi, C.: Heat transport pathways into the Arctic and their connections to surface air temperatures, Atmos. Chem. Phys., 19, 3927–3937, https://doi.org/10.5194/acp-19-3927-2019, 2019. a
Nash, D., Waliser, D., Guan, B., Ye, H., and Ralph, F. M.: The role of atmospheric rivers in extratropical and polar hydroclimate, J. Geophys. Res.-Atmos., 123, 6804–6821, https://doi.org/10.1029/2017JD028130, 2018. a, b
Neff, W., Compo, G. P., Ralph, F. M., and Shupe, M. D.: Continental heat anomalies and the extreme melting of the Greenland ice surface in 2012 and 1889, J. Geophys. Res.-Atmos., 119, 6520–6536, https://doi.org/10.1002/2014JD021470, 2014. a
Newell, R. E., Newell, N. E., Zhu, Y., and Scott, C.: Tropospheric rivers? – A pilot study, Geophys. Res. Lett., 19, 2401–2404, https://doi.org/10.1029/92GL02916, 1992. a
OSI SAF: Global Sea Ice Concentration Climate Data Record v2.0 - Multimission, EUMETSAT SAF on Ocean and Sea Ice [data set], https://doi.org/10.15770/EUM_SAF_OSI_0008, 2017. a, b
Papritz, L. and Spengler, T.: A Lagrangian Climatology of Wintertime Cold Air Outbreaks in the Irminger and Nordic Seas and Their Role in Shaping Air–Sea Heat Fluxes, J. Climate, 30, 2717–2737, https://doi.org/10.1175/JCLI-D-16-0605.1, 2017. a, b, c
Papritz, L., Hauswirth, D., and Hartmuth, K.: Moisture origin, transport pathways, and driving processes of intense wintertime moisture transport into the Arctic, Weather Clim. Dynam., 3, 1–20, https://doi.org/10.5194/wcd-3-1-2022, 2022. a
Pithan, F., Medeiros, B., and Mauritsen, T.: Mixed-phase clouds cause climate model biases in Arctic wintertime temperature inversions, Clim. Dynam., 43, 289–303, https://doi.org/10.1007/s00382-013-1964-9, 2014. a
Pithan, F., Svensson, G., Caballero, R., Chechin, D., Cronin, T. W., Ekman, A. M. L., Neggers, R., Shupe, M. D., Solomon, A., Tjernström, M., and Wendisch, M.: Role of air-mass transformations in exchange between the Arctic and mid-latitudes, Nat. Geosci., 11, 805–812, https://doi.org/10.1038/s41561-018-0234-1, 2018. a, b, c
Rantanen, M., Karpechko, A. Y., Lipponen, A., Nordling, K., Hyvärinen, O., Ruosteenoja, K., Vihma, T., and Laaksonen, A.: The Arctic has warmed nearly four times faster than the globe since 1979, Communications Earth & Environment, 3, 168, https://doi.org/10.1038/s43247-022-00498-3, 2022. a
Rinke, A., Segger, B., Crewell, S., Maturilli, M., Naakka, T., Nygård, T., Vihma, T., Alshawaf, F., Dick, G., Wickert, J., and Keller, J.: Trends of Vertically Integrated Water Vapor over the Arctic during 1979–2016: Consistent Moistening All Over?, J. Climate, 32, 6097–6116, https://doi.org/10.1175/JCLI-D-19-0092.1, 2019. a
Rückert, J. E., Rostosky, P., Huntemann, M., Clemens-Sewall, D., Ebell, K., Kaleschke, L., Lemmetyinen, J., Macfarlane, A. R., Naderpour, R., Stroeve, J., Walbröl, A., and Spreen, G.: Sea ice concentration satellite retrievals influenced by surface changes due to warm air intrusions: A case study from the MOSAiC expedition, Elementa: Science of the Anthropocene, 11, 00039, https://doi.org/10.1525/elementa.2023.00039, 2023. a
Schirmacher, I., Kollias, P., Lamer, K., Mech, M., Pfitzenmaier, L., Wendisch, M., and Crewell, S.: Assessing Arctic low-level clouds and precipitation from above – a radar perspective, Atmos. Meas. Tech., 16, 4081–4100, https://doi.org/10.5194/amt-16-4081-2023, 2023. a, b
Screen, J. A. and Simmonds, I.: The central role of diminishing sea ice in recent Arctic temperature amplification, Nature, 464, 1334–1337, https://doi.org/10.1038/nature09051, 2010. a
Serreze, M. C. and Barry, R. G.: Processes and impacts of Arctic amplification: A research synthesis, Global Planet. Change, 77, 85–96, https://doi.org/10.1016/j.gloplacha.2011.03.004, 2011. a
Serreze, M. C. and Barry, R. G.: The Arctic Climate System, Cambridge Atmospheric and Space Science Series, Cambridge University Press, 2nd edn., ISBN 9781139583817, 2014. a
Serreze, M. C., Barrett, A. P., Stroeve, J. C., Kindig, D. N., and Holland, M. M.: The emergence of surface-based Arctic amplification, The Cryosphere, 3, 11–19, https://doi.org/10.5194/tc-3-11-2009, 2009. a, b
Serreze, M. C., Gustafson, J., Barrett, A. P., Druckenmiller, M. L., Fox, S., Voveris, J., Stroeve, J., Sheffield, B., Forbes, B. C., Rasmus, S., Laptander, R., Brook, M., Brubaker, M., Temte, J., McCrystall, M. R., and Bartsch, A.: Arctic rain on snow events: bridging observations to understand environmental and livelihood impacts, Environ. Res. Lett., 16, 105009, https://doi.org/10.1088/1748-9326/ac269b, 2021. a
Stevens, B., Ament, F., Bony, S., Crewell, S., Ewald, F., Gross, S., Hansen, A., Hirsch, L., Jacob, M., Kölling, T., Konow, H., Mayer, B., Wendisch, M., Wirth, M., Wolf, K., Bakan, S., Bauer-Pfundstein, M., Brueck, M., Delanoë, J., Ehrlich, A., Farrell, D., Forde, M., Gödde, F., Grob, H., Hagen, M., Jäkel, E., Jansen, F., Klepp, C., Klingebiel, M., Mech, M., Peters, G., Rapp, M., Wing, A. A., and Zinner, T.: A High-Altitude Long-Range Aircraft Configured as a Cloud Observatory: The NARVAL Expeditions, B. Am. Meteorol. Soc., 100, 1061–1077, https://doi.org/10.1175/BAMS-D-18-0198.1, 2019. a, b
Stevens, B., Bony, S., Farrell, D., Ament, F., Blyth, A., Fairall, C., Karstensen, J., Quinn, P. K., Speich, S., Acquistapace, C., Aemisegger, F., Albright, A. L., Bellenger, H., Bodenschatz, E., Caesar, K.-A., Chewitt-Lucas, R., de Boer, G., Delanoë, J., Denby, L., Ewald, F., Fildier, B., Forde, M., George, G., Gross, S., Hagen, M., Hausold, A., Heywood, K. J., Hirsch, L., Jacob, M., Jansen, F., Kinne, S., Klocke, D., Kölling, T., Konow, H., Lothon, M., Mohr, W., Naumann, A. K., Nuijens, L., Olivier, L., Pincus, R., Pöhlker, M., Reverdin, G., Roberts, G., Schnitt, S., Schulz, H., Siebesma, A. P., Stephan, C. C., Sullivan, P., Touzé-Peiffer, L., Vial, J., Vogel, R., Zuidema, P., Alexander, N., Alves, L., Arixi, S., Asmath, H., Bagheri, G., Baier, K., Bailey, A., Baranowski, D., Baron, A., Barrau, S., Barrett, P. A., Batier, F., Behrendt, A., Bendinger, A., Beucher, F., Bigorre, S., Blades, E., Blossey, P., Bock, O., Böing, S., Bosser, P., Bourras, D., Bouruet-Aubertot, P., Bower, K., Branellec, P., Branger, H., Brennek, M., Brewer, A., Brilouet , P.-E., Brügmann, B., Buehler, S. A., Burke, E., Burton, R., Calmer, R., Canonici, J.-C., Carton, X., Cato Jr., G., Charles, J. A., Chazette, P., Chen, Y., Chilinski, M. T., Choularton, T., Chuang, P., Clarke, S., Coe, H., Cornet, C., Coutris, P., Couvreux, F., Crewell, S., Cronin, T., Cui, Z., Cuypers, Y., Daley, A., Damerell, G. M., Dauhut, T., Deneke, H., Desbios, J.-P., Dörner, S., Donner, S., Douet, V., Drushka, K., Dütsch, M., Ehrlich, A., Emanuel, K., Emmanouilidis, A., Etienne, J.-C., Etienne-Leblanc, S., Faure, G., Feingold, G., Ferrero, L., Fix, A., Flamant, C., Flatau, P. J., Foltz, G. R., Forster, L., Furtuna, I., Gadian, A., Galewsky, J., Gallagher, M., Gallimore, P., Gaston, C., Gentemann, C., Geyskens, N., Giez, A., Gollop, J., Gouirand, I., Gourbeyre, C., de Graaf, D., de Groot, G. E., Grosz, R., Güttler, J., Gutleben, M., Hall, K., Harris, G., Helfer, K. C., Henze, D., Herbert, C., Holanda, B., Ibanez-Landeta, A., Intrieri, J., Iyer, S., Julien, F., Kalesse, H., Kazil, J., Kellman, A., Kidane, A. T., Kirchner, U., Klingebiel, M., Körner, M., Kremper, L. A., Kretzschmar, J., Krüger, O., Kumala, W., Kurz, A., L'Hégaret, P., Labaste, M., Lachlan-Cope, T., Laing, A., Landschützer, P., Lang, T., Lange, D., Lange, I., Laplace, C., Lavik, G., Laxenaire, R., Le Bihan, C., Leandro, M., Lefevre, N., Lena, M., Lenschow, D., Li, Q., Lloyd, G., Los, S., Losi, N., Lovell, O., Luneau, C., Makuch, P., Malinowski, S., Manta, G., Marinou, E., Marsden, N., Masson, S., Maury, N., Mayer, B., Mayers-Als, M., Mazel, C., McGeary, W., McWilliams, J. C., Mech, M., Mehlmann, M., Meroni, A. N., Mieslinger, T., Minikin, A., Minnett, P., Möller, G., Morfa Avalos, Y., Muller, C., Musat, I., Napoli, A., Neuberger, A., Noisel, C., Noone, D., Nordsiek, F., Nowak, J. L., Oswald, L., Parker, D. J., Peck, C., Person, R., Philippi, M., Plueddemann, A., Pöhlker, C., Pörtge, V., Pöschl, U., Pologne, L., Posyniak, M., Prange, M., Quiñones Meléndez, E., Radtke, J., Ramage, K., Reimann, J., Renault, L., Reus, K., Reyes, A., Ribbe, J., Ringel, M., Ritschel, M., Rocha, C. B., Rochetin, N., Röttenbacher, J., Rollo, C., Royer, H., Sadoulet, P., Saffin, L., Sandiford, S., Sandu, I., Schäfer, M., Schemann, V., Schirmacher, I., Schlenczek, O., Schmidt, J., Schröder, M., Schwarzenboeck, A., Sealy, A., Senff, C. J., Serikov, I., Shohan, S., Siddle, E., Smirnov, A., Späth, F., Spooner, B., Stolla, M. K., Szkółka, W., de Szoeke, S. P., Tarot, S., Tetoni, E., Thompson, E., Thomson, J., Tomassini, L., Totems, J., Ubele, A. A., Villiger, L., von Arx, J., Wagner, T., Walther, A., Webber, B., Wendisch, M., Whitehall, S., Wiltshire, A., Wing, A. A., Wirth, M., Wiskandt, J., Wolf, K., Worbes, L., Wright, E., Wulfmeyer, V., Young, S., Zhang, C., Zhang, D., Ziemen, F., Zinner, T., and Zöger, M.: EUREC4A, Earth Syst. Sci. Data, 13, 4067–4119, https://doi.org/10.5194/essd-13-4067-2021, 2021. a
Stroeve, J., Nandan, V., Willatt, R., Dadic, R., Rostosky, P., Gallagher, M., Mallett, R., Barrett, A., Hendricks, S., Tonboe, R., McCrystall, M., Serreze, M., Thielke, L., Spreen, G., Newman, T., Yackel, J., Ricker, R., Tsamados, M., Macfarlane, A., Hannula, H.-R., and Schneebeli, M.: Rain on snow (ROS) understudied in sea ice remote sensing: a multi-sensor analysis of ROS during MOSAiC (Multidisciplinary drifting Observatory for the Study of Arctic Climate), The Cryosphere, 16, 4223–4250, https://doi.org/10.5194/tc-16-4223-2022, 2022. a
Tjernström, M., Shupe, M. D., Brooks, I. M., Persson, P. O. G., Prytherch, J., Salisbury, D. J., Sedlar, J., Achtert, P., Brooks, B. J., Johnston, P. E., Sotiropoulou, G., and Wolfe, D.: Warm-air advection, air mass transformation and fog causes rapid ice melt, Geophys. Res. Lett., 42, 5594–5602, https://doi.org/10.1002/2015GL064373, 2015. a
Viceto, C., Gorodetskaya, I. V., Rinke, A., Maturilli, M., Rocha, A., and Crewell, S.: Atmospheric rivers and associated precipitation patterns during the ACLOUD and PASCAL campaigns near Svalbard (May–June 2017): case studies using observations, reanalyses, and a regional climate model, Atmos. Chem. Phys., 22, 441–463, https://doi.org/10.5194/acp-22-441-2022, 2022. a
von Lerber, A., Mech, M., Rinke, A., Zhang, D., Lauer, M., Radovan, A., Gorodetskaya, I., and Crewell, S.: Evaluating seasonal and regional distribution of snowfall in regional climate model simulations in the Arctic, Atmos. Chem. Phys., 22, 7287–7317, https://doi.org/10.5194/acp-22-7287-2022, 2022. a, b
Wendisch, M., Macke, A., Ehrlich, A., Lüpkes, C., Mech, M., Chechin, D., Dethloff, K., Velasco, C. B., Bozem, H., Brückner, M., Clemen, H.-C., Crewell, S., Donth, T., Dupuy, R., Ebell, K., Egerer, U., Engelmann, R., Engler, C., Eppers, O., Gehrmann, M., Gong, X., Gottschalk, M., Gourbeyre, C., Griesche, H., Hartmann, J., Hartmann, M., Heinold, B., Herber, A., Herrmann, H., Heygster, G., Hoor, P., Jafariserajehlou, S., Jäkel, E., Järvinen, E., Jourdan, O., Kästner, U., Kecorius, S., Knudsen, E. M., Köllner, F., Kretzschmar, J., Lelli, L., Leroy, D., Maturilli, M., Mei, L., Mertes, S., Mioche, G., Neuber, R., Nicolaus, M., Nomokonova, T., Notholt, J., Palm, M., van Pinxteren, M., Quaas, J., Richter, P., Ruiz-Donoso, E., Schäfer, M., Schmieder, K., Schnaiter, M., Schneider, J., Schwarzenböck, A., Seifert, P., Shupe, M. D., Siebert, H., Spreen, G., Stapf, J., Stratmann, F., Vogl, T., Welti, A., Wex, H., Wiedensohler, A., Zanatta, M., and Zeppenfeld, S.: The Arctic Cloud Puzzle: Using ACLOUD/PASCAL Multiplatform Observations to Unravel the Role of Clouds and Aerosol Particles in Arctic Amplification, B. Am. Meteorol. Soc., 100, 841–871, https://doi.org/10.1175/BAMS-D-18-0072.1, 2019. a, b
Wendisch, M., Handorf, D., Tegen, I., Neggers, R., and Spreen, G.: Glimpsing the Ins and Outs of the Arctic Atmospheric Cauldron, Eos, 102, https://doi.org/10.1029/2021EO155959, 2021. a
Wendisch, M., Brückner, M., Crewell, S., Ehrlich, A., Notholt, J., Lüpkes, C., Macke, A., Burrows, J. P., Rinke, A., Quaas, J., Maturilli, M., Schemann, V., Shupe, M. D., Akansu, E. F., Barrientos-Velasco, C., Bärfuss, K., Blechschmidt, A.-M., Block, K., Bougoudis, I., Bozem, H., Böckmann, C., Bracher, A., Bresson, H., Bretschneider, L., Buschmann, M., Chechin, D. G., Chylik, J., Dahlke, S., Deneke, H., Dethloff, K., Donth, T., Dorn, W., Dupuy, R., Ebell, K., Egerer, U., Engelmann, R., Eppers, O., Gerdes, R., Gierens, R., Gorodetskaya, I. V., Gottschalk, M., Griesche, H., Gryanik, V. M., Handorf, D., Harm-Altstädter, B., Hartmann, J., Hartmann, M., Heinold, B., Herber, A., Herrmann, H., Heygster, G., Höschel, I., Hofmann, Z., Hölemann, J., Hünerbein, A., Jafariserajehlou, S., Jäkel, E., Jacobi, C., Janout, M., Jansen, F., Jourdan, O., Jurányi, Z., Kalesse-Los, H., Kanzow, T., Käthner, R., Kliesch, L. L., Klingebiel, M., Knudsen, E. M., Kovács, T., Körtke, W., Krampe, D., Kretzschmar, J., Kreyling, D., Kulla, B., Kunkel, D., Lampert, A., Lauer, M., Lelli, L., von Lerber, A., Linke, O., Löhnert, U., Lonardi, M., Losa, S. N., Losch, M., Maahn, M., Mech, M., Mei, L., Mertes, S., Metzner, E., Mewes, D., Michaelis, J., Mioche, G., Moser, M., Nakoudi, K., Neggers, R., Neuber, R., Nomokonova, T., Oelker, J., Papakonstantinou-Presvelou, I., Pätzold, F., Pefanis, V., Pohl, C., van Pinxteren, M., Radovan, A., Rhein, M., Rex, M., Richter, A., Risse, N., Ritter, C., Rostosky, P., Rozanov, V. V., Donoso, E. R., Saavedra Garfias, P., Salzmann, M., Schacht, J., Schäfer, M., Schneider, J., Schnierstein, N., Seifert, P., Seo, S., Siebert, H., Soppa, M. A., Spreen, G., Stachlewska, I. S., Stapf, J., Stratmann, F., Tegen, I., Viceto, C., Voigt, C., Vountas, M., Walbröl, A., Walter, M., Wehner, B., Wex, H., Willmes, S., Zanatta, M., and Zeppenfeld, S.: Atmospheric and Surface Processes, and Feedback Mechanisms Determining Arctic Amplification: A Review of First Results and Prospects of the (AC)3 Project, B. Am. Meteorol. Soc., 104, E208–E242, https://doi.org/10.1175/BAMS-D-21-0218.1, 2023. a
Wendisch, M., Crewell, S., Ehrlich, A., Herber, A., Kirbus, B., Lüpkes, C., Mech, M., Abel, S. J., Akansu, E. F., Ament, F., Aubry, C., Becker, S., Borrmann, S., Bozem, H., Brückner, M., Clemen, H.-C., Dahlke, S., Dekoutsidis, G., Delanoë, J., De La Torre Castro, E., Dorff, H., Dupuy, R., Eppers, O., Ewald, F., George, G., Gorodetskaya, I. V., Grawe, S., Groß, S., Hartmann, J., Henning, S., Hirsch, L., Jäkel, E., Joppe, P., Jourdan, O., Jurányi, Z., Karalis, M., Kellermann, M., Klingebiel, M., Lonardi, M., Lucke, J., Luebke, A., Maahn, M., Maherndl, N., Maturilli, M., Mayer, B., Mayer, J., Mertes, S., Michaelis, J., Michalkov, M., Mioche, G., Moser, M., Müller, H., Neggers, R., Ori, D., Paul, D., Paulus, F., Pilz, C., Pithan, F., Pöhlker, M., Pörtge, V., Ringel, M., Risse, N., Roberts, G. C., Rosenburg, S., Röttenbacher, J., Rückert, J., Schäfer, M., Schäfer, J., Schemannn, V., Schirmacher, I., Schmidt, J., Schmidt, S., Schneider, J., Schnitt, S., Schwarz, A., Siebert, H., Sodemann, H., Sperzel, T., Spreen, G., Stevens, B., Stratmann, F., Svensson, G., Tatzelt, C., Tuch, T., Vihma, T., Voigt, C., Volkmer, L., Walbröl, A., Weber, A., Wehner, B., Wetzel, B., Wirth, M., and Zinner, T.: Overview: Quasi-Lagrangian observations of Arctic air mass transformations – Introduction and initial results of the HALO–(AC)3 aircraft campaign, EGUsphere [preprint], https://doi.org/10.5194/egusphere-2024-783, 2024. a
Wesche, C., Steinhage, D., and Nixdorf, U.: Polar aircraft Polar5 and Polar6 operated by the Alfred Wegener Institute, Journal of large-scale research facilities JLSRF, 2, A87, https://doi.org/10.17815/jlsrf-2-153, 2016. a
Woods, C. and Caballero, R.: The Role of Moist Intrusions in Winter Arctic Warming and Sea Ice Decline, J. Climate, 29, 4473–4485, https://doi.org/10.1175/JCLI-D-15-0773.1, 2016. a, b, c, d
Woods, C., Caballero, R., and Svensson, G.: Large-scale circulation associated with moisture intrusions into the Arctic during winter: Moisture Intrusions during Arctic Winter, Geophys. Res. Lett., 40, 4717–4721, https://doi.org/10.1002/grl.50912, 2013. a, b
You, C., Tjernström, M., Devasthale, A., and Steinfeld, D.: The Role of Atmospheric Blocking in Regulating Arctic Warming, Geophys. Res. Lett., 49, e2022GL097899, https://doi.org/10.1029/2022GL097899, 2022. a, b
Yu, Y., Xiao, W., Zhang, Z., Cheng, X., Hui, F., and Zhao, J.: Evaluation of 2-m Air Temperature and Surface Temperature from ERA5 and ERA-I Using Buoy Observations in the Arctic during 2010–2020, Remote Sens.-Basel, 13, 2813, https://doi.org/10.3390/rs13142813, 2021. a
Ziereis, H. and Gläßer, M.: HALO - Global Player für die Atmosphärenforschung, Deutsches Zentrum für Luft- und Raumfahrt (DLR), 32–36, https://elib.dlr.de/51508/ (last access: 4 July 2024), 2006. a
- Abstract
- Introduction
- Data and methods
- Overview of the campaign period
- Warm air intrusions
- Cold air outbreaks
- Effect of WAIs on sea ice conditions
- Summary
- Appendix A: Integrated water vapor transport for moist and warm air intrusions
- Appendix B: Pressure constellation during the warm and cold periods
- Code and data availability
- Author contributions
- Competing interests
- Disclaimer
- Special issue statement
- Acknowledgements
- Financial support
- Review statement
- References