the Creative Commons Attribution 4.0 License.
the Creative Commons Attribution 4.0 License.
 | 11 Jul 2024
The correlation between Arctic sea ice, cloud phase and radiation using A-Train satellites
Olivia Pierpaoli
Matteo Ottaviani
Zhonghai Jin
Israel Silber
Climate warming has a stronger impact on Arctic climate and sea ice cover (SIC) decline than previously thought. Better understanding and characterization of the relationship between sea ice and clouds and the implications for surface radiation is key to improving our confidence in Arctic climate projections. Here we analyze the relationship between sea ice, cloud phase and surface radiation over the Arctic, defined as north of 60° N, using active- and passive-sensor satellite observations from three different datasets. We find that all datasets agree on the climatology of and seasonal variability in total and liquid-bearing (liquid and mixed-phase) cloud covers. Similarly, our results show a robust relationship between decreased SIC and increased liquid-bearing clouds in the lowest levels (below 3 km) for all seasons (strongest in winter) but summer, while increased SIC and ice clouds are positively correlated in two of the three datasets. A refined map correlation analysis indicates that the relationship between SIC and liquid-bearing clouds can change sign over the Bering, Barents and Laptev seas, likely because of intrusions of warm air from low latitudes during winter and spring. Finally, the increase in liquid clouds resulting from decreasing SIC is associated with enhanced radiative cooling at the surface. Our findings indicate that the newly formed liquid clouds reflect more shortwave (SW) radiation back to space compared to the surface, generating a cooling effect of the surface, while their downward longwave (LW) radiation is similar to the upward LW surface emission, which has a negligible radiative impact on the surface. This overall cooling effect should contribute to dampening future Arctic surface warming as SIC continues to decline.
- Article
(4077 KB) - Full-text XML
-
Supplement
(2401 KB) - BibTeX
- EndNote


Clouds can have different radiative effects over the Arctic (Curry et al., 1996; Shupe and Intrieri, 2004), defined as north of 60° N: cooling in summer generated by sunlight reflection and warming in winter through longwave (LW) radiative heating of the surface. In a region where the warming can be up to 4 times larger than in the rest of the world (Boeke and Taylor, 2018), it is crucial to determine how clouds respond to climate change and whether their feedback will enhance or dampen the warming. While cloud feedback was shown to play a minor role in polar amplification in CMIP5 (Pithan and Mauritsen, 2014; Middlemas et al., 2020), studies using the most recent climate model generation (CMIP6) unveil a strong impact of extratropical mixed-phase clouds on global climate (Zelinka et al., 2020). Part of the uncertainty in determining cloud variability in polar regions stems from the extent to which Arctic clouds respond to sea ice loss (e.g., Kay and Gettelman, 2009; Morrison et al., 2018; Taylor and Monroe, 2023), which is still debated. Within the context of substantial decrease in sea ice extent over the past few decades (Kim et al., 2023), determining how clouds may be affected by this tremendous change is necessary to simulate realistic projections of polar climate.
The analysis of various observational datasets has led to consensus on the sensitivity of cloud fraction to sea ice extent variability in the fall but not in the summer (Kay and Gettelman, 2009; Morrison et al., 2018). As the sea ice cover (SIC) decreases in the fall, the cloud fraction increases, mostly attributable to low-level liquid clouds (Morrison et al., 2018). A more recent study also found a larger cloud fraction over open ocean than over sea ice in winter and spring (Taylor and Monroe, 2023). In general, these studies try to better understand the relationship between sea ice and clouds at the process level and show that clouds are most likely controlled by air–surface coupling. However, they focus on one specific dataset over a limited number of years and disregard the response of ice clouds and more broadly free-troposphere clouds, which can have a notable radiative impact (L'Ecuyer et al., 2019).
In this study, we build on their results to analyze the relationship between sea ice and clouds on longer timescales and advance our understanding of Arctic climate with the hope of providing constraint for climate models. We use cloud observations from three different datasets that discriminate between liquid, ice and mixed-phase clouds. The first dataset is constrained to the years 2007–2010 and is based on CloudSat–CALIPSO retrievals (DARDAR – raDAR/liDAR). The second is a new dataset based on CALIPSO-GOCCP that documents all liquid, mixed-phase and ice-only clouds from 2007 to 2020. The third is a passive-sensor satellite dataset based on MODIS retrievals (CERES – Clouds and the Earth's Radiant Energy System) and also provides surface flux retrievals. We also analyze all seasons over the whole Arctic Ocean. After describing the datasets, we show their climatology of the different Arctic cloud types for all seasons. We then perform a correlation analysis of the SIC with all cloud types. Additionally, we focus on the vertical structure of these cloud types as a function of sea ice conditions. Finally, we investigate the radiative impact of these clouds at the surface.
2.1 CALIPSO-PHACT
The PHAse Cloud Type (PHACT; Cesana and Silber, 2024) product development has been guided by recent ground-based observations to document the topmost liquid-bearing cloud layers for different cloud types (ice over liquid, liquid only, liquid seeded by ice above, mixed phase, multilayer and single layer, etc.) and for thin (optical depth ≲ 3) and opaque (optical depth ≳ 3) clouds. PHACT, which will be fully described in a separate paper, uses instantaneous CALIPSO-GOCCP profiles (Cesana and Chepfer, 2013; Chepfer et al., 2010). These profiles document cloud properties obtained from near-nadir lidar profiles at a 333 m along-track resolution and for 480 m altitude bins. Cloud-phase diagnostics are based on the cloud particle sphericity instead of temperature, in contrast with many passive sensors. Liquid- and ice-dominated altitude bins are discriminated using the polarization state of the laser return, which changes when backscattered by a non-spherical crystal as opposed to spherical droplets. In highly reflective layers, the distinction between the two water phases is more ambiguous, because of multiple scattering and noise, and results in undefined-phase clouds, which often correspond to mixed-phase clouds (Cesana et al., 2016).
PHACT 2D cloud covers and 3D cloud fractions differ from CALIPSO-GOCCP cloud-phase statistics in two main ways. First, PHACT provides ice-only (no liquid in the column) and mixed-phase (liquid with ice below, contiguous or not) cloud covers, in addition to the traditional liquid-phase (with possibly ice above) category. Second, the phase cloud cover is computed as the number of ice, liquid or mixed-phase cloudy profiles divided by the total number of profiles, consistent with the common definition of cloud cover:
where phase means ice, liquid or mixed phase.
As a result, the sum of ice-only, liquid and mixed-phase cloud covers cannot be greater than 1. We note a large difference in the magnitude of the vertical cloud profiles between CALIPSO-GOCCP and PHACT because PHACT is focused on the topmost liquid layer, whereas CALIPSO-GOCCP documents all available vertical levels. Additionally, PHACT contains a mixed-phase category which is not available in CALIPSO-GOCCP. Mixed-phase clouds are diagnosed when ice or undefined-phase clouds are retrieved below liquid, either directly underneath or not. Undefined-phase clouds are clouds that are located underneath highly reflective clouds (i.e., optically thicker; Cesana and Chepfer, 2013) and have been shown to be most likely mixed-phase clouds at subfreezing temperatures (Cesana et al., 2016). A validation study against in situ aircraft measurements shows that the maximum disagreement fraction between CALIPSO-GOCCP instantaneous profiles – used in PHACT – and five in situ aircraft flights is ∼ 11.8 % when accounting for in situ aircraft measurement uncertainty (Cesana et al., 2016; their Table 3).
2.2 CloudSat–CALIPSO DARDAR
The DARDAR product (raDAR/liDAR; Delanoë and Hogan, 2010) uses both CALIPSO and CloudSat observations to retrieve vertical profiles of cloud properties with a vertical and horizontal resolution of 60 m and 1.7 km, respectively. The DARDAR cloud-phase algorithm is based on the complementarity of the high sensitivity of the 532 nm lidar to small and spherical liquid droplets and the 94 GHz radar to large ice crystals. In addition, the algorithm also uses cloudy layer temperature and cloud geometrical thickness to determine cloud phase. DARDAR distinguishes between ice, mixed, supercooled and warm liquid clouds. A more detailed explanation of the algorithm is given by Mioche et al. (2015). Since DARDAR is not provided as a gridded Level 3 product (as opposed to CALIPSO-GOCCP, CALIPSO-PHACT and CERES), we have processed the vertical profiles for the available time period; computed the cloud-phase covers following the same definition as CALIPSO-PHACT; and computed pan-Arctic statistics onto a 1° × 1° grid, which was then interpolated to 2.5° × 2.5° grid. Similarly, we have used a cloud-phase classification for the 2D maps so that the sum of ice-only, liquid and mixed-phase cloud covers cannot be greater than 1 and, hence, is equal to the total cloud cover. Should we have used ice-containing and liquid-containing 2D cloud covers, we could have accounted for liquid or ice two times in the same profile, hence a cloud cover greater than 1.
We are not aware of a formal evaluation of the DARDAR product, but we note that when the lidar signal is fully attenuated (i.e., no more signal), the DARDAR algorithm attributes the ice phase to any cloudy pixels at subfreezing temperatures, which may lead to an overestimate of the ice cloud covers. In addition, Mioche et al. (2015) mention a potential overestimate of mixed-phase cloud due to excessive supercooled liquid detections, which may have been mitigated in the newer version of the DARDAR product, which is used here.
2.3 CERES
To study the surface fluxes, we use Clouds and the Earth’s Radiant Energy System (CERES) FluxByCldTyp – Level 3 (Sun et al., 2022), which also contains information about the cloud phase. The computation of all-sky and clear-sky fluxes assumes the same surface type, which means that the surface albedo is accounted for in the computations of cloud radiative effect (CRE) values (Sect. 3). The cloud and cloud-phase information is based on MODIS cloud properties. The phase is retrieved for daytime only using the newest MODIS collection 6 (MODIS C6) cloud-phase algorithm, which employed a decision tree logic based on four independent tests (Marchant et al., 2016): cloud top temperature, a tri-spectral infrared test using difference in brightness temperatures, a 1.38 µm test to determine the presence of cirrus clouds and a tri-spectral cloud effective radius test. We note that the MODIS C6 cloud phase has a large agreement fraction with CALIPSO science team cloud-phase retrievals (up to 90 %; Marchant et al., 2016) – for clouds that are detected by both instruments – and that the use of daytime-only observations is a limiting factor in our analysis (no cloud-phase data during the Arctic winter). The original grid of CERES dataset is 1° × 1°.
We use data from the 2007–2020 overlapping period for PHACT and CERES. DARDAR data are available for 2007–2010 and 2013–2017; however, this latter period is limited to daytime observations, and using it could introduce biases into the comparison. Although DARDAR 2013–2017 and DARDAR 2007–2010 show differences in the total cloud cover that are comparable to that of PHACT over the same time periods (Figs. S1 and S2 in the Supplement, bottom-right plots), major differences appear in DARDAR cloud-phase partitioning that do not in PHACT (Figs. S1 and S2, bottom rows). These differences suggest that using daytime-only data has a strong impact on DARDAR phase diagnostics.
Finally, all datasets are projected onto a 2.5° × 2.5° grid. We note that we find no significant impact of the spatial resolution – i.e., using either a 2.5° × 2.5° or a 1° × 1° grid – for PHACT total, ice and liquid cloud covers over the Arctic (not shown).
Figure 1 shows a comparison of ice, liquid, mixed-phase and total cloud covers for all the datasets. All three datasets agree very well on the total cloud cover. Interestingly, the datasets also detect a very similar liquid cloud cover (in terms of means and pattern correlations, Table 1 and Fig. S3) with a sharp contrast between land and sea and maxima over the Laptev, Barents and Greenland seas, even though they use independent methods to retrieve liquid layers. We note that CERES exhibits the largest quantity of liquid clouds for two reasons (47 %). First, it does not distinguish between mixed-phase and liquid clouds, and second, it does not include the winter season north of 70° N, which is the season with the least liquid cloud amount (Cesana et al., 2012, their Fig. 1). When accounting for all liquid-bearing clouds (i.e., liquid-only and mixed-phase clouds), the differences among datasets drastically lessen: 50 %, 50 % and 44 % for DARDAR, PHACT and CERES, respectively. It is worth noting that although CERES observations come from a passive sensor instrument, which makes it more challenging to detect clouds and retrieve their properties over bright surfaces, they are in good agreement with the two other active-sensor observations. The mixed-phase cloud category is also consistent between DARDAR and PHACT (pattern correlation r=0.56). Yet DARDAR diagnoses slightly more mixed-phase clouds than PHACT (25 % compared to 14 %), likely because the radar is able to penetrate the clouds deeper and detect precipitating ice below. In this regard, PHACT can be viewed as a lower bound in terms of mixed-phase cloud cover. On average, these mixed-phase clouds account for about 27 % of liquid-bearing clouds in PHACT and 50 % in DARDAR (Fig. S4, Table S1), which is closer to 73 % from Arctic ground-based measurements using a radar with a cloud detection sensibility similar to CloudSat (Silber et al., 2021). These discrepancies are attributable to lidar attenuation in the case of PHACT, which does not allow the lidar beam to reach the mixed-phase layer; to ground clutter in the case of CloudSat-based measurements, which prevents retrieving hydrometeors below 500 m; and to spatial variability (i.e., one data point in ground-based measurements against an Arctic-wide average in spaceborne measurements). Finally, the greatest differences between the datasets in terms of pattern correlation and cloud covers come from the ice clouds. DARDAR and CERES show more ice clouds than PHACT, and their pattern correlation are smaller than those from liquid clouds. To diagnose cloud cover, the DARDAR algorithm uses the CALIPSO Level 2 product, which averages the lidar signal along track up to 80 km to be able to retrieve the thinnest cirrus clouds. This may explain why DARDAR detects more ice clouds than PHACT – although they both use CALIPSO observations but may also cause false positive detections (Cesana et al., 2016). CERES reports larger ice cloud cover than PHACT because it does not diagnose the ice-only cloud column as in PHACT. When accounting for ice above liquid clouds as well as ice-only clouds, consistent with CERES observations, PHACT detects more ice clouds than CERES (Fig. S5).
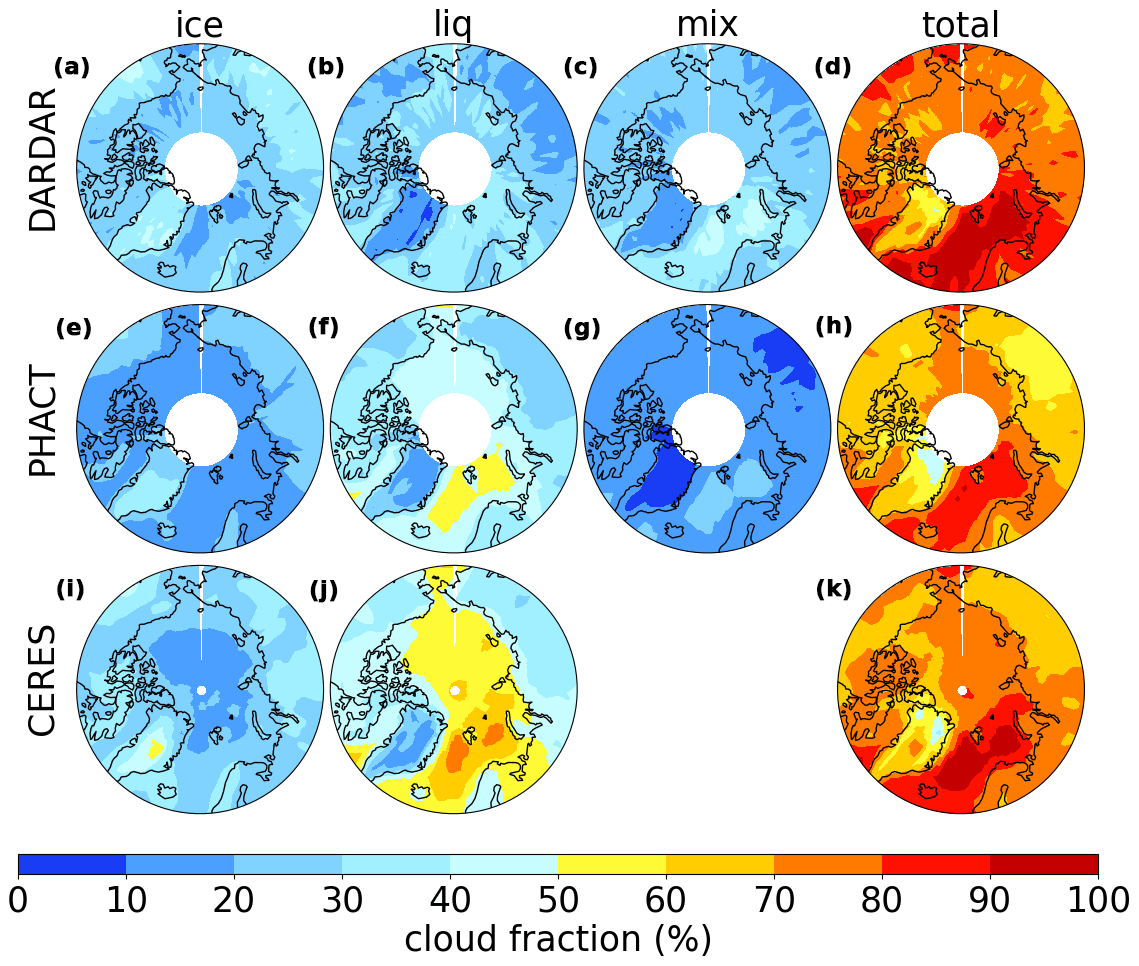
Figure 1Average cloud ice, liquid, mixed-phase and total cloud covers (%) for DARDAR (2007–2010; Delanoë and Hogan, 2010), PHACT (2007–2020; Cesana and Silber, 2024) and CERES (2007–2020; Sun et al., 2022).
Table 1Arctic area-weighted mean cloud covers (%) for all datasets from 2007–2010. We note a robust consistency in the liquid-bearing cloud cover among all datasets. NA – not available.
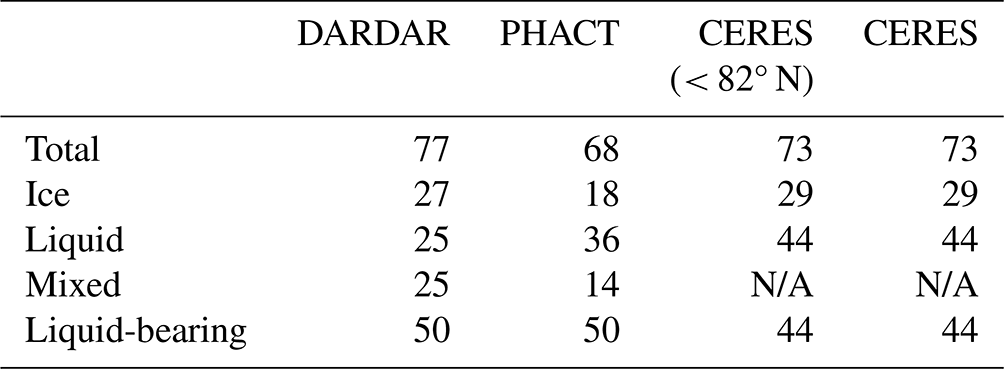
Figure 2 shows the seasonal variability in each cloud type over the Arctic for the three datasets. All datasets exhibit a maximum in fall and a minimum in winter in the total cloud cover, mostly driven by liquid-containing clouds (liquid and mixed phase), which is consistent with previous findings (e.g., Cesana et al., 2012; Lacour et al., 2017; McIlhattan et al., 2017; Mioche et al., 2015; Shupe, 2011). That seasonality of liquid clouds is mainly attributable to environmental conditions that favor liquid cloud formation, i.e., more moisture and mild temperature in summer and transition seasons compared to winter. Yet we note some small differences between CERES and the CALIPSO-based observations during the winter months, most likely because of the use of daytime-only observations in CERES, which restricts the latitudes during these months. As expected, ice cloud cover reaches its lowest value in summer (July) in all datasets, while its maximum occurs in the winter. Using 2007–2010 instead of 2007–2020 does not change our results qualitatively or quantitatively (Fig. S6).
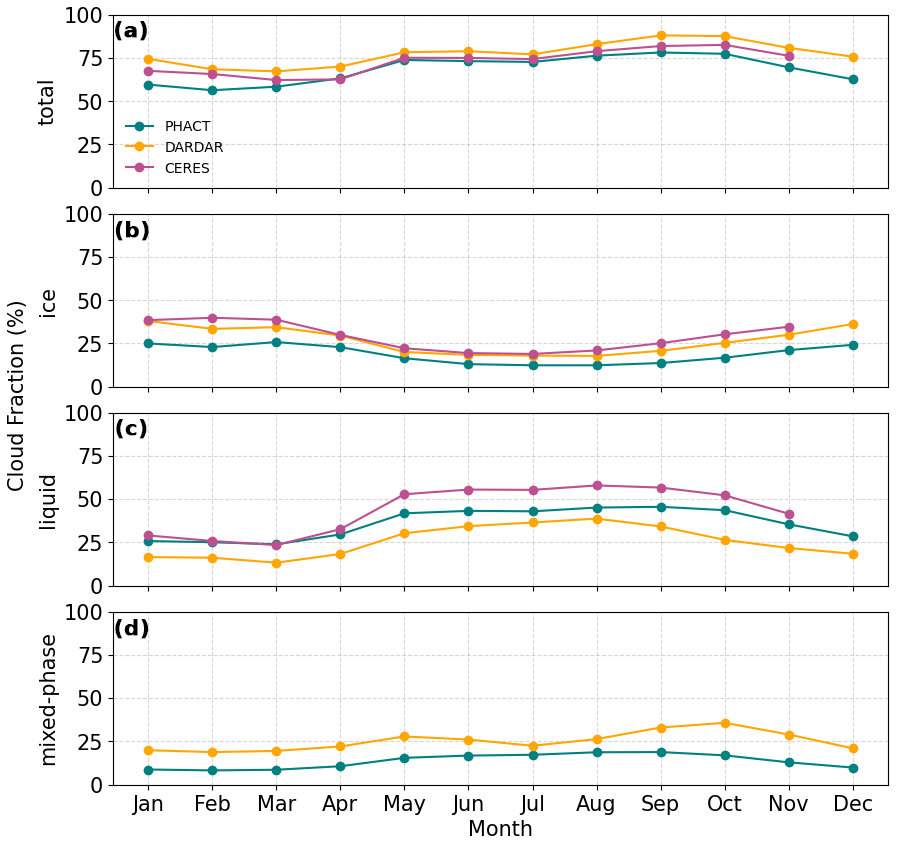
Figure 2Seasonal variability in the Arctic cloud cover (%) for DARDAR (orange, 2007–2010), CERES (purple, 2007–2020) and PHACT (green, 2007–2020).
Next, we explore the relationship between clouds and SIC variability. Given the relatively good agreement in the representation of the seasonal variability in liquid and total cloud covers between all datasets, we expect to find robust relationships between these clouds and SIC.
Table 2Colored table of spatial (first five columns) and temporal (last column) correlations between cloud types and SIC for all seasons and for DARDAR (2007–2010), PHACT (2007–2020) and CERES (2007–2020). Dark red and blue colors indicate strong correlations and anti-correlations, respectively.
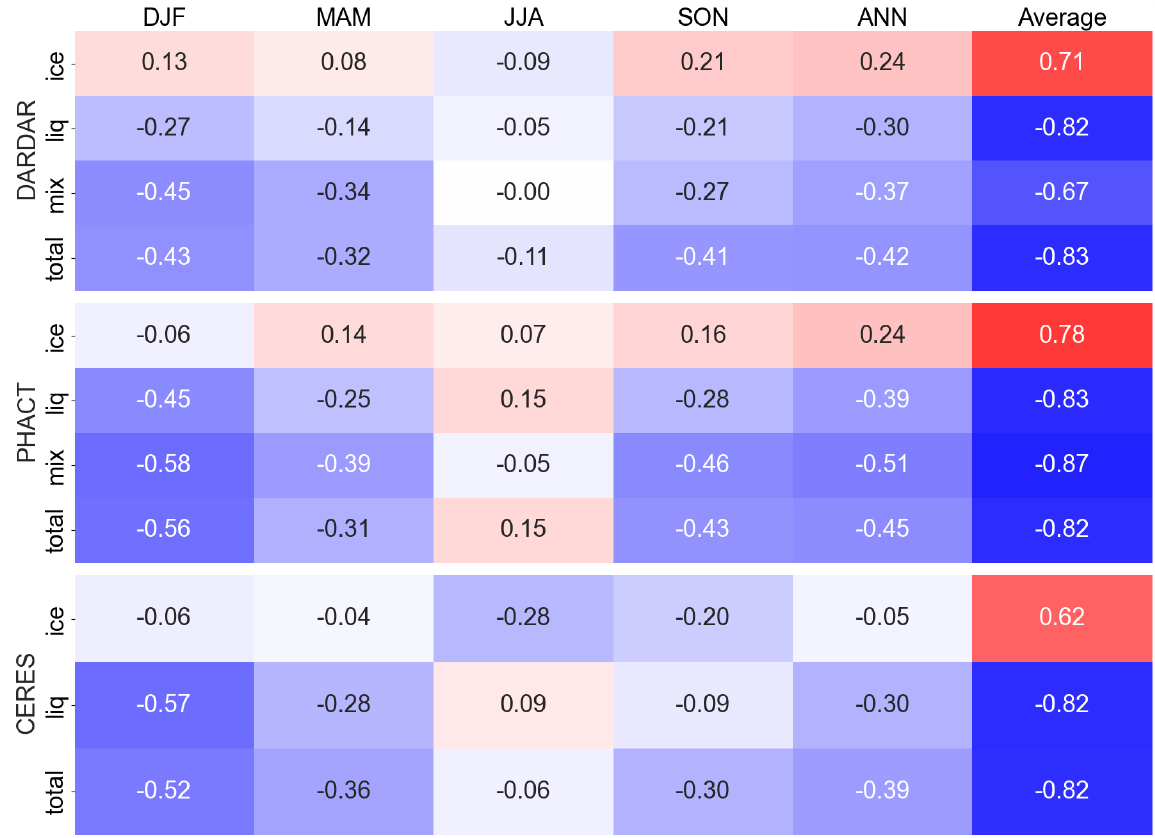
We compute spatial correlations between SIC and cloud covers from each cloud type for our three cloud datasets. Our SIC comes from ERA5 reanalysis, but we note that no substantial differences are found using a different dataset (Hadley Centre Sea Ice and Sea Surface Temperature, not shown). Furthermore, we focus on those grid boxes in which SIC varies over the time period, when averaged SIC is greater than 0.01 (excluding open-ocean-only grid boxes) and smaller than 0.99 (excluding sea-ice-covered-only grid boxes). Using a more restrictive thresholds (0.02 and 0.98 or 0.03 and 0.97) does not affect our results qualitatively (Table S1). Our results are consistent with the previous literature. We find large and significant negative correlations between SIC and liquid and total cloud covers from all datasets (Table 2). In addition, our results show little to no correlation between SIC and liquid cloud cover for the summer, consistent with previous studies (Kay and Gettelman, 2009; Morrison et al., 2018). More surprisingly, our analysis indicates that the ice cloud cover is somewhat positively correlated with SIC in all datasets, though less so in CERES likely because of liquid cloud contamination, which, to our knowledge, has not been reported in the literature before. It is also interesting to note that these correlations are stronger when comparing temporal variability in SIC and cloud covers (temporal correlation) although slightly weaker when using all grid boxes (Figs. 3, 4, 5) rather than first averaging across the Arctic (Table 2, last column). This discrepancy might be indicative of the influence of local parameters other than sea ice on clouds; when looking from a pan-Arctic perspective, this local influence fades out and the presence of sea ice is associated with synoptical meteorological conditions that favor ice cloud formation and hinder that of liquid clouds.
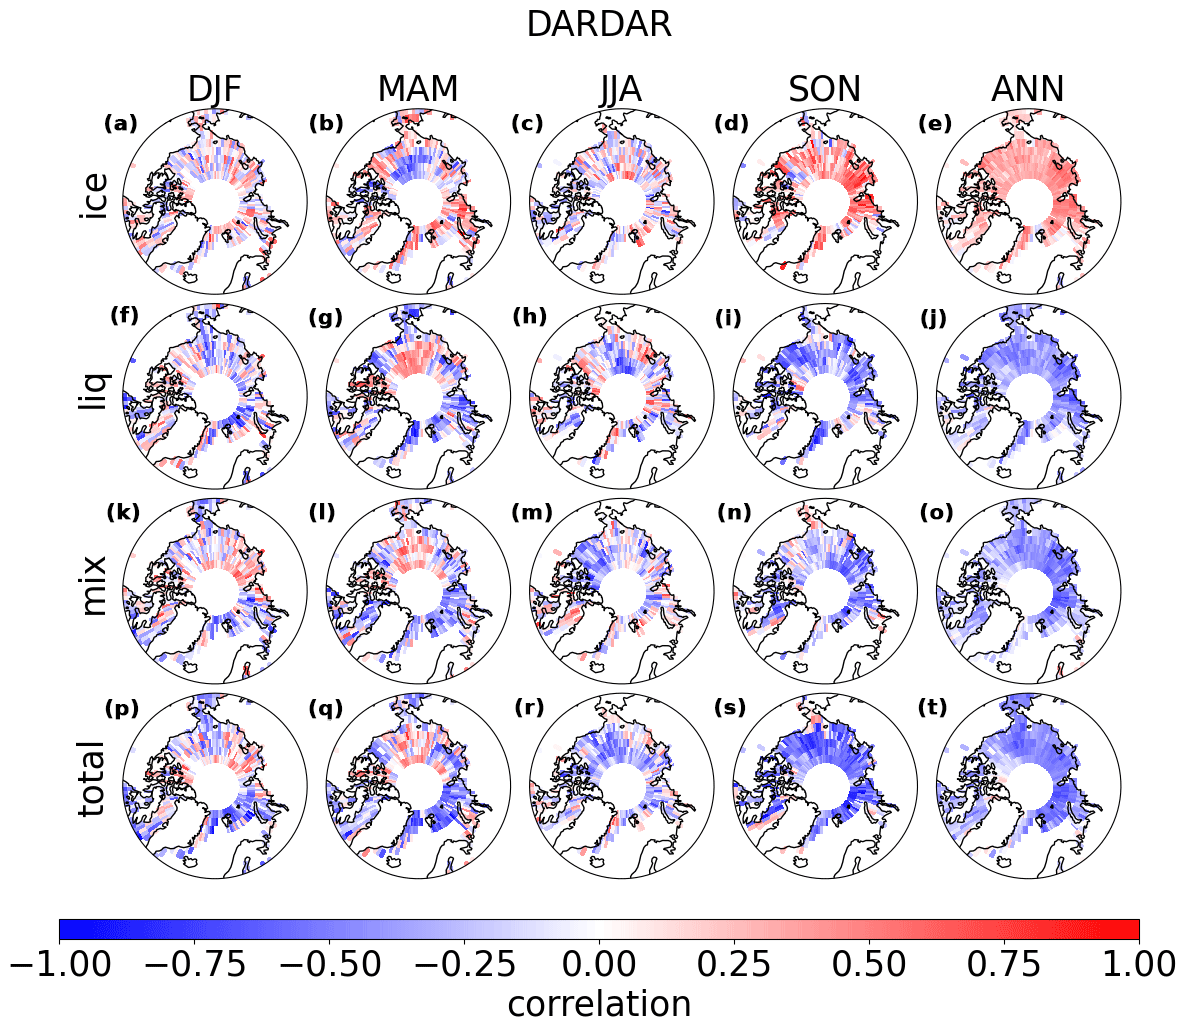
Figure 3Maps of correlations between DARDAR cloud types and SIC for each season (2007–2010).
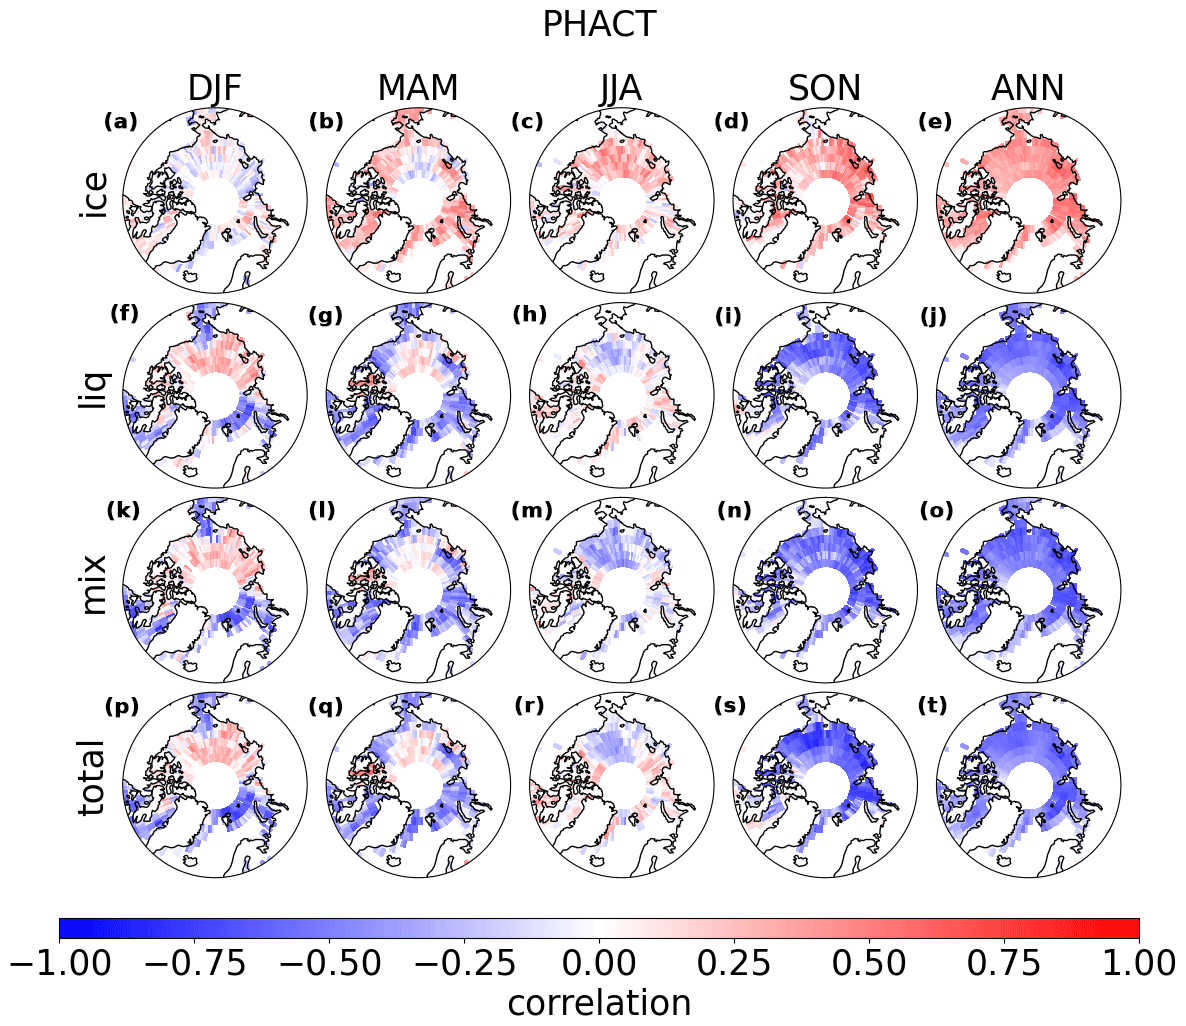
Figure 4Maps of correlations between PHACT cloud types and SIC for each season (2007–2020).

Figure 5Maps of correlations between CERES cloud types and SIC for each season (2007–2020).
The correlation maps help us better understand the variability in the relationships between each cloud type and SIC as a function of the seasons (Figs. 3, 4, 5). For liquid clouds (second row), the correlations are generally negative in the fall and spring, while in summer little correlation is found and, in winter, it is mostly negative except over the Bering, Barents and Laptev seas. This exception might be explained by the incursion of moist and warm air from the Aleutian Low – a frequent large-scale atmospheric pattern during the Arctic cold season (Overland et al., 1999). The advection of moist air strongly affects Arctic surface temperatures (Shulski et al., 2010). This moist air incursion results in the formation of liquid clouds at subfreezing temperatures in that area, while the sea ice continues to build up, even though a strong Aleutian Low can reduce sea ice growth (Walsh et al., 2017; Dörr et al., 2021). Since these correlations occur mostly over grid boxes in which SIC is close to 1 – and does not vary much – the total correlation (Table 2) remains highly negative, even more so than in SON. We speculate that it is more difficult for liquid clouds to form over sea ice than it would be in fall because of the lower temperatures – for similar environmental conditions – hence the stronger negative correlations in winter. We find similar patterns for the mixed-phase and total cloud correlation maps, which are clearly dominated by the response of liquid-containing clouds (liquid-only and mixed-phase clouds). Furthermore, we find that the correlations are even stronger for mixed-phase clouds than for liquid clouds in PHACT. In this dataset, the mixed-phase cloud are more opaque than liquid clouds. The recent literature suggests that opaque clouds are at a more mature stage of their lifecycle than thin clouds (Silber et al., 2020), and therefore, they would have to linger over open ocean for longer to reach that mature stage, which could explain the stronger correlations of mixed-phase clouds with open ocean compared to optically thinner liquid clouds. The results are more diverse among the datasets when it comes to ice clouds. The correlations are mostly positive in PHACT (except in winter). DARDAR correlations are consistent with those from PHACT in spring and fall, while CERES correlations are both negative and positive depending on the season. Despite some disagreements, likely related to the difference in ice cloud definitions, all products agree on positive correlations when using all months. Ice clouds may have two distinct origins: high cirrus clouds mostly controlled by synoptic-scale dynamics through so-called intrusions from lower latitudes (Pithan et al., 2018) and low and mid-level ice clouds driven by either small convective pockets or local increases in moisture fluxes, which form liquid clouds first and then ice clouds (Pithan et al., 2018). Over sea ice, both of these processes might be enhanced because the air is generally colder, explaining positive correlations between ice clouds and sea ice.

Figure 6Effect of sea ice conditions on cloud-type profiles (%) for PHACT (a–d, 2007–2020), CALIPSO-GOCCP (e–h, 2007–2020) and DARDAR (i–l, 2007–2010).
Next, we take advantage of the active-sensor profiling capability to investigate changes in each cloud-type profile as a function of the surface conditions to determine what altitude contributes the most to cloud variability (Fig. 6). Here we compute the difference in cloud-type profiles above open-ocean minus sea-ice-covered grid boxes, where open-ocean and sea ice grid boxes are defined as SIC < 0.4 and SIC > 0.6, respectively, in order to maximize the number of grid boxes utilized in the computation – using more restrictive thresholds does not change our results (see Fig. S7). Since PHACT only documents the uppermost ice cloud level, we also analyze observations from CALIPSO-GOCCP, which documents all cloudy levels and uses the same cloud and phase diagnostics as well as resolution as PHACT. These results are consistent with our correlation analysis and provide additional insights. At the low levels (below 3 km), the cloud cover change is mostly driven by liquid clouds and the mixed-phase clouds behave like the liquid clouds, which increase over open ocean during all seasons but summer (Fig. 6c, g, k and d, h, l). In DARDAR and CALIPSO-GOCCP, the ice cloud fraction also increases substantially during the winter and spring seasons, albeit to a smaller extent in CALIPSO-GOCCP (Fig. 6f–j). This is not captured by PHACT (Fig. 6b), a product that only documents the uppermost ice cloud layer. The boundary layer is the main contributor in PHACT and CALIPSO-GOCCP. In DARDAR however – and in CALIPSO-GOCCP to a smaller extent – the ice cloud fraction increases substantially over open ocean at middle and high levels in all seasons. Yet the associated ice cloud cover changes are negative in all products, which means that ice clouds are less frequent but more vertically extended over open ocean. Stronger and more frequent convection over open ocean compared to sea ice surface could very well explain this result.
Table 3Area-weighted changes in longwave, shortwave and net surface cloud radiative effects (W m−2) between open-ocean and sea ice grid boxes (CERES, 2007–2020).


Figure 7Maps of correlations between CERES surface net cloud radiative effects and SIC for each season (2007–2020).
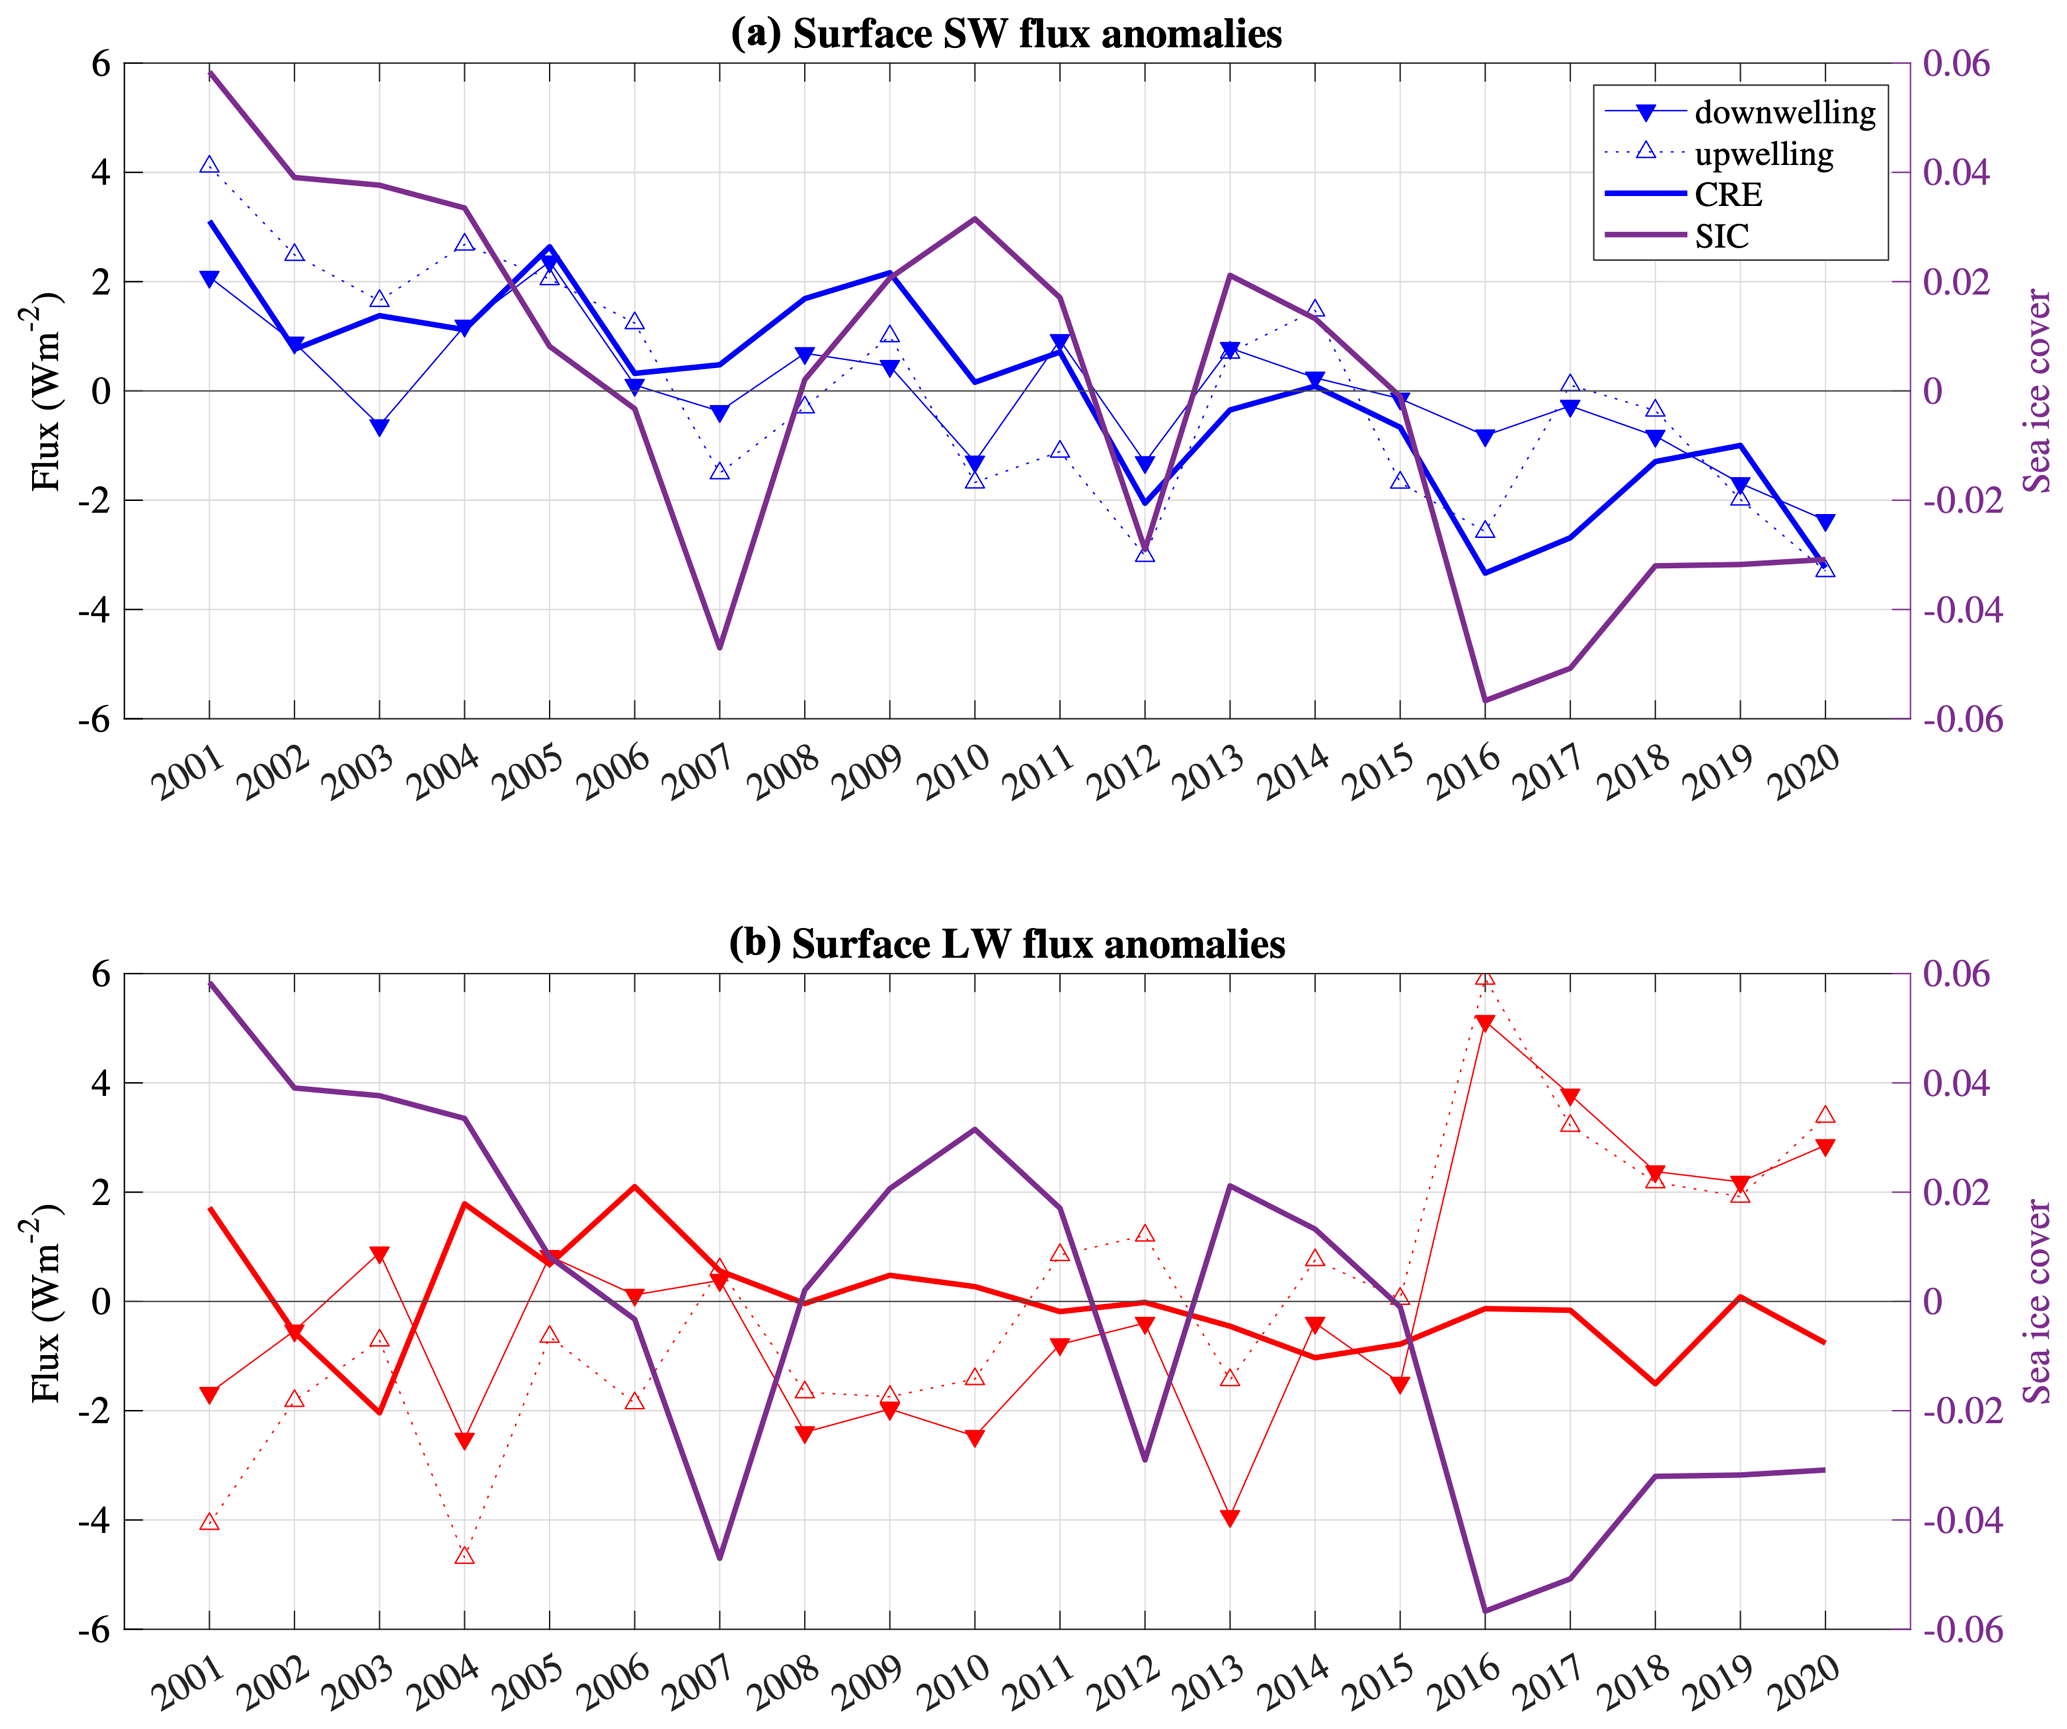
Figure 8Time series of surface SW and LW flux and SIC anomalies from CERES observations and ERA5 reanalysis (2001–2020). The downwelling, upwelling and CRE fluxes correspond to downward-pointing triangles, upward-pointing triangles and thick solid lines, respectively, for SW (a) and LW (b) radiation, while SIC is shown in purple.
Finally, in order to determine the radiative impact of these cloud changes, we compute net surface LW, shortwave (SW) and total CRE for open-ocean and sea-ice-covered conditions following the same method as described in the above paragraph (Table 3). Our results indicate that the increase in cloud cover over open ocean, driven by low-level liquid clouds, corresponds to stronger cooling in all seasons but winter, attributable to larger SW reflection than LW absorption. The correlation maps between SIC and the net effect of the clouds at the surface (Fig. 7) are consistent with the correlations found between SIC and liquid cloud covers, albeit of opposite sign. On the one hand, SIC is positively correlated with net SW CRE at the surface (Fig. 7f–j) because the reduction in liquid clouds generated by increased SIC allows more SW radiation to be absorbed. On the other hand, fewer liquid clouds also reduce the net LW CRE warming at the surface, resulting in a negative correlation of net LW CRE and SIC (Fig. 7a–e). Yet we note that even when the correlation between clouds and SIC is low (e.g., in summer, Fig. 5h), the correlation between net CRE and SIC remains high (Fig. 7h), emphasizing the importance of the underlying surface type for surface CRE. Finally, our results show that the correlation of the net total CRE with sea ice is dominated by the SW component for all seasons but winter.
To gain additional insights into surface fluxes, we analyze annual anomalies of SW and LW downwelling, upwelling and CRE fluxes together with SIC over a longer record (2001–2020; Fig. 8). We find that, as SIC decreases, SWdn (subscript “dn” and “up” denote downwelling and upwelling, respectively) decreases because more SW radiation is blocked by clouds (Fig. 8a). Simultaneously, SWup decreases because the surface albedo is reduced (i.e., bright sea ice being replaced by dark ocean). Overall, this strengthens the cooling effect of clouds at the surface (i.e., more negative SW CRE), which is consistent with the previous literature looking at surface SW CRE trends during spring and summer (Lelli et al., 2023). For LW (Fig. 8b), LWdn increases, likely driven by the formation of additional low-level liquid clouds that emit LW down to the surface, and LWup increases as the surface gets warmer. These changes cancel out each other, which results in a LW CRE that remains neutral.
Using three independent active- and passive-sensor satellite datasets from the A-Train, we analyze the relationship between sea ice, cloud phase and surface radiation over the Arctic (north of 60° N). We find that all three satellite datasets depict a similar pattern and seasonal variability in total and liquid-bearing cloud covers, while DARDAR diagnoses far more ice clouds with distinct seasonal variability compared to PHACT and CERES. We then show that the strong negative correlation between Arctic cloud cover and sea ice cover (SIC) is primarily driven by liquid-bearing clouds from the lowest levels (i.e., below 3 km), for which mixed-phase clouds account for 27 % in PHACT and 50 % in DARDAR. This relationship is robust among all satellite observations for all seasons but summer, which is consistent with findings from previous studies using the CALIPSO liquid 3D cloud fraction (Morrison et al., 2018) and CALIPSO–CloudSat total 3D cloud fraction (Taylor and Monroe, 2023). Unlike in other studies though, we find slightly stronger negative correlations between liquid-bearing clouds and SIC during winter than fall, which could be due to winter lower temperatures that make it more difficult for liquid-bearing clouds to form over sea ice. Additionally, our seasonal maps of correlation reveal the presence of regional differences, which may be driven by local processes and synoptic circulation. In particular over the Bering, Barents and Laptev seas, winter and spring intrusions of low-latitude warm air change the sign of the correlation between liquid cloud cover and SIC. Furthermore, we show that ice-only clouds (DARDAR and PHACT) also correlate well with SIC on average (with some variability depending on the season), which has not been previously reported in the literature to our knowledge. Finally, the increase in liquid-bearing clouds with open-ocean conditions – and to some extent the decrease in ice clouds – is associated with more radiative cooling from clouds at the surface, attributable to a larger SW CRE cooling than LW CRE warming. Such a cooling effect is found in all seasons but winter, when the LW CRE warming exceeds the SW CRE cooling. A brief analysis of surface flux and SIC anomalies confirms that in response to SIC decrease, liquid-bearing clouds increase, and their associated radiative effect is a cooling of the surface driven by the SW component.
In response to climate warming, Arctic SIC has been declining and will most likely continue to do so in the future, with ice-free summers that could occur as early as 2030 (Kim et al., 2023). Within this context, it is important to quantify the effect of sea ice loss on clouds, which are a major contributor to the surface radiative budget. Our analysis suggests that optically thick low-level liquid clouds will be more frequent as SIC declines, and this process should contribute to mitigating Arctic surface warming, except in winter. These results could be used to assess the SIC–cloud relationship in climate models, which still struggle to represent the cloud-phase transition (Cesana et al., 2022, 2024b), and thereby help narrow down the large uncertainties in their representation of Arctic amplification (Boeke and Taylor, 2018).
The PHACT observations can be downloaded here: https://doi.org/10.5281/zenodo.11088539 (Cesana and Silber, 2024). The DARDAR instantaneous files were obtained from https://www.icare.univ-lille.fr/dardar/documentation-dardar-mask/ (last access: 9 July 2024, restricted access), and the gridded statistics were computed from the ICARE Data and Services Center and can be downloaded here: https://doi.org/10.5281/zenodo.11088101 (Cesana et al., 2024a). The CALIPSO-GOCCP files were downloaded from http://climserv.ipsl.polytechnique.fr/cfmip-obs/Calipso_goccp.html (Cesana and Chepfer, 2013). The CERES cloud-phase and flux observations were downloaded from the following CERES websites: https://ceres-tool.larc.nasa.gov/ord-tool/jsp/FluxByCldTypSelection.jsp (Sun et al., 2022) and https://ceres-tool.larc.nasa.gov/ord-tool/jsp/SYN1degEd41Selection.jsp (Sun et al., 2022), respectively. The ERA5 monthly means of sea ice cover were downloaded from the Climate Data Store website (https://cds.climate.copernicus.eu/cdsapp#!/dataset/reanalysis-era5-pressure-levels-monthly-means?tab=form, last access: 9 July 2024; https://doi.org/10.24381/cds.6860a573, Hersbach et al., 2023).
The supplement related to this article is available online at: https://doi.org/10.5194/acp-24-7899-2024-supplement.
GVC designed the study, carried out the analysis, processed PHACT data and drafted the figures. OP and LV processed the DARDAR and CERES datasets. OP finalized the processing of DARDAR data and prepared the figures and tables. GVC and IS developed the PHACT dataset. GVC wrote the manuscript with contributions from all co-authors.
The contact author has declared that none of the authors has any competing interests.
Publisher’s note: Copernicus Publications remains neutral with regard to jurisdictional claims made in the text, published maps, institutional affiliations, or any other geographical representation in this paper. While Copernicus Publications makes every effort to include appropriate place names, the final responsibility lies with the authors.
Grégory V. Cesana was partially supported by a CloudSat–CALIPSO RTOP grant at the NASA Goddard Institute for Space Studies. We would also like to thank the NASA Office of STEM Engagement at GISS, the Minority University Research and Education Project (MUREP), and the NASA OSTEM internship program for the support offered to Olivia Pierpaoli and Linh Vu. Resources supporting this work were provided by the NASA Center for Climate Simulation (NCCS) at the Goddard Space Flight Center. We thank NASA and CNES for giving access to CALIPSO observations and Climserv for giving access to CALIPSO-GOCCP observations and for providing computing resources.
This research has been supported by the National Aeronautics and Space Administration Interdisciplinary Research in Earth Science (NASA IDS, grant no. 80NSSC20K1523) and US Department of Energy's (DOE) Atmospheric System Research, an Office of Science Biological and Environmental Research program (grant no. DESC0021004).
This paper was edited by Ivy Tan and reviewed by Xia Li and one anonymous referee.
Boeke, R. C. and Taylor, P. C.: Seasonal energy exchange in sea ice retreat regions contributes to differences in projected Arctic warming, Nat. Commun., 9, 5017, https://doi.org/10.1038/s41467-018-07061-9, 2018. a, b
Cesana, G. and Chepfer, H.: Evaluation of the cloud thermodynamic phase in a climate model using CALIPSO-GOCCP, J. Geophys. Res.-Atmos., 118, 7922–7937, https://doi.org/10.1002/jgrd.50376, 2013 (data available at: http://climserv.ipsl.polytechnique.fr/cfmip-obs/Calipso_goccp.html, last access: 9 July 2024). a, b, c
Cesana, G. and Silber, I.: The PHAse Cloud Type (PHACT) product, Zenodo [data set], https://doi.org/10.5281/zenodo.11088539, 2024. a, b, c
Cesana, G., Kay, J. E., Chepfer, H., English, J. M., and de Boer, G.: Ubiquitous low-level liquid-containing Arctic clouds: New observations and climate model constraints from CALIPSO-GOCCP, Geophys. Res. Lett., 39, 1–6, https://doi.org/10.1029/2012GL053385, 2012. a, b
Cesana, G., Chepfer, H., Winker, D., Getzewich, B., Cai, X., Jourdan, O., Mioche, G., Okamoto, H., Hagihara, Y., Noel, V., and Reverdy, M.: Using in situ airborne measurements to evaluate three cloud phase products derived from CALIPSO, J. Geophys. Res., 121, 5788–5808, https://doi.org/10.1002/2015JD024334, 2016. a, b, c, d
Cesana, G. V., Khadir, T., Chepfer, H., and Chiriaco, M.: Southern Ocean Solar Reflection Biases in CMIP6 Models Linked to Cloud Phase and Vertical Structure Representations, Geophys. Res. Lett., 49, e2022GL099777, https://doi.org/10.1029/2022GL099777, 2022. a
Cesana, G., Pierpaoli, O., Vu, L., Ottaviani, M., and Li, Z.: DARDAR 1°x1° gridded statistics of cloud fraction by cloud phase type over the Arctic for the period 2007–2010, Zenodo [data set], https://doi.org/10.5281/zenodo.11088101, 2024a. a
Cesana, G. V., Ackerman, A. S., Fridlind, A. M., Silber, I., Del Genio, A. D., Zelinka, M. D., Chepfer, H., Khadir, T., and Roehrig, R.: Observational constraint on a feedback from supercooled clouds reduces projected warming uncertainty, Communications Earth & Environment, 5, 181, https://doi.org/10.1038/s43247-024-01339-1, 2024b. a
Chepfer, H., Bony, S., Winker, D., Cesana, G., Dufresne, J. L., Minnis, P., Stubenrauch, C. J., and Zeng, S.: The GCM-Oriented CALIPSO Cloud Product (CALIPSO-GOCCP), J. Geophys. Res., 115, D00H16, https://doi.org/10.1029/2009JD012251, 2010. a
Curry, J. A., Schramm, J. L., Rossow, W. B., and Randall, D.: Overview of Arctic Cloud and Radiation Characteristics, J. Climate, 9, 1731–1764, https://doi.org/10.1175/1520-0442(1996)009<1731:OOACAR>2.0.CO;2, 1996. a
Delanoë, J. and Hogan, R. J.: Combined CloudSat-CALIPSO-MODIS retrievals of the properties of ice clouds, J. Geophys. Res.-Atmos., 115, D00H29, https://doi.org/10.1029/2009JD012346, 2010. a, b
Dörr, J., Årthun, M., Eldevik, T., and Madonna, E.: Mechanisms of Regional Winter Sea-Ice Variability in a Warming Arctic, J. Climate, 34, 8635–8653, https://doi.org/10.1175/JCLI-D-21-0149.1, 2021. a
Hersbach, H., Bell, B., Berrisford, P., Biavati, G., Horányi, A., Muñoz Sabater, J., Nicolas, J., Peubey, C., Radu, R., Rozum, I., Schepers, D., Simmons, A., Soci, C., Dee, D., and Thépaut, J.-N.: ERA5 monthly averaged data on pressure levels from 1940 to present, Copernicus Climate Change Service (C3S) Climate Data Store (CDS) [data set], https://doi.org/10.24381/cds.6860a573, 2023. a
Kay, J. E. and Gettelman, A.: Cloud influence on and response to seasonal Arctic sea ice loss, J. Geophys. Res.-Atmos., 114, 1–18, https://doi.org/10.1029/2009JD011773, 2009. a, b, c
Kim, Y.-H., Min, S.-K., Gillett, N. P., Notz, D., and Malinina, E.: Observationally-constrained projections of an ice-free Arctic even under a low emission scenario, Nat. Commun., 14, 3139, https://doi.org/10.1038/s41467-023-38511-8, 2023. a, b
Lacour, A., Chepfer, H., Shupe, M. D., Miller, N. B., Noel, V., Kay, J., Turner, D. D., and Guzman, R.: Greenland Clouds Observed in CALIPSO-GOCCP: Comparison with Ground-Based Summit Observations, J. Climate, 30, 6065–6083, https://doi.org/10.1175/JCLI-D-16-0552.1, 2017. a
L'Ecuyer, T. S., Hang, Y., Matus, A. V., and Wang, Z.: Reassessing the Effect of Cloud Type on Earth's Energy Balance in the Age of Active Spaceborne Observations. Part I: Top of Atmosphere and Surface, J. Climate, 32, 6197–6217, https://doi.org/10.1175/JCLI-D-18-0753.1, 2019. a
Lelli, L., Vountas, M., Khosravi, N., and Burrows, J. P.: Satellite remote sensing of regional and seasonal Arctic cooling showing a multi-decadal trend towards brighter and more liquid clouds, Atmos. Chem. Phys., 23, 2579–2611, https://doi.org/10.5194/acp-23-2579-2023, 2023. a
Marchant, B., Platnick, S., Meyer, K., Arnold, G. T., and Riedi, J.: MODIS Collection 6 shortwave-derived cloud phase classification algorithm and comparisons with CALIOP, Atmos. Meas. Tech., 9, 1587–1599, https://doi.org/10.5194/amt-9-1587-2016, 2016. a, b
McIlhattan, E. A., L'Ecuyer, T. S., and Miller, N. B.: Observational evidence linking arctic supercooled liquid cloud biases in CESM to snowfall processes, J. Climate, 30, 4477–4495, https://doi.org/10.1175/JCLI-D-16-0666.1, 2017. a
Middlemas, E. A., Kay, J. E., Medeiros, B. M., and Maroon, E. A.: Quantifying the Influence of Cloud Radiative Feedbacks on Arctic Surface Warming Using Cloud Locking in an Earth System Model, Geophys. Res. Lett., 47, e2020GL089207, https://doi.org/10.1029/2020GL089207, 2020. a
Mioche, G., Jourdan, O., Ceccaldi, M., and Delanoë, J.: Variability of mixed-phase clouds in the Arctic with a focus on the Svalbard region: a study based on spaceborne active remote sensing, Atmos. Chem. Phys., 15, 2445–2461, https://doi.org/10.5194/acp-15-2445-2015, 2015. a, b, c
Morrison, A. L., Kay, J. E., Chepfer, H., Guzman, R., and Yettella, V.: Isolating the Liquid Cloud Response to Recent Arctic Sea Ice Variability Using Spaceborne Lidar Observations, J. Geophys. Res.-Atmos., 123, 473–490, https://doi.org/10.1002/2017JD027248, 2018. a, b, c, d, e
Overland, J. E., Adams, J. M., and Bond, N. A.: Decadal Variability of the Aleutian Low and Its Relation to High-Latitude Circulation, J. Climate, 12, 1542–1548, https://doi.org/10.1175/1520-0442(1999)012<1542:DVOTAL>2.0.CO;2, 1999. a
Pithan, F. and Mauritsen, T.: Arctic amplification dominated by temperature feedbacks in contemporary climate models, Nat. Geosci., 7, 181–184, https://doi.org/10.1038/ngeo2071, 2014. a
Pithan, F., Svensson, G., Caballero, R., Chechin, D., Cronin, T. W., Ekman, A. M. L., Neggers, R., Shupe, M. D., Solomon, A., Tjernström, M., and Wendisch, M.: Role of air-mass transformations in exchange between the Arctic and mid-latitudes, Nat. Geosci., 11, 805–812, https://doi.org/10.1038/s41561-018-0234-1, 2018. a, b
Shulski, M., Walsh, J., Stevens, E., and Thoman, R.: Diagnosis of extended cold-season temperature Anomalies in Alaska, Mon. Weather Rev., 138, 453–462, https://doi.org/10.1175/2009MWR3039.1, 2010. a
Shupe, M. D.: Clouds at Arctic Atmospheric Observatories. Part II: Thermodynamic Phase Characteristics, J. Appl. Meteorol. Clim., 50, 645–661, https://doi.org/10.1175/2010JAMC2468.1, 2011. a
Shupe, M. D. and Intrieri, J. M.: Cloud Radiative Forcing of the Arctic Surface: The Influence of Cloud Properties, Surface Albedo, and Solar Zenith Angle, J. Climate, 17, 616–628, https://doi.org/10.1175/1520-0442(2004)017<0616:CRFOTA>2.0.CO;2, 2004. a
Silber, I., Fridlind, A. M., Verlinde, J., Russell, L. M., and Ackerman, A. S.: Nonturbulent Liquid-Bearing Polar Clouds: Observed Frequency of Occurrence and Simulated Sensitivity to Gravity Waves, Geophys. Res. Lett., 47, 1–11, https://doi.org/10.1029/2020GL087099, 2020. a
Silber, I., Fridlind, A. M., Verlinde, J., Ackerman, A. S., Cesana, G. V., and Knopf, D. A.: The prevalence of precipitation from polar supercooled clouds, Atmos. Chem. Phys., 21, 3949–3971, https://doi.org/10.5194/acp-21-3949-2021, 2021. a
Sun, M., Doelling, D. R., Loeb, N. G., Scott, R. C., Wilkins, J., Nguyen, L. T., and Mlynczak, P.: Clouds and the Earth's Radiant Energy System (CERES) FluxByCldTyp Edition 4 Data Product, J. Atmos. Ocean. Tech., 39, 303–318, https://doi.org/10.1175/JTECH-D-21-0029.1, 2022 (data available at: https://ceres-tool.larc.nasa.gov/ord-tool/jsp/FluxByCldTypSelection.jsp, last access: 9 July 2024, and https://ceres-tool.larc.nasa.gov/ord-tool/jsp/SYN1degEd41Selection.jsp, last access: 9 July 2024). a, b, c, d
Taylor, P. C. and Monroe, E.: Isolating the Surface Type Influence on Arctic Low-Clouds, J. Geophys. Res.-Atmos., 128, e2022JD038098, https://doi.org/10.1029/2022JD038098, 2023. a, b, c
Walsh, J. E., Bieniek, P. A., Brettschneider, B., Euskirchen, E. S., Lader, R., and Thoman, R. L.: The exceptionally warm winter of 2015/16 in Alaska, J. Climate, 30, 2069–2088, https://doi.org/10.1175/JCLI-D-16-0473.1, 2017. a
Zelinka, M. D., Myers, T. A., McCoy, D. T., Po-Chedley, S., Caldwell, P. M., Ceppi, P., Klein, S. A., and Taylor, K. E.: Causes of Higher Climate Sensitivity in CMIP6 Models, Geophys. Res. Lett., 47, 1–12, https://doi.org/10.1029/2019GL085782, 2020. a