the Creative Commons Attribution 4.0 License.
the Creative Commons Attribution 4.0 License.
 | 05 Jul 2024
Measurement report: Size-resolved secondary organic aerosol formation modulated by aerosol water uptake in wintertime haze
Jing Duan
Ru-Jin Huang
Ying Wang
Haobin Zhong
Chunshui Lin
Wei Huang
Yifang Gu
Jurgita Ovadnevaite
Darius Ceburnis
Colin O'Dowd
This study investigated the potential effects of changes in inorganics on aerosol water uptake and, thus, on secondary organic aerosol (SOA) formation in wintertime haze based on the size-resolved measurements of non-refractory fine particulate matter (NR-PM2.5) in Xi'an, northwestern China. The composition of inorganic aerosol showed significant changes in winter 2018–2019 compared to winter 2013–2014, shifting from a sulfate-rich profile to a nitrate-rich profile. In particular, the fraction of sulfate and chloride decreased, but that of nitrate increased in the entire size range, while ammonium mainly increased at larger particle sizes. These changes thus resulted in a size-dependent evolution in water uptake. Increased water uptake was observed in most cases, mainly associated with enhanced contributions of both nitrate and ammonium, with the highest increase ratio reaching 5 %–35 % at larger particle sizes and higher relative humidity (RH>70 %). The non-negligible influence of chloride on aerosol water uptake was also emphasized. The random forest analysis coupled with a Shapley additive explanation algorithm (SHAP) further showed an enhanced relative importance of aerosol water in impacting SOA formation. Aerosol water exhibited a significant contribution to SOA formation during winter 2018–2019, particularly at larger particle sizes. The SHAP value of aerosol water increased alongside higher levels of aerosol water, indicating an enhanced contribution of aerosol water to SOA formation. This implies that the majority of enhanced aerosol water uptake at larger particle sizes and high RH might facilitate the efficient aqueous-phase SOA formation. This study highlights the key role of aerosol water as a medium to link inorganics and organics in their multiphase processes. As challenges to further improve China's air quality remain and because SOA plays an increasing role in haze pollution, these results provide insight into the size-resolved evolution characteristics and offer guidance for future controls.
- Article
(3419 KB) - Full-text XML
-
Supplement
(1110 KB) - BibTeX
- EndNote


Particulate matter with a diameter of less than 2.5 µm (PM2.5) has become a major concern with regard to air pollution, which is associated with adverse health effects and regional climate change (Huang et al., 2014; Cai et al., 2017; Burnett et al., 2018; An et al., 2019; Wu et al., 2022). During the past 2 decades, particulate pollution in China has attracted widespread attention, and many studies have been carried out to elucidate the aerosol characteristics and formation mechanisms in haze pollution (Zhang et al., 2015; Huang et al., 2019; Zhong et al., 2020; Zheng et al., 2021; Gu et al., 2023). Aerosol characteristics such as mixing state, hygroscopicity, and acidity are strongly influenced by particle size. The size distribution of aerosol components provides essential information to elucidate the formation and transformation processes in the atmosphere, e.g., the formation and growth of new particles or photochemical and aqueous-phase reactions (Craig and Ault, 2018; Kuang et al., 2020; He et al., 2021; Xu et al., 2021; Cai et al., 2022). Therefore, analyzing the characteristics of size-segregated aerosol is instrumental in comprehending their formation mechanisms in the atmosphere.
In recent years, China has implemented a series of control measures to improve air quality, including the introduction of desulfurization equipment, stricter emission standards for coal-fired power plants and industries, limitations on the number of on-road vehicles, and the replacement of coal combustion with natural gas (Fontes et al., 2017; Zheng et al., 2018; Zhang et al., 2020). As a result of these measures, the annual average concentration of PM2.5 in China has largely decreased, and air quality has improved (Zhang et al., 2019; Wang et al., 2020; Li et al., 2021). However, further improvement of China's air quality remains a challenge and requires more studies (Xu et al., 2019; Sun et al., 2020; Wang et al., 2022). A number of recent studies have shown changes in aerosol composition and properties since the state's two-phase program to clean China's air from 2013 to 2020, and many studies highlight the increasing contribution of secondary aerosols and the growing role of nitrate over sulfate in haze pollution (Xu et al., 2019; Li et al., 2021; Duan et al., 2022; Zhong et al., 2022; Lin et al., 2023). This is consistent with the faster decline in SO2 concentrations than in NO2 concentrations in recent years (Chu et al., 2020). Nitrate and sulfate are two main hygroscopic substances that absorb water and provide an aqueous environment on particles, facilitating multiphase chemistry (Herrmann et al., 2015; Wu et al., 2018). For instance, condensed water enables the partitioning of water-soluble, polar organic precursors into the aqueous phase, promoting the formation of secondary organic aerosol (SOA) (Wu et al., 2018; Lv et al., 2023). The water uptake capacity of aerosols is closely related to their chemical composition, mixing state, and size distribution (Liu et al., 2019; Kim et al., 2020). The transformation of sulfate and nitrate roles in haze pollution will inevitably induce changes in aerosol water uptake capacity. However, the size-segregated changes in aerosol composition and water uptake capacity as a consequence of air pollution controls in recent years are not well understood; thus, their impact on the SOA formation remains unclear (Xu et al., 2019; Lv et al., 2023).
In this study, we analyzed the size-resolved non-refractory fine particulate matter (NR-PM2.5) composition and OA sources in the winter of 2018–2019, and we compared these to those in the winter of 2013–2014 in Xi'an, northwestern China. Particularly, we examined the size-resolved changes in inorganic species and discussed the size-segregated evolution of aerosol water uptake induced by the changes in inorganics. Moreover, we investigated the potential influence of aerosol water uptake changes on SOA formation processes in wintertime haze.
2.1 Sampling and instrumentation
The campaigns in the winters of 2013–2014 and 2018–2019 were conducted at the campus of the Institute of Earth Environment, Chinese Academy of Sciences (34°23′ N, 108°89′ E) in downtown Xi'an, surrounded by traffic, residential, and commercial areas. Detailed descriptions of the samplings are provided in Elser et al. (2016) and Duan et al. (2022). For comparative analysis, data from 13 December 2013 to 6 January 2014 and from 23 December 2018 to 20 January 2019 were selected for this study, considering the similar time duration and the fact that both time frames include clean and haze periods. The size-resolved NR-PM2.5 composition was analyzed using a high-resolution time of flight aerosol mass spectrometer (HR-ToF-AMS, Aerodyne Research Inc.) in PToF mode for the winter of 2013–2014 and a soot particle long-time-of-flight aerosol mass spectrometer (SP-LToF-AMS, Aerodyne Research Inc.) in efficient PToF (ePToF) mode for the winter of 2018–2019. In our study, the SP-LToF-AMS operated as a standard LToF-AMS in “laser-off” mode, exclusively measuring non-refractory aerosols, aligning with the HR-ToF-AMS measurements. The LToF-AMS is an upgraded version of the HR-ToF-AMS, employing the same quantification principle for non-refractory organic and inorganic components while featuring an extended ToF mass spectrometer chamber to enhance mass resolution and a multiplexed chopper in ePToF mode for a higher sizing duty cycle during particle sampling. To ensure data comparability, ionization efficiency (IE) calibration and size calibration utilizing NH4NO3 were conducted for both instruments during the 2013–2014 and 2018–2019 campaigns, respectively. Detailed information on instrument operation and calibration can also be found in Elser et al. (2016) and Duan et al. (2022).
2.2 Data analysis
The SQuirrel (version 1.61D) and Pika (1.21D) software, coded in IGOR Pro 6.37 (WaveMetrics), were used to analyze the size-resolved data from HR-ToF-AMS for 2013–2014 and from SP-LToF-AMS for 2018–2019. Based on the NH4NO3 and (NH4)2SO4 calibrations, experimentally determined relative ionization efficiencies (RIEs) of 1.48 and 3.37 for 2013–2014 and 1.30 and 3.70 of for 2018–2019 were used for sulfate and ammonium, respectively. In comparison, default RIEs of 1.4, 1.1, and 1.3 were used for organics, nitrate, and chloride, respectively, according to previous studies (Canagaratna et al., 2007; Zhang et al., 2014; Xu et al., 2020). Additionally, incomplete detection due to particle bounce was calibrated based on the composition-dependent collection efficiency (CDCE) for both 2013–2014 and 2018–2019 (Middlebrook et al., 2012). The data and error matrices were preprocessed to obtain the size-resolved NR-PM2.5 composition (organics, , , , and Cl−), as well as OA mass spectra for 12–120.
2.3 Size-resolved OA source apportionment
Positive matrix factorization (PMF, Paatero and Tapper, 1994) and a multilinear engine (ME-2) in IGOR Pro (Paatero, 1999) were used to perform the source apportionment for the size-resolved OA mass spectra. We first binned the OA mass spectra in the range of 80–2500 nm into 10 size ranges (Table S1 in the Supplement). As the mass spectra of OA in the range of 80–112 nm and 1772–2500 nm in 2013–2014 contained many negative values, we primarily performed the OA source apportionment and result discussions for the mass spectra of the remaining eight size bins in the range of 112–1772 nm for both 2013–2014 and 2018–2019. The error matrices of size-resolved OA mass spectra were created using Eq. (1) according to the methods in Ulbrich et al. (2012) and Polissar et al. (1998):
where Uij refers to the uncertainty for the ith species in the jth row, and Cj refers to the measured mass loading. The 3 times standard deviations (3 s) of the 5 % lowest OA mass loading during the measurement periods were applied as the limits of detection (LODs). The relative uncertainties (u) of 20 % were used for the particles, in accordance with the transmission efficiency of the aerodynamic lens. Before PMF analysis, the ions with a signal-to-noise (SN) ratio of <0.2 were removed, and those with a ratio of were down-weighted by a factor of 2 (Xu et al., 2021).
A 2D matrix PMF was utilized to analyze the OA mass spectra in each size bin for both the 2013–2014 and 2018–2019 campaigns. Briefly, unconstrained PMF analysis with varied factor numbers was performed for OA mass spectra in each size bin during the winter campaigns of 2013–2014 and 2018–2019. The optimal factor number was selected based on the principle that decreasing the number of factors causes mixing between different sources, and increasing the number of factors leads to factor splitting and the occurrence of non-meaningful factors. The results were evaluated by comparing the mass spectral profiles with previous studies and the correlations with tracer species. The methodology of size-resolved PMF analysis and the selection of the best solutions are detailed in the Supplement (Supplemental Text S1). Two OA sources including primary organic aerosol (POA) and SOA were resolved in each size bin for 2013–2014, and three OA sources including fossil-fuel-related OA (FFOA), biomass burning OA (BBOA), and SOA were resolved in each size bin for 2018–2019 (Fig. S1–S4 in the Supplement). The evolution and comparison of size-resolved OA sources will be detailed in Sect. 3.3.
2.4 Calculation of aerosol liquid water content (ALWC) and mass growth factor for inorganic aerosols (Gmi)
The thermodynamic model ISORROPIA II was used to calculate the aerosol liquid water content (ALWC). We ran the model in “reverse” mode, in which inorganic aerosol components (, , , Cl−) combined with ambient temperature (T) and relative humidity (RH) were input as parameters (Fountoukis and Nenes, 2007). In addition, the simulation was run in “metastable” mode, and all components were assumed to be deliquescent. The thermodynamic equilibrium and phase state of those inorganic species were then simulated, and the ALWC (µg m−3) was calculated. The mass growth factor for inorganic aerosols (Gmi) was further calculated using the following equation:
where mi is the dry mass concentration of inorganic aerosol (µg m−3) (Song et al., 2019).
2.5 Random forest modeling
A decision-tree-based random forest model was developed to understand the observed trend in SOA. We analyzed the relationship between SOA and its influencing parameters, such as RH, T, Ox (O3+NO2), solar radiation (SR), and aerosol liquid water. In the random forest (RF) model, the whole dataset was randomly divided into a training dataset and a testing dataset. The training dataset contained 70 % of all the data and was used to build the model. The test data contained the remaining 30 % of all the data and was used to validate the model performance. The model's performance was evaluated based on the root mean square error (RMSE) and the correlation between predicted and observed values of the test data (R2) (Table S2 and Fig. S9 in the Supplement). To grow a tree, the number of independent and/or explanatory variables was set to 3, the minimum node size was set to 5, and the number of trees in the forest was set to 300, in accordance with Grange et al. (2018) and Wang et al. (2022). Moreover, the Shapley additive explanation (SHAP) algorithm was applied to evaluate the importance of each variable in predicting SOA. SHAP is a novel interpretable method for machine learning models based on the concept of the Shapley value in game theory, which can help in interpreting the complex model predictions (nonlinear fitting) and in quantifying the input variables' contributions to a single prediction (SOA) with physical significance (Lundberg et al., 2020). The functional expression of SHAP can be defined as follows:
where f(xi) denotes the predicted value produced for each sample (xi) with M features. ϕ0(f,x) serves as the base value representing the anticipated output value of the RF model across the dataset. Additionally, ϕj(f,xi) represents the SHAP value delineating the influence of feature j in the sample (xi) on the prediction of that specific sample (Lundberg et al., 2020).
3.1 Size-resolved changes in NR-PM2.5 composition
The average size distribution of NR-PM2.5 composition in winter in Xi'an and the relative changes between 2018–2019 and 2013–2014 are shown in Fig. 1. The peak diameter of total NR-PM2.5 in 2018–2019 (631–890 nm) was smaller than that in 2013–2014 (890–1256 nm). The mass fraction of total secondary inorganic species (SIAs, including sulfate, nitrate, and ammonium) in the total NR-PM2.5 increased from 28 % to 58 % as the particle size increased from 112 to 1772 nm in 2013–2014. Specifically, the mass fraction of sulfate displayed the largest increase from 8 % to 33 %, followed by nitrate from 8 % to 15 %, while ammonium maintained a relatively stable contribution of 10 % across the entire size range. In contrast, in 2018–2019 the mass fraction of SIAs in total NR-PM2.5 increased from 25 % to 51 % as the particle size increased from 112 to 1772 nm. Unlike in 2013–2014, the mass fraction of nitrate showed the most significant contribution from 12 % to 25 %, followed by sulfate from 6 % to 16 % and then ammonium from 8 % to 11 % in 2018–2019.
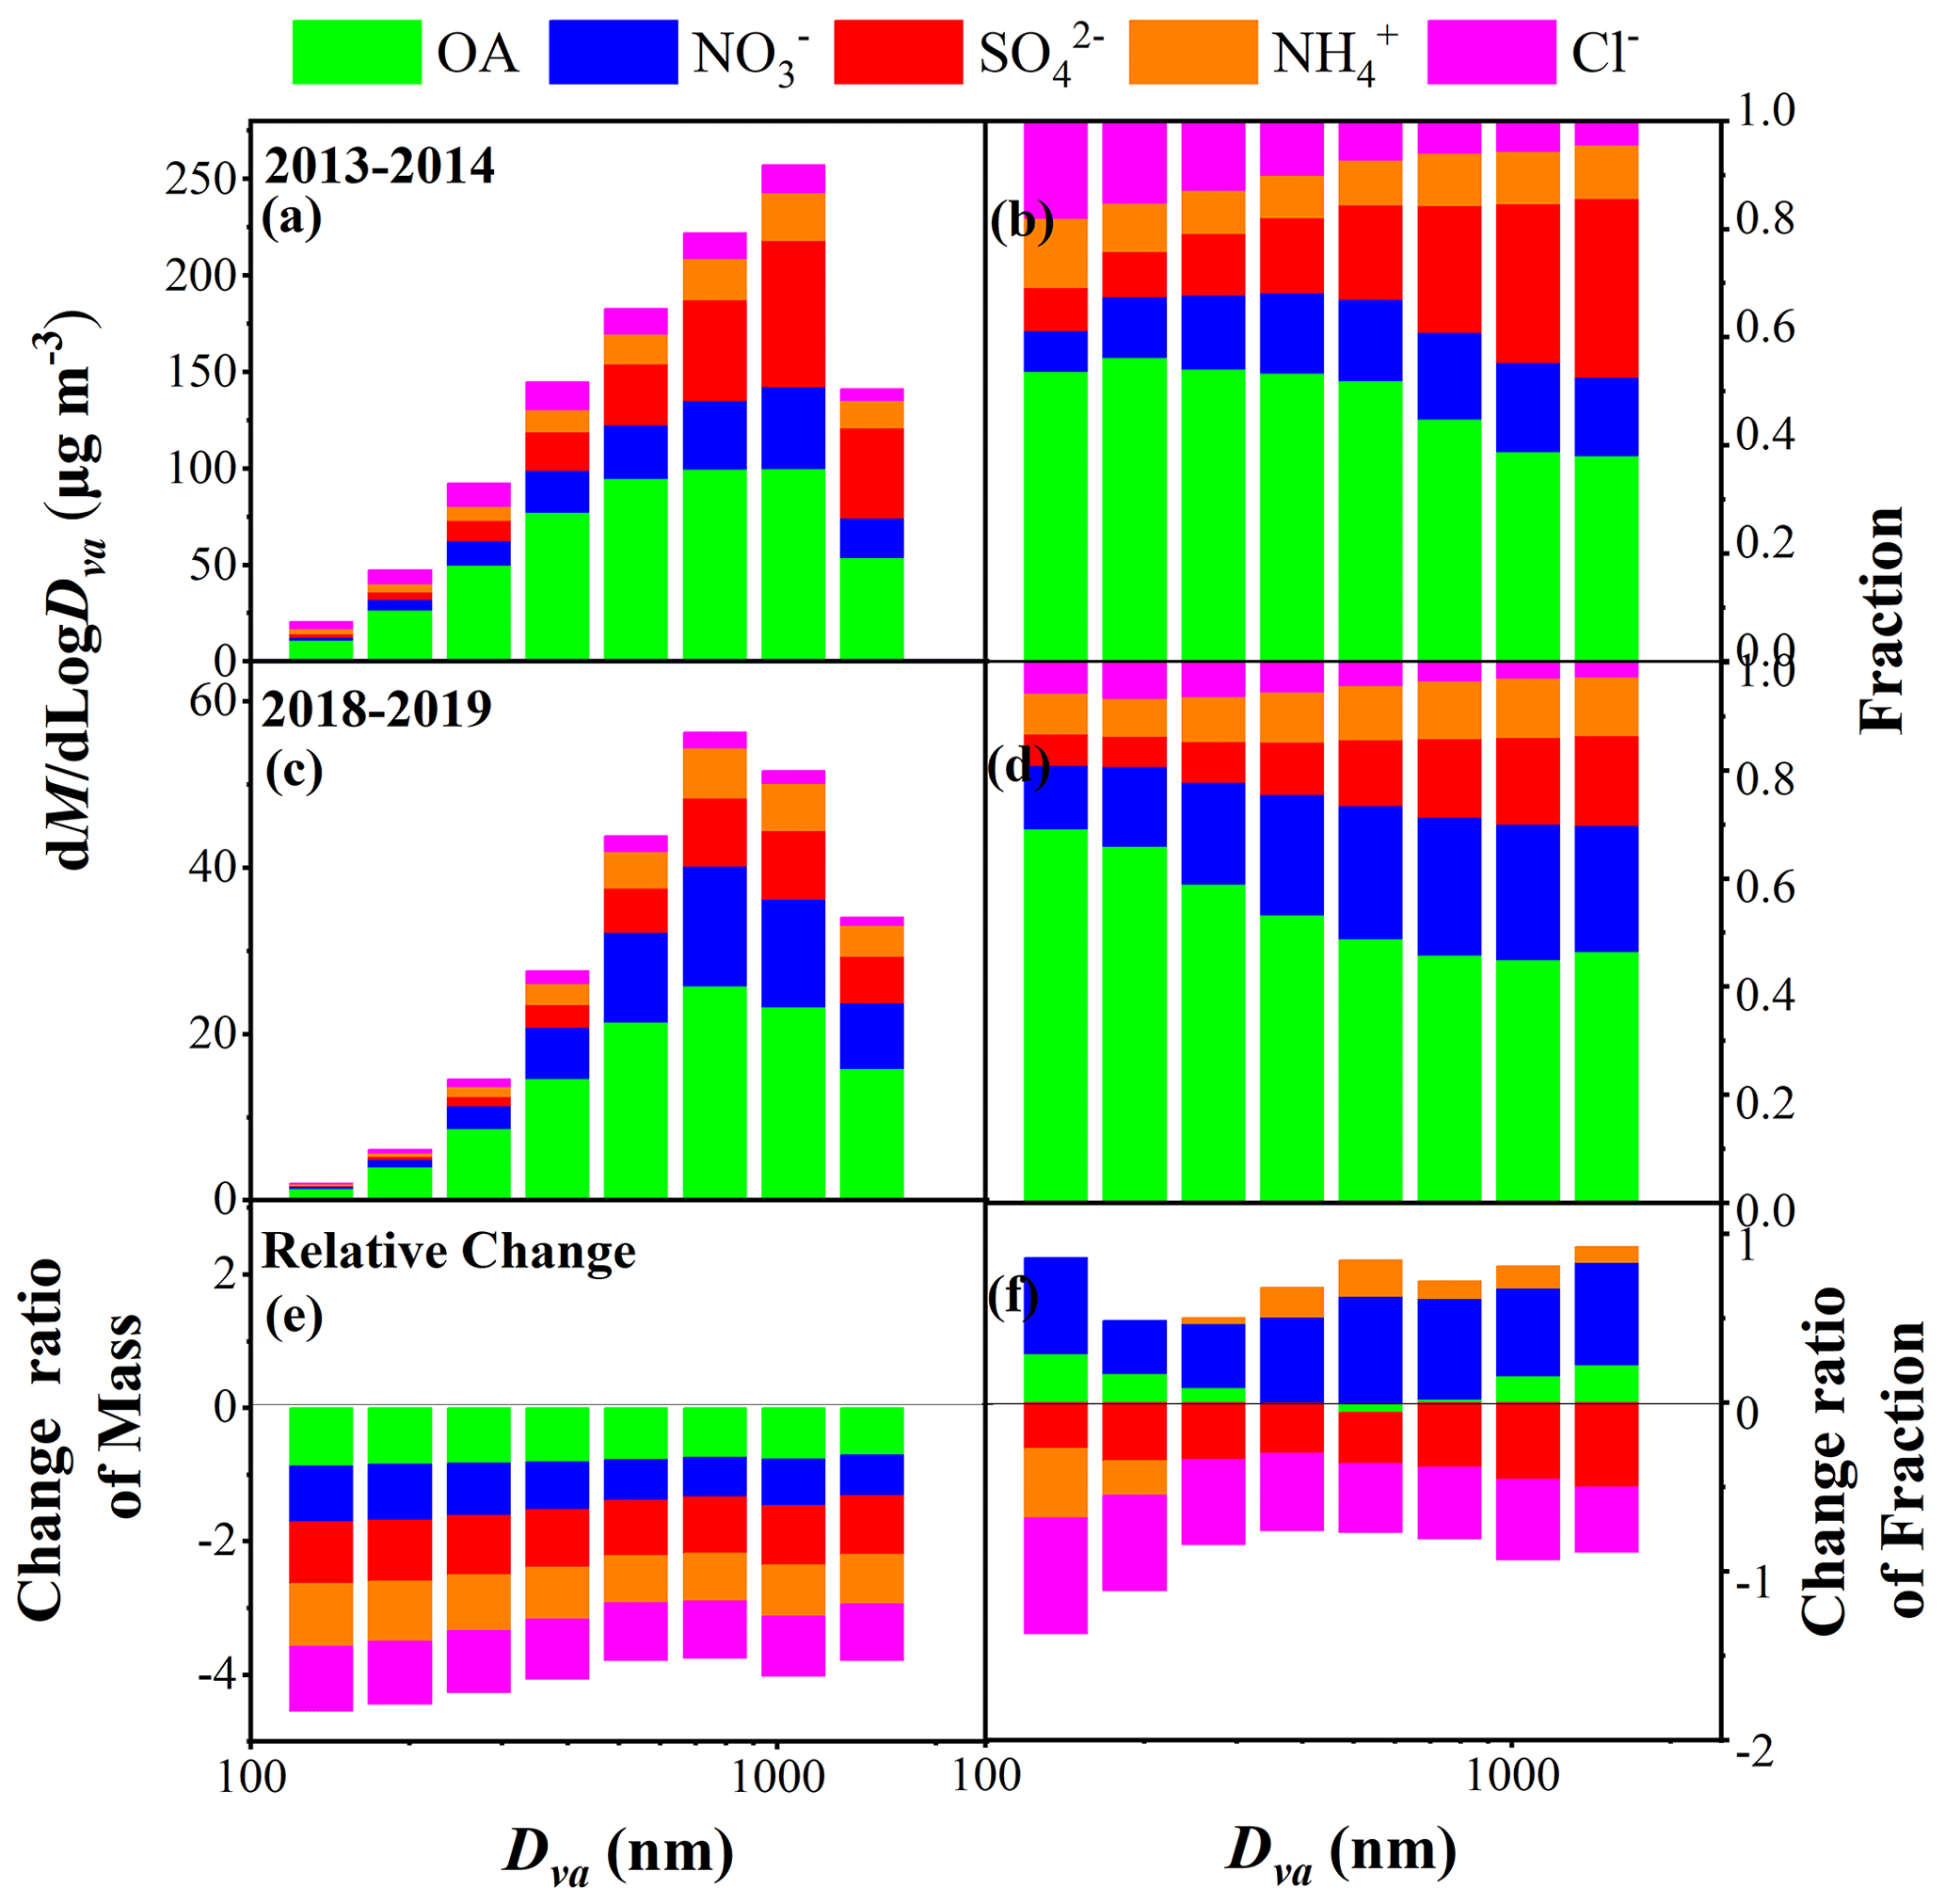
Figure 1Average size distributions of mass concentrations and fractions of NR-PM2.5 species (OA, , , and Cl−) in winter 2013–2014 (a, b) and winter 2018–2019 (c, d) in Xi'an, as well as the relative change ratios of mass and fraction in 2018–2019 compared to 2013–2014 (e, f).
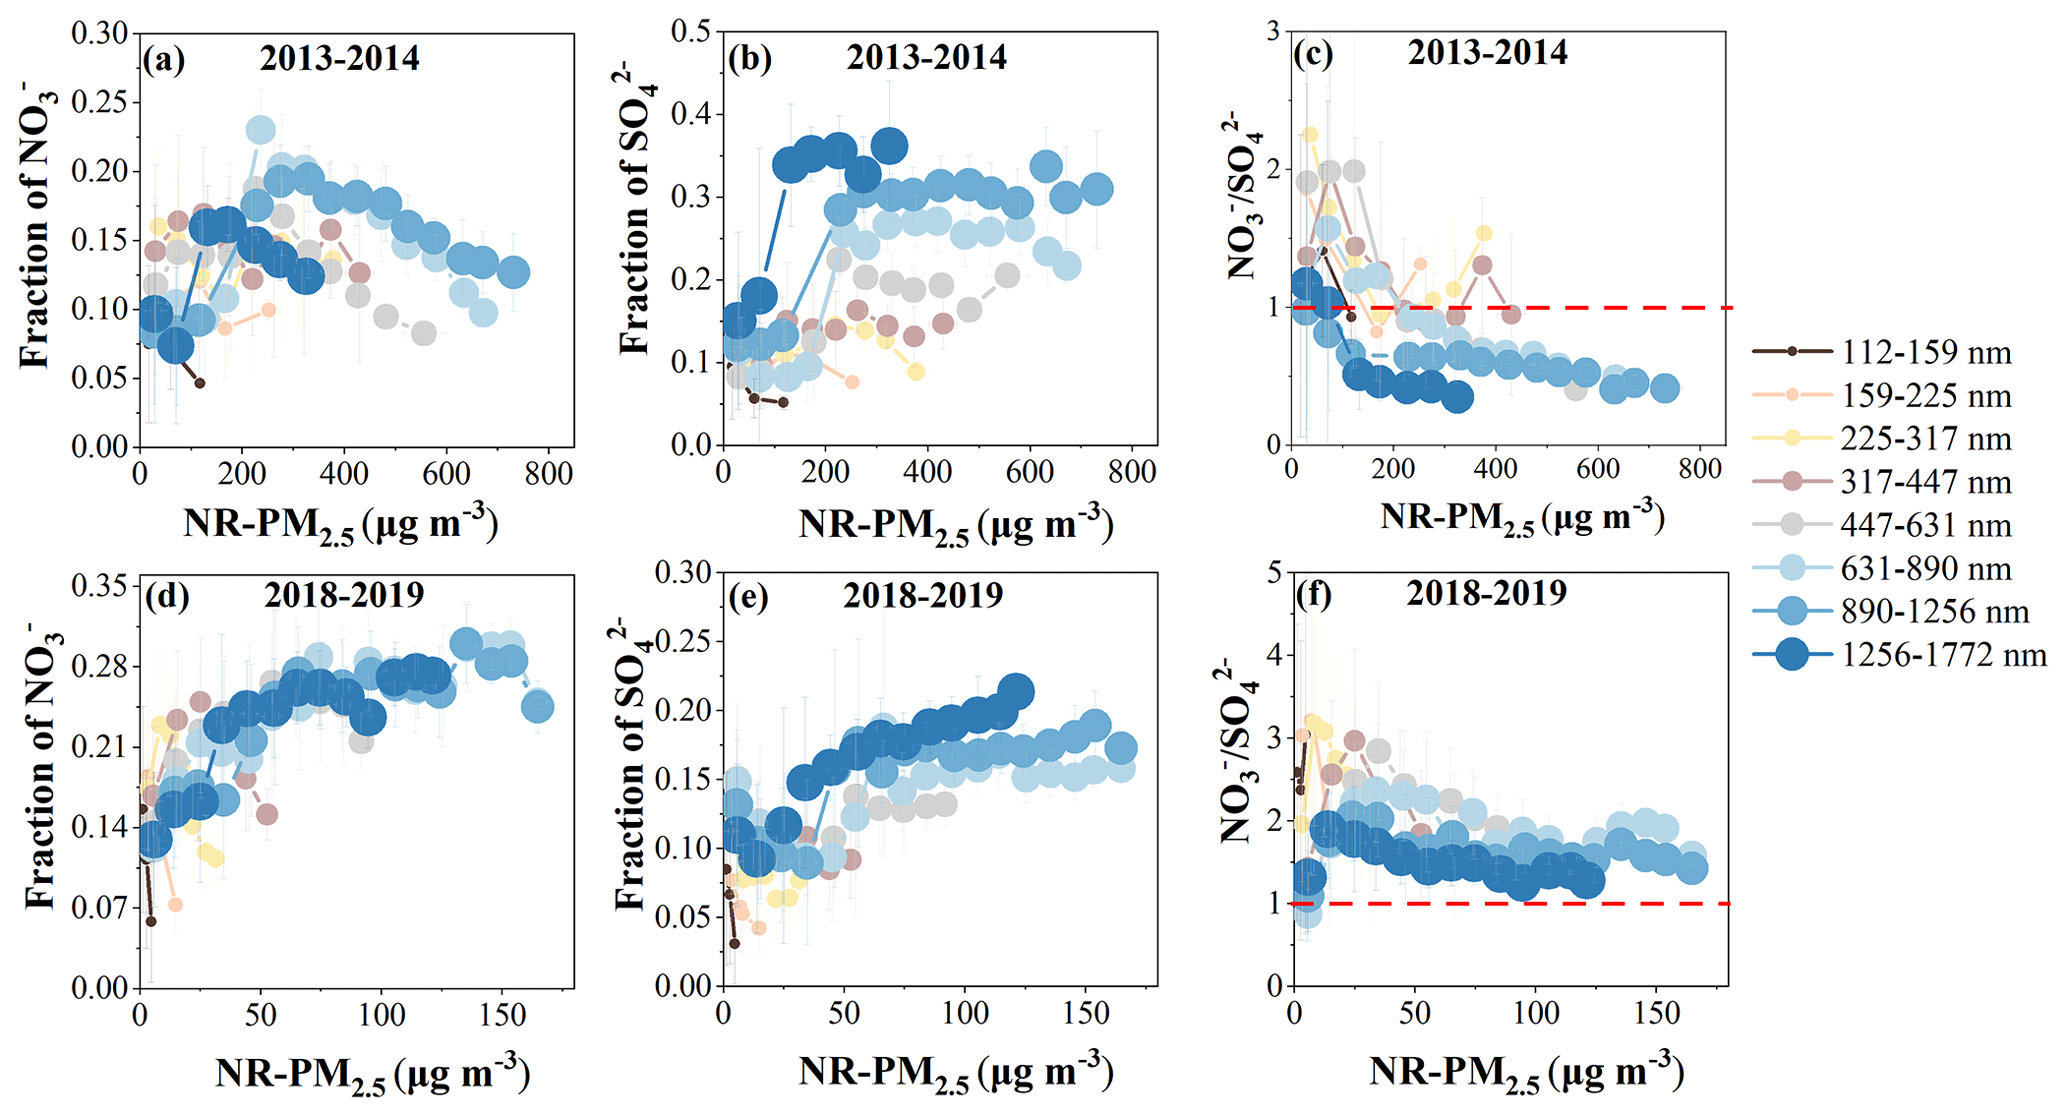
Figure 2Variations in the fractions of nitrate and sulfate, as well as in the ratio of at different NR-PM2.5 levels in winter 2013–2014 (a–c) and winter 2018–2019 (d–f).
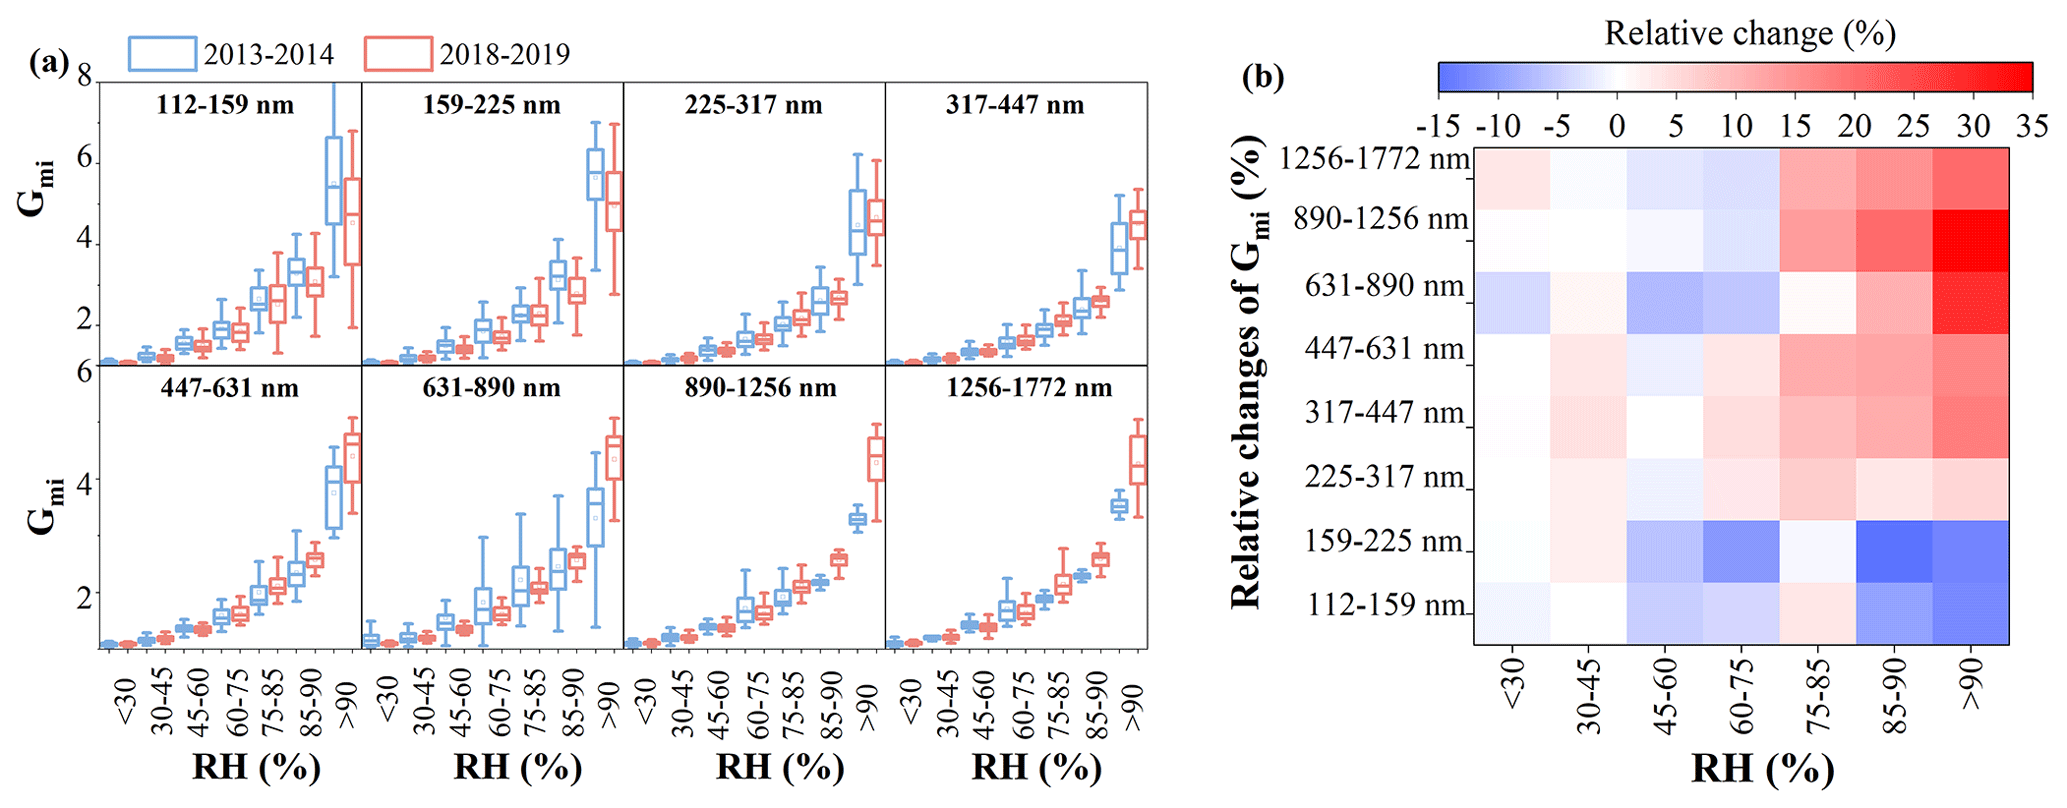
Figure 3Variations in Gmi as functions of RH under different size ranges between winter 2013–2014 and winter 2018–2019 in Xi'an (a) and relative changes in Gmi in winter 2018–2019 compared to that in winter 2013–2014 across different particle sizes and different RH ranges (b).
The mass concentrations of all NR-PM2.5 species decreased significantly in 2018–2019 compared to 2013–2014 for the entire size range, and the reduction ratio decreased as particle size increased from 112 to 1772 nm (Fig. 1e). However, the contribution of each species showed different variations in 2018–2019 compared to 2013–2014. In particular, the contributions of sulfate and chloride decreased obviously for the entire size range, with the reduction ratio varying from 27 % to 50 % for sulfate and from 68 % to 39 % for chloride. The significant reduction in chloride contribution, particularly in smaller particle sizes, indicates a decrease in primary chloride emission sources during winter from 2013–2014 to 2018–2019. In contrast, the contribution of nitrate increased significantly for the entire size range, and the increase ratios at particle sizes >317 nm (51 %–61 %) were higher than those at particle sizes <317 nm (31 %–55 %). Additionally, the fraction of ammonium decreased at particle sizes <317 nm but increased slightly at particle sizes >317 nm. The contribution of organics increased slightly at particle sizes <317 or >890 nm, while these showed no significant change in the size range of 317–890 nm. These variations indicate the obvious changes in NR-PM2.5 composition in winter in Xi'an, which transitions from a sulfate-rich composition to a nitrate-rich composition with size-resolved characteristics.
To elucidate the effects of changes in sulfate and nitrate, we further compared the size-resolved nitrate and sulfate contributions for different NR-PM2.5 mass concentrations between 2018–2019 and 2013–2014. As shown in Fig. 2, during winter 2013–2014, nitrate and sulfate displayed similar contributions when the NR-PM2.5 mass concentration was lower than 200 µg m−3. As NR-PM2.5 mass concentration increased from 200 to 400–800 µg m−3, the contribution of sulfate increased dramatically and was maintained at a stable level, while the contribution of nitrate decreased linearly. In addition, under a constant NR-PM2.5 mass concentration, the sulfate contribution increased with the increase in particle size, while the decrease in nitrate contribution showed no obvious dependence on particle size. As a result, the ratio of decreased as NR-PM2.5 mass concentration increased, with most values being lower than 1, suggesting the more important role of sulfate than nitrate in haze pollution in winter 2013–2014. In comparison, during winter 2018–2019, the contributions of both nitrate and sulfate tended to increase as NR-PM2.5 mass concentration increased across the entire mass concentration range. The increase in sulfate contribution was also more pronounced at larger particle sizes, while the increase in nitrate contribution had no obvious dependence on particle size, similarly to that in 2013–2014. The ratio of was higher than 1 in the entire NR-PM2.5 mass concentration range and in the entire particle size range, suggesting the obviously increased contribution of nitrate to haze pollution in 2018–2019. However, the ratio of showed a slightly decreasing trend with increasing NR-PM2.5 and decreased slightly as particle size increased at a constant NR-PM2.5 mass concentration. This implies that, although nitrate showed a higher contribution than sulfate in haze pollution in 2018–2019, the formation of sulfate was more efficient than nitrate under high NR-PM2.5 mass concentrations, especially at larger particle sizes. This is similar to a recent study by Xie et al. (2023) where a lower ratio was observed under serious pollution compared to under moderate pollution in Hohhot, China.
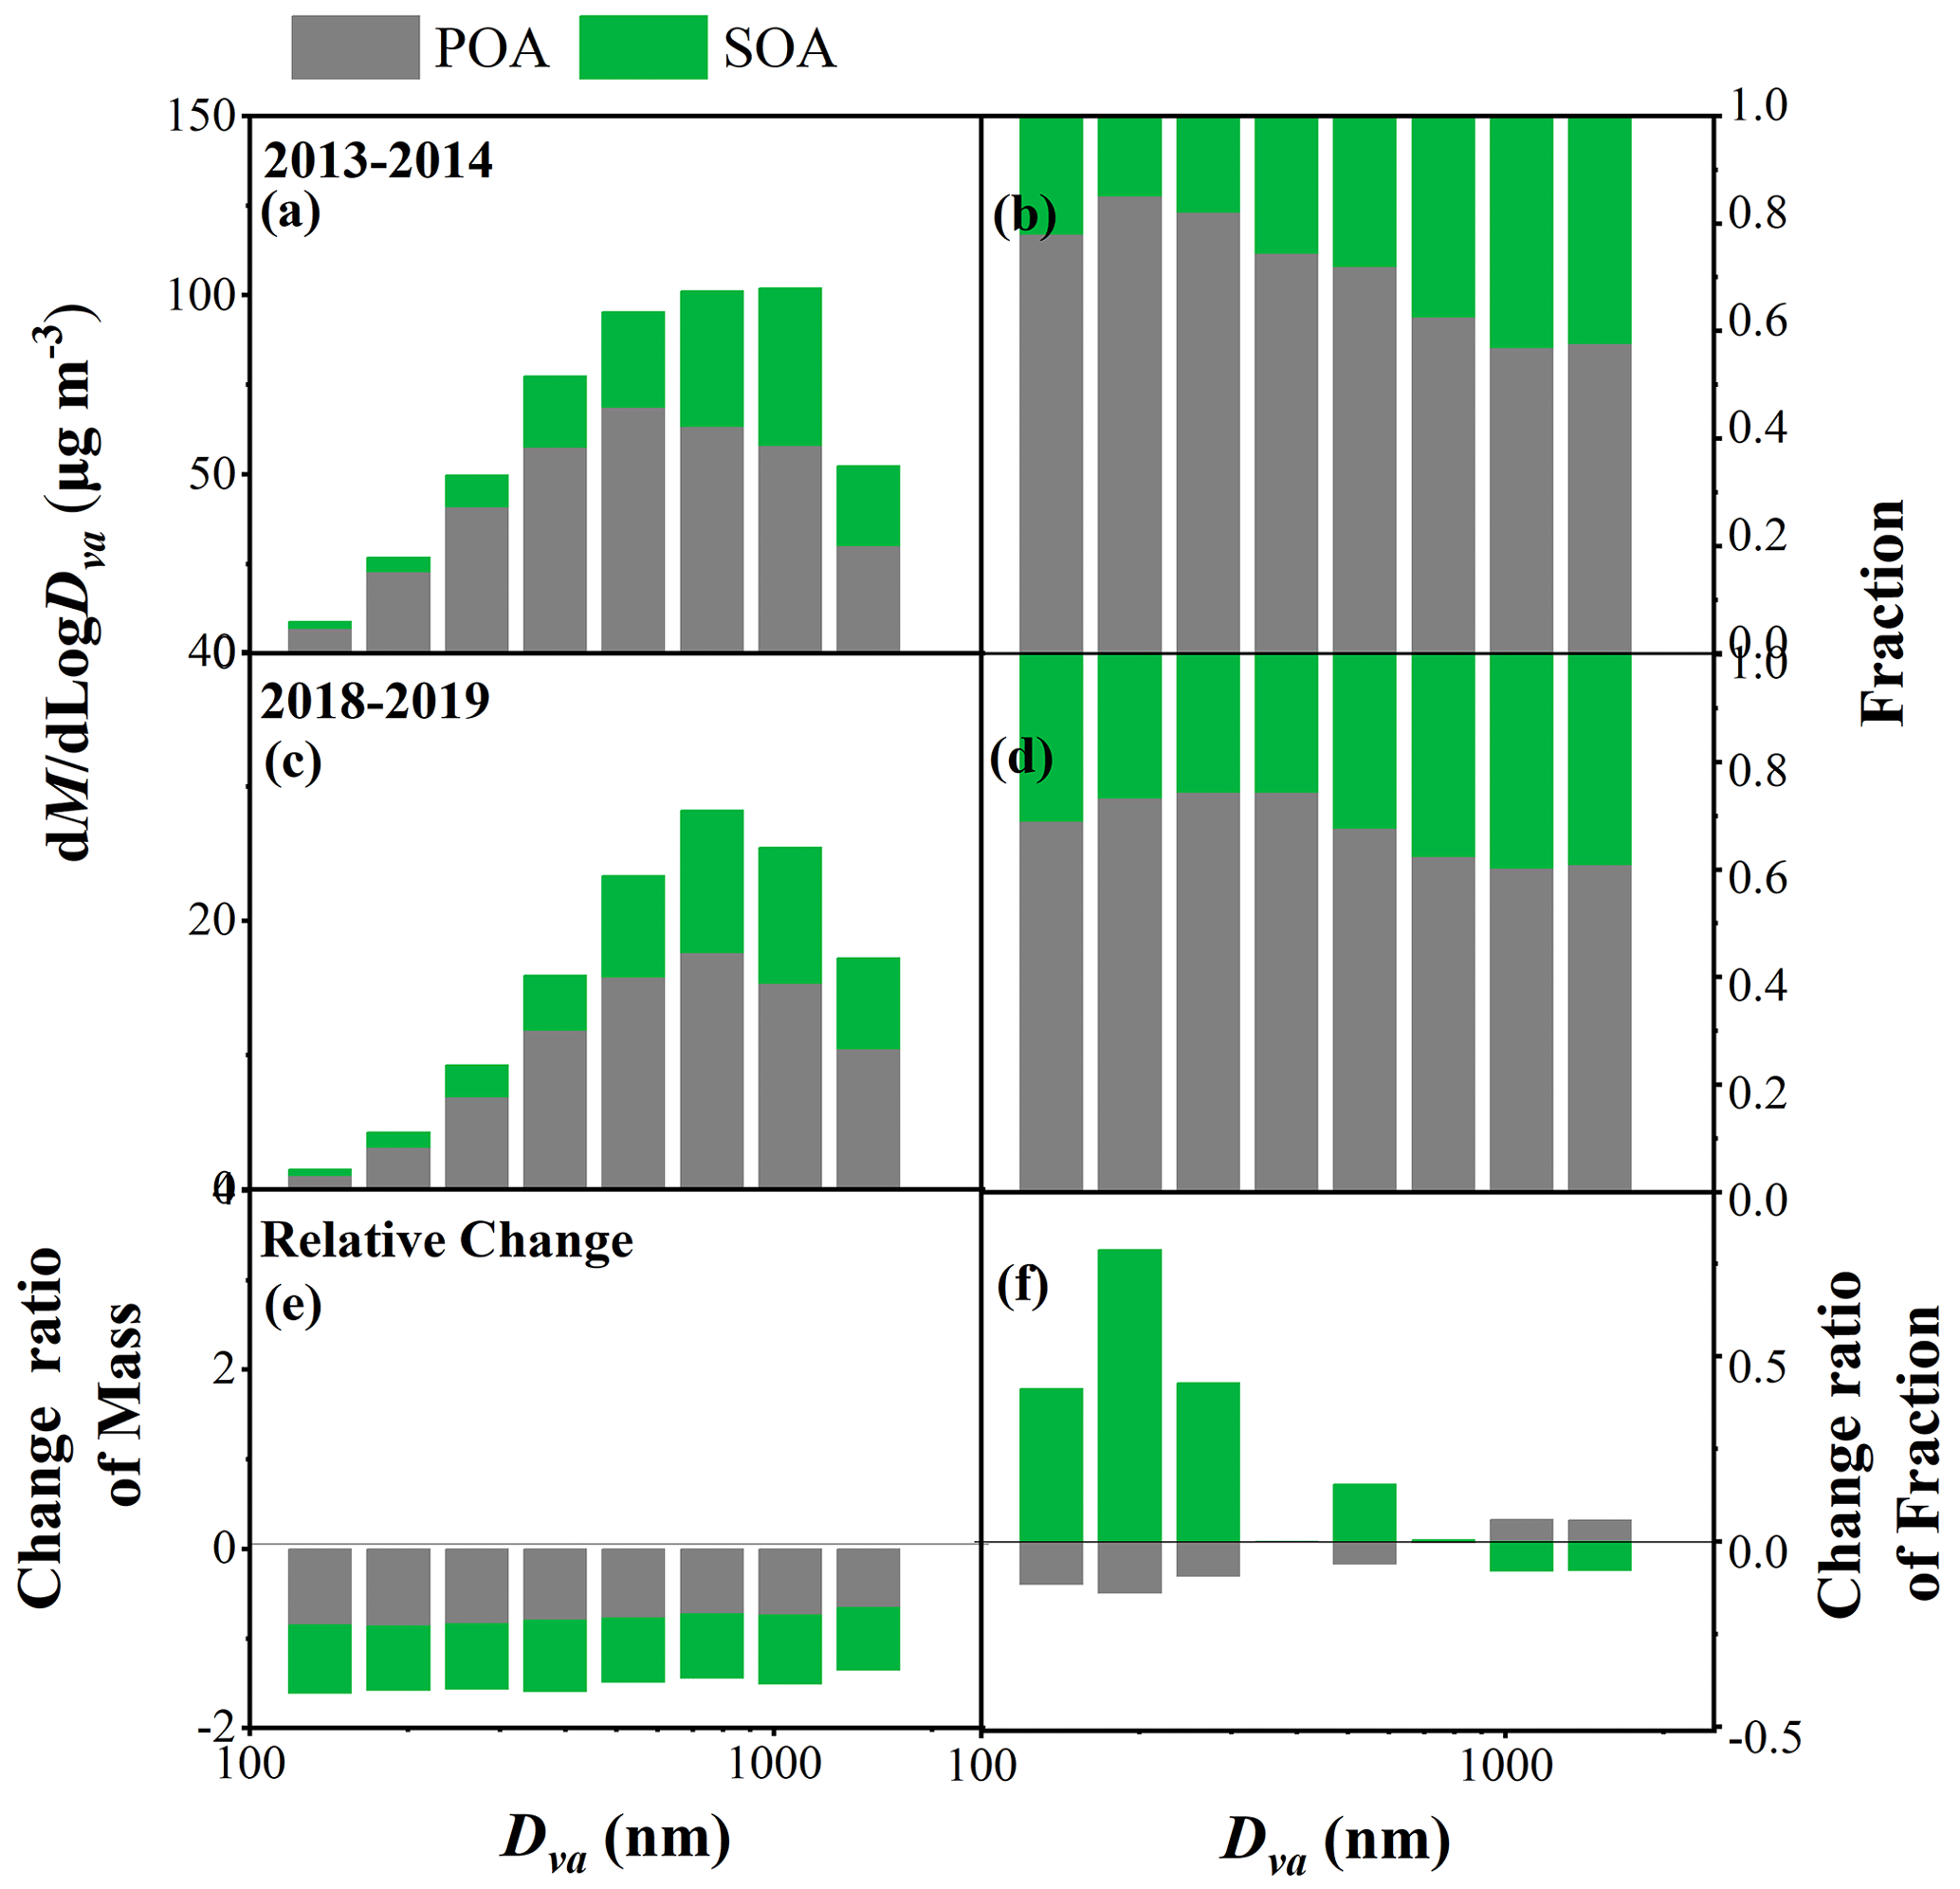
Figure 4Average size distributions of mass concentrations and fractions of POA and SOA factors in winter 2013–2014 (a, b) and winter 2018–2019 (c, d) in Xi'an and the relative change ratios of mass and fraction in 2018–2019 compared to 2013–2014 (e, f).
3.2 Size-resolved evolution of aerosol water uptake
The changes in aerosol composition, especially inorganic composition, also induce changes in aerosol water uptake. The size-resolved ALWCs modeled by ISORROPIA II for the 2018–2019 and 2013–2014 winters were compared (Fig. S10 in the Supplement). Consistently with the size distribution of NR-PM2.5, ALWC also peaked at 631–890 nm in 2018–2019 and at 890–1256 nm in 2013–2014. The ALWC in 2018–2019 was ∼5–15 times lower than that in 2013–2014 across the entire size range due to the ∼4–11 times lower inorganic mass concentrations in 2018–2019. In addition, the frequency of RH>60 % in 2018–2019 (49 %) was lower than that in 2013–2014 (64 %) (Fig. S11 in the Supplement). The less frequent occurrence of high RH together with the much lower inorganic mass concentration in 2018–2019 resulted in a lower ALWC than that in 2013–2014.
The mass growth factor of inorganic aerosol (Gmi), affected primarily by mass fractions of inorganic species rather than absolute mass, was further used to evaluate the response of aerosol water uptake to the changes in inorganic composition. As shown in Fig. 3, Gmi showed an exponential increase with RH across the entire size range in both 2018–2019 and 2013–2014. The relatively size-dependent and RH-dependent changes in Gmi in 2018–2019 compared to in 2013–2014 were further analyzed (Fig. 3b). Gmi in 2018–2019 increased relative to 2013–2014 in most cases, especially at larger particle sizes and higher RH conditions, with the highest increase ratio reaching 5 %–35 % for particles >317 nm at RH>90 %. However, decreased Gmi in 2018–2019 relative to 2013–2014 also occurred in some cases, in particular at small particle sizes and lower RH conditions. The variable changes in Gmi were further suggested to be associated with the complicated changes in inorganic composition between 2018–2019 and 2013–2014 (Figs. S12 and S13 in the Supplement).
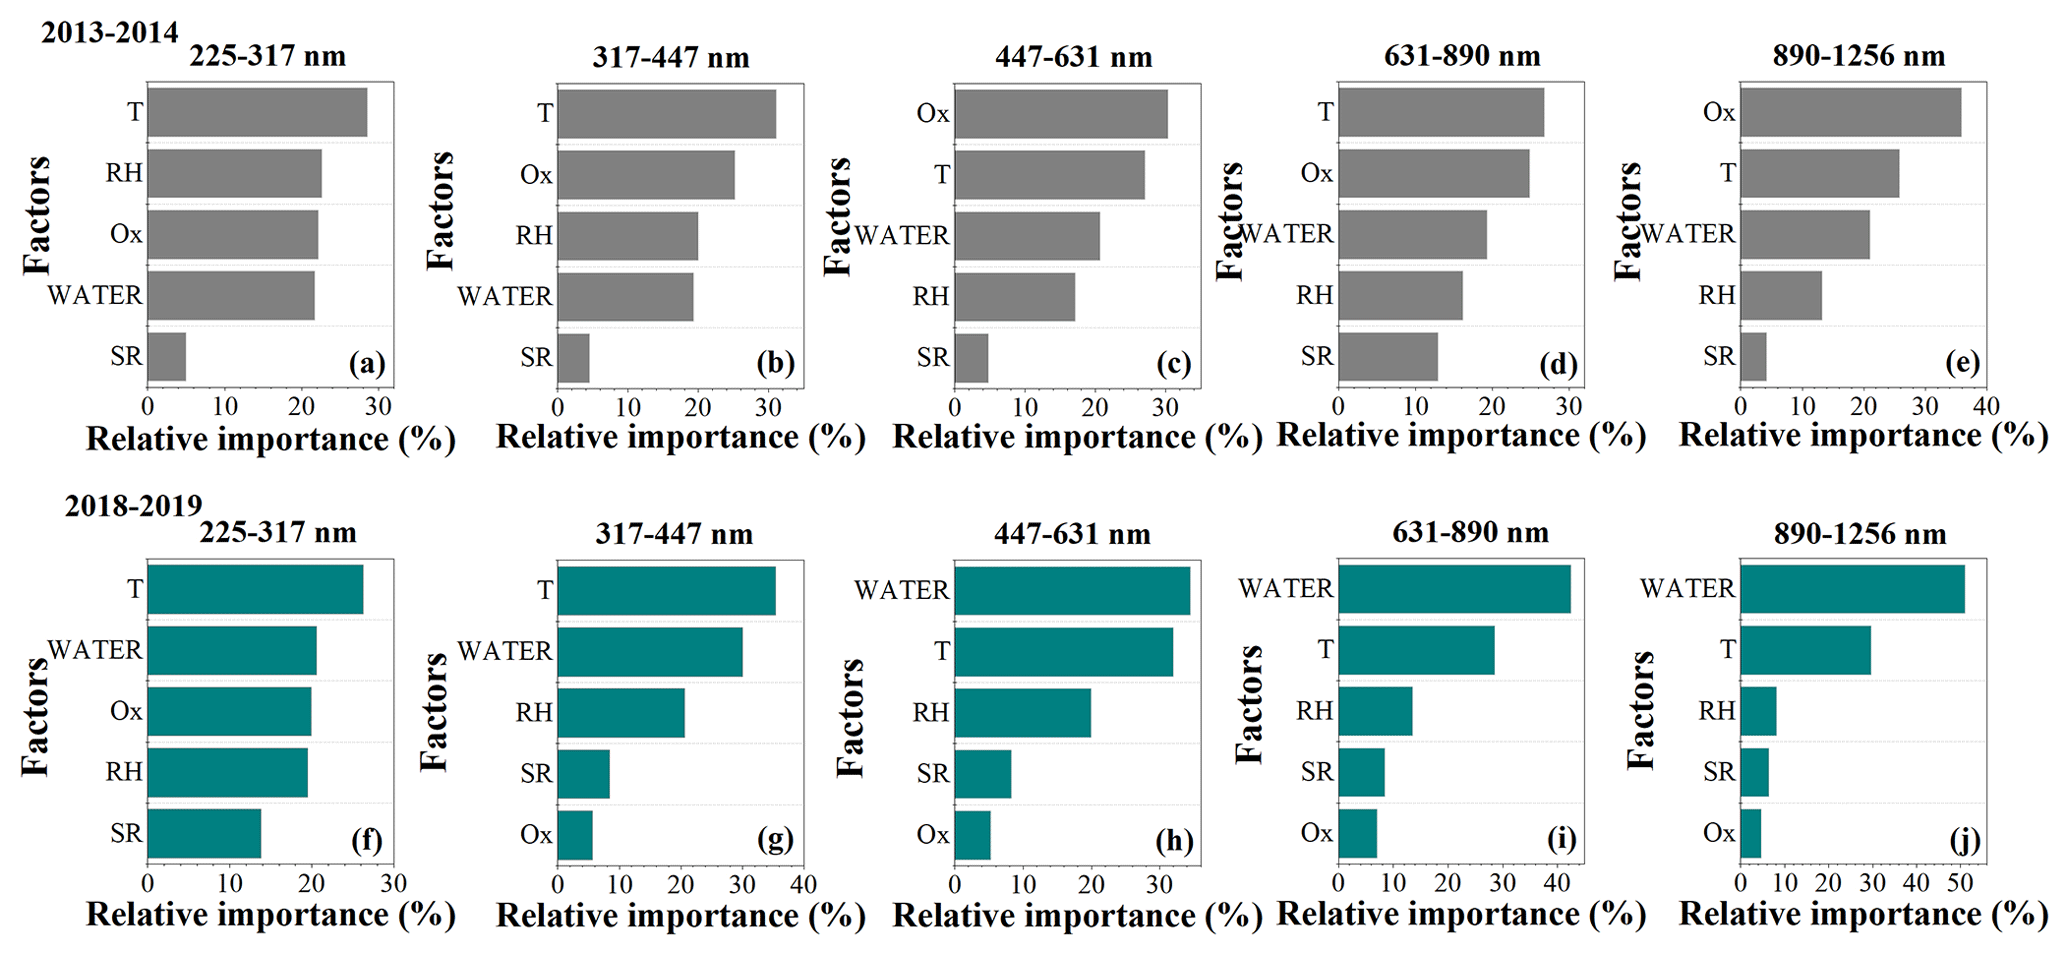
Figure 5Random forest analysis for relative importance of factors impacting SOA formation during winter 2013–2014 (a–e) and winter 2018–2019 (f–j) in Xi'an.
At small particle sizes such as 112–225 nm, in total, sulfate and nitrate contributed a lower mass fraction (∼40 %–45 %) to inorganics in 2013–2014, during which time the sulfate and nitrate could be fully neutralized by ammonium, and a large excess of ammonium was further combined with chloride. The important contribution of ammonium chloride to water uptake and its much higher hygroscopicity compared to other ones such as ammonium sulfate and ammonium nitrate led to higher Gmi in 2013–2014 at small particle sizes. This is similar to a recent observation in Delhi, India, where ammonium chloride was the largest contributor to aerosol water due to a higher fraction of chloride but lower fractions of sulfate and nitrate (Chen et al., 2022). Compared to 2013–2014, the increased sulfate and nitrate but decreased chloride fractions in 2018–2019 led to the increased contributions of ammonium sulfate and ammonium nitrate and the decreased contribution of ammonium chloride to water uptake, which then resulted in the decreased Gmi in 2018–2019 at small particle sizes.
At larger particle sizes, however, in total, sulfate and nitrate dominated inorganics (>60 %) in most cases in both 2013–2014 and 2018–2019, during which time ammonium sulfate, ammonium hydrogen sulfate, and ammonium nitrate should be considered to be the main water-absorbing species. Under this condition, a distinctly increased contribution of ammonium nitrate to water uptake in 2018–2019 will lead to increased Gmi due to the higher hygroscopicity of ammonium nitrate compared to ammonium sulfate (Topping et al., 2005; Petters and Kreidenweis, 2007). Again, some cases with decreased Gmi in 2018–2019 compared to 2013–2014 at larger particle sizes were associated with a significant reduction in sulfate and nitrate contributions in 2013–2014 – that is, the increased contribution of ammonium chloride to aerosol water (Fig. S12). Further analysis shows that the cases with increased Gmi in 2018–2019 compared to 2013–2014 were mainly related to enhanced contributions of both nitrate and ammonium (Fig. S13). These results highlight the importance of ammonium and chloride in impacting water uptake in addition to the commonly recognized sulfate and nitrate.
3.3 Size-resolved changes in POA and SOA sources
We performed OA source apportionment in each size bin. Two OA sources including POA and SOA were resolved in winter 2013–2014, while three OA sources including FFOA, BBOA, and SOA were resolved in winter 2018–2019. The fewer OA factors resolved in this study compared to in Elser et al. (2016) and Duan et al. (2022) were due to the lower resolution of the size-resolved mass spectrometer data (unit mass resolution, UMR) used in this study compared to the bulk mass spectrometer data (high resolution, HR) used in Elser et al. (2016) and Duan et al. (2022). Here, we defined FFOA + BBOA as POA in winter 2018–2019 for better comparison (Fig. 4). As particle size increased from 112 to 1772 nm, the fraction of SOA in total OA increased from 27 % to 40 % in 2018–2019 and from 15 % to 43 % in 2013–2014. Both the mass concentrations of POA and SOA in 2018–2019 decreased relative to 2013–2014 across the entire size range. Specifically, the reduction ratio of POA in the smaller size mode was slightly higher than that in the larger size mode, which decreased from 85 % to 65 % as particle size increased from 112 to 1772 nm. In comparison, the reduction ratio of SOA showed no obvious dependence on the particle size, fluctuating around 70 % as particle size increased from 112 to 1772 nm. As a result, compared to 2013–2014, the fraction of SOA in total OA in 2018–2019 mainly increased at smaller sizes of 112–317 nm while showing no obvious changes at larger sizes of 317–1772 nm due to the similar decrease ratio between POA and SOA concentrations.
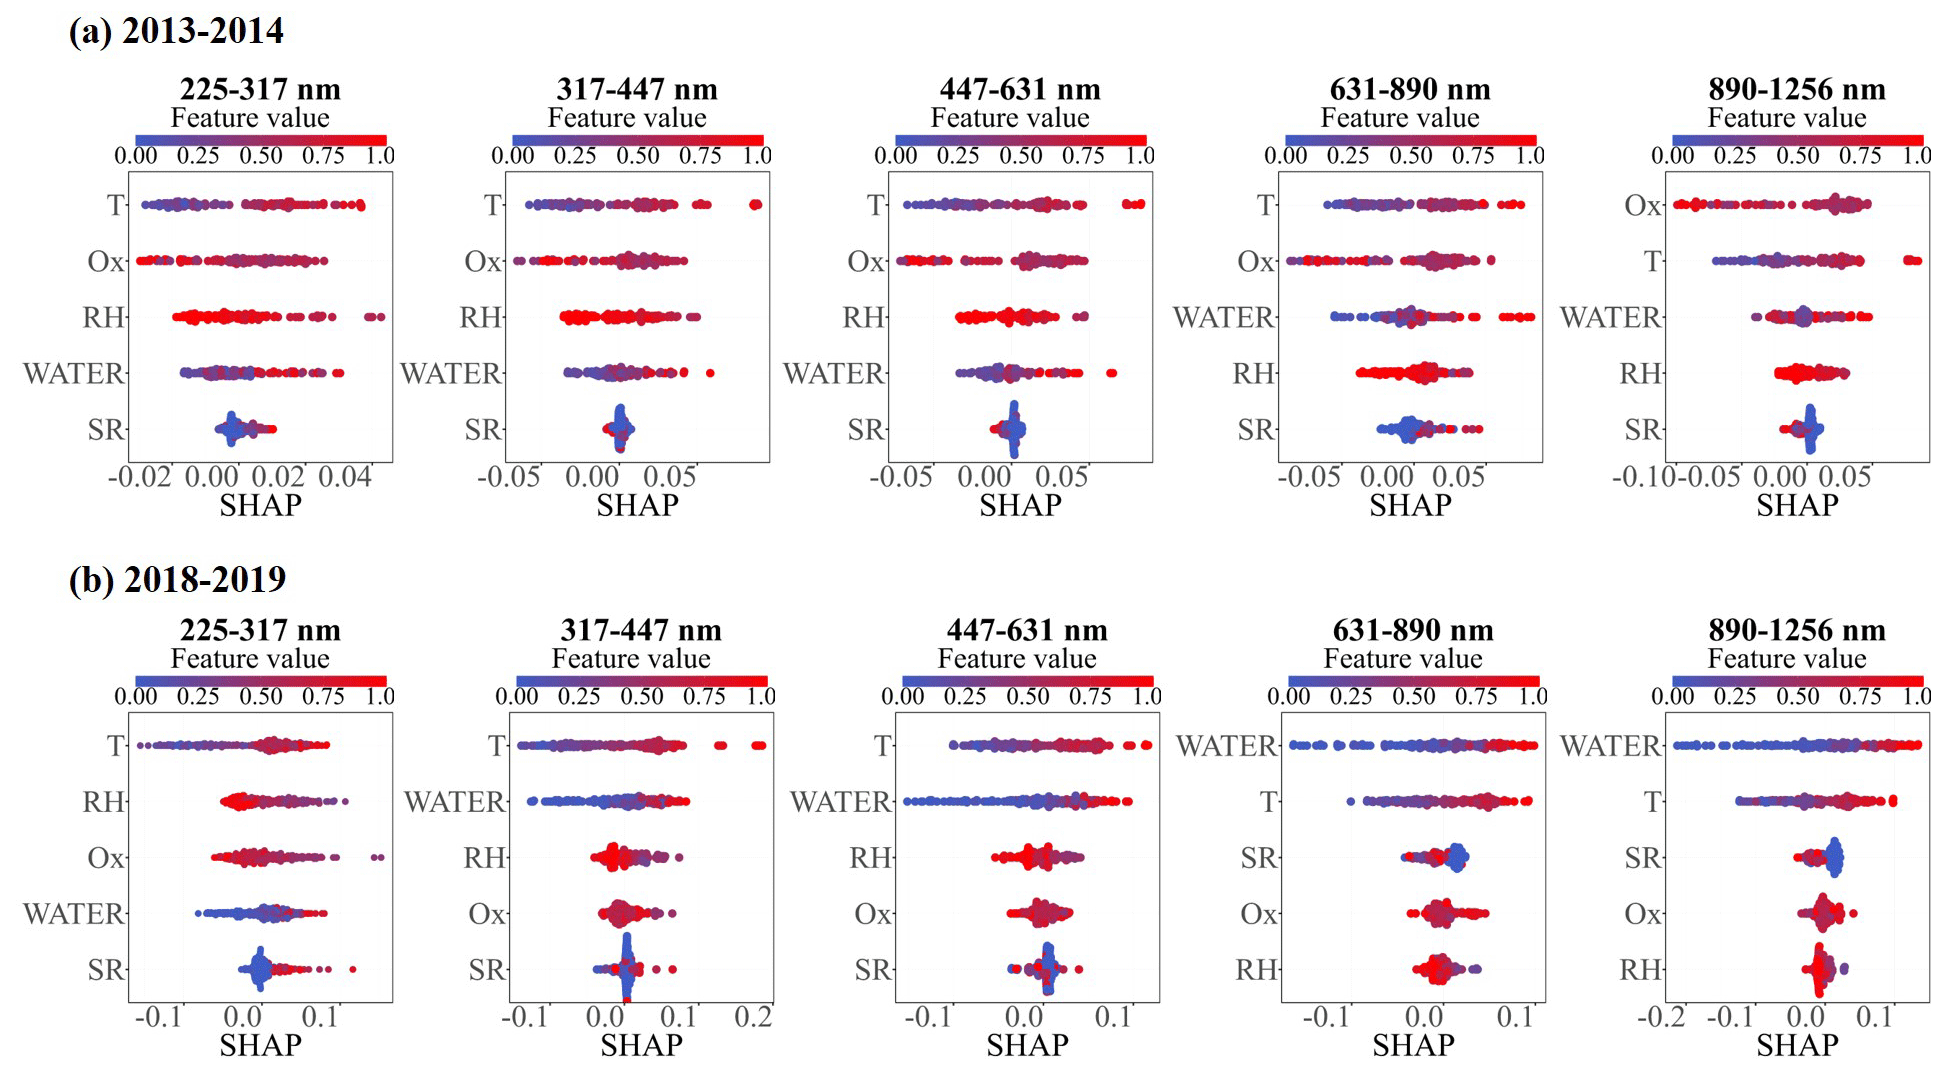
Figure 6SHAP values for the analysis of the importance of each factor in SOA formation between winter 2013–2014 (a) and winter 2018–2019 (b) for sizes of 225–1256 nm.
3.4 Enhanced influence of aerosol water on SOA formation
Meteorological parameters such as RH, temperature, SR, and Ox and aerosol water play important roles in the photochemical and aqueous-phase processes of SOA (Huang et al., 2019; Kuang et al., 2020). We used both variable importance and SHAP methods in the random forest model to evaluate the size-resolved impacts of these factors on SOA formation between winter 2018–2019 and winter 2013–2014. The normalized aerosol water (ALWC/NR-PM2.5, Liu et al., 2021) and SOA (the mass fraction of SOA in total OA) were applied to eliminate the effect of simultaneous increases or decreases in the absolute concentrations of aerosol species. Note that the contribution of organics to ALWC was not considered in ISORROPIA II modeling, which will lead to an underestimation of ALWC/NR-PM2.5. The performance of the model results was assessed using the correlation between the predicted and observed values of the test data (Table S2), and only those size ranges with a correlation efficiency (R2) above 0.5 in both 2013–2014 and 2018–2019 were selected for comparison. Figure 5 shows the relative importance of these factors in influencing SOA formation. In winter 2013–2014, the SOA formation was mainly affected by Ox and temperature but showed a lower dependence on aerosol water, with the relative importance ranging from 19 % to 22 % across the size range of 225–1256 nm. However, an enhanced impact of aerosol water on SOA formation was observed during winter 2018–2019. The relative importance of aerosol water increased from 21 % to 51 % as particle size increased from 225 to 1256 nm, and this became the greatest influencing factor in SOA formation for particle sizes of 447–1256 nm in winter 2018–2019.
Similarly, SHAP modeling results also show an increased contribution of aerosol water to SOA formation in winter 2018–2019 compared to in winter 2013–2014 (Fig. 6). The variables are arranged in descending order of importance from top to bottom. A negative or positive SHAP value signifies that the variable contributes more, while a SHAP value closer to zero indicates less contribution to the SOA formation. In winter 2013–2014, a positive SHAP value was observed more frequently for Ox, and the SHAP value of temperature increased positively as temperature increased across the size range of 225–1256 nm. However, aerosol water displayed a SHAP value that was close to zero or slightly negative in most cases. This suggests that SOA was mainly formed from photochemical oxidation in winter 2013–2014 (Elser et al., 2016). Compared to winter 2013–2014, Ox showed less of a contribution to SOA formation, with a SHAP value close to zero being seen more frequently in winter 2018–2019. Conversely, aerosol water exhibited predominantly positive SHAP values across most data points, signifying a positive contribution to SOA formation in the majority of cases during the sampling period, particularly noticeable at larger particle sizes. Furthermore, the positive impact of aerosol water on SOA formation was particularly pronounced under high-aerosol-water conditions, with the SHAP value of aerosol water increasing as aerosol water levels intensified, implying that SOA formation may be predominantly influenced by aqueous-phase processes. These results suggest an enhanced positive impact of aerosol water on SOA formation in winter 2018–2019. We suppose that the majority of enhanced aerosol water uptake in winter 2018–2019 at larger particle sizes and high RH might facilitate the efficient gas particle partitioning of water-soluble organic compounds and, thus, efficient aqueous-phase formation of SOA (Lv et al., 2023). Apart from the significant contributions of aerosol water, temperature also exhibited notable impacts on SOA formation across the size range of 225–1256 nm. The SHAP value of temperature increased with rising temperatures, indicating that higher temperatures also facilitate SOA formation in winter 2018–2019. This could be attributed to the fact that the elevated temperatures may accelerate the chemical oxidation reactivity of precursors, thereby enhancing the processes involved in SOA formation (Jian et al., 2012; Chen et al., 2020). Additionally, the most recent study by Liu et al. (2023) revealed that urban aerosol particles could exist in a liquid state at lower RH levels with increased nitrate fraction, and the diffusion coefficient was significantly enhanced in nitrate-dominated particles, making them key seeds for secondary aerosol formation through multiphase reactions. This might be another reason for the enhanced aqueous-phase formation of SOA in winter 2018–2019 compared to in winter 2013–2014 in our study. These results highlight the importance of aerosol water, which links the hygroscopicity of inorganic species to multiphase processes of secondary organics, and show the potential influence of inorganic ions in SOA formation in urban aerosol.
Size-resolved NR-PM2.5 compositions and OA sources were compared between the winters of 2018–2019 and 2013–2014 in Xi'an. The NR-PM2.5 composition changed significantly from being sulfate-rich to nitrate-rich from winter 2013–2014 to winter 2018–2019, especially at larger particle sizes. The size-resolved changes in chemical composition resulted in size-dependent changes in aerosol water uptake. Compared to 2013–2014, Gmi in 2018–2019 increased in most cases, especially at larger particle sizes and higher RH conditions, with the highest increase ratio reaching 5 %–35 % for particles >317 nm. In particular, the important role of ammonium and chloride in impacting water uptake was emphasized in addition to the roles of sulfate and nitrate. The random forest analysis showed enhanced relative importance of aerosol water in impacting SOA formation from 2013–2014 to 2018–2019, especially at larger particle sizes. Ox and temperature showed dominant and positive contributions to SOA formation in 2013–2014, while aerosol water became the leading factor contributing positively to SOA formation in 2018–2019, implying an enhanced aqueous-phase formation of SOA. This study highlights the key role of aerosol water uptake, which links inorganic species and organic compounds in their secondary processes. The potential impact of inorganic ions, especially nitrate, in the multiphase processes of SOA and the key mechanisms thereof need to be further clarified in urban nitrate-dominant particles.
The data used in this study are archived at the East Asian Paleoenvironmental Science Database, National Earth System Science Data Center, National Science and Technology Infrastructure of China: https://doi.org/10.12262/IEECAS.EAPSD2024001 (Duan, 2024).
The supplement related to this article is available online at: https://doi.org/10.5194/acp-24-7687-2024-supplement.
RJH designed the study. JD, YW, HZ, and YG conducted the field observation. JD and RJH analyzed the data, with help from YW, WX, and CL. JD and RJH wrote the paper, and WH, JO, DC, and CO'D all commented on and discussed the paper.
The contact author has declared that none of the authors has any competing interests.
Publisher's note: Copernicus Publications remains neutral with regard to jurisdictional claims made in the text, published maps, institutional affiliations, or any other geographical representation in this paper. While Copernicus Publications makes every effort to include appropriate place names, the final responsibility lies with the authors.
The authors gratefully acknowledge the personnel who participated in data collection and instrument maintenance during the field campaigns.
This research has been supported by the National Natural Science Foundation of China (NSFC) (grant no. 41925015), the Strategic Priority Research Program of Chinese Academy of Sciences (grant no. XDB40000000), the Key Research Program of Frontier Sciences from the Chinese Academy of Sciences (grant no. ZDBS-LY-DQC001), the Natural Science Basic Research Program of Shaanxi Province (grant no. 2023-JC-QN-0319), and the National Key Research and Development Program (grant no. 2023YFC3705503).
This paper was edited by Manabu Shiraiwa and reviewed by two anonymous referees.
An, Z. S., Huang, R.-J., Zhang, R. Y., Tie, X. X., Li, G. H., Cao, J. J., Zhou, W. J., Shi, Z. G., Han, Y. M., Gu, Z. L., and Ji, Y. M.: Severe haze in northern China: A synergy of anthropogenic emissions and atmospheric processes, P. Natl. Acad. Sci. USA, 116, 8657–8666, https://doi.org/10.1073/pnas.1900125116, 2019.
Burnett, R., Chen, H., Szyszkowicz, M., Fann, N., Hubbell, B., Pope, C. A., Apte, J. S., Brauer, M., Cohen, A., Weichenthal, S., Coggins, J., Di, Q., Brunekreef, B., Frostad, J., Lim, S. S., Kan, H., Walker, K. D., Thurston, G. D., Hayes, R. B., Lim, C. C., Turner, M. C., Jerrett, M., Krewski, D., Gapstur, S. M., Diver, W. R., Ostro, B., Goldberg, D., Crouse, D. L., Martin, R. V., Peters, P., Pinault, L., Tjepkema, M., van Donkelaar, A., Villeneuve, P. J., Miller, A. B., Yin, P., Zhou, M., Wang, L., Janssen, N. A. H., Marra, M., Atkinson, R. W., Tsang, H., Quoc Thach, T., Cannon, J. B., Allen, R. T., Hart, J. E., Laden, F., Cesaroni, G., Forastiere, F., Weinmayr, G., Jaensch, A., Nagel, G., Concin, H., and Spadaro, J. V.: Global estimates of mortality associated with long-term exposure to outdoor fine particulate matter, P. Natl. Acad. Sci. USA, 115, 9592–9597, https://doi.org/10.1073/pnas.1803222115, 2018.
Cai, M., Huang, S., Liang, B., Sun, Q., Liu, L., Yuan, B., Shao, M., Hu, W., Chen, W., Song, Q., Li, W., Peng, Y., Wang, Z., Chen, D., Tan, H., Xu, H., Li, F., Deng, X., Deng, T., Sun, J., and Zhao, J.: Measurement report: Distinct size dependence and diurnal variation in organic aerosol hygroscopicity, volatility, and cloud condensation nuclei activity at a rural site in the Pearl River Delta (PRD) region, China, Atmos. Chem. Phys., 22, 8117–8136, https://doi.org/10.5194/acp-22-8117-2022, 2022.
Cai, W., Li, K., Liao, H., Wang, H., and Wu, L.: Weather conditions conducive to Beijing severe haze more frequent under climate change, Nat. Clim. Change, 7, 257–263, https://doi.org/10.1038/nclimate3249, 2017.
Canagaratna, M. R., Jayne, J. T., Jiménez, J. L., Allan, J. D., Alfarra, M. R., Zhang, Q., Onasch, T. B., Drewnick, F., Coe, H., Middlebrook, A., Delia, A., Williams, L. R., Trimborn, A. M., Northway, M. J., DeCarlo, P. F., Kolb, C. E., Davidovits, P., and Worsnop, D. R.: Chemical and Microphysical Characterization of Ambient Aerosols with the Aerodyne Aerosol Mass Spectrometer, Mass Spectrom. Rev., 26, 185–222, 2007.
Chen, Y., Wang, Y., Nenes, A., Wild, O., Song, S., Hu, D., Liu, D., He, J., Hildebrandt Ruiz, L., Apte, J. S., Gunthe, S. S., and Liu, P.: Ammonium Chloride Associated Aerosol Liquid Water Enhances Haze in Delhi, India, Environ. Sci. Technol., 56, 7163–7173, https://doi.org/10.1021/acs.est.2c00650, 2022.
Chen, Z., Chen, D., Zhao, C., Kwan, M.-P., Cai, J., Zhuang, Y., Zhao, B., Wang, X., Chen, B., Yang, J., Li, R., He, B., Gao, B., Wang, K., and Xu, B.: Influence of meteorological conditions on PM2.5 concentrations across China: A review of methodology and mechanism, Environ. Int., 139, 105558, https://doi.org/10.1016/j.envint.2020.105558, 2020.
Chu, B., Ma, Q., Liu, J., Ma, J., Zhang, P., Chen, T., Feng, Q., Wang, C., Yang, N., Ma, H., Ma, J., Russell, A. G., and He, H.: Air Pollutant Correlations in China: Secondary Air Pollutant Responses to NOx and SO2 Control, Environ. Sci. Tech. Let., 7, 695–700, https://doi.org/10.1021/acs.estlett.0c00403, 2020.
Craig, R. L. and Ault, A. P.: Aerosol Acidity: Direct Measurement from a Spectroscopic Method, in: Multiphase Environmental Chemistry in the Atmosphere, ACS Symposium Series, 1299, American Chemical Society, 171–191, https://doi.org/10.1021/bk-2018-1299.ch009, 2018.
Duan, J.: Size-resolved OA composition in winter Xi'an between different years, East Asian Paleoenvironmental Science Database [data set], https://doi.org/10.12262/IEECAS.EAPSD2024001, 2024.
Duan, J., Huang, R.-J., Gu, Y., Lin, C., Zhong, H., Xu, W., Liu, Q., You, Y., Ovadnevaite, J., Ceburnis, D., Hoffmann, T., and O'Dowd, C.: Measurement report: Large contribution of biomass burning and aqueous-phase processes to the wintertime secondary organic aerosol formation in Xi'an, Northwest China, Atmos. Chem. Phys., 22, 10139–10153, https://doi.org/10.5194/acp-22-10139-2022, 2022.
Elser, M., Huang, R.-J., Wolf, R., Slowik, J. G., Wang, Q., Canonaco, F., Li, G., Bozzetti, C., Daellenbach, K. R., Huang, Y., Zhang, R., Li, Z., Cao, J., Baltensperger, U., El-Haddad, I., and Prévôt, A. S. H.: New insights into PM2.5 chemical composition and sources in two major cities in China during extreme haze events using aerosol mass spectrometry, Atmos. Chem. Phys., 16, 3207–3225, https://doi.org/10.5194/acp-16-3207-2016, 2016.
Fontes, T., Li, P. L., Barros, N., and Zhao, P. J.: Trends of PM2.5 concentrations in China: A long term approach, J. Environ. Manage., 196, 719–732, https://doi.org/10.1016/j.jenvman.2017.03.074, 2017.
Fountoukis, C. and Nenes, A.: ISORROPIA II: a computationally efficient thermodynamic equilibrium model for K+–Ca2+–Mg2+– –Na+–––Cl−–H2O aerosols, Atmos. Chem. Phys., 7, 4639–4659, https://doi.org/10.5194/acp-7-4639-2007, 2007.
Grange, S. K., Carslaw, D. C., Lewis, A. C., Boleti, E., and Hueglin, C.: Random forest meteorological normalisation models for Swiss PM10 trend analysis, Atmos. Chem. Phys., 18, 6223–6239, https://doi.org/10.5194/acp-18-6223-2018, 2018.
Gu, Y., Huang, R.-J., Duan, J., Xu, W., Lin, C., Zhong, H., Wang, Y., Ni, H., Liu, Q., Xu, R., Wang, L., and Li, Y. J.: Multiple pathways for the formation of secondary organic aerosol in the North China Plain in summer, Atmos. Chem. Phys., 23, 5419–5433, https://doi.org/10.5194/acp-23-5419-2023, 2023.
He, Y., Akherati, A., Nah, T., Ng, N. L., Garofalo, L. A., Farmer, D. K., Shiraiwa, M., Zaveri, R. A., Cappa, C. D., Pierce, J. R., and Jathar, S. H.: Particle Size Distribution Dynamics Can Help Constrain the Phase State of Secondary Organic Aerosol, Environ. Sci. Technol., 55, 1466–1476, https://doi.org/10.1021/acs.est.0c05796, 2021.
Herrmann, H., Schaefer, T., Tilgner, A., Styler, S., Weller, C., Teich, M., and Otto, T.: Tropospheric Aqueous-Phase Chemistry: Kinetics, Mechanisms, and Its Coupling to a Changing Gas Phase, Chem. Rev., 115, 4259–4334, https://doi.org/10.1021/cr500447k, 2015.
Huang, R.-J., Zhang, Y. L., Bozzetti, C., Ho, K.-F., Cao, J. J., Han, Y. M., Daellenbach, K. R., Slowik, J. G., Platt, S. M., Canonaco, F., Zotter, P., Wolf, R., Pieber, S. M., Bruns, E. A., Crippa, M., Ciarelli, G., Piazzalunga, A., Schwikowski, M., Abbaszade, G., Schnelle-Kreis, J., Zimmermann, R., An, Z., Szidat, S., Baltensperger, U., Haddad, I. E., and Prévôt, A. S. H.: High secondary aerosol contribution to particulate pollution during haze events in China, Nature, 514, 218–222, https://doi.org/10.1038/nature13774, 2014.
Huang, R.-J., Wang, Y., Cao, J., Lin, C., Duan, J., Chen, Q., Li, Y., Gu, Y., Yan, J., Xu, W., Fröhlich, R., Canonaco, F., Bozzetti, C., Ovadnevaite, J., Ceburnis, D., Canagaratna, M. R., Jayne, J., Worsnop, D. R., El-Haddad, I., Prévôt, A. S. H., and O'Dowd, C. D.: Primary emissions versus secondary formation of fine particulate matter in the most polluted city (Shijiazhuang) in North China, Atmos. Chem. Phys., 19, 2283–2298, https://doi.org/10.5194/acp-19-2283-2019, 2019.
Jian, L., Zhao, Y., Zhu, Y. P., Zhang, M. B., and Bertolatti, D.: An application of arima model to predict submicron particle concentrations from meteorological factors at a busy roadside in hangzhou, China, Sci. Total Environ., 426, 336–345, 2012.
Kim, N., Yum, S. S., Park, M., Park, J. S., Shin, H. J., and Ahn, J. Y.: Hygroscopicity of urban aerosols and its link to size-resolved chemical composition during spring and summer in Seoul, Korea, Atmos. Chem. Phys., 20, 11245–11262, https://doi.org/10.5194/acp-20-11245-2020, 2020.
Kuang, Y., He, Y., Xu, W. Y., Yuan, B., Zhang, G., Ma, Z. Q., Wu, C. H., Wang, C. M., Wang, S. H., Zhang, S. Y., Tao, J. C., Ma, N., Su, H., Cheng, Y. F., Shao, M., and Sun, Y. L.: Photochemical aqueous-phase reactions induce rapid daytime formation of oxygenated organic aerosol on the North China Plain, Environ. Sci. Technol., 54, 3849–3860, https://doi.org/10.1021/acs.est.9b06836, 2020.
Li, J., Gao, W., Cao, L., Xiao, Y., Zhang, Y., Zhao, S., Liu, Z., Liu, Z., Tang, G., Ji, D., Hu, B., Song, T., He, L., Hu, M., and Wang, Y. S.: Significant changes in autumn and winter aerosol composition and sources in Beijing from 2012 to 2018: Effects of clean air actions, Environ. Pollut., 268, 115855, https://doi.org/10.1016/j.envpol.2020.115855, 2021.
Lin, C., Huang, R.-J., Zhong, H., Duan, J., Wang, Z., Huang, W., and Xu, W.: Elucidating ozone and PM2.5 pollution in the Fenwei Plain reveals the co-benefits of controlling precursor gas emissions in winter haze, Atmos. Chem. Phys., 23, 3595–3607, https://doi.org/10.5194/acp-23-3595-2023, 2023.
Liu, Y., Wu, Z., Huang, X., Shen, H., Bai, Y., Qiao, K., Meng, X., Hu, W., Tang, M., and He, L.: Aerosol phase state and its link to chemical composition and liquid water content in a subtropical coastal megacity, Environ. Sci. Technol., 53, 5027–5033, https://doi.org/10.1021/acs.est.9b01196, 2019.
Liu, Y., Feng, Z., Zheng, F., Bao, X., Liu, P., Ge, Y., Zhao, Y., Jiang, T., Liao, Y., Zhang, Y., Fan, X., Yan, C., Chu, B., Wang, Y., Du, W., Cai, J., Bianchi, F., Petäjä, T., Mu, Y., He, H., and Kulmala, M.: Ammonium nitrate promotes sulfate formation through uptake kinetic regime, Atmos. Chem. Phys., 21, 13269–13286, https://doi.org/10.5194/acp-21-13269-2021, 2021.
Liu, Y. C., Wu, Z. J., Qiu, Y. T., Tian, P., Liu, Q., Chen, Y., Song, M., and Hu, M.: Enhanced nitrate fraction: Enabling urban aerosol particles to remain in a liquid state at reduced relative humidity, Geophys. Res. Lett., 50, e2023GL105505, https://doi.org/10.1029/2023GL105505, 2023.
Lundberg, S. M., Erion, G., Chen, H., DeGrave, A., Prutkin, J. M., Nair, B., Katz, R., Himmelfarb, J., Bansal, N., and Lee, S.-I.: From local explanations to global understanding with explainable AI for trees, Nat. Mach. Intell., 2, 56–67, https://doi.org/10.1038/s42256-019-0138-9, 2020.
Lv, S. J., Wu, C., Wang, F. L., Liu, X. D., Zhang, S., Chen, Y. B., Zhang, F., Yang, Y., Wang, H. L., Huang, C., Fu, Q. Y., Duan, Y. S., and Wang, G. H.: Nitrate-enhanced gas-to-particle-phase partitioning of water-soluble organic compounds in Chinese urban atmosphere: implications for secondary organic aerosol formation, Environ. Sci. Tech. Let., 10, 14–20, https://doi.org/10.1021/acs.estlett.2c00894, 2023.
Middlebrook, A. M., Bahreini, R., Jimenez, J. L., and Canagaratna, M. R.: Evaluation of composition-dependent collection efficiencies for the Aerodyne Aerosol Mass Spectrometer using field data, Aerosol Sci. Tech., 46, 258–271, https://doi.org/10.1080/02786826.2011.620041, 2012.
Paatero, P.: The multilinear engine: a table-driven, least squares program for solving multilinear problems, including the n-way parallel factor analysis model, J. Comput. Graph. Stat., 8, 854–888, https://doi.org/10.1080/10618600.1999.10474853, 1999.
Paatero, P. and Tapper, U.: Positive Matrix Factorization: A non-negative factor model with optimal utilization of error estimates of data values, Environmetrics, 5, 111–126, https://doi.org/10.1002/env.3170050203, 1994.
Petters, M. D. and Kreidenweis, S. M.: A single parameter representation of hygroscopic growth and cloud condensation nucleus activity, Atmos. Chem. Phys., 7, 1961–1971, https://doi.org/10.5194/acp-7-1961-2007, 2007.
Polissar, A. V., Hopke, P. K., Malm, W. C., and Sisler, J. F.: Atmospheric Aerosol over Alaska: 2. Elemental Composition and Sources, J. Geophys. Res.-Atmos., 103, 19045–19057, https://doi.org/10.1029/98JD01212, 1998.
Song, S., Nenes, A., Gao, M., Zhang, Y., Liu, P., Shao, J., Ye, D., Xu, W., Lei, L., Sun, Y., Liu, B., Wang, S., and McElroy, M. B.: Thermodynamic Modeling Suggests Declines in Water Uptake and Acidity of Inorganic Aerosols in Beijing Winter Haze Events during 2014/2015–2018/2019, Environ. Sci. Tech. Let., 6, 752–760, https://doi.org/10.1021/acs.estlett.9b00621, 2019.
Sun, Y., Lei, L., Zhou, W., Chen, C., He, Y., Sun, J., Li, Z., Xu, W., Wang, Q., Ji, D., Fu, P., Wang, Z., and Worsnop, D.: A chemical cocktail during the COVID-19 outbreak in Beijing, China: insights from six-year aerosol particle composition measurements during the Chinese New Year holiday, Sci. Total Environ., 742, 140739, https://doi.org/10.1016/j.scitotenv.2020.140739, 2020.
Topping, D. O., McFiggans, G. B., and Coe, H.: A curved multi-component aerosol hygroscopicity model framework: Part 1 – Inorganic compounds, Atmos. Chem. Phys., 5, 1205–1222, https://doi.org/10.5194/acp-5-1205-2005, 2005.
Ulbrich, I. M., Canagaratna, M. R., Cubison, M. J., Zhang, Q., Ng, N. L., Aiken, A. C., and Jimenez, J. L.: Three-dimensional factorization of size-resolved organic aerosol mass spectra from Mexico City, Atmos. Meas. Tech., 5, 195–224, https://doi.org/10.5194/amt-5-195-2012, 2012.
Wang, M., Zhang, Z., Yuan, Q., Li, X., Han, S., Lam, Y., Cui, L., Huang, Y., Cao, J., and Lee, S.-C.: Slower than expected reduction in annual PM2.5 in Xi'an revealed by machine learning-based meteorological normalization, Sci. Total Environ., 841, 156740, https://doi.org/10.1016/j.scitotenv.2022.156740, 2022.
Wang, Y. H., Gao, W. K., Wang, S. A., Song, T., Gong, Z. Y., Ji, D. S., Wang, L. L., Liu, Z. R., Tang, G. Q., Huo, Y. F., Tian, S. L., Li, J. Y., Li, M. G., Yang, Y., Chu, B. W., Petäjä, T., Kerminen, V.-M., He, H., Hao, J. M., Kulmala, M., Wang, Y. S., and Zhang, Y. H.: Contrasting trends of PM2.5 and surface-ozone concentrations in China from 2013 to 2017, Natl. Sci. Rev., 7, 1331–1339, https://doi.org/10.1093/nsr/nwaa032, 2020.
Wu, D., Zheng, H., Li, Q., Jin, L., Lyu, R., Ding, X., Huo, Y., Zhao, B., Jiang, J., and Chen, J.: Toxic potency-adjusted control of air pollution for solid fuel combustion, Nat. Energy, 7, 194–202, https://doi.org/10.1038/s41560-021-00951-1, 2022.
Wu, Z., Wang, Y., Tan, T., Zhu, Y., Li, M., Shang, D., Wang, H., Lu, K., Guo, S., Zeng, L., and Zhang, Y.: Aerosol liquid water driven by anthropogenic inorganic salts: implying its key role in haze formation over the North China Plain, Environ. Sci. Tech. Let., 5, 160–166, https://doi.org/10.1021/acs.estlett.8b00021, 2018.
Xie, F., Su, Y., Tian, Y., Shi, Y., Zhou, X., Wang, P., Yu, R., Wang, W., He, J., Xin, J., and Lü, C.: The shifting of secondary inorganic aerosol formation mechanisms during haze aggravation: the decisive role of aerosol liquid water, Atmos. Chem. Phys., 23, 2365–2378, https://doi.org/10.5194/acp-23-2365-2023, 2023.
Xu, J., Ge, X., Zhang, X., Zhao, W., Zhang, R., and Zhang, Y.: COVID-19 impact on the concentration and composition of submicron particulate matter in a typical city of Northwest China, Geophys. Res. Lett., 47, e2020GL089035, https://doi.org/10.1029/2020GL089035, 2020.
Xu, W., Sun, Y., Wang, Q., Zhao, J., Wang, J., Ge, X., Xie, C., Zhou, W., Du, W., Li, J., Fu, P., Wang, Z., Worsnop, D. R., and Coe, H.: Changes in aerosol chemistry from 2014 to 2016 in winter in Beijing: Insights from high-resolution aerosol mass spectrometry, J. Geophys. Res.-Atmos., 124, 1132–1147, https://doi.org/10.1029/2018JD029245, 2019.
Xu, W., Chen, C., Qiu, Y., Xie, C., Chen, Y., Ma, N., Xu, W., Fu, P., Wang, Z., Pan, X., Zhu, J., Ng, N. L., and Sun, Y.: Size-resolved characterization of organic aerosol in the North China Plain: new insights from high resolution spectral analysis, Environ. Sci. Atmos., 1, 346–358, https://doi.org/10.1039/D1EA00025J, 2021.
Zhang, J. K., Sun, Y., Liu, Z. R., Ji, D. S., Hu, B., Liu, Q., and Wang, Y. S.: Characterization of submicron aerosols during a month of serious pollution in Beijing, 2013, Atmos. Chem. Phys., 14, 2887–2903, https://doi.org/10.5194/acp-14-2887-2014, 2014.
Zhang, Q., Zheng, Y., Tong, D., Shao, M., Wang, S., Zhang, Y., Xu, X., Wang, J., He, H., Liu, W., Ding, Y., Lei, Y., Li, J., Wang, Z., Zhang, X., Wang, Y., Cheng, J., Liu, Y., Shi, Q., Yan, L., Geng, G., Hong, C., Li, M., Liu, F., Zheng, B., Cao, J., Ding, A., Gao, J., Fu, Q., Huo, J., Liu, B., Liu, Z., Yang, F., He, K., and Hao, J.: Drivers of Improved PM2.5 Air Quality in China from 2013 to 2017, P. Natl. Acad. Sci. USA, 116, 24463–24469, https://doi.org/10.1073/pnas.1907956116, 2019.
Zhang, R. Y., Wang, G. H., Guo, S., Zarnora, M. L., Ying, Q., Lin, Y., Wang, W. G., Hu, M., and Wang, Y.: Formation of Urban Fine Particulate Matter, Chem. Rev., 115, 3803–3855, https://doi.org/10.1021/acs.chemrev.5b00067, 2015.
Zhang, Y., Vu, T. V., Sun, J., He, J., Shen, X., Lin, W., Zhang, X., Zhong, J., Gao, W., Wang, Y., Fu, T. M., Ma, Y., Li, W., and Shi, Z.: Significant Changes in Chemistry of Fine Particles in Wintertime Beijing from 2007 to 2017: Impact of Clean Air Actions, Environ. Sci. Technol., 54, 1344–1352, https://doi.org/10.1021/acs.est.9b04678, 2020.
Zheng, B., Tong, D., Li, M., Liu, F., Hong, C., Geng, G., Li, H., Li, X., Peng, L., Qi, J., Yan, L., Zhang, Y., Zhao, H., Zheng, Y., He, K., and Zhang, Q.: Trends in China's anthropogenic emissions since 2010 as the consequence of clean air actions, Atmos. Chem. Phys., 18, 14095–14111, https://doi.org/10.5194/acp-18-14095-2018, 2018.
Zheng, Y., Chen, Q., Cheng, X., Mohr, C., Cai, J., Huang, W., Shrivastava, M., Ye, P., Fu, P., Shi, X., Ge, Y., Liao, K., Miao, R., Qiu, X., Koenig, T. K., and Chen, S.: Precursors and Pathways Leading to Enhanced Secondary Organic Aerosol Formation during Severe Haze Episodes, Environ. Sci. Technol., 55, 15680–15693, https://doi.org/10.1021/acs.est.1c04255, 2021.
Zhong, H., Huang, R.-J., Duan, J., Lin, C., Gu, Y., Wang, Y., Li, Y. J., Zheng, Y., Chen, Q., Chen, Y., Dai, W. T., Ni, H. Y., Cao, J. J., Worsnop, D. R., Xu, W., Ovadnevaite, J., Ceburnis, D., and O'Dowd, C. D.: Seasonal variations in the sources of organic aerosol in Xi'an, Northwest China: The importance of biomass burning and secondary formation, Sci. Total Environ., 737, 139666, https://doi.org/10.1016/j.scitotenv.2020.139666, 2020.
Zhong, H., Huang, R.-J., Lin, C., Xu, W., Duan, J., Gu, Y., Huang, W., Ni, H., Zhu, C., You, Y., Wu, Y., Zhang, R., Ovadnevaite, J., Ceburnis, D., and O'Dowd, C. D.: Measurement report: On the contribution of long-distance transport to the secondary aerosol formation and aging, Atmos. Chem. Phys., 22, 9513–9524, https://doi.org/10.5194/acp-22-9513-2022, 2022.