the Creative Commons Attribution 4.0 License.
the Creative Commons Attribution 4.0 License.
 | 04 Jul 2024
Airborne observations of upper troposphere and lower stratosphere composition change in active convection producing above-anvil cirrus plumes
Cameron R. Homeyer
Jessica B. Smith
Rei Ueyama
Jonathan M. Dean-Day
Elliot L. Atlas
Kate Smith
Jasna V. Pittman
David S. Sayres
David M. Wilmouth
Apoorva Pandey
Jason M. St. Clair
Thomas F. Hanisco
Jennifer Hare
Reem A. Hannun
Steven Wofsy
Bruce C. Daube
Stephen Donnelly
Tropopause-overshooting convection in the midlatitudes provides a rapid transport pathway for air from the lower troposphere to reach the upper troposphere and lower stratosphere (UTLS) and can result in the formation of above-anvil cirrus plumes (AACPs) that significantly hydrate the stratosphere. Such UTLS composition changes alter the radiation budget and impact climate. Novel in situ observations from the NASA Dynamics and Chemistry of the Summer Stratosphere (DCOTSS) field campaign are used in this study to examine UTLS impacts from AACP-generating overshooting convection. Namely, a research flight on 31 May 2022 sampled active convection over the state of Oklahoma for more than 3 h with the NASA ER-2 high-altitude research aircraft. An AACP was bisected during this flight, providing the first such extensive in situ sampling of this phenomenon. The convective observations reveal pronounced changes in air mass composition and stratospheric hydration up to altitudes of 2.3 km above the tropopause and concentrations more than double background levels. Unique dynamic and trace gas signatures were found within the AACP, including enhanced vertical mixing near the AACP edge and a positive correlation between water vapor and ozone. Moreover, the water vapor enhancement within the AACP was found to be limited to the saturation mixing ratio of the low temperature overshoot and AACP air. Comparison with all remaining DCOTSS flights demonstrates that the 31 May 2022 flight had some of the largest tropospheric tracer and water vapor perturbations in the stratosphere and within the AACP.
- Article
(6695 KB) - Full-text XML
-
Supplement
(19039 KB) - BibTeX
- EndNote


The tropopause is often viewed as a sharp boundary separating the troposphere and stratosphere. However, dynamic processes routinely impact the tropopause region and modify the characteristics of a variably deep layer that is commonly referred to as the upper troposphere and lower stratosphere (UTLS). The most rapid of these processes, tropopause-overshooting convection (hereafter “overshooting convection”), facilitates transport of air from the lower troposphere to the UTLS in minutes to hours and can enable irreversible mixing between these layers, known as stratosphere–troposphere exchange (STE). Transport and corresponding STE from overshooting convection alters the composition of the UTLS, modifying greenhouse gases such as water vapor and ozone (Holton et al., 1995; Stohl et al., 2003). This can impact the radiation budget and climate, as the radiation budget is especially sensitive to composition changes within the UTLS. For example, the radiative forcing by water vapor in the UTLS is most sensitive to changes in the extratropical lowermost stratosphere (Solomon et al., 2010; Banerjee et al., 2019), while that for ozone is most sensitive to changes in the upper troposphere (Lacis et al., 1990). Overshooting convection is also commonly associated with severe weather, as these storm produce hazards including hail, tornadoes, and strong winds (Fujita, 1974; Brunner et al., 2007; Bedka, 2011; Dworak et al., 2012; Bedka et al., 2015, 2018; Marion et al., 2019; Sandmæl et al., 2019). To date, much of what we know about the impacts of overshooting convection on the UTLS is based on remotely sensed observations and numerical modeling studies. Few airborne field campaigns have extensively sampled (more than a few minutes) tropopause-overshooting convection, resulting in limited in situ observations of these storms (Smith et al., 2017; Homeyer et al., 2014b).
Tropopause-overshooting convection occurs worldwide and is most frequent over land in the midlatitudes, especially in North and South America (Liu and Liu, 2016; Liu et al., 2020; Clapp et al., 2023; Nugent and Bretherton, 2023). The United States, specifically the Great Plains region, has been recognized as a unique hotspot of deep and frequent overshooting based on satellite and radar observations (Solomon et al., 2016; Cooney et al., 2018; Homeyer and Bowman, 2021). Overshooting convection in the United States is most frequent in the warm season (March–August), with notable annual and diurnal cycles. Approximately half of overshooting convection in the United States reaches the stratospheric overworld (potential temperature (θ)> 380 K; Cooney et al., 2018), where the impacts from these events on the stratosphere can last weeks to months as this air will take longer to descend back to the troposphere in the midlatitudes (Holton et al., 1995). Additionally, air that reaches the stratospheric overworld can be isentropically transported toward the tropics where it may enter the upward branch of the Brewer–Dobson circulation, further extending its stratospheric lifetime (Chang et al., 2023). Despite not being studied explicitly, overshooting convection frequency will likely increase in the future as favorable environments for severe thunderstorms are projected to increase with a warming climate (Del Genio et al., 2007; Trapp et al., 2007; Lepore et al., 2021).
A key storm feature commonly associated with midlatitude tropopause-overshooting convection is the above-anvil cirrus plume (AACP). AACPs are cirrus clouds that reside above the anvil within the stratosphere and are commonly identified in visible and infrared (IR) satellite imagery (Wang, 2003; Luderer et al., 2007; Wang et al., 2016; Homeyer et al., 2017). When AACPs appear warm relative to the underlying anvil cloud in IR imagery, this indicates stratospheric injection of cloud ice and subsequent hydration via sublimation (Murillo and Homeyer, 2022). These plumes are known to be driven by gravity wave breaking near and within the overshooting top in environments with strong storm-relative winds (the difference between the environmental wind and storm motion) in the UTLS, which is associated with the establishment of a hydraulic jump (Wang, 2003; Luderer et al., 2007; Wang et al., 2016; Homeyer et al., 2017; O'Neill et al., 2021). This hydraulic jump occurs near the tropopause and downstream of the overshooting top, where the overshooting top acts as a topographic obstacle. While our appreciation for the impact that various storm and environmental characteristics (including whether an AACP is produced) have on the amount of overshooting and cross-tropopause transport is increasing, most prior observational work does not consider such characteristics when evaluating the UTLS impacts associated with these storms.
UTLS composition impacts from overshooting convection have been explored broadly via satellite observations (Randel et al., 2012; Schwartz et al., 2013; Smith et al., 2017; Werner et al., 2020; Tinney and Homeyer, 2021) and specifically using observations from airborne field campaigns (Poulida et al., 1996; Fischer et al., 2003; Fromm and Servranckx, 2003; Hegglin et al., 2004; Frey et al., 2015; Hanisco et al., 2007; Homeyer et al., 2011; Anderson et al., 2012; Homeyer et al., 2014b; Pan et al., 2014; Herman et al., 2017; Smith et al., 2017; Khaykin et al., 2022). These studies have shown that water vapor in the UTLS is enhanced through both sublimation of ice and air mass transport and that water vapor and additional tropospheric and stratospheric trace gases have been observed to be modified up to 4 km above the tropopause. The contribution to the global lower stratosphere H2O budget from overshooting convection is currently estimated to range from 10 %–15 %, based on several studies using output from convection-resolving model simulations and observations of storms with a trajectory model driven by large-scale winds (Dauhut and Hohenegger, 2022; Dessler and Sherwood, 2004; Tinney and Homeyer, 2021; Ueyama et al., 2023). This is likely an underestimation, as most existing efforts to quantify the lower stratosphere H2O budget only consider effects from tropical convection. However, there has been increasing attention towards midlatitude convection contributions to the lower stratosphere H2O budget, due to its observed frequency and depth (Khaykin et al., 2009; Liu and Liu, 2016; Liu et al., 2020; Werner et al., 2020).
Stratospheric hydration from convection has been encountered in a few prior field campaigns, including the SCOUT-AMMA aircraft campaign over Africa (Khaykin et al., 2009); the Aura Validation Experiment (AVE) aircraft campaign over the United States (Hanisco et al., 2007; Anderson et al., 2012; Smith et al., 2017); the Studies of Emissions, Atmospheric Composition, Clouds and Climate Coupling by Regional Surveys (SEAC4RS) aircraft campaign over the United States (Smith et al., 2017); and the Deep Convective Clouds and Chemistry (DC3) field campaign over the United States (Homeyer et al., 2014b; Pan et al., 2014). The majority of convective encounters within these field campaigns was serendipitous rather than targeted. The SEAC4RS campaign targeted convective outflow from an AACP-producing storm that occurred ∼ 20 h prior to flight, detailed in Smith et al. (2017). In situ data were used to estimate that between 6.6 and 13.5 kt of water vapor was irreversibly delivered to the lower stratosphere from this convective system. Most airborne observations of overshooting convection and UTLS impacts are associated with recent (less than 36 h between overshooting and sampling) or aged convection (longer than 36 h between overshooting and convection) rather than active convection (measurements in or near an active convective complex with co-located cloud observations, which can range from minutes to a few hours old), especially within the lower stratosphere. The DC3 field campaign had active convection targeting, which occurred primarily in the upper troposphere. The G5 and DC-8 aircraft used during DC3, however, did encounter convectively injected H2O at altitudes up to 1–2 km above the tropopause near active overshooting convection during a flight on 20 May 2012, detailed in Homeyer et al. (2014b). Water vapor enhancements exceeded 200 ppmv above background concentrations in the lower stratosphere, with evidence of extensive mixing between troposphere and stratosphere air within this broad H2O enhancement. Additionally, an AACP was briefly encountered within this flight, measured at a distant range from the parent overshoot for approximately 30 s.
As past observations of overshoot-influenced air are limited, much of the current understanding of the impact of overshooting convection on the UTLS has been gleaned from numerical model simulations. Simulations of overshooting convection suggest the amount of overshooting and cross-tropopause transport is sensitive to storm mode (Mesoscale Convective System or MCS versus a discrete supercell) and the characteristics of the lower stratospheric environment, such as stability and the strength of storm-relative winds (Mullendore et al., 2005; Bigelbach et al., 2014; Homeyer et al., 2014a; Starzec et al., 2020; O'Neill et al., 2021; Gordon and Homeyer, 2022). The amount of STE from overshooting convection also appears to depend on the height of the tropopause and, more generally, UTLS temperature (Phoenix and Homeyer, 2021). A lower UTLS temperature is an important constraint for stratospheric hydration, while a higher tropopause also impacts air mass transport as it is harder to reach since it allows for greater cumulative diluting effects on air within the convective updraft that result from entrainment of environmental (free troposphere) air. Within these known sensitivities, multiple simulations have shown that water vapor enhancements have appeared to reach higher altitudes than passive tropospheric tracers (Homeyer, 2015; Phoenix and Homeyer, 2021; Gordon and Homeyer, 2022). Furthermore, recent numerical modeling studies have identified the unique influence of AACP-producing storms on UTLS composition (O'Neill et al., 2021; Gordon and Homeyer, 2022). Specifically, troposphere-to-stratosphere (TST) transport is greater in AACP-producing storms. Additionally, AACP-producing storms feature enhanced downward transport of overworld air to the lowermost stratosphere (the portion below 380 K potential temperature) compared to non-AACP storms (Gordon and Homeyer, 2022). Many of these modeling results have yet to be verified by observations, including water vapor enhancements routinely reaching greater altitudes than tropospheric tracers and the apparent downward mixing of overworld air to the lowermost stratosphere associated with AACP-producing storms.
The recently completed NASA Dynamics and Chemistry of the Summer Stratosphere (DCOTSS) field campaign provides unprecedented observations of tropopause-overshooting convection that have exceeded all prior records of stratospheric depth (Homeyer et al., 2023). The primary goal of the DCOTSS mission was to improve understanding of the dynamical and chemical processes that influence the composition of the extratropical summertime stratosphere, with several core science questions including the following. (a) How much tropospheric air and water is irreversibly injected into the stratosphere by convection? And (b) what dynamical mechanisms lead to the irreversible injection of material into the stratosphere by convective storms? DCOTSS completed at least 18 flights sampling material from overshooting convection, but it is currently uncertain how many of these flights sampled material from AACP-producing storms (versus non-AACP storms). Multiple active convection flights were completed, but only one flight (on 31 May 2022) specifically targeted and repeatedly sampled an actively generated AACP as it was deemed safe to do so. In this study, we present in situ airborne observations of this event. The measurements obtained throughout this flight by the versatile DCOTSS instrument payload provide unique insight into UTLS composition changes associated with the storm. We seek to utilize these observations to address how the composition of the UTLS is altered by an AACP-producing storm and compare these observations with results from recent modeling studies. Specifically, we aim to address the following questions. (i) How is the UTLS composition altered near/during active overshooting convection and AACPs? And (ii) what dynamical/physical processes could contribute to these changes in UTLS composition? We use airborne observations of trace gases and meteorological parameters to investigate composition changes and to constrain transport and mixing processes within the UTLS.
2.1 DCOTSS overview
The DCOTSS field campaign used the National Aeronautics and Space Administration (NASA) ER-2 high-altitude research aircraft to investigate the impact of intense convection on the summertime stratosphere over North America from June to August 2021 and May to July 2022. The focus was on sampling air from active, recent, and aged overshooting events over the United States, but science flights also sampled pyrocumulonimbus smoke, outflow from storms occurring over the Sierra Madre Occidental in Mexico, and surveyed the large-scale structure of the North American monsoon anticyclone. DCOTSS was based primarily in Salina, Kansas (38.84° N, 97.61° W), and the ER-2 flew 29 science flights with research-quality data (depending on the instrument) during the campaign: 14 in 2021 and 15 in 2022. Active convection was sampled during three flights (31 May, 8 June, and 24 June 2022), with the most extensive sampling of active convection during the 31 May 2022 flight. The 31 May 2022 flight sampled multiple convective enhancements (both inside and outside of cloud material) throughout the flight, featuring a bisect and profile of an AACP. The DCOTSS instrument payload consists of 12 instruments and was designed to provide myriad in situ measurements of trace species and meteorological parameters in the UTLS necessary to evaluate transport, mixing, and the net chemical impact of summertime convection on the UTLS.
2.2 DCOTSS observations
In our analysis we use multiple select trace constituents that are useful for diagnosing convective transport within the UTLS. These include water vapor (H2O), ozone (O3), carbon monoxide (CO), methane (CH4), total water (vapor + ice), and several additional trace species with anthropogenic sources at the surface. Harvard Water Vapor (HWV) measures ambient H2O mixing ratios at 1 Hz. The HWV instrument is composed of the Harvard Lyman-α photo-fragment fluorescence instrument (LyA) and the Harvard Herriott Hygrometer (HHH), a tunable diode laser direct absorption instrument. Only the HHH observations are used in this study. The measurements have an accuracy of 5 %–10 % and a precision better than 0.1 ppmv (Sargent et al., 2013). The Rapid OZone Experiment (ROZE) is a cavity-enhanced ultraviolet absorption instrument that measures in situ O3 by direct absorption, obtaining measurements at 1 Hz with a precision of 1 ppbv in the stratosphere and an accuracy of 6 % (Hannun et al., 2020). The Harvard University Picarro Cavity Ringdown Spectrometer (HUPCRS) is a modified G2401-m Picarro gas analyzer (Crosson, 2008) that measures CO2, CH4, and CO every ∼ 2.2 s; CH4 data are reported at 1 Hz with 0.2 ppbv uncertainty, and CO data are reported at 0.1 Hz with 3.2 ppbv uncertainty. The Water Isotopologues – Integrated Cavity-Output Spectrometer (WI-ICOS) measures total water (vapor + ice) and its major isotopologues at 1 Hz. WI-ICOS uses cavity-enhanced absorption, and an isokinetic inlet and heaters are used to measure total water, which is the only measurement we use in this study. WI-ICOS total water measurements have an accuracy of 0.1 ppmv and an uncertainty of 10 % (Sayres et al., 2009).
The Advanced Whole Air Sampler (AWAS) consists of 32 stainless-steel canisters mounted in the center belly pod of the ER-2. The canisters were typically filled on demand to target samples from specific features during a research flight. The time for AWAS to collect a sample varies depending on altitude, between 20 and 200 s (with shorter times at lower altitudes). After each flight, canisters were analyzed using gas chromatography with mass spectrometry, a flame ionization detector, and an electron capture detector to determine the mixing ratio of a variety of tracers. AWAS measures more than 20 constituents with varying lifetimes and provides valuable measurements of short-lived and very short-lived tracers (Flocke et al., 1999; Schauffler et al., 1999). AWAS constituents of interest for the 31 May 2022 flight include ethane, ethyne, and propane. Ethane (C2H6) has a tropospheric lifetime of 52 d (Chelpon et al., 2021) and is primarily sourced from crude oil and natural gas production, with additional sources from biomass and fossil fuel burning. Propane (C3H8) is also primarily a product of crude oil and natural gas production, with additional sources from biomass and fossil fuel burning, and has a tropospheric lifetime of 9.4 d (Chelpon et al., 2021). Ethyne (C2H2) has a tropospheric lifetime of 9.8 d (Chelpon et al., 2021) and is primarily sourced from biomass and biofuel burning but can also result from crude oil and natural gas production.
Meteorological parameters including temperature, potential temperature, horizontal winds, and vertical winds are examined to gain further insight regarding STE processes throughout the flight. The Meteorological Measurement System (MMS) provides calibrated, high-resolution measurements of ambient meteorological parameters, including temperature, pressure, the three-dimensional wind vector, and turbulent energy dissipation rate (TEDR), at 20 samples per second. The MMS potential temperature has an accuracy of 0.5–1.5 K, temperature has an accuracy of ±0.3 K, horizontal and vertical winds have a combined accuracy of ±1 m s−1, and the GPS altitudes have an accuracy of 15 m (Scott et al., 1990). For contextual campaign-wide analysis, we leverage feature identifications outlined in Homeyer et al. (2023). Namely, convective versus non-convective observations are based on manual identification of water vapor enhancements above prevailing background conditions within the stratosphere that have been linked to overshooting convection (identified with radar and satellite observations) via trajectory matching.
2.3 ERA5 reanalysis
Version 5 of the European Centre for Medium-Range Weather Forecasts (ECMWF) reanalysis, ERA5, is used for tropopause identification within this study (Hersbach et al., 2020). The ERA5 output we use consists of hourly global assimilations of the atmospheric state on 37 pressure levels and a 0.25° latitude–longitude grid. These ERA5 vertical profiles are linearly interpolated to a regular 200 m grid before the lapse-rate tropopause (LRT) definition (World Meteorological Organization, 1957) is applied, which allows finer localization of the tropopause than that possible on the coarse grid and increased agreement with finer-resolution data. Resulting LRT altitudes are interpolated linearly in time and space to aircraft location as well as radar and satellite grids for analysis. ERA5 LRT altitudes calculated on the native model grid have been demonstrated to have minimal bias with uncertainties ≤ 250 m (e.g., Hoffmann and Spang, 2022). Although ERA5 output is available on the full 137 model grid, those data yield minor refinement. Specifically, global comparison of our LRT altitudes based on the 37-level pressure grid and the native model grid demonstrate that they commonly agree to within ±500 m (not shown). This minimal refinement led to the decision to use the coarser 37-pressure-level data to minimize storage and computational cost. Moreover, a tropopause altitude uncertainty of ±500 m for global model output such as ERA5 is a long-demonstrated standard and tolerable for the analyses and interpretations presented in this study.
2.4 Radar observations
Gridded NEXRAD WSR-88D Radar (GridRad) data version 4.2 is used for high-resolution analyses of overshooting convection in the contiguous United States (Homeyer and Bowman, 2022). GridRad merges individual NEXRAD WSR-88D data onto a common three-dimensional grid and is available at 10 min intervals for this study. The grid has ∼ 0.02° latitude–longitude (∼ 2 km) resolution, with a domain spanning 24–50° N latitude and 235–294° E longitude. Altitude spacing of the GridRad data is 0.5 km at altitudes below 7 km above mean sea level (a.m.s.l.) and 1 km otherwise up to 22 km a.m.s.l. The sole variable from the GridRad volumes used for analysis in this study is the radar reflectivity at horizontal polarization (ZH). Tropopause-overshooting convection is identified as ZH = 15 dBz echo-top altitudes above the ERA5 LRT. Quality control metrics consistent with previous radar climatologies (Solomon et al., 2016; Cooney et al., 2018; Homeyer and Bowman, 2021) are applied, and GridRad echo-top altitudes are unbiased with an uncertainty of 1 km.
2.5 Satellite observations
Imagery from the Geostationary Observing Earth Satellite (GOES) platform over North America is used to enable AACP identification and to complement radar observations for analysis of the 31 May 2022 flight. Here, we only use GOES-16 (GOES-East) imagery at 1 min intervals over the domain of the flight. Namely, visible (VIS; channel 2 with a central wavelength of ∼ 0.64 µm) and infrared (IR; channel 13 with a central wavelength of ∼ 10.3 µm) satellite imagery from the GOES Advanced Baseline Imager (ABI) are used (Schmit et al., 2017). AACPs are commonly identifiable in VIS as an area with relatively smooth texture that casts a shadow on the underlying anvil, especially at times approaching sunset when the solar inclination angle is high. In IR, AACPs representing stratospheric injection of cloud material can be identified by anomalously warm brightness temperatures compared to the storm anvil (Murillo and Homeyer, 2022).
3.1 Storm characteristics and flight overview
The 31 May 2022 flight was designed to target active and ongoing overshooting convection in western Oklahoma. On 31 May 2022, a cluster of storms formed in western Oklahoma and the adjacent northern portion of Texas near 21:00 UTC. Overshooting convection began near 22:00 UTC on 31 May 2022 and dissipated near 06:30 UTC on 1 June 2022, leading to ∼ 8.5 h of sustained overshooting within this cluster of storms. Overshoots reached a maximum echo-top height of 19 km at 22:00 UTC, with persistent echo-top heights near 17–18 km for the majority of the storms' lifetimes (including the sampling time span of the 31 May 2022 flight). Figure 1 shows radar reflectivity, echo-top heights, and IR and VIS satellite imagery of the storms for select times, including throughout the sampling time period (00:20 UTC through 02:10 UTC). Material from the overshoot and accompanying AACP in western Oklahoma (indicated by the yellow and cyan circles in Fig. 1, respectively) was targeted. This specific cell had sustained overshooting from 22:00 UTC on 31 May until it decayed near 01:00 UTC on 1 June (3 consecutive hours of overshooting), while the AACP remained until at least ∼ 03:00 UTC on 1 June. The convectively influenced air from the overshooting storm was advected to the east, while the storm that produced the AACP moved eastward more slowly. As a result, the ER-2 could safely sample the overshoot material downstream of the storm for an extended period of time. The 31 May 2022 flight was the first active convection flight of DCOTSS and the only flight to target an AACP.
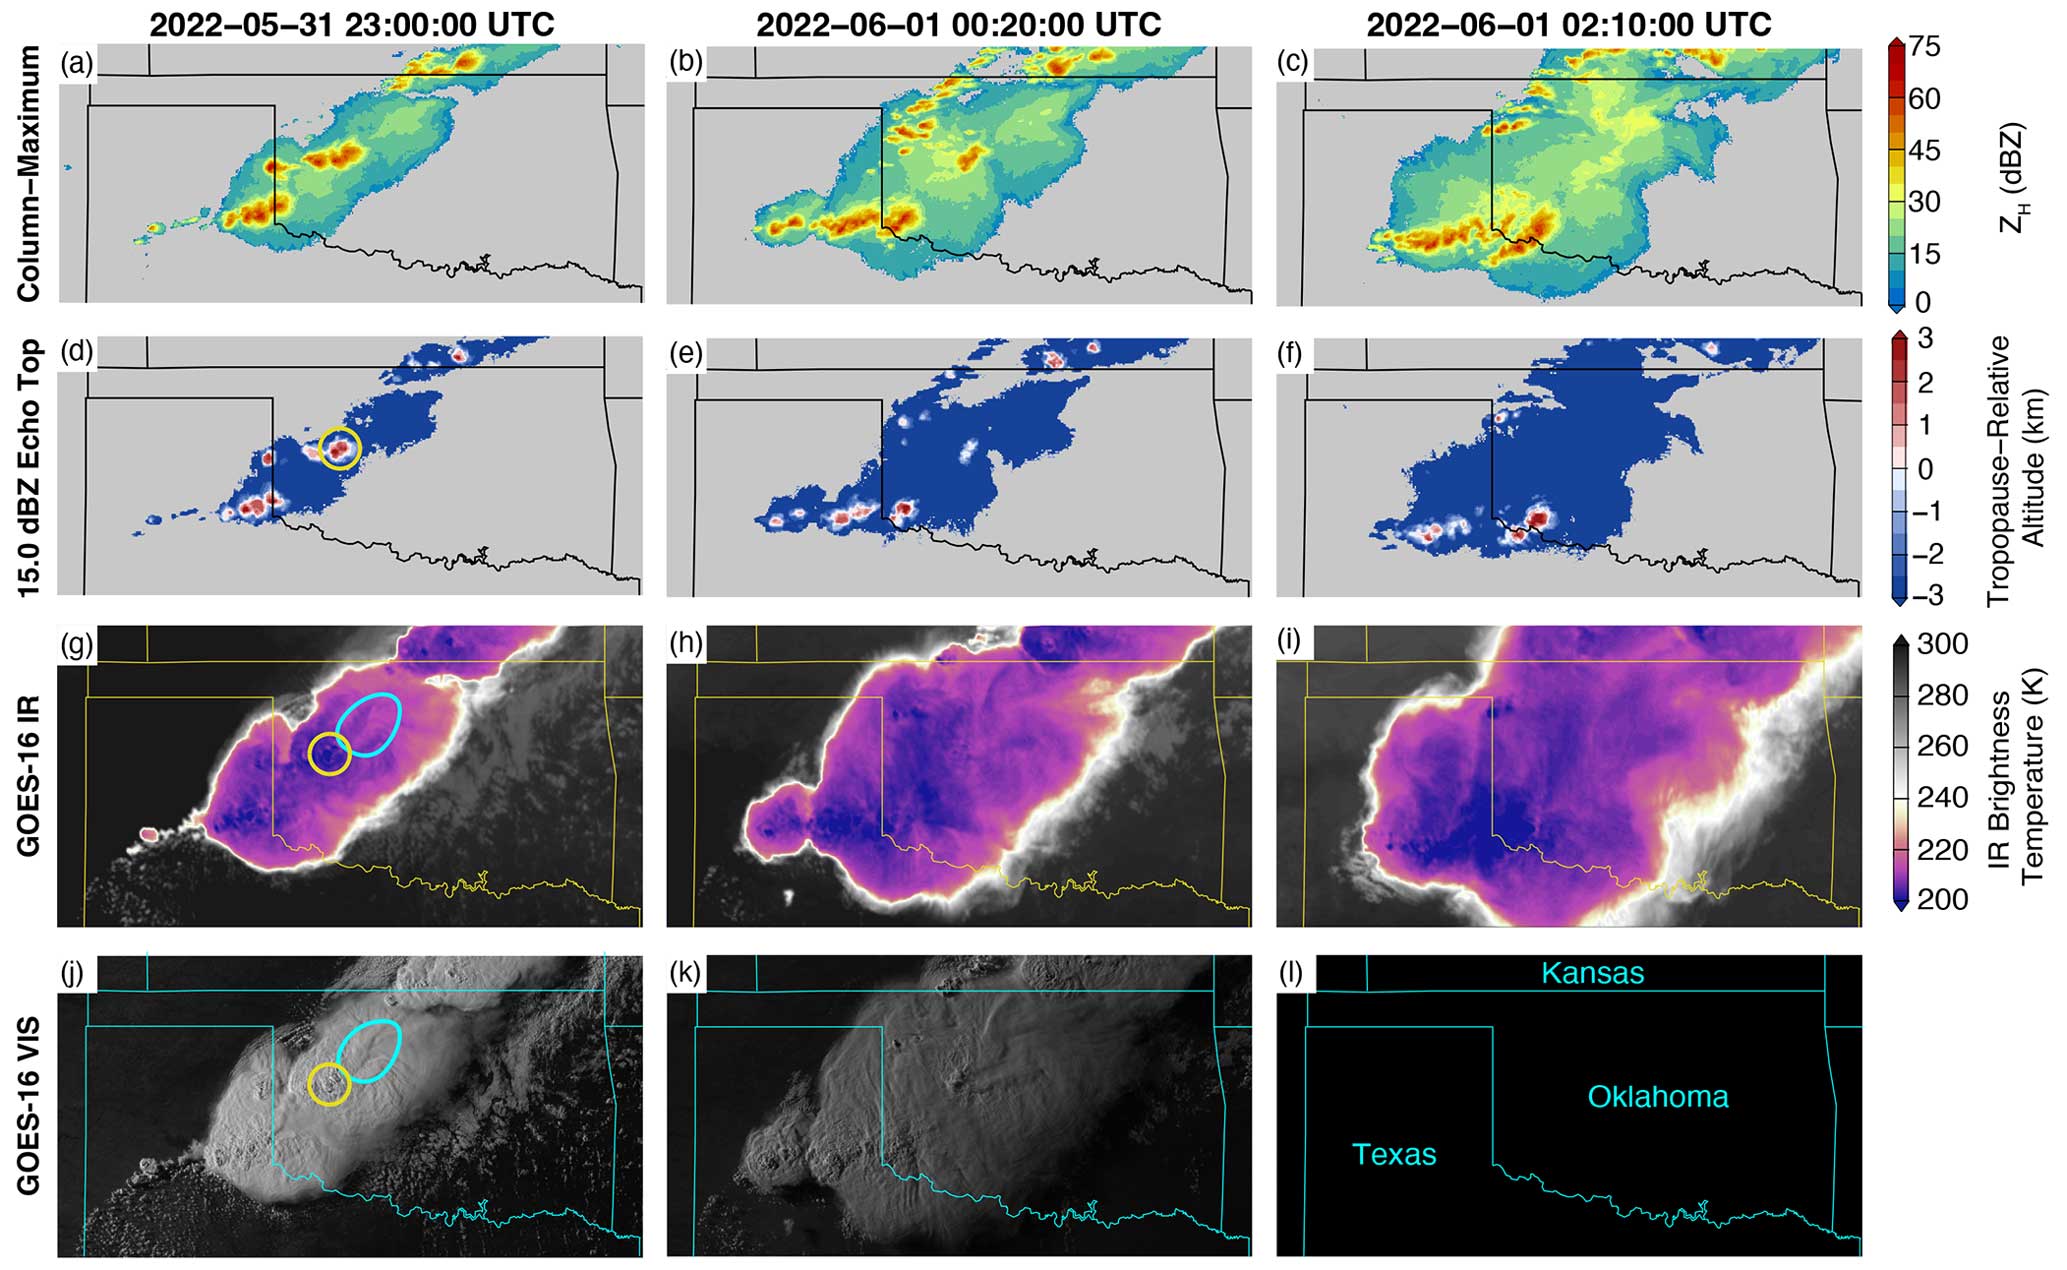
Figure 1(a–c) GridRad radar reflectivity (ZH), (d–f) GridRad ZH= 15.0 dBZ tropopause-relative echo-top heights (km), (g–i) GOES-16 infrared imagery, and (j–l) GOES-16 visible imagery at (a, d, g, j) 23:00 UTC on 31 May 2022 (takeoff), (b, e, h, k) 00:20 UTC on 1 June 2022 (convective sampling begins), and (c, f, i, l) 02:10 UTC on 1 June 2022 (start of the AACP bisects). The latitude and longitude domain span 33.3–37.5° N, 94.0–103.5° W. The targeted overshoot is annotated with a yellow circle, while the targeted AACP is annotated with a cyan oval.
Figure 2 shows the entire flight track of the 31 May 2022 flight colored by altitude and H2O measurements, with points of interest labeled (an animation of the aircraft position and flight track atop 1 min satellite imagery is provided in the Supplement). The flight began with takeoff at 22:59 UTC on 31 May 2022, and the ER-2 ascended to an altitude of 20 km while approaching the targeted storms in western Oklahoma, approximately 1–2 h after their initial overshooting. The aircraft descended to the first level leg at an altitude of 14.5 km near point A at 00:20 UTC (Figs. 2 and 3a) and completed a series of stacked level legs between points P1 and P2, at altitudes of 14.5, 15, 14.75, 15.5, and 16.5 km (Fig. 2). The AACP of the targeted storm can be seen in ER-2 camera imagery from the level legs in Fig. 3a (facing forward) and 3b (facing right of the aircraft, towards the west). Beginning at 02:07 UTC (∼ 3:10 h of flight time), following the radar-indicated collapse of the target cell near point P3 at approximately 01:00 UTC (seen in Fig. 1d, e, and f), the ER-2 was able to sample between points P1 and P3 at an altitude of 15.75 km, bisecting the AACP. The ER-2 image midway through the AACP bisect shows a layer of light distinguishing the AACP from the broader anvil below (Fig. 3c; facing right of the aircraft). The pilot encountered turbulence near point P3 and briefly ascended to 16.75 km before turning northeast and returning to 15.75 km, resulting in a fortuitous vertical profile through the AACP. Figure 3d shows the AACP as the ER-2 ascends above it during the vertical profile near P3. The camera was again facing to the right. As the ER-2 approached point P1 following the AACP bisect, it was routed back to Salina, KS, at 02:48 UTC due to convection near the airport that could impact landing. The ER-2 ascended to an altitude of 20 km and returned to Salina, KS, at 04:07 UTC, completing the 5 h, 8 min flight.
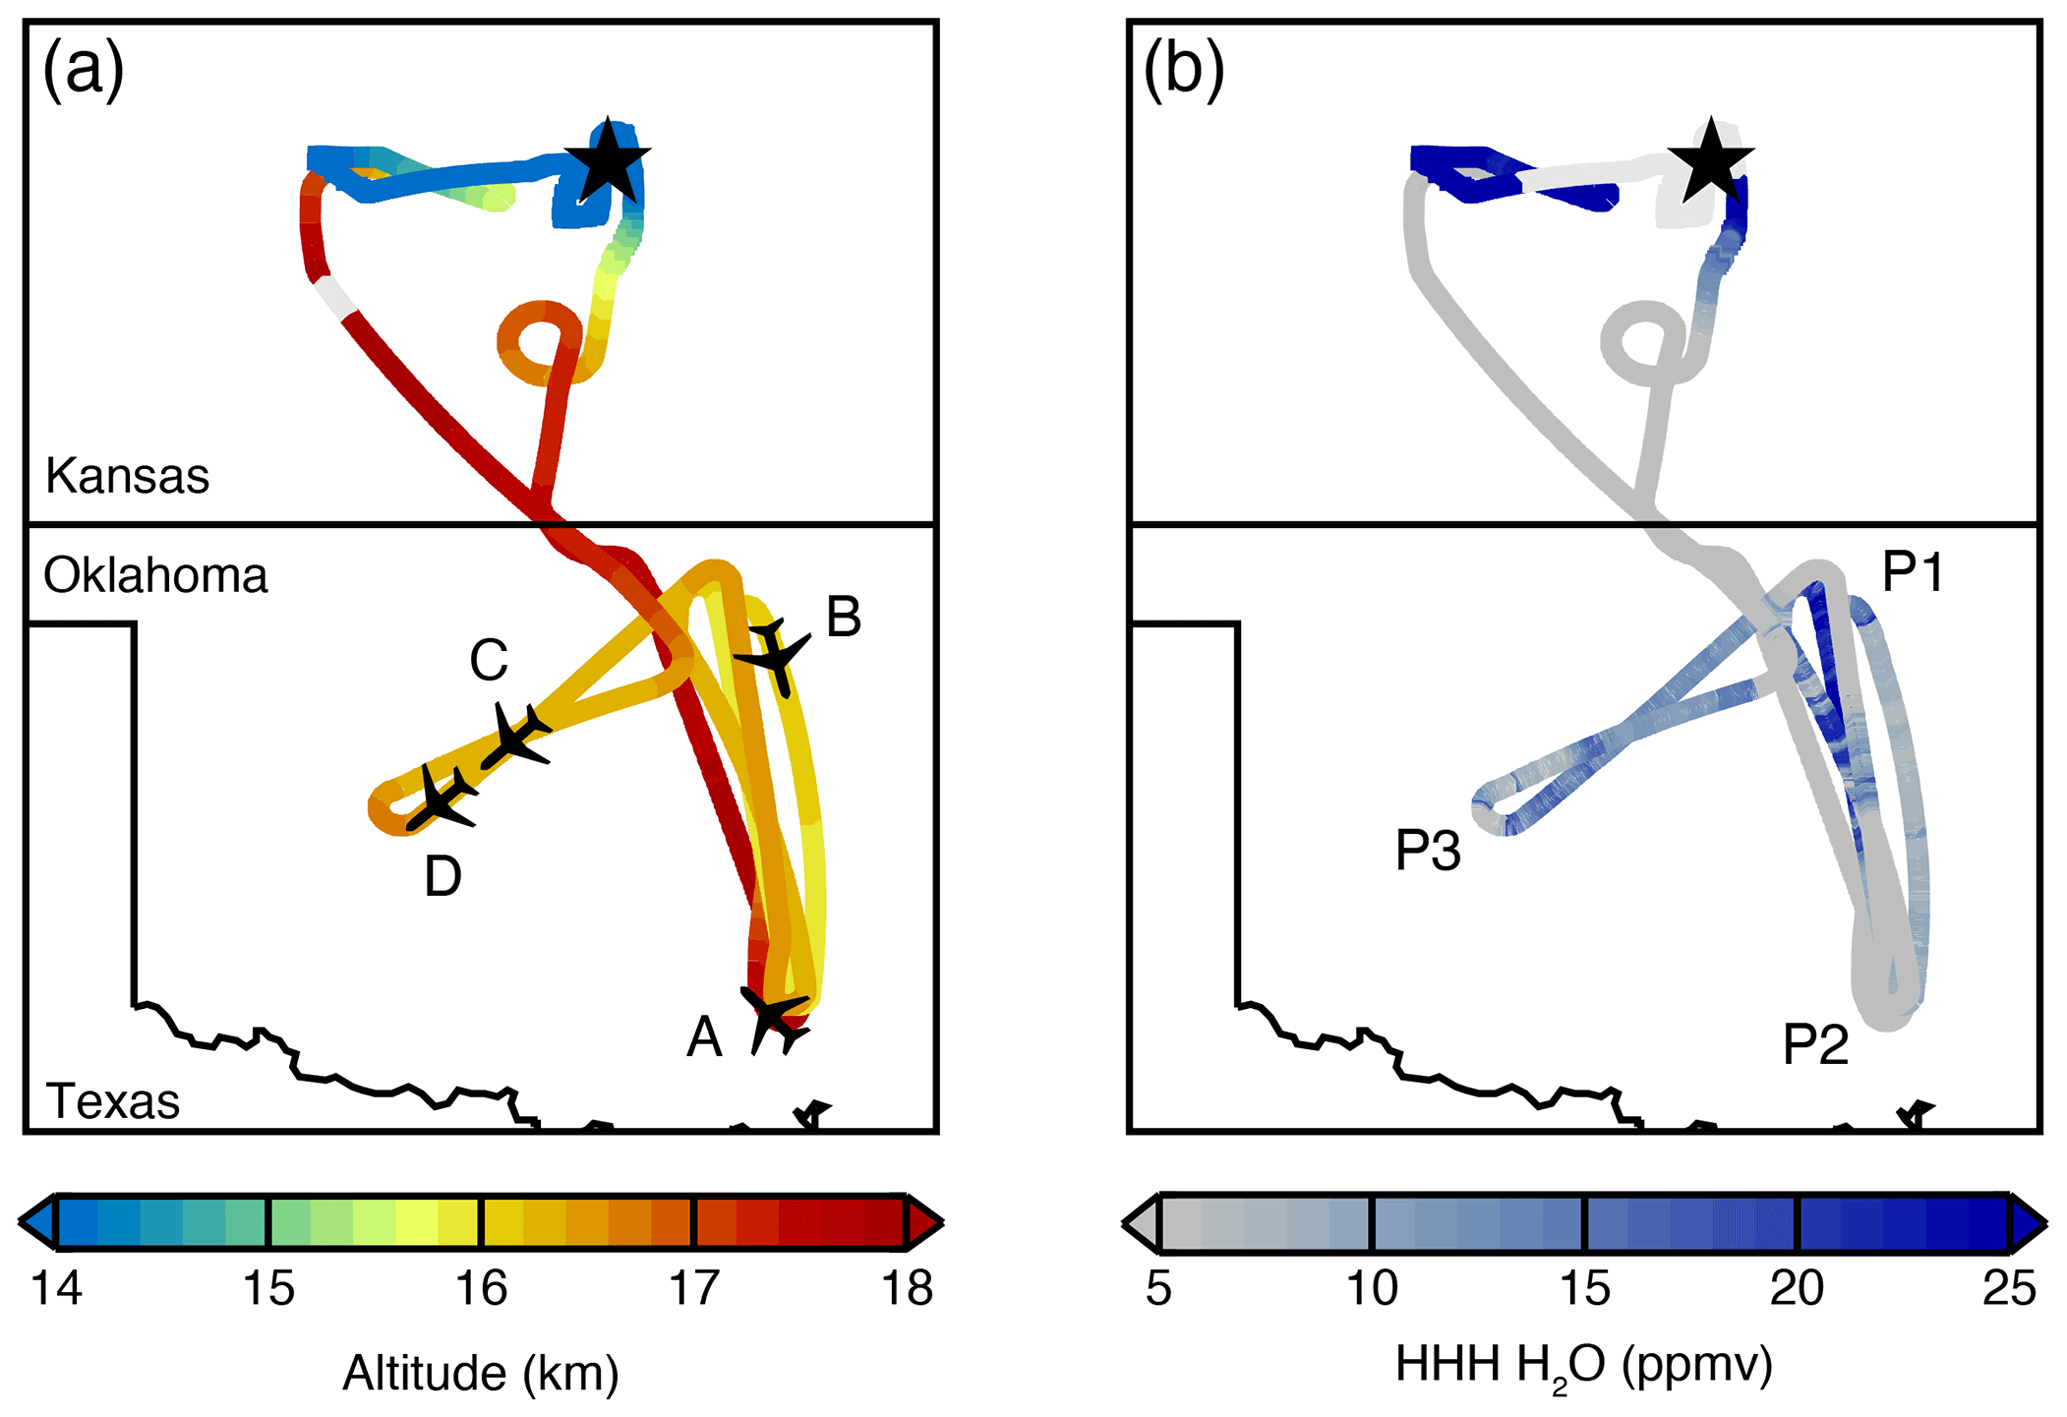
Figure 2ER-2 aircraft flight track for the 31 May 2022 flight shaded by (a) altitude in kilometers (km) and (b) HHH H2O in parts per million by volume (ppmv), spanning a domain of 33.0–39.5° N, 96.0–100.5° W. The star symbol indicates the location of Salina, KS, the base of the DCOTSS field campaign. The plane symbols labeled A, B, C, and D coincide with ER-2 camera imagery shown in Fig. 3. Point 1 (P1) is the starting point of the racetrack sampling, point 2 (P2) is the endpoint of the racetrack sampling, and point 3 (P3) is the endpoint of the AACP bisect sampling.
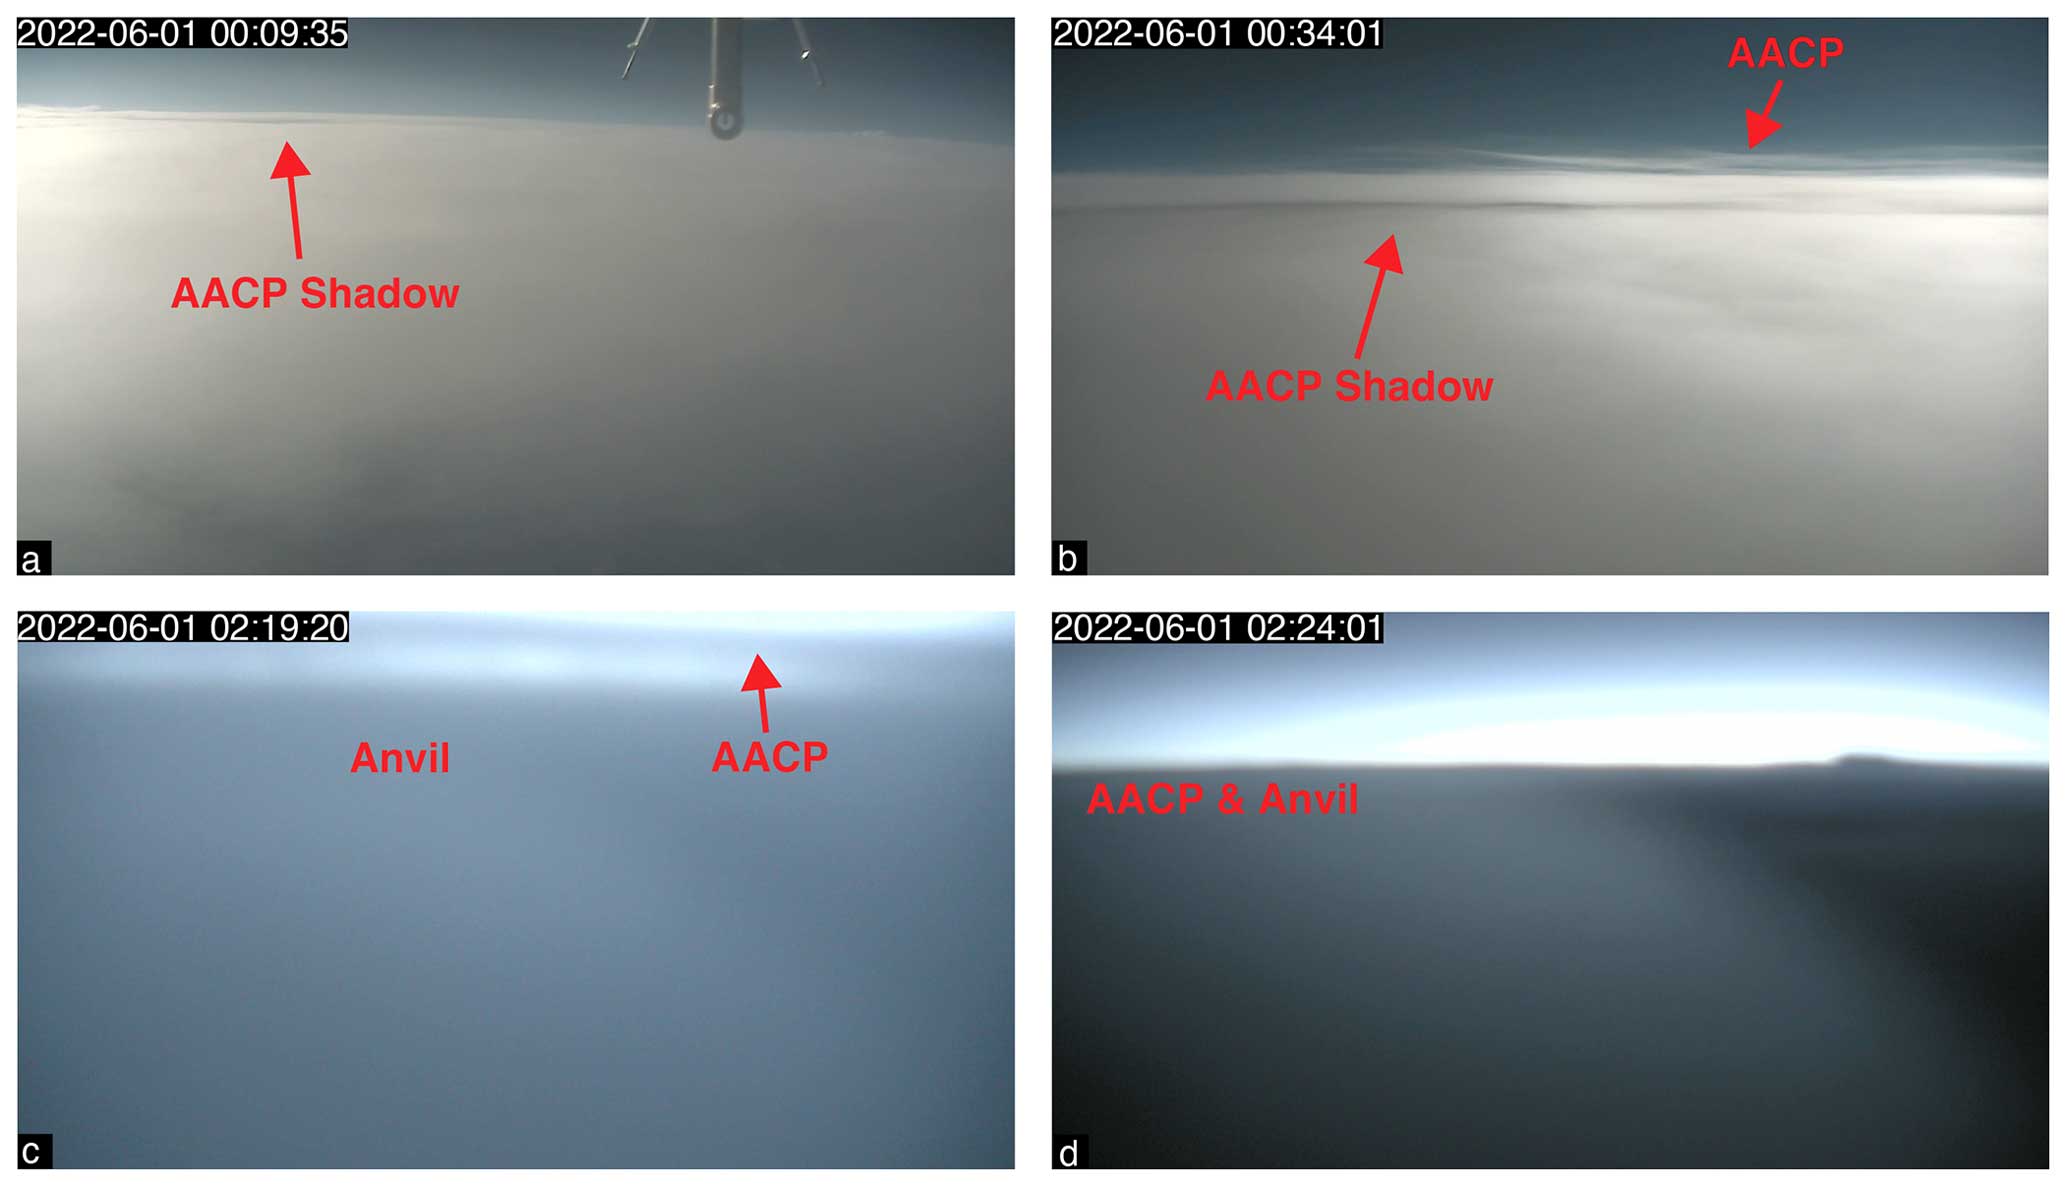
Figure 3Visible imagery from the rotatable camera aboard the NASA ER-2 aircraft taken at (a) 00:09 UTC, where the camera is facing forward toward the northwest; (b) 00:34 UTC, where the camera is facing right of the aircraft towards the west; (c) 02:19 UTC, where the camera is facing right of the aircraft towards the northwest; and (d) 02:24 UTC on 1 June 2022, where the camera is facing to the right of the aircraft toward the northwest. These images correspond to the plane symbols labeled A, B, C, and D in Fig. 2.
3.2 UTLS composition changes
Multiple segments of convectively influenced air at different altitudes were sampled during the 31 May 2022 flight. Figure 4a shows a time series from 00:17–02:44 UTC on 1 June of WI-ICOS total water (vapor + ice), aircraft altitude, ERA5 tropopause geopotential height, and HHH H2O, with subjectively identified convective enhancements in H2O (mixing ratios that greatly exceed background at that altitude for several minutes) shaded in blue. Background H2O mixing ratios in the lower stratosphere range from 4 to 6 ppmv during this flight. The first two H2O enhancements (convective segments 1 and 2) occur mostly below the tropopause at altitudes of 14.75 and 15.25 km, with H2O reaching near ∼ 30 ppmv. Convective segment 1 contains enhanced H2O at two altitudes and includes the ascent between them. For both segments 1 and 2, the ER-2 is sampling near or within the tropopause-reaching anvil cloud, as revealed by total water exceeding H2O periodically during these segments, indicating that ice was present in addition to vapor. Measurements where the difference between H2O and total water is greater than the combined variability of the two measurements are indicative that the aircraft is within cloud material. The next two convective H2O enhancements (convective segments 3 and 4) are at higher, stratospheric altitudes of ∼ 15.75 and ∼ 16.25 km (0.5–1.5 km above the tropopause), with H2O reaching up to 20 ppmv (an approximate quadrupling of the background mixing ratio). Enhancement 4 occurs outside of cloud material, as seen by total water being approximately equivalent to H2O. The final two H2O enhancements (convective segments 5 and 6) occur within the AACP bisect, while the ER-2 is broadly within cloud as total water substantially exceeds H2O. Elevated H2O is observed within the AACP before and during the vertical profile, with enhancements spanning 10–20 ppmv that maximize during the vertical profile.
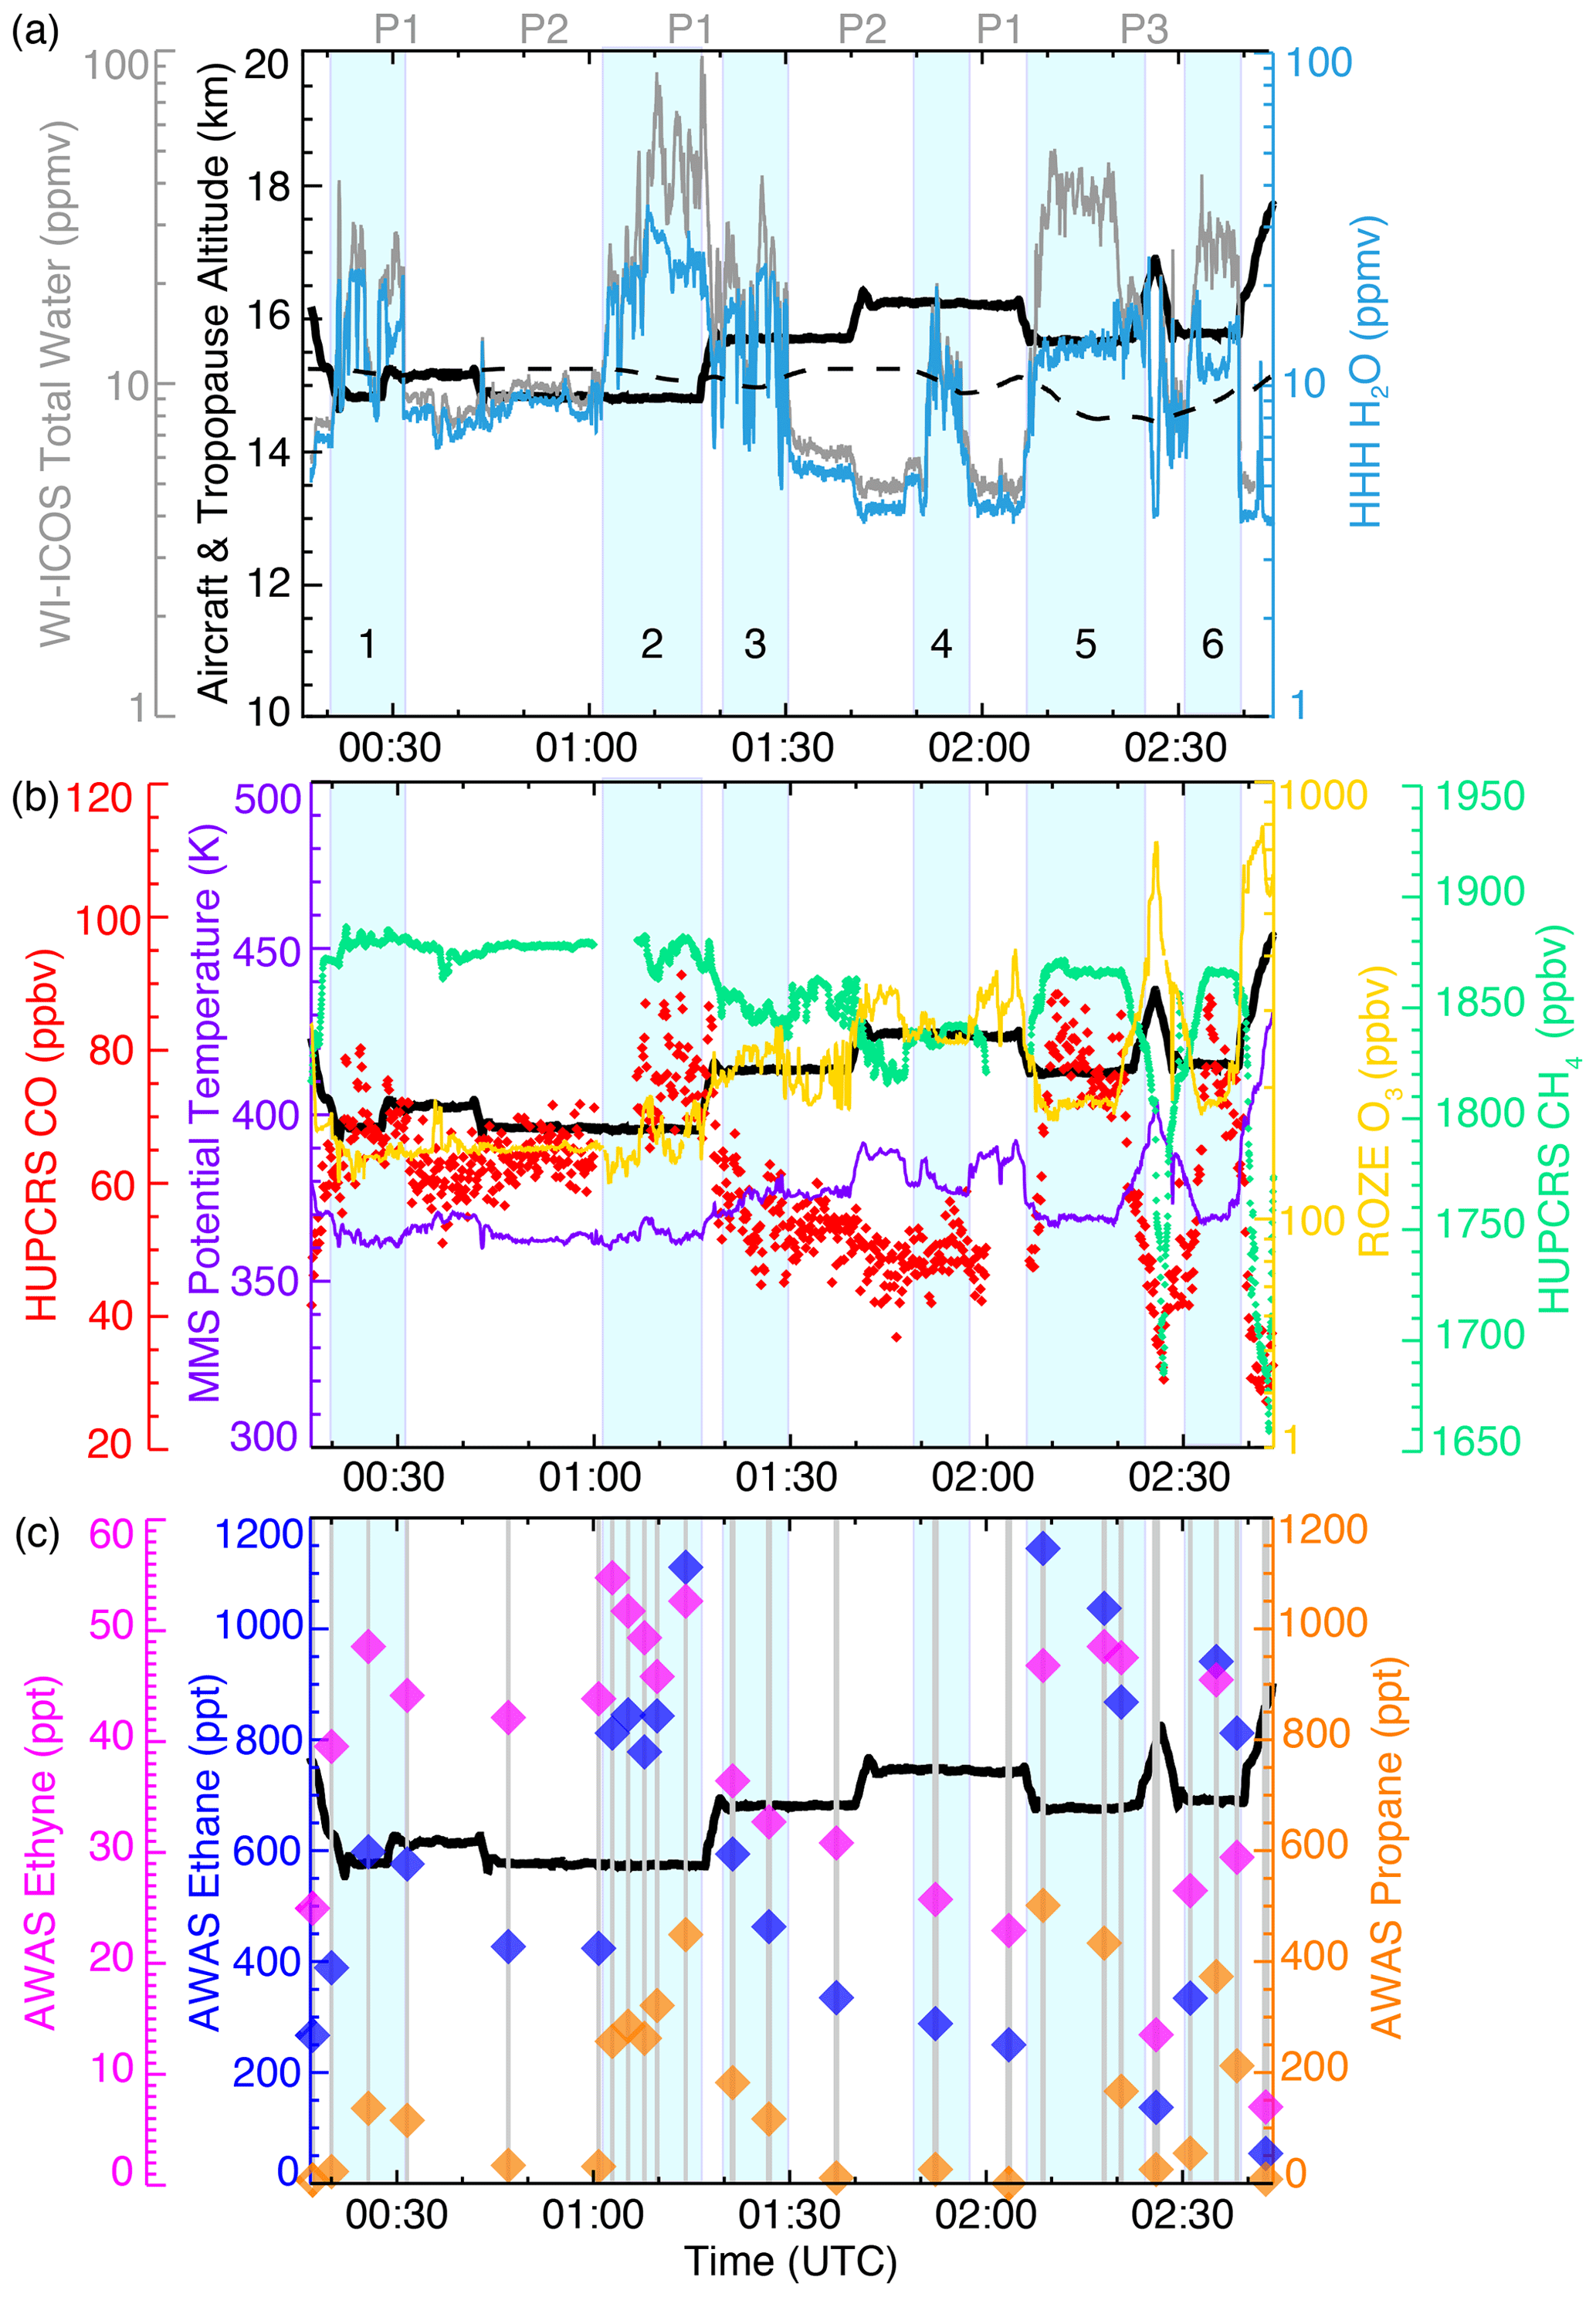
Figure 4The convective sampling period (in UTC) of the DCOTSS 31 May 2022 flight shown as time series. All time series include the MMS GPS aircraft altitude (thick black line) and illustrations of the convective sampling segments (light-blue shading, labeled 1–6 in time series; a). The top time series (a) includes WI-ICOS total water (gray), ERA5 LRT altitude (dashed black line), and H2O mixing ratio (blue). Points P1, P2, and P3 from Fig. 2 are labeled (gray) atop the time series (a). The middle time series (b) includes HUPCRS CO (red), MMS potential temperature (purple), ROZE O3 mixing ratio (yellow), and HUPCRS CH4 (green). The lower time series (c) includes AWAS ethyne (magenta), ethane (blue), propane (orange), and canister fill time (vertical gray bars of varying width).
Figure 4b is a time series including HUPCRS CO, MMS potential temperature, ROZE O3, and HUPCRS CH4. Potential temperature and O3, stratospheric tracers, follow similar trends to one another throughout the flight and will be discussed in greater detail in subsequent analyses. CO and CH4, tracers of tropospheric origin, are substantially elevated above adjacent measurements within the H2O convective enhancements 5 and 6. CO is also elevated in segments 1 and 2. These four convective segments are when the ER-2 was within cloud, skimming the anvil (convective segments 1 and 2) and bisecting the AACP on either side of the vertical profile (convective segments 5 and 6). The AACP feature will be highlighted further in subsequent analyses. It is worth noting that while H2O is enhanced at the beginning of the vertical profile (near the end of convective segment 5), tropospheric tracers are not. This leaves segments 3 and 4, when the ER-2 is sampling predominantly outside of cloud and at stratospheric altitudes, as primarily a H2O signal. Tropospheric tracers, such as CO and CH4, experience the greatest convective enhancement within cloud material (convective segments 2, 5, and 6), especially within the AACP, and at closer proximity to the tropopause altitude (convective segment 1). CO reaches near 90 ppbv at an altitude of 14.75 km, while the ER-2 is skimming the anvil beneath the tropopause, and is enhanced to ∼ 87 ppbv within the AACP bisect (∼ 1.2 km above the tropopause, where the typical background mixing ratio is ∼ 40 ppbv). These results show that CO and CH4 reach similar enhancement within the AACP compared to the anvil, even though the AACP is above the tropopause and occurs at a higher altitude and potential temperature. The maximum altitude of elevated H2O for the 31 May 2022 flight occurred out of cloud material and was linked to the target storm at an altitude of ∼ 17 km (∼ 2 km above the LRT) during the final ascent to return home (at ∼ 02:42 UTC, which is not shaded in Fig. 4a), while the maximum altitude of elevated tropospheric tracers was 15.75 km (∼ 1.2 km above the LRT) and occurred within the AACP (convective segment 6). The maximum altitude of enhanced H2O relative to the ERA5 tropopause was 2.3 km and occurred out of cloud material but within the vertical profile of the AACP (near the end of convective segment 5 in Fig. 4a). Thus, it is abundantly clear from these measurements that H2O enhancements reached higher absolute and tropopause-relative altitudes than tropospheric tracers, which is consistent with a common yet unexplained result from previous modeling work (Homeyer, 2015; Phoenix and Homeyer, 2021; Gordon and Homeyer, 2022). Specifically, both previous modeling work and these observational results indicate that elevated H2O can reach stratospheric altitudes at least 1 km higher than enhanced passive tracers.
Since longer-lived tropospheric tracers (CO and CH4) appear to be most enhanced within cloud material, shorter-lived tracers from AWAS samples are examined as well. Figure 4c is a time series of AWAS ethane, ethyne, and propane. Overall, these short-lived tracers exhibit similar characteristics to the CO and CH4 measurements as they are most enhanced when the ER-2 is within cloud material (predominantly convective segments 2, 5, and 6). In particular, ethane and propane maximize within the AACP bisect (convective segments 5 and 6), reaching 1145 and 501.4 ppt, respectively. Ethyne also exhibits enhancements throughout the 31 May 2022 flight, with a maximum of 54.6 ppt occurring within the anvil segment (convective segment 2) and additional enhancements within the AACP peaking at 48.4 ppt (convective segments 5 and 6). Enhancements in ethyne, ethane, and propane demonstrate a clear signal for stratospheric delivery of short-lived tropospheric trace gases from oil and natural gas sources when sampling within cloud for the 31 May 2022 flight, with limited enhancement outside of cloud material. Furthermore, nearly all tropospheric gases measured during DCOTSS were enhanced within the AACP and anvil, including maximum values of multiple tropospheric gases measured during the AACP (e.g., ethane and propane shown here) rather than the anvil (e.g., ethyne, CO, and CH4). This supports the distinct impact of AACP-producing storms on UTLS composition, as suggested in prior model simulations (Homeyer et al., 2017; O'Neill et al., 2021; Gordon and Homeyer, 2022).
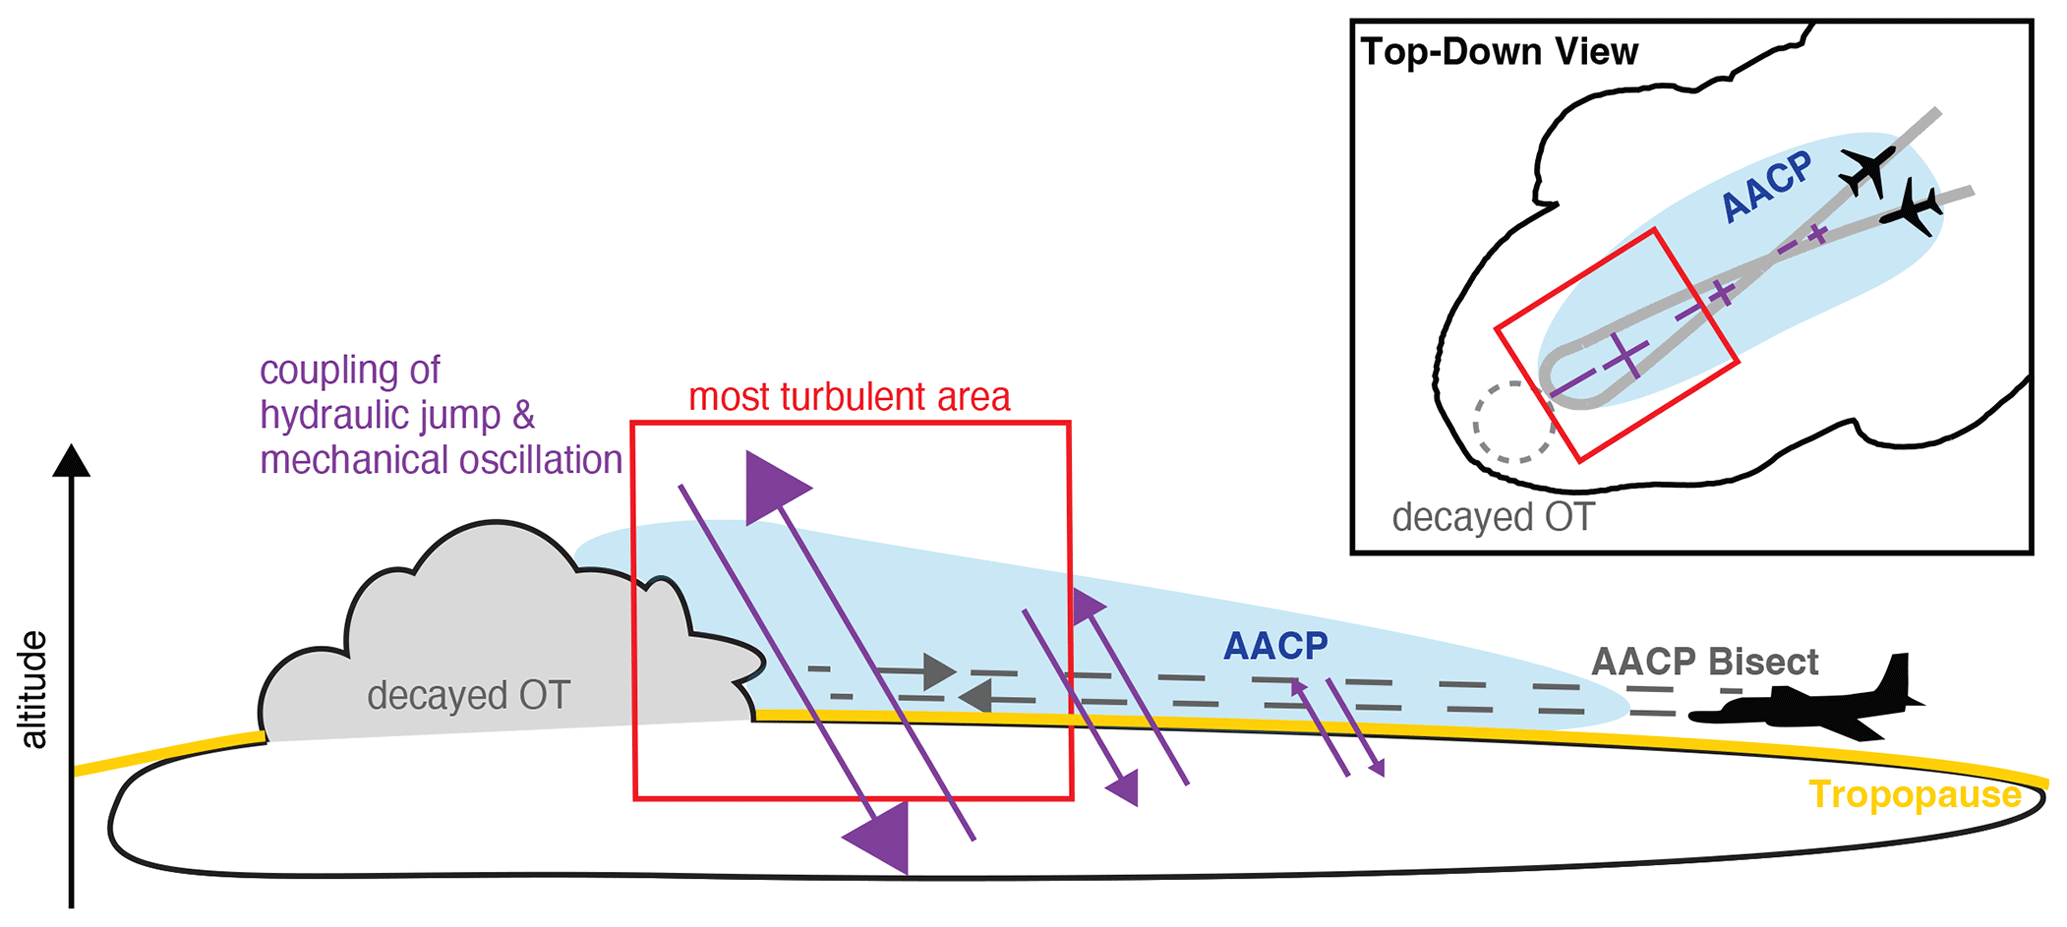
Figure 5An illustration of AACP sampling during the 31 May 2022 flight. Dynamic processes we would expect to encounter (based on prior modeling work) and their feature-relative locations are indicated, including the decayed overshoot (gray), the AACP (blue), mixing associated with the coupling of the hydraulic jump and mechanical oscillation (purple), and the expected location of maximum turbulence (red). The ER-2 is shown in black, and an outline of the flight track along the AACP bisects is denoted in gray in the top-down view panel.
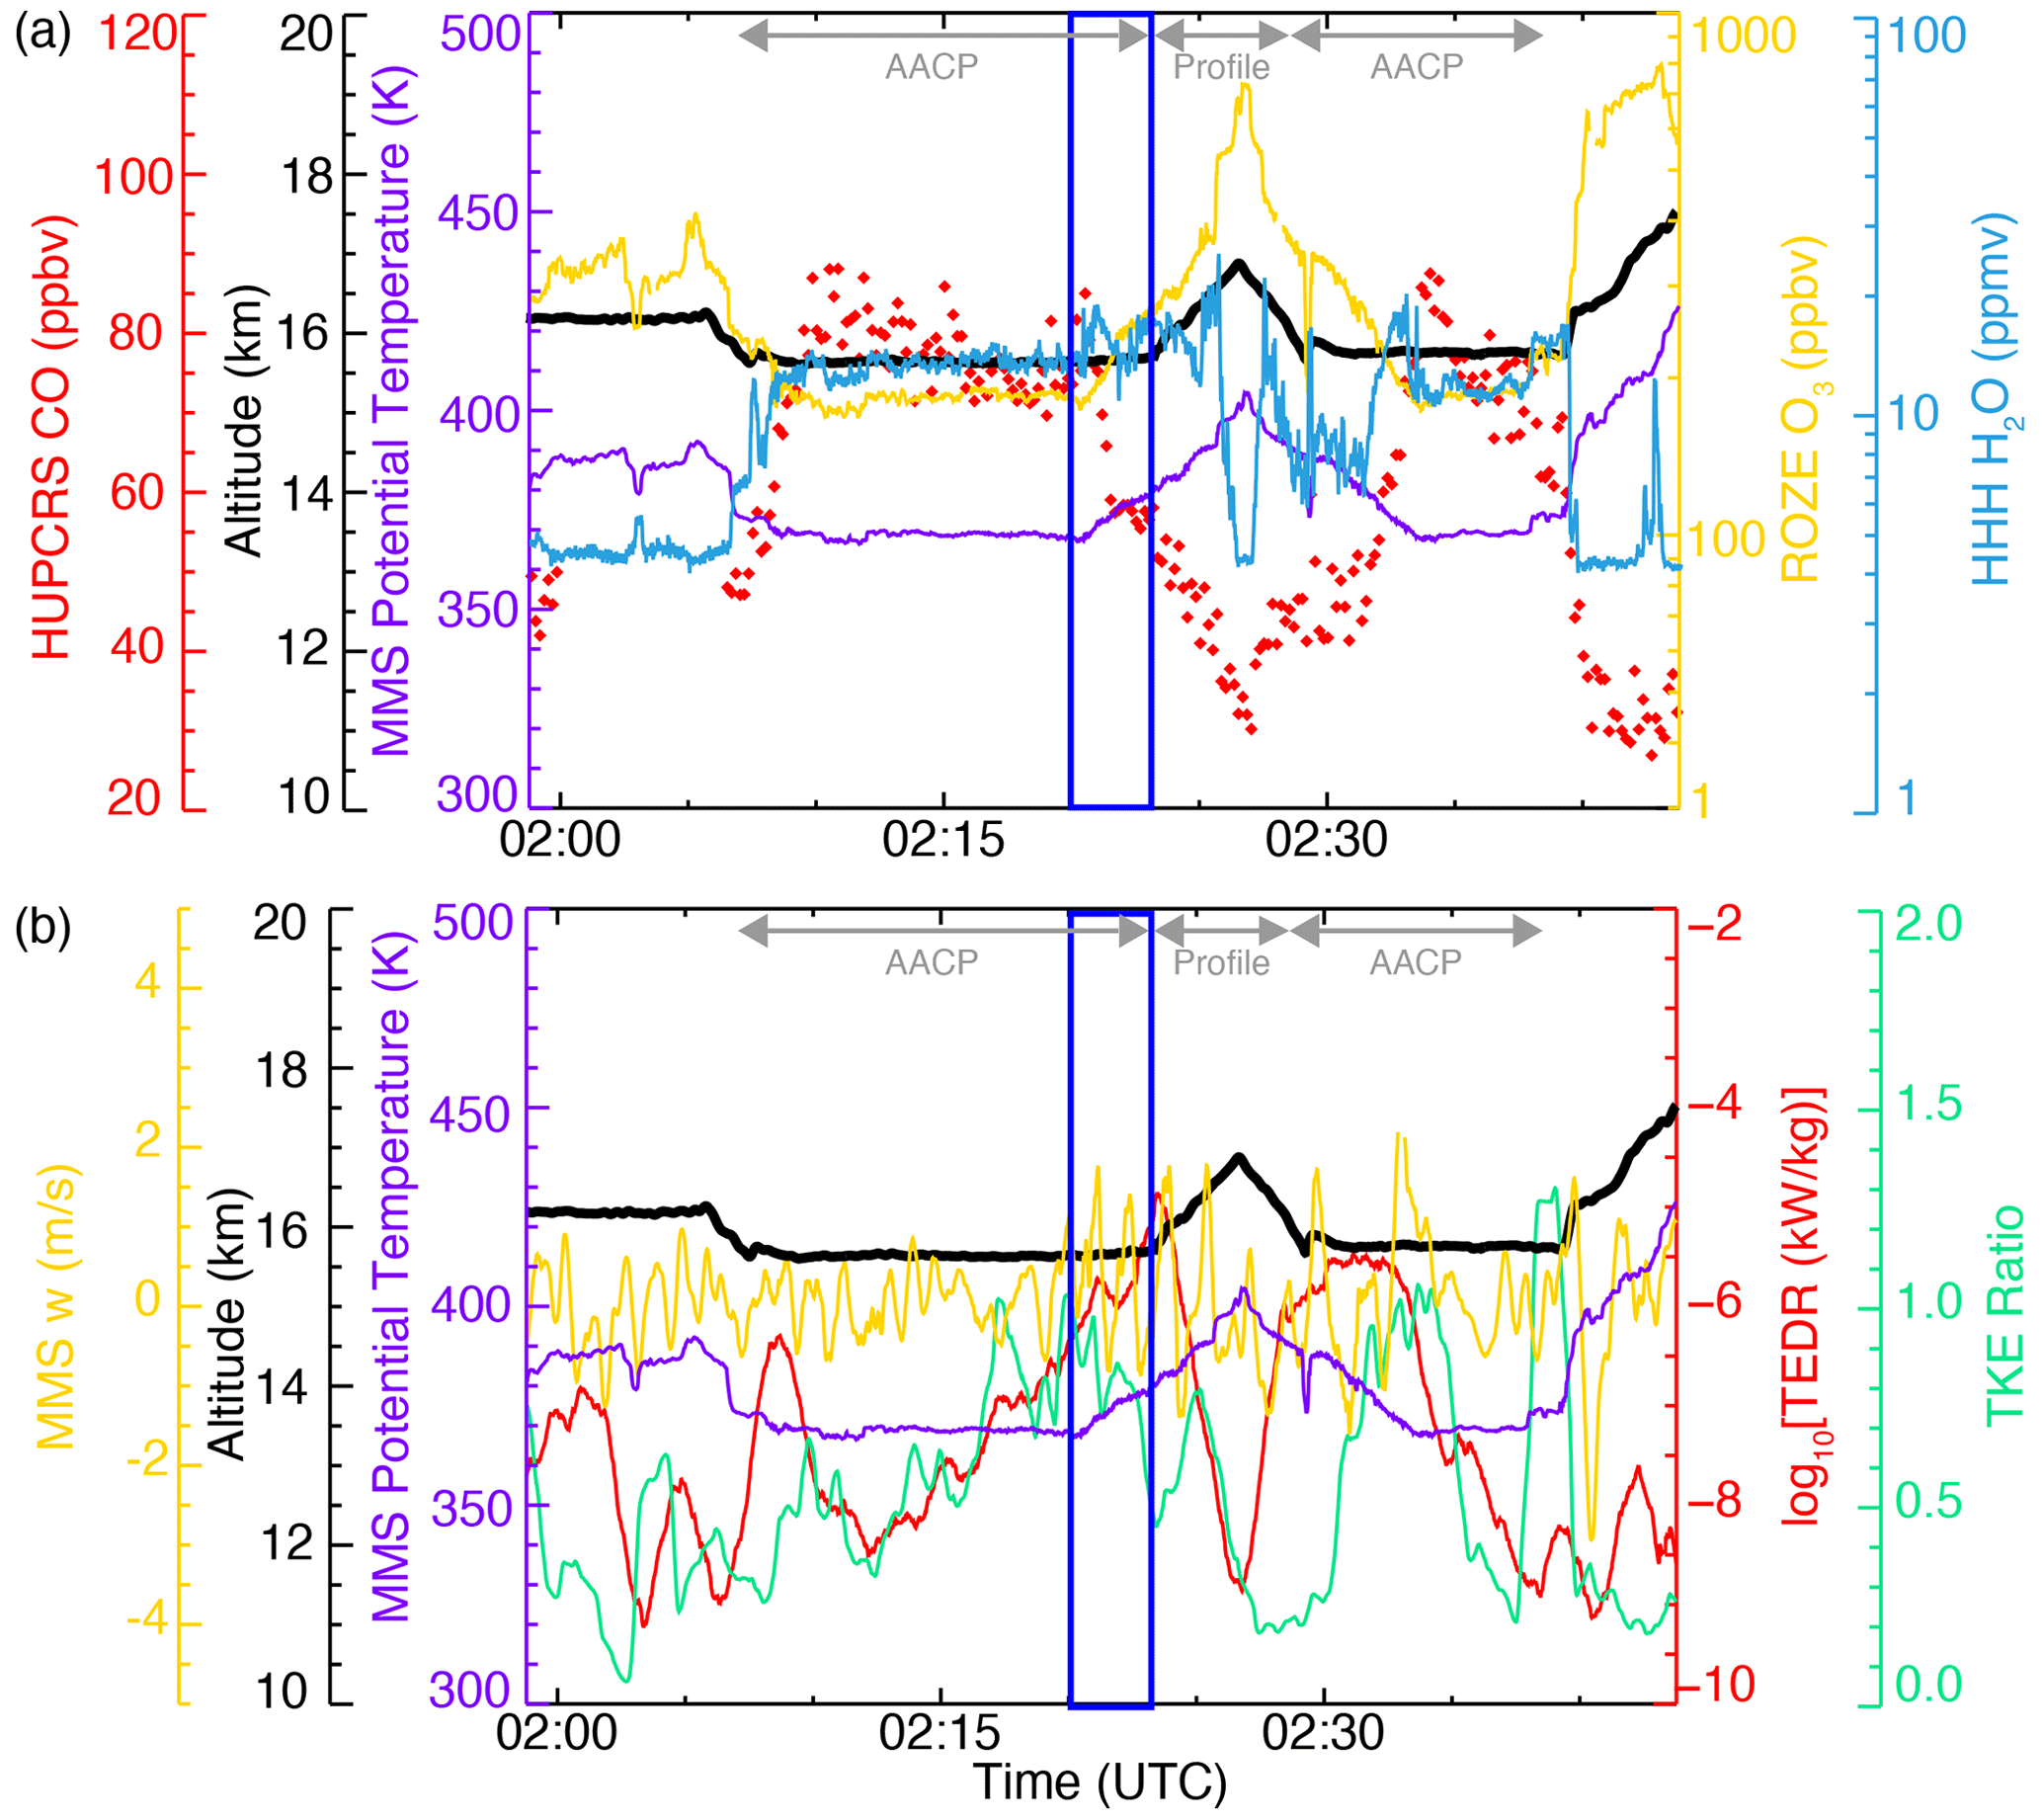
Figure 6AACP sampling during the 31 May 2022 flight (in UTC) shown as time series. Both time series include the MMS GPS aircraft altitude (thick black line) and potential temperature (purple line). The top time series (a) uniquely includes HUPCRS CO (red), ROZE O3 mixing ratio (yellow), and HHH H2O mixing ratio (blue). The lower time series (b) uniquely includes MMS measurements of the vertical wind speed (m s−1; yellow), the log 10 of the turbulent eddy dissipation rate (TEDR; red), and the vertical-to-horizontal TKE ratio (green). The dark-blue box in each time series denotes the time period of the “stratospheric signal” near the end of the first AACP bisect, and gray horizontal lines with arrows at each end denote times when the ER-2 is within the AACP and in the turbulence-avoidance vertical profile.
Given the demonstrated unique impact of the AACP on tropospheric tracer and H2O enhancements in the lower stratosphere, we focus on the AACP samples and vertical profile to further examine these composition changes and gain insight into what processes could be occurring. To provide context for the detailed evaluation of AACP sampling that follows, Fig. 5 illustrates how the storm was sampled by the ER-2 and what dynamic features we would expect to encounter throughout the AACP bisect based on insights from prior modeling work. The ER-2 bisected the AACP while traveling towards the decayed overshoot where it encountered a region with increasing turbulence, eventually resulting in a turbulence-avoidance vertical profile near the location of the decayed overshoot. The co-location of the most turbulent area with the overshoot is a common result in all modeling work focused on AACP-producing storms, owing to the establishment of a hydraulic jump that leads to gravity wave breaking and AACP formation (as outlined in the Introduction). This is also the location where a coupling of the hydraulic jump and overshoot-driven mechanical oscillation leads to increased vertical mixing and enhanced downward transport of overworld air to the lowermost stratosphere (Gordon and Homeyer, 2022). Simulations show the mechanical oscillation decreases in magnitude as distance from the overshoot increases, further contributing to the area near the overshoot being the most turbulent. It is through this model-informed lens of transport and mixing processes and the known storm-relative sampling during this flight that we interpret the in situ data collected during the AACP sampling.
To examine composition changes within the AACP bisect and vertical profile components of the 31 May 2022 flight, Fig. 6a is a time series from 01:59–02:44 UTC and includes HUPCRS CO, MMS GPS altitude, MMS potential temperature, ROZE O3, and HHH H2O. The AACP bisect begins at ∼ 02:07 UTC, continues until the turbulence-avoidance vertical profile occurs from 02:23–02:28 UTC, and resumes thereafter until 02:39 UTC when the ER-2 begins to ascend to maximum altitude and return to Salina. Tropospheric tracers, such as CO, are elevated within both passes through the AACP, with an exception near the ends of the horizontal segments bounding the vertical profile. Note that CO data from 02:00–02:06 UTC are missing due to a routine in-flight calibration of the HUPCRS instrument. Potential temperature and O3 begin to increase at 02:20 UTC, shortly before the vertical profile begins and when altitude is constant. The increase in stratospheric tracers and decrease in tropospheric tracers (except for H2O) at constant altitude suggest a reduction in the amount of tropospheric air transport to the stratosphere (i.e., a H2O-dominant convective signature with no or minimal impacts on other trace gases). This apparent “stratospheric signal” at constant altitude (annotated in Fig. 6a) implies a change in the physical/dynamic process leading to convectively influenced air above the tropopause. A change in controlling processes is also likely present within the second AACP bisect, as potential temperature and O3 are elevated and then decrease while at constant altitude. Note that inspection of ERA5 output suggests there are no alternative large-scale explanations for an increase in potential temperature from a pre-existing isentropic gradient in this region. Therefore, the stratospheric signal, evident as a unique signature in trace species concentrations distinct from those in the broader AACP feature, suggests different mixing processes are occurring near the end of the first AACP bisect and the beginning of the second AACP bisect (02:28–02:33 UTC) closest to the decayed overshoot.
To identify what processes are primarily driving the stratospheric signal (corresponding with the time that substantial turbulence was encountered, resulting in the eventual ascent of the ER-2 out of the AACP), we examine the turbulent energy dissipation rate (TEDR), turbulence kinetic energy (TKE), and vertical wind speed measured by MMS (w; Fig. 6b). TEDR combines both vertical and horizontal components of turbulent motion in one metric and was smoothed with a 90 s centered average to show turbulent bursts throughout the flight. Horizontal and vertical TKE was calculated using MMS wind speeds after application of a high-pass filter (removing power at timescales greater than 4 s to isolate turbulent motions) followed by calculating the 20 s variance of these filtered winds. A 90 s centered average was then applied to the horizontal and vertical TKE components before calculating the ratio (vertical : horizontal) shown in Fig. 6b. These time intervals were chosen to best capture the spatial and temporal differences throughout the flight. The absolute vertical winds are also shown to provide additional context, which were calculated using a low-pass filter (removing power at timescales less than 4 s, thus emphasizing the broader scales of motion including those at the scale of gravity waves and the hydraulic jump) and applying a 20 s average to be consistent with the 20 s variance used for TKE calculations.
Converting displayed log 10(TEDR) values to TEDR dissipation rates throughout this portion of the flight shows an increase in turbulent motion within the stratospheric signal prior to the vertical profile (near 10−2 W kg−1 at 02:23 UTC) and within the AACP following the vertical profile (near W kg−1 at 02:31 UTC). This suggests that peak turbulence is occurring within the stratospheric signal and near the decayed overshoot, coinciding with the turbulence-avoidance vertical profile. This is consistent with what is expected based on Fig. 5, where the most turbulent region within the AACP is located near the overshoot. Examining the TKE ratio within these areas of elevated TEDR provides additional insight towards the contributions of vertical and horizontal mixing to the increasing turbulence. For the majority of the 31 May 2022 flight, horizontal TKE exceeds vertical TKE, as indicated by the TKE ratio being consistently well below a value of 1. However, there is a rapid increase in TKE ratio to a value near 1 shortly prior to and within the stratospheric signal during the first (02:17–02:23 UTC) and second (02:31–02:35 UTC) AACP bisects. This suggests that increased vertical mixing is associated with the emergence of the stratospheric signal. It is worth noting that the TKE ratio also increases to a value near 1 (suggesting increased vertical mixing) within elevated TEDR at a flight time of approximately 02:31 UTC. This coincides with sampling the AACP cloud boundary following descent from the short vertical profile, which resides within the most turbulent area of the AACP near the decayed overshoot (as seen in Fig. 5). Similar trace gas changes, including decreasing O3 with increasing H2O and CO, are seen near these vertical TKE peaks in Fig. 6a. Low-pass-filtered vertical wind speed (w) provides additional context towards the contributions of vertical mixing with turbulent regions. Throughout the majority of the sampling period shown in Fig. 6b, w oscillates between −0.5 and 0.5 m s−1. However, the oscillation increases in magnitude throughout the first AACP bisect and reaches a range of near −1 to 1 m s−1 at the onset of the stratospheric signal (when the ER-2 is near the decayed overshoot). Similarly, w shows a strong oscillation within the second AACP bisect following the descent from the vertical profile ranging from −1.5 to 2 m s−1, when the ER-2 is near the decayed overshoot. A stronger oscillation and vertical mixing near the decayed overshoot is in agreement with the key dynamic mechanisms illustrated in Fig. 5, where vertical mixing associated with the coupling of the hydraulic jump from the AACP and overshoot-induced mechanical oscillation is strongest near the overshoot and decreases in strength as distance from the overshoot increases. Given this close coupling between prior simulations and the DCOTSS measurements, we therefore believe that the stratospheric signal represents the downward mixing of stratospheric air from higher altitudes in the vicinity of the coupled hydraulic jump and mechanical oscillation.
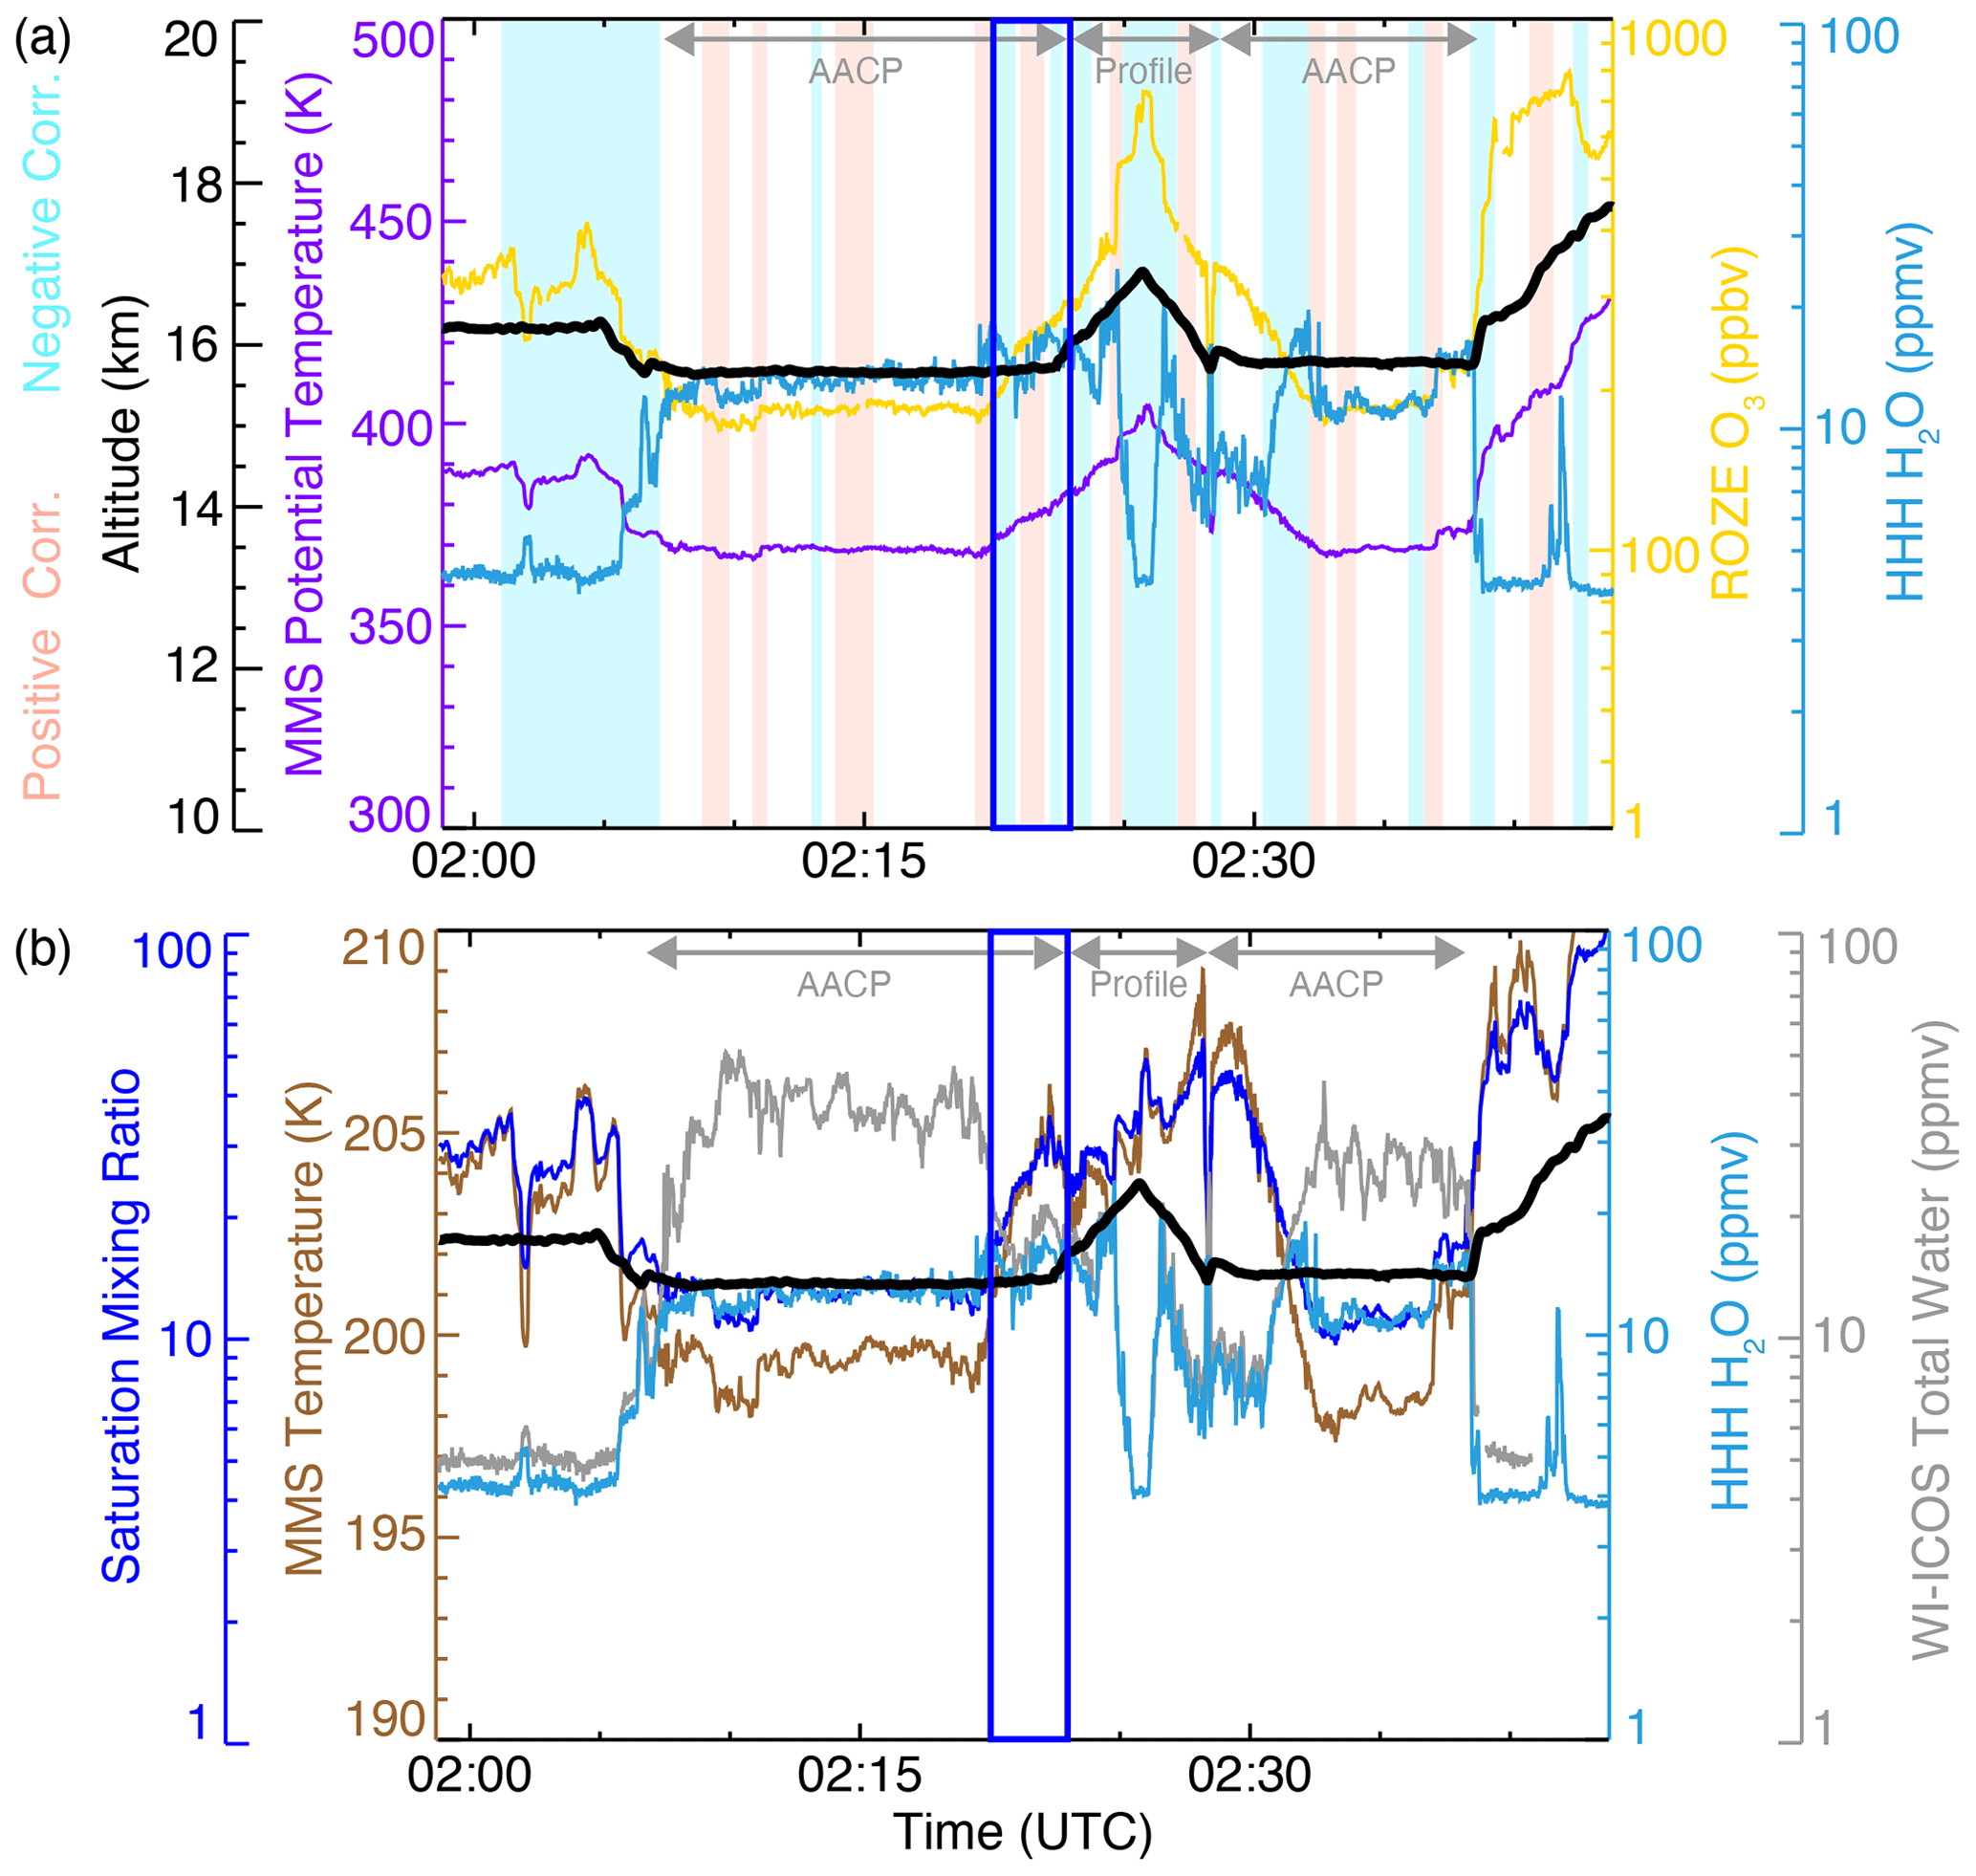
Figure 7As in Fig. 6 but with top time series (a) of MMS GPS altitude (black), MMS potential temperature (purple), ROZE O3 mixing ratio (yellow), HHH H2O mixing ratio (blue), positive O3–H2O correlations (blue shading), and negative O3–H2O correlations (pink shading). The lower time series (b) includes MMS GPS altitude (black), MMS saturation mixing ratio (dark blue), MMS temperature (brown), H2O mixing ratio (light blue), and WI-ICOS total water (gray).
Next we examine relationships between O3 and H2O during the AACP bisect and in the segment with the stratospheric signal where the O3 mixing ratio increases. O3–H2O correlations for the AACP bisect and profile components of the 31 May 2022 flight are shown in Fig. 7a. Strong linear correlations were identified via the Pearson correlation coefficient, which was calculated over an observation-centered time window of ±10 s. A strong positive correlation is considered to be ≥ 0.5 and, similarly, a strong negative correlation is ≤ −0.5. There are many strong negative and positive O3–H2O correlations throughout the AACP bisect. These correlations can change frequently as the ±10 s time window captures fine-scale changes within the dynamic environment being sampled and helps mitigate potential biases that result from pre-existing large-scale gradients in the trace gases. Correlations are least informative during vertical profiling since they can arise directly from the pre-existing vertical gradients in these trace gases, especially the rapid increase in O3 with altitude in the stratosphere. The variety of positive and negative correlations seen in constant-altitude segments suggests that varied physical and dynamic constraints may be important to the composition impacts and resulting correlation, with some processes dominating over others. Generally, with overshooting convection it is expected that air of high-H2O, cloud ice, and low-O3 composition will mix with stratospheric air of high-O3 and low-H2O composition, resulting in a negative O3–H2O correlation (Fig. 8). Therefore, it is not surprising to see the frequency of negative O3–H2O correlations associated with STE. The occurrence and frequency of positive O3–H2O correlations was unexpected. There are multiple positive correlations coinciding with the AACP bisect and at the onset of the stratospheric signal. To better understand the potential factors leading to positive O3–H2O correlation, we further examine multiple tracers and meteorological variables.

Figure 8Illustration of the process that is generally expected for an overshoot which results in a negative O3–H2O correlation (a, b) and a saturation-limited overshoot and hypothesized process resulting in a positive O3–H2O correlation (c, d).
Figure 7b shows a time series for the AACP bisect and profile components of the 31 May 2022 flight including MMS temperature, the saturation mixing ratio (SMR), HHH H2O, and WI-ICOS total water (vapor + ice). During the first AACP bisect (flight time of 02:07–02:22 UTC), temperature broadly decreases to ∼ 199 K, followed by a sharp increase to ∼ 206 K during the stratospheric signal (beginning at 02:20 UTC), consistent with sampling a warmer stratospheric environment. Total water also drops at the onset of the stratospheric signal from 30–40 to 10–20 ppmv, while H2O remains elevated between 10 and 20 ppmv. Such changes in total water and H2O at this time suggest that mixing of AACP air with the warmer stratospheric environment is significant, which is in agreement with prior analyses and with the broad occurrences of negative O3–H2O correlations at the beginning and end of this time segment. In contrast, when the temperature is low throughout the remainder of the first AACP bisect, H2O is nearly equal to the SMR, demonstrating that the air is saturated and H2O within the convectively lofted air is constrained to the SMR. Notably, the O3–H2O correlations observed during this saturation-limited period of sampling are almost entirely positive. When the temperature increases at the onset of the stratospheric signal, the SMR exceeds H2O and the air becomes subsaturated while the O3–H2O correlation sign flips to negative. When the temperature rapidly decreases following the vertical profile and near the start of the second AACP bisect, total water rapidly increases to values exceeding H2O and the AACP air is once again saturated. Similar patterns in the O3–H2O correlations are also observed within the second AACP bisect. Given these relationships, a plausible explanation for the occurrence of positive O3–H2O correlations is that H2O within the overshoot and AACP air is saturation-limited due to the low temperature within the overshoot. In the absence of a saturation-limited condition at low temperatures, there is significantly more H2O in the overshoot than the stratospheric environment. However, with these particular overshoots, the temperature decreases to a point where the SMR is less than the maximum possible H2O concentration in the environmental stratospheric air, resulting in less water in the vapor phase and more in the ice phase within the overshoot. To account for this H2O imbalance, the cloud ice along the periphery could preferentially sublimate into the warm stratospheric environment (rather than remaining in the overshoot), while subsequent mixing between this hydrated stratosphere air and the relatively dry overshoot leads to a positive O3–H2O correlation, as illustrated in Fig. 8.

Figure 9Density of CO (a, c) and H2O (b, d) in LRT-relative altitude of convective segments (blue; a, b) and background segments (gray; c, d) from all DCOTSS 2021 and 2022 flights except for the 31 May 2022 flight. Convective sampling from the 31 May 2022 flight (red) and AACP sampling from the 31 May 2022 flight (yellow) are shown atop the respective convective sampling densities. Density is determined using a 10.0 ppbv × 0.5 km bin resolution for CO and a 1.0 ppmv × 0.5 km bin resolution for H2O. For the 31 May 2022 convective samples, every 5th H2O measurement is shown to be more consistent with the frequency of CO, which results in no loss of qualitative detail. Measurements obtained when skimming the anvil near the tropopause and during the vertical profile are annotated.
While the preceding analyses have been focused on understanding the dynamic and physical processes constraining stratospheric hydration and STE, one question that remains is whether the 31 May 2022 AACP observations differ from the typical range of lower stratosphere composition impacts from overshooting convection (AACP-producing or otherwise). Therefore, to assess the uniqueness of these active convection observations, measurements of H2O and CO from the 31 May 2022 flight are compared to samples of overshooting convection from all other DCOTSS research flights. Figure 9 shows the density of convective observations as a function of trace gas concentration and ERA5 LRT-relative altitude, with the convective observations (red) and AACP observations (yellow) from the 31 May 2022 flight overlaid. For additional context, the density of background (i.e., non-convective) observations from all DCOTSS flights except for the 31 May 2022 flight are shown in additional panels. Background DCOTSS observations of CO range from 28–70 ppbv near the tropopause and 10–50 ppbv throughout much of the stratosphere. Convective samples from remaining DCOTSS flights span approximately 40–95 ppbv near the tropopause and 20–60 ppbv throughout much of the lower stratosphere (up to ∼ 3 km above the tropopause). Most of the enhanced CO (> 40 ppbv) in convective samples at an LRT-relative altitude of 2–3 km originate from the 8 June and 10 June 2022 flights that targeted recent/active convection (not shown). Measurements from the 31 May 2022 active convection flight show an above-average mixing ratio of CO in overshoot material and exceptional values within the AACP at a LRT-relative altitude of 0.5–1.2 km. The majority of H2O convective sampling for all DCOTSS flights ranges from 3–15 ppmv, while the density of background observations is 3–5 ppmv throughout much of the stratosphere, especially at LRT-relative altitudes > 1 km. The 31 May 2022 active convection flight sampling of H2O is largely consistent with convective measurements from other DCOTSS flights, with greater extremes than those commonly measured at altitudes near the tropopause and > 1.5 km above the tropopause. The most prominent example of exceptional H2O observed during the 31 May 2022 flight is near a LRT-relative altitude of ∼ 2.1 km where H2O reaches ∼ 23 ppmv. This H2O enhancement occurs within the vertical profile as the ER-2 emerged from the first AACP bisect and stratospheric signal, which was primarily a H2O convective signal (as tropospheric tracers were not strongly enhanced). H2O sampled within the AACP bisects is near or slightly above the typical range of H2O mixing ratios for all DCOTSS convective sampling at the LRT-relative altitudes spanned by the AACP. As demonstrated in Fig. 8, H2O concentrations in the AACP are limited by the SMR set by the low temperatures in the AACP air, making these enhancements less exceptional than those seen with CO compared to remaining DCOTSS flights.
This study analyzes observations from the DCOTSS 31 May 2022 flight obtained within convective outflow and an actively generated AACP from a storm over Oklahoma. UTLS composition changes from the storm are evaluated and discussed in comparison with results from recent model simulations. Multiple segments of convectively influenced air with pronounced changes in stratospheric hydration and air mass composition were sampled throughout the flight. Consistent with previous modeling studies, observations showed that water vapor enhancements reached higher altitudes than passive tropospheric tracer enhancements (Figs. 4 and 6a). Convective enhancements of short-lived tracers including CO, ethyne, ethane, and propane were found to be most enhanced when sampling within cloud material, specifically when bisecting the storm anvil and AACP (Figs. 4 and 6a). This suggests that AACP-producing storms have a unique impact on UTLS composition, especially with respect to troposphere-to-stratosphere transport of tropospheric air. In addition to enhanced tropospheric tracers within the AACP, there was an apparent “stratospheric signal” at constant altitude near the end of the first AACP bisect and beginning of the second AACP bisect, where O3 and potential temperature increased while CO, CH4, and total water decreased and H2O remained elevated (or vice versa). This stratospheric signal seems to be associated with enhanced vertical mixing, based on both composition changes and turbulence analyses (Fig. 6b). Observations of vertical mixing and downward transport of deeper stratospheric air near the AACP edge (in close proximity to the once-active overshooting top) support the novel finding in recent modeling work (Gordon and Homeyer, 2022). O3–H2O correlations were examined throughout the flight, and multiple fine-scale positive and negative correlations were observed. There are notable positive O3–H2O correlations throughout the AACP bisects that appear to be the result of preferential sublimation of cloud ice into the warm stratospheric environment and subsequent mixing between overshoot/AACP and hydrated stratosphere air (illustrated in Fig. 8). Tropospheric tracer enhancements including CO and H2O observed from the 31 May 2022 flight are unique compared to remaining DCOTSS flights. While H2O enhancements observed during the AACP bisect were not extraordinary in comparison to remaining observations during the flight due to the aforementioned saturation-limited condition, CO measurements within the AACP are exceptional when compared to remaining DCOTSS observations (Fig. 9). These comparisons support the perceived impactful nature of AACPs on air mass composition within the UTLS inferred from model simulations, in addition to their increasingly appreciated impact on stratospheric hydration.
The observational results in this study emphasize that determining how often overshooting storms produce AACPs is important for assessing both H2O and non-H2O composition impacts on the UTLS. While some insight into stratospheric hydration can be gained from existing overshoot climatologies (Homeyer and Bowman, 2021; Cooney et al., 2018; Solomon et al., 2016; Liu and Liu, 2016; Liu et al., 2020), an AACP climatology is needed to provide sufficient knowledge towards H2O and non-H2O UTLS composition change. Machine learning efforts are underway that may result in an objective AACP climatology.
While this study is the first to analyze targeted observations of an AACP, it is important to note that this was the only DCOTSS flight to do so. Thus, these observations from an AACP-producing storm are representative of one storm within one environment. Observed UTLS composition changes may vary substantially in other scenarios based on the known sensitivities of STE to the stratospheric environment. The DCOTSS observations from this flight also have a limited spatial extent, with observations not spanning the entirety of the storm throughout its lifetime. It is also worth noting that it is possible some of the overshoot-influenced air measured could have been sourced from the overshooting storm to the southwest of the target storm. However, the premise of this analysis would not change as the analyzed observations are from active overshooting convection and an AACP regardless of the responsible storm cell. Future modeling work could also simulate this event to supplement the observational analysis conducted here, providing additional perspective on the UTLS composition changes, sources, and constraining mechanisms.
Observations from the 31 May 2022 flight showed that H2O within the overshoot and AACP was saturation-limited due to the constraint of the low temperature and that stratospheric hydration was occurring via sublimation and subsequent mixing of cool, high-ice cloud material into the warm stratospheric environment. Thus, exploring a saturation-limited perspective on H2O delivery from overshooting convection is important for future work. Specifically, it is important to determine how frequently a H2O-limiting temperature constraint occurs and its impact on stratospheric hydration. It is currently unclear whether the temperature constraint is driven by environmental characteristics or whether the storms themselves can facilitate it. Exploring the microphysics occurring in overshoots and AACPs could provide increased understanding of these processes. The saturation-limited condition was also associated with a uniquely positive correlation between O3 and H2O. Ongoing efforts evaluating O3–H2O correlations from all DCOTSS flights may provide indirect evidence for the importance of this temperature constraint on a broader scale.
All DCOTSS aircraft data (https://doi.org/10.5067/ASDC/DCOTSS-Aircraft-Data_1, NASA, 2023a) and satellite and radar data (https://doi.org/10.5067/ASDC/DCOTSS-Radar-Satellite-Data_1, NASA, 2023b) analyzed here are available from the NASA Atmospheric Sciences Data Center.
The supplement related to this article is available online at: https://doi.org/10.5194/acp-24-7591-2024-supplement.
AEG and CRH designed and executed the analysis, with substantial design contributions from JBS, RU, and JDD. All instrument data presented here were obtained and rigorously analyzed and carefully processed to ensure quality assurance/quality control by co-authors JBS, RU, JDD, ELA, KS, JVP, DSS, DMW, AP, JMSC, TFH, JH, RAH, SW, BCD, and SD. AEG drafted the manuscript, and all co-authors provided editorial comments and corrections.
The contact author has declared that none of the authors has any competing interests.
Publisher’s note: Copernicus Publications remains neutral with regard to jurisdictional claims made in the text, published maps, institutional affiliations, or any other geographical representation in this paper. While Copernicus Publications makes every effort to include appropriate place names, the final responsibility lies with the authors.
The authors thank the entire DCOTSS team for being instrumental in planning and executing the successful flights and measurements discussed here. We also thank two anonymous reviewers for their insightful comments which helped improve the paper.
This research has been supported by the NASA's Science Mission Directorate (award nos. 80NSSC19K0347, 80NSSC19K1473, 80NSSC19K0326, and 80NSSC19K0340).
This paper was edited by Rolf Müller and reviewed by two anonymous referees.
Anderson, J. G., Wilmouth, D. M., Smith, J. B., and Sayres, D. S.: UV Dosage Levels in Summer: Increased Risk of Ozone Loss from Convectively Injected Water Vapor, Science, 337, 835–839, https://doi.org/10.1126/science.1222978, 2012. a, b
Banerjee, A., Chiodo, G., Previdi, M., Ponater, M., Conley, A. J., and Polvani, L. M.: Stratospheric water vapor: an important climate feedback, Clim. Dynam., 53, 1697–1710, https://doi.org/10.1007/s00382-019-04721-4, 2019. a
Bedka, K., Murillo, E. M., Homeyer, C. R., Scarino, B., and Mersiovsky, H.: The Above Anvil Cirrus Plume: An Important Severe Weather Indicator in Visible and Infrared Satellite Imagery, Weather Forecast., 33, 1159–1181, https://doi.org/10.1175/WAF-D-18-0040.1, 2018. a
Bedka, K. M.: Overshooting cloud top detections using MSG SEVIRI Infrared brightness temperatures and their relationship to severe weather over Europe, Atmos. Res., 99, 175–189, https://doi.org/10.1016/j.atmosres.2010.10.001, 2011. a
Bedka, K. M., Wang, C., Rogers, R., Carey, L. D., Feltz, W., and Kanak, J.: Examining Deep Convective Cloud Evolution Using Total Lightning, WSR-88D, and GOES-14 Super Rapid Scan Datasets, Weather Forecast., 30, 571–590, https://doi.org/10.1175/WAF-D-14-00062.1, 2015. a
Bigelbach, B. C., Mullendore, G. L., and Starzec, M.: Differences in deep convective transport characteristics between quasi-isolated strong convection and mesoscale convective systems using seasonal WRF simulations, J. Geophys. Res.-Atmos., 119, 11445–11455, https://doi.org/10.1002/2014JD021875, 2014. a
Brunner, J. C., Ackerman, S. A., Bachmeier, A. S., and Rabin, R. M.: A Quantitative Analysis of the Enhanced-V Feature in Relation to Severe Weather, Weather Forecast., 22, 853–872, https://doi.org/10.1175/WAF1022.1, 2007. a
Chang, K.-W., Bowman, K. P., and Rapp, A. D.: Transport and Confinement of Plumes From Tropopause-Overshooting Convection Over the Contiguous United States During the Warm Season, J. Geophys. Res.-Atmos., 128, e2022JD037020, https://doi.org/10.1029/2022JD037020, 2023. a
Chelpon, S. M., Pan, L. L., Luo, Z. J., Atlas, E. L., Honomichl, S. B., Smith, W. P., Wang, S., Ullmann, K., Hall, S. R., Apel, E. C., and Hornbrook, R. S.: Deriving Tropospheric Transit Time Distributions Using Airborne Trace Gas Measurements: Uncertainty and Information Content, J. Geophys. Res.-Atmos., 126, e2020JD034358, https://doi.org/10.1029/2020JD034358, 2021. a, b, c
Clapp, C. E., Smith, J. B., Bedka, K. M., and Anderson, J. G.: Distribution of cross-tropopause convection within the Asian monsoon region from May through October 2017, Atmos. Chem. Phys., 23, 3279–3298, https://doi.org/10.5194/acp-23-3279-2023, 2023. a
Cooney, J. W., Bowman, K. P., Homeyer, C. R., and Fenske, T. M.: Ten-Year Analysis of Tropopause-Overshooting Convection Using GridRad Data, J. Geophys. Res.-Atmos., 123, 329–343, https://doi.org/10.1002/2017JD027718, 2018. a, b, c, d
Crosson, E. R.: A cavity ring-down analyzer for measuring atmospheric levels of methane, carbon dioxide, and water vapor, Appl. Phys. B, 92, 403–408, https://doi.org/10.1007/s00340-008-3135-y, 2008. a
Dauhut, T. and Hohenegger, C.: The Contribution of Convection to the Stratospheric Water Vapor: The First Budget Using a Global Storm-Resolving Model, J. Geophys. Res.-Atmos., 127, e2021JD036295, https://doi.org/10.1029/2021JD036295, 2022. a
Del Genio, A. D., Yao, M.-S., and Jonas, J.: Will moist convection be stronger in a warmer climate?, Geophys. Res. Lett., 34, L16703, https://doi.org/10.1029/2007GL030525, 2007. a
Dessler, A. E. and Sherwood, S. C.: Effect of convection on the summertime extratropical lower stratosphere, J. Geophys. Res.-Atmos., 109, D23301, https://doi.org/10.1029/2004JD005209, 2004. a
Dworak, R., Bedka, K., Brunner, J., and Feltz, W.: Comparison between GOES-12 Overshooting-Top Detections, WSR-88D Radar Reflectivity, and Severe Storm Reports, Weather Forecast., 27, 684–699, https://doi.org/10.1175/WAF-D-11-00070.1, 2012. a
Fischer, H., de Reus, M., Traub, M., Williams, J., Lelieveld, J., de Gouw, J., Warneke, C., Schlager, H., Minikin, A., Scheele, R., and Siegmund, P.: Deep convective injection of boundary layer air into the lowermost stratosphere at midlatitudes, Atmos. Chem. Phys., 3, 739–745, https://doi.org/10.5194/acp-3-739-2003, 2003. a
Flocke, F., Herman, R. L., Salawitch, R. J., Atlas, E., Webster, C. R., Schauffler, S. M., Lueb, R. A., May, R. D., Moyer, E. J., Rosenlof, K. H., Scott, D. C., Blake, D. R., and Bui, T. P.: An examination of chemistry and transport processes in the tropical lower stratosphere using observations of long-lived and short-lived compounds obtained during STRAT and POLARIS, J. Geophys. Res., 104, 26625–26642, 1999. a
Frey, W., Schofield, R., Hoor, P., Kunkel, D., Ravegnani, F., Ulanovsky, A., Viciani, S., D'Amato, F., and Lane, T. P.: The impact of overshooting deep convection on local transport and mixing in the tropical upper troposphere/lower stratosphere (UTLS), Atmos. Chem. Phys., 15, 6467–6486, https://doi.org/10.5194/acp-15-6467-2015, 2015. a
Fromm, M. D. and Servranckx, R.: Transport of forest fire smoke above the tropopause by supercell convection, Geophys. Res. Lett., 30, 1542, https://doi.org/10.1029/2002GL016820, 2003. a
Fujita, T. T.: Overshooting thunderheads observed from ATS and Learjet, Tech. Rep. NASA-CR-138595, University of Chicago, Department of Geophysical Sciences, Chicago, IL, United States, https://ntrs.nasa.gov/citations/19740018973 (last access: 3 November 2023), 1974. a
Gordon, A. E. and Homeyer, C. R.: Sensitivities of Cross-Tropopause Transport in Midlatitude Overshooting Convection to the Lower Stratosphere Environment, J. Geophys. Res.-Atmos., 127, e2022JD036713, https://doi.org/10.1029/2022JD036713, 2022. a, b, c, d, e, f, g, h
Hanisco, T. F., Moyer, E. J., Weinstock, E. M., Clair, J. M. S., Sayres, D. S., Smith, J. B., Lockwood, R., Anderson, J. G., Dessler, A. E., Keutsch, F. N., Spackman, J. R., Read, W. G., and Bui, T. P.: Observations of deep convective influence on stratospheric water vapor and its isotopic composition, Geophys. Res. Lett., 34, L04814, https://doi.org/10.1029/2006GL027899, 2007. a, b
Hannun, R. A., Swanson, A. K., Bailey, S. A., Hanisco, T. F., Bui, T. P., Bourgeois, I., Peischl, J., and Ryerson, T. B.: A cavity-enhanced ultraviolet absorption instrument for high-precision, fast-time-response ozone measurements, Atmos. Meas. Tech., 13, 6877–6887, https://doi.org/10.5194/amt-13-6877-2020, 2020. a
Hegglin, M. I., Brunner, D., Wernli, H., Schwierz, C., Martius, O., Hoor, P., Fischer, H., Parchatka, U., Spelten, N., Schiller, C., Krebsbach, M., Weers, U., Staehelin, J., and Peter, Th.: Tracing troposphere-to-stratosphere transport above a mid-latitude deep convective system, Atmos. Chem. Phys., 4, 741–756, https://doi.org/10.5194/acp-4-741-2004, 2004. a
Herman, R. L., Ray, E. A., Rosenlof, K. H., Bedka, K. M., Schwartz, M. J., Read, W. G., Troy, R. F., Chin, K., Christensen, L. E., Fu, D., Stachnik, R. A., Bui, T. P., and Dean-Day, J. M.: Enhanced stratospheric water vapor over the summertime continental United States and the role of overshooting convection, Atmos. Chem. Phys., 17, 6113–6124, https://doi.org/10.5194/acp-17-6113-2017, 2017. a
Hersbach, H., Bell, B., Berrisford, P., Hirahara, S., Horányi, A., Muñoz-Sabater, J., Nicolas, J., Peubey, C., Radu, R., Schepers, D., Simmons, A., Soci, C., Abdalla, S., Abellan, X., Balsamo, G., Bechtold, P., Biavati, G., Bidlot, J., Bonavita, M., De Chiara, G., Dahlgren, P., Dee, D., Diamantakis, M., Dragani, R., Flemming, J., Forbes, R., Fuentes, M., Geer, A., Haimberger, L., Healy, S., Hogan, R. J., Hólm, E., Janisková, M., Keeley, S., Laloyaux, P., Lopez, P., Lupu, C., Radnoti, G., de Rosnay, P., Rozum, I., Vamborg, F., Villaume, S., and Thépaut, J.-N.: The ERA5 global reanalysis, Q. J. Roy. Meteor. Soc., 146, 1999–2049, https://doi.org/10.1002/qj.3803, 2020. a
Hoffmann, L. and Spang, R.: An assessment of tropopause characteristics of the ERA5 and ERA-Interim meteorological reanalyses, Atmos. Chem. Phys., 22, 4019–4046, https://doi.org/10.5194/acp-22-4019-2022, 2022. a
Holton, J. R., Haynes, P. H., McIntyre, M. E., Douglass, A. R., and Pfister, L.: Stratosphere-troposphere exchange, Rev. Geophys., 33, 403–439, 1995. a, b
Homeyer, C. R.: Numerical simulations of extratropical tropopause-penetrating convection: Sensitivities to grid resolution, J. Geophys. Res.-Atmos., 120, 7174–7188, https://doi.org/10.1002/2015JD023356, 2015. a, b
Homeyer, C. R. and Bowman, K. P.: A 22-Year Evaluation of Convection Reaching the Stratosphere Over the United States, J. Geophys. Res.-Atmos., 126, e2021JD034808, https://doi.org/10.1029/2021JD034808, 2021. a, b, c
Homeyer, C. R. and Bowman, K. P.: Algorithm Description Document for Version 4.2 of the Three-Dimensional Gridded Nexrad WSR-88D Radar (GridRad) Dataset, Tech. rep., http://gridrad.org/ (last access: 10 January 2023), 2022. a
Homeyer, C. R., Bowman, K. P., Pan, L. L., Atlas, E. L., Gao, R.-S., and Campos, T. L.: Dynamical and chemical characteristics of tropospheric intrusions observed during START08, J. Geophys. Res., 116, D06111, https://doi.org/10.1029/2010JD015098, 2011. a
Homeyer, C. R., Pan, L. L., and Barth, M. C.: Transport from convective overshooting of the extratropical tropopause and the role of large-scale lower stratosphere stability, J. Geophys. Res.-Atmos., 119, 2220–2240, https://doi.org/10.1002/2013JD020931, 2014a. a
Homeyer, C. R., Pan, L. L., Dorsi, S. W., Avallone, L. M., Weinheimer, A. J., O'Brien, A. S., DiGangi, J. P., Zondlo, M. A., Ryerson, T. B., Diskin, G. S., and Campos, T. L.: Convective transport of water vapor into the lower stratosphere observed during double-tropopause events, J. Geophys. Res.-Atmos., 119, 10941–10958, https://doi.org/10.1002/2014JD021485, 2014b. a, b, c, d
Homeyer, C. R., McAuliffe, J. D., and Bedka, K. M.: On the Development of Above-Anvil Cirrus Plumes in Extratropical Convection, J. Atmos. Sci., 74, 1617–1633, https://doi.org/10.1175/JAS-D-16-0269.1, 2017. a, b, c
Homeyer, C. R., Smith, J. B., Bedka, K. M., Bowman, K. P., Wilmouth, D. M., Ueyama, R., Dean-Day, J. M., St. Clair, J. M., Hannun, R., Hare, J., Pandey, A., Sayres, D. S., Hanisco, T. F., Gordon, A. E., and Tinney, E. N.: Extreme Altitudes of Stratospheric Hydration by Midlatitude Convection Observed During the DCOTSS Field Campaign, Geophys. Res. Lett., 50, e2023GL104914, https://doi.org/10.1029/2023GL104914, 2023. a, b
Khaykin, S., Pommereau, J.-P., Korshunov, L., Yushkov, V., Nielsen, J., Larsen, N., Christensen, T., Garnier, A., Lukyanov, A., and Williams, E.: Hydration of the lower stratosphere by ice crystal geysers over land convective systems, Atmos. Chem. Phys., 9, 2275–2287, https://doi.org/10.5194/acp-9-2275-2009, 2009. a, b
Khaykin, S. M., Moyer, E., Krämer, M., Clouser, B., Bucci, S., Legras, B., Lykov, A., Afchine, A., Cairo, F., Formanyuk, I., Mitev, V., Matthey, R., Rolf, C., Singer, C. E., Spelten, N., Volkov, V., Yushkov, V., and Stroh, F.: Persistence of moist plumes from overshooting convection in the Asian monsoon anticyclone, Atmos. Chem. Phys., 22, 3169–3189, https://doi.org/10.5194/acp-22-3169-2022, 2022. a
Lacis, A. A., Wuebbles, D. J., and Logan, J. A.: Radiative forcing of climate by changes in the vertical distribution of ozone, J. Geophys. Res.-Atmos., 95, 9971–9981, https://doi.org/10.1029/JD095iD07p09971, 1990. a
Lepore, C., Abernathey, R., Henderson, N., Allen, J. T., and Tippett, M. K.: Future Global Convective Environments in CMIP6 Models, Earth's Future, 9, e2021EF002277, https://doi.org/10.1029/2021EF002277, 2021. a
Liu, N. and Liu, C.: Global distribution of deep convection reaching tropopause in 1 year GPM observations, J. Geophys. Res.-Atmos., 121, 3824–3842, https://doi.org/10.1002/2015JD024430, 2016. a, b, c
Liu, N., Liu, C., and Hayden, L.: Climatology and Detection of Overshooting Convection From 4 Years of GPM Precipitation Radar and Passive Microwave Observations, J. Geophys. Res.-Atmos., 125, e2019JD032003, https://doi.org/10.1029/2019JD032003, 2020. a, b, c
Luderer, G., Trentmann, J., Hungershöfer, K., Herzog, M., Fromm, M., and Andreae, M. O.: Small-scale mixing processes enhancing troposphere-to-stratosphere transport by pyro-cumulonimbus storms, Atmos. Chem. Phys., 7, 5945–5957, https://doi.org/10.5194/acp-7-5945-2007, 2007. a, b
Marion, G. R., Trapp, R. J., and Nesbitt, S. W.: Using Overshooting Top Area to Discriminate Potential for Large, Intense Tornadoes, Geophys. Res. Lett., 46, 12520–12526, https://doi.org/10.1029/2019GL084099, 2019. a
Mullendore, G. L., Durran, D. R., and Holton, J. R.: Cross-tropopause tracer transport in midlatitude convection, J. Geophys. Res., 110, D06113, https://doi.org/10.1029/2004JD005059, 2005. a
Murillo, E. M. and Homeyer, C. R.: What Determines Above-Anvil Cirrus Plume Infrared Temperature?, J. Atmos. Sci., 79, 3181–3194, https://doi.org/10.1175/JAS-D-22-0080.1, 2022. a, b
NASA: Dynamics and Chemistry of the Summer Stratosphere Airborne Data Products, NASA Langley Atmospheric Science Data Center DAAC [data set], https://doi.org/10.5067/ASDC/DCOTSS-Aircraft-Data_1, 2023a. a
NASA: Dynamics and Chemistry of the Summer Stratosphere Radar and Satellite (Remote Sensing) Data Products, NASA Langley Atmospheric Science Data Center DAAC [data set], https://doi.org/10.5067/ASDC/DCOTSS-Radar-Satellite-Data_1, 2023b. a
Nugent, J. M. and Bretherton, C. S.: Tropical Convection Overshoots the Cold Point Tropopause Nearly as Often Over Warm Oceans as Over Land, Geophys. Res. Lett., 50, e2023GL105083, https://doi.org/10.1029/2023GL105083, 2023. a
O'Neill, M. E., Orf, L., Heymsfield, G. M., and Halbert, K.: Hydraulic jump dynamics above supercell thunderstorms, Science, 373, 1248–1251, https://doi.org/10.1126/science.abh3857, 2021. a, b, c, d
Pan, L. L., Paulik, L. C., Honomichl, S. B., Munchak, L. A., Bian, J., Selkirk, H. B., and Vömel, H.: Identification of the tropical tropopause transition layer using the ozone-water vapor relationship, J. Geophys. Res.-Atmos., 119, 3586–3599, https://doi.org/10.1002/2013JD020558, 2014. a, b
Phoenix, D. B. and Homeyer, C. R.: Simulated Impacts of Tropopause-Overshooting Convection on the Chemical Composition of the Upper Troposphere and Lower Stratosphere, J. Geophys. Res.-Atmos., 126, e2021JD034568, https://doi.org/10.1029/2021JD034568, 2021. a, b, c
Poulida, O., Dickerson, R. R., and Heymsfield, A.: Stratosphere-troposphere exchange in a midlatitude mesoscale convective complex 1. Observations, J. Geophys. Res., 101, 6823–6836, 1996. a
Randel, W. J., Moyer, E., Park, M., Jensen, E., Bernath, P., Walker, K., and Boone, C.: Global variations of HDO and HDO/H2O ratios in the upper troposphere and lower stratosphere derived from ACE-FTS satellite measurements, J. Geophys. Res., 117, D06303, https://doi.org/10.1029/2011JD016632, 2012. a
Sandmæl, T. N., Homeyer, C. R., Bedka, K. M., Apke, J. M., Mecikalski, J. R., and Khlopenkov, K.: Evaluating the Ability of Remote Sensing Observations to Identify Significantly Severe and Potentially Tornadic Storms, J. Appl. Meteorol. Clim., 58, 2569–2590, https://doi.org/10.1175/JAMC-D-18-0241.1, 2019. a
Sargent, M. R., Sayres, D. S., Smith, J. B., Witinski, M., Allen, N. T., Demusz, J. N., Rivero, M., Tuozzolo, C., and Anderson, J. G.: A new direct absorption tunable diode lase spectrometere for high precision measurement of water vapor in the upper troposphere and lower stratosphere, Rev. Sci. Instrum., 84, 074102, https://doi.org/10.1063/1.4815828, 2013. a
Sayres, D. S., Moyer, E. J., Hanisco, T. F., St. Clair, J. M., Keutsch, F. N., O'Brien, A., Allen, N. T., Lapson, L., Demusz, J. N., Rivero, M., Martin, T., Greenberg, M., Tuozzolo, C., Engel, G. S., Kroll, J. H., Paul, J. B., and Anderson, J. G.: A new cavity based absorption instrument for detection of water isotopologues in the upper troposphere and lower stratosphere, Rev. Sci. Instrum., 80, 044102, https://doi.org/10.1063/1.3117349, 2009. a
Schauffler, S. M., Atlas, E. L., Blake, D. R., Flocke, F., Lueb, R. A., Lee-Taylor, J. M., Stroud, V., and Travnicek, W.: Distributions of brominated organic compounds in the troposphere and lower stratosphere, J. Geophys. Res.-Atmos., 104, 21513–21535, https://doi.org/10.1029/1999JD900197, 1999. a
Schmit, T. J., Griffith, P., Gunshor, M. M., Daniels, J. M., Goodman, S. J., and Lebair, W. J.: A Closer Look at the ABI on the GOES-R Series, B. Am. Meteorol. Soc., 98, 681–698, https://doi.org/10.1175/BAMS-D-15-00230.1, 2017. a
Schwartz, M. J., Read, W. G., Santee, M. L., Livesey, N. J., Froidevaux, L., Lambert, A., and Manney, G. L.: Convectively injected water vapor in the North American summer lowermost stratosphere, Geophys. Res. Lett., 40, 1–6, https://doi.org/10.1002/grl.50421, 2013. a
Scott, S. G., Bui, T. P., and Chan, K. R.: The Meteorological Measurement System on the NASA ER-2 Aircraft, J. Atmos. Ocean. Tech., 7, 525–540, https://doi.org/10.1175/1520-0426(1990)007<0525:TMMSOT>2.0.CO;2, 1990. a
Smith, J. B., Wilmouth, D. M., Bedka, K. M., Bowman, K. P., Homeyer, C. R., Dykema, J. A., Sargent, M. R., Clapp, C., Leroy, S. S., Sayres, D. S., Dean-Day, J. M., Bui, T. P., and Anderson, J. G.: A Case Study of Convectively Sourced Water Vapor Observed in the Overworld Stratosphere over the United States, J. Geophys. Res.-Atmos., 122, 9529–9554, https://doi.org/10.1002/2017JD026831, 2017. a, b, c, d, e, f
Solomon, D. L., Bowman, K. P., and Homeyer, C. R.: Tropopause-Penetrating Convection from Three-Dimensional Gridded NEXRAD Data, J. Appl. Meteorol. Clim., 55, 465–478, https://doi.org/10.1175/JAMC-D-15-0190.1, 2016. a, b, c
Solomon, S., Rosenlof, K. H., Portmann, R. W., Daniel, J. S., Davis, S. M., Sanford, T. J., and Plattner, G.-K.: Contributions of Stratospheric Water Vapor to Decadal Changes in the Rate of Global Warming, Science, 327, 1219–1223, https://doi.org/10.1126/science.1182488, 2010. a
Starzec, M., Mullendore, G. L., and Homeyer, C. R.: Retrievals of Convective Detrainment Heights Using Ground-Based Radar Observations, J. Geophys. Res.-Atmos., 125, e2019JD031164, https://doi.org/10.1029/2019JD031164, 2020. a
Stohl, A., Wernli, H., James, P., Bourqui, M., Forster, C., Liniger, M. A., Seibert, P., and Sprenger, M.: A new perspective of stratosphere-troposphere exchange, B. Am. Meteorol. Soc., 84, 1565–1573, 2003. a
Tinney, E. N. and Homeyer, C. R.: A 13-year Trajectory-Based Analysis of Convection-Driven Changes in Upper Troposphere Lower Stratosphere Composition over the United States, J. Geophys. Res.-Atmos., 126, e2020JD033657, https://doi.org/10.1029/2020JD033657, 2021. a, b
Trapp, R. J., Diffenbaugh, N. S., Brooks, H. E., Baldwin, M. E., Robinson, E. D., and Pal, J. S.: Changes in severe thunderstorm environment frequency during the 21st century caused by anthropogenically enhanced global radiative forcing, P. Natl. Acad. Sci. USA, 104, 19719–19723, https://doi.org/10.1073/pnas.0705494104, 2007. a
Ueyama, R., Schoeberl, M., Jensen, E., Pfister, L., Park, M., and Ryoo, J.-M.: Convective Impact on the Global Lower Stratospheric Water Vapor Budget, J. Geophys. Res.-Atmos., 128, e2022JD037135, https://doi.org/10.1029/2022JD037135, 2023. a
Wang, P. K.: Moisture plumes above thunderstorm anvils and their contributions to cross-tropopause transport of water vapor in midlatitudes, J. Geophys. Res., 108, 4194, https://doi.org/10.1029/2002JD002581, 2003. a, b
Wang, P. K., Cheng, K.-Y., Setvák, M., and Wang, C.-K.: The origin of the gullwing-shaped cirrus above an Argentinian thunderstorm as seen in CALIPSO images, J. Geophys. Res.-Atmos., 121, 3729–3738, https://doi.org/10.1002/2015JD024111, 2016. a, b
Werner, F., Schwartz, M. J., Livesey, N. J., Read, W. G., and Santee, M. L.: Extreme Outliers in Lower Stratospheric Water Vapor Over North America Observed by MLS: Relation to Overshooting Convection Diagnosed From Colocated Aqua-MODIS Data, Geophys. Res. Lett., 47, e2020GL090131, https://doi.org/10.1029/2020GL090131, 2020. a, b
World Meteorological Organization: Meteorology – A three-dimensional science: Second session of the commission for aerology, World Meteorol. Organ. Bull., 4, 134–138, 1957. a