the Creative Commons Attribution 4.0 License.
the Creative Commons Attribution 4.0 License.
 | 01 Jul 2024
The role of naphthalene and its derivatives in the formation of secondary organic aerosol in the Yangtze River Delta region, China
Fei Ye
Yaqin Gao
Hongli Wang
Jingyu An
Cheng Huang
Keding Lu
Kangjia Gong
Haowen Zhang
Momei Qin
Jianlin Hu
Naphthalene (Nap) and its derivatives, including 1-methylnaphthalene (1-MN) and 2-methylnaphthalene (2-MN), serve as prominent intermediate volatile organic compounds (IVOCs) and contribute to the formation of secondary organic aerosol (SOA). In this study, the Community Multiscale Air Quality (CMAQ) model coupled with detailed emissions and reactions of these compounds was utilized to examine their roles in the formation of SOA and other secondary pollutants in the Yangtze River Delta (YRD) region during summer. Significant underestimations of Nap and MN concentrations (by 79 % and 85 %) were observed at the Taizhou site based on the model results using the default emissions. Constrained by the observations, anthropogenic emissions of Nap and MN in the entire region were multiplied by 5 and 7, respectively, to better capture the evolution of pollutants. The average concentration of Nap reached 25 ppt (parts per trillion) in the YRD, with Nap contributing 4.1 % and 8.1 % (up to 12.6 %) of total aromatic emissions and aromatic-derived secondary organic carbon (SOC), respectively. The concentrations of 1-MN and 2-MN were relatively low, averaging 2 and 5 ppt, respectively. Together, they accounted for only 2.4 % of the aromatic-derived SOC. The impacts of Nap and MN oxidation on ozone and radicals were insignificant at regional scales but were not negligible when considering daily fluctuations in locations with high emissions of Nap and MN. This study highlights the significant roles of Nap and MN in the formation of SOA, which may pose environmental risks and result in adverse health effects.
- Article
(2124 KB) - Full-text XML
-
Supplement
(4139 KB) - BibTeX
- EndNote


Secondary organic aerosols (SOAs) are formed from the condensation and multiphase evolution of organic species, which can be directly emitted or produced from the oxidation of volatile organic compounds (VOCs) in the atmosphere. SOAs not only affect visibility and human health but also exert direct (by absorbing and reflecting solar radiation) and indirect (by influencing cloud formation) effects on the climate (Chen et al., 2016; Zhang and Ying, 2012). Semi-volatile and intermediate-volatility organic compounds (S/IVOCs) have been identified as the key precursors of SOA (Robinson et al., 2007; Hu et al., 2022). IVOCs are categorized by small polycyclic aromatic hydrocarbons (PAHs), intermediate-length alkanes (e.g., n-hexadecane), and phenols (Pye and Seinfeld, 2010). PAHs are organic compounds containing multiple aromatic rings. In 2004, China exhibited the highest annual PAH emissions (114 Gg) globally, accounting for 22 % of the total emissions worldwide (Zhang and Tao, 2009). Naphthalene (Nap) and methylnaphthalene (MN), such as 1-methylnaphthalene (1-MN) and 2-methylnaphthalene (2-MN), are the most abundant airborne PAHs (Chen et al., 2016; Fang et al., 2021), primarily emitted from combustion of fossil fuels, biomass burning, and industrial sectors (Fang et al., 2021).
Chamber studies have identified the gas- and particle-phase products from Nap reacting with hydroxyl radicals (OH⋅) (Huang et al., 2019). Ring-retaining products (such as 1,4-naphthoquinone) with lower volatilities dominate under conditions of low nitrogen oxides (NOx), whereas ring-opening products (such as 2-formylcinnamaldehyde) with higher volatilities dominate in the presence of high NOx. Chan et al. (2009) evaluated the SOA yields of Nap, 1-MN, 2-MN, and 1,2-dimethyl naphthalene in chambers to estimate SOA formation from primary emissions of diesel engines and wood burning. It was found that SOA is more efficiently produced under low-NOx conditions than under high-NOx conditions, with yields of 55 %–75 % and 25 %–45 %, respectively, at a total organic aerosol loading of 15 µg m−3. During a photooxidation period of less than 12 h, these PAHs produced 3–5 times more SOA than light aromatic compounds, accounting for up to 54 % of the total SOA from the oxidation of diesel emissions. Huang et al. (2019) applied a tracer method to determine that 14.9 % of SOA was attributed to the oxidation of Nap and MN in the afternoon during wintertime haze in Beijing. Shakya and Griffin (2010) also reported 37–162 kg d−1 of SOA produced by PAHs (including Nap, 1-MN, 2-MN, acenaphthylene, and acenaphthene) emitted from mobile sources in Houston, based on the yields from their study and that of Chan et al. (2009). By adopting the SOA yields from Shakya and Griffin (2010), Liu et al. (2015) showed that Nap accounted for 8 %–52 % of the total SOA derived from benzene, toluene, C2-benzene, C3-benzene, C4-benzene, and Nap in exhaust emissions from light-duty gasoline vehicles. All of these experimental findings demonstrate the significant role of Nap and MN in SOA formation in environments dominated by anthropogenic influences. However, these results might not accurately reflect the actual atmospheric conditions due to the simplicity of reaction conditions and the limited precursors involved in chamber studies (Ling et al., 2022).
Numerical models have been developed and utilized to assess the contribution of S/IVOCs to SOA (Hayes et al., 2015; Pye and Seinfeld, 2010; An et al., 2023). Using the Community Multiscale Air Quality (CMAQ) model, Zhang and Ying (2011) showed that PAHs emitted from anthropogenic sources could produce as much as 10 % of the SOA mass estimated from traditional light aromatics or approximately 4 % of the estimated total anthropogenic SOA. However, the SOA products of several PAH species such as Nap and MN were lumped together due to limited experimental data for explicit parameterization. Pye and Pouliot (2012) assumed that 10 % of ARO2 (lumped aromatic species) reacted with OH⋅ to represent SOA formation from PAHs in the CMAQ model, using Nap as a surrogate for parameterization, without considering individual PAH's emissions or OH⋅ reactivity. According to Cohan et al. (2013), the modeled SOA increased by roughly 1 %–10 % when Nap emissions from on-road gasoline and diesel vehicles were considered. Their simulations showed a lower limit in the SOA production from Nap due to underestimations in the emission inventory in the South Coast Air Basin of California. Using a 3D chemical transport model (CTM), Majdi et al. (2019) found that Nap and MN contributed 2.4 % of the total organic aerosol (OA) originating from wildfires over the Euro-Mediterranean region during the summer of 2007. The contributions of Nap and MN to SOA at regional scales in China have not been quantified.
In this study, SOA formation from Nap, 1-MN, and 2-MN in the Yangtze River Delta (YRD) region during the EXPLORE-YRD (EXPeriment on the eLucidation of the atmospheric Oxidation capacity and aerosol foRmation and their Effects in the Yangtze River Delta) campaign period (20 May–18 June 2018) was investigated using an updated CMAQ model that incorporated explicit SOA schemes for these PAHs. Emission inventories of Nap, 1-MN, and 2-MN were estimated based on different sources and methods and validated against observations. After that, the influences of Nap and MN on secondary organic carbon (SOC), ozone (O3), and radical concentrations were examined in locations with high levels of Nap and MN as well as at the regional scale. The newly added SOA parameterizations for 1-MN and 2-MN were fitted by both two-product and one-product methods to compare the differences. We found that Nap and its derivatives, although accounting for a small fraction of emitted aromatics (5.1 %), contributed 10.4 % of aromatic-derived SOC in the YRD.
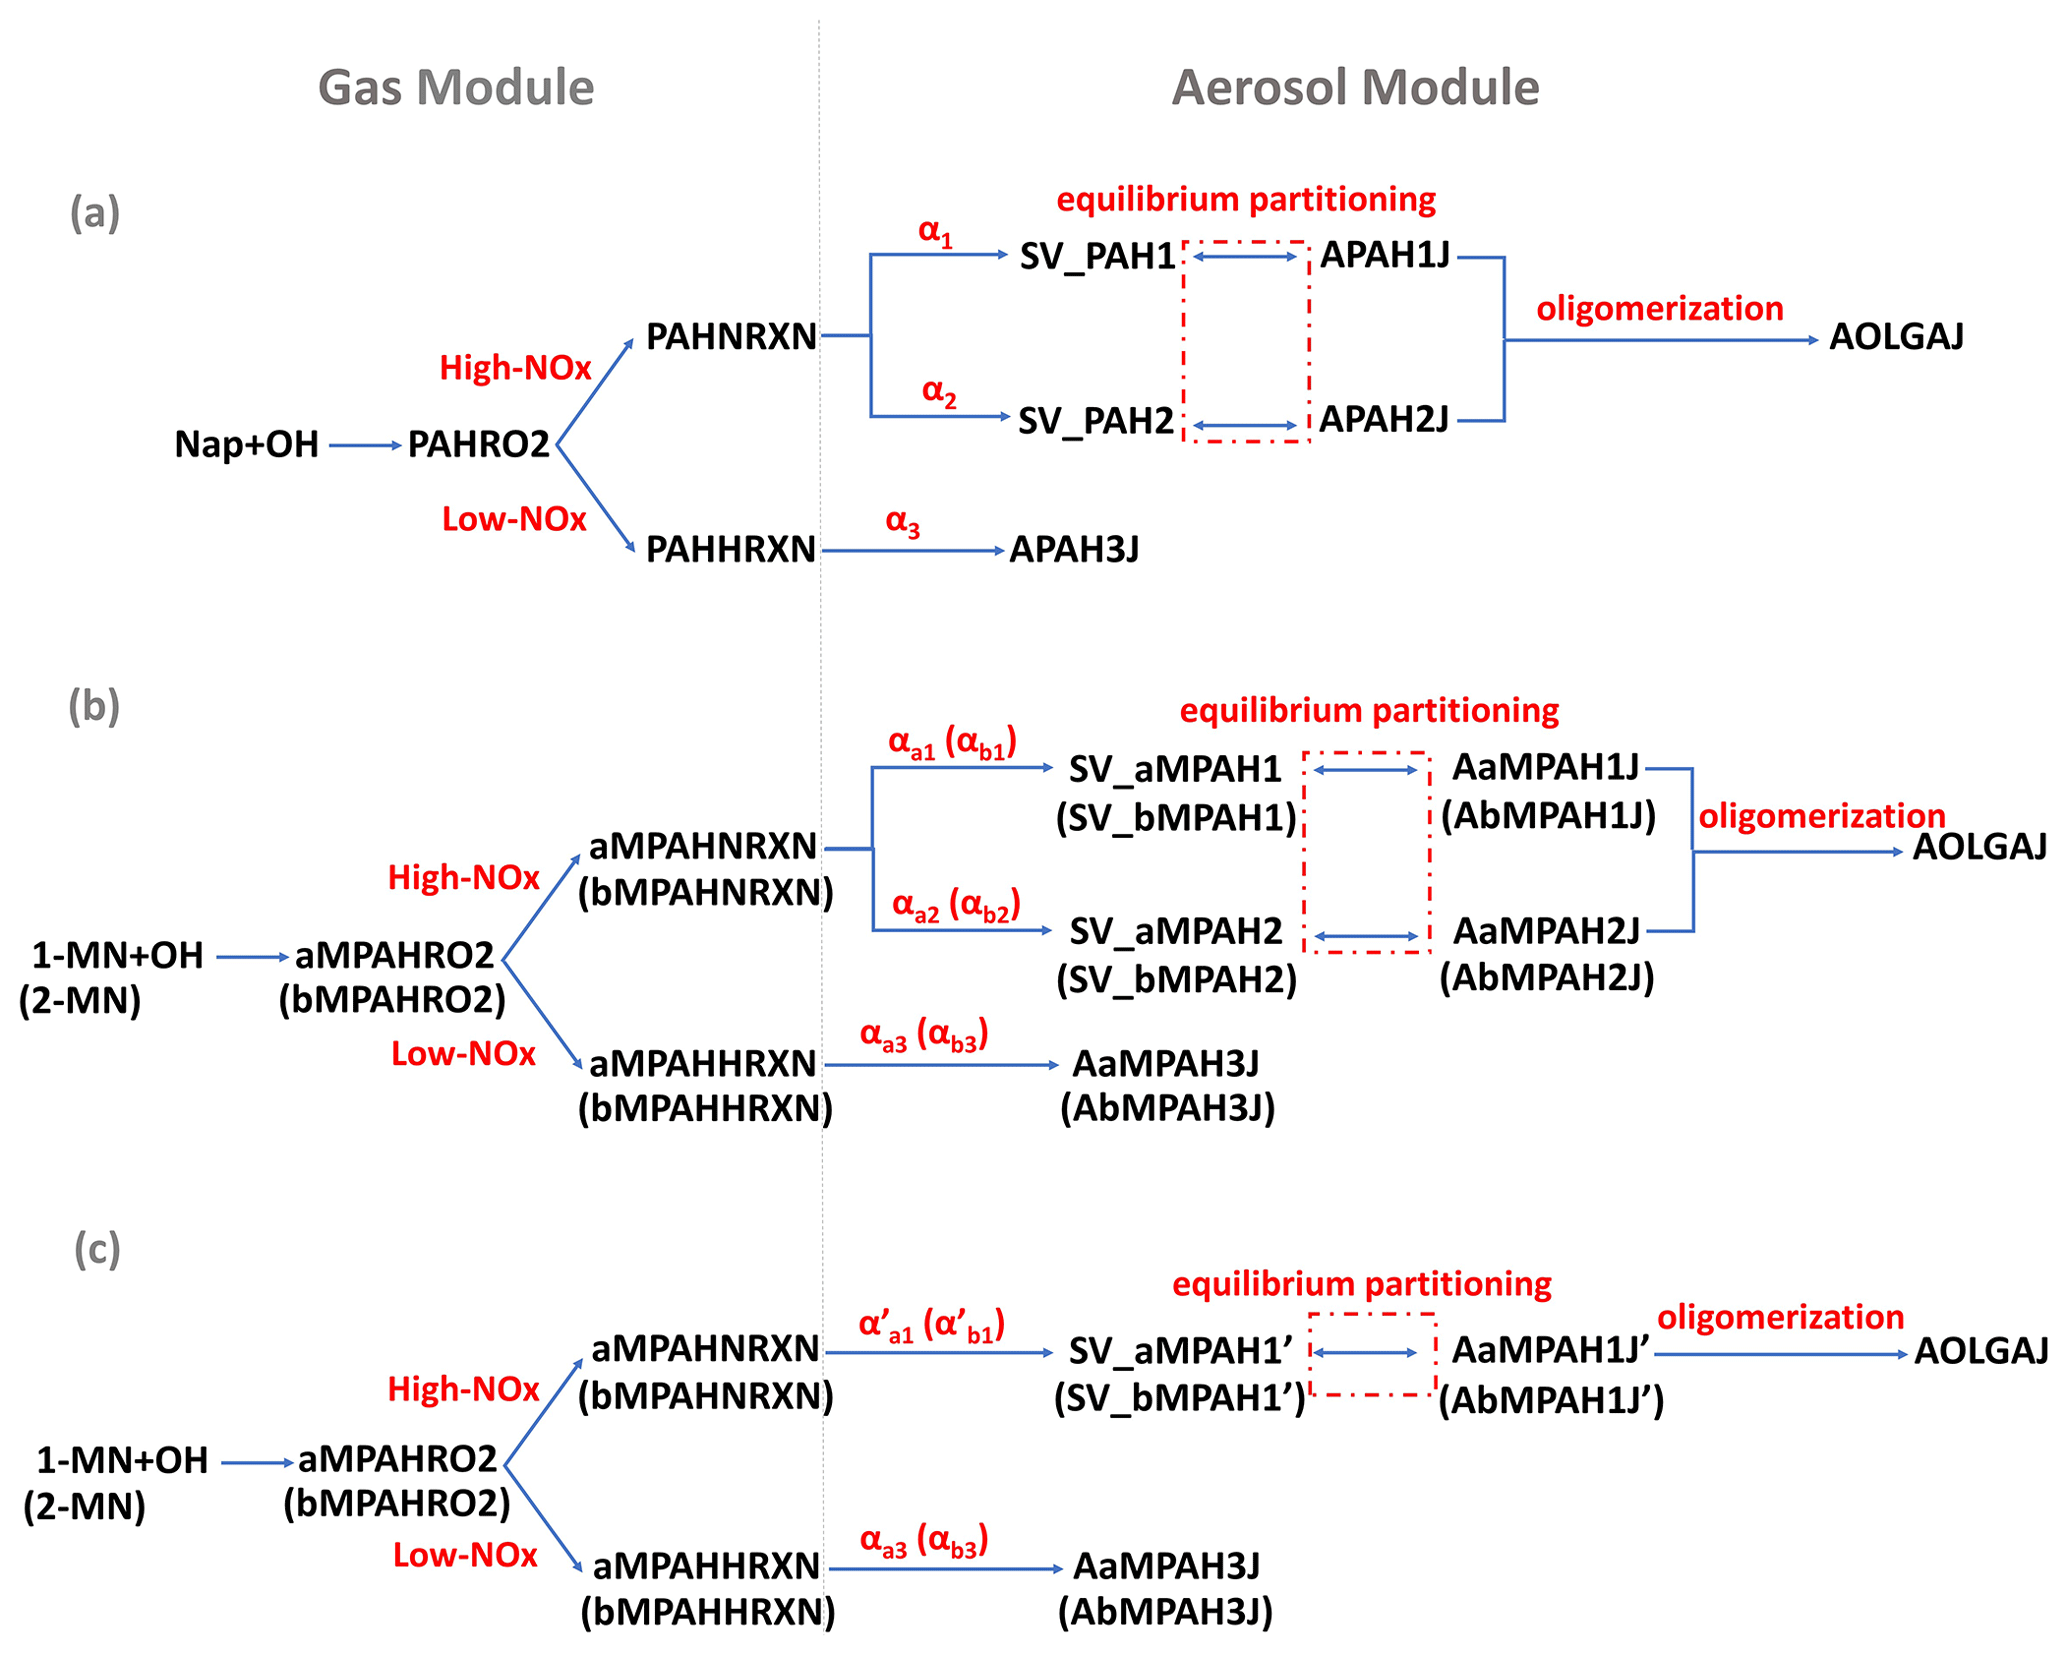
Figure 1SOA schemes for naphthalene (Nap), 1-methylnaphthalene (1-MN), and 2-methylnaphthalene (2-MN) in the updated CMAQ model: (a) preexisting Nap-derived SOA formation pathways fitted by two products under high NOx; (b) newly added SOA formation pathways for 1-MN and 2-MN fitted by two products under high NOx; (c) newly added SOA formation pathways for 1-MN and 2-MN fitted by one product under high NOx. SOA formation from Nap and MN oxidation by OH radicals under low-NOx conditions is represented by a fixed yield. Parameters for 2-MN are indicated in parentheses in panels (b) and (c). The values of α refer to Table S1.
2.1 Modified SOA formation pathways of MN
The CMAQ model (version 5.2) coupled with the SAPRC07tic atmospheric chemical mechanism and the AERO6i aerosol module, was updated to include the oxidation of 1-MN and 2-MN by OH⋅ and the corresponding SOA formation pathways. In the original CMAQ model, Nap reacts with OH⋅ to form SOA under high- and low-NOx conditions, represented by two different counter species, PAHNRXN and PAHHRXN, respectively (Fig. 1a). Similar to Nap, 1-MN and 2-MN were explicitly treated as reacting with OH⋅ and forming SOA counter species under high-NOx (aMPAHNRXN and bMPAHNRXN) and low-NOx (aMPAHHRXN and bMPAHHRXN) conditions, along with other products, following Zhang and Ying (2012). These counter species were used to calculate the production of SOA through gas–particle partitioning based on yields (αi) and partitioning coefficients (Kom,i, m3 µg−1) of condensable organic products derived from chamber experiment data. Details of gas–particle partitioning for fitting SOA formation using one-product and two-product methods are given in the Supplement.
In the original CMAQ model, a two-product method (SV_PAH1 and SV_PAH2) was used to represent the SOA formation from Nap under high-NOx conditions, denoted as APAH1J and APAH2J, respectively (Fig. 1a). Under low-NOx conditions, a one-product method was used to represent the SOA formation from Nap, denoted as APAH3J. It was assumed that APAH3J (with a yield of α3) was non-volatile and resided in the particle phase. Similar to Nap, a two-product method for the SOA formation from 1-MN under high-NOx conditions was added (as shown in Fig. 1b), with the SOA species denoted as AaMPAH1J and AaMPAH2J. Additionally, a one-product method characterizing the SOA formation from 1-MN under high-NOx conditions was applied to compare differences caused by different fitting approaches. As shown in Fig. 1c, the semi-volatile organic product SV_aMPAH1' undergoes equilibrium partitioning to form SOA (AaMPAH1J'). Under low-NOx conditions, a non-volatile SOA product AaMPAH3J is formed through oxidation of 1-MN. The SOA scheme of 2-MN followed that of 1-MN with corresponding products AbMPAH1J and AbMPAH2J (or AbMPAH1J') under high-NOx conditions and AbMPAH3J under low-NOx conditions, respectively. Moreover, all semi-volatile SOA products originating from MN undergo condensed-phase oligomerization reactions at the same rate as APAH1J and APAH2J, generating anthropogenic non-volatile oligomers (AOLGAJ). Other processes and parameters involved in the newly added SOA pathways for 1-MN and 2-MN, such as the dry and wet deposition and the molecular weight of the oxidation products, were set to be the same as Nap due to limited experimental data. Details of all the parameters, i.e., αi, Kom,i, and enthalpy are summarized in Table S1 in the Supplement.
2.2 Model application
The simulation domain, which covers Jiangsu, Zhejiang, Anhui, Shanghai, and neighboring provinces, has a horizontal resolution of 4 km×4 km (238×268 grids) and a vertical structure of 18 layers, as shown in Fig. S1 in the Supplement. Details of the domain setup can be found in previous studies (Li et al., 2022, 2021). The meteorological field was predicted by the Weather Research and Forecasting (WRF) model version 4.0 with the ECMWF Reanalysis v5 (ERA5) reanalysis data as inputs. More details about the WRF configuration have been summarized by Wang et al. (2021). A spin-up of 2 d was used to minimize the influence of initial conditions.
Biogenic emissions were generated from the Model of Emissions of Gases and Aerosols from Nature (MEGAN), version 2.1 (Guenther et al., 2012). Emissions from open biomass burning were based on the Fire INventory from the National Center for Atmospheric Research (FINN) (Wiedinmyer et al., 2011). Anthropogenic emissions were generated from the updated 2017 emission inventory for the YRD (An et al., 2021) and the Multi-resolution Emission Inventory for China (MEIC, http://www.meicmodel.org, last access: 1 June 2023) for the rest of the domain. Currently, there is a lack of localized source profiles in China, particularly regarding Nap and MN. These data were obtained from the U.S. Environmental Protection Agency's (EPA's) repository of organic gas and particulate matter (PM) speciation profiles of air pollution sources (SPECIATEv5.2) along with the source information reported by An et al. (2021) and Li et al. (2014). Relevant details of emission calculations can be found in the Supplement. There are two sets of emission data consisting of different Nap and MN emissions. The emis-orig used the original Nap emissions from the 2017 YRD inventory as well as the calculated Nap emissions in the rest of the domain and MN emissions in the entire domain. We show later that Nap and MN were underestimated and required an adjustment in their emissions to capture the observed concentrations. Considering their predominantly anthropogenic origin, their anthropogenic emissions in the entire region from emis-orig were multiplied by respective values of 5 and 7 in the emis-adjust case. All of the emission ratios applied in this study are shown in Table S2. According to Fig. S2, Nap and MN emissions were mainly located in Shanghai, southern Jiangsu, and parts of Zhejiang. After adjustments, the total emission rate of Nap and MN in the YRD region in emis-adjust (85.0 t d−1) was approximately 4 times higher than that in emis-orig (18.2 t d−1). The total MN emission rate in the YRD region in emis-adjust was 20.3 t d−1, lower than that of Nap. For emis-adjust, the dominant source of MN was related to residential emissions (47.0 %), followed by industry processes (25.8 %) and on-road transportation (20.8 %). Among all sources, on-road transportation contributed the most to Nap emissions in both emis-orig (78.2 %) and emis-adjust (87.5 %). It should be noted that uncertainties associated with the emission inventory and source profiles, which are based on sector-specific mass ratios presented in Table S2, may potentially affect both the distribution and source contributions of Nap and MN.
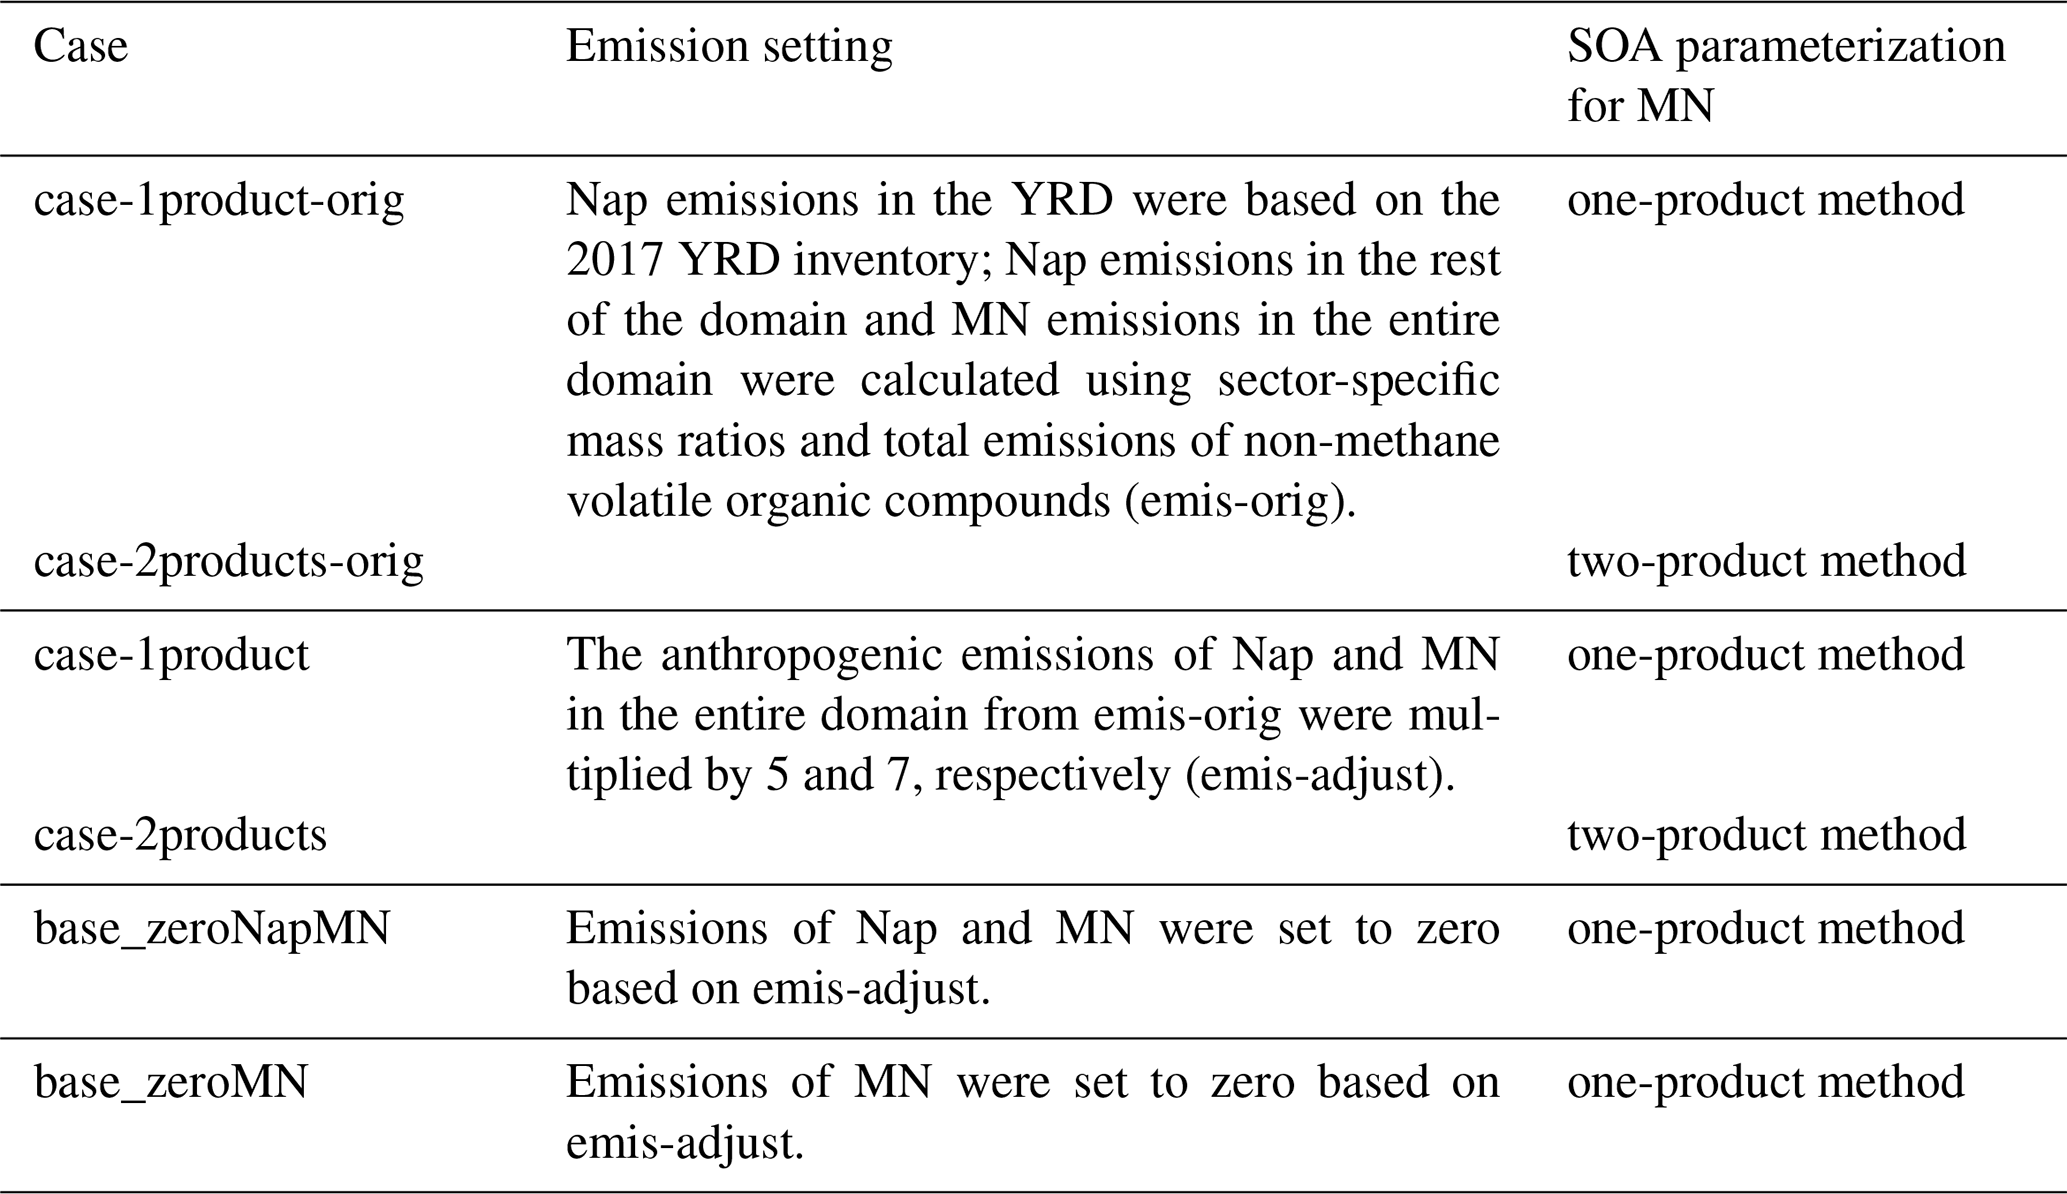
Table 1 lists the scenarios conducted in this study. In case-1product-orig, the anthropogenic emissions were based on emis-orig, along with the SOA parameterization for MN fitted by a one-product method in Fig. 1c and that of Nap fitted by a two-product method in Fig. 1a under high-NOx conditions. To assess the impacts of different SOA parameterizations, case-2products-orig adopted the same setting as case-1product-orig except for utilizing a two-product method for MN-derived SOA under high-NOx conditions (Fig. 1b). For accurate representations of the fate of Nap and MN in the atmosphere, both case-1product and case-2products employed adjusted emissions (emis-adjust) along with different SOA parameterizations for MN. SOA formation from Nap and MN under low-NOx conditions in the above cases was characterized by a fixed yield, as shown in Table S1. Overall, the contributions of Nap, 1-MN, and 2-MN to the aromatic SOC were estimated based on different emission inventories and SOA schemes. To evaluate the effects of Nap, 1-MN, and 2-MN on O3, SOC, and radical concentrations, their emissions in case-1product were set to zero and named base_zeroNapMN. A case named base_zeroMN was conducted to quantify the individual effects of Nap and MN by setting the emissions of 1-MN and 2-MN to zero.
2.3 Observation data for model validation
In May–June 2018, the EXPLORE-YRD field campaign was launched at a rural site in Taizhou (32.558° N, 119.994° E); the campaign simultaneously monitored VOCs (including Nap and MN), O3, NOx, organic carbon (OC), OH⋅, hydroperoxy radical (HO2⋅), and other various pollutants, providing a good opportunity for model validation and understanding the evolution of air pollution in the YRD (H. Wang et al., 2020; Huang et al., 2020; Yu et al., 2021; Gao et al., 2022). For details of the measurement method and accuracy for each species, readers are referred to the references in the preceding sentence. The simulated daily maximum 8 h average (MDA8) O3, fine particulate matter (PM2.5), sulfur dioxide (SO2), nitrogen dioxide (NO2), and carbon monoxide (CO) were also compared with observations from the National Real-Time Urban Air Quality Release Platform of China National Environmental Monitoring Centre (https://air.cnemc.cn:18007, last access: 17 May 2023) in Suzhou, Nanjing, Hangzhou, Hefei, and Shanghai, as shown in Fig. S1. The statistical metrics, including the normalized mean bias (NMB), normalized mean error (NME), and correlation coefficient (r), were calculated for several air pollution species. The benchmarks for model performance followed the recommendations by Emery et al. (2017) and are listed in Table S3. The meteorological parameters predicted by WRF have been examined to be robust during the same episode by Wang et al. (2021).
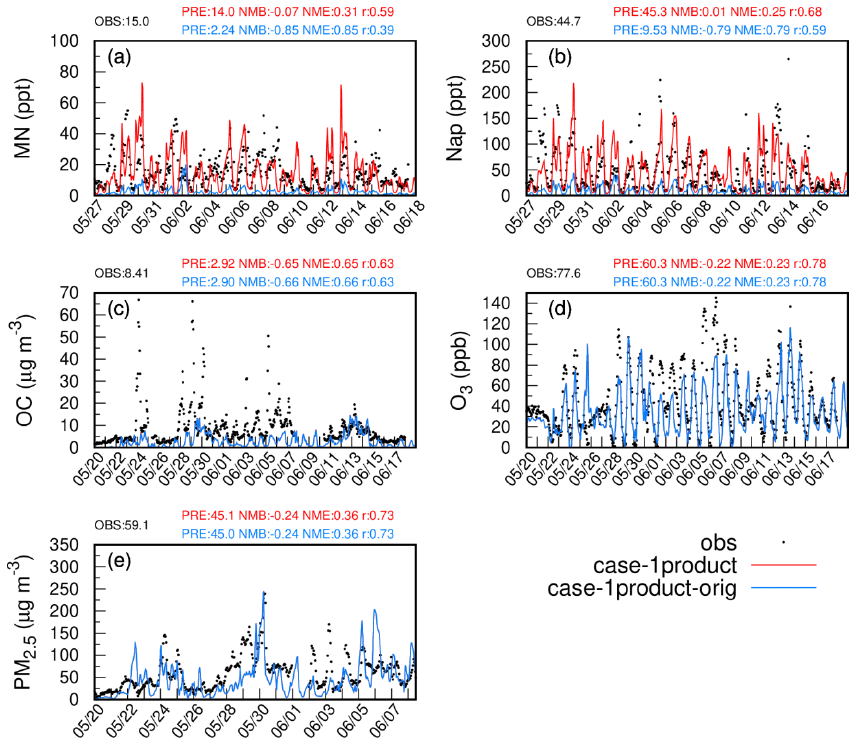
Figure 2Observed and simulated hourly concentrations of MN, Nap, OC, PM2.5, and O3 based on emis-adjust (red) and emis-orig (blue) at the Taizhou site. The model performance for daily MN, Nap, OC, PM2.5, and MDA8 O3 is shown in blue for case-1product-orig and in red for case-1product. OBS and PRE represent the average of observations and predictions, respectively. Note that the red and blue lines overlap in panels (c), (d), and (e).
3.1 Model validation
Figures 2 and S3 show the comparison of observed and simulated hourly variations in Nap, MN, O3, OC, and PM2.5 at the Taizhou site during the study period. The concentrations of Nap in case-1product-orig and case-2products-orig were significantly underestimated (by 79 %) compared with the observations. In contrast, emis-adjust better represented the temporal variations in Nap (NMB =0.01, r=0.68) than emis-orig, with the average concentration increasing by a factor of 4 and agreeing well with the observations. The modeled concentration of MN by emis-adjust (14.0 ppt, parts per trillion) was also comparable to the observed value (15.0 ppt) and showed a good correlation between the two (r=0.59). For other species, the concentrations of OC and PM2.5 were slightly increased in emis-adjust compared with that of emis-orig, although they were underestimated in both scenarios. The NMB and NME of PM2.5 satisfied the benchmarks recommended by Emery et al. (2017), while the NMB of MDA8 O3 exceeded the criteria. Table S4 shows that the concentrations of NO2 and nitric oxide (NO) were underestimated at the Taizhou site. The simulated OH radicals agreed well with observations at the Taizhou site, whereas the concentrations of HO2⋅ were underestimated (Fig. S4). It should be noted that the influences of different SOA schemes for MN on the aforementioned species are negligible. The predicted concentrations of MDA8 O3, PM2.5, SO2, NO2, and CO in other cities were also examined. Overall, the model agreed well with observations except for a significant underestimation of MAD8 O3 in Shanghai (Table S3). The results of case-1product and case-2products using emis-adjust as the emission data were superior compared with the cases using emis-orig. These findings will be further discussed in the subsequent analysis.
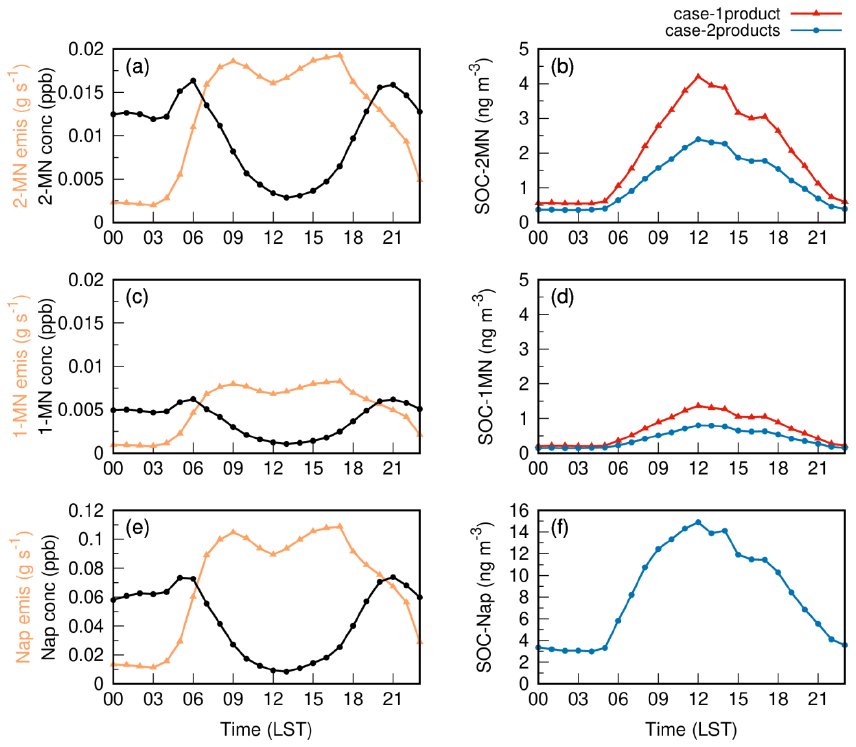
Figure 3Diurnal variations in emissions (yellow line) and predicted concentrations (black line) for 2-MN (a), 1-MN (c), and Nap (e) as well as the corresponding SOC concentrations (b, d, f) at the Taizhou site. Note that the red and blue lines overlap in panel (f).
3.2 Influences of Nap and MN on SOC in Taizhou
Figure 3 depicts the diurnal variations in emissions and concentrations of Nap, 1-MN, and 2-MN as well as the corresponding SOC products SOC-Nap, SOC-1MN, and SOC-2MN at the Taizhou site in both case-1product and case-2products. The emissions of Nap, 1-MN, and 2-MN exhibited a bimodal pattern. For Nap, the bimodal characteristics were the most pronounced, accompanied by two peaks that occurred between 08:00–09:00 and 16:00–17:00 LST (local standard time), respectively. This is likely attributed to the dominant source of Nap from transportation, as described in Sect. 2.2. Nap and MN concentrations were relatively low during the daytime and peaked in the morning and at night. This is caused by the fast photochemical removal and increased dilution during the daytime, along with the facilitated accumulation due to low mixing heights at night (Huang et al., 2019; Cohan et al., 2013). The simulated diurnal variation in Nap agreed well with observations, but the daytime MN concentration was underpredicted, as shown in Fig. S5. The concentrations of SOC generated by Nap, 1-MN, and 2-MN were high during the daytime, especially from 10:00 to 15:00 LST. This is attributed to the removal of Nap and MN by OH radicals to form SOC. The potential removal by nitrate radicals (NO3) was negligible in this study, leading to a decline in SOC formation at night. Nap-derived SOC was the most abundant, followed by SOC from 2-MN and 1-MN. This is attributed to the combined effects of the OH⋅ reactivity, SOA yields, and the abundances of the three compounds (Li et al., 2017; Yu et al., 2021). Apart from having the highest emissions, Nap also exhibits greater reactivity with OH⋅. Although its SOA yield under high-NOx conditions is lower than that of MN fitted by the one-product scheme (Fig. S6), its SOA yield under low-NOx conditions is the highest among the three PAHs (Table S1). Overall, Nap contributed the most to SOC. The Nap derivative 2-MN demonstrates higher SOA yields than 1-MN under high-NOx conditions in both cases, but it displays a lower SOA yield under low-NOx conditions. Considering the impact of a higher emission rate (Fig. 3a and c), 2-MN contributed 2 times more SOC compared with 1-MN. The SOC generated by MN in case-2products was lower than that in case-1product due to the lower SOA yield applied in case-2products (Fig. S6).
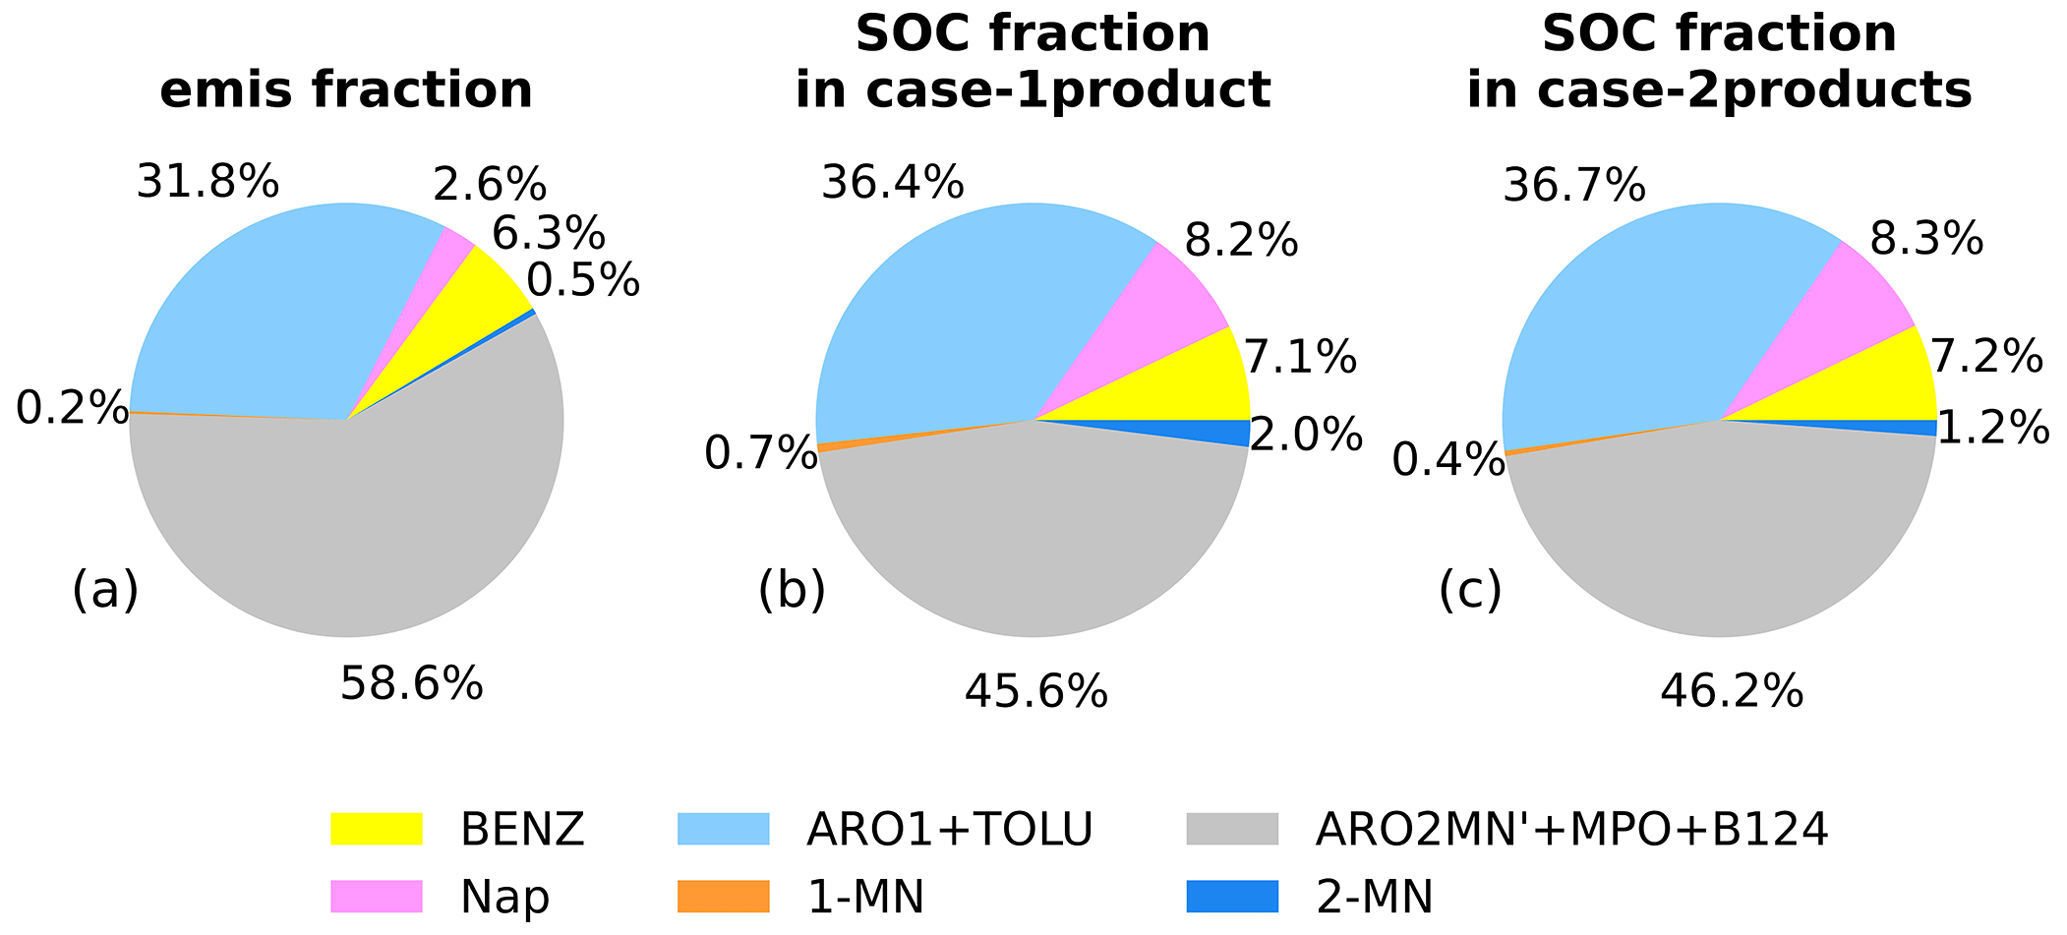
Figure 4Contributions of the major aromatic species to (a) the total emissions of aromatics (weight fraction) and the aromatic-derived SOC in (b) case-1product and (c) case-2products at the Taizhou site. The aromatic species include Nap; 1-MN; 2-MN; BENZ; the sum of toluene and aromatics with ppm−1 min−1 (ARO1+TOLU); and the sum of xylenes, 1,2,4-trimethylbenzene, and aromatics with ppm−1 min−1 excluding Nap and MN (ARO2MN'+MPO+B124) .
Figure 4 shows the contributions of major aromatic species, i.e., Nap, 1-MN, 2-MN, 1,2,4-trimethylbenzene (B124), xylene (MPO), benzene (BENZ), toluene (TOLU), aromatics with kOH (reaction rate constant with OH⋅) ppm−1 min−1 (ARO1), and ARO2MN' (ARO2 excluding Nap and MN) to the total emissions of aromatics and the aromatic-derived SOC in both case-1product and case-2products at the Taizhou site. Among all the species, ARO2MN', MPO, and B124 showed the largest fraction in emissions, accounting for 58.6 %, followed by ARO1 and TOLU (31.8 %) and BENZ (6.3 %). Nap and MN contributed the least to the total aromatic emissions, with Nap being the most abundant species. The daily average concentrations of SOC produced from all of the aromatics were quite similar in case-1product and case-2products, with the values of 101.3 and 100.2 ng m−3, respectively (Fig. S7). The contribution of ARO2MN', MPO, and B124 to the total aromatic-derived SOC was the most significant, ranging from 45.6 % to 46.2 %. Nap indicated a remarkable contribution to SOC, accounting for 8.2 %–8.3 %, despite constituting only 2.6 % of the total emitted aromatics. The Nap derivative 2-MN was also an important SOC precursor, contributing 1.2 %–2.0 % of the aromatic-derived SOC. In contrast, 1-MN showed the lowest emissions, accounting for 0.2 % of the total aromatic emissions and less than 1.0 % of the aromatic-derived SOC. Overall, Nap, 1-MN, and 2-MN exhibited the same trait of contributing significantly more to SOC than to precursor emissions, especially for Nap. The total contributions of MN and Nap to SOC were higher than that of BENZ, even though their emissions were significantly lower than BENZ. Similar results were also found in field campaigns conducted in Guangzhou (Fang et al., 2021) and Beijing (Huang et al., 2019), where Nap and MN showed higher contributions. Compared with benzene and other monocyclic aromatics, the oxidation products of Nap and MN are much less volatile and are more efficient with respect to aerosol growth (M. Wang et al., 2020). Thus, their considerably higher SOA yields and reactivity with OH⋅ lead to an important contribution to SOA formation. We found that 3.3 % of aromatic emissions from Nap and derivatives contributed up to 10.9 % of SOC generated from aromatics at the Taizhou site.
3.3 Regional distributions of Nap and MN and the influences on secondary pollutants
In the YRD, Nap accounted for 4.1 % of aromatic emissions and contributed 8.0 % and 8.1 % of the total SOC generated by aromatics in case-1product and case-2products, respectively (Fig. S8). We found extremely high contributions of Nap-derived SOC in areas with high Nap emissions, reaching up to 12.6 % in case-2products. The Nap derivative 2-MN contributed 0.6 % of the total aromatic emissions and up to 2.5 % of the aromatic-derived SOC in case-1product. Among the three PAHs, 1-MN showed the lowest emissions (about 0.4 % of the aromatic emissions) and contributed minimally to the regional average SOC (0.4 %–0.7 %). The SOC derived from MN in case-2products was approximately 38 % lower than that in case-1product across the entire YRD region (Fig. S9), while minor differences were observed in O3 and the total SOC between the two cases with different SOA parameterization of MN (Fig. S10). In general, the concentrations of SOC produced by the three PAHs in case-1product were higher than that in case-2products, exhibiting similar spatial distribution patterns in both cases. We will focus on the results from case-1product in the subsequent analysis.
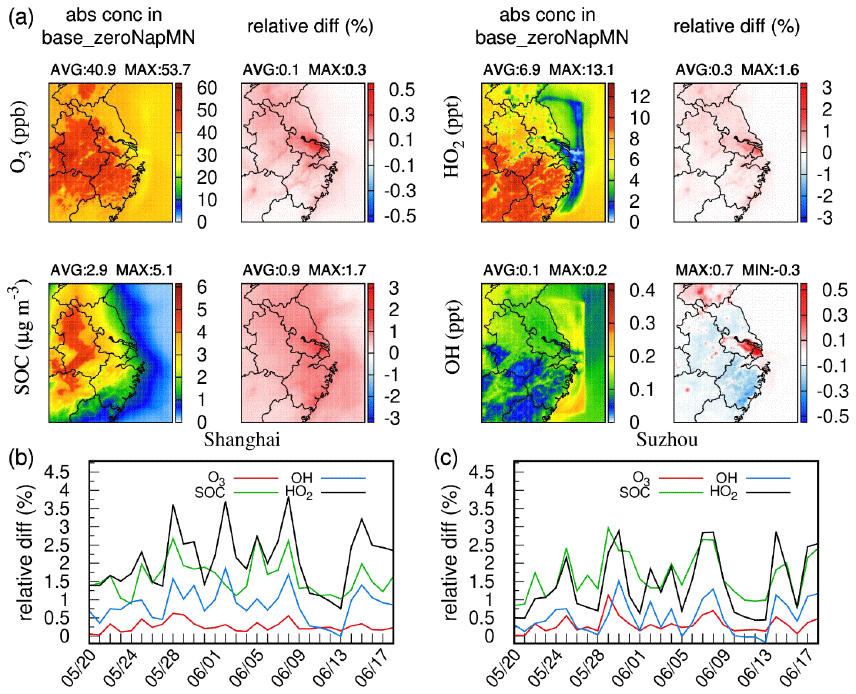
Figure 5(a) Average concentrations of SOC, O3, OH⋅, and HO2⋅ in base_zeroNapMN and changes in case-1product relative to base_zeroNapMN. Daily relative changes in case-1product compared with base_zeroNapMN in (b) Shanghai and (c) Suzhou.
Accurate representation of Nap and MN sources and sinks in model simulations is crucial for comprehending the atmospheric oxidation capacity. The relative differences between base_zeroNapMN and case-1product were calculated to evaluate the effects of Nap, 1-MN, and 2-MN on O3, SOC, and radical concentrations. As shown in Fig. 5a, the SOC concentrations in the YRD increased by approximately 0.9 % on average, with the most significant change observed in areas with high emissions of Nap and MN, such as Shanghai and southern Jiangsu Province, reaching up to 1.7 %. The impact on O3 was relatively limited, with a maximum increase of 0.3 %, primarily attributed to Nap rather than MN (Fig. S11). Similar to SOC, the spatial distribution of O3 variations was consistent with that of Nap and MN emissions. By considering the oxidation of Nap and MN in the model, the HO2⋅ concentration was enhanced across the domain by up to 1.6 % (in Shanghai), likely due to the production of HO2⋅ through the reaction of Nap and MN with OH⋅. However, the variations in the OH⋅ concentration exhibited regional heterogeneity, with a maximum increase of 0.7 % in Shanghai and a maximum decrease of 0.3 % in Wenzhou. The areas with elevated OH⋅ coincided with the locations experiencing notable increases in O3. As an OH⋅ source in the troposphere, the photolysis of O3 produces electronically excited O(1D) atoms that react with water molecules to form fresh OH⋅ (Qin et al., 2022; Tan et al., 2019). Moreover, the areas with elevated OH⋅ also exhibited a significant increase in HO2⋅. This HO2⋅ can react with O3 or NO to produce OH⋅, thereby offsetting the OH⋅ consumption by Nap and MN oxidation (Zhu et al., 2020). In the areas with decreased OH⋅, the increases in O3 and HO2⋅ were insignificant, resulting in a reduced generation of OH⋅ to compensate for the OH⋅ consumption by Nap and MN. Similar to O3, variations in OH⋅ and HO2⋅ were primarily influenced by Nap rather than MN (Fig. S11).
To avoid obscuring the true magnitude by averaging over the entire episode, daily relative differences in SOC, O3, and radicals at the Shanghai and Suzhou sites, which exhibit significant variations, are shown in Fig. 5b and c. Overall, the influences of Nap and MN varied daily. At the Shanghai site, the most pronounced effects on OH⋅ and HO2⋅ were observed, with increases of up to 1.9 % and 3.8 %, respectively. At the Suzhou site, the maximum daily variations in OH⋅ and HO2⋅ (1.5 % and 2.9 %) were slightly lower than those in Shanghai. However, the daily SOC and O3 were elevated by up to 3.0 % and 1.1 % in Suzhou, respectively. It was found that both OH⋅ and HO2⋅ displayed bimodal variations at the two sites, with the most pronounced changes of 0.7 %–1.0 % and 1.6 %–2.2 % occurring in the morning, respectively (Fig. S12). The concentrations of SOC and O3 were elevated in the daytime, reaching peak increments of 2.1 %–2.3 % and 0.4 %–0.5 % at noon. Consequently, the influences of Nap and MN on SOC, O3, and the atmospheric oxidation capacity were substantial at the daily scale in those regions.
Our results revealed that the contributions of Nap and MN to the total aromatic emissions were minimal: 5.1 % in the YRD and 3.3 % at the Taizhou site. However, the SOC produced by Nap and MN accounted for 10.4 % of the total aromatic-derived SOC in the YRD and 10.9 % at the Taizhou site. Given the overestimation of other aromatic species in the current model (Table S4), the contributions of Nap and MN to aromatic SOC may be underestimated. After the inclusion of Nap and MN oxidation, Yu et al. (2021) demonstrated an augmented ratio of SOC derived from a yield method to the SOC estimated using the elemental carbon (EC) tracer method (from 25.3 % to 39.5 %) during the same episode at the Taizhou site. That is to say, Nap and MN contribute 35.9 % of the total SOC estimated using the SOA yield multiplied by the consumption of VOCs, which is higher than the value (10.9 %) in this study. Other field studies have also found significant SOA formation from Nap and MN among aromatics in the Pearl River Delta region (12.4 %) (Fang et al., 2021) and in Beijing during haze days (10.2±1.3 %) (Huang et al., 2019), with relatively smaller contributions (less than 2 % and 7 %, respectively) to emissions of aromatics. This study highlights the important roles of Nap and MN, which exhibit high SOA formation potentials with trace amounts emitted into the atmosphere. In addition, the average concentrations of Nap and MN in this study were 25 and 7 ppt during summer over the YRD region (Fig. S9), respectively. Previous studies have confirmed that the concentrations of Nap and MN exhibited seasonal variation, with maxima in winter and minima in summer, attributed to the increased heating and cooking activities in households during the cold season (Huang et al., 2019; Fang et al., 2021; Tang et al., 2020). Consequently, the ambient concentration of Nap and MN as well as the potential SOA production may be more severe in winter. Cleaner fuel types and household cleaning products are recommended for vehicular and domestic usage.
The improvement in simulation and assessment of Nap and MN chemistry is crucial. Firstly, the characterization of Nap and MN from local sources and additional field observations are indispensable to reduce the disparities between the modeled and observed Nap and MN concentrations. Secondly, the SOA parameterizations of Nap and MN, including the enthalpy of vaporization and SOA yields, are derived from limited chamber experiments and require further validation. Previous studies have reported that the SOA yields obtained from chamber studies were contingent on OH⋅ exposure, NOx levels, relative humidity, and seed particles, which may not represent the actual atmospheric conditions (Yu et al., 2021; Ling et al., 2022). Thirdly, chlorine radicals (Cl), NO3 radicals, and O3 also play an important role in the atmospheric reactions of Nap and MN (Wang et al., 2005; Cohan et al., 2013; Riva et al., 2015, 2014; Aleman, 2006); however, these were missing from the current study due to the lack of parameterization. The formation of gas- and particle-phase products through reactions between Cl atoms and Nap has been confirmed. For instance, chloronaphthalene and chloroacenaphthenone have been identified as potential SOA markers for the Cl-initiated oxidation of Nap in the ambient atmosphere (Riva et al., 2015). As important sources of Cl atoms, abundant nitryl chloride (ClNO2) and molecular chlorine (Cl2) are attributed to sea salt, coal combustion, biomass burning (Le Breton et al., 2018), and urban transport-related emissions (Li et al., 2021; Tham et al., 2014). Consequently, the Cl-initiated SOA formation process may be pronounced in specific regions, such as the marine boundary layer and industrial areas. Using the rate constant of Cl with Nap ((4.22±0.46) cm3 molecule−1 s−1) (Riva et al., 2014) and corresponding SOA yields (0.91±0.05) (Riva et al., 2015), which is up to 3 times higher than those determined from OH-initiated oxidation (Chan et al., 2009; Shakya and Griffin, 2010), we estimated the potential SOA formation from the reaction of Nap and Cl atoms via a yield method (Huang et al., 2019; Yu et al., 2021). Assuming a 12 h average daytime OH⋅ concentration of 2×10⁶ molecules cm−3 and a photooxidation age of 6 h, the SOA generated from Nap oxidation by Cl atoms can reach up to 56 % of that from the Nap + OH pathway in highly polluted regions with a Cl OH ratio greater than 0.8 (Choi et al., 2020). This suggests that the omission of Cl-initiated chemistry in this study might lead to an approximate 36 % underestimation of Nap-derived SOA. Given the underestimation of anthropogenic chlorine emissions in China (Choi et al., 2020; Li et al., 2021), further studies are recommended to estimate chlorine emissions with finer spatial resolution and the impacts on Nap SOA under atmospherically realistic conditions. Lastly, a precise depiction of Nap and MN chemistry is crucial for gaining a deeper understanding of the health implications of these noxious compounds. The health risks associated with inhalation exposure to outdoor Nap and other PAHs have been assessed by calculating the incremental lifetime cancer risk (ILCR) values in China and the United States (Han et al., 2020; Zhang et al., 2016). Nonetheless, there has been no systematic evaluation of the health risks resulting from exposure to PAH-derived SOA and by-products, despite previous studies verifying the toxicological impacts (e.g., oxidation potential, OP) of Nap-derived SOA (Wang et al., 2018; Tuet et al., 2017a, 2017b; Lima de Albuquerque et al., 2021). More precise measurements of the OP of different SOA components are needed to evaluate the overall oxidative potentials of ambient SOA. Future studies are needed to develop rational parameterization schemes for assessing the health risks associated with Nap- and MN-derived SOA.
In this study, we investigated the impacts of Nap, 1-MN, and 2-MN oxidation on the formation of SOC, O3, and radicals from 20 May to 18 June 2018, in the YRD using a revised CMAQ model and explicit emission inventories. The results of case-1product, using the adjusted emissions (emis-adjust) and a one-product method for fitting MN SOA, best captured the observed evolution of Nap (NMB =0.01) and MN (NMB ) when compared to the default case (NMB for Nap, NMB for MN). The primary sources of Nap and MN were transportation and residential sectors, resulting in a bimodal emission pattern. The concentrations of Nap and MN were lowest during the daytime, peaking in the morning and at night. Their SOC concentrations reached the maximum value during the daytime due to the photooxidation of Nap and MN and boundary layer evolution. Nap, 1-MN, and 2-MN exhibited the same trait of contributing more to aromatic-derived SOC than to emissions of aromatic hydrocarbons, especially for Nap. The average concentration of Nap was 25 ppt in the YRD, accounting for 4.1 % and 8.1 % (up to 12.6 %) of total aromatic emissions and aromatic-derived SOC, respectively. The concentrations of 1-MN and 2-MN were relatively low, with average values of 2 and 5 ppt, respectively. Together, they contributed only 2.4 % of the aromatic-derived SOC. At the regional scale, the impacts of Nap and MN oxidation on O3 and radical concentrations were limited. However, substantial increases still occurred in areas with high Nap and MN emissions, which cannot be ignored. The high SOA formation potentials of Nap and MN and their impacts on secondary pollutants highlight the importance of considering these IVOCs alongside traditional VOCs when implementing air pollution control policies, energy use strategies, and health risk evaluation.
The CMAQ source code is available from GitHub (https://www.github.com/USEPA/CMAQ, USEPA, 2023). The WRF source code can be downloaded from the model website (https://www.mmm.ucar.edu/models/wrf, UCAR, 2023). The MEGAN source code can be downloaded from the model website (https://bai.ess.uci.edu/megan/data-and-code/megan21, UCI BAI, 2023). MEIC emissions are available from the data website (http://www.meicmodel.org, MEIC, 2023). FINN data can be downloaded from the data archive (https://www.acom.ucar.edu/Data/fire/, Wiedinmyer, 2011). ERA5 reanalysis data are available from the data archive (https://www.ecmwf.int/en/forecasts/dataset/ecmwf-reanalysis-v5, ECMWF, 2023). The observations of O3, PM2.5, SO2, NO2, and CO are available from the National Real-Time Urban Air Quality Release Platform of China National Environmental Monitoring Centre (https://air.cnemc.cn:18007, last access: 17 May 2023).
The supplement related to this article is available online at: https://doi.org/10.5194/acp-24-7467-2024-supplement.
FY, JL, and JH designed the research and conducted the simulations. YG, HW, SG, and KL collected the observation data. JA and CH provided emission data. FY led data analysis and drafted the main text. JL, JH, and MQ analyzed the data. All authors contributed to interpreting the results and editing the original manuscript.
The contact author has declared that none of the authors has any competing interests.
Publisher's note: Copernicus Publications remains neutral with regard to jurisdictional claims made in the text, published maps, institutional affiliations, or any other geographical representation in this paper. While Copernicus Publications makes every effort to include appropriate place names, the final responsibility lies with the authors.
The authors would like to thank the REACH team members for investing their time and effort in this work.
This research has been supported by the National Key R&D Program of China (grant no. 2022YFE0136200) and the National Natural Science Foundation of China (grant no. 42077199).
This paper was edited by Minghuai Wang and reviewed by two anonymous referees.
Aleman, G.: The kinetics and mechanisms of chlorine atom reactions with alkylbenzenes and alkylnaphthalenes, M.S. thesis, California State University, Fullerton, 148 pp., 2006.
An, J., Huang, Y., Huang, C., Wang, X., Yan, R., Wang, Q., Wang, H., Jing, S., Zhang, Y., Liu, Y., Chen, Y., Xu, C., Qiao, L., Zhou, M., Zhu, S., Hu, Q., Lu, J., and Chen, C.: Emission inventory of air pollutants and chemical speciation for specific anthropogenic sources based on local measurements in the Yangtze River Delta region, China, Atmos. Chem. Phys., 21, 2003–2025, https://doi.org/10.5194/acp-21-2003-2021, 2021.
An, J., Huang, C., Huang, D., Qin, M., Liu, H., Yan, R., Qiao, L., Zhou, M., Li, Y., Zhu, S., Wang, Q., and Wang, H.: Sources of organic aerosols in eastern China: a modeling study with high-resolution intermediate-volatility and semivolatile organic compound emissions, Atmos. Chem. Phys., 23, 323–344, https://doi.org/10.5194/acp-23-323-2023, 2023.
Chan, A. W. H., Kautzman, K. E., Chhabra, P. S., Surratt, J. D., Chan, M. N., Crounse, J. D., Kürten, A., Wennberg, P. O., Flagan, R. C., and Seinfeld, J. H.: Secondary organic aerosol formation from photooxidation of naphthalene and alkylnaphthalenes: implications for oxidation of intermediate volatility organic compounds (IVOCs), Atmos. Chem. Phys., 9, 3049–3060, https://doi.org/10.5194/acp-9-3049-2009, 2009.
Chen, C.-L., Kacarab, M., Tang, P., and Cocker, D. R.: SOA formation from naphthalene, 1-methylnaphthalene, and 2-methylnaphthalene photooxidation, Atmos. Environ., 131, 424–433, https://doi.org/10.1016/j.atmosenv.2016.02.007, 2016.
Choi, M. S., Qiu, X., Zhang, J., Wang, S., Li, X., Sun, Y., Chen, J., and Ying, Q.: Study of Secondary Organic Aerosol Formation from Chlorine Radical-Initiated Oxidation of Volatile Organic Compounds in a Polluted Atmosphere Using a 3D Chemical Transport Model, Environ. Sci. Technol., 54, 13409–13418, https://doi.org/10.1021/acs.est.0c02958, 2020.
Cohan, A., Eiguren-Fernandez, A., Miguel, A. H., and Dabdub, D.: Secondary organic aerosol formation from naphthalene roadway emissions in the South Coast Air Basin of California, Int. J. Environ. Pollut., 52, 206–224, 2013.
ECMWF: ECMWF Reanalysis v5 (ERA5), https://www.ecmwf.int/en/forecasts/dataset/ecmwf-reanalysis-v5, last access: 1 June 2023.
Emery, C., Liu, Z., Russell, A. G., Odman, M. T., Yarwood, G., and Kumar, N.: Recommendations on statistics and benchmarks to assess photochemical model performance, J. Air Waste Manage. Assoc., 67, 582–598, https://doi.org/10.1080/10962247.2016.1265027, 2017.
Fang, H., Luo, S., Huang, X., Fu, X., Xiao, S., Zeng, J., Wang, J., Zhang, Y., and Wang, X.: Ambient naphthalene and methylnaphthalenes observed at an urban site in the Pearl River Delta region: Sources and contributions to secondary organic aerosol, Atmos. Environ., 252, 118295, https://doi.org/10.1016/j.atmosenv.2021.118295, 2021.
Gao, Y., Wang, H., Liu, Y., Zhang, X., Jing, S., Peng, Y., Huang, D., Li, X., Chen, S., Lou, S., Li, Y., and Huang, C.: Unexpected High Contribution of Residential Biomass Burning to Non-Methane Organic Gases (NMOGs) in the Yangtze River Delta Region of China, J. Geophys. Res.-Atmos., 127, e2021JD035050, https://doi.org/10.1029/2021jd035050, 2022.
Guenther, A. B., Jiang, X., Heald, C. L., Sakulyanontvittaya, T., Duhl, T., Emmons, L. K., and Wang, X.: The Model of Emissions of Gases and Aerosols from Nature version 2.1 (MEGAN2.1): an extended and updated framework for modeling biogenic emissions, Geosci. Model Dev., 5, 1471–1492, https://doi.org/10.5194/gmd-5-1471-2012, 2012.
Han, F., Guo, H., Hu, J., Zhang, J., Ying, Q., and Zhang, H.: Sources and health risks of ambient polycyclic aromatic hydrocarbons in China, Sci. Total Environ., 698, 134229, https://doi.org/10.1016/j.scitotenv.2019.134229, 2020.
Hayes, P. L., Carlton, A. G., Baker, K. R., Ahmadov, R., Washenfelder, R. A., Alvarez, S., Rappenglück, B., Gilman, J. B., Kuster, W. C., de Gouw, J. A., Zotter, P., Prévôt, A. S. H., Szidat, S., Kleindienst, T. E., Offenberg, J. H., Ma, P. K., and Jimenez, J. L.: Modeling the formation and aging of secondary organic aerosols in Los Angeles during CalNex 2010, Atmos. Chem. Phys., 15, 5773–5801, https://doi.org/10.5194/acp-15-5773-2015, 2015.
Hu, W., Zhou, H., Chen, W., Ye, Y., Pan, T., Wang, Y., Song, W., Zhang, H., Deng, W., Zhu, M., Wang, C., Wu, C., Ye, C., Wang, Z., Yuan, B., Huang, S., Shao, M., Peng, Z., Day, D. A., Campuzano-Jost, P., Lambe, A. T., Worsnop, D. R., Jimenez, J. L., and Wang, X.: Oxidation Flow Reactor Results in a Chinese Megacity Emphasize the Important Contribution of S/IVOCs to Ambient SOA Formation, Environ. Sci. Technol., 56, 6880–6893, https://doi.org/10.1021/acs.est.1c03155, 2022.
Huang, D. D., Kong, L., Gao, J., Lou, S., Qiao, L., Zhou, M., Ma, Y., Zhu, S., Wang, H., Chen, S., Zeng, L., and Huang, C.: Insights into the formation and properties of secondary organic aerosol at a background site in Yangtze River Delta region of China: Aqueous-phase processing vs. photochemical oxidation, Atmos. Environ., 239, 117716, https://doi.org/10.1016/j.atmosenv.2020.117716, 2020.
Huang, G., Liu, Y., Shao, M., Li, Y., Chen, Q., Zheng, Y., Wu, Z., Liu, Y., Wu, Y., Hu, M., Li, X., Lu, S., Wang, C., Liu, J., Zheng, M., and Zhu, T.: Potentially Important Contribution of Gas-Phase Oxidation of Naphthalene and Methylnaphthalene to Secondary Organic Aerosol during Haze Events in Beijing, Environ. Sci. Technol., 53, 1235–1244, https://doi.org/10.1021/acs.est.8b04523, 2019.
Le Breton, M., Hallquist, Å. M., Pathak, R. K., Simpson, D., Wang, Y., Johansson, J., Zheng, J., Yang, Y., Shang, D., Wang, H., Liu, Q., Chan, C., Wang, T., Bannan, T. J., Priestley, M., Percival, C. J., Shallcross, D. E., Lu, K., Guo, S., Hu, M., and Hallquist, M.: Chlorine oxidation of VOCs at a semi-rural site in Beijing: significant chlorine liberation from ClNO2 and subsequent gas- and particle-phase Cl–VOC production, Atmos. Chem. Phys., 18, 13013–13030, https://doi.org/10.5194/acp-18-13013-2018, 2018.
Li, J., Zhang, M., Wu, F., Sun, Y., and Tang, G.: Assessment of the impacts of aromatic VOC emissions and yields of SOA on SOA concentrations with the air quality model RAMS-CMAQ, Atmos. Environ., 158, 105–115, https://doi.org/10.1016/j.atmosenv.2017.03.035, 2017.
Li, J., Zhang, N., Wang, P., Choi, M., Ying, Q., Guo, S., Lu, K., Qiu, X., Wang, S., Hu, M., Zhang, Y., and Hu, J.: Impacts of chlorine chemistry and anthropogenic emissions on secondary pollutants in the Yangtze river delta region, Environ. Pollut., 287, 117624, https://doi.org/10.1016/j.envpol.2021.117624, 2021.
Li, L., Xie, F., Li, J., Gong, K., Xie, X., Qin, Y., Qin, M., and Hu, J.: Diagnostic analysis of regional ozone pollution in Yangtze River Delta, China: A case study in summer 2020, Sci. Total Environ., 812, 151511, https://doi.org/10.1016/j.scitotenv.2021.151511, 2022.
Li, M., Zhang, Q., Streets, D. G., He, K. B., Cheng, Y. F., Emmons, L. K., Huo, H., Kang, S. C., Lu, Z., Shao, M., Su, H., Yu, X., and Zhang, Y.: Mapping Asian anthropogenic emissions of non-methane volatile organic compounds to multiple chemical mechanisms, Atmos. Chem. Phys., 14, 5617–5638, https://doi.org/10.5194/acp-14-5617-2014, 2014.
Lima de Albuquerque, Y., Berger, E., Tomaz, S., George, C., and Géloën, A.: Evaluation of the Toxicity on Lung Cells of By-Products Present in Naphthalene Secondary Organic Aerosols, Life, 11, 319, https://doi.org/10.3390/life11040319, 2021.
Ling, Z., Wu, L., Wang, Y., Shao, M., Wang, X., and Huang, W.: Roles of semivolatile and intermediate-volatility organic compounds in secondary organic aerosol formation and its implication: A review, J. Environ. Sci., 114, 259–285, https://doi.org/10.1016/j.jes.2021.08.055, 2022.
Liu, T., Wang, X., Deng, W., Hu, Q., Ding, X., Zhang, Y., He, Q., Zhang, Z., Lü, S., Bi, X., Chen, J., and Yu, J.: Secondary organic aerosol formation from photochemical aging of light-duty gasoline vehicle exhausts in a smog chamber, Atmos. Chem. Phys., 15, 9049–9062, https://doi.org/10.5194/acp-15-9049-2015, 2015.
Majdi, M., Sartelet, K., Lanzafame, G. M., Couvidat, F., Kim, Y., Chrit, M., and Turquety, S.: Precursors and formation of secondary organic aerosols from wildfires in the Euro-Mediterranean region, Atmos. Chem. Phys., 19, 5543–5569, https://doi.org/10.5194/acp-19-5543-2019, 2019.
MEIC: MEICModel, http://www.meicmodel.org, last access: 1 June 2023.
Pye, H. O. and Pouliot, G. A.: Modeling the role of alkanes, polycyclic aromatic hydrocarbons, and their oligomers in secondary organic aerosol formation, Environ. Sci. Technol., 46, 6041–6047, https://doi.org/10.1021/es300409w, 2012.
Pye, H. O. T. and Seinfeld, J. H.: A global perspective on aerosol from low-volatility organic compounds, Atmos. Chem. Phys., 10, 4377–4401, https://doi.org/10.5194/acp-10-4377-2010, 2010.
Qin, M., Hu, A., Mao, J., Li, X., Sheng, L., Sun, J., Li, J., Wang, X., Zhang, Y., and Hu, J.: PM2.5 and O3 relationships affected by the atmospheric oxidizing capacity in the Yangtze River Delta, China, Sci. Total Environ., 810, 152268, https://doi.org/10.1016/j.scitotenv.2021.152268, 2022.
Riva, M., Healy, R. M., Flaud, P.-M., Perraudin, E., Wenger, J. C., and Villenave, E.: Kinetics of the Gas-Phase Reactions of Chlorine Atoms with Naphthalene, Acenaphthene, and Acenaphthylene, J. Phys. Chem. A, 118, 3535–3540, https://doi.org/10.1021/jp5009434, 2014.
Riva, M., Healy, R. M., Flaud, P.-M., Perraudin, E., Wenger, J. C., and Villenave, E.: Gas- and Particle-Phase Products from the Chlorine-Initiated Oxidation of Polycyclic Aromatic Hydrocarbons, J. Phys. Chem. A, 119, 11170–11181, https://doi.org/10.1021/acs.jpca.5b04610, 2015.
Robinson, A. L., Donahue, N. M., Shrivastava, M. K., Weitkamp, E. A., Sage, A. M., Grieshop, A. P., Lane, T. E., Pierce, J. R., and Pandis, S. N.: Rethinking organic aerosols: semivolatile emissions and photochemical aging, Science, 315, 1259–1262, https://doi.org/10.1126/science.1133061, 2007.
Shakya, K. M. and Griffin, R. J.: Secondary Organic Aerosol from Photooxidation of Polycyclic Aromatic Hydrocarbons, Environ. Sci. Technol., 44, 8134–8139, https://doi.org/10.1021/es1019417, 2010.
Tan, Z., Lu, K., Hofzumahaus, A., Fuchs, H., Bohn, B., Holland, F., Liu, Y., Rohrer, F., Shao, M., Sun, K., Wu, Y., Zeng, L., Zhang, Y., Zou, Q., Kiendler-Scharr, A., Wahner, A., and Zhang, Y.: Experimental budgets of OH, HO2, and RO2 radicals and implications for ozone formation in the Pearl River Delta in China 2014, Atmos. Chem. Phys., 19, 7129–7150, https://doi.org/10.5194/acp-19-7129-2019, 2019.
Tang, T., Cheng, Z., Xu, B., Zhang, B., Zhu, S., Cheng, H., Li, J., Chen, Y., and Zhang, G.: Triple Isotopes (δ13C, δ2H, and Δ14C) Compositions and Source Apportionment of Atmospheric Naphthalene: A Key Surrogate of Intermediate-Volatility Organic Compounds (IVOCs), Environ. Sci. Technol., 54, 5409–5418, https://doi.org/10.1021/acs.est.0c00075, 2020.
Tham, Y. J., Yan, C., Xue, L., Zha, Q., Wang, X., and Wang, T.: Presence of high nitryl chloride in Asian coastal environment and its impact on atmospheric photochemistry, Chin. Sci. Bull., 59, 356–359, https://doi.org/10.1007/s11434-013-0063-y, 2014.
Tuet, W. Y., Chen, Y., Fok, S., Gao, D., Weber, R. J., Champion, J. A., and Ng, N. L.: Chemical and cellular oxidant production induced by naphthalene secondary organic aerosol (SOA): effect of redox-active metals and photochemical aging, Sci. Rep., 7, 15157, https://doi.org/10.1038/s41598-017-15071-8, 2017a.
Tuet, W. Y., Chen, Y., Xu, L., Fok, S., Gao, D., Weber, R. J., and Ng, N. L.: Chemical oxidative potential of secondary organic aerosol (SOA) generated from the photooxidation of biogenic and anthropogenic volatile organic compounds, Atmos. Chem. Phys., 17, 839–853, https://doi.org/10.5194/acp-17-839-2017, 2017b.
UCAR: Weather Research & Forecasting Model (WRF), https://www.mmm.ucar.edu/models/wrf, last access: 1 June 2023.
UCI BAI: MEGAN21, https://bai.ess.uci.edu/megan/data-and-code/megan21 , last access: 1 June 2023.
USEPA: CMAQ, GitHub, https://github.com/USEPA/CMAQ, last access: 1 June 2023.
Wang, H., Chen, X., Lu, K., Hu, R., Li, Z., Wang, H., Ma, X., Yang, X., Chen, S., Dong, H., Liu, Y., Fang, X., Zeng, L., Hu, M., and Zhang, Y.: NO3 and N2O5 chemistry at a suburban site during the EXPLORE-YRD campaign in 2018, Atmos. Environ., 224, 117180, https://doi.org/10.1016/j.atmosenv.2019.117180, 2020.
Wang, L., Arey, J., and Atkinson, R.: Reactions of Chlorine Atoms with a Series of Aromatic Hydrocarbons, Environ. Sci. Technol., 39, 5302–5310, https://doi.org/10.1021/es0479437, 2005.
Wang, M., Chen, D., Xiao, M., Ye, Q., Stolzenburg, D., Hofbauer, V., Ye, P., Vogel, A. L., Mauldin, R. L., Amorim, A., Baccarini, A., Baumgartner, B., Brilke, S., Dada, L., Dias, A., Duplissy, J., Finkenzeller, H., Garmash, O., He, X.-C., Hoyle, C. R., Kim, C., Kvashnin, A., Lehtipalo, K., Fischer, L., Molteni, U., Petäjä, T., Pospisilova, V., Quéléver, L. L. J., Rissanen, M., Simon, M., Tauber, C., Tomé, A., Wagner, A. C., Weitz, L., Volkamer, R., Winkler, P. M., Kirkby, J., Worsnop, D. R., Kulmala, M., Baltensperger, U., Dommen, J., El-Haddad, I., and Donahue, N. M.: Photo-oxidation of Aromatic Hydrocarbons Produces Low-Volatility Organic Compounds, Environ. Sci. Technol., 54, 7911–7921, https://doi.org/10.1021/acs.est.0c02100, 2020.
Wang, S., Ye, J., Soong, R., Wu, B., Yu, L., Simpson, A. J., and Chan, A. W. H.: Relationship between chemical composition and oxidative potential of secondary organic aerosol from polycyclic aromatic hydrocarbons, Atmos. Chem. Phys., 18, 3987–4003, https://doi.org/10.5194/acp-18-3987-2018, 2018.
Wang, X., Li, L., Gong, K., Mao, J., Hu, J., Li, J., Liu, Z., Liao, H., Qiu, W., Yu, Y., Dong, H., Guo, S., Hu, M., Zeng, L., and Zhang, Y.: Modelling air quality during the EXPLORE-YRD campaign – Part I. Model performance evaluation and impacts of meteorological inputs and grid resolutions, Atmos. Environ., 246, 118131, https://doi.org/10.1016/j.atmosenv.2020.118131, 2021.
Wiedinmyer, C., Akagi, S. K., Yokelson, R. J., Emmons, L. K., Al-Saadi, J. A., Orlando, J. J., and Soja, A. J.: The Fire INventory from NCAR (FINN): a high resolution global model to estimate the emissions from open burning, Geosci. Model Dev., 4, 625–641, https://doi.org/10.5194/gmd-4-625-2011, 2011 (data available at: https://www.acom.ucar.edu/Data/fire/, last access: 1 June 2023).
Yu, Y., Wang, H., Wang, T., Song, K., Tan, T., Wan, Z., Gao, Y., Dong, H., Chen, S., Zeng, L., Hu, M., Wang, H., Lou, S., Zhu, W., and Guo, S.: Elucidating the importance of semi-volatile organic compounds to secondary organic aerosol formation at a regional site during the EXPLORE-YRD campaign, Atmos. Environ., 246, 118043, https://doi.org/10.1016/j.atmosenv.2020.118043, 2021.
Zhang, H. and Ying, Q.: Secondary organic aerosol formation and source apportionment in Southeast Texas, Atmos. Environ., 45, 3217–3227, https://doi.org/10.1016/j.atmosenv.2011.03.046, 2011.
Zhang, H. and Ying, Q.: Secondary organic aerosol from polycyclic aromatic hydrocarbons in Southeast Texas, Atmos. Environ., 55, 279–287, https://doi.org/10.1016/j.atmosenv.2012.03.043, 2012.
Zhang, J., Wang, P., Li, J., Mendola, P., Sherman, S., and Ying, Q.: Estimating population exposure to ambient polycyclic aromatic hydrocarbon in the United States – Part II: Source apportionment and cancer risk assessment, Environ. Int., 97, 163–170, https://doi.org/10.1016/j.envint.2016.08.024, 2016.
Zhang, Y. and Tao, S.: Global atmospheric emission inventory of polycyclic aromatic hydrocarbons (PAHs) for 2004, Atmos. Environ., 43, 812–819, https://doi.org/10.1016/j.atmosenv.2008.10.050, 2009.
Zhu, J., Wang, S., Wang, H., Jing, S., Lou, S., Saiz-Lopez, A., and Zhou, B.: Observationally constrained modeling of atmospheric oxidation capacity and photochemical reactivity in Shanghai, China, Atmos. Chem. Phys., 20, 1217–1232, https://doi.org/10.5194/acp-20-1217-2020, 2020.