the Creative Commons Attribution 4.0 License.
the Creative Commons Attribution 4.0 License.
 | 28 Jun 2024
Variability and long-term changes in tropical cold-point temperature and water vapor
Mona Zolghadrshojaee
Susann Tegtmeier
Sean M. Davis
Robin Pilch Kedzierski
The tropical tropopause layer (TTL) is the main gateway for air transiting from the troposphere to the stratosphere and therefore impacts the chemical composition of the stratosphere. In particular, the cold-point tropopause, where air parcels encounter their final dehydration, effectively controls the water vapor content of the lower stratosphere. Given the important role of stratospheric water vapor for the global energy budget, it is crucial to understand the long-term changes in cold-point temperature and their impact on water vapor trends.
Our study uses Global Navigation Satellite System – Radio Occultation (GNSS-RO) data to show that there has been no overall cooling trend of the TTL over the past 2 decades, in contrast to observations prior to 2000. Instead, the cold point is warming, with the strongest trends of up to 0.7 K per decade during boreal winter and spring. The cold-point warming shows longitudinal asymmetries, with the smallest warming over the central Pacific and the largest warming over the Atlantic. These asymmetries are anticorrelated with patterns of tropospheric temperature trends, and regions of strongest cold-point warming are found to show slight cooling trends in the upper troposphere. Overall, the here-identified warming of the cold point is consistent with model predictions under global climate change, which attribute the warming trends to radiative effects. The seasonal signals and zonal asymmetries of the cold-point temperature and height trends might be related to dynamical responses to enhanced upper-tropospheric heating, changing convection, or trends in the stratospheric circulation.
Water vapor observations in the TTL show mostly positive trends consistent with cold-point warming for 2004–2021. We find a decrease in the amplitude of the cold-point temperature seasonal cycle by ∼ 7 % driving a reduction in the seasonal cycle in 100 hPa water vapor by 5 %–6 %. Our analysis shows that this reduction in the seasonal cycle is transported upwards together with the seasonal anomalies and has reduced the amplitude of the well-known tape recorder over the last 2 decades.
- Article
(19726 KB) - Full-text XML
- BibTeX
- EndNote


The tropical tropopause layer (TTL) is the transition region between the turbulent, moist troposphere and the stable, dry stratosphere (Fueglistaler et al., 2009). The TTL acts as the main gateway for air entering the stratosphere and extends from the region of strong convective outflow near 12–14 km to the highest altitudes reached by convective overshooting events, around 18 km (e.g., Highwood and Hoskins, 1998; Folkins et al., 1999; Fueglistaler et al., 2009). In consequence, air masses in the TTL are controlled by numerous processes on a wide range of lengths and timescales and show dynamical and chemical properties of both the troposphere and the stratosphere. Monitoring long-term changes in the TTL is crucial as the interactions among circulation, convection, trace gases, clouds, and radiation make this region a key player in radiative forcing and chemistry–climate coupling (e.g., Mote et al., 1996; Holton and Gettelman, 2001; Fueglistaler et al., 2011; Randel and Jensen, 2013). Atmospheric radiative fluxes in the TTL are particularly sensitive to temperatures, water vapor concentrations, and the presence of thin cirrus clouds and convective anvils (Wang et al., 1996; Sassen et al., 2009; Riese et al., 2012). Theoretical arguments suggest that the TTL radiative balances can in turn impact altitudes of deep-convective outflow (Hartmann and Larson, 2002; Harrop and Hartmann, 2012).
An important characteristic of the TTL is the change in the negative vertical temperature gradient of the troposphere into the positive temperature gradient of the stratosphere. The vertical location of the temperature minimum is termed the cold-point tropopause (CPT; Highwood and Hoskins, 1998). Air parcels transitioning from the troposphere to the stratosphere encounter final dehydration at these minimum temperatures, and in consequence, the cold-point tropopause effectively controls the water vapor content of the lower stratosphere (Randel et al., 2004; Fueglistaler et al., 2009; Randel and Park, 2019). Stratospheric water vapor plays an important role in the global energy budget, with increasing stratospheric water vapor cooling the stratosphere and heating the troposphere (De F. Forster and Shine, 1999; Smith et al., 2001), and can impact stratospheric ozone loss (Vogel et al., 2011).
The temperature structure of the TTL is determined by the interplay of tropospheric and stratospheric processes. Ongoing strong convection across continents and the western Pacific Ocean contributes significantly to the convective equilibrium that governs the temperatures in the lower TTL. In particular, the connection between El Niño – Southern Oscillation (ENSO) and TTL temperatures via convective activities can cause large interannual variations in the latter (Yulaeva and Wallace, 1994). The enhancement of deep convection over the tropical west Pacific is caused by ENSO's negative phase (i.e., La Niña), which is accompanied by TTL cold anomalies right above (Gettelman et al., 2001). Similar TTL cold anomalies occur over the central Pacific during the positive phase (El Niño).
Conversely, the Brewer–Dobson circulation (BDC) with large-scale tropical upwelling, which keeps temperatures well below radiative equilibrium, affects lower-stratospheric temperatures. The BDC has a distinct annual cycle due to the seasonality of extratropical planetary wave driving, which imprints a pronounced seasonal cycle in upper TTL temperature. Significant interannual variations in upper TTL temperature are driven by the quasi-biennial oscillation (QBO; Baldwin et al., 2001), a descending pattern of alternating zonal winds. The QBO temperature variations oscillate between the easterly and westerly shear phases following thermal wind balance. Easterly wind shear results in increased upwelling and cold anomalies, while westerly wind shear results in decreased upwelling and warm anomalies (Plumb and Bell, 1982; Baldwin et al., 2001). If the QBO easterly phase occurs during boreal winter, seasonal mean deep convection over the western Pacific will be strengthened (Collimore et al., 2003; Liess and Geller, 2012), further amplifying the QBO cold anomalies in this region (Tegtmeier et al., 2020b). When compared to the equivalent stratospheric changes (± 4 K at 25 km), the QBO temperature signal in the TTL is relatively small (± 0.5 K at the CPT) and peaks between 10° N and 10° S (Randel and Wu, 2015).
Volcanic eruptions have long been recognized as major natural events capable of influencing global climate, including TTL temperature. For the three major volcanic eruptions that have occurred since the late 1950s, analysis of observational and reanalysis data has revealed warming signals in the tropical lower stratosphere (Free and Lanzante, 2009; Fujiwara et al., 2015) and upper TTL (e.g., Krüger et al., 2008; Fujiwara et al., 2015; Tegtmeier et al., 2020a)
Given the important role that the TTL plays in the climate system and the chemical composition of the stratosphere, it is crucial to understand long-term changes in TTL temperature. In particular, trends in the cold-point temperature are of interest since they can lead to changes in stratospheric water vapor. Long-term changes in the TTL temperatures are regulated by complex coupling of chemical, dynamic, and radiative processes (Fueglistaler et al., 2009; Grise and Thompson, 2013). Changes in greenhouse gas (GHG) concentrations (e.g., Xie et al., 2008), the strength of the BDC (e.g., Wang et al., 2013; Fu et al., 2015), convection (e.g., Nishimoto and Shiotani, 2012), and sea surface temperatures (SSTs; e.g., Hu et al., 2014) all have an impact on TTL temperatures. Among these factors, the SST and BDC changes as well as convective activities play a key role in the long-term cold-point temperature changes (e.g., Rosenlof and Reid, 2008; Xie et al., 2014).
Different data sources exist for deriving trends in TTL temperature. An extended satellite temperature record based on the Stratospheric Sounding Unit (SSU), the Advanced Microwave Sounding Unit-A (AMSU-A), the Microwave Limb Sounder (MLS), and the Sounding of the Atmosphere using Broadband Emission Radiometry (SABER) offers very good global coverage but relatively low vertical resolution (Maycock et al., 2018). The Global Navigation Satellite System – Radio Occultation (GNSS-RO) data also have very good global coverage and, in addition, offer a very high vertical resolution. GNSS-RO data are available for the period starting in 2002, thus restricting trend estimates to the last 20 years. TTL temperature measurements from radiosonde stations extend back in time much longer; however, climate records of radiosonde temperature often suffer from time-varying biases or inhomogeneities caused by changes in measurement practices (Seidel and Randel, 2006; Wang et al., 2012). Reanalyses offer TTL temperature records with different vertical resolutions (Tegtmeier et al., 2020a). While meteorological reanalysis data are often utilized as “stand-ins” for observations, trends in reanalysis fields can be impacted by spurious changes in the quality and quantity of the observations used as input data (e.g., Long et al., 2017).
Over the past several decades, the global mean stratosphere has cooled due to increasing GHGs and decreases in stratospheric ozone (e.g., Maycock et al., 2018). The onset of ozone recovery in the late 1990s has led to a reduction in ozone-induced cooling, with weaker stratospheric cooling trends observed during 1998–2016 compared to 1979–1997. The troposphere, on the other hand, is warming due to the increasing GHGs. Amplified warming of the upper tropical troposphere compared to the surface (Santer et al., 2005), the so-called tropical amplification, is driven by convective process and water vapor feedback as well as oceanic dynamical processes and heat storage (e.g., Song et al., 2014; Li et al., 2019). Trends in TTL temperature vary between cooling and warming depending on the time period, season, and region considered. Data from two reanalyses for 1979–2014 suggest zonally asymmetric cold-point temperature trends with positive trends of 0.22 K per decade over the tropical central and eastern Pacific and negative trends of −0.08 K per decade throughout the remaining tropical regions (Hu et al., 2016). Zonal mean temperature trends from five reanalyses over the 1979–2005 period suggest a small but substantial cooling of −0.3 to −0.6 K per decade at 100 hPa and at the cold point, which are statistically compatible with trends based on the adjusted radiosonde datasets (Tegtmeier et al., 2020a). Based on Microwave Sounding Unit (MSU) and AMSU satellite records, Garfinkel et al. (2013) showed that there has been a strong warming trend in the tropical upper troposphere near the Indo-Pacific warm pool, while the trends in the western and central Pacific are much weaker. They found these patterns to be opposite to the lower-stratosphere trends, where the cooling trend is strongest over the Indo-Pacific warm pool and weaker over western and central Pacific waters. GNSS-RO data available for the last 2 decades have revealed a continued strong upper-tropospheric warming extending into the lower tropical stratosphere (Ladstädter et al., 2023).
Water vapor measurements in the upper troposphere and lower stratosphere are available from the MLS at near-global coverage starting in 2004. The Stratospheric Water and OzOne Satellite Homogenized (SWOOSH) dataset combines water vapor data from multiple instruments (Davis et al., 2016). Based on these two datasets, a significant moistening of the stratosphere was found starting in 2002, with relatively high values persisting over the last decade (Konopka et al., 2022). This moistening is prominent in late boreal winter and spring and shows a clear hemispheric asymmetry, with the largest positive values in the Northern Hemisphere and negative trends in the polar Southern Hemisphere. The eruption of the Hunga Tonga–Hunga Ha'apai volcano (Tonga) in January 2022 resulted in a substantial injection of water vapor directly into the upper atmosphere (Millán et al., 2022; Vömel et al., 2022), which impacted estimates of stratospheric water vapor trends that go beyond the end of 2021.
Here, we update available long-term trends of cold-point tropopause temperatures from GNSS-RO data and of stratospheric water vapor from MLS and SWOOSH data. We investigate spatial and seasonal patterns of the cold-point temperature trends and their relation to tropospheric and stratospheric changes in Sect. 3. The impact of the seasonality of the cold-point temperature trends on the seasonality of water vapor trends and specifically on the tape recorder signal are presented in Sect. 4. Datasets and methodology are introduced in Sect. 2, and a discussion and summary of the results are provided in Sect. 5.
2.1 GNSS-RO temperature data
The radio occultation (RO) data derived from the Global Navigation Satellite System (GNSS) exhibit widespread coverage, remain unaffected by clouds and precipitation, and boast exceptional vertical resolution and accuracy, as highlighted by Kursinski et al. (1997). GNSS-RO measurements are obtained when a satellite in a low Earth orbit (LEO) measures the Doppler shift in the radio signal emitted by GNSS satellites after it travels through the Earth's atmosphere, which slightly bends the signal's path due to its refractivity gradients. The relative motion between LEO and GNSS satellite orbits enables a vertical scan of the atmosphere. In the upper troposphere and stratosphere, the high-resolution refractivity profile is effectively a function of pressure and temperature, while humidity is increasingly important lower down. The vertical resolution of GNSS-RO temperature data is variable, ranging from ∼ 1 km in regions of constant stratification down to 100–200 m where the biggest stratification gradients occur, e.g., at a very sharp tropopause (Gorbunov et al., 2004). In this study, we leverage GNSS-RO measurements collected from various satellite missions, including the CHAllenging Minisatellite Payload (CHAMP; Wickert et al., 2001); Constellation Observing System for Meteorology, Ionosphere, and Climate (COSMIC; Anthes et al., 2008); Gravity Recovery and Climate Experiment (GRACE; Beyerle et al., 2005); Meteorological Operational satellite (MetOp-A; Von Engeln et al., 2011) and successive MetOp-B, MetOp-C, and Satélite de Aplicaciones Científicas-C/Scientific Application Satellite-C (SAC-C) (Hajj et al., 2004); TerraSAR-X (Beyerle et al., 2011); and Korean Multi-purpose Satellite-5 (KOMPSAT-5; Bowler, 2018).
The dataset employed in this analysis represents an updated version of the data used in Tegtmeier et al. (2020a). Specifically, we utilize a dataset encompassing monthly mean CPT temperature, height, and pressure data, along with temperature values at various pressure levels (30, 50, 60, 70, 100, 150, 200, 300, and 400 hPa). These data are sourced from all GNSS-RO missions and are spatially gridded on a 30° × 10° longitude–latitude grid between 30° N and 30° S, covering the period from 2002 until October 2022.
2.2 MLS water vapor data
The Microwave Limb Sounder (MLS) instrument on board the Aura spacecraft is a part of NASA's Earth Observing System (EOS) platform launched in 2004. MLS uses the microwave limb sounding technique to measure vertical profiles of many atmospheric constituents from the upper troposphere through the mesosphere (Waters et al., 2006). In this study, we use MLS/Aura level 3 monthly binned water vapor (H2O) mixing ratios, data version 5.1 (Livesey et al., 2022) during 2004–2021. The spatial coverage is near-global (82° N to 82° S) at a resolution of 4° latitude by 5° longitude. A recently identified drift in the MLS v4 H2O has been corrected in version 5, and as a result, the MLS v5 H2O record shows no statistically significant drifts compared to the Atmospheric Chemistry Experiment – Fourier Transform Spectrometer (ACE-FTS) and reduced drifts when compared to balloon-borne frost point hygrometer measurements (Livesey et al., 2021). We omit data after the end of 2021 to avoid the long-term changes being impacted by the anomalous entrainment of water vapor from the Hunga Tonga–Hunga Ha'apai eruption.
2.3 SWOOSH water vapor data
The Stratospheric Water and OzOne Satellite Homogenized (SWOOSH) v2.7 dataset is a merged record of stratospheric ozone and water vapor measurements taken by a number of limb sounding and solar occultation satellites over the previous ∼ 30 years (Davis et al., 2016). The SWOOSH record spans 1984 to the present and is comprised of data from the Stratospheric Aerosol and Gas Experiment-II/III (SAGE-II/III), the Upper-Atmosphere Research Satellite Halogen Occultation Experiment (UARS HALOE), UARS MLS, ACE-FTS, the Ozone Mapping and Profiler Suite – Limb Profiler (OMPS-LP), SAGE III/ISS, and Aura MLS instruments (v5.1). The measurements are homogenized by applying corrections that are calculated from data taken during time periods of instrument overlap. The SWOOSH data product consists of monthly mean zonal mean values on a pressure grid at a resolution of 5° latitude by 20° longitude.
2.4 Regression method
In order to isolate tropospheric and stratospheric drivers of TTL temperature variability from long-term changes, a multiple linear regression analysis was used. The regression was applied to the CPT, 30, 50, 60, 70, 100, 150, 200, 300, and 400 hPa time series of deseasonalized monthly mean temperature anomalies for each 30° × 10° grid cell and for tropical mean values. The analysis isolates the linear long-term changes from temperature variability driven by QBO, ENSO, and the stratospheric aerosol optical depth (SAOD) based on the regression described in Eq. (1).
where T(t) are the temperature anomalies and ϵ(t) are the residuals. The output of the regression provides the linear trend in the form of the regression coefficient B. The QBO1(t) and QBO2(t) terms are orthogonal time series representing QBO variations constructed as the first two empirical orthogonal functions of the Freie Universität Berlin (FUB) radiosonde stratospheric winds (Naujokat, 1986; Wallace et al., 1993). ENSO(t) is the multivariate ENSO index (https://www.esrl.noaa.gov/psd/enso/mei/, last access: 19 June 2024.), and SAOD(t) is the detrended stratospheric aerosol optical depth from the Global Space-based Stratospheric Aerosol Climatology (Thomason et al., 2018). Significance is tested based on a two-tailed Student t test with a 95 % confidence interval.
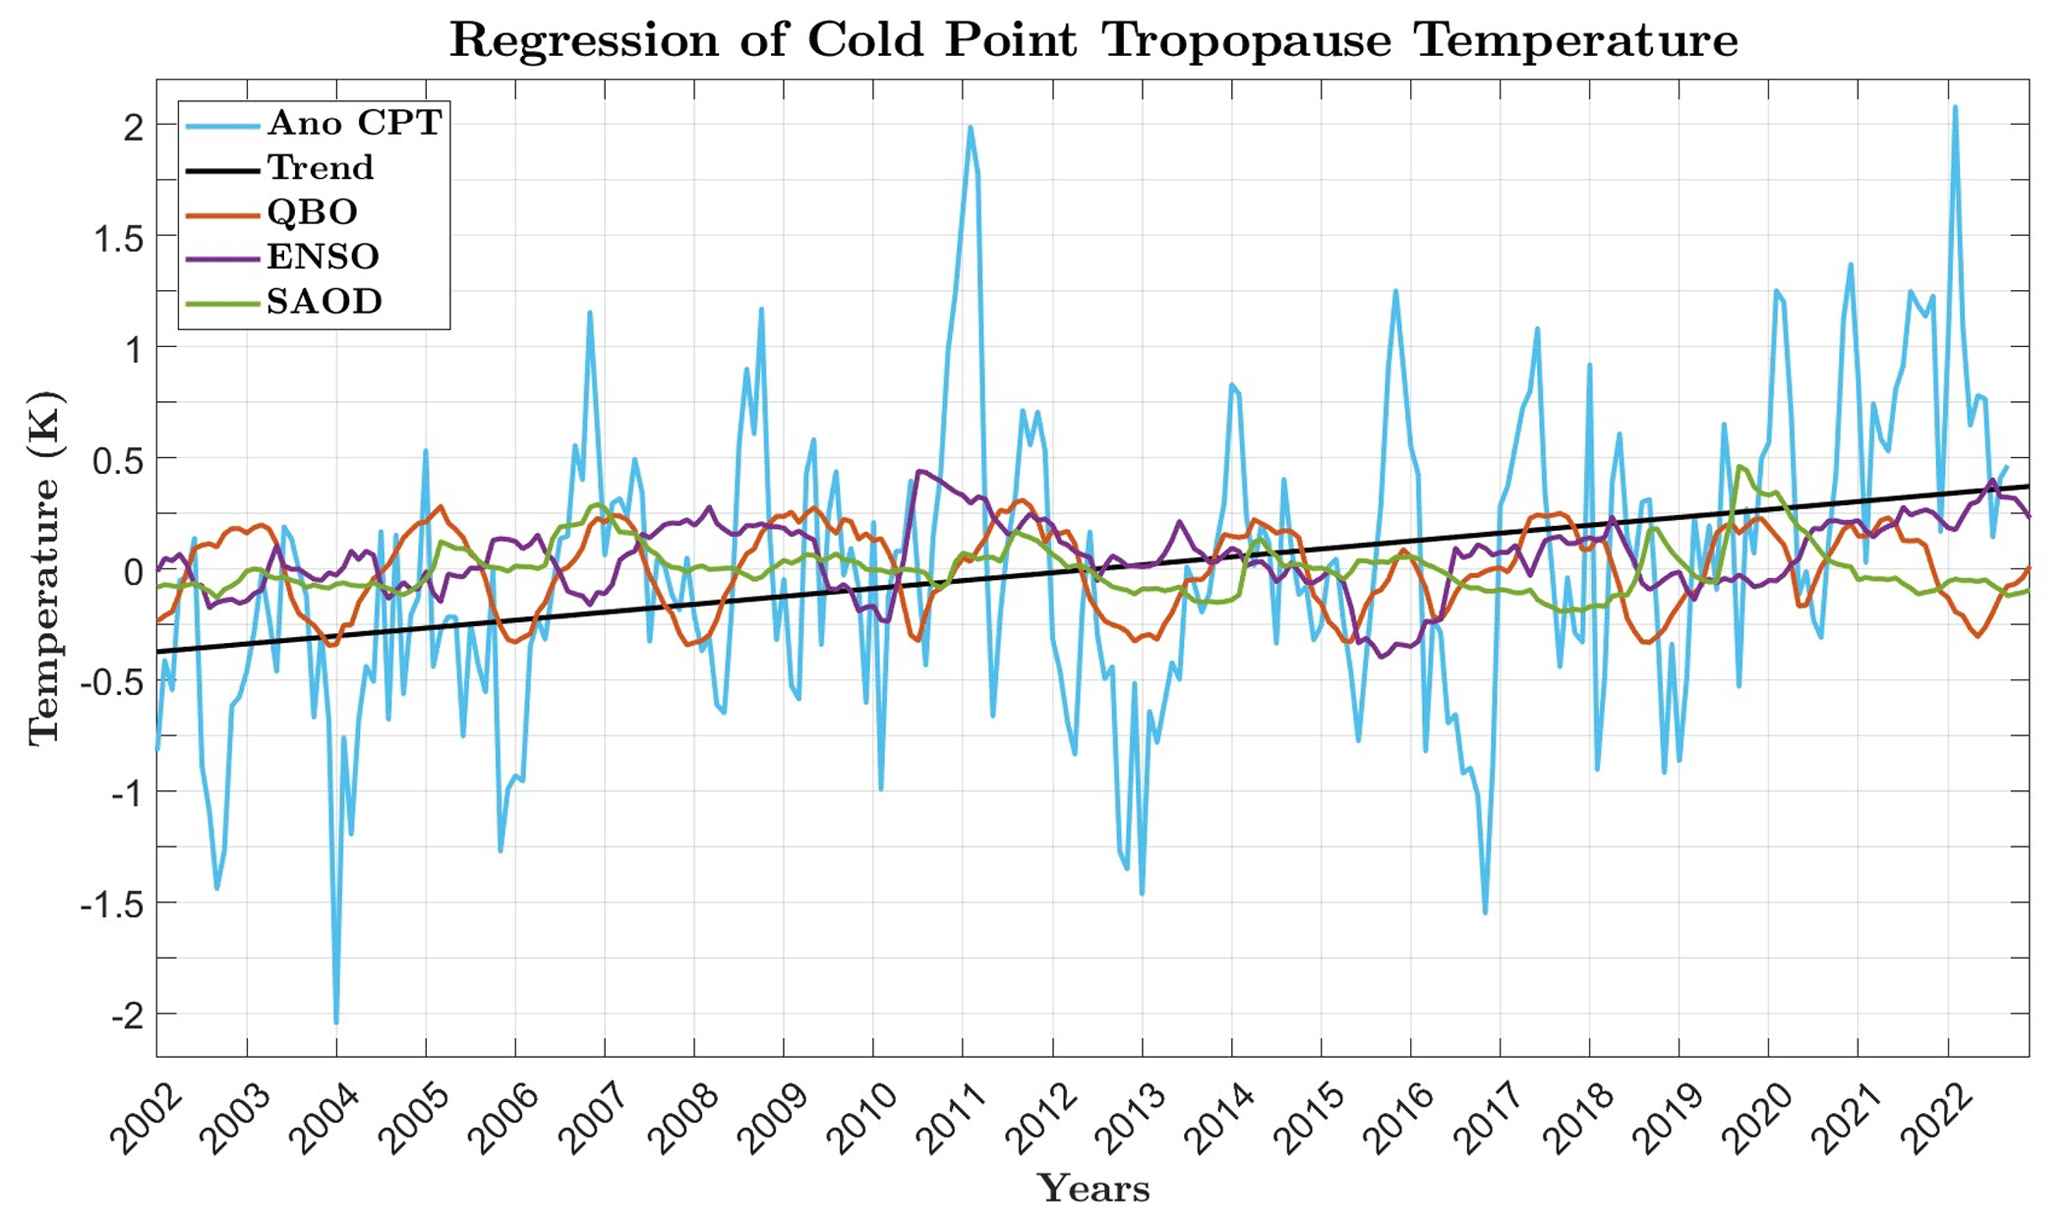
Figure 1Tropical mean (20° N–20° S) deseasonalized cold-point tropopause (CPT) temperature anomalies (Ano CPT), regression terms (QBO, ENSO, and SAOD), and the linear trend based on GNSS-RO data.
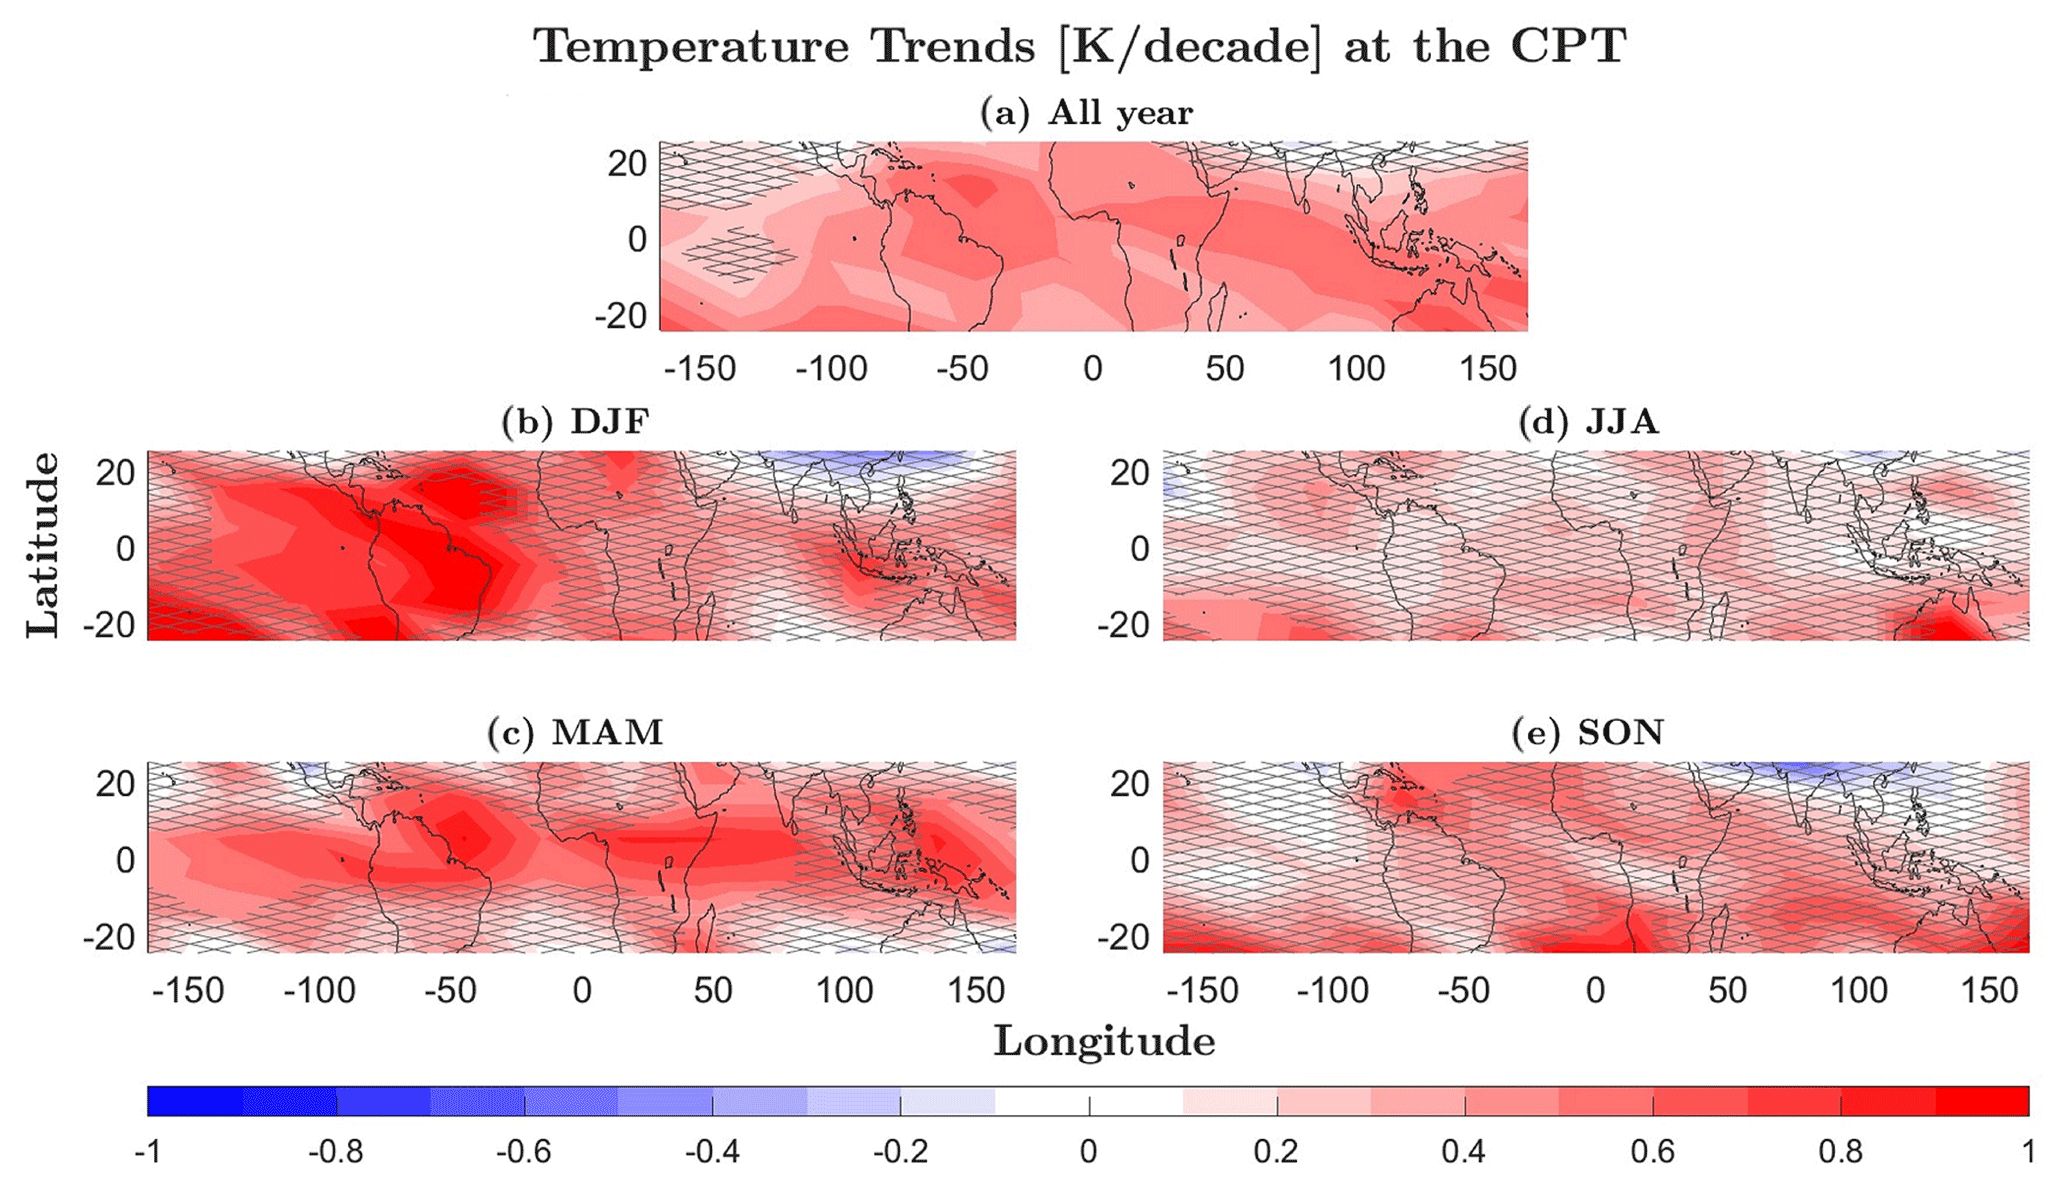
Figure 2Long-term (2002–2022) temperature trends (K per decade) of the cold-point tropopause (CPT) based on the GNSS-RO dataset for the monthly mean (a) and seasonal mean (b–e) time series. Trends not significant at the 95 % confidence level are marked with grey cross-hatching.
The long-term change in tropical mean CPT temperature has been calculated for the GNSS-RO 2002–2022 data (Fig. 1) by applying the multiple linear regression described in Sect. 2.4. The deseasonalized temperature anomalies (blue line) used as input data for the regression analysis exhibit strong interannual variations, with a range of approximately ± 2 K. The R-squared value of 0.3 indicates that approximately 30 % of the variability in CPT temperature variations can be explained by the long-term trend, QBO, ENSO, and SAOD. The QBO results in periodic oscillations in CPT temperature, albeit with a relatively modest magnitude (reddish line). ENSO variations in TTL temperature are slightly larger (purple line), showing warm anomalies that often but not always coincide with positive ENSO phases (e.g., 2011 and 2021–2022). The fluctuations in SAOD are relatively minor. After taking into account these factors, the regression suggests a positive linear trend (black line) of 0.36 ± 0.06 K per decade. It should be emphasized that the substantial residuals (not shown here) indicate a significant portion of variability of around 70 % that cannot be accounted for by the prescribed regressors. This variability may arise from non-linear processes or processes not captured by the proxies, such as fluctuations in tropical upwelling with the BDC due to extratropical wave driving and changes in convective activity not associated with ENSO.
In the second step, spatial and seasonal patterns of CPT temperature trends have been analyzed based on the regression analysis applied to seasonal and monthly temperature time series at each grid point. The findings, depicted in Fig. 2, indicate that over the past 2 decades, there has been no overall cooling trend in the CPT, in contrast to observations prior to 2000 (e.g., Randel et al., 2006; Rosenlof and Reid, 2008). For the full monthly mean time series, clear warming of the CPT with the strongest and most significant trends of up to 0.71 K per decade over the tropical regions of South America, the Atlantic, Africa, the Indian Ocean, and Australia can be observed (Fig. 2a). Temperature trends minimize to around zero over the central Pacific region.
Seasonal mean CPT temperature trends (Fig. 2b–e) are similar to trends based on the full time series. Temperature changes in the Northern Hemisphere (NH) winter (December, January, and February, DJF), spring (March, April, and May, MAM), summer (June, July, and August, JJA), and fall (September, October, and November, SON) indicate prevalent CPT warming across the tropics. The warming is especially pronounced over the tropical Atlantic and South America in NH winter and spring (up to 1.13 K per decade) as well as central Africa and the Maritime Continent in NH spring (up to 0.91 K per decade). During NH summer and fall, the cold-point tropopause shows weak and nonsignificant warming trends except for Australia, which shows significant cold-point warming (up to 1.25 K per decade). Similar results are found for NH fall, with mostly nonsignificant cold-point trends except for warming over the Atlantic (up to 0.94 K per decade).
Trends of cold-point height and pressure can be expected to be linked to long-term changes in CPT temperature. A comparison of the seasonal trends in CPT temperature (Fig. 2b–e), height (Fig. 3a–d), and pressure (Fig. 3e–h) reveals a noteworthy consistency in the seasonality of the signals. Seasons with the strongest warming (DJF and MAM) show a decrease in CPT height (up to −0.12 km per decade) and an increase in CPT pressure (up to 2.4 hPa per decade). Regional patterns between temperature and height trends are similar for MAM but less so for DJF. However, these trends in cold-point pressure and specifically in cold-point height are significant only over a few smaller regions. During NH summer and fall, most regions experience a rise in the CPT (positive trend in height and negative trend in pressure), while temperature shows weak warming trends.
The investigation of the seasonal cycle and the vertical structure of TTL temperature trends over 20° N–20° S highlights discernible patterns (Fig. 4). Overall, the well-known upper-tropospheric warming extends into the lower stratosphere up to 80 hPa during the NH spring and summer, to 50 hPa during NH winter, and all the way up to 30 hPa during October. Temperature trends at the cold point show a clear seasonal cycle, with a pronounced warming during boreal winter and spring and weaker, nonsignificant warming for the rest of the year. For the upper troposphere, the seasonal cycle of the temperature trends is nearly opposite to that of the CP, with largest warming during NH late summer and winter.
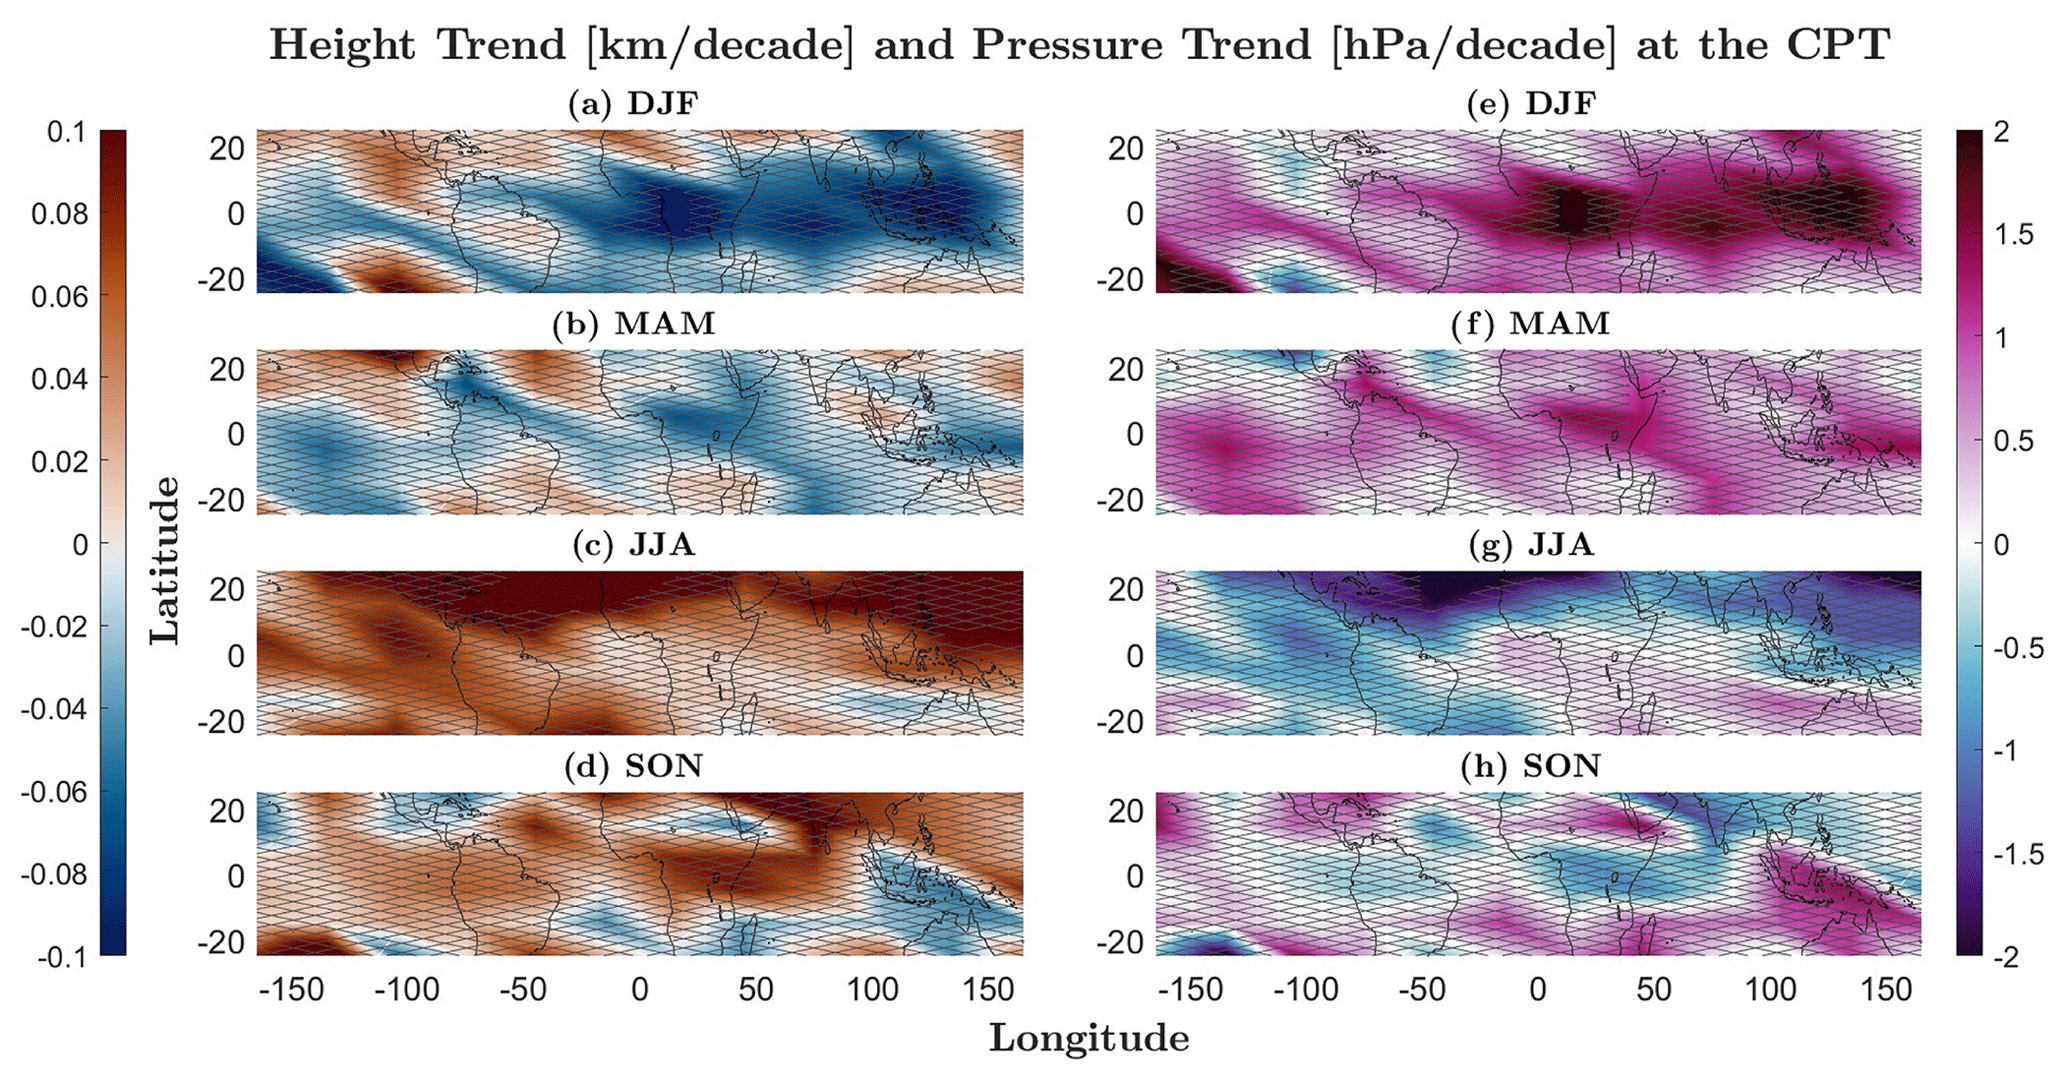
Figure 3Long-term (2002–2022) height (km per decade; a–d) and pressure (hPa per decade; e–h) trends of the cold-point tropopause (CPT) based on GNSS-RO data for seasonal mean time series. Trends not significant at the 95 % confidence level are marked with grey cross-hatching.
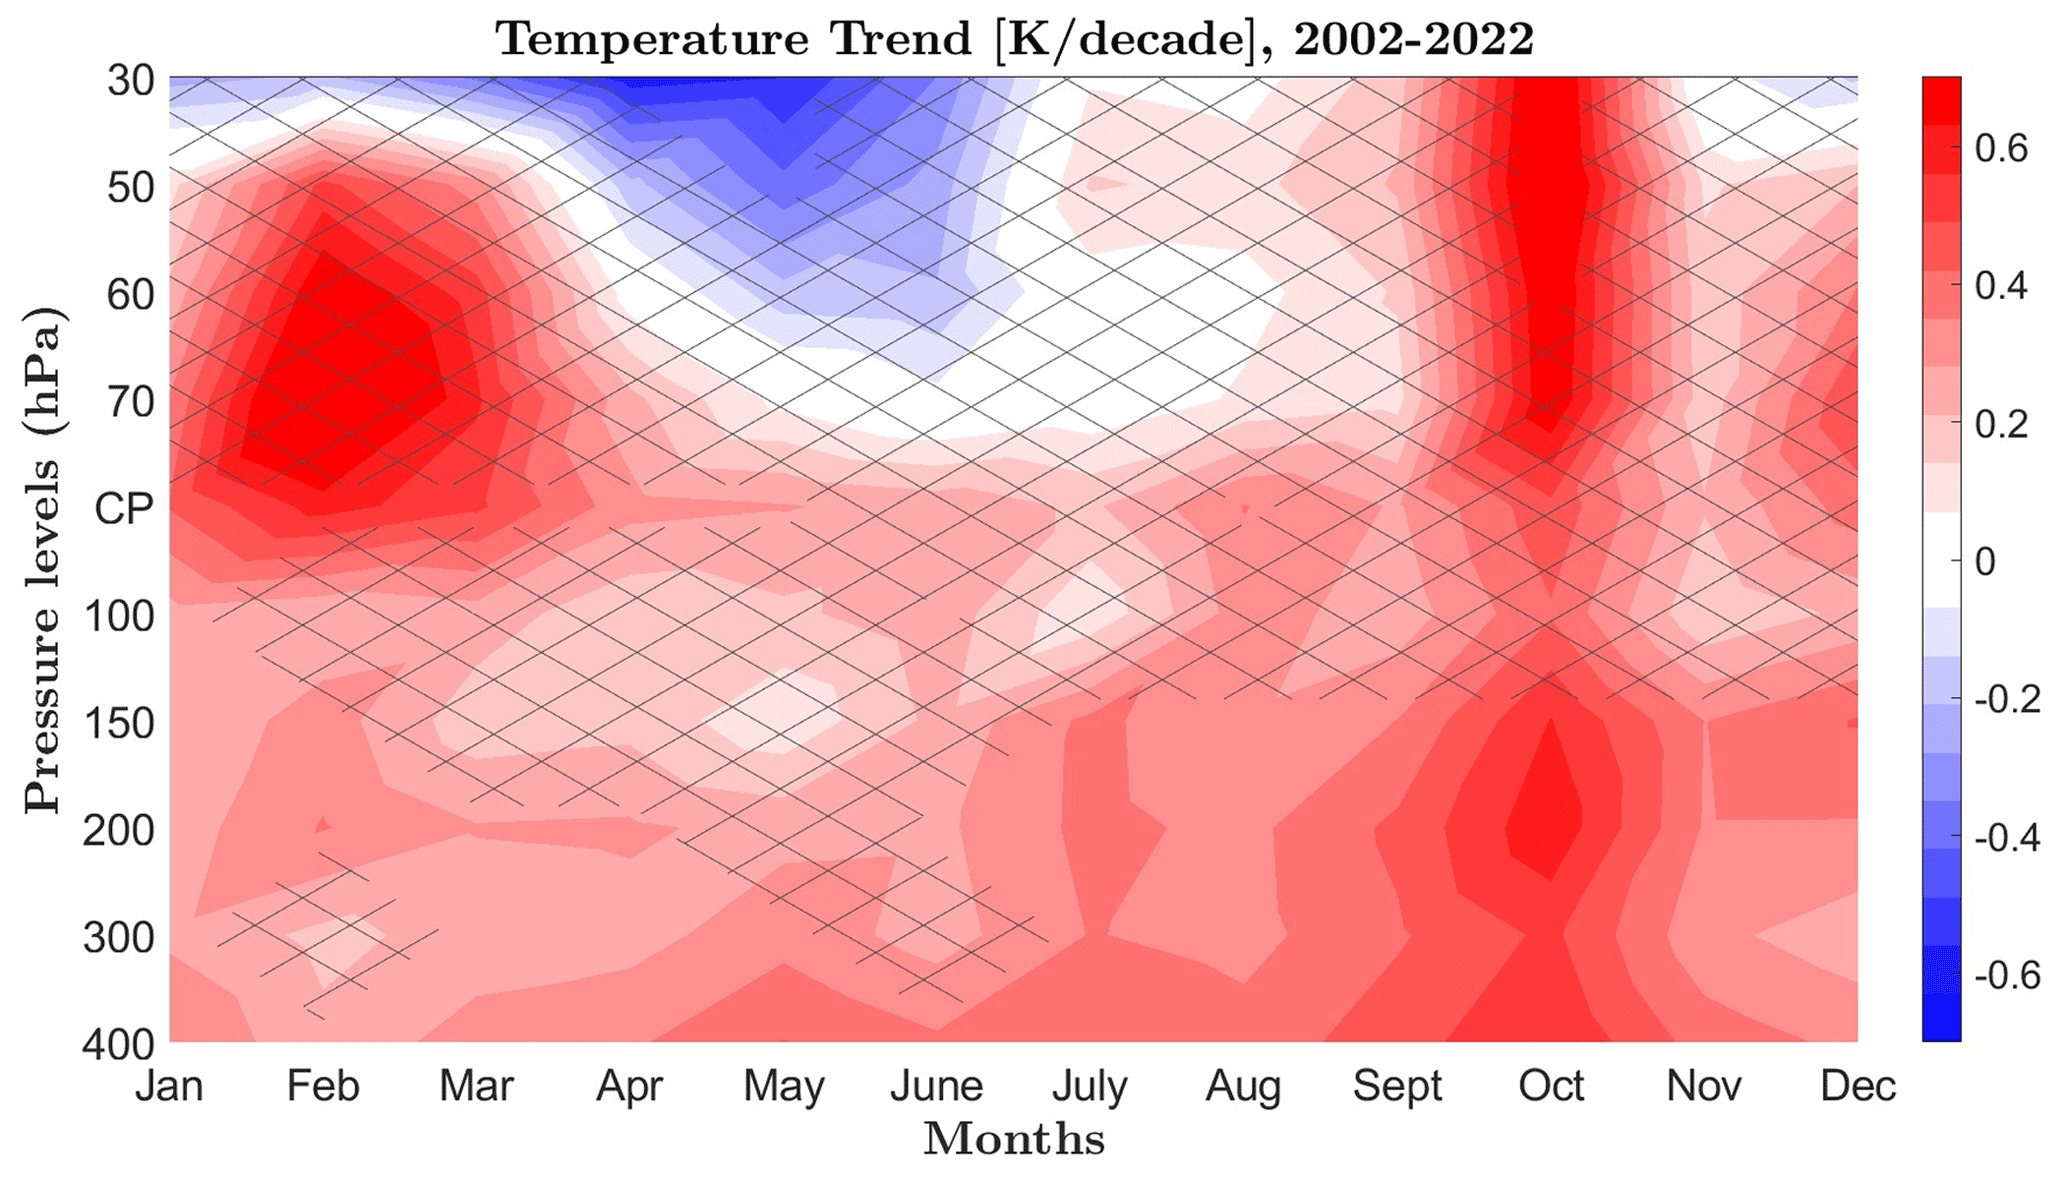
Figure 4The 2002–2022 seasonal cycle of temperature trends (K per decade) at the cold point (CP) and different pressure levels based on GNSS-RO data (20° N–20° S). Trends not significant at the 95 % confidence level are marked with crosses.
The connections between temperature trends at the cold-point trends and in the lower stratosphere and upper troposphere (at fixed pressure levels at 30, 50, 70,100, 200, 300, and 400 hPa) are analyzed by comparing their spatial patterns (Fig. 5). Focusing on boreal winter trends at various pressure levels, the findings highlight a notable pattern: in regions where the cold point exhibits the strongest warming (specifically, the tropical Atlantic and South America), temperatures in the upper troposphere (400 and 300 hPa) experience a slight cooling trend, although this lower-level cooling trend is not statistically significant. Conversely, regions characterized by weaker and nonsignificant cold-point cooling such as parts of east Asia demonstrate substantial warming in the upper troposphere. Such reversed dipole patterns are also observed during the boreal fall season when the cold point shows some local cooling over the tropical east Pacific and east Asia (Fig. 5, approximately 90–140° E and 10° N). This cooling is also evident at 70 and 100 hPa, while in the upper troposphere at 300 and 400 hPa, the same regions show the strongest warming trends. During MAM and JJA, the observed trends do not exhibit significant dipole patterns or clear trend reversals between the CP and the upper troposphere. Instead, these seasons predominantly display warming trends across most tropical regions and all levels between CP and 400 hPa (not shown here).
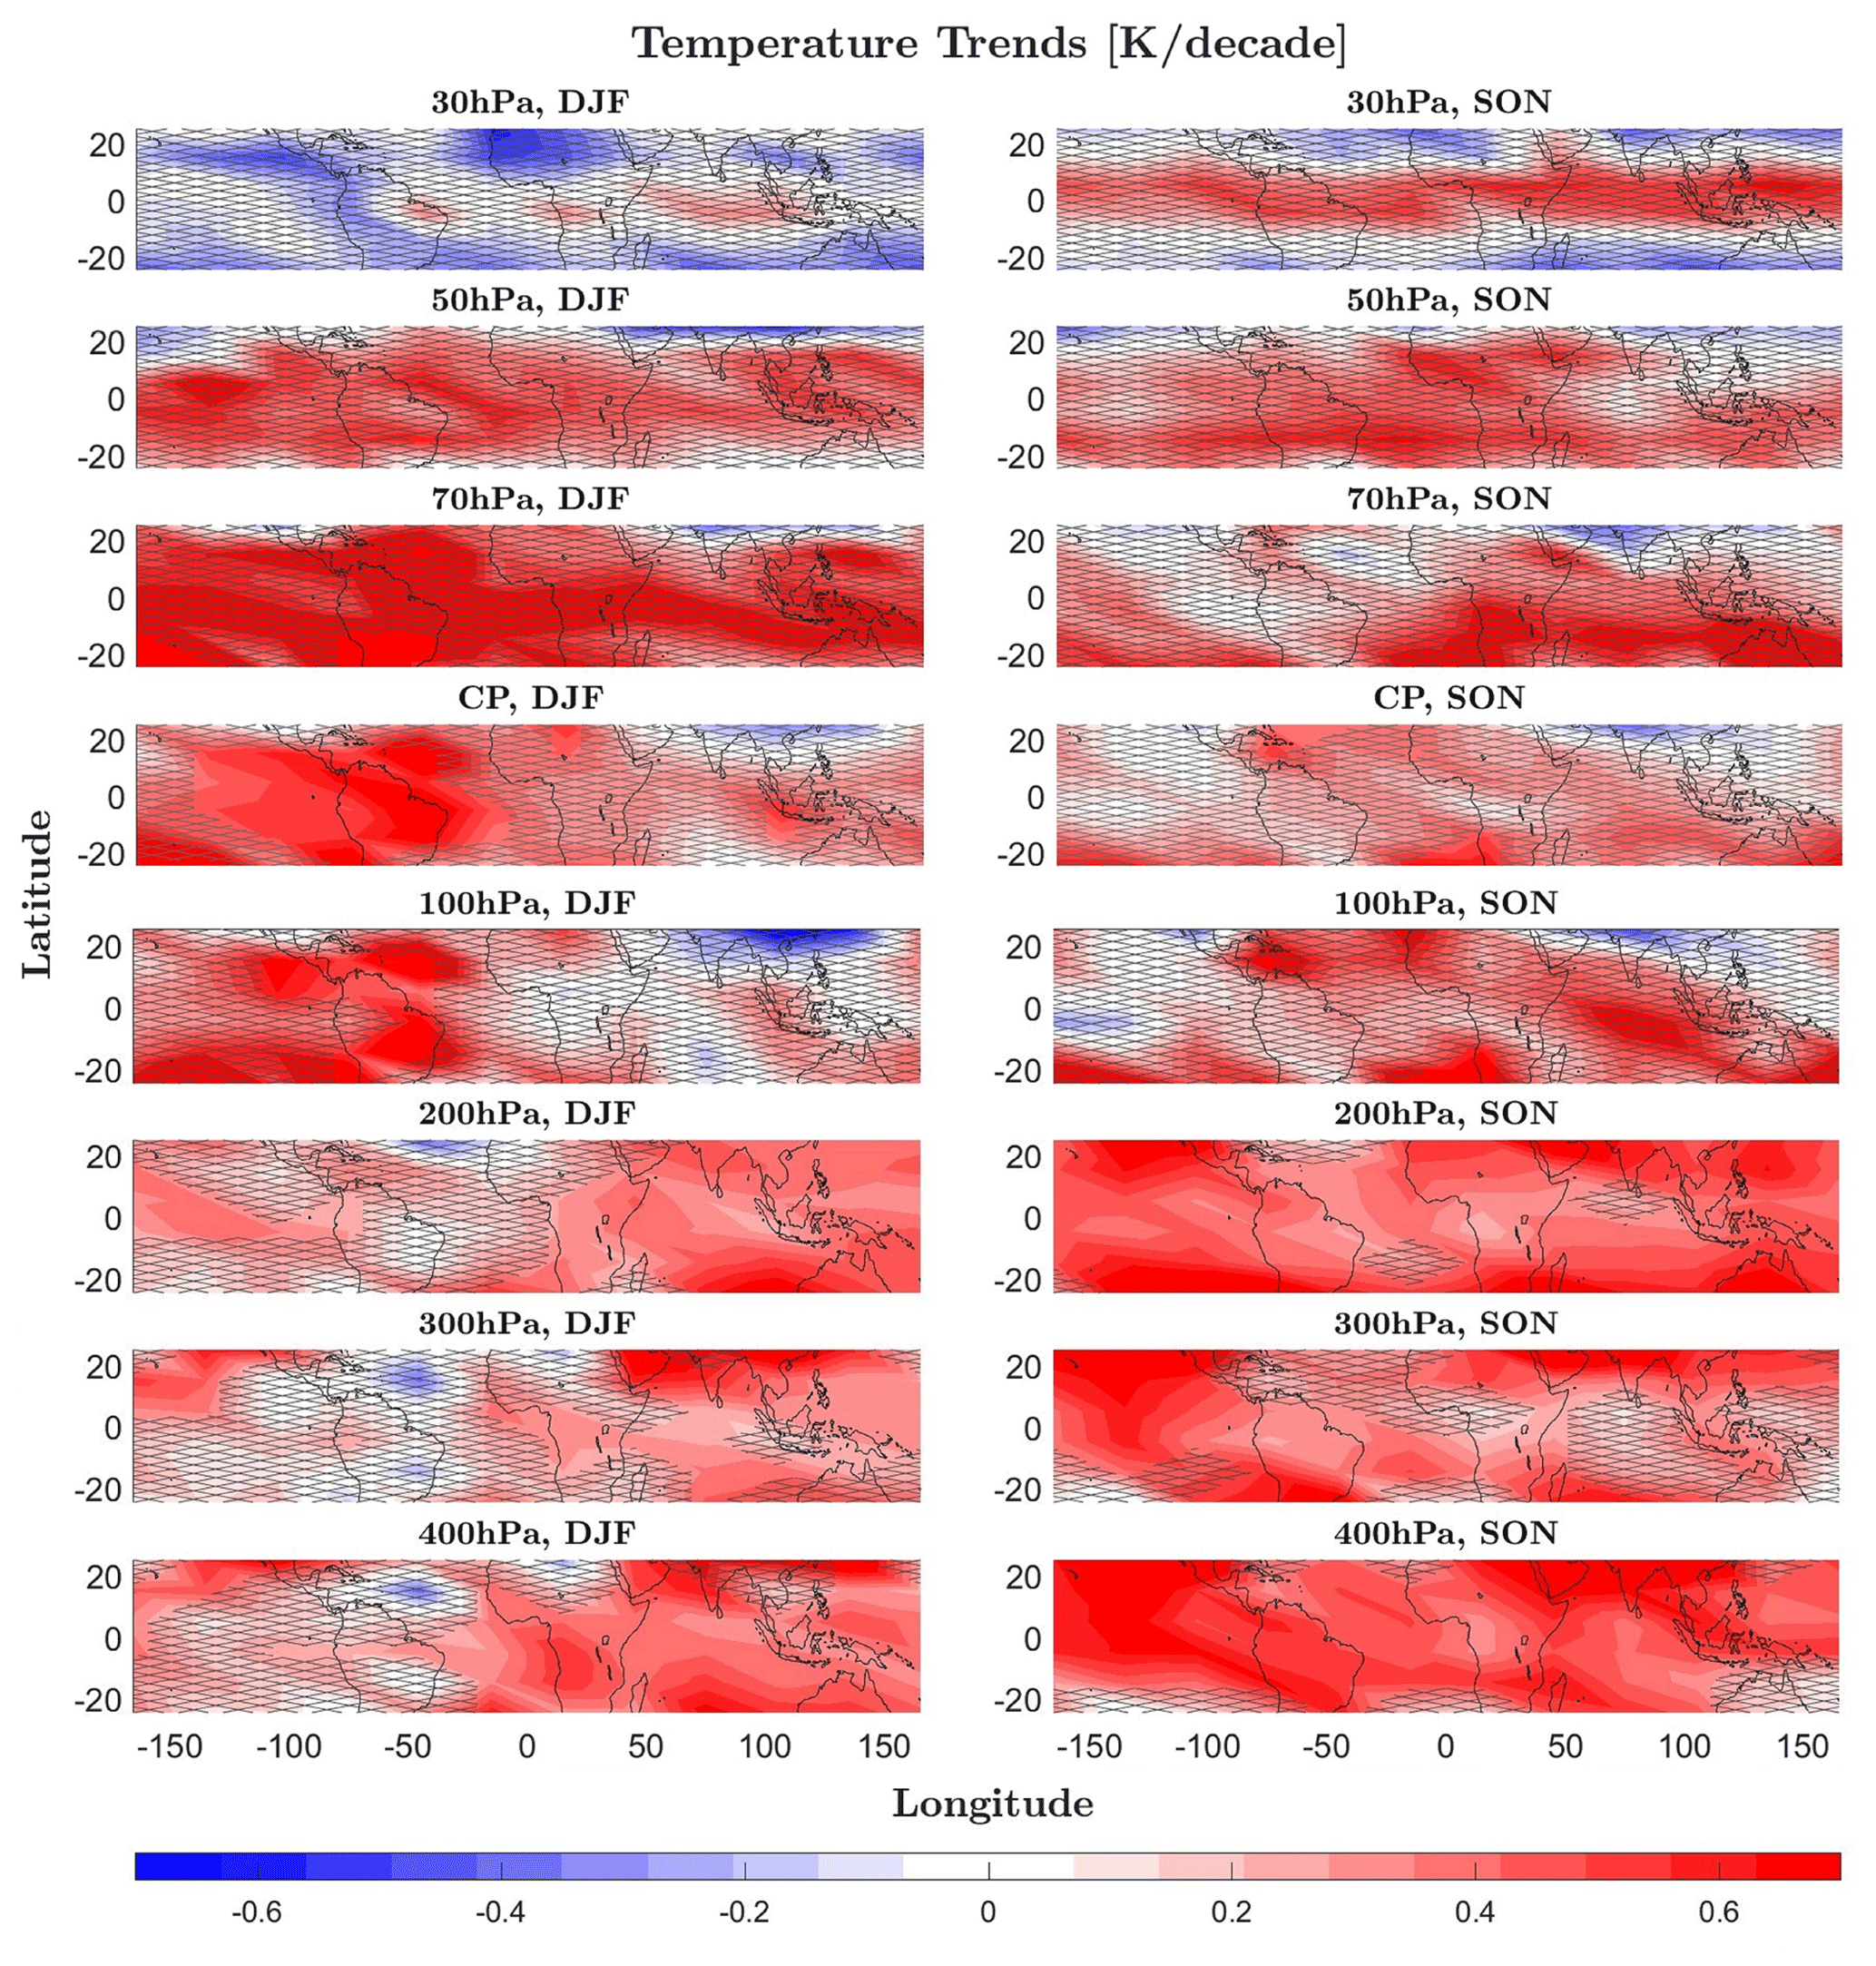
Figure 5The 2002–2022 temperature trends (K per decade) during DJF and SON at different pressure levels and the cold point (CP) based on GNSS-RO data. Trends not significant at the 95 % confidence level are marked with grey cross-hatching.
The connections between temperature trends at the cold point and in the upper troposphere and lower stratosphere are further analyzed by calculating the Pearson correlation coefficients between the gridded trends at the CP and the trends at all other levels (Fig. 6). Notably, the cold-point temperature trend patterns exhibit striking similarities to the temperature trend patterns at levels slightly below (100 hPa) and above (70 hPa) the CPT. These similarities extend upwards into the lower stratosphere (60 to 50 hPa) during NH winter. The connection between temperature trends at the cold point and in the upper troposphere manifests itself in the form of clear anticorrelation between the trend patterns, particularly during the DJF and SON seasons as discussed above. Anticorrelations maximize at 300 hPa for DJF and 400 hPa for SON. This suggests that the intensity of cold-point warming is connected to patterns of enhanced and reduced upper-tropospheric warming via some regional dynamical or radiative processes. The here-found anticorrelations of the trend patterns resemble previously observed links between tropospheric and lower-stratospheric temperature anomalies, which have several possible theoretical explanations. On the one hand, cooling of the tropopause has been suggested to result from either convective overshooting of the level of neutral buoyancy (Kuang and Bretherton, 2004) or from the formation of convective cold tops via hydrostatic adjustment above tropospheric convective heating (Holloway and Neelin, 2007). Alternatively, theoretical evidence has suggested that tropospheric thermal forcing and thus generated tropopause geopotential anomalies can modulate stratospheric upwelling and temperature (Lin and Emanuel, 2024).
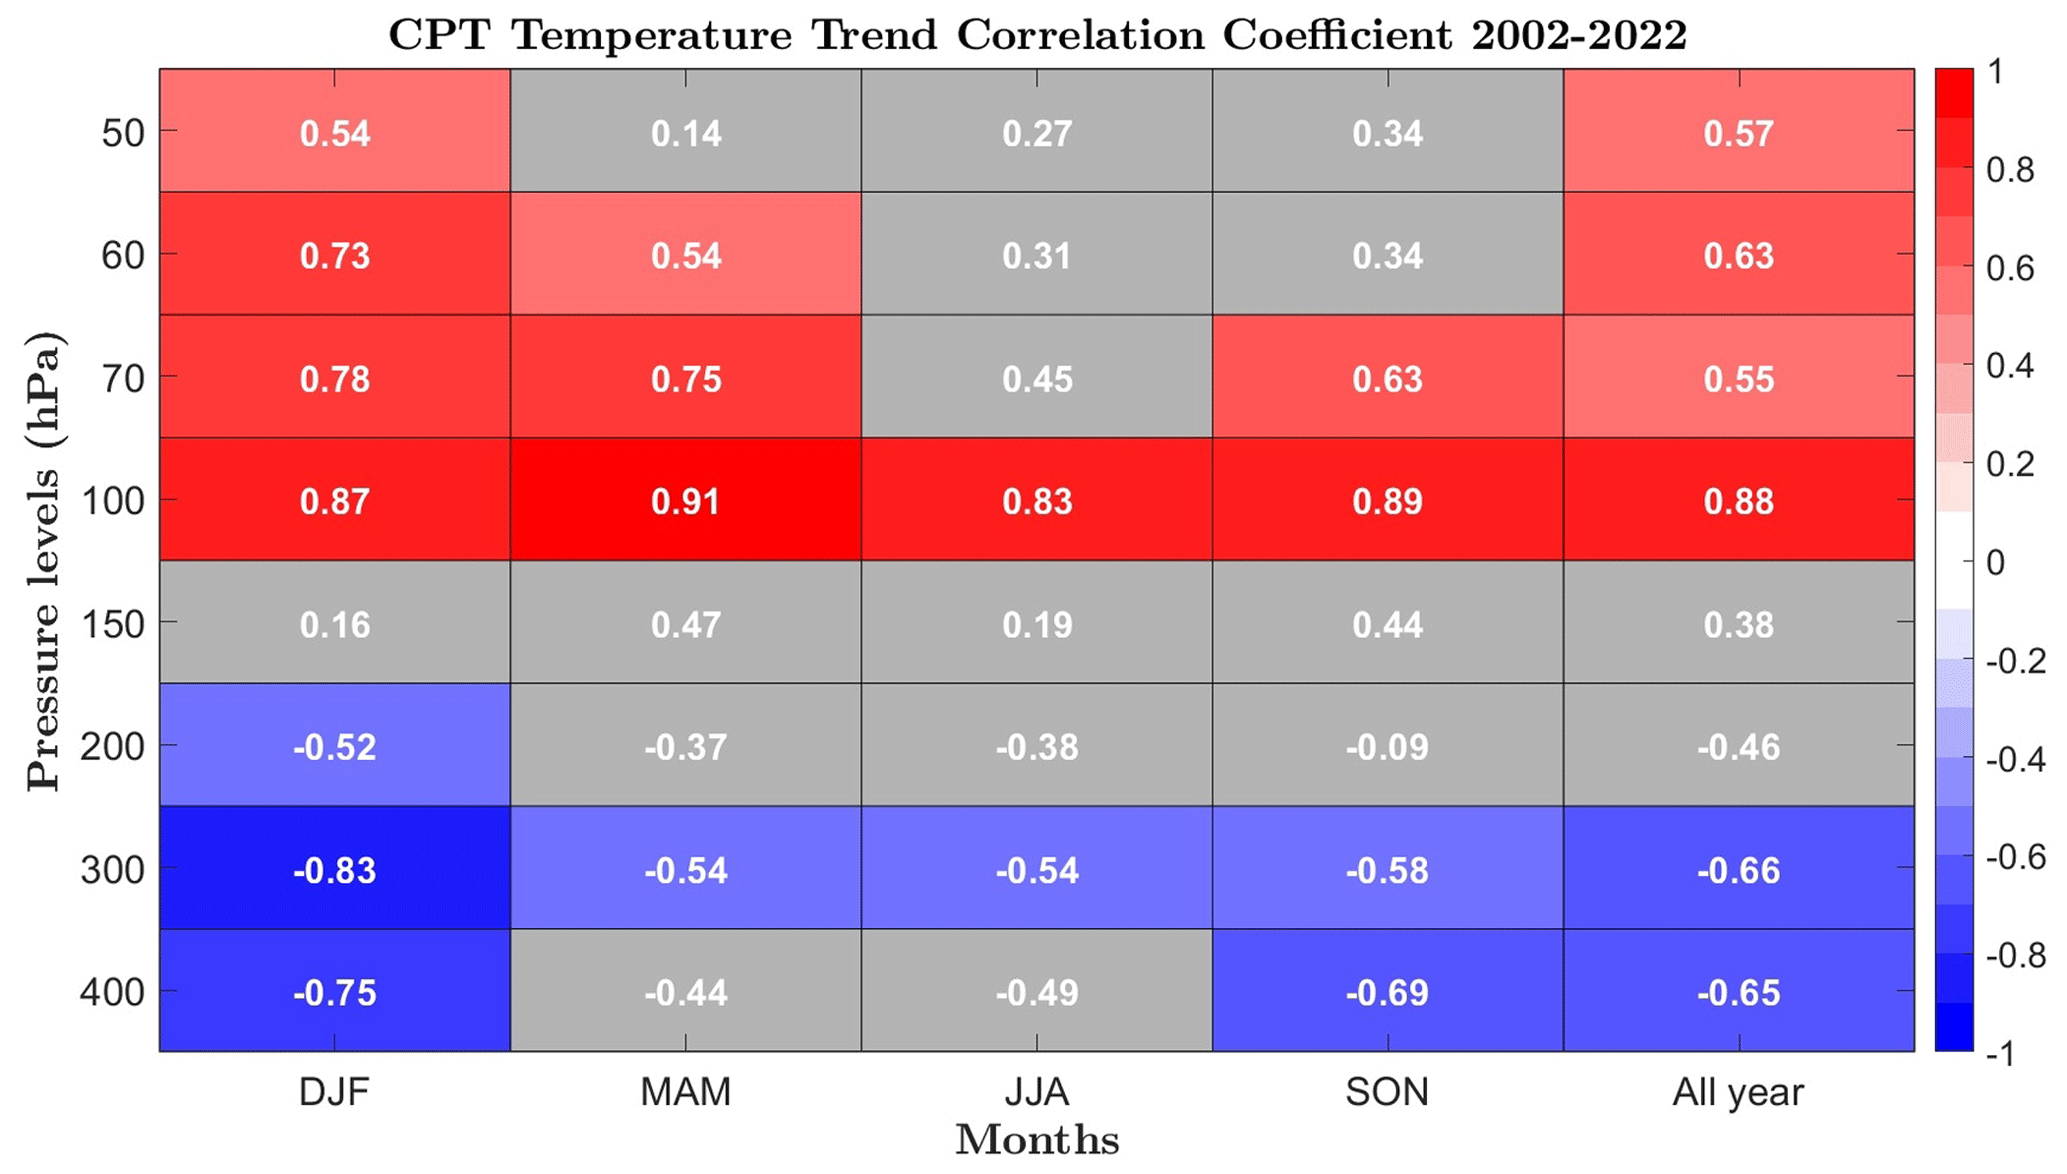
Figure 6Correlation coefficients between gridded temperature trends at the CPT and at different pressure levels as given on the y axis based on GNSS-RO data for 2002–2022. Correlation coefficients in grey boxes are not significant at the 95 % confidence level.
The temperature of the cold point plays a crucial role in governing the water vapor content of the lower stratosphere. In order to examine the influence of the spatial variations in cold-point temperature trends, the patterns of CPT temperature and water vapor trends are compared in Fig. 7 for the 2004–2021 time period. The analyzed datasets, MLS v5.1 and SWOOSH v2.7, agree very well on the overall trend values and spatial patterns, with some smaller differences. Trends from the homogenized SWOOSH dataset show less variability on smaller spatial scales and give, therefore, a smoother overall picture with smaller peak values. While the stratosphere shows overall moistening, these positive trends are only significant over South America for DJF and central America for MAM. Spatial variations in temperature trends at the CPT (Fig. 7a–b) and at 70 hPa (not shown here) are found to coincide with spatial variations in water vapor trends at 100 hPa (Fig. 7c–f) and 82 hPa (not shown here), respectively. The strongest moistening is observed over the regions that show the largest warming trends (e.g., South America in DJF). Regions with weak cold-point cooling, on the other hand, show weak and nonsignificant drying (e.g., southeast Asia in DJF).
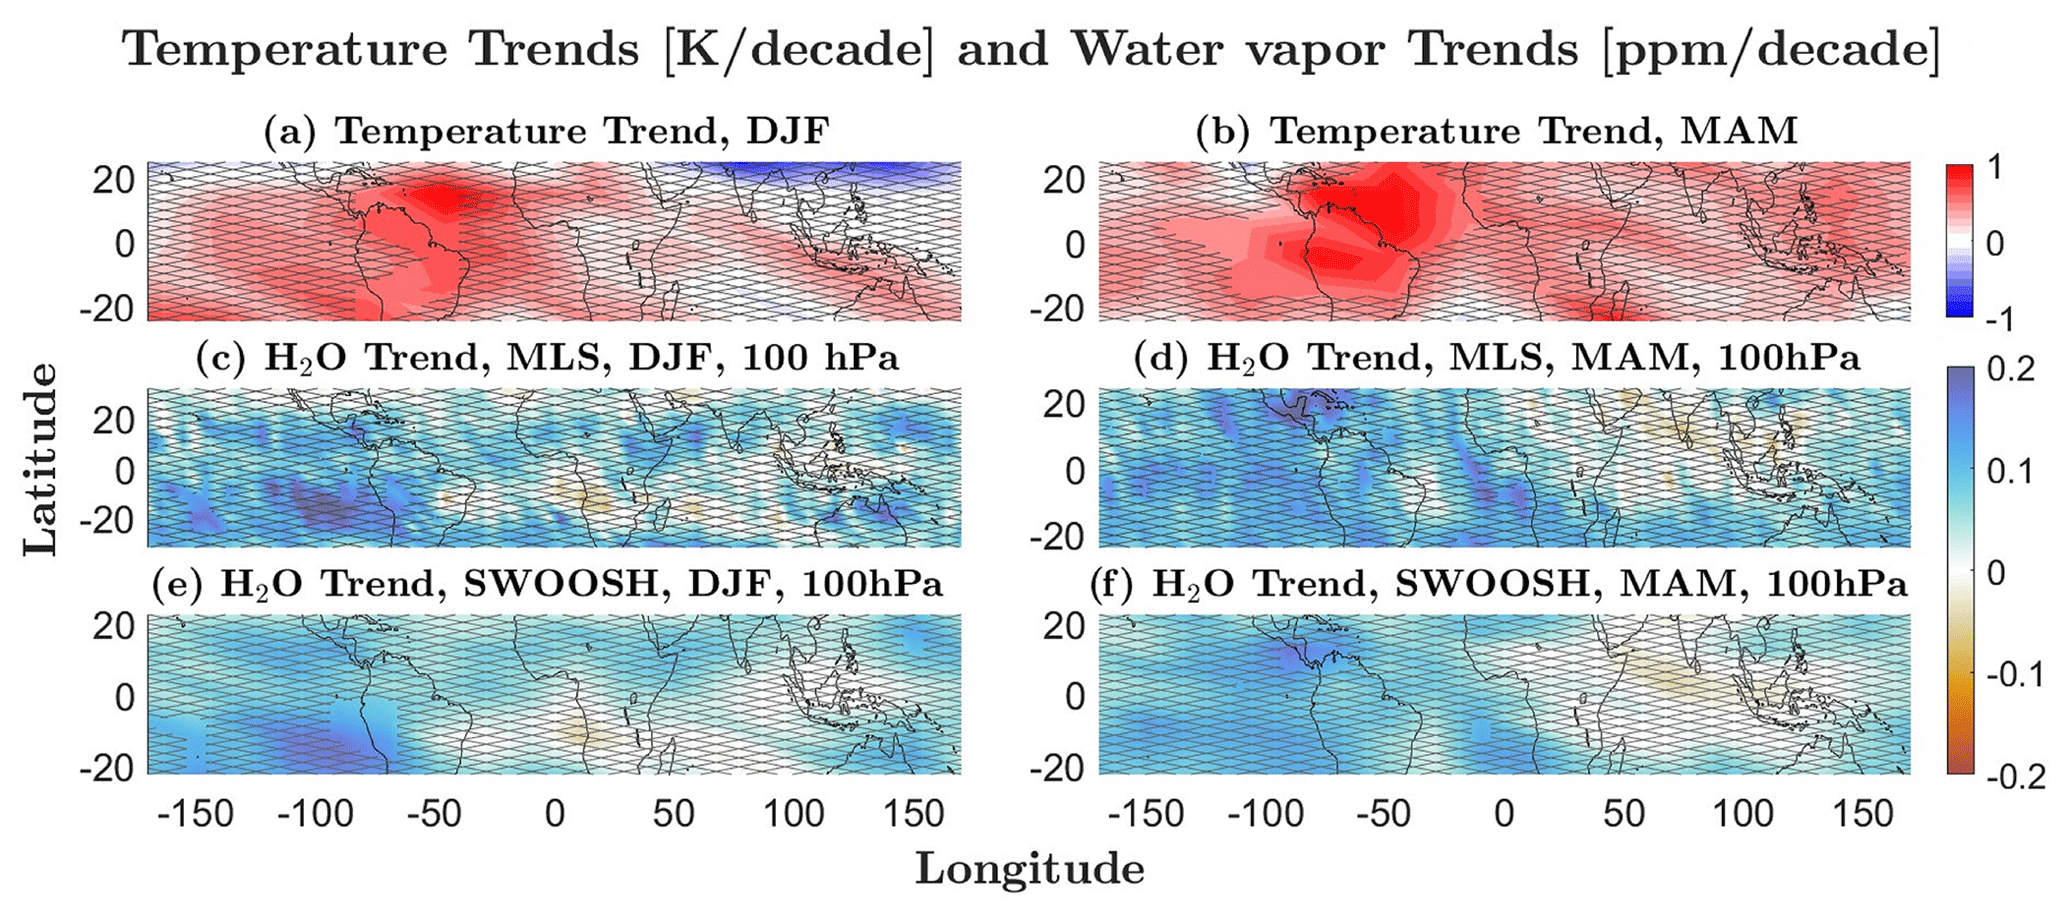
Figure 7The 2004–2021 temperature trends (K per decade) at the cold-point tropopause based on GNSS-RO data (a–b), and water vapor trends (ppm per decade) based on MSL v5.1 and SWOOSH v2.7 at 100 hPa (c–f) for DJF and MAM. Trends not significant at the 95 % confidence level are marked with grey cross-hatching.
Given the strong seasonal cycle in cold-point temperature trends, one can expect water vapor trends to have similar seasonal variations. Figure 8 shows the seasonal cycles of cold-point temperature and 100 hPa water vapor trends for 10° N–10° S. The cold point displays the strongest warming during the boreal winter and spring months, with significant trends from February to June (see also Fig. 4). Most of the boreal summer and fall months, on the other hand, experience weak and nonsignificant warming. This seasonality of the CPT temperature trend extracted from GNSS-RO aligns closely with the seasonality found for the water vapor trends sourced from MLS and SWOOSH data. Consistent with peak warming in boreal winter and spring, water vapor at 100 hPa shows the strongest positive trends during the same time of the year and small, nonsignificant trends during boreal autumn. It is worth noting that both water vapor datasets indicate a maximum trend slightly later than the maximum cold-point warming. The reasons for this discrepancy are currently unclear and may be related to limitations of the vertical resolution of the measurements or involve other processes potentially influencing water vapor trends during boreal spring.
MLS and SWOOSH water vapor trends agree very well in terms of their values, seasonality, and significance, with a seasonal cycle amplitude of 0.2 ppm per decade. The seasonal cycle of cold-point warming shows an amplitude of around 0.4 K per decade. The ratio of the water vapor and temperature trend amplitudes of 0.5 ppm K−1 is consistent with the Clausius–Clapeyron equation as discussed in Konopka et al. (2022).
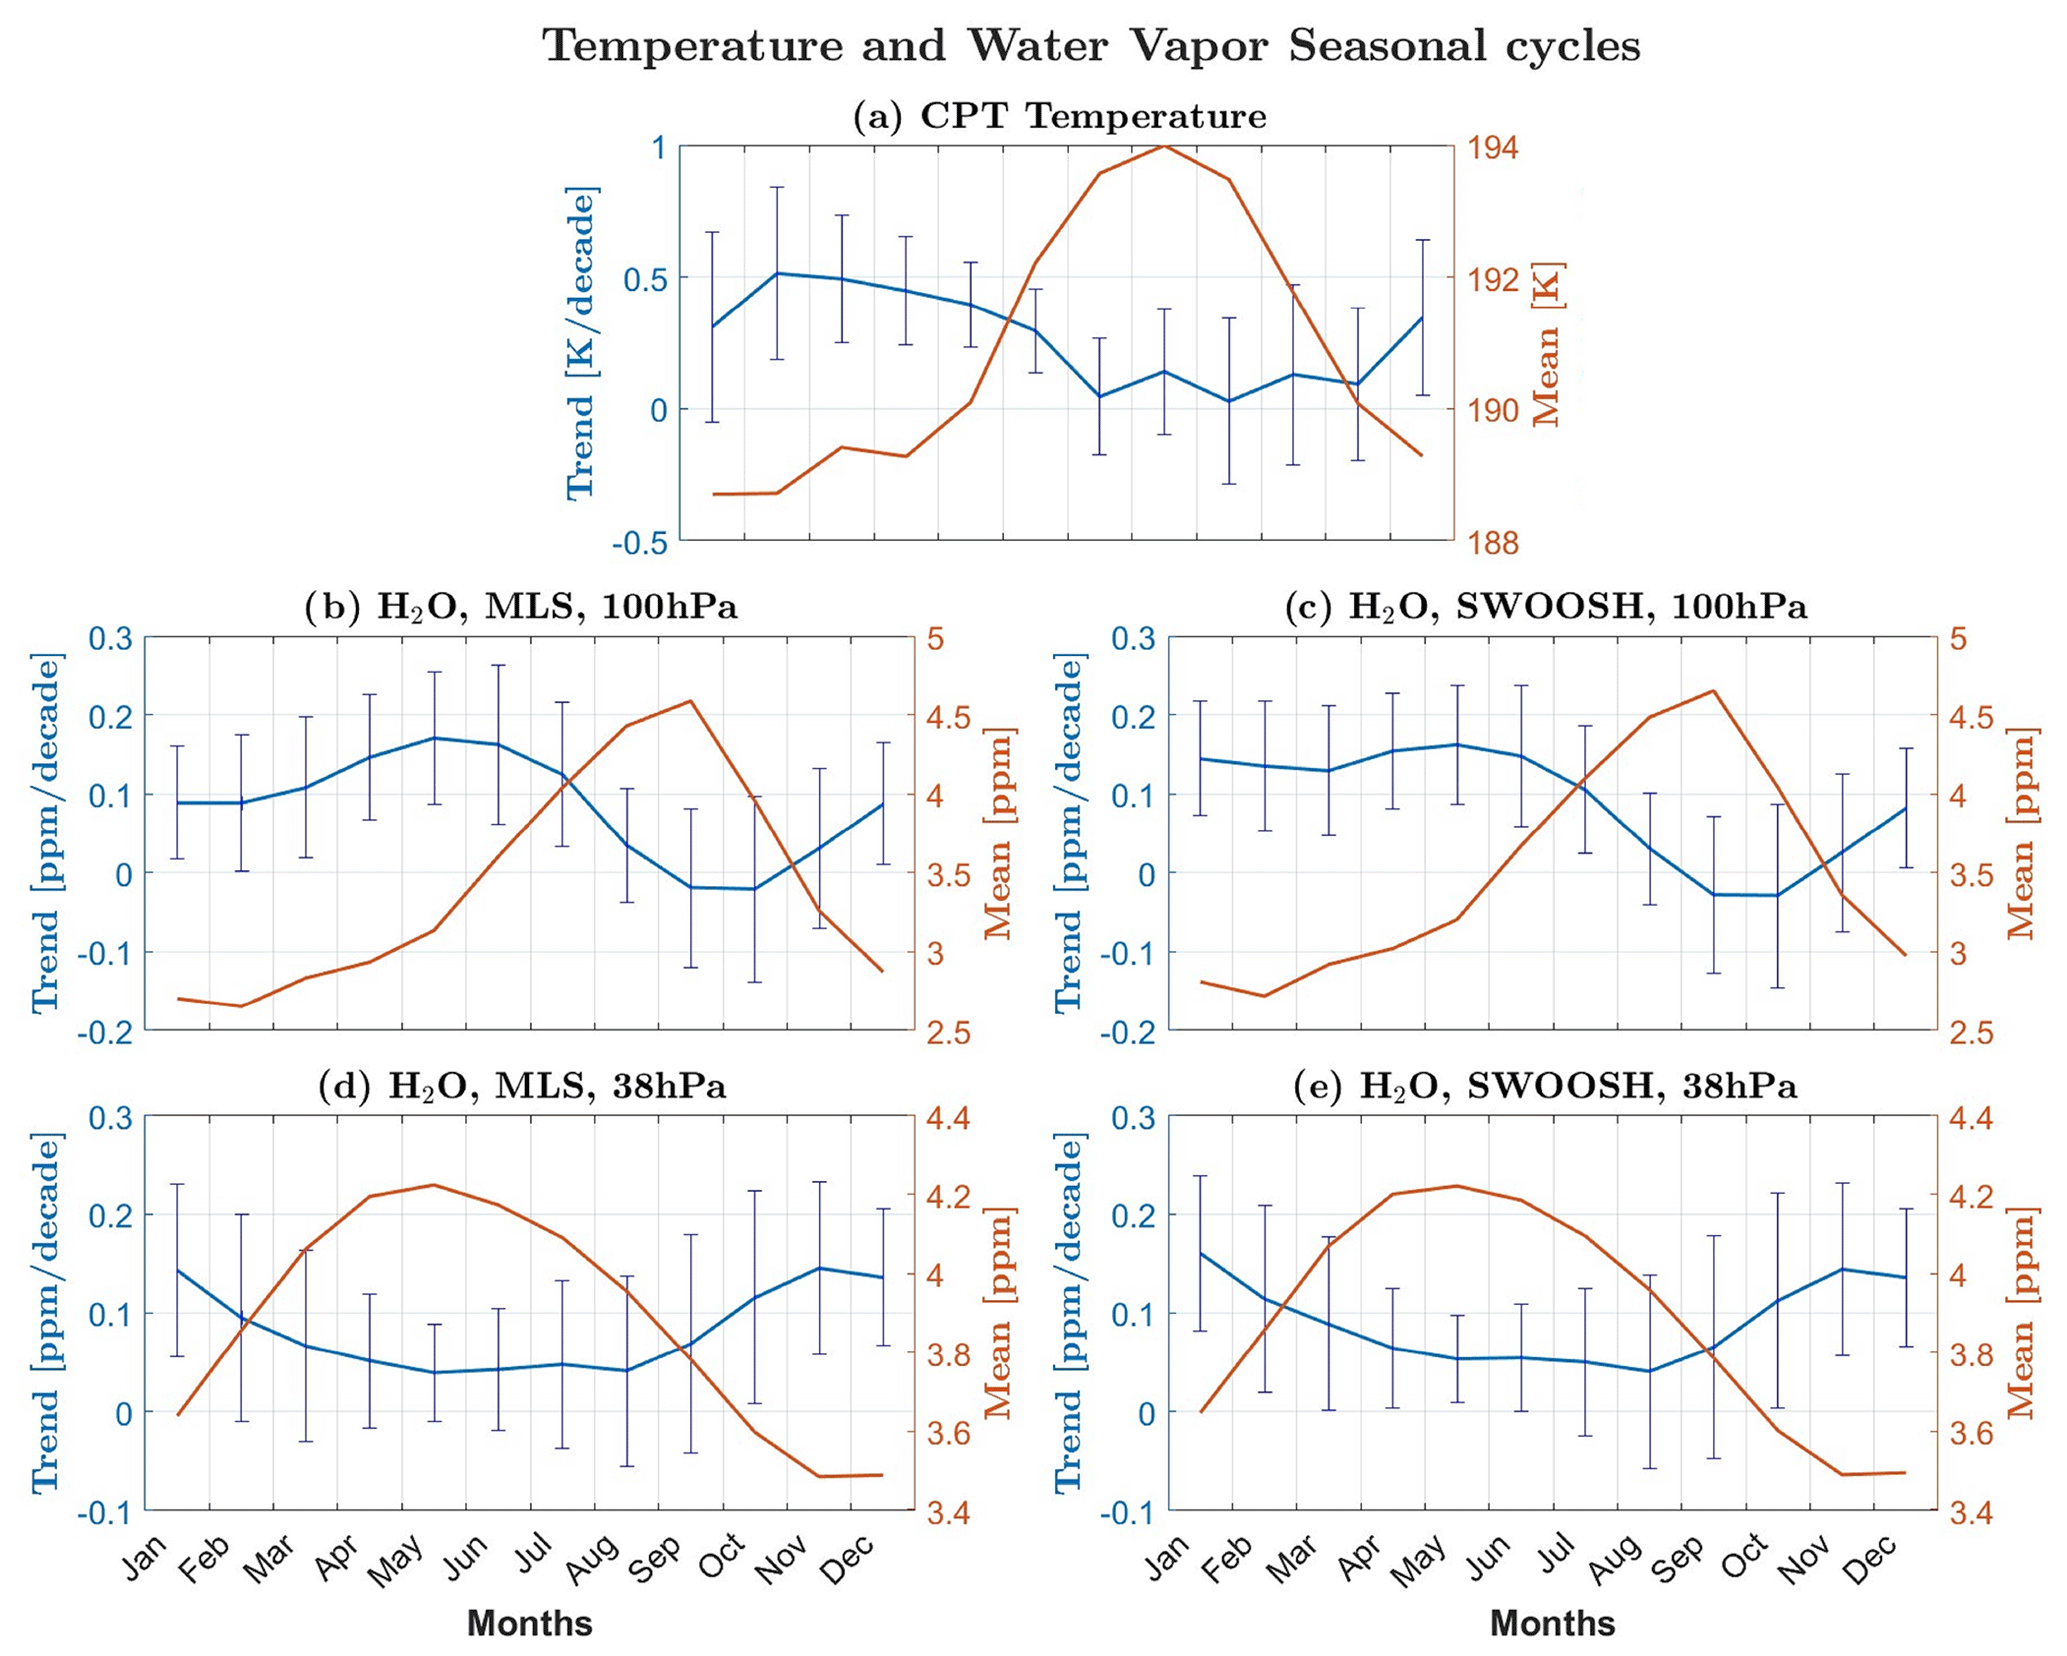
Figure 8The 2004–2021 seasonal cycle of cold-point tropopause (CPT) temperature climatology (brown line) and trend (blue line) based on GNSS-RO data (a) and water vapor climatology (brown line) and trends (blue line) at 100 hPa (b–c), and 21 hPa (d–e) based on MLS v5.1 and SWOOSH v2.7. Error bars show the ± 2 sigma confidence intervals of the trend.
The stronger moistening during boreal winter and spring when TTL water vapor shows minimum values (Fig. 8b–c), along with the weaker moistening during NH fall when water vapor shows maximum values, suggest a weakening of the water vapor seasonal cycle. The same principle applies to the seasonal cycle in cold-point temperatures where the strongest warming coincides with the season of lowest temperatures (Fig. 8a), thus leading to a decrease in the seasonal cycle amplitude over time. As the cold-point and water vapor seasonal cycles set the entry values of the tape recorder (Mote et al., 1996), their weakening can lead to a weakening of the tape recorder signal. Indeed, the seasonal cycle of water vapor trends in the middle stratosphere (38 hPa, Fig. 8d–e) illustrates how the signal propagates upward in time, with the strongest moistening now appearing during boreal late fall and winter. As the climatological seasonal cycle propagates upward in the same way, the largest moistening still coincides with the timing of the lowest water vapor values, while maximum water vapor experiences weaker moistening.
The upward transport of the deseasonalized water vapor anomalies is shown in Fig. 9a and c for MLS and SWOOSH data over 10° N–10° S. All time series are boxcar smoothed (a width of 5 months) to remove sub-seasonal variability. The mean seasonal cycle of the tape recorder shows the expected minimum during NH winter and spring followed by an increase during summer and fall at 100 hPa and the slow upward propagation of this pattern to higher levels. Water vapor trends have been calculated based on the multilinear regression for each level and month of the year for MLS and SWOOSH (Fig. 9b and d). Noticeably, the findings illustrate an upward transport of the trends in water vapor at similar timescales as the upward transport of the seasonal cycle in water vapor. The dotted black lines illustrate the timing of the upward transport of water vapor seasonal maxima and minima. The same black lines are overlaid on top of the water vapor trend, demonstrating that the minimum (maximum) in water vapor coincides with the stronger (weaker) moistening on most levels.
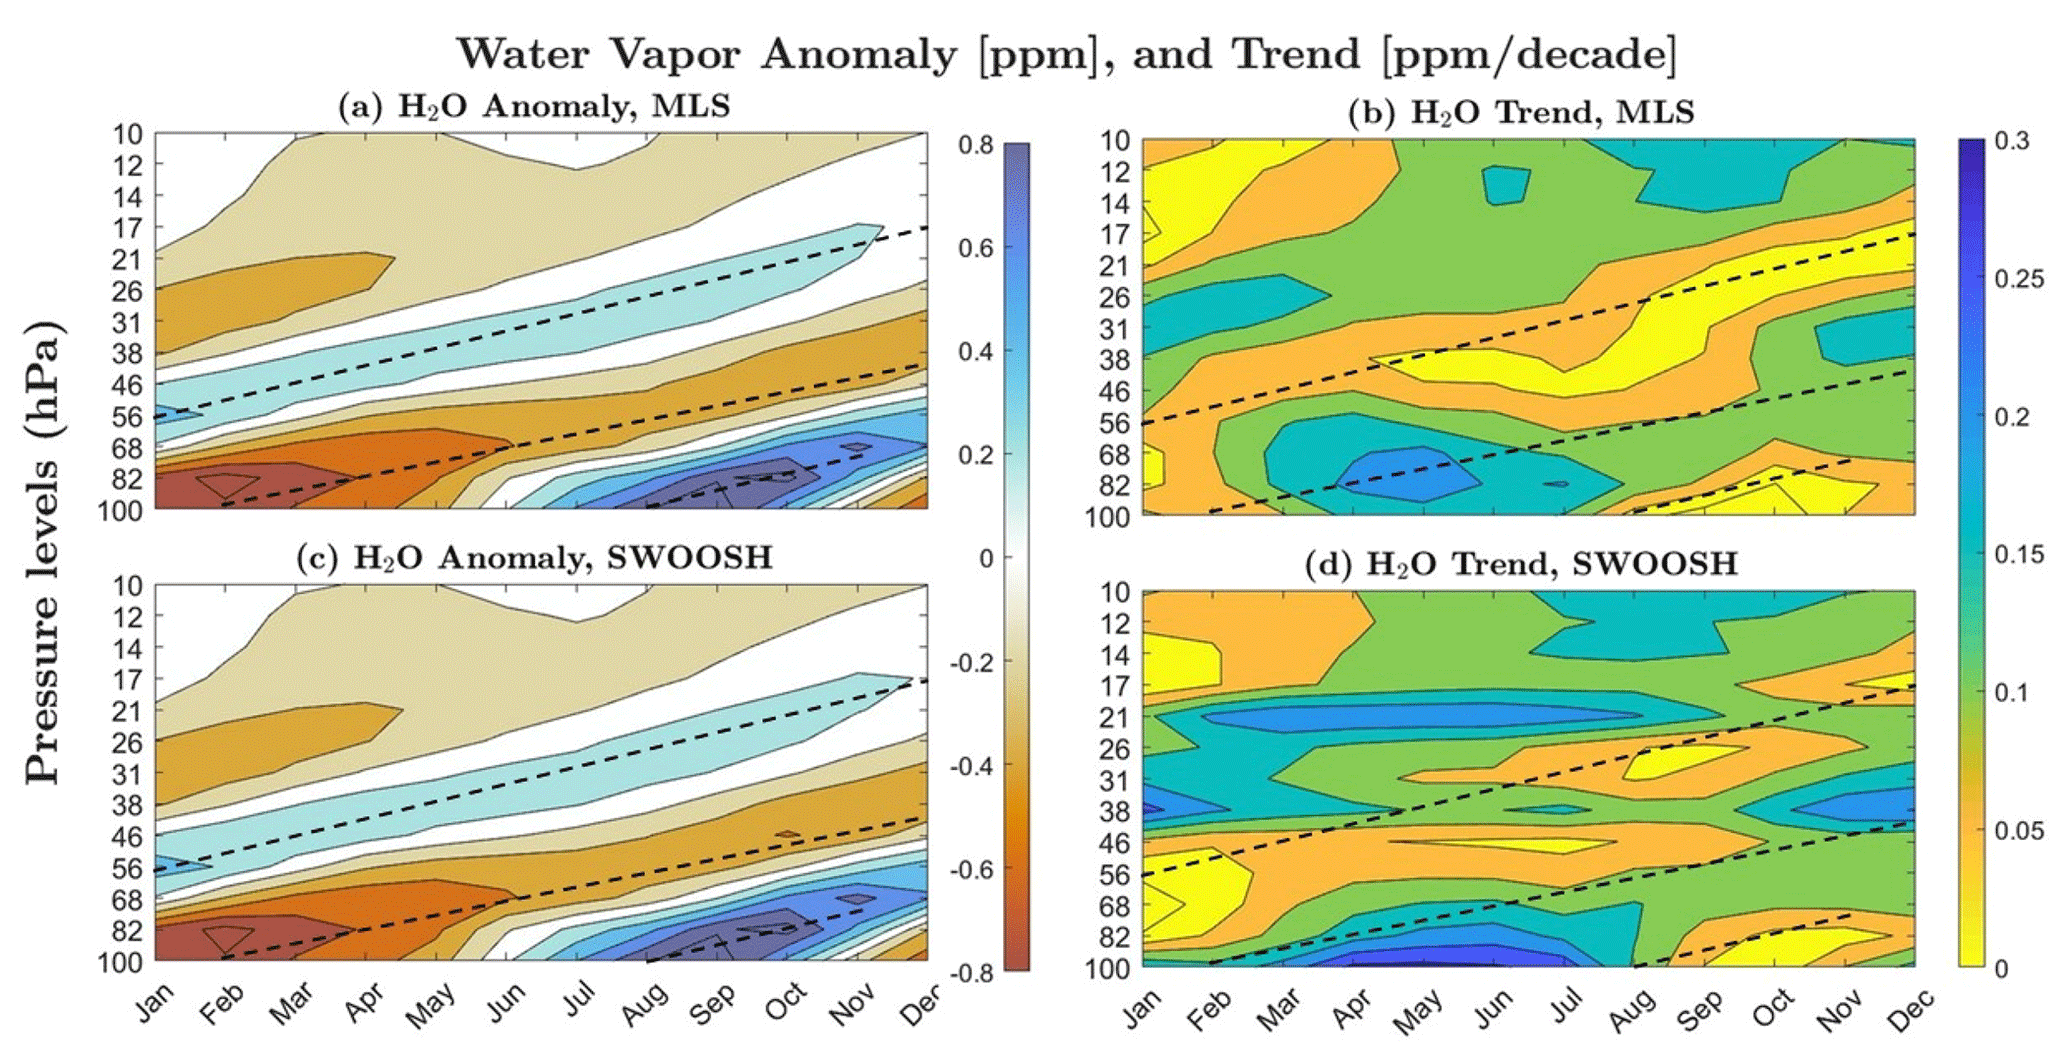
Figure 9The 2004–2021 deviation in water vapor (ppm) from the time mean profile averaged over 10° N–10° S for MLS v5.1 (a) and SWOOSH v2.7 (c). Upward transport of seasonal maxima and minima are shown as dotted black lines. Water vapor trend (ppm per decade) from MLS v5.1 (b) and SWOOSH v2.7 (d), with dotted black lines from panels (a) and (c) overlaid on top.
The percentage change in amplitude of the water vapor seasonal cycle based on the long-term linear trend has been calculated by assuming that the climatological seasonal cycle changes only according to the linear trend for the respective time period (Table 1). At 100 hPa, the tape recorder signal is estimated to decrease by as much as 5 % to 6 % per decade. Such decreasing amplitude is also found at most other levels, consistent with our hypothesis of upward propagation of the weakening amplitude. An exception is found for MLS at the 56 hPa level, which shows a slightly increasing amplitude inconsistent with MLS trends at the other levels. The weakening of amplitude relative to the background seasonal cycle changes with increasing altitude, in particular above 30 hPa, possibly due to the influence of other seasonal signals in the middle stratosphere, such as the variability in water vapor production from methane.
High vertical resolution GNSS-RO data demonstrates that over the past 2 decades, there has been no overall cooling trend in the TTL region consistent with previous studies (e.g., Randel et al., 2017; Steiner et al., 2020; Ladstädter et al., 2023). Focusing on the cold point, which sets the entry values of stratospheric water vapor, our study shows clear warming of this level, with the strongest trends of up to 0.7 K per decade over the tropical regions of South America, the Atlantic, Africa, the Indian Ocean, and Australia. This cold-point warming during 2002–2022 is in contrast to observations prior to 2000, which show a clear cold-point cooling (Randel et al., 2006; Wang et al., 2012). In addition, we find an upward shift in the cold point during boreal summer and autumn and a downward shift during boreal winter and spring in good agreement with results derived from the ozonesonde network SHADOZ (Southern Hemisphere Additional Ozonesondes; Thompson et al., 2021).
Modeling studies have suggested warmer and higher tropopause levels under future global warming due to local radiative effects from increased GHGs and due to a warmer troposphere (Kim et al., 2013; Lin et al., 2017). This temperature signal agrees with the here-identified cold-point warming, suggesting that radiative effects drive the trends observed over the last 20 years. However, our tropopause height trends with a downward shift during the seasons of maximum warming (DJF and MAM) are not consistent with the model results, implying that dynamical processes might also play a role in the observed cold-point tropopause trends as discussed below.
Upper-tropospheric warming is known to be an amplification of the surface warming signal maximizing in the tropics around 200 hPa and is predicted to decrease to zero near the tropical tropopause (e.g., Santer et al., 2005; Keil et al., 2023). The strong upper-tropospheric warming is evident from the GNSS-RO observations (Figs. 4 and 5) and agrees well with estimates from other observational datasets (Vergados et al., 2021; Steiner et al., 2020). Previous studies have suggested that observed temperature trends in the tropical upper troposphere and in the lower stratosphere are anticorrelated (Garfinkel et al., 2013; Hu et al., 2016) in agreement with our results. While 1979–2014 reanalysis datasets suggest the strongest warming over the tropical central and eastern Pacific (Hu et al., 2016), our analysis of 2002–2022 GNSS-RO data finds that the warming signal minimizes over the central Pacific and maximizes over the Atlantic (Fig. 2). The regions of strongest tropopause warming reveal slight cooling trends in the upper troposphere, while regions characterized by weaker and nonsignificant tropopause cooling demonstrate substantial warming in the upper troposphere (Figs. 5 and 6). The identified anticorrelations suggest that dynamical responses to the enhanced moist heating in the upper troposphere or SST-driven enhanced convection can be expected to result in negative cold-point trends, potentially canceling some of the radiatively driven warming.
Global stratospheric cooling has weakened over the last 2 decades due to the reduction in ozone-induced cooling after the onset of ozone recovery (Randel et al., 2017; Maycock et al., 2018). However, the tropical lower stratosphere continues to experience negative ozone trends (e.g., Godin-Beekmann et al., 2022), which leads to ongoing cooling and is therefore not consistent with the warming of the tropical lower stratosphere extending up to 30–70 hPa (Fig. 4). Dynamical changes related to upwelling with the stratospheric Brewer–Dobson circulation (BDC) or local effects of wave activity can also impact tropopause trends. Tropical TTL warming could result from decreased upwelling due to a weakening of the BDC. While this weakening is not expected from model projections under increasing GHGs, some observational datasets suggest positive but nonsignificant age-of-air trends in the TTL for 2002–2012 (Haenel et al., 2015) indicating weakened BDC transport in this region. Global lower-stratospheric temperature observations from MSU/AMSU also suggest that the annual mean BDC accelerated from 1980 to 1999 and decelerated from 2000–2018 (Fu et al., 2019), consistent with the changes in TTL temperatures from GNSS-RO data identified here. We find the strongest cold-point warming during boreal winter, which would be consistent with a more pronounced weakening of the BDC during this time of year. In addition to boreal winter, the cold point and lower stratosphere show a strong warming signal in October, which has also been suggested to be related to the weakening of the BDC during this month, as it coincides with a strong negative temperature trend in the Southern Hemisphere polar regions (Ladstädter et al., 2023).
The cold-point temperatures have a clear seasonal cycle, with the lowest temperatures during boreal winter and spring due to increased upwelling with BDC. The cold-point temperature trends also show a seasonal cycle, with the strongest warming during boreal winter and spring. The weaker warming trends found for the rest of the year were not significant due to the strong variability in the temperature time series. We find that the amplitude of the temperature seasonal cycle decreased by 7 % as a result of the seasonal alignment of the coldest temperatures with the strongest warming.
Table 1The 2004–2021 change in the amplitude of the tropical water vapor tape recorder (% per decade) averaged over 10° N–10° S for MLS v5.1 and SWOOSH v2.7 data.
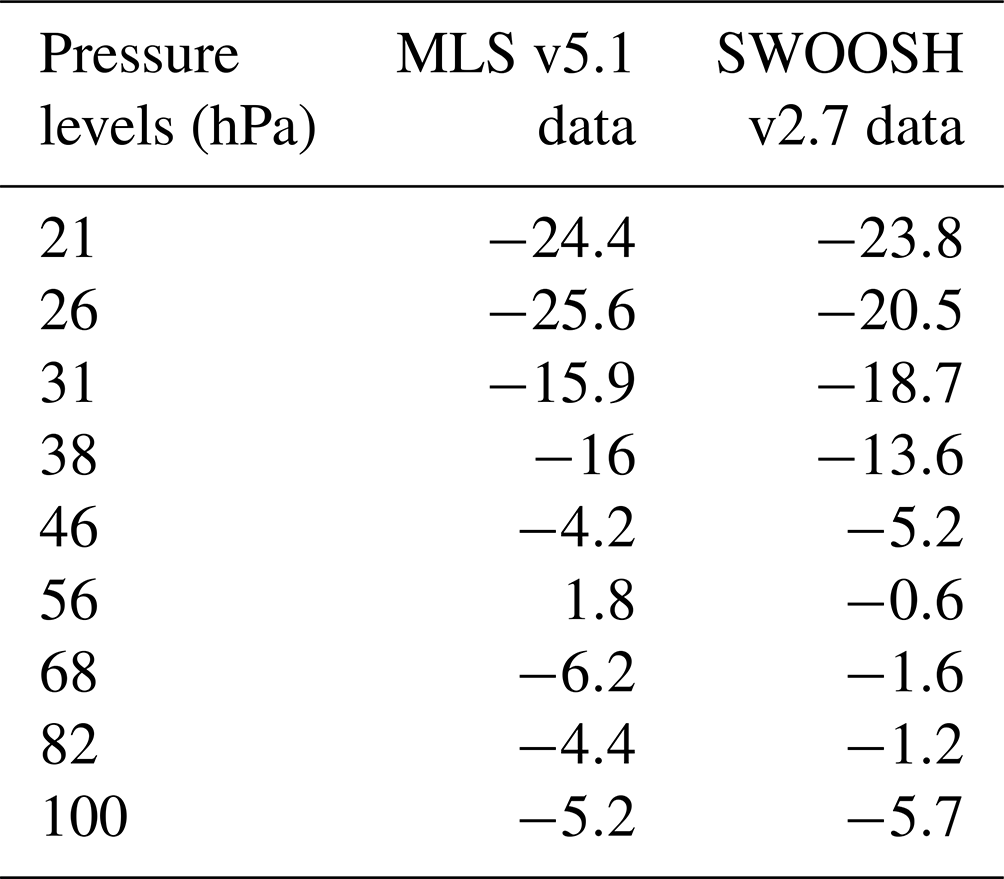
Water vapor observations at 100 hPa, a level very close to the cold point, show positive trends for 2004–2021 throughout most of the tropics, consistent with increasing cold-point temperatures. This is consistent with the multi-decadal variation in water vapor identified for a longer time series extending over the past 40 years (Tao et al., 2023). The positive trend occurred after a sharp drop in water vapor in 2001 (Konopka et al., 2022). The authors showed that the tropical moistening after 2000 occurred mainly during boreal winter and spring, consistent with our results and with the seasonal cycle of the cold-point warming (Fig. 8). We find that the seasonal cycle in water vapor at 100 hPa is reduced by 5 %–6 % (Table 1) as a result of the strongest moistening and maximum warming during the season of lowest water vapor and coldest temperatures. Our analysis shows that this reduction in the seasonal cycle is transported upwards together with the seasonal anomalies and has reduced the amplitude of the well-known tape recorder over the last 2 decades.
Overall, the here-identified warming of the cold point is consistent with model simulations that attribute the warming trends to radiative effects. At the same time, the cold-point warming is consistent with a potential weakening of the BDC upwelling in the tropical lower stratosphere. Some observations such as satellite temperatures suggest such weakened upwelling; however, these trends show large uncertainties and disagree with model simulations. Seasonal signals and zonal asymmetries in cold-point temperature and height trends might be related to dynamical responses to the enhanced moist heating in the upper troposphere, changing convection, or variations in the trends of the stratospheric BDC. These seasonal variations have important implications for cross-tropopause transport of water vapor. We find a weakened seasonal cycle in cold-point temperature that leads to a weakened seasonal cycle in stratospheric moistening and thus a reduction in the tape recorder signal.
The GNSS-RO COSMIC data are available from https://cdaac-www.cosmic.ucar.edu/cdaac/products.html (CDAAC, 2023). MLS data are available at the NASA GSFC DISC (https://disc.gsfc.nasa.gov, last access: 19 June 2024, Livesey et al., 2022), SWOOSH data can be obtained from https://csl.noaa.gov/swoosh/ (last access: 19 June 2024, Davis et al., 2016).
MZ performed the analysis and wrote the manuscript. ST developed the research question and guided the research process. RPK provided the GNSS-RO data. SMD provided the SWOOSH data. All authors took part in the process of preparing the final paper.
The contact author has declared that none of the authors has any competing interests.
Publisher’s note: Copernicus Publications remains neutral with regard to jurisdictional claims made in the text, published maps, institutional affiliations, or any other geographical representation in this paper. While Copernicus Publications makes every effort to include appropriate place names, the final responsibility lies with the authors.
This research has been enabled by the NSERC Discovery Grant RGPIN-2020-06292. We thank UCAR for the reprocessing and availability of GNSS-RO data from all satellite missions.
This research has been supported by the Natural Sciences and Engineering Research Council of Canada (NSERC; grant no. RGPIN-2020-06292).
This paper was edited by Laura Wilcox and reviewed by two anonymous referees.
Anthes, R. A., Bernhardt, P. A., Chen, Y., Cucurull, L., Dymond, K. F., Ector, D., Healy, S. B., Ho, S.-P., Hunt, D. C., Kuo, Y.-H., Liu, H., Manning, K., McCormick, C., Meehan, T. K., Randel, W. J., Rocken, C., Schreiner, W. S., Sokolovskiy, S. V., Syndergaard, S., Thompson, D. C., Trenberth, K. E., Wee, T.-K., Yen, N. L., and Zeng, Z.: The COSMIC/FORMOSAT-3 Mission: Early Results, B. Am. Meteor. Soc., 89, 313–334, https://doi.org/10.1175/BAMS-89-3-313, 2008.
Baldwin, M. P., Gray, L. J., Dunkerton, T. J., Hamilton, K., Haynes, P. H., Randel, W. J., Holton, J. R., Alexander, M. J., Hirota, I., Horinouchi, T., Jones, D. B. A., Kinnersley, J. S., Marquardt, C., Sato, K., and Takahashi, M.: The quasi-biennial oscillation, Rev. Geophys., 39, 179–229, https://doi.org/10.1029/1999RG000073, 2001.
Beyerle, G., Schmidt, T., Michalak, G., Heise, S., Wickert, J., and Reigber, C.: GPS radio occultation with GRACE: Atmospheric profiling utilizing the zero difference technique, Geophys. Res. Lett., 32, 2005GL023109, https://doi.org/10.1029/2005GL023109, 2005.
Beyerle, G., Grunwaldt, L., Heise, S., Köhler, W., König, R., Michalak, G., Rothacher, M., Schmidt, T., Wickert, J., Tapley, B. D., and Giesinger, B.: First results from the GPS atmosphere sounding experiment TOR aboard the TerraSAR-X satellite, Atmos. Chem. Phys., 11, 6687–6699, https://doi.org/10.5194/acp-11-6687-2011, 2011.
Bowler, N. E.: An initial assessment of the quality of RO data from KOMPSAT-5, GRAS SAF Rep, 32, 18, 2018.
CDAAC: GNSS Radio Occultation Datasets – Metop-A, COSMIC Data Analysis and Archive Center [data set], https://cdaac-www.cosmic.ucar.edu/cdaac/products.html (last access: 19 June 2024), 2023.
Collimore, C. C., Martin, D. W., Hitchman, M. H., Huesmann, A., and Waliser, D. E.: On the relationship between the QBO and tropical deep convection, J. Climate, 16, 2552–2568, 2003.
Davis, S. M., Rosenlof, K. H., Hassler, B., Hurst, D. F., Read, W. G., Vömel, H., Selkirk, H., Fujiwara, M., and Damadeo, R.: The Stratospheric Water and Ozone Satellite Homogenized (SWOOSH) database: a long-term database for climate studies, Earth Syst. Sci. Data, 8, 461–490, https://doi.org/10.5194/essd-8-461-2016, 2016 (data available: https://csl.noaa.gov/swoosh/, last access: 19 June 2024).
De F. Forster, P. M. and Shine, K. P.: Stratospheric water vapour changes as a possible contributor to observed stratospheric cooling, Geophys. Res. Lett., 26, 3309–3312, https://doi.org/10.1029/1999GL010487, 1999.
Folkins, I., Loewenstein, M., Podolske, J., Oltmans, S. J., and Proffitt, M.: A barrier to vertical mixing at 14 km in the tropics: Evidence from ozonesondes and aircraft measurements, J. Geophys. Res.-Atmos., 104, 22095–22102, 1999.
Free, M. and Lanzante, J.: Effect of Volcanic Eruptions on the Vertical Temperature Profile in Radiosonde Data and Climate Models, J. Climate, 22, 2925–2939, https://doi.org/10.1175/2008JCLI2562.1, 2009.
Fu, Q., Lin, P., Solomon, S., and Hartmann, D. L.: Observational evidence of strengthening of the Brewer-Dobson circulation since 1980, J. Geophys. Res.-Atmos., 120, 10214–10228, https://doi.org/10.1002/2015JD023657, 2015.
Fu, Q., Solomon, S., Pahlavan, H. A., and Lin, P.: Observed changes in Brewer–Dobson circulation for 1980–2018, Environ. Res. Lett., 14, 114026, https://doi.org/10.1088/1748-9326/ab4de7, 2019.
Fueglistaler, S., Dessler, A. E., Dunkerton, T. J., Folkins, I., Fu, Q., and Mote, P. W.: Tropical tropopause layer, Rev. Geophys., 47, 2008RG000267, https://doi.org/10.1029/2008RG000267, 2009.
Fueglistaler, S., Haynes, P. H., and Forster, P. M.: The annual cycle in lower stratospheric temperatures revisited, Atmos. Chem. Phys., 11, 3701–3711, https://doi.org/10.5194/acp-11-3701-2011, 2011.
Fujiwara, M., Hibino, T., Mehta, S. K., Gray, L., Mitchell, D., and Anstey, J.: Global temperature response to the major volcanic eruptions in multiple reanalysis data sets, Atmos. Chem. Phys., 15, 13507–13518, https://doi.org/10.5194/acp-15-13507-2015, 2015.
Garfinkel, C. I., Waugh, D. W., Oman, L. D., Wang, L., and Hurwitz, M. M.: Temperature trends in the tropical upper troposphere and lower stratosphere: Connections with sea surface temperatures and implications for water vapor and ozone, J. Geophys. Res.-Atmos., 118, 9658–9672, https://doi.org/10.1002/jgrd.50772, 2013.
Gettelman, A., Randel, W. J., Massie, S., Wu, F., Read, W. G., and Russell, J. M.: El Nino as a natural experiment for studying the tropical tropopause region, J. Climate, 14, 3375–3392, 2001.
Godin-Beekmann, S., Azouz, N., Sofieva, V. F., Hubert, D., Petropavlovskikh, I., Effertz, P., Ancellet, G., Degenstein, D. A., Zawada, D., Froidevaux, L., Frith, S., Wild, J., Davis, S., Steinbrecht, W., Leblanc, T., Querel, R., Tourpali, K., Damadeo, R., Maillard Barras, E., Stübi, R., Vigouroux, C., Arosio, C., Nedoluha, G., Boyd, I., Van Malderen, R., Mahieu, E., Smale, D., and Sussmann, R.: Updated trends of the stratospheric ozone vertical distribution in the 60° S–60° N latitude range based on the LOTUS regression model, Atmos. Chem. Phys., 22, 11657–11673, https://doi.org/10.5194/acp-22-11657-2022, 2022.
Gorbunov, M. E., Benzon, H.-H., Jensen, A. S., Lohmann, M. S., and Nielsen, A. S.: Comparative analysis of radio occultation processing approaches based on Fourier integral operators, Radio Sci., 39, RS6004, https://doi.org/10.1029/2003RS002916, 2004.
Grise, K. M. and Thompson, D. W. J.: On the Signatures of Equatorial and Extratropical Wave Forcing in Tropical Tropopause Layer Temperatures, J. Atmos. Sci., 70, 1084–1102, https://doi.org/10.1175/JAS-D-12-0163.1, 2013.
Haenel, F. J., Stiller, G. P., von Clarmann, T., Funke, B., Eckert, E., Glatthor, N., Grabowski, U., Kellmann, S., Kiefer, M., Linden, A., and Reddmann, T.: Reassessment of MIPAS age of air trends and variability, Atmos. Chem. Phys., 15, 13161–13176, https://doi.org/10.5194/acp-15-13161-2015, 2015.
Hajj, G. A., Ao, C. O., Iijima, B. A., Kuang, D., Kursinski, E. R., Mannucci, A. J., Meehan, T. K., Romans, L. J., De La Torre Juarez, M., and Yunck, T. P.: CHAMP and SAC-C atmospheric occultation results and intercomparisons, J. Geophys. Res., 109, 2003JD003909, https://doi.org/10.1029/2003JD003909, 2004.
Harrop, B. E. and Hartmann, D. L.: Testing the Role of Radiation in Determining Tropical Cloud-Top Temperature, J. Climate, 25, 5731–5747, https://doi.org/10.1175/JCLI-D-11-00445.1, 2012.
Hartmann, D. L. and Larson, K.: An important constraint on tropical cloud – climate feedback, Geophys. Res. Lett., 29, 1951, https://doi.org/10.1029/2002GL015835, 2002.
Highwood, E. J. and Hoskins, B. J.: The tropical tropopause, Q. J. Roy. Meteorol. Soc., 124, 1579–1604, https://doi.org/10.1002/qj.49712454911, 1998.
Holloway, C. E. and Neelin, J. D.: The Convective Cold Top and Quasi Equilibrium*, J. Atmos. Sci., 64, 1467–1487, https://doi.org/10.1175/JAS3907.1, 2007.
Holton, J. R. and Gettelman, A.: Horizontal transport and the dehydration of the stratosphere, Geophys. Res. Lett., 28, 2799–2802, https://doi.org/10.1029/2001GL013148, 2001.
Hu, D., Tian, W., Xie, F., Shu, J., and Dhomse, S.: Effects of meridional sea surface temperature changes on stratospheric temperature and circulation, Adv. Atmos. Sci., 31, 888–900, https://doi.org/10.1007/s00376-013-3152-6, 2014.
Hu, D., Tian, W., Guan, Z., Guo, Y., and Dhomse, S.: Longitudinal Asymmetric Trends of Tropical Cold-Point Tropopause Temperature and Their Link to Strengthened Walker Circulation, J. Climate, 29, 7755–7771, https://doi.org/10.1175/JCLI-D-15-0851.1, 2016.
Keil, P., Schmidt, H., Stevens, B., Byrne, M. P., Segura, H., and Putrasahan, D.: Tropical tropospheric warming pattern explained by shifts in convective heating in the Matsuno–Gill model, Q. J. Roy. Meteorol. Soc., 149, 2678–2695, https://doi.org/10.1002/qj.4526, 2023.
Kim, J., Grise, K. M., and Son, S.-W.: Thermal characteristics of the cold-point tropopause region in CMIP5 models, J. Geophys. Res.-Atmos., 118, 8827–8841, 2013.
Konopka, P., Tao, M., Ploeger, F., Hurst, D. F., Santee, M. L., Wright, J. S., and Riese, M.: Stratospheric Moistening After 2000, Geophys. Res. Lett., 49, e2021GL097609, https://doi.org/10.1029/2021GL097609, 2022.
Krüger, K., Tegtmeier, S., and Rex, M.: Long-term climatology of air mass transport through the Tropical Tropopause Layer (TTL) during NH winter, Atmos. Chem. Phys., 8, 813–823, https://doi.org/10.5194/acp-8-813-2008, 2008.
Kuang, Z. and Bretherton, C. S.: Convective Influence on the Heat Balance of the Tropical Tropopause Layer: A Cloud-Resolving Model Study, J. Atmos. Sci., 61, 2919–2927, https://doi.org/10.1175/JAS-3306.1, 2004.
Kursinski, E. R., Hajj, G. A., Schofield, J. T., Linfield, R. P., and Hardy, K. R.: Observing Earth's atmosphere with radio occultation measurements using the Global Positioning System, J. Geophys. Res., 102, 23429–23465, https://doi.org/10.1029/97JD01569, 1997.
Ladstädter, F., Steiner, A. K., and Gleisner, H.: Resolving the 21st century temperature trends of the upper troposphere–lower stratosphere with satellite observations, Sci. Rep., 13, 1306, https://doi.org/10.1038/s41598-023-28222-x, 2023.
Li, Y., Yang, S., Deng, Y., Hu, X., Cai, M., and Zhou, W.: Detection and attribution of upper-tropospheric warming over the tropical western Pacific, Clim. Dynam., 53, 3057–3068, https://doi.org/10.1007/s00382-019-04681-9, 2019.
Liess, S. and Geller, M. A.: On the relationship between QBO and distribution of tropical deep convection, J. Geophys. Res., 117, 2011JD016317, https://doi.org/10.1029/2011JD016317, 2012.
Lin, J. and Emanuel, K.: Tropospheric Thermal Forcing of the Stratosphere through Quasi-Balanced Dynamics, J. Atmos. Sci., 81, 561–582, https://doi.org/10.1175/JAS-D-23-0081.1, 2024.
Lin, P., Paynter, D., Ming, Y., and Ramaswamy, V.: Changes of the Tropical Tropopause Layer under Global Warming, J. Climate, 30, 1245–1258, https://doi.org/10.1175/JCLI-D-16-0457.1, 2017.
Livesey, N. J., Read, W. G., Froidevaux, L., Lambert, A., Santee, M. L., Schwartz, M. J., Millán, L. F., Jarnot, R. F., Wagner, P. A., Hurst, D. F., Walker, K. A., Sheese, P. E., and Nedoluha, G. E.: Investigation and amelioration of long-term instrumental drifts in water vapor and nitrous oxide measurements from the Aura Microwave Limb Sounder (MLS) and their implications for studies of variability and trends, Atmos. Chem. Phys., 21, 15409–15430, https://doi.org/10.5194/acp-21-15409-2021, 2021.
Livesey, N. J., Read, W. G., Wagner, P. A., Froidevaux, L., Santee, M. L., Schwartz, M. J., Lambert, A., Valle, L. F. M., Pumphrey, H. C., Manney, G. L., Fuller, R. A., Jarnot, R. F., Knosp, B. W., and Lay, R. R.: Version 5.0x Level 2 and 3 data quality and description document., Tech. Rep. JPL D-105336 Rev. B, Jet Propulsion Laboratory, California Institute of Technology, Pasadena, California, 91109-8099, available at: https://mls.jpl.nasa.gov/eos-aura-mls/documentation.php (last access: 19 June 2024), 2022 (data available at: https://disc.gsfc.nasa.gov, last access: 19 June 2024).
Long, C. S., Fujiwara, M., Davis, S., Mitchell, D. M., and Wright, C. J.: Climatology and interannual variability of dynamic variables in multiple reanalyses evaluated by the SPARC Reanalysis Intercomparison Project (S-RIP), Atmos. Chem. Phys., 17, 14593–14629, https://doi.org/10.5194/acp-17-14593-2017, 2017.
Maycock, A. C., Randel, W. J., Steiner, A. K., Karpechko, A. Y., Christy, J., Saunders, R., Thompson, D. W. J., Zou, C., Chrysanthou, A., Luke Abraham, N., Akiyoshi, H., Archibald, A. T., Butchart, N., Chipperfield, M., Dameris, M., Deushi, M., Dhomse, S., Di Genova, G., Jöckel, P., Kinnison, D. E., Kirner, O., Ladstädter, F., Michou, M., Morgenstern, O., O'Connor, F., Oman, L., Pitari, G., Plummer, D. A., Revell, L. E., Rozanov, E., Stenke, A., Visioni, D., Yamashita, Y., and Zeng, G.: Revisiting the Mystery of Recent Stratospheric Temperature Trends, Geophys. Res. Lett., 45, 9919–9933, https://doi.org/10.1029/2018GL078035, 2018.
Millán, L., Santee, M. L., Lambert, A., Livesey, N. J., Werner, F., Schwartz, M. J., Pumphrey, H. C., Manney, G. L., Wang, Y., Su, H., Wu, L., Read, W. G., and Froidevaux, L.: The Hunga Tonga-Hunga Ha'apai Hydration of the Stratosphere, Geophys. Res. Lett., 49, e2022GL099381, https://doi.org/10.1029/2022GL099381, 2022.
Mote, P. W., Rosenlof, K. H., McIntyre, M. E., Carr, E. S., Gille, J. C., Holton, J. R., Kinnersley, J. S., Pumphrey, H. C., Russell, J. M., and Waters, J. W.: An atmospheric tape recorder: The imprint of tropical tropopause temperatures on stratospheric water vapor, J. Geophys. Res., 101, 3989–4006, https://doi.org/10.1029/95JD03422, 1996.
Naujokat, B.: An update of the observed quasi-biennial oscillation of the stratospheric winds over the tropics, J. Atmos. Sci., 43, 1873–1877, 1986.
Nishimoto, E. and Shiotani, M.: Seasonal and interannual variability in the temperature structure around the tropical tropopause and its relationship with convective activities, J. Geophys. Res., 117, 2011JD016936, https://doi.org/10.1029/2011JD016936, 2012.
Plumb, R. A. and Bell, R. C.: Equatorial waves in steady zonal shear flow, Q. J. Roy. Meteorol. Soc., 108, 313–334, https://doi.org/10.1002/qj.49710845603, 1982.
Randel, W. and Park, M.: Diagnosing Observed Stratospheric Water Vapor Relationships to the Cold Point Tropical Tropopause, J. Geophys. Res.-Atmos., 124, 7018–7033, https://doi.org/10.1029/2019JD030648, 2019.
Randel, W. J. and Jensen, E. J.: Physical processes in the tropical tropopause layer and their roles in a changing climate, Nat. Geosci., 6, 169–176, https://doi.org/10.1038/ngeo1733, 2013.
Randel, W. J. and Wu, F.: Variability of Zonal Mean Tropical Temperatures Derived from a Decade of GPS Radio Occultation Data, J. Atmos. Sci., 72, 1261–1275, https://doi.org/10.1175/JAS-D-14-0216.1, 2015.
Randel, W. J., Wu, F., Oltmans, S. J., Rosenlof, K., and Nedoluha, G. E.: Interannual changes of stratospheric water vapor and correlations with tropical tropopause temperatures, J. Atmos. Sci., 61, 2133–2148, 2004.
Randel, W. J., Wu, F., Vömel, H., Nedoluha, G. E., and Forster, P.: Decreases in stratospheric water vapor after 2001: Links to changes in the tropical tropopause and the Brewer-Dobson circulation, J. Geophys. Res., 111, 2005JD006744, https://doi.org/10.1029/2005JD006744, 2006.
Randel, W. J., Polvani, L., Wu, F., Kinnison, D. E., Zou, C., and Mears, C.: Troposphere-Stratosphere Temperature Trends Derived From Satellite Data Compared With Ensemble Simulations From WACCM, J. Geophys. Res.-Atmos., 122, 9651–9667, https://doi.org/10.1002/2017JD027158, 2017.
Riese, M., Ploeger, F., Rap, A., Vogel, B., Konopka, P., Dameris, M., and Forster, P.: Impact of uncertainties in atmospheric mixing on simulated UTLS composition and related radiative effects, J. Geophys. Res.-Atmos., 117, D16305, https://doi.org/10.1029/2012JD017751, 2012.
Rosenlof, K. H. and Reid, G. C.: Trends in the temperature and water vapor content of the tropical lower stratosphere: Sea surface connection, J. Geophys. Res., 113, 2007JD009109, https://doi.org/10.1029/2007JD009109, 2008.
Santer, B. D., Wigley, T. M. L., Mears, C., Wentz, F. J., Klein, S. A., Seidel, D. J., Taylor, K. E., Thorne, P. W., Wehner, M. F., Gleckler, P. J., Boyle, J. S., Collins, W. D., Dixon, K. W., Doutriaux, C., Free, M., Fu, Q., Hansen, J. E., Jones, G. S., Ruedy, R., Karl, T. R., Lanzante, J. R., Meehl, G. A., Ramaswamy, V., Russell, G., and Schmidt, G. A.: Amplification of Surface Temperature Trends and Variability in the Tropical Atmosphere, Science, 309, 1551–1556, https://doi.org/10.1126/science.1114867, 2005.
Sassen, K., Wang, Z., and Liu, D.: Cirrus clouds and deep convection in the tropics: Insights from CALIPSO and CloudSat, J. Geophys. Res., 114, 2009JD011916, https://doi.org/10.1029/2009JD011916, 2009.
Seidel, D. J. and Randel, W. J.: Variability and trends in the global tropopause estimated from radiosonde data, J. Geophys. Res., 111, 2006JD007363, https://doi.org/10.1029/2006JD007363, 2006.
Smith, C. A., Haigh, J. D., and Toumi, R.: Radiative forcing due to trends in stratospheric water vapour, Geophys. Res. Lett., 28, 179–182, https://doi.org/10.1029/2000GL011846, 2001.
Song, X., Zhang, G. J., and Cai, M.: Quantifying contributions of climate feedbacks to tropospheric warming in the NCAR CCSM3.0, Clim. Dynam., 42, 901–917, https://doi.org/10.1007/s00382-013-1805-x, 2014.
Steiner, A. K., Ladstädter, F., Randel, W. J., Maycock, A. C., Fu, Q., Claud, C., Gleisner, H., Haimberger, L., Ho, S.-P., Keckhut, P., Leblanc, T., Mears, C., Polvani, L. M., Santer, B. D., Schmidt, T., Sofieva, V., Wing, R., and Zou, C.-Z.: Observed Temperature Changes in the Troposphere and Stratosphere from 1979 to 2018, J. Climate, 33, 8165–8194, https://doi.org/10.1175/JCLI-D-19-0998.1, 2020.
Tao, M., Konopka, P., Wright, J. S., Liu, Y., Bian, J., Davis, S. M., Jia, Y., and Ploeger, F.: Multi-decadal variability controls short-term stratospheric water vapor trends, Commun. Earth Environ., 4, 441, https://doi.org/10.1038/s43247-023-01094-9, 2023.
Tegtmeier, S., Anstey, J., Davis, S., Dragani, R., Harada, Y., Ivanciu, I., Pilch Kedzierski, R., Krüger, K., Legras, B., Long, C., Wang, J. S., Wargan, K., and Wright, J. S.: Temperature and tropopause characteristics from reanalyses data in the tropical tropopause layer, Atmos. Chem. Phys., 20, 753–770, https://doi.org/10.5194/acp-20-753-2020, 2020a.
Tegtmeier, S., Anstey, J., Davis, S., Ivanciu, I., Jia, Y., McPhee, D., and Pilch Kedzierski, R.: Zonal Asymmetry of the QBO Temperature Signal in the Tropical Tropopause Region, Geophys. Res. Lett., 47, e2020GL089533, https://doi.org/10.1029/2020GL089533, 2020b.
Thomason, L. W., Ernest, N., Millán, L., Rieger, L., Bourassa, A., Vernier, J.-P., Manney, G., Luo, B., Arfeuille, F., and Peter, T.: A global space-based stratospheric aerosol climatology: 1979–2016, Earth Syst. Sci. Data, 10, 469–492, https://doi.org/10.5194/essd-10-469-2018, 2018.
Thompson, A. M., Stauffer, R. M., Wargan, K., Witte, J. C., Kollonige, D. E., and Ziemke, J. R.: Regional and Seasonal Trends in Tropical Ozone From SHADOZ Profiles: Reference for Models and Satellite Products, J. Geophys. Res.-Atmos., 126, e2021JD034691, https://doi.org/10.1029/2021JD034691, 2021.
Vergados, P., Ao, C. O., Mannucci, A. J., and Kursinski, E. R.: Quantifying the Tropical Upper Tropospheric Warming Amplification Using Radio Occultation Measurements, Earth Space Sci., 8, e2020EA001597, https://doi.org/10.1029/2020EA001597, 2021.
Vogel, B., Feck, T., and Grooß, J.-U.: Impact of stratospheric water vapor enhancements caused by CH4 and H2O increase on polar ozone loss, J. Geophys. Res., 116, D05301, https://doi.org/10.1029/2010JD014234, 2011.
Vömel, H., Evan, S., and Tully, M.: Water vapor injection into the stratosphere by Hunga Tonga-Hunga Ha'apai, Science, 377, 1444–1447, https://doi.org/10.1126/science.abq2299, 2022.
Von Engeln, A., Andres, Y., Marquardt, C., and Sancho, F.: GRAS radio occultation on-board of Metop, Adv. Space Res., 47, 336–347, https://doi.org/10.1016/j.asr.2010.07.028, 2011.
Wallace, J. M., Panetta, R. L., and Estberg, J.: Representation of the equatorial stratospheric quasi-biennial oscillation in EOF phase space, J. Atmos. Sci., 50, 1751–1762, 1993.
Wang, J. S., Seidel, D. J., and Free, M.: How well do we know recent climate trends at the tropical tropopause?, J. Geophys. Res., 117, 2012JD017444, https://doi.org/10.1029/2012JD017444, 2012.
Wang, P., Minnis, P., McCormick, M. P., Kent, G. S., and Skeens, K. M.: A 6-year climatology of cloud occurrence frequency from Stratospheric Aerosol and Gas Experiment II observations (1985–1990), J. Geophys. Res., 101, 29407–29429, https://doi.org/10.1029/96JD01780, 1996.
Wang, W., Matthes, K., Schmidt, T., and Neef, L.: Recent variability of the tropical tropopause inversion layer, Geophys. Res. Lett., 40, 6308–6313, https://doi.org/10.1002/2013GL058350, 2013.
Waters, J. W., Froidevaux, L., Harwood, R. S., Jarnot, R. F., Pickett, H. M., Read, W. G., Siegel, P. H., Cofield, R. E., Filipiak, M. J., Flower, D. A., Holden, J. R., Lau, G. K., Livesey, N. J., Manney, G. L., Pumphrey, H. C., Santee, M. L., Wu, D. L., Cuddy, D. T., Lay, R. R., Loo, M. S., Perun, V. S., Schwartz, M. J., Stek, P. C., Thurstans, R. P., Boyles, M. A., Chandra, K. M., Chavez, M. C., Gun-Shing Chen, Chudasama, B. V., Dodge, R., Fuller, R. A., Girard, M. A., Jiang, J. H., Yibo Jiang, Knosp, B. W., LaBelle, R. C., Lam, J. C., Lee, K. A., Miller, D., Oswald, J. E., Patel, N. C., Pukala, D. M., Quintero, O., Scaff, D. M., Van Snyder, W., Tope, M. C., Wagner, P. A., and Walch, M. J.: The Earth observing system microwave limb sounder (EOS MLS) on the aura Satellite, IEEE Trans. Geosci. Remote Sens., 44, 1075–1092, https://doi.org/10.1109/TGRS.2006.873771, 2006.
Wickert, J., Reigber, C., Beyerle, G., König, R., Marquardt, C., Schmidt, T., Grunwaldt, L., Galas, R., Meehan, T. K., Melbourne, W. G., and Hocke, K.: Atmosphere sounding by GPS radio occultation: First results from CHAMP, Geophys. Res. Lett., 28, 3263–3266, https://doi.org/10.1029/2001GL013117, 2001.
Xie, F., Tian, W., and Chipperfield, M. P.: Radiative effect of ozone change on stratosphere-troposphere exchange, J. Geophys. Res., 113, 2008JD009829, https://doi.org/10.1029/2008JD009829, 2008.
Xie, F., Li, J., Tian, W., Li, Y., and Feng, J.: Indo-Pacific Warm Pool Area Expansion, Modoki Activity and Tropical Cold-Point Tropopause Temperature Variations, Sci. Rep., 4, 4552, https://doi.org/10.1038/srep04552, 2014.
Yulaeva, E. and Wallace, J. M.: The signature of ENSO in global temperature and precipitation fields derived from the microwave sounding unit, J. Climate, 7, 1719–1736, 1994.