the Creative Commons Attribution 4.0 License.
the Creative Commons Attribution 4.0 License.
 | 21 Jun 2024
Microphysical characteristics of precipitation within convective overshooting over East China observed by GPM DPR and ERA5
Nan Sun
Gaopeng Lu
Yunfei Fu
We examine the geographical distribution and microphysical three-dimensional structure of convective overshooting over East China by matching the Global Precipitation Measurement Dual-frequency Precipitation Radar (GPM DPR) instrument with the European Centre for Medium-Range Weather Forecasts Fifth-Generation Reanalysis (ERA5). Convective overshooting mainly occurs over Northeast China (NC) and northern Middle and East China (MEC), and its frequency varies from to . Radar reflectivity of convective overshooting over NC accounts for a higher proportion below the freezing level, while MEC and South China (SC) account for a higher proportion above the freezing level, indicating stronger upward motion and more ice crystal particles. The microphysical processes within convective overshooting are unique, leading to various properties of the droplets in precipitation. Droplets of convective overshooting are large but sparse, with an effective droplet radius of nearly 2.5 mm below 10 km, which is about twice that of non-overshooting precipitation. The findings of this study may have important implications for the microphysical evolution associated with convective overshooting and provide more accurate precipitation microphysical parameters as input for model simulations.
- Article
(5259 KB) - Full-text XML
- BibTeX
- EndNote


Convective overshooting provides a rapid transport mechanism that can irreversibly transport water vapor and chemical constituents from the lower troposphere to the upper troposphere and lower stratosphere (UTLS) by mixing them with environmental air (Fueglistaler et al., 2004; Frey et al., 2015); this has a direct impact on radiation balance and global climate change (Solomon et al., 2010). As one of the main sources of ozone destroying OH hydroxyl radicals, stratospheric water vapor can help to destroy ozone, which has potential effects on radiative forcing (Anderson et al., 2012). Water vapor enters the stratosphere mainly through the tropical tropopause layer. Several studies show that tropical convective overshooting has a net dehydrating effect on the stratospheric humidity (Danielsen, 1993; Sherwood and Dessler, 2001), while modeling and observational studies have universally shown tropical convective overshooting hydrating the stratosphere (Chaboureau et al., 2007; Jensen et al., 2007; de Reus et al., 2009; Avery et al., 2017) because of the injection of ice mass into the stratosphere (Grosvenor et al., 2007; Corti et al., 2008; Chemel et al., 2009; Khaykin et al., 2009). At midlatitudes, observations and model simulations show that deep convective overshooting is also an important source for lower-stratosphere water vapor (Liu and Liu, 2016; Smith et al., 2017; Liu et al., 2020; Werner et al., 2020; Wang et al., 2023). Wang et al. (2023) use a high-resolution numerical model to study convective overshooting moistening in the midlatitude lower stratosphere, and results show that convective water vapor plumes above 380 K temperature are stable in the stratosphere, while those closer to the tropopause and cloud tops are less stable. In addition to these impacts on water vapor, the effects of convective overshooting on the temperature of the UTLS have also attracted much attention (Sherwood et al., 2003; Chae et al., 2011; Biondi et al., 2012). Given these potentially significant impacts, it is of high importance to understand the characteristics of convective overshooting, which have attracted considerable attention in recent years (Johnston et al., 2018; Muhsin et al., 2018).
Perhaps one of the most poorly understood features of convective overshooting is the microphysical structure of precipitation, such as particle size, concentration, phase state, and other parameters. Understanding the microphysical characteristics of convective overshooting is helpful to clarify the efficiency of water vapor transport to the lower stratosphere by convective overshooting. Furthermore, the microphysical processes within convective overshooting are closely related to storm dynamics and thermodynamics through latent heat, and the quantitative description of microphysical characteristics is helpful in improving the accuracy of model simulation parameters (Homeyer and Kumjian, 2015). In addition, thunderstorms with overshooting tops are closely associated with hazardous weather at the Earth's surface, such as heavy rainfall, large hail, damaging winds, and tornadoes (Reynolds, 1980; Negri and Adler, 1981; Fujita, 1989; Kellenbenz et al., 2007; Brunner et al., 2007; Setvák et al., 2010; Dworak et al., 2012; Line et al., 2016; Bedka et al., 2018; Marion et al., 2019), indicating the application of overshooting detections for severe weather warnings (McCann, 1983; Bedka, 2011; Homeyer and Kumjian, 2015). Bedka (2011) has studied the relationship between overshooting cloud tops with severe weather over Europe, and results show that overshooting was found near 47 % of the confirmed severe weather events. Specifically, the overshooting top–severe weather relationship is strong for large hail (53 %) and severe wind (52 %) but relatively weak for tornado events (14 %). Dworak et al. (2012) show that severe weather has often been associated with overshooting detections during the warm season (April–September). Furthermore, convective overshooting generates gravity waves, and gravity wave breaking generates turbulence, which is of fundamental importance in the generation of small-scale motions that influence aircraft (Lane and Sharman, 2006). Tens of commercial airline passengers are injured each year over the continental United States during turbulence-related aviation incidents (Lane et al., 2003). Cloud-to-ground lightning is also found to occur frequently near the convective-overshooting region, which is also a threat to aviation safety (Bedka, 2011). In summary, hazardous weather accompanied by convective overshooting seriously harms the social economy and human production and life. Quantitative study of the precipitation structure of convective overshooting can help in understanding the relationship between convective overshooting and severe weather like heavy rainfall, providing a predictor for severe weather warning and ensuring aviation safety. Liu et al. (2012) studied the climatological characteristics of convective overshooting and found convective overshooting shows remarkable regionality and seasonal variations. Homeyer and Kumjian (2015) observed the radar reflectivity characteristics of convective overshooting from the analysis of polarimetric radar observations. Although the above studies have explored the characteristics of some precipitation parameters within the context of convective overshooting, we still lack an understanding of other precipitation microphysical parameters and more detailed microphysical processes within convective overshooting due to the limitations of observation methods.
To fully study the microphysical characteristics of convective overshooting, accurate methods of detecting the frequency and long-term distribution of convective overshooting are required. The traditional way to detect convective overshooting from satellites is to find pixels in infrared imagery with brightness temperatures colder than a given temperature threshold (Machado et al., 1998; Rossow and Pearl, 2007). Gettelman et al. (2002) have studied the cloud regions colder than the tropopause temperature on infrared images and have found that the frequency of tropical convective overshooting is about 0.5 %. However, it is impossible to guarantee that the low value of infrared brightness temperature represents clouds penetrating the tropopause rather than cirrus or anvil cloud in the upper air due to the lack of vertical structure information of convection. Also, overshoots mix with relatively warm stratosphere air such that cold pixels are often diminished and not a reliable means to identify overshooting. With the launch of precipitation radar aboard the Tropical Rainfall Measuring Mission (TRMM), three-dimensional structure information of precipitation within the convective overshooting can be provided (Alcala and Dessler, 2002; Liu and Zipser, 2005), and a new method for detecting the convective overshooting is proposed whereby pixels with rain top height higher than tropopause height are found (Xian and Fu, 2015; Sun et al., 2021), improving the accuracy of detecting convective overshooting. Still, TRMM PR cannot provide precipitation microphysical information, which limits our study on the internal microphysical structure within convective overshooting. Besides, TRMM PR can underestimate the height of convective overshooting because of only being sensitive to large precipitation particles (sensitivity at ∼ 17 dBZ) (Takahashi and Luo, 2014).
As the continuation of TRMM PR, the Global Precipitation Measurement (GPM) mission carrying the first radar of its kind, the Dual-frequency Precipitation Radar (DPR), launched in February 2014. GPM DPR includes two bands of precipitation radar, which provides excellent opportunities for studying the microphysical structure of precipitation (Sun et al., 2022a). Liu and Liu (2016) and Liu et al. (2020) have used GPM KuPR and the ERA-Interim 6-hourly dataset to study the climatology and detection of convective overshooting. However, the above studies only use the KuPR data and mainly focus on the geographical distribution; the vertical and microphysical precipitation structure of convective overshooting remains unknown.
East China is a densely populated area, an area of economic concentration, and an important food-producing area in China. Affected by the circulation anomalies of the East Asian tropical and subtropical monsoon and their interactions, extreme precipitation events occur frequently over East China. Many scholars have studied the characteristics of precipitation in East China (Zhang and Fu, 2018; Xu, 2020), but few have studied the characteristics of convective overshooting and its internal precipitation microphysical structure over East China, which can not only help flood prevention work in summer over East China, but also ensure social economic development to a certain extent. In addition, there are thousands of aircraft that operate over East China, carrying hundreds of millions of passengers every year. In view of the impact of convective overshooting on social economic and aviation safety, it is necessary to conduct relevant research on East China. The purpose of this study is to examine the microphysical characteristics of convective overshooting over East China by matching the precipitation data from GPM DPR and meteorological parameters from ERA5. We will focus on the vertical structure of precipitation within convective overshooting and further explore its microphysical structure feature of precipitation.
2.1 DPR-based precipitation dataset
GPM DPR includes KuPR (Ku band, 13.6 GHz) and KaPR (Ka band, 35.5 GHz), two bands of the precipitation radar. KuPR is similar to TRMM PR and has a longer wavelength, which is better at detecting heavy precipitation (the minimum detected precipitation is about 0.5 mm h−1). However, KaPR has a shorter wavelength, which is more sensitive to weak precipitation (the minimum detected precipitation is about 0.2 mm h−1). Based on the different echo characteristics of Ku band and Ka band, the dual-channel inversion algorithm can be used to retrieve the droplet size distribution (DSD). Here we use the precipitation datasets provided by the GPM level 2 product 2ADPR in version 6. The horizontal resolution is 5 km, and the vertical resolution is 125 m. The precipitation microphysical parameters provided by GPM 2ADPR include droplet concentration (dBN0) and effective radius (D0).
2.2 ERA5-based meteorological dataset
The meteorological data are from ERA5 reanalysis product, whose name is “ERA5 hourly data on pressure levels from 1940 to present”. And the following parameters are used in this paper: temperature, specific humidity, vertical velocity, U component of wind, and V component of wind. The time resolution is 1 h, and the horizontal resolution is 0.25° × 0.25°. Vertical coverage is 1000 to 1 hPa, and vertical resolution is 37 pressure levels (1000, 975, 950, 925, 900, 875, 850, 825, 800, 775, 750, 700, 650, 600, 550, 500, 450, 400, 350, 300, 250, 225, 200, 175, 150, 125, 100, 70, 50, 30, 20, 10, 7, 5, 3, 2, 1 hPa).
2.3 Detection method of convective overshooting
Convective overshooting is defined as occurring where the storm top height is above the real-time tropopause height in a precipitation pixel. Obtaining correct tropopause height data with high spatial and temporal resolution is the most important and difficult step in convective-overshooting detection. On the one hand, the determination of the tropopause is still under debate. At present, the following four definitions of the tropopause are widely adopted throughout the world: cold-point tropopause, thermal tropopause, dynamic tropopause, and ozone tropopause. The cold-point tropopause is only physically meaningful in the latitude zone 10° S–10° N near the Equator (Highwood and Hoskins, 1998; Rodriguez-Franco and Cuevas, 2013). The dynamic tropopause is based on the differing values of potential vorticity in the troposphere and stratosphere and applies to extratropical areas (Danielsen et al., 1987; Holton et al., 1995). The ozone tropopause is defined based on ozone sounding profiles, whose disadvantage is that the choice of ozone mixing ratio thresholds varies with region and season (Bethan et al., 1996; Zahn et al., 2004). Therefore, this paper uses the thermal tropopause, which is defined by the World Meteorological Organization (WMO) (WMO, 1957). The thermal tropopause is based on the temperature lapse rate and is also known as the lapse-rate tropopause. The accurate calculation of the tropopause height based on this definition, on the other hand, depends on the temperature profile data with high spatial and temporal resolution. The latest generation of ECMWF reanalysis data, ERA5, provides hourly estimates of a large number of atmospheric, land, and oceanic climate variables and has attracted much attention due to its much higher spatial and temporal resolution than its predecessor ERA-Interim, especially in the upper troposphere and lower stratosphere (Hoffmann et al., 2019). Sun et al. (2022b) verified the accuracy of the tropopause height calculated from temperature profiles of ERA5 by comparing ERA5 with other popular datasets. Based on the above analysis, the process of convective-overshooting detection is shown as follows.
Firstly, match each pixel of GPM DPR detection with ERA5 grid data using the principle of the nearest method. The matching time between GPM and ERA5 is 1 h, and the matching range is 0.25° × 0.25°. Storm top height is obtained from GPM DPR.
Secondly, real-time tropopause height is calculated from the temperature profiles from ERA5 according to the definition from the World Meteorological Organization (WMO, 1957). The algorithmic process is shown as follows: firstly, find the X layer whose atmospheric lapse rate is 2 K km−1 or less, starting from the first layer (near the ground) of the temperature profile, and then judge whether the atmospheric lapse rate does not exceed 2 K km−1 between the X level and all higher levels within 2 km; if so, the height of X layer is the tropopause height, and if not, repeat the above algorithm starting from the X layer until the tropopause layer is found.
At last, convective overshooting is identified based on the storm top height and tropopause height.
2.4 Study areas
The study areas are marked as black boxes in Fig. 1a, and only the land parts are studied because characteristics of the vertical structure of precipitation over land and sea are very different; this study is limited in space and focuses only on the land region. Using years of NCEP/NCAR Reanalysis data, Xia (2015) analyzed the climatic feature of temperature and water vapor in China and divided China into different climatic zones. To have a better understanding of precipitation microphysical structure over different regions of East China, we also divided East China into three climatic zones according to its climatic characteristics and previous studies (Xia, 2015; Sun et al., 2022a). From north to south, they are Northeast China (NC; 38–50° N, 118–130° E), Middle and East China (MEC; 26.5–38° N, 112–123° E), and South China (SC; 18–26.5° N, 108–123° E). For the three regions, the lower-latitude areas have higher surface temperature, a greater temperature lapse rate, and lower temperature of the stratosphere. Temperature profiles of same latitude are essentially the same over SC and MEC, and meridional differences over NC exist in temperature signals. Atmospheric humidity has remarkable regional characteristics. SC is wetter, with a surface relative humidity of more than 70 %, while NC and MEC are drier and their humidity ranges from 50 % to 70 % (Xia, 2015). The study time frame is defined as the time from 2014 to 2020 in summer (June, July, and August)
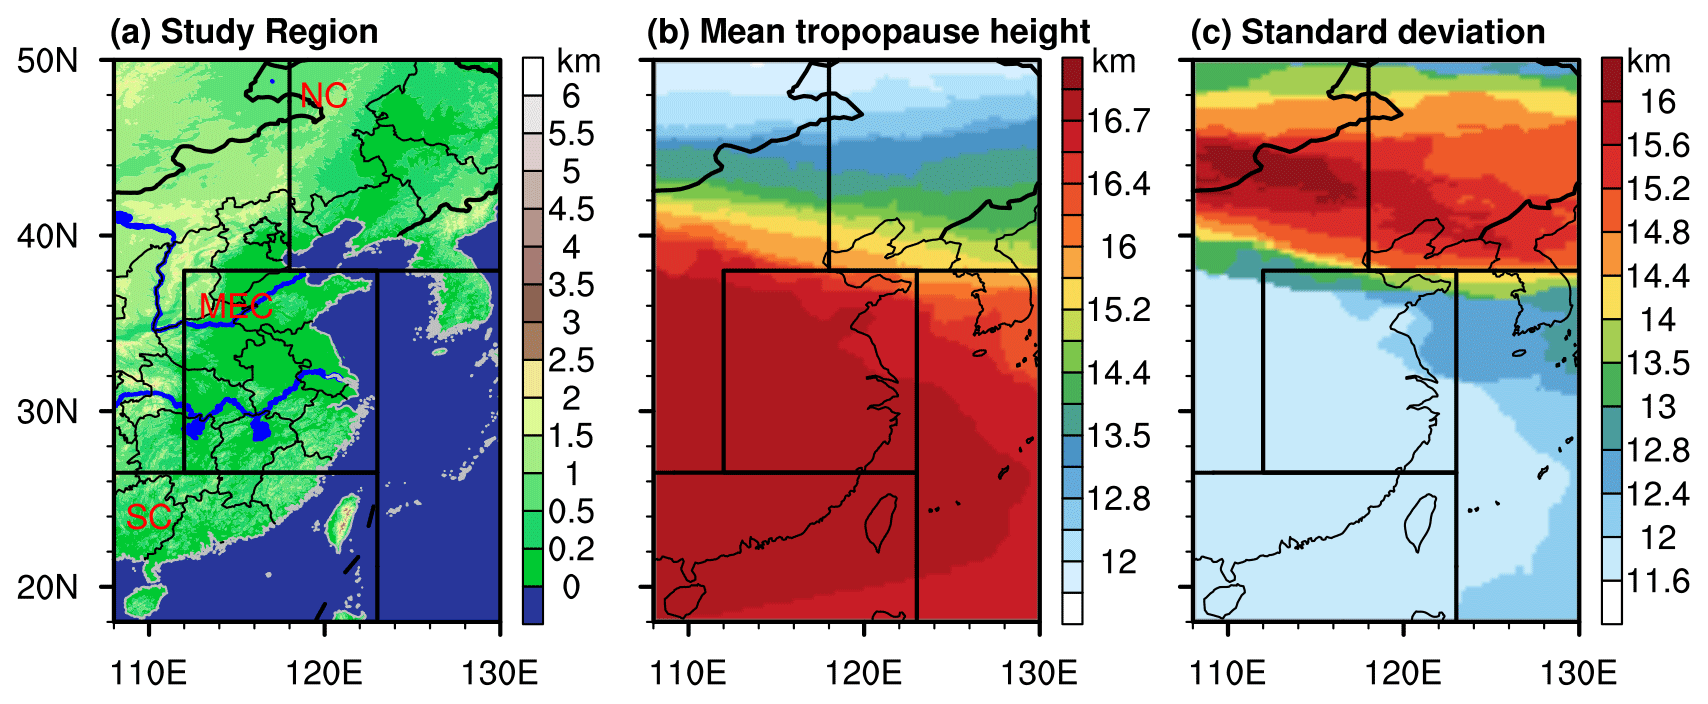
Figure 1Study areas and their tropopause characteristics. (a) Regionalization of East China (black boxes: divisions between NC, MEC, and SC; only the land surface is studied) and their terrain features. (b) Climatological mean of tropopause height from 2014 to 2020 in summer (June, July, and August). (c) Distribution of standard deviation of tropopause height. Publisher's remark: please note that the above figure contains disputed territories.
3.1 Case studies
Three cases selected from NC, MEC, and SC are analyzed to lay a foundation for the subsequent statistical analysis. The precipitation characteristics of the three cases are shown in Fig. 2. Case 1 (C1) occurs in NC at 14:00 UTC on 1 July 2017. Convective overshooting is observed in a total of 65 pixels for C1, whose mean rain rate is 20.7 mm h−1 (Fig. 2a) and mean storm top height is 14.1 km (Fig. 2b). The strong radar reflectivity along A1–B1 occurs 35–95 km away from point A1, and the strongest echo is up to 50 dBZ, appearing at 0–5 km (Fig. 2c). The maximum echo height is about 15 km, 2 km higher than the tropopause height. Case 2 (C2) occurs in MEC at 13:00 UTC on 30 July 2015. Convective overshooting is observed in a total of 58 pixels for C2, and their mean rain rate is 29.7 mm h−1 (Fig. 2d) and mean storm top height is 15.2 km (Fig. 2e). The radar echo along A2–B2 is very strong, and the strongest echo is up to 50 dBZ, which is about 45–95 km away from point A2 (Fig. 2f). The highest echo can reach to about 17 km altitude. Case 3 (C3) occurs in SC at 17:00 UTC on 13 June 2015. Convective overshooting is observed in a total of 8 pixels for C3, and their mean rain rate is 46.3 mm h−1 (Fig. 2g) and mean storm top height is 16.9 km (Fig. 2h). The strongest echo occurs at 60–70 km away from point A3, and the highest echo can reach to 17.2 km, about 0.5 km higher than the tropopause height (Fig. 2i).
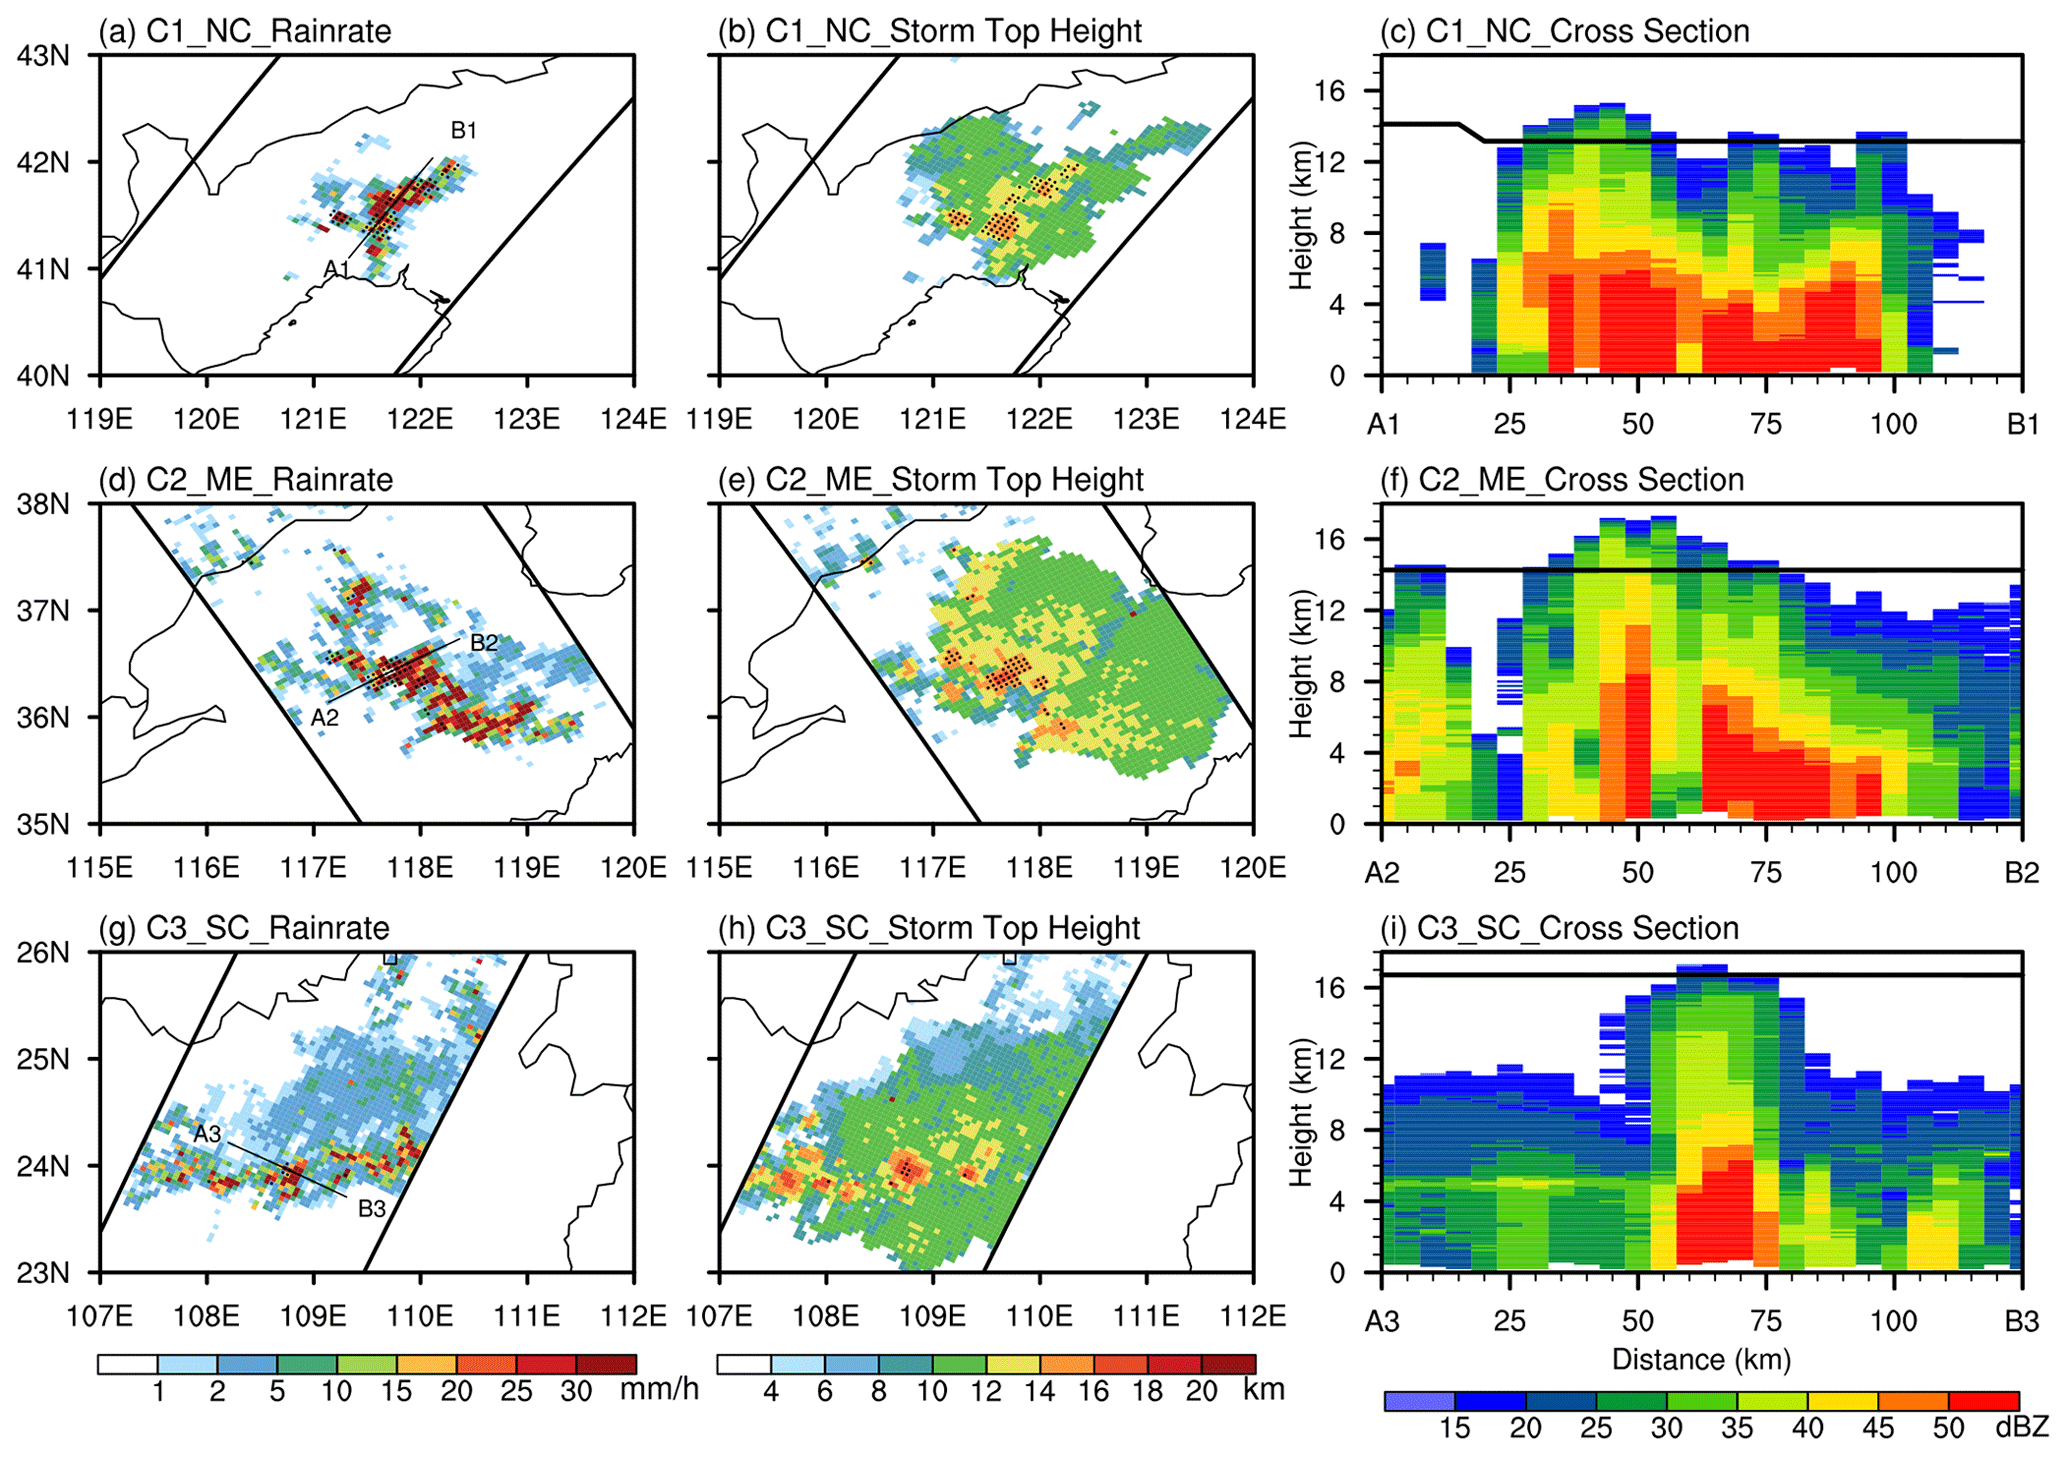
Figure 2Precipitation characteristics of convective-overshooting cases. (a) Distribution of the rain rate of Case 1 (C1). (The pixels in which convective overshooting occurs are marked as black points.) (b) Distribution of the storm top height of C1. (c) Radar reflectivity cross section along A1–B1; the black line shows the tropopause height along A1–B1. (d) Distribution of the rain rate of C2. (e) Distribution of the storm top height of C2. (f) Radar reflectivity cross section along A2–B2. (g) Distribution of the rain rate of C3. (h) Distribution of the storm top height of C3. (i) Radar reflectivity cross section along A3–B3.
To learn about the characteristics of the large-scale circulation for these three cases, we calculate the distribution of precipitable water vapor (PWV), streamlines, and vertical velocity (VV), and locations of the three cases are shown as the black boxes in Fig. 3. In general, areas in which convective overshooting occurs have abundant PWV and strong ascending movement. In C1, the PWV of the region in which convective overshooting occurs is between 50 and 55 mm, which is higher than otherwise (Fig. 3a). Upward motion near the convective overshooting is strong, ranging from −0.03 to −0.12 Pa s−1, contributing to the occurrence of convective overshooting (Fig. 3b). The PWV of C2 is more abundant than C1, and the PWV of the area in which convective overshooting occurs is between 55 and 60 mm (Fig. 3c). The VV near the convective overshooting is mostly between −0.09 and −0.15 Pa s−1 (Fig. 3d). In C3, the PWV near the precipitation area and convective-overshooting area is the most abundant compared with C1 and C2, with its maximum exceeding 70 mm (Fig. 3e). Upward movement near the precipitation area and convective-overshooting area is very strong, and the VV is between −0.12 and −0.18 Pa s−1, which provides abundant water vapor and dynamic conditions for the occurrence of convective overshooting.
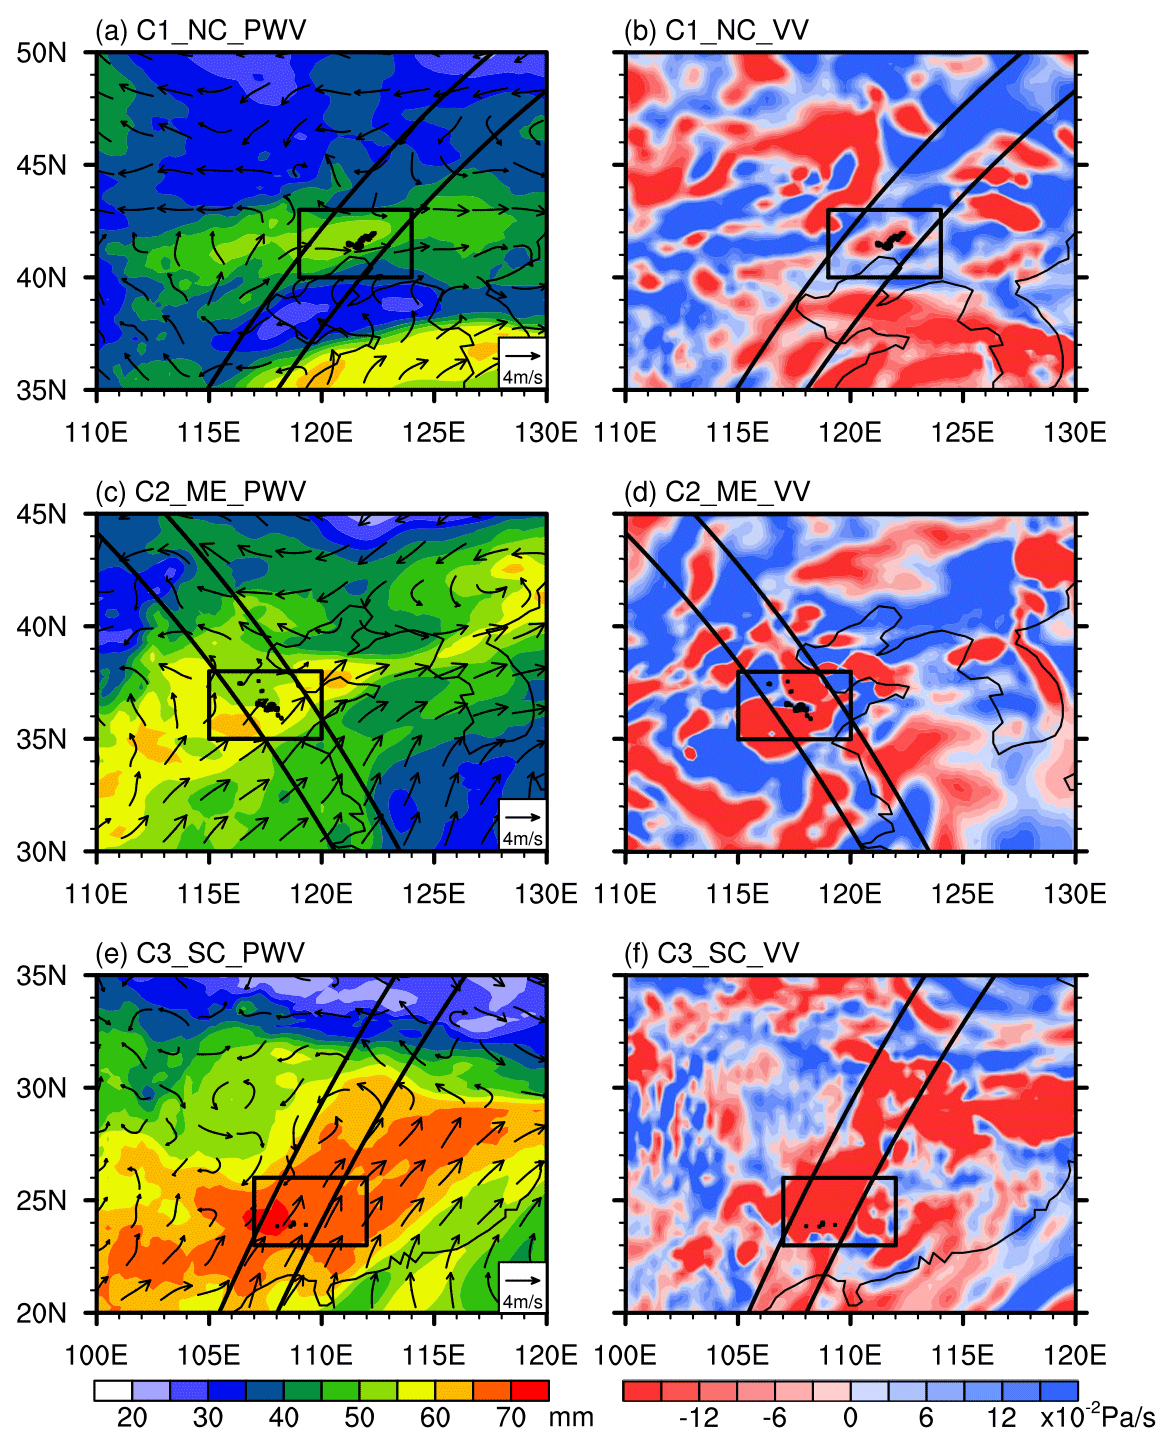
Figure 3Characteristics of large-scale circulation of convective-overshooting cases. (a) Distribution of precipitable water vapor (PWV) and streamlines at 850 hPa of C1. The area where the case occurred is marked with large black boxes, and the pixels in which convective overshooting occurs are marked as small black boxes. The black line is the GPM detection orbit. (b) Distribution of vertical velocity (VV) at 500 hPa of C1. (c) Distribution of PWV and streamlines of C2. (d) Distribution of VV of C2. (e) Distribution of PWV and streamlines of C3. (f) Distribution of VV of C3.
3.2 Statistical results
3.2.1 Geographical distribution
Firstly, the horizontal-distribution characteristics of convective overshooting over East China are analyzed by designing a more accurate algorithm for convective-overshooting determination. Accurate determination of tropopause height is the first step of the convective-overshooting determination algorithm. We first analyze the geographical distribution of the climatological mean of the tropopause height over East China calculated from ERA5, shown in Fig. 1b. In general, the tropopause height over East China is between 11.6 and 16.7 km and has an obvious zonal distribution pattern: tropopause height over SC and southern MEC (18–36° N) is the highest and has small spatial variabilities, concentrated at ∼ 16.7 km. Over northern MEC (36–38° N), tropopause height decreases and forms a gradient, which decreases to 16 km. Tropopause height over NC is the lowest and continues to decrease in a gradient pattern from south to north, decreasing to 13 km near central NC (45° N) and 12 km near northern NC (48° N). The minimum standard deviation of tropopause height appears in SC, along with central and southern MEC, and is lower than 0.2 km. From northern MEC to northern NC, the standard deviation first increases and then decreases, reaching a maximum of more than 2 km around 42° N, and standard deviation over NC is generally above 1 km.
Obtaining storm top height from precipitation data is the second step of the convective-overshooting algorithm. Figure 4 shows the geographical distribution of storm top height for total precipitation, convective precipitation, and convective overshooting. Total precipitation represents all pixels with a rain rate higher than 0 mm h−1 detected by GPM DPR, and those pixels whose rain type is “convective” are defined as convective precipitation. As shown, mean storm top height over East China varies from 4.5 to 8.5 km, while convective storm top height is mainly distributed between 3.5 and 9 km. Convective storm top heights over NC and northern MEC are the highest, with most areas exceeding 6.5 km, and as we noted above, tropopause height in these two regions is lower (Fig. 1b); it can be inferred that convective-overshooting events are more likely to occur. Further analysis of the frequency of convective overshooting in the following text will confirm this point. Compared with NC, convective storm top height over SC and southern MEC is lower, mainly distributed below 6.5 km. The storm top height of convective overshooting ranges from 10 to 21 km (Fig. 4c), much higher than normal precipitation (total and convective precipitation) and increasing gradually from north to south. Storm top heights of convective overshooting over NC and northern MEC are low, distributed between 10 and 16 km, which is due to a lower tropopause height (Fig. 1b) allowing convection with a lower storm top height to reach the stratosphere. This lowers the mean storm top height of convective overshooting in these regions, while tropopause heights over SC and southern MEC range from 16 km to 21 km (Fig. 1b), allowing only strong convection to reach the stratosphere.
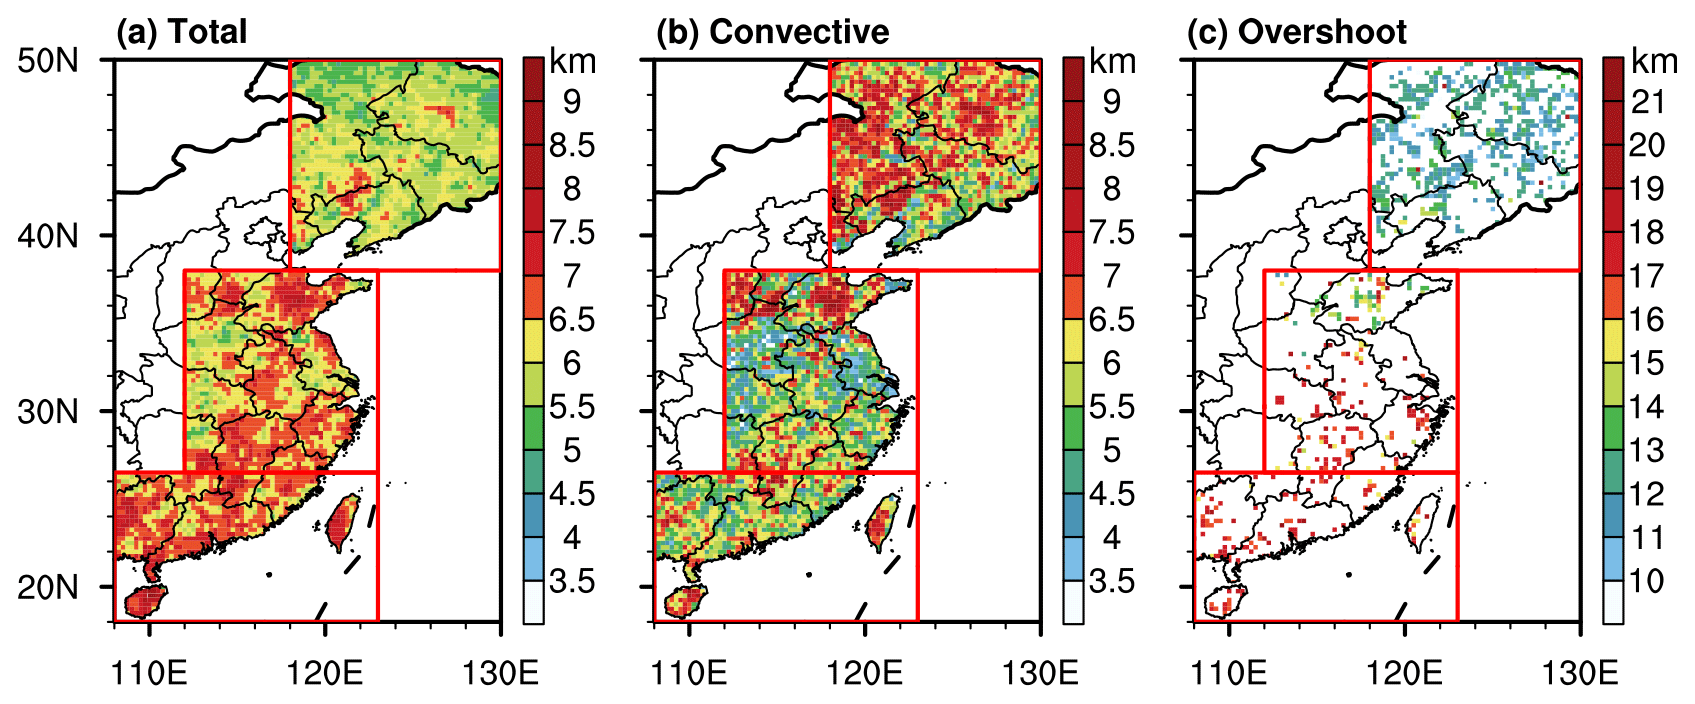
Figure 4Geographical distribution of storm top height. (a) Distribution of storm top height for total precipitation. (b) Distribution of storm top height for convective precipitation. (c) Distribution of storm top height for convective overshooting. Publisher's remark: please note that the above figure contains disputed territories.
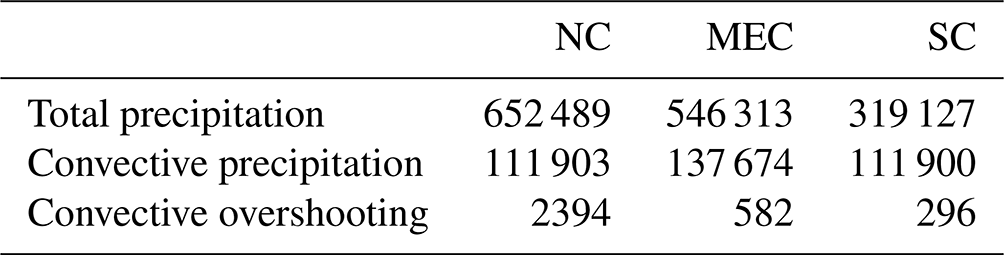
The frequency of convective overshooting is defined as the number of convective-overshooting events divided by the total observed sample number of GPM DPR. Statistical results indicate that the frequency of the convective overshooting over East China is very low, with a magnitude of only 10−3, varying regionally (Fig. 5). The sample size of convective overshooting over NC is the highest, followed by MEC, and SC is the lowest (Table 1). Convective overshooting over NC and northern MEC, whose frequency ranges from to (Fig. 5), occurs more frequently than over SC and southern MEC, whose frequency is between and , which is mainly because the former has a lower tropopause height and it is easier for convective overshooting to occur.
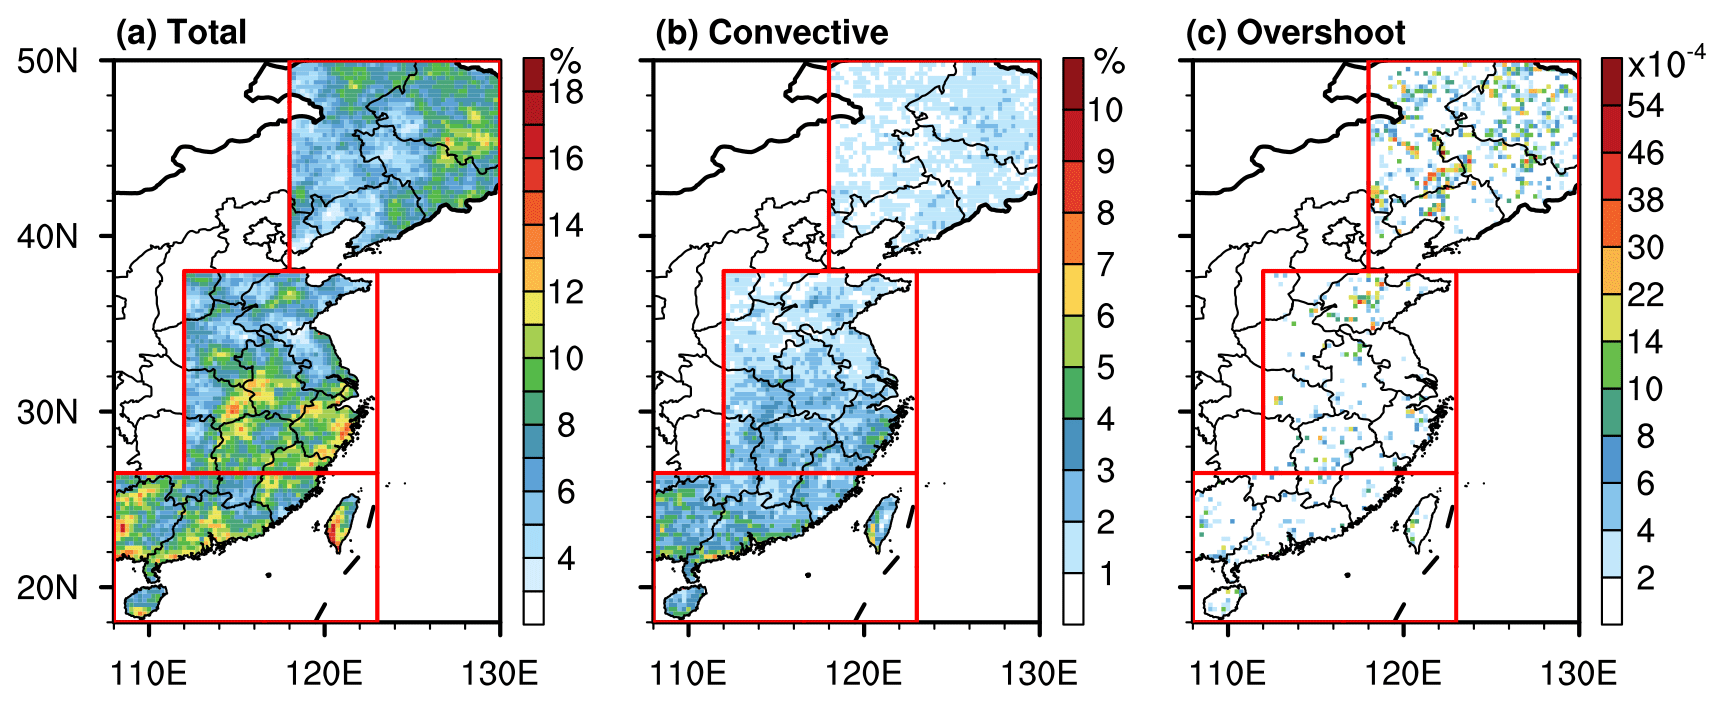
Figure 5Precipitation frequency. (a) Frequency of total precipitation. (b) Frequency of convective precipitation. (c) Frequency of convective overshooting. Publisher's remark: please note that the above figure contains disputed territories.
Table 1The sample number of total precipitation, convective precipitation, and convective overshooting over NC, MEC, and SC.
3.2.2 Vertical structures
Based on the reflectivity profiles and the rain rate profiles provided by the GPM DPR instrument, we studied the vertical structure of precipitation within convective overshooting. Contoured frequency by altitude diagram (CFAD) analysis of radar reflectivity can effectively indicate the three-dimensional structure characteristics of precipitation; therefore they are applied in a large number of precipitation studies (Yuter and Houze, 1995). Figure 6 shows CFADs of the DPR radar reflectivity. In general, radar reflectivity within convective overshooting is stronger and its storm top height is higher. The CFAD analysis also shows regional differences. The radar echo intensity of convective overshooting over NC is the weakest, and the echo near the surface is mainly distributed from 25 to 55 dBZ, with a sharp peak near 47 dBZ, while the peak of the total precipitation is around 16 dBZ. The maximum radar echo top within convective overshooting over NC can reach to 13.5 km, 3.3 km higher than the mean precipitation. Compared with NC, radar reflectivities within convective overshooting over SC and MEC are stronger and their CFAD character is more similar. Their echo top height is ∼ 18 km, 6.5 km higher than total precipitation and 4.5 km higher than NC, and their echo near the surface is concentrated around 30–55 dBZ, while that of total precipitation is between 15 and 43 dBZ. Besides, radar reflectivity of convective overshooting over NC accounts for a higher proportion below the freezing level (altitude where the temperature is 0 °C), while MEC and SC account for a higher proportion above the freezing level, which indicates that the upward motion within convective overshooting over MEC and SC is stronger and there are larger ice crystal particles.
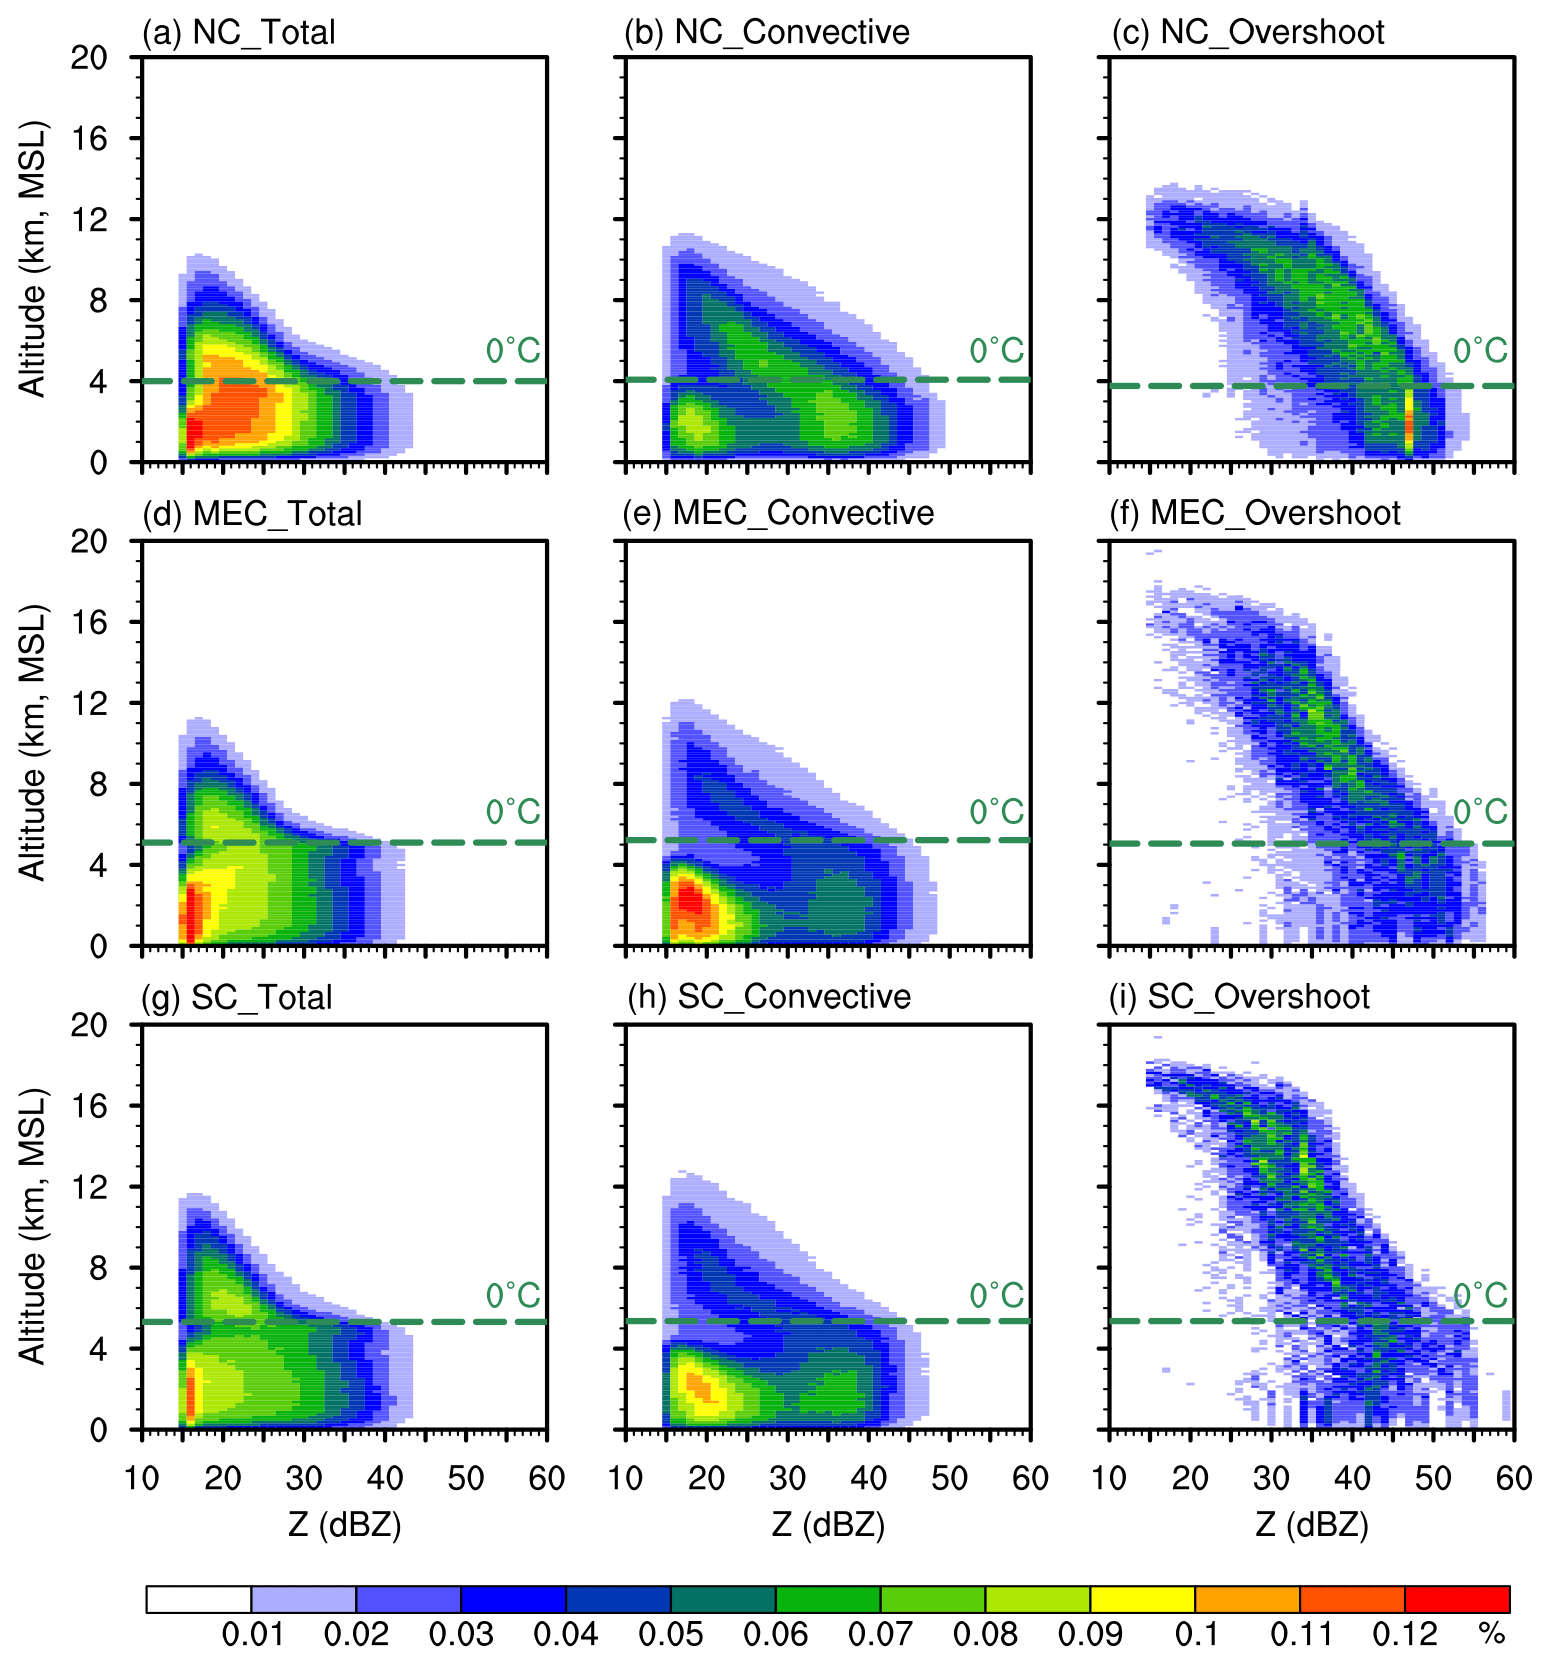
Figure 6Contoured frequency by altitude diagrams (CFADs) of radar reflectivity. (a) CFAD for total precipitation over NC (the dashed green line indicates the altitude of the freezing level). (b) CFAD for convective precipitation over NC. (c) CFAD for convective overshooting over NC. (d) CFAD for total precipitation over MEC. (e) CFAD for convective precipitation over MEC. (f) CFAD for convective overshooting over MEC. (g) CFAD for total precipitation over SC. (h) CFAD for convective precipitation over SC. (i) CFAD for convective overshooting over SC.
Quantitative analysis of the vertical structure of precipitation within convective overshooting is one of the main issues of interest in this study. Shown in Fig. 7, the rain rate profiles of convective overshooting are provided, and to highlight their unique features, rain rate profiles of total precipitation and convective precipitation are also given. In general, the rain rate of convective overshooting is much higher, especially below the freezing level (∼ 5 km), 5–10 times that of normal precipitation. This indicates stronger convection and a greater concentration of ice. In addition, differences between the three regions are obvious. The rain rate of convective overshooting over NC is about half as high as over MEC and SC, which is consistent with the results of radar echo. At 1 km altitude, the rain rates of convective overshooting are 12 mm h−1 (NC), 22.5 mm h−1 (MEC), and 23 mm h−1 (SC), respectively. Below freezing level, the variation in the rain rate with altitude is not very obvious, and the differences in the rain rate between convective overshooting and normal precipitation are ∼ 8 mm h−1 over NC and ∼ 20 mm h−1 over MEC and SC. Above freezing level, the rain rate of convective overshooting clearly decreases with increasing altitude, and rain rates are 6 mm h−1 (NC), 10 mm h−1 (MEC), and 6.5 mm h−1 (SC) at 10 km. However, rain rates of other precipitation are no more than 2 mm h−1 above 8 km; we therefore suggest that the strong upward flow within convective overshooting brings large amounts of moisture from the lower layer to the upper layer.
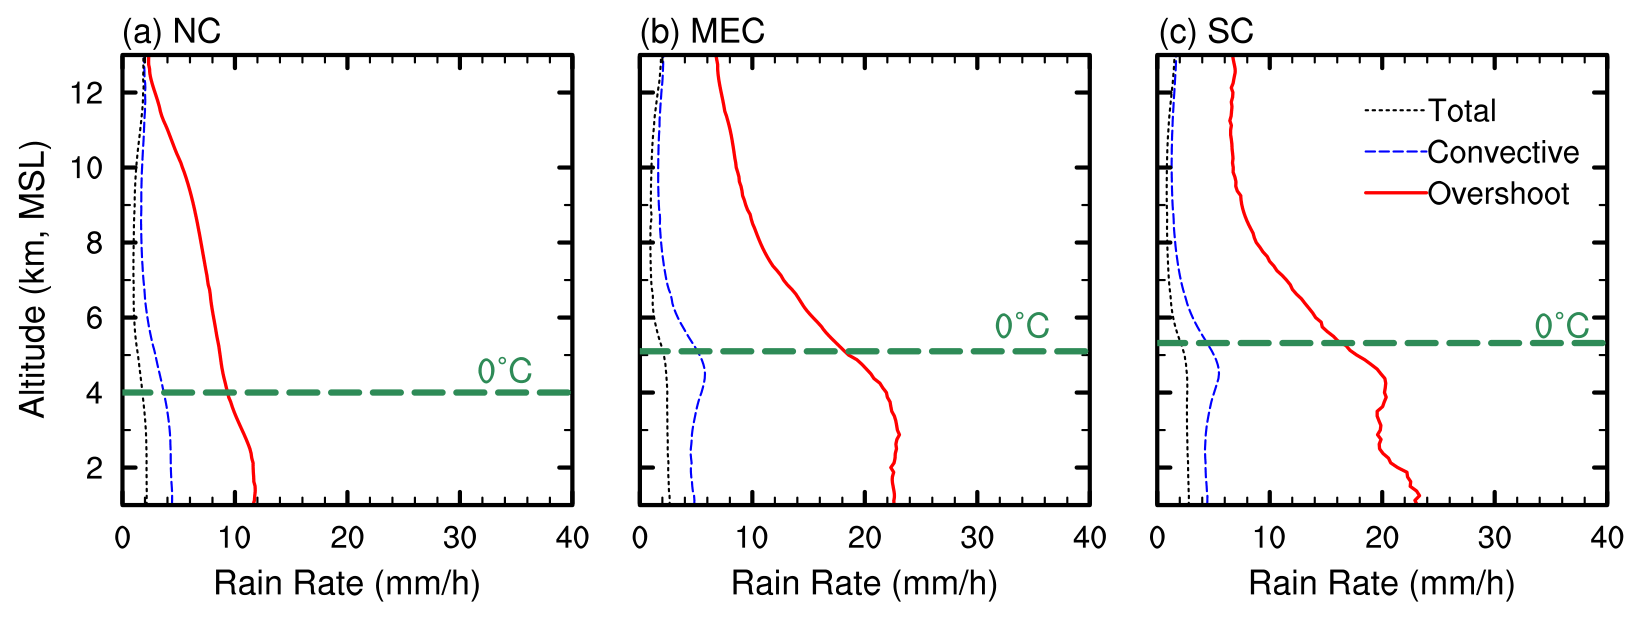
Figure 7Rain rate profiles for total precipitation, convective precipitation, and convective overshooting (red lines are convective overshooting; blue lines are the convective precipitation; black lines are the total precipitation). (a) The rain rate profiles over NC (the dashed green line indicates the altitude of the freezing level). (b) The rain rate profiles over MEC. (c) The rain rate profiles over SC.
We conduct probability density function (PDF) analysis on the near-surface rain rate (NSRR) within convective overshooting, and PDFs for the NSRR of total and convective precipitation are also calculated, as shown in Fig. 8. The grades of precipitation are as follows: light rain, < 4.9 mm per 12 h; moderate rain, 5.0–14.9 mm per 12 h; heavy rain, 15.0–29.9 mm per 12 h; torrential rain, 30.0–69.9 mm per 12 h; downpour, 70.0–139.9 mm per 12 h; and heavy downpour, ≥140.0 mm per 12 h (General Administration of Quality Supervision, 2012). The PDF curve of the NSRR of convective overshooting is clearly different from that of normal precipitation and has regional differences. The peak value of PDF of convective overshooting appears at ∼ 10 mm h−1, classified as downpour, while that of normal precipitation appears at ∼ 1 mm h−1, classified as moderate rain, which is obviously lower than convective overshooting. The PDF of the peak value of convective overshooting over NC is about 11.5 %, while those over MEC and SC are about 6 %. Besides, the sample size of convective overshooting with a precipitation grade of heavy downpour accounts for 34.0 % (NC), 46.7 % (MEC), and 34.8 % (SC), respectively, 3–10 times the normal precipitation, which reminds us to pay special attention to the extreme precipitation events caused by convective overshooting that may cause harm to production and life.
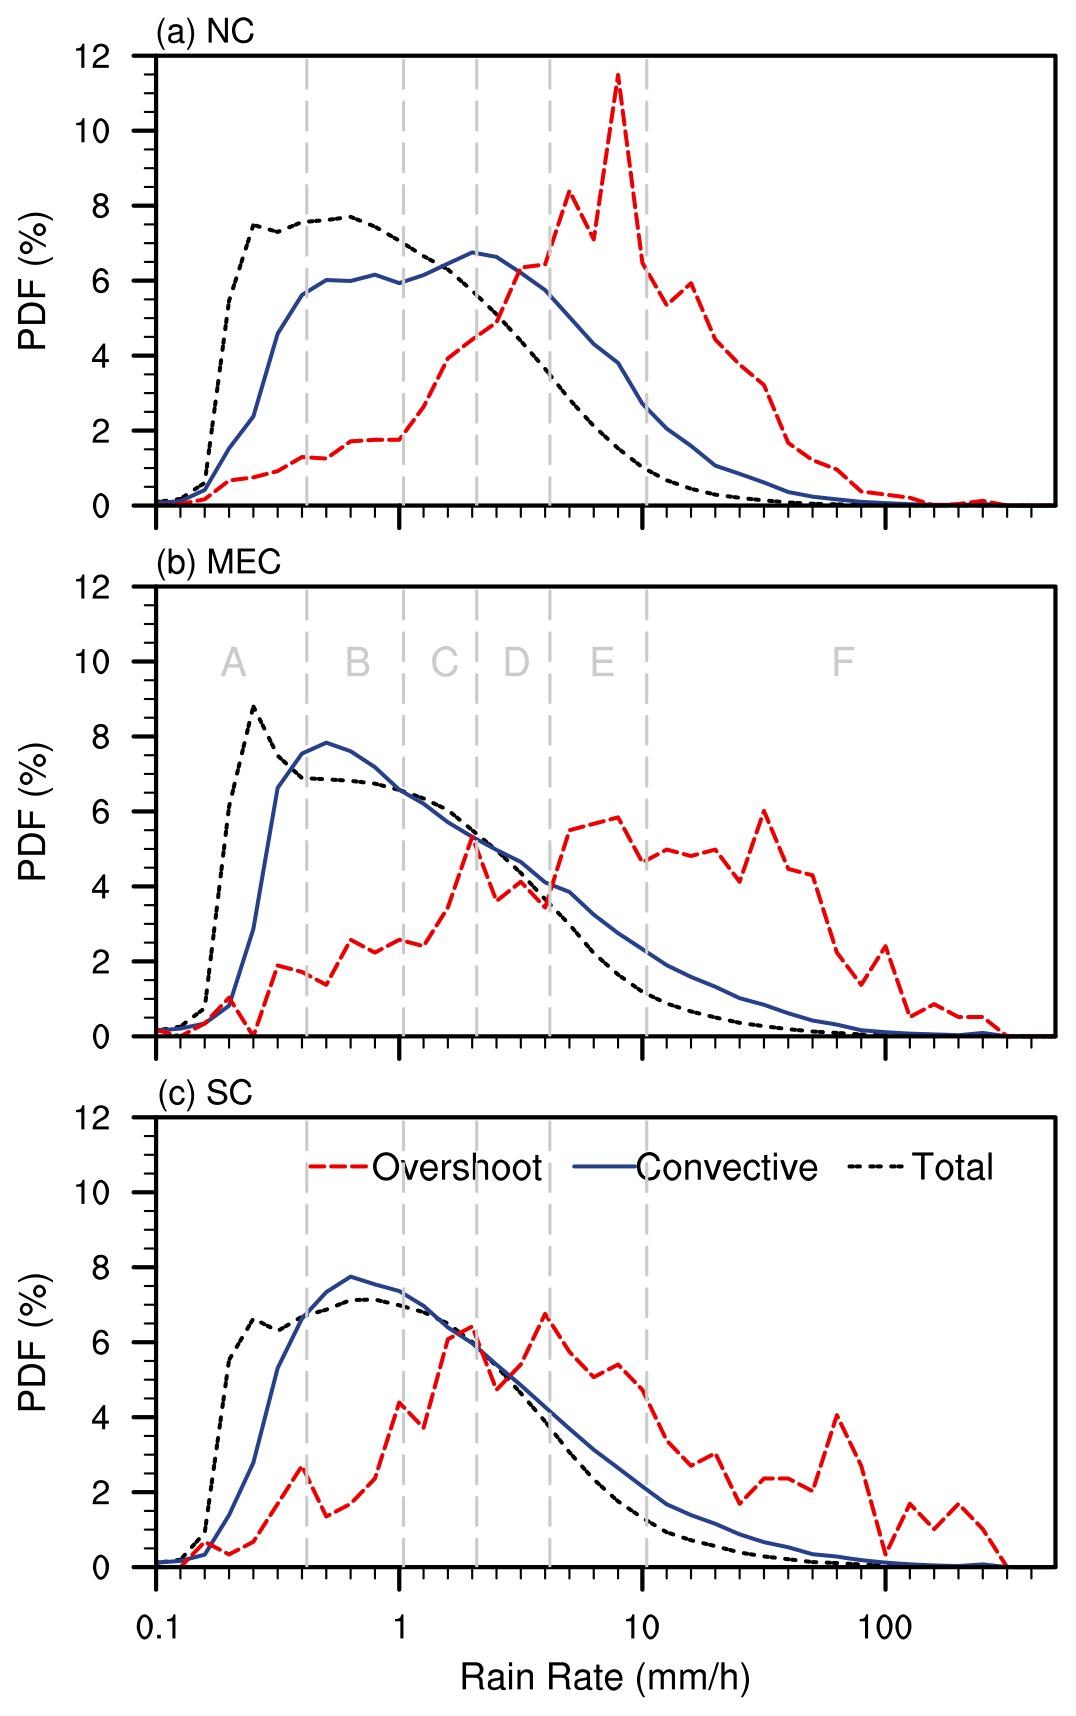
Figure 8Probability density function (PDF) of the near-surface rain rate (NSRR). (a) PDF of NSRR in NC. (b) PDF of NSRR in MEC. (c) PDF of NSRR in SC.
3.2.3 Microphysical features
The GPM center provides the particle spectrum from the dual-frequency radar. Based on the DSD profiles from 2ADPR, we further investigate the microphysical structures of convective overshooting. The liquid water path (LWP) and ice water path (IWP) show the overall water content in the atmospheric column, which is closely associated with microphysical processes within convective overshooting. To quantify the characteristics of LWP and IWP within convective overshooting, the PDFs of LWP and IWP of convective overshooting are shown in Fig. 9, and those of convective and total precipitation are also shown for comparison. The LWP and IWP within convective overshooting are the highest, with high values of PDF mainly distributed around 1000 and 5000 g m−3, respectively, much higher than those of normal precipitation, which are around 100 and 300 g m−3, indicating sufficient water vapor inside convective overshooting. Differences in IWP between convective overshooting and normal precipitation are bigger than those in LWP, suggesting that differences in water vapor above freezing level between them are greater and convective overshooting brings water vapor from the bottom of the troposphere to higher layers. Besides, differences in LWP and IWP between the three regions are also worth noting: the LWP and IWP over MEC and SC are more similar and higher than over NC. In particular, LWP over MEC has a bimodal structure with peaks of 630 and 5000 g m−3, which is consistent with the bimodal structure of NSRR PDF curve in Fig. 8. Analysis above in Fig. 1b shows that tropopause height over northern MEC is lower than over southern MEC, making it easier for convective overshooting to occur over northern MEC. This indicates that there are two types of convective-overshooting events over MEC, weak events with lower storm top height and strong events with higher storm top height, which correspond to the two peaks of the LWP PDF curve, respectively.
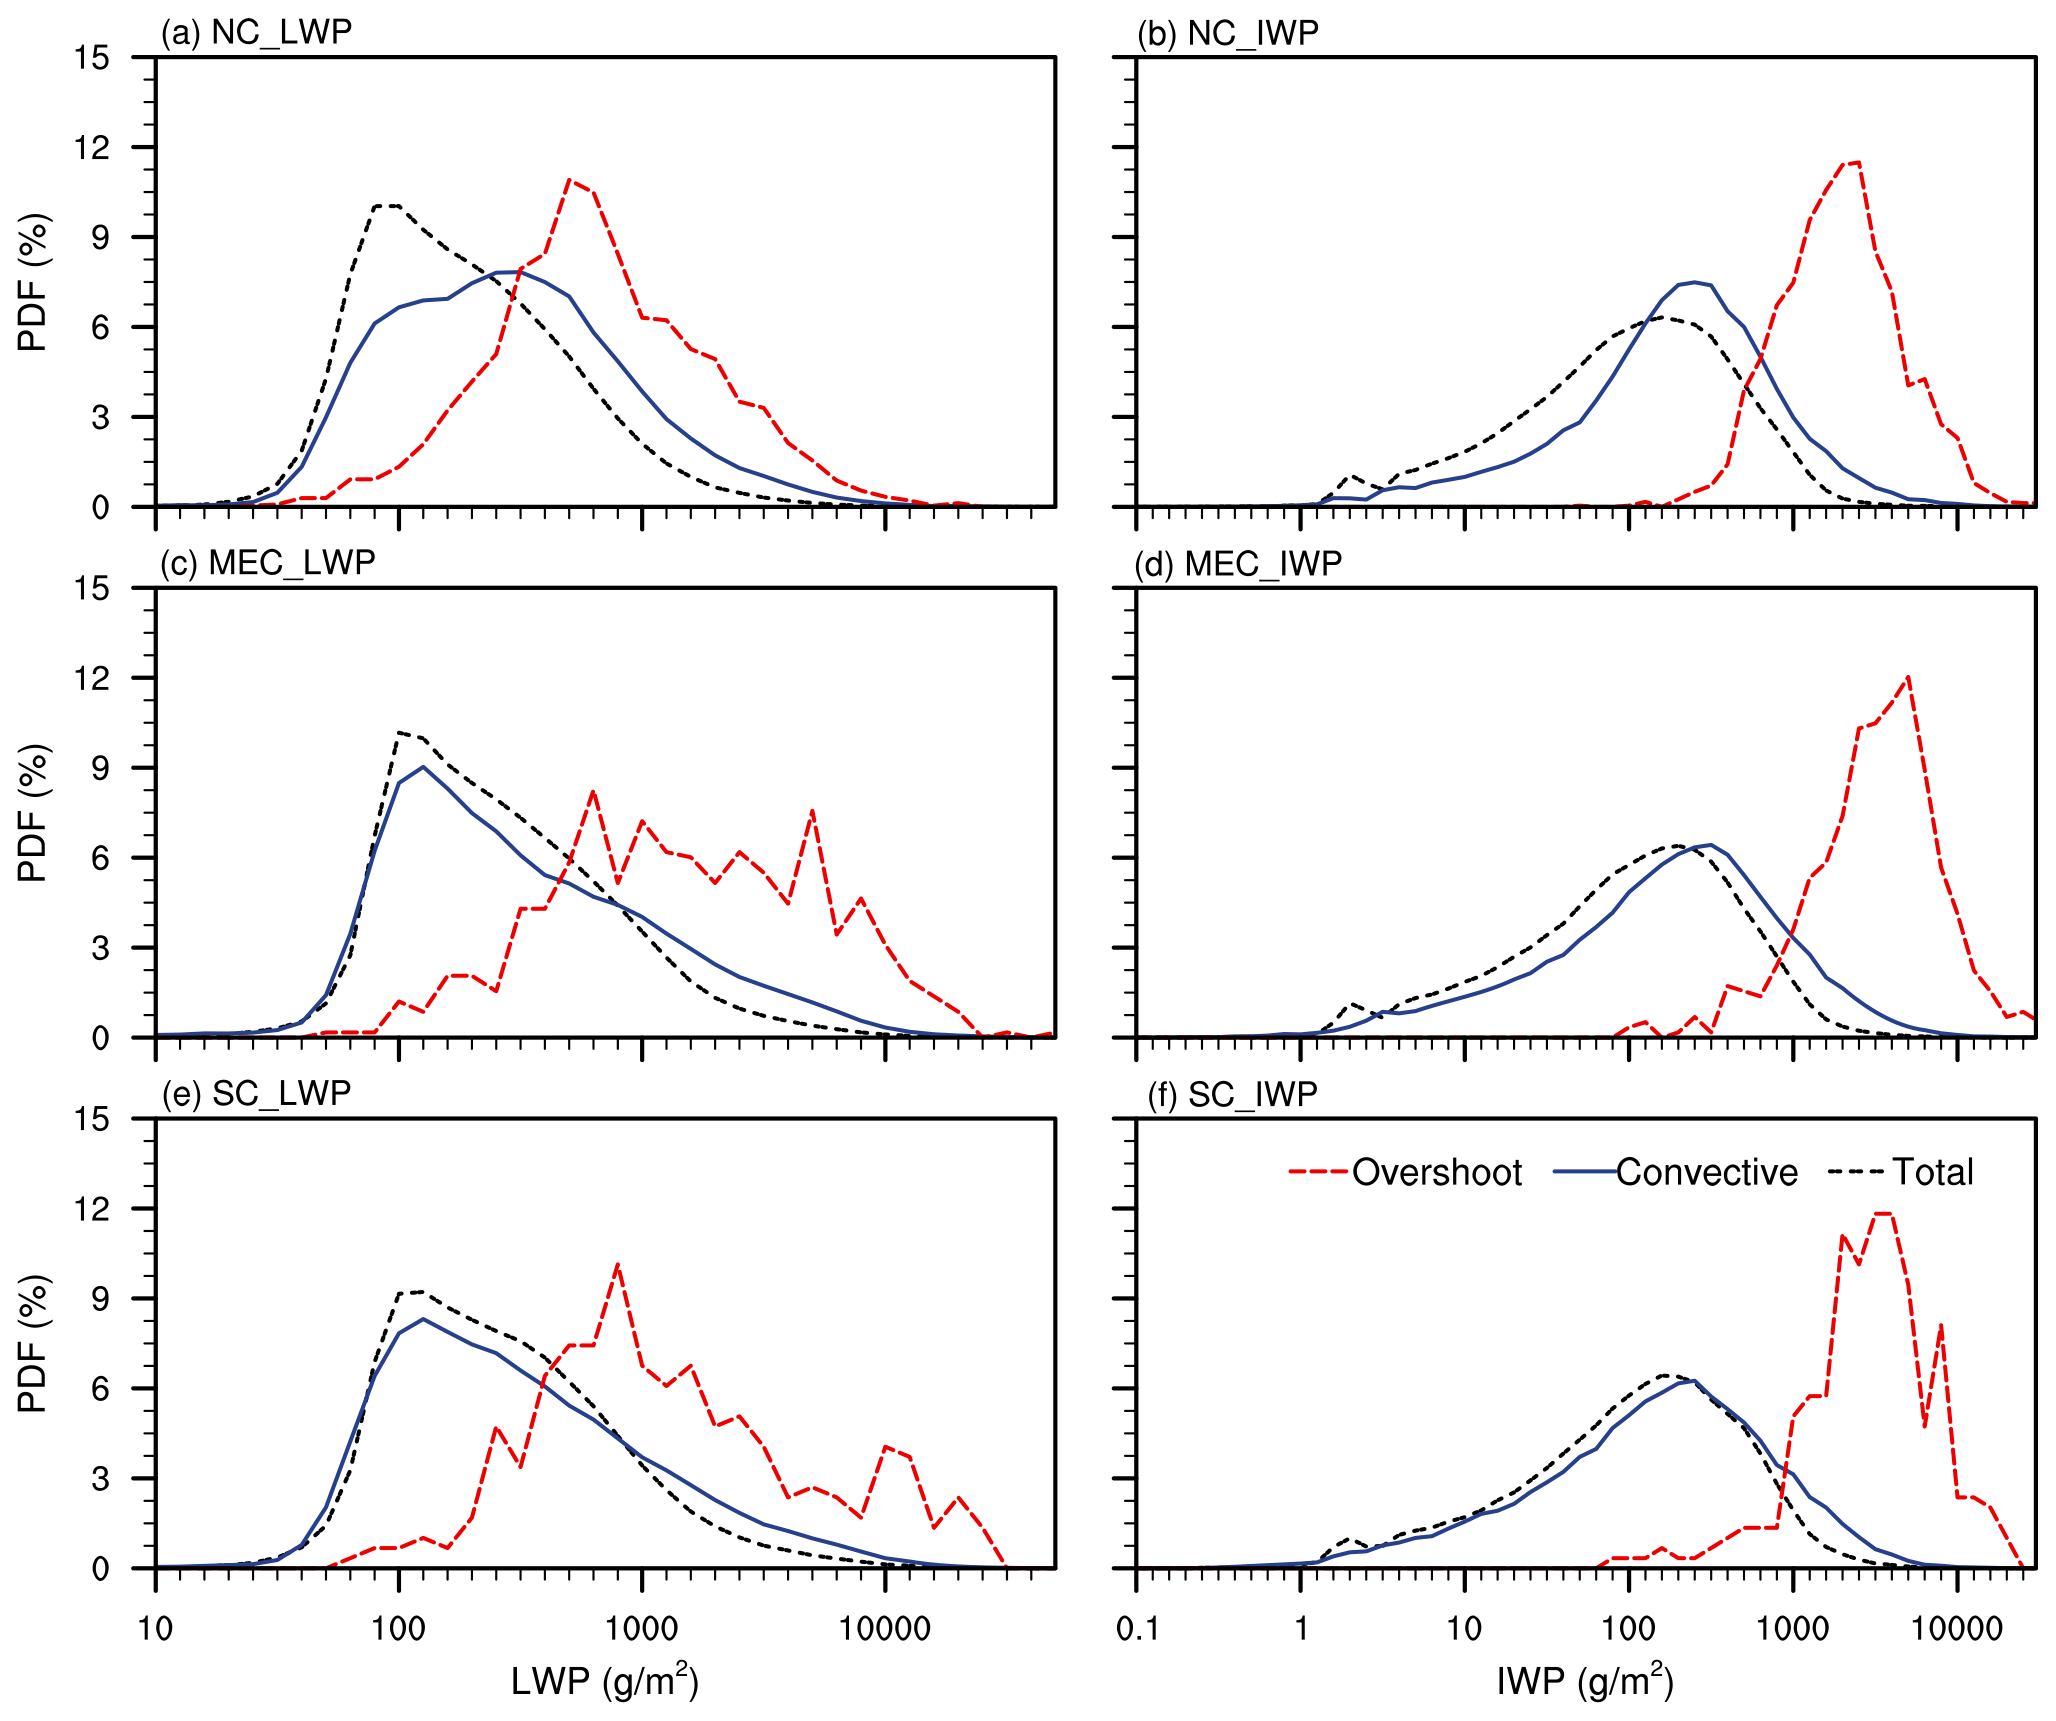
Figure 9PDFs of the liquid water path (LWP) and ice water path (IWP). (a) PDF of LWP over NC. (b) PDF of IWP over NC. (c) PDF of LWP over MEC. (d) PDF of IWP over MEC. (e) PDF of LWP over SC. (f) PDF of IWP over SC.
We further use DSD parameter profiles, including the effective radius (D0) and droplet concentration (dBN0) profiles, to analyze the microphysical characteristics within convective overshooting, shown in Fig. 10. Results show that the microphysical processes within convective overshooting are unique, leading to various properties of the droplets in precipitation. Droplets of convective overshooting are large but sparse. Influenced by strong updrafts, precipitation particles within convective overshooting continuously collide and grow large enough to fall; therefore, the effective radii of droplets are big below 10 km altitude, almost exceeding 2.5 mm, which is about twice that of normal precipitation. However, the droplet concentration within convective overshooting is relatively low. Differences in microphysical structure between the three regions are also worth noting. Convective-overshooting events over NC have large but sparse droplets, while those over SC have small but dense droplets, and the effective radius and concentration of droplets over MEC are between NC and SC. It is speculated that this is related to the differences in aerosol content and types over three regions. Specifically, at 1 km altitude, the effective radius of droplets over NC is the largest (2.87 mm), followed by MEC (2.7 mm), and SC is the lowest (2.5 mm). As altitude increases, the effective radius of droplets first increases and then decreases, with a maximum of 2.93 mm over NC at 2.5 km and a sharp peak over MEC (2.85 mm) and SC (2.76 mm) near freezing level, about twice the normal precipitation. The effective radius of droplets for convective overshooting over NC and MEC is lower than 2.5 mm above 10 and 12 km, respectively. It is worth noting that the effective radius of droplets for convective overshooting over SC shows an increasing trend above 8 km altitude, which is similar to convective precipitation, whose effective radius of droplets over the three regions also shows an increasing tend from 9 to 13 km, which may be related to the strong upward motion inside. When the upward motion is strong, ice particles must grow large enough to fall (Langmuir, 1948). Droplet concentration basically decreases with altitude, and that within convective overshooting is obviously lower than for normal precipitation with NC being the lowest, while MEC and SC are higher and similar. Droplet concentration within convective overshooting near the ground is the highest, with 25.4 (NC), 28 (MEC), and 28 (SC), while that of normal precipitation is mainly distributed between 32 and 35.
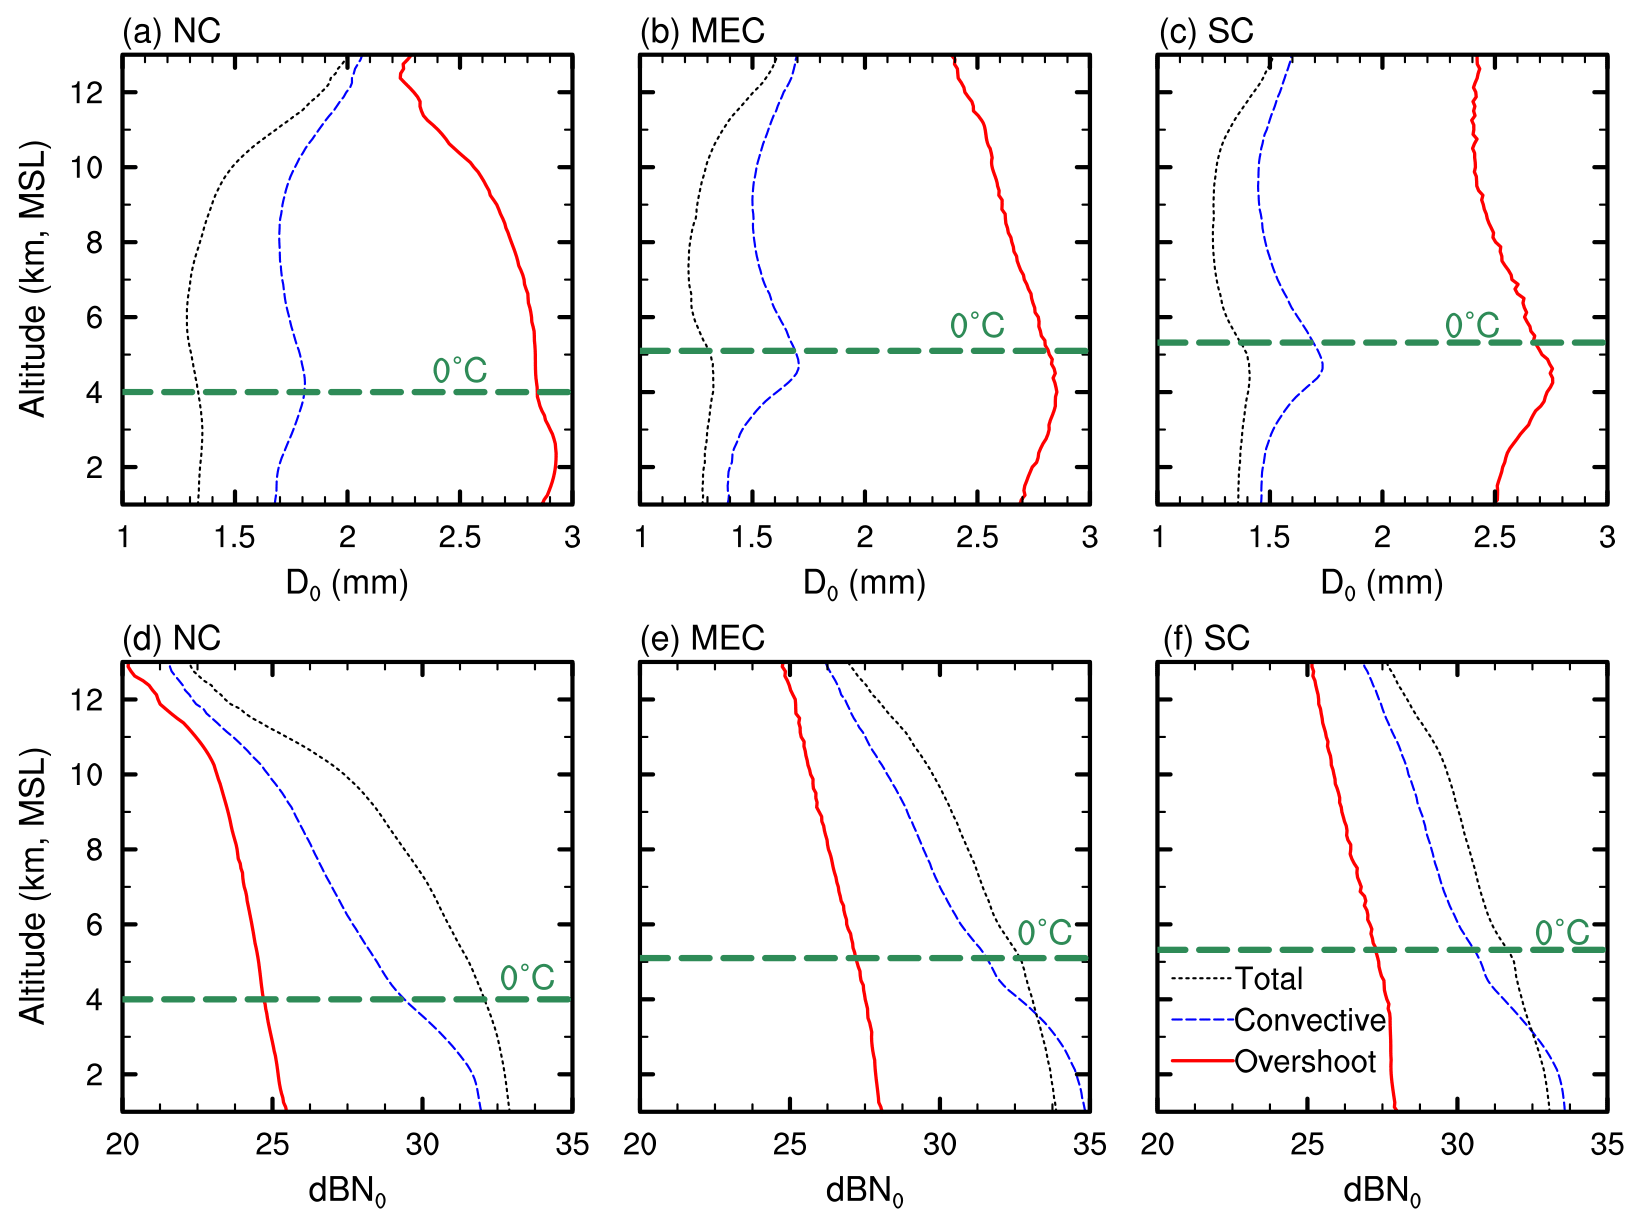
Figure 10The effective radius (D0) and droplet concentration (dBN0) profiles for total precipitation, convective precipitation, and convective overshooting over NC, MEC, and SC. (a) D0 profiles over NC. (b) D0 profiles over MEC. (c) D0 profiles over SC. (d) The dBN0 profiles over NC. (e) The dBN0 profiles over MEC. (f) The dBN0 profiles over SC (the dashed green line indicates the altitude of the freezing level).
The microphysical characteristics of convective overshooting are essential but poorly understood due to the difficulty in accurately detecting the convective overshooting and obtaining microphysical parameters during severe weather events. Based on the microphysical precipitation data from GPM DPR and the meteorological data from ERA5 data, we designed a more accurate algorithm for convective-overshooting determination and examined the particle size, concentration, phase state, and other parameters of the convective overshooting over East China. The main conclusions are as follows.
Firstly, the horizontal-distribution characteristics of convective overshooting over East China are analyzed by designing a more accurate algorithm for convective-overshooting determination. Statistical results indicate that the frequency of the convective overshooting over East China is very low, with a magnitude of only 10−3, with large regional differences. Convective-overshooting events occur more frequently over NC and northern MEC than over SC and southern MEC, mainly because of the lower tropopause height of the former areas and the different underlying surfaces. The mean convective-overshooting storm top height mostly ranges from 10 to 21 km and has obvious regional distribution differences, and the convective-overshooting storm top height over NC is 5–6 km higher than over SC.
Based on the reflectivity profiles and the rain rate profiles provided by the GPM DPR instrument, we studied the vertical structure of precipitation within convective overshooting. The CFAD analysis of the radar reflectivity shows that radar reflectivity within convective overshooting is stronger and its storm top height is higher. The CFAD analysis also shows regional differences. Radar reflectivity of convective overshooting over NC accounts for a higher proportion below the freezing level, while MEC and SC account for a higher proportion above the freezing level, which indicates that the upward motion within convective overshooting over MEC and SC is stronger and there are more ice crystal particles. Rain rate results also show that the rain rate within convective overshooting is higher, 5–10 times that of normal precipitation. In particular, the sample number of strong precipitation with the grade of precipitation of heavy downpour accounts for 34.0 % (NC), 46.7 % (MEC), and 34.8 % (SC), which reminds us to pay special attention to the extreme precipitation events caused by convective overshooting.
The GPM center provides the particle spectrum from the dual-frequency radar. Based on the DSD profiles from 2ADPR, we further investigated the microphysical structures of convective overshooting. Statistical results show that convective overshooting has unique microphysical characteristics compared with normal precipitation, with obvious regional differences. The LWP and IWP within convective overshooting are abundant, with high values of PDF distributed around 1000 and 5000 g m−3, respectively. Moreover, influenced by strong updrafts, precipitation particles within convective overshooting continuously collide and grow large enough to fall; therefore, the effective radius is big below 10 km altitude, almost exceeding 2.5 mm, which is about twice that of normal precipitation. However, the droplet concentration within convective overshooting is relatively low. Differences in microphysical structure between the three regions are also worth noting. The effective radius of droplets over NC is slightly bigger than MEC and SC, while the droplet concentration is lower; it is speculated that this is related to the differences in aerosol content and types over the three regions.
Quantitative study of the internal microphysical characteristics within convective overshooting has not been documented previously. Findings of this study may have important implications for the microphysical evolution associated with convective overshooting and provide more accurate precipitation microphysical parameters as the input of the model simulation. This study is a continuation of previous research (Sun et al., 2021). In the future, we will further explore the impact of aerosols on the internal microphysical characteristics within convective overshooting, and more microphysical parameters with higher spatiotemporal resolution are expected to provide more detailed features.
ERA5 data are taken from https://www.ecmwf.int/en/forecasts/datasets/reanalysis-datasets/era5 (ECMWF, 2023). GPM DPR data are archived at https://doi.org/10.5067/GPM/DPR/GPM/2A/07 (Iguchi and Meneghini, 2021).
SN, LGP, and FYF framed this study. All the authors discussed the concepts. SN conducted the data analyses. SN drafted the manuscript, and all authors edited the manuscript.
The contact author has declared that none of the authors has any competing interests.
Publisher’s note: Copernicus Publications remains neutral with regard to jurisdictional claims made in the text, published maps, institutional affiliations, or any other geographical representation in this paper. While Copernicus Publications makes every effort to include appropriate place names, the final responsibility lies with the authors.
The authors thank the two anonymous reviewers and the editor for taking the time to review and enhance the manuscript. We also acknowledge the Copernicus Climate Change Service for providing ERA5 data and Goddard Earth Sciences Data and Information Services Center for providing GPM data. We thank our colleagues at the University of Science and Technology of China for providing helpful feedback and suggestions.
This research has been supported by a National Natural Science Foundation of China project (grant no. 42230612) and a fellowship of the China Postdoctoral Science Foundation (grant no. 2022M723011).
This paper was edited by Johannes Quaas and reviewed by two anonymous referees.
Alcala, C. M. and Dessler, A. E.: Observations of deep convection in the tropics using the Tropical Rainfall Measuring Mission (TRMM) precipitation radar, J. Geophys. Res.-Atmos., 107, 4792, https://doi.org/10.1029/2002JD002457, 2002.
Anderson, J. G., Wilmouth, D. M., Smith, J. B., and Sayres, D. S.: UV dosage levels in summer: Increased risk of ozone loss from convectively injected water vapor, Science, 337, 835–839, https://doi.org/10.1126/science.1222978, 2012.
Avery, M. A., Davis, S. M., Rosenlof, K. H., Ye, H., and Dessler, A. E.: Large anomalies in lower stratospheric water vapour and ice during the 2015–2016 El Niño, Nat. Geosci., 10, 405–409, https://doi.org/10.1038/ngeo2961, 2017.
Bedka, K. M.: Overshooting cloud top detections using MSG SEVIRI Infrared brightness temperatures and their relationship to severe weather over Europe, Atmos. Res., 99, 175–189, https://doi.org/10.1016/j.atmosres.2010.10.001, 2011.
Bedka, K., Murillo, E. M., Homeyer, C. R., Scarino, B., and Mersiovsky, H.: The above-anvil cirrus plume: An important severe weather indicator in visible and infrared satellite imagery, Weather Forecast., 33, 1159–1181, https://doi.org/10.1175/WAF-D-18-0040.1, 2018.
Bethan, S., Vaughan, G., and Reid, S. J.: A comparison of ozone and thermal tropopause heights and the impact of tropopause definition on quantifying the ozone content of the troposphere, Q. J. Roy. Meteorol. Soc., 122, 929–944, https://doi.org/10.1002/qj.49712253207, 1996.
Biondi, R., Randel, W. J., Ho, S.-P., Neubert, T., and Syndergaard, S.: Thermal structure of intense convective clouds derived from GPS radio occultations, Atmos. Chem. Phys., 12, 5309–5318, https://doi.org/10.5194/acp-12-5309-2012, 2012.
Brunner, J. C., Ackerman, S. A., Bachmeier, A. S., and Rabin, R. M.: A quantitative analysis of the enhanced-V feature in relation to severe weather, Weather Forecast., 22, 853–872, https://doi.org/10.1175/WAF1022.1, 2007.
Chaboureau, J.-P., Cammas, J.-P., Duron, J., Mascart, P. J., Sitnikov, N. M., and Voessing, H.-J.: A numerical study of tropical cross-tropopause transport by convective overshoots, Atmos. Chem. Phys., 7, 1731–1740, https://doi.org/10.5194/acp-7-1731-2007, 2007.
Chae, J. H., Wu, D. L., Read, W. G., and Sherwood, S. C.: The role of tropical deep convective clouds on temperature, water vapor, and dehydration in the tropical tropopause layer (TTL), Atmos. Chem. Phys., 11, 3811–3821, https://doi.org/10.5194/acp-11-3811-2011, 2011.
Chemel, C., Russo, M. R., Pyle, J. A., Sokhi, R. S., and Schiller, C.: Quantifying the imprint of a severe hector thunderstorm during ACTIVE/SCOUT-O3 onto the water content in the upper troposphere/lower stratosphere, Mon. Weather Rev., 137, 2493–2514, https://doi.org/10.1175/2008MWR2666.1, 2009.
Corti, T., Luo, B. P., De Reus, M., Brunner, D., Cairo, F., Mahoney, M. J., Martucci, G., Matthey, R., Mitev, V., Dos Santos, F. H., Schiller, C., Shur, G., Sitnikov, N. M., Spelten, N., Vössing, H. J., Borrmann, S., and Peter, T.: Unprecedented evidence for deep convection hydrating the tropical stratosphere, Geophys. Res. Lett., 35, L10810, https://doi.org/10.1029/2008GL033641, 2008.
Danielsen, E. F.: In situ evidence of rapid, vertical, irreversible transport of lower tropospheric air into the lower tropical stratosphere by convective cloud turrets and by larger©/scale upwelling in tropical cyclones, J. Geophys. Res.-Atmos., 98, 8665–8681, https://doi.org/10.1029/92JD02954, 1993.
Danielsen, E. F., Hipskind, R. S., Gaines, S. E., Sachse, G. W., Gregory, G. L., and Hill, G. F.: Three-dimensional analysis of potential vorticity associated with tropopause folds and observed variations of ozone and carbon monoxide, J. Geophys. Res.-Atmos., 92, 2103–2111, https://doi.org/10.1029/JD092iD02p02103, 1987.
de Reus, M., Borrmann, S., Bansemer, A., Heymsfield, A. J., Weigel, R., Schiller, C., Mitev, V., Frey, W., Kunkel, D., Kürten, A., Curtius, J., Sitnikov, N. M., Ulanovsky, A., and Ravegnani, F.: Evidence for ice particles in the tropical stratosphere from in-situ measurements, Atmos. Chem. Phys., 9, 6775–6792, https://doi.org/10.5194/acp-9-6775-2009, 2009.
Dworak, R., Bedka, K., Brunner, J., and Feltz, W.: Comparison between GOES-12 overshooting-top detections, WSR-88D radar reflectivity, and severe storm reports, Weather Forecast., 27, 684–699, https://doi.org/10.1175/WAF-D-11-00070.1, 2012.
ECMWF: ECMWF Reanalysis v5 (ERA5), European Centre for Medium-Range Weather Forecasts [data set], https://www.ecmwf.int/en/forecasts/dataset/ecmwf-reanalysis-v5 (last access: 12 June 2023), 2023.
Frey, W., Schofield, R., Hoor, P., Kunkel, D., Ravegnani, F., Ulanovsky, A., Viciani, S., D'Amato, F., and Lane, T. P.: The impact of overshooting deep convection on local transport and mixing in the tropical upper troposphere/lower stratosphere (UTLS), Atmos. Chem. Phys., 15, 6467–6486, https://doi.org/10.5194/acp-15-6467-2015, 2015.
Fueglistaler, S., Wernli, H., and Peter, T.: Tropical troposphere – to – stratosphere transport inferred from trajectory calculations, J. Geophys. Res.-Atmos., 109, D03108, https://doi.org/10.1029/2003JD004069, 2004.
Fujita, T. T.: The Teton-Yellowstone tornado of 21 July 1987, Mon. Weather Rev., 117, 1913–1940, https://doi.org/10.1175/1520-0493(1989)117<1913:TTYTOJ>2.0.CO;2, 1989.
General Administration of Quality Supervision: Inspection and Quarantine of the People's Republic of China: Standardization Administration of the People's Republic of China, GB/T 28592—2012 Grade of precipitation, Standards Press of China, 1–2, https://www.chinesestandard.net/PDF/English.aspx/GBT28592-2012 (last access: 3 August 2023), 2012.
Gettelman, A., Salby, M. L., and Sassi, F.: Distribution and influence of convection in the tropical tropopause region, J. Geophys. Res.-Atmos., 107, 4080, https://doi.org/10.1029/2001JD001048, 2002.
Grosvenor, D. P., Choularton, T. W., Coe, H., and Held, G.: A study of the effect of overshooting deep convection on the water content of the TTL and lower stratosphere from Cloud Resolving Model simulations, Atmos. Chem. Phys., 7, 4977–5002, https://doi.org/10.5194/acp-7-4977-2007, 2007.
Highwood, E. J. and Hoskins, B. J.: The tropical tropopause, Q. J. Roy. Meteorol. Soc., 124, 1579–1604, https://doi.org/10.1002/qj.49712454911, 1998.
Hoffmann, L., Günther, G., Li, D., Stein, O., Wu, X., Griessbach, S., Heng, Y., Konopka, P., Müller, R., Vogel, B., and Wright, J. S.: From ERA-Interim to ERA5: the considerable impact of ECMWF's next-generation reanalysis on Lagrangian transport simulations, Atmos. Chem. Phys., 19, 3097–3124, https://doi.org/10.5194/acp-19-3097-2019, 2019.
Holton, J. R., Haynes, P. H., McIntyre, M. E., Douglass, A. R., Rood, R. B., and Pfister, L.: Stratosphere-troposphere exchange, Rev. Geophys., 33, 403–439, https://doi.org/10.1029/95RG02097, 1995.
Homeyer, C. R. and Kumjian, M. R.: Microphysical characteristics of overshooting convection from polarimetric radar observations, J. Atmos. Sci., 72, 870–891, https://doi.org/10.1175/JAS-D-13-0388.1, 2015.
Iguchi, T. and Meneghini, R.: GPM DPR Precipitation Profile L2A 1.5 hours 5 km V07, Greenbelt, MD, Goddard Earth Sciences Data and Information Services Center (GES DISC), Earth Data [data set], https://doi.org/10.5067/GPM/DPR/GPM/2A/07, 2021
Jensen, E. J., Ackerman, A. S., and Smith, J. A.: Can overshooting convection dehydrate the tropical tropopause layer?, J. Geophys. Res.-Atmos., 112, D11209, https://doi.org/10.1029/2006JD007943, 2007.
Johnston, B. R., Xie, F., and Liu, C.: The effects of deep convection on regional temperature structure in the tropical upper troposphere and lower stratosphere, J. Geophys. Res.-Atmos., 123, 1585–1603, https://doi.org/10.1002/2017JD027120, 2018.
Kellenbenz, D. J., Grafenauer, T. J., and Davies, J. M.: The North Dakota tornadic supercells of 18 July 2004: Issues concerning high LCL heights and evapotranspiration, Weather Forecast., 22, 1200–1213, https://doi.org/10.1175/2007WAF2006109.1, 2007.
Khaykin, S., Pommereau, J.-P., Korshunov, L., Yushkov, V., Nielsen, J., Larsen, N., Christensen, T., Garnier, A., Lukyanov, A., and Williams, E.: Hydration of the lower stratosphere by ice crystal geysers over land convective systems, Atmos. Chem. Phys., 9, 2275–2287, https://doi.org/10.5194/acp-9-2275-2009, 2009.
Lane, T. P. and Sharman, R. D.: Gravity wave breaking, secondary wave generation, and mixing above deep convection in a three – dimensional cloud model, Geophys. Res. Lett., 33, L23813, https://doi.org/10.1029/2006GL027988, 2006.
Lane, T. P., Sharman, R. D., Clark, T. L., and Hsu, H. M.: An investigation of turbulence generation mechanisms above deep convection, J. Atmos. Sci., 60, 1297–1321, https://doi.org/10.1175/1520-0469(2003)60<1297:AIOTGM>2.0.CO;2, 2003.
Langmuir, I.: The production of rain by a chain reaction in cumulus clouds at temperatures above freezing, J. Atmos. Sci., 5, 175–192, https://doi.org/10.1175/1520-0469(1948)005<0175:TPORBA>2.0.CO;2, 1948.
Line, W. E., Schmit, T. J., Lindsey, D. T., and Goodman, S. J.: Use of geostationary super rapid scan satellite imagery by the Storm Prediction Center, Weather Forecast., 31, 483–494, https://doi.org/10.1175/WAF-D-15-0135.1, 2016.
Liu, C. and Zipser, E. J.: Global distribution of convection penetrating the tropical tropopause, J. Geophys. Res.-Atmos., 110, D23104, https://doi.org/10.1029/2005JD006063, 2005.
Liu, N. and Liu, C.: Global distribution of deep convection reaching tropopause in 1 year GPM observations, J. Geophys. Res.-Atmos., 121, 3824–3842, https://doi.org/10.1002/2015JD024430, 2016.
Liu, N., Liu, C., and Hayden, L.: Climatology and detection of overshooting convection from 4 years of GPM precipitation radar and passive microwave observations, J. Geophys. Res.-Atmos., 125, e2019JD032003, https://doi.org/10.1029/2019JD032003, 2020.
Liu, P., Wang, Y., Feng, S., Li, C. Y., and Fu, Y. F.: Climatological characteristics of overshooting convective precipitation in summer and winter over the tropical and subtropical regions, Chin. J. Atmos. Sci., 36, 579–589, https://doi.org/10.3878/j.issn.1006-9895.2011.11109, 2012.
Machado, L. A. T., Rossow, W. B., Guedes, R. L., and Walker, A. W.: Life cycle variations of mesoscale convective systems over the Americas, Mon. Weather Rev., 126, 1630–1654, https://doi.org/10.1175/1520-0493(1998)126<1630:LCVOMC>2.0.CO;2, 1998.
Marion, G. R., Trapp, R. J., and Nesbitt, S. W.: Using overshooting top area to discriminate potential for large, intense tornadoes, Geophys. Res. Lett., 46, 12520–12526, https://doi.org/10.1029/2019GL084099, 2019.
McCann, D. W.: The enhanced-V: A satellite observable severe storm signature, Mon. Weather Rev., 111, 887–894, https://doi.org/10.1175/1520-0493(1983)111<0887:TEVASO>2.0.CO;2, 1983.
Muhsin, M., Sunilkumar, S. V., Ratnam, M. V., Parameswaran, K., Murthy, B. K., and Emmanuel, M.: Effect of convection on the thermal structure of the troposphere and lower stratosphere including the tropical tropopause layer in the South Asian monsoon region, J. Atmos. Solar-Terrest. Phys., 169, 52–65, https://doi.org/10.1016/j.jastp.2018.01.016, 2018.
Negri, A. J. and Adler, R. F.: Relation of satellite-based thunderstorm intensity to radar-estimated rainfall, J. Appl. Meteorol. Climatol., 20, 288–300, https://doi.org/10.1175/1520-0450(1981)020<0288:ROSBTI>2.0.CO;2, 1981.
Reynolds, D. W.: Observations of damaging hailstorms from geosynchronous satellite digital data, Mon. Weather Rev., 108, 337–348, https://doi.org/10.1175/1520-0493(1980)108<0337:OODHFG>2.0.CO;2, 1980.
Rodriguez-Franco, J. J. and Cuevas, E.: Characteristics of the subtropical tropopause region based on long-term highly resolved sonde records over Tenerife, J. Geophys. Res.-Atmos., 118, 10–754, https://doi.org/10.1002/jgrd.50839, 2013.
Rossow, W. B. and Pearl, C.: 22-year survey of tropical convection penetrating into the lower stratosphere, Geophys. Res. Lett., 34, L04803, https://doi.org/10.1029/2006GL028635, 2007.
Setvák, M., Lindsey, D. T., and Novák, P. et al.: Satellite-observed cold-ring-shaped features atop deep convective clouds, Atmos. Res., 97, 80–96, https://doi.org/10.1016/j.atmosres.2010.03.009, 2010.
Sherwood, S. C. and Dessler, A. E.: A model for transport across the tropical tropopause, J. Atmos. Sci., 58, 765–779, https://doi.org/10.1175/1520-0469(2001)058<0765:AMFTAT>2.0.CO;2, 2001.
Sherwood, S. C., Horinouchi, T., and Zeleznik, H. A.: Convective impact on temperatures observed near the tropical tropopause, J. Atmos. Sci., 60, 1847–1856, https://doi.org/10.1175/1520-0469(2003)060<1847:CIOTON>2.0.CO;2, 2003.
Smith, J. B., Wilmouth, D. M., and Bedka, K. M. et al.: A case study of convectively sourced water vapor observed in the overworld stratosphere over the United States, J. Geophys. Res.-Atmos., 122, 9529–9554, https://doi.org/10.1002/2017JD026831, 2017.
Solomon, S., Rosenlof, K. H., and Portmann, R. W. et al.: Contributions of stratospheric water vapor to decadal changes in the rate of global warming, Science, 327, 1219–1223, https://doi.org/10.1126/science.1182488, 2010.
Sun, N., Fu, Y., Zhong, L., Zhao, C., and Li, R.: The Impact of Convective Overshooting on the Thermal Structure over the Tibetan Plateau in Summer Based on TRMM, COSMIC, Radiosonde, and Reanalysis Data, J. Climate, 34, 8047–8063, https://doi.org/10.1175/JCLI-D-20-0849.1, 2021.
Sun, N., Fu, Y., Zhong, L., and Li, R.: Aerosol effects on the vertical structure of precipitation in East China, Clim. Atmos. Sci., 5, 60, https://doi.org/10.1038/s41612-022-00284-0, 2022a.
Sun, N., Zhong, L., Zhao, C., Ma, M., and Fu, Y.: Temperature, water vapor and tropopause characteristics over the Tibetan Plateau in summer based on the COSMIC, ERA-5 and IGRA datasets, Atmos. Res., 266, 105955, https://doi.org/10.1016/j.atmosres.2021.105955, 2022b.
Takahashi, H. and Luo, Z. J.: Characterizing tropical overshooting deep convection from joint analysis of CloudSat and geostationary satellite observations, J. Geophys. Res.-Atmos., 119, 112–121, https://doi.org/10.1002/2013JD020972, 2014.
Wang, X., Huang, Y., Qu, Z., Vaillancourt, P. A., Yau, M. K., Feng, J., Langille, J., and Bourassa, A.: Convectively Transported Water Vapor Plumes in the Midlatitude Lower Stratosphere, J. Geophys. Res.-Atmos., 128, e2022JD037699, https://doi.org/10.1029/2022JD037699, 2023.
Werner, F., Schwartz, M. J., Livesey, N. J., Read, W. G., and Santee, M. L.: Extreme outliers in lower stratospheric water vapor over North America observed by MLS: Relation to overshooting convection diagnosed from colocated Aqua-MODIS data, Geophys. Res. Lett., 47, e2020GL090131, https://doi.org/10.1029/2020GL090131, 2020.
WMO (World Meteorological Organization: Meteorology): A three-dimensional science: Second session of the commission for aerology, WMO Bull., 4, 134–138, 1957.
Xia, J.: Research on climatic regionalization of China and characteristics of temperature, humidity and wind in precipitation cloud, University of Science and Technology of China, 12–25, https://www.cnki.net/KCMS/detail/detail.aspx?dbcode (last access: 2 January 2024), 2015.
Xian, T. and Fu, Y.: Characteristics of tropopause-penetrating convection determined by TRMM and COSMIC GPS radio occultation measurements, J. Geophys. Res.-Atmos., 120, 7006–7024, https://doi.org/10.1002/2014JD022633, 2015.
Xu, W.: Thunderstorm climatologies and their relationships to total and extreme precipitation in China, J. Geophys. Res.-Atmos., 125, e2020JD033152, https://doi.org/10.1029/2020JD033152, 2020.
Yuter, S. E. and Houze, R. A.: Three-dimensional kinematic and microphysical evolution of Florida cumulonimbus. Part II: Frequency distributions of vertical velocity, reflectivity, and differential reflectivity, Mon. Weather Rev., 123, 1941–1963, https://doi.org/10.1175/1520-0493(1995)123<1941:TDKAME>2.0.CO;2, 1995.
Zahn, A., Brenninkmeijer, C. A. M., and van Velthoven, P. F. J.: Passenger aircraft project CARIBIC 1997–2002, Part I: the extratropical chemical tropopause, Atmos. Chem. Phys. Discuss., 4, 1091–1117, https://doi.org/10.5194/acpd-4-1091-2004, 2004.
Zhang, A. and Fu, Y.: Life cycle effects on the vertical structure of precipitation in East China measured by Himawari-8 and GPM DPR, Mon. Weather Rev., 146, 2183–2199, https://doi.org/10.1175/MWR-D-18-0085.1, 2018.