the Creative Commons Attribution 4.0 License.
the Creative Commons Attribution 4.0 License.
 | 20 Jun 2024
In situ measurement of organic aerosol molecular markers in urban Hong Kong during a summer period: temporal variations and source apportionment
Hongyong Li
Xiaopu Lyu
Likun Xue
Yunxi Huo
Dawen Yao
Haoxian Lu
Organic aerosol (OA) is a significant constituent of urban particulate matter (PM), and molecular markers therein provide information on the sources and formation mechanisms. With the in situ measurement of over 70 OA molecular markers in a summer month at a bihourly resolution, this study focused on the temporal variations in representative markers and dynamic source contributions to OA at an urban site in Hong Kong SAR (HK). The levels of secondary OA (SOA) markers were markedly elevated (p < 0.05) in the short-duration cases with continental and coastal air relative to those in the most common marine air, and the primary markers primarily contained local characteristics. The troughs showed the enhancements of many SOA markers (p < 0.05), which appeared to be related to the high relative humidity. The diurnal patterns of 2-methyltetrols varied in differed cases, and their aqueous formation at night seemed plausible, particularly in the presence of troughs. Eight sources were identified for the organic matter in submicron PM (PM1-OM). Despite being an urban site, the mean SOA contribution (66.1 ± 10.5 %), primarily anthropogenic, was significant. Anthropogenic SOA dominated in the cases with continental and coastal air and in the early afternoon. Local cooking and vehicle emissions became predominant in the case of marine air without troughs. Even averaged over the study period in this summer month with the prevalence of marine air, primary cooking emissions contributed up to 44.2 % to PM1-OM in the early evening. The study highlighted the need to control regional anthropogenic SOA and local cooking emissions to mitigate PM pollution in HK.
- Article
(5543 KB) - Full-text XML
-
Supplement
(1678 KB) - BibTeX
- EndNote


Atmospheric particulate matter (PM) is a widespread environmental concern, due to its significant climate and health effects (Ramanathan et al., 2001; Pöschl, 2005; Yang et al., 2018). Organic aerosol (OA) makes up 20 %–90 % of fine PM (PM2.5) by mass concentration (Kanakidou et al., 2005; Jimenez et al., 2009). While inorganic PM compositions are somewhat effectively controlled, reducing OA remains a major challenge for the further mitigation of PM2.5 pollution in China (Huang et al., 2014a; Zhang et al., 2019). This is closely related to the lag and inadequacy of our knowledge of OA, especially the insufficient understanding of time-resolved and unambiguous identification of OA sources and secondary OA (SOA) formation mechanisms. Therefore, it has become increasingly important to improve the understanding of OA with new theories and techniques.
Molecular information records the history of OA, including sources and chemical evolution. Filter-based techniques are a widely used method for measuring molecular compositions of OA (Yu et al., 2011; Ding et al., 2012; Fu et al., 2016). It generally takes half a day to a few days to collect PM on filters, followed by the solvent or thermal extraction of target compounds and chemical analysis. However, during the collection cycle of each sample, emissions of OA and its precursors are not necessarily consistent, and chemical transformation may occur over several generations. For example, cooking and vehicle emissions vary significantly over the course of a day (Sun et al., 2018; Yao et al., 2021). With much higher time resolutions, aerosol mass spectrometry (AMS) was developed and has been extensively applied in OA research (Sun et al., 2018; Liu et al., 2019; Yao et al., 2022). Nevertheless, AMS cannot provide molecular information about OA due to the application of hard ionization, which makes it difficult to identify unambiguous OA sources with AMS data (Sun et al., 2011; Lee et al., 2015). Applied earlier in the United States (Williams et al., 2006, 2010), the in situ measurement of OA molecular markers based on thermal desorption has become an emerging technique for the chemical characterization of OA in China, e.g., Beijing (Ren et al., 2019), Shanghai (Li et al., 2020; Wang et al., 2020), and Hong Kong SAR (HK) (Lyu et al., 2020; Wang et al., 2022).
HK is a metropolis in East Asia with a developed economy and a high population density. Although the PM2.5 level has continued to decrease in recent decades, it is still far from the World Health Organization guideline value (5 µg m−3). Led by the service sector, HK has few high-emission industries. Street-level air pollution has long been a concern due to vehicle emissions (Lee et al., 2006; Liu et al., 2019). Moreover, mounting evidence demonstrates the considerable contributions of cooking emissions to OA (Lee et al., 2015; Sun et al., 2016). On the other hand, SOA formation in HK may also be significant, as mediated by the subtropical climate and coastal features. For example, studies indicated that aqueous processes accelerated SOA formation in spring with high relative humidity in HK (Li et al., 2013). In addition to local emissions and chemistry, transboundary transport also increases the atmospheric load of OA in HK (Lyu et al., 2017; Cheng et al., 2021). With filter-based techniques, a range of molecular compositions of OA, such as polycyclic aromatic hydrocarbons (PAHs) (Guo et al., 2003; Liao and Yu, 2020), alkanes (Yao et al., 2004; Yu et al., 2011), dicarboxylic acids (Ho et al., 2006; Hu and Yu, 2013), and anhydrosugars (Zhang et al., 2012; Ho et al., 2014), have been intensely studied in HK. Furthermore, OA sources have also been explored by introducing the molecular markers into receptor models (Hu et al., 2010; Huang et al., 2014b; Chow et al., 2022). Cooking emissions, vehicle emissions, biomass burning, and secondary formation were identified as the main sources of PM in HK. AMS has also been applied in HK, advancing our understanding of the dynamic features of OA and its sources (Lee et al., 2015; Xing et al., 2022). In recent years, thermal desorption aerosol gas chromatography coupled with mass spectrometry (TAG) allowed for the in situ measurement of OA molecular markers and facilitated understanding of dynamic source contributions to OA at two background sites in HK (Lyu et al., 2020; Wang et al., 2022). In brief, it was found that the concentrations of SOA markers were significantly elevated in PM2.5 pollution episodes and transboundary transport led to a rise in biomass burning contributions to OA. Despite the previous studies, there is a lack of knowledge on time-resolved and unambiguous sources of OA in urban areas of HK.
This study presents the temporal variations in OA and a range of molecular markers therein based on a continuous measurement for ∼ 1 month at an urban site in HK with TAG and AMS. Diurnal patterns of typical markers are discussed to indicate the emission patterns and possible formation mechanisms of OA. Source apportionment with the time-resolved data reveals the dynamic source contributions. The study enhances our understanding of urban OA in HK at a bihourly resolution and molecular level and provides a reference for PM pollution mitigation by intervention in OA emissions and formation.
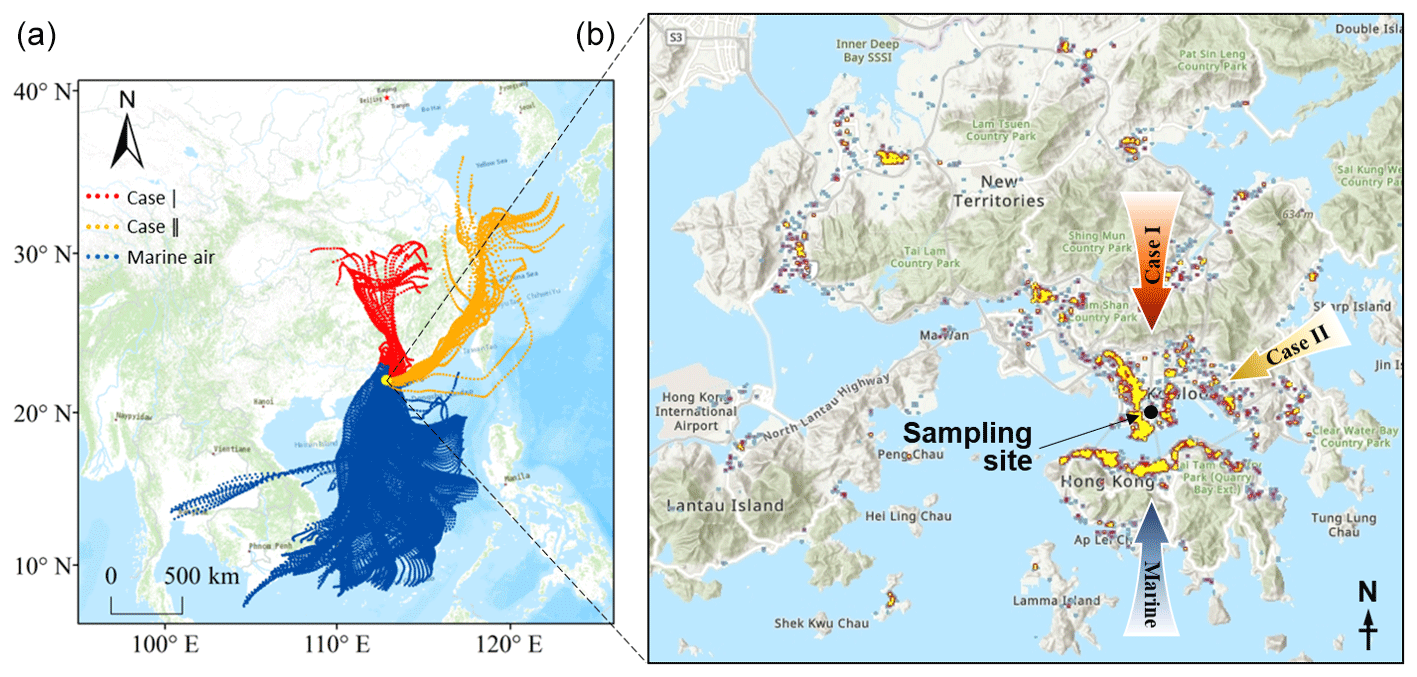
Figure 1Location of the sampling site with 72 h backward trajectories of three types of air masses (a) and a heatmap of the distribution of restaurants in HK (b).
2.1 Sampling campaign
The observation experiment was carried out on the campus of the Hong Kong Polytechnic University from 6 to 26 June 2019. The instruments were deployed in a laboratory on 11th floor at a height of ∼ 45 m above ground level. The sampling inlet protruded ∼ 1.5 m from the wall. As shown in Fig. 1, the site was in a mixed residential and commercial area with heavy traffic, which was also one of the areas with the highest concentration of restaurants in HK. Moreover, it is worth noting that the nearby funeral parlors and temples within 1 km to the east of the site often conducted the burning of worship supplies, ritual candles, and incense.
Despite an urban site, air pollution could also be influenced by regional transport. The 72 h backward trajectories of air masses reaching the site were calculated using the HYbrid Single-Particle Lagrangian Integrated Trajectory model, which was driven by the Global Data Assimilation System archive data at a horizontal resolution of 1° × 1°. The trajectories started from the location 50 m above the sampling site and were calculated every 2 h. Based on their origins and paths, the air masses were classified into three types (Fig. 1). Those from the South China Sea represented the marine air (blue trajectories in Fig. 1) and accounted for ∼ 87 % of the total air mass. However, the fraction of air mass originating from and passing over the mainland was very low (6 %, red trajectories), and this is the same for that which arrived at the site along the coastline of eastern and southern China (7 %, orange trajectories). From a representative perspective, we discuss them as special cases, and the continental air and coastal air are labeled as Case I and Case II, respectively.
To analyze OA as small particles of interest, a cyclone of submicron particulate matter (PM1) was installed at the front of the inlet line and was made of pre-cleaned copper tubing. The cutoff size of 1 μm also matched the design of the high-resolution time-of-flight aerosol mass spectrometry (HR-ToF-AMS, abbreviated as AMS hereinafter) instrument manufactured by Aerodyne Research Inc. AMS couples size-resolved particle sampling and mass spectrometry analysis, enabling the real-time measurement of non-refractory compositions of PM1, including total organic matter (PM1-OM), sulfate, nitrate, ammonium, and chloride. With hard ionization and in the absence of species separation, AMS only provides mass spectral fragmentation information on size-segregated particles that arrive at the ionizer at the same time. As an important addition, the molecular markers of PM1-OM were measured every 2 h using the first commercial TAG instrument, jointly developed by Aerodyne Research Inc. and the University of California, Berkeley. The main difference between TAG and traditional gas chromatography–mass spectrometry (GC–MS) is that TAG automates sample collection, derivatization, transfer, and GC–MS analysis. Within each cycle, the air after the removal of gaseous organics by a charcoal denuder was drawn and impacted onto a collection and thermal desorption (CTD) unit at a constant rate of ∼ 10 L min−1 for the first 90 min. Afterwards, the CTD unit was heated according to a preset program. At the same time, a helium flow saturated with N-trimethylsilyl-N-methyl trifluoroacetamide was injected into the CTD unit to derivatize and purge the sample to a focusing trap (FT) that was maintained at room temperature. The FT allowed the volatiles to flow out and trapped the less-volatile compounds. Then, it was heated quickly, and the trapped substances were flushed to the chromatographic column head by helium. Lastly, the GC–MS analysis was performed but did not take any additional time because it happened simultaneously with sample collection. The sample treatment, transfer, and some other steps took 30 min; thereby it took 2 h for a complete cycle. With online derivatization and thermal desorption, TAG was capable of analyzing a wide range of polar and nonpolar organic compounds. A 5.22 µL mixture of deuterated (2H-containing) or 13C-containing compounds at a concentration of 0.0625–0.5 ng µL−1 was used as the internal standard (IS) and was injected on top of every ambient sample and subject to the same treatment and analysis procedures. Therefore, the ISs could track and correct for the changes in instrument sensitivity. More details about the AMS and TAG operations, including the IS information, can be found in our previous studies (Lyu et al., 2020; Huo et al., 2022).
Moreover, the mixing ratios of inorganic trace gases, including sulfur dioxide (SO2), carbon monoxide (CO), nitric oxide (NO), nitrogen dioxide (NO2), and ozone (O3), were continuously measured in the sampling period. The instruments are listed in Table S1 in the Supplement, and more operation and quality control details have been presented elsewhere (Guo et al., 2013). We adopted the meteorological parameters measured by the Hong Kong Observatory at the King's Park Meteorological Station, which was ∼ 870 m away from our sampling site. They include temperature, relative humidity (RH), wind speed (WS), wind direction (WD), and ultraviolet (UV) light. The prevailing winds were roughly consistent with the origins of air masses indicated by the backward trajectories. Liquid water content (LWC) in PM1 was calculated in the same way as that adopted by Yao et al. (2022), using the Extended Aerosol Inorganics Model with temperature, RH, and inorganic ions in PM1 as inputs. Table S2 in the Supplement shows the various metrics (mean, median, and percentiles) of the trace gases, meteorological parameters, and LWC.
2.2 Processing of TAG data
A total of 225 bihourly samples were analyzed by TAG throughout the experiment, and 74 OA markers in the volatility range equivalent to C16–C36 n-alkanes were identified based on their retention time and mass spectrums, especially the base ion (Lyu et al., 2020), as shown in Table S3 in the Supplement. In brief, we identified a species from the TAG chromatogram based on the retention time of the base ion of the authentic standard and confirmed it by searching the ion fragments in an expanded National Institute of Standards and Technology (NIST) mass spectral library. For a few samples, the fatty acids and oleic acid were not fully derivatized, likely due to their exceptionally high concentrations in cooking hours. Peak fitting and integration were performed to both the derivatized and underivatized forms of them. Given the consistent number of ISs injected on top of all individual samples, the variations in peak areas of ISs over time could only be attributed to changes in instrument sensitivity (including recovery rate). To understand the true variations in target compounds in the air, we calculated the ratio of the peak areas of target compounds to the peak areas of corresponding ISs with similar structures and a close retention time, and the ratio is deemed to be the IS-corrected response. The pairing of target compounds and ISs is the same as that adopted in Lyu et al. (2020). However, we ran out of the external standards (multiple concentrations of authentic standards that are exactly the same as target compounds or surrogate standards) in this sampling campaign. Therefore, the relationship between the IS-corrected response and concentration was not determined, and the concentrations of the detected species were not quantified. We use the IS-corrected responses of target compounds for analysis instead.
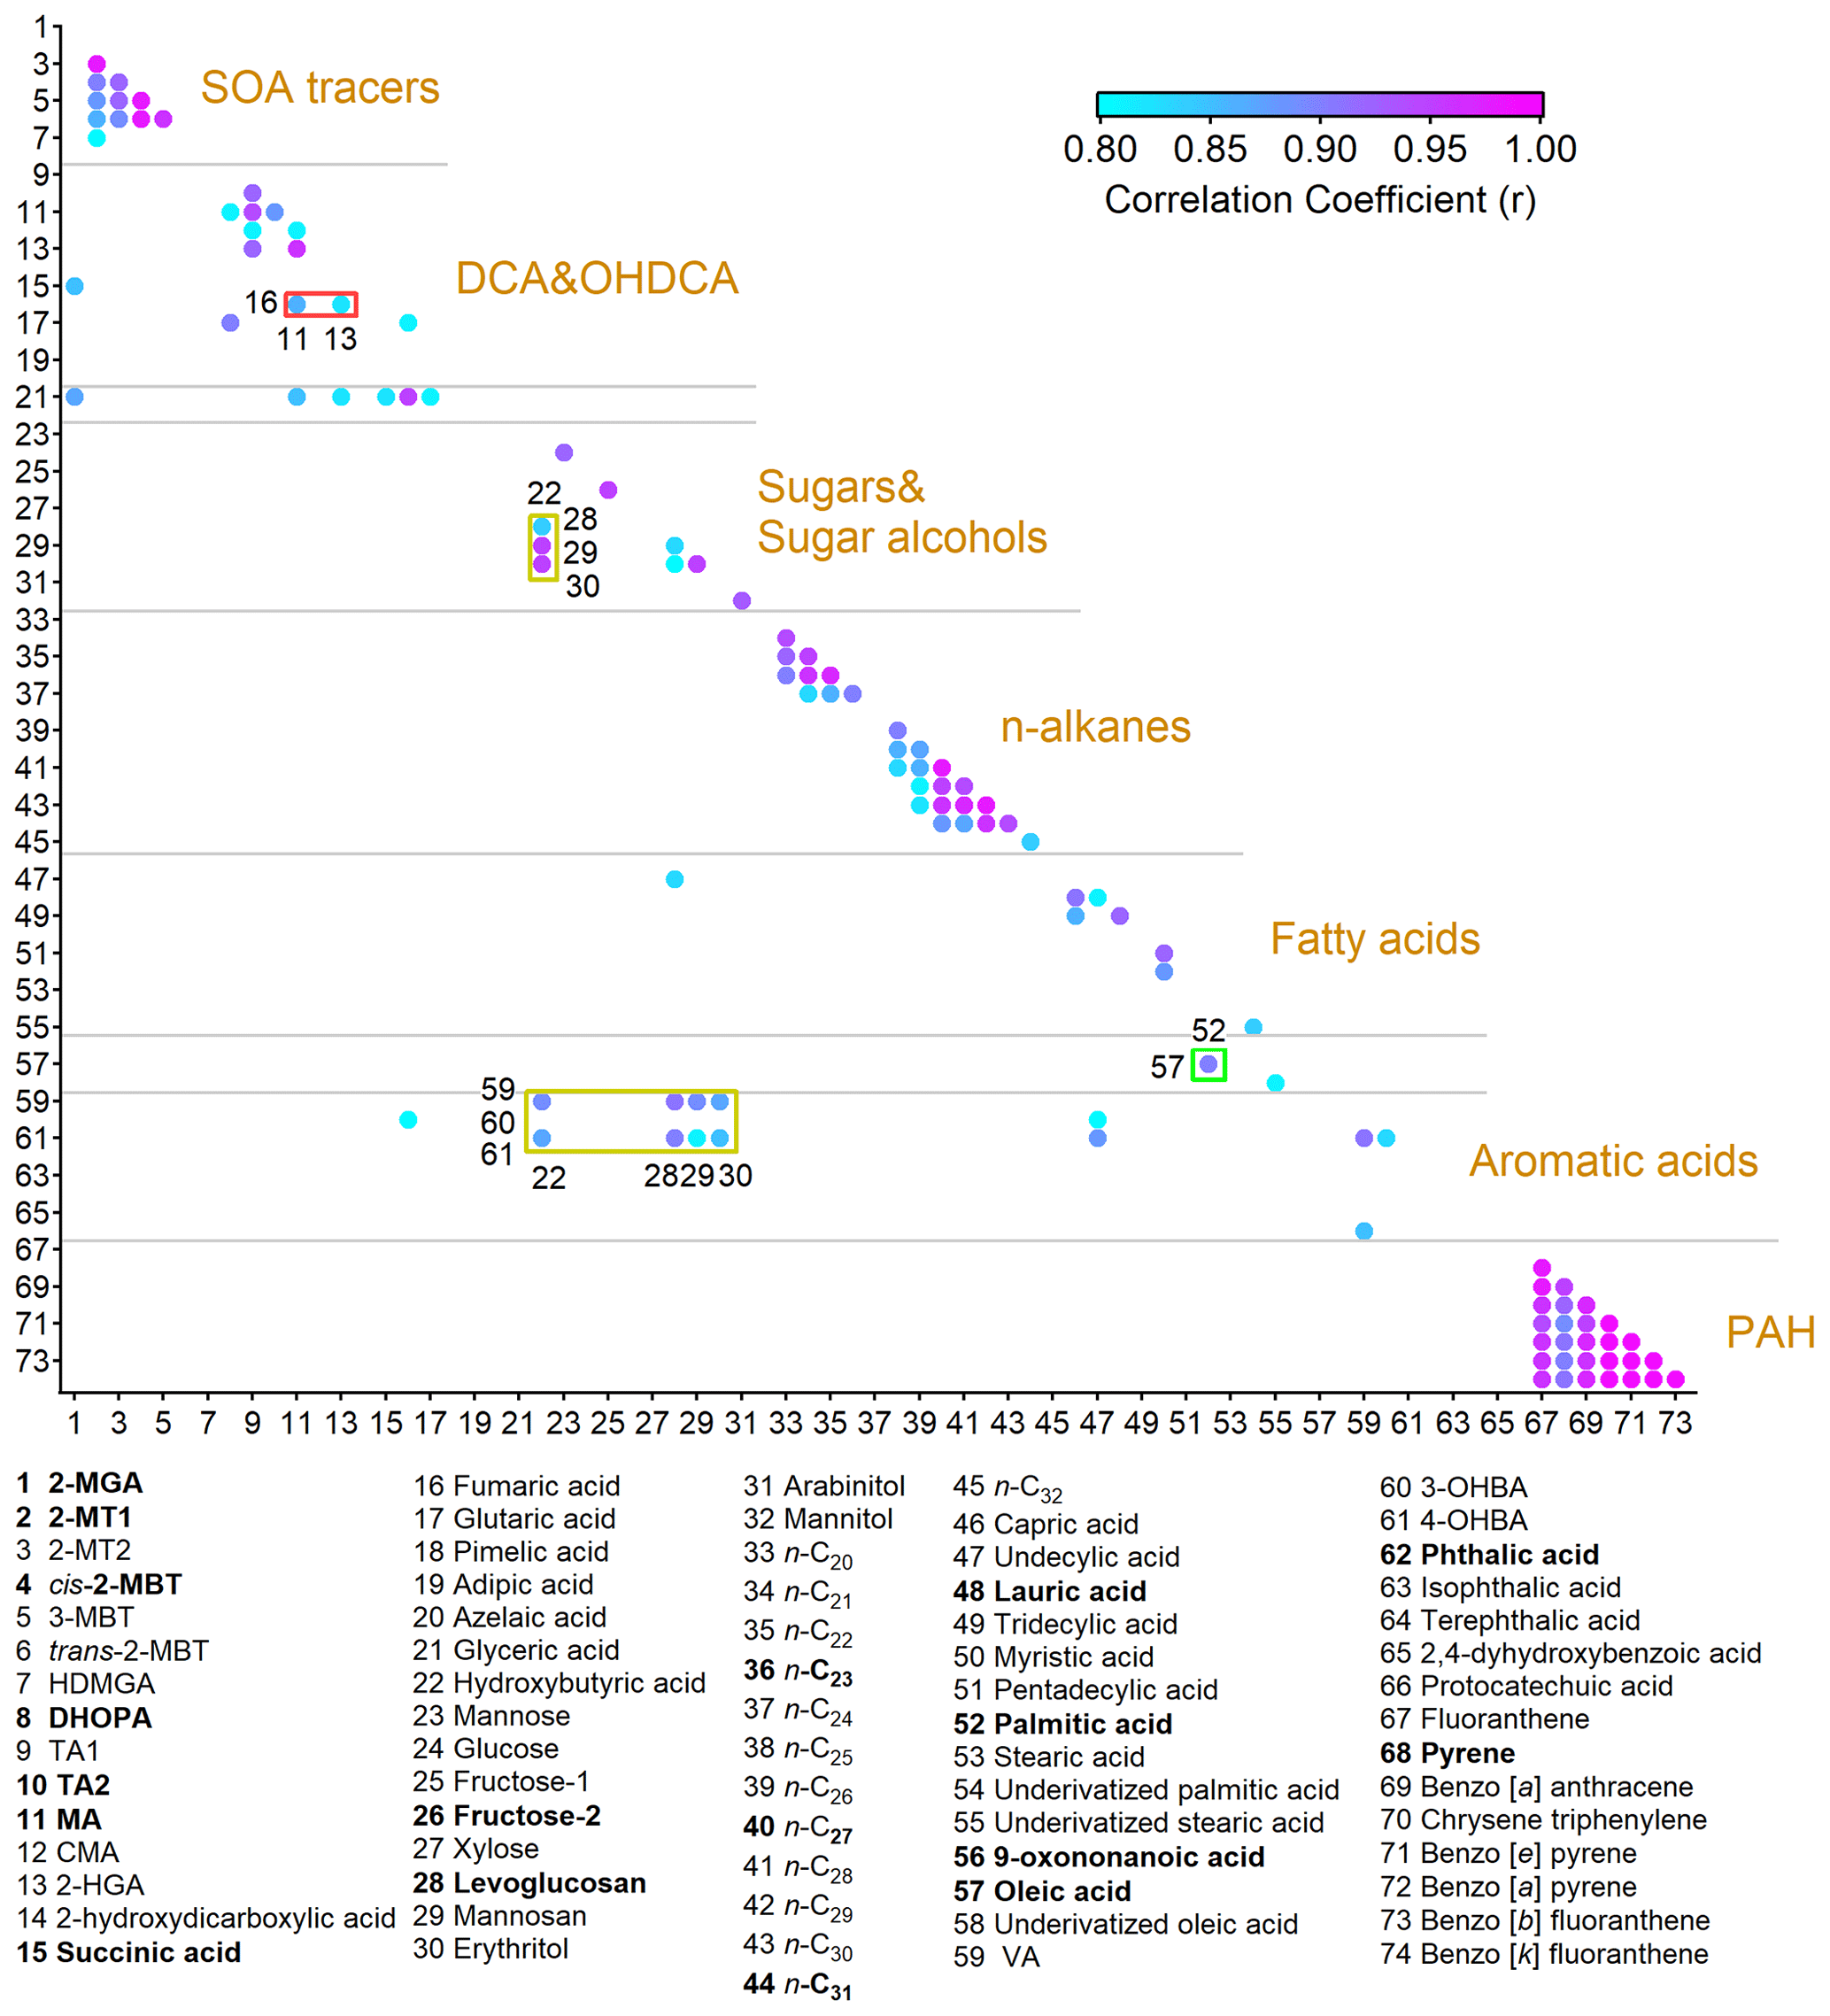
Figure 2Pearson correlation coefficients between OA molecular markers with r not lower than 0.8. The representative species that we focus on in this study are in bold. The full names of the abbreviations are given in Table S3.
For ease of analysis, we first classified the detected compounds based on their common origins and chemical structures. Furthermore, Pearson correlation analysis was performed among them, as shown in Fig. 2. Moderate to good correlations were identified for some species within seven groups, including common SOA markers, dicarboxylic acids (DCAs) and hydroxyl dicarboxylic acids (OHDCAs), sugars and sugar alcohols, n-alkanes, fatty acids, aromatic acids, and PAHs. The Pearson correlation coefficient (r) was higher than 0.89 for the correlations between any pair of four- or five-ring PAHs. The variations in levoglucosan and mannosan were roughly consistent (r = 0.83). Good correlations (r > 0.78) were identified within the subgroups of n-alkanes with high molecular weight (C25 – C30) and low molecular weight (C20 – C24) separately but not between them. This likely resulted from their different sources, e.g., vegetable wax and debris for the former and petroleum products for the latter (Kawamura et al., 2003; Simoneit et al., 2004; Kang et al., 2016a). Consistent variations were observed for OHDCA species. Some DCAs, such as succinic acid which is a known precursor of malic acid (Hu and Yu, 2013), also correlated well with OHDCA. The patterns of isoprene SOA markers formed under the conditions of low nitrogen oxides (NOx), i.e., 2-methyltetrols (2-MTs) and C5-alkenetriols (Claeys et al., 2004; Edney et al., 2005; Surratt et al., 2010), resembled each other (r > 0.88). Moreover, there were also some correlations between species of different groups, mainly due to co-emissions from cooking (oleic acid, fatty acids, fructose isomers, and azelaic acid) and biomass burning (vanillic acid, VA; 4-hydroxybenzoic acid, 4-OHBA; and levoglucosan). Based on the correlations, we selected 18 OA markers as representatives of the whole in the following analyses, as highlighted in Fig. 2 and Table S3. All chemical and meteorological data with a time resolution higher than the TAG data were converted to bihourly averages for matching purposes where necessary.
2.3 Application of the Positive Matrix Factorization (PMF) model
PMF has been widely used as a quantitative tool to understand air pollution sources (Hu et al., 2010; Wang et al., 2018; Dai et al., 2020). In this study, the EPA PMF v5.0 model was used to perform the source apportionment for PM1-OM. A total of 13 OA markers measured by TAG and NOx were used to indicate the sources, including two OHDCA species (MA and 2-HGA; see Table S3 for the full names), two anthropogenic SOA markers (DHOPA and phthalic acid), three isoprene SOA markers (2-MT1, cis-2-MBT, and 2-MGA), one monoterpene SOA marker (HDMGA), one oxygenated cooking OA (OCOA) marker (9-oxononanoic acid), and four primary organic aerosol (POA) species (levoglucosan, fructose-2, palmitic acid, and oleic acid). Here, a “source” refers not only to a specific and isolated source of direct emissions but also to a combination of multiple sources (e.g., vehicle emissions) and/or transformation processes (e.g., SOA). The uncertainty file was compiled following the method described in Lyu et al. (2020), based on an error faction of 10 % and method detection limit (MDL) for individual species. The MDL for PM1-OM measured by AMS was determined to be 0.201 µg m−3, as described in Sect. S1 in the Supplement. Since the molecular markers measured by TAG were not quantified in this sampling campaign, the MDLs determined for the same instrument ∼ 8 months earlier were adopted (Lyu et al., 2020). For the newly detected species, e.g., phthalic acid, 2-MGA, cis-2-MBT, and 9-oxononanoic acid, we assume 10 % of the average IS-corrected response to be the dimensionless MDL. Extreme values are generally difficult to reproduce with a PMF model, especially for data points with scaled residuals greater than 4. To address this, greater weight was given to the high values that are considered true in the PMF iteration process, as described by Wang et al. (2018).
The optimal number of PMF factors was determined according to the mathematical tests and physical interpretability. We examined the solutions with 3–10 factors and the corresponding Q Qexp ratios (Fig. S1 in the Supplement). The ratio decreased rapidly for 3–7 factors, with the decline slowing down for 7–10 factors, demonstrating a minimum of 7 factors from a mathematical perspective. Further inspections found that some markers indicative of different sources (e.g., DHOPA and MA) were not separated in the 7-factor solution, and some species were not well reproduced. The 9-factor solution however apportioned markers of the same source into multiple factors. We ended up with 8 factors, which provided a reasonably good fit for all species with physically interpretable source profiles.
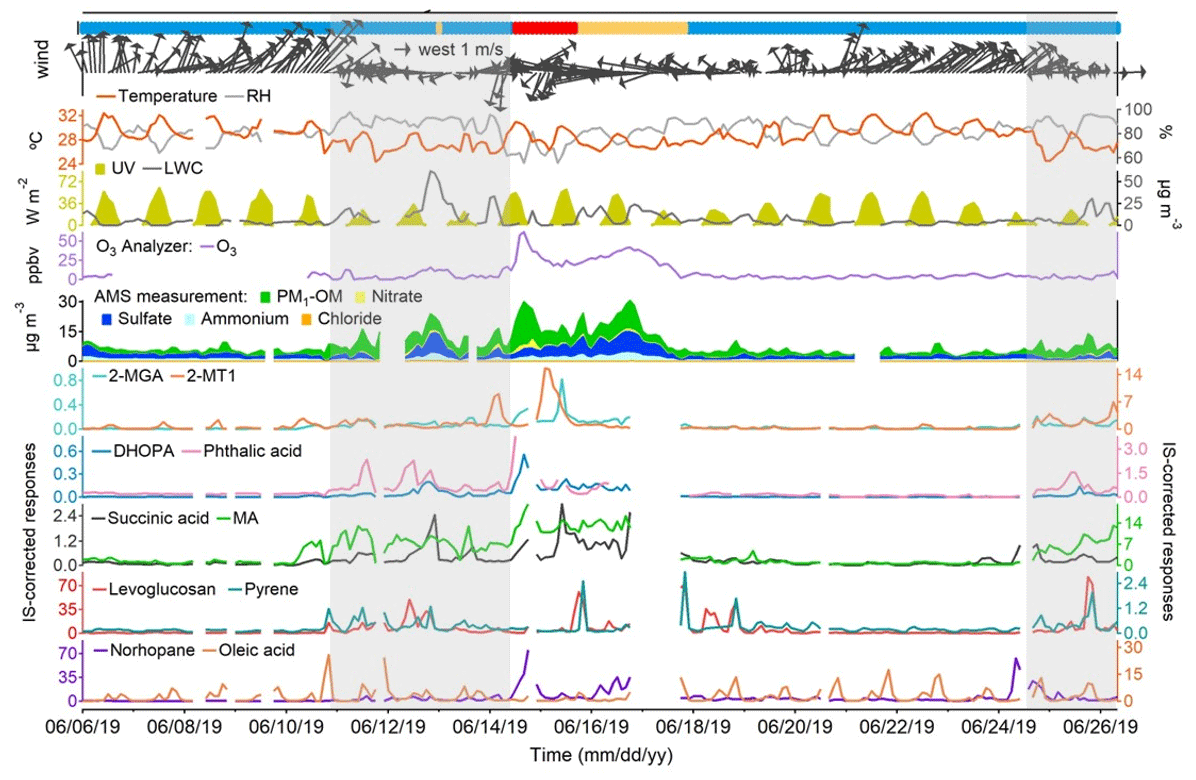
Figure 3Time series of representative OA markers, PM1 compositions, trace gases, and meteorological conditions. Blue, orange, and red bars at the top represent marine, coastal, and continental air, respectively. Shaded areas represent the periods with troughs. Missing data are due to instrument maintenance.
2.4 Statistical analysis
Due to uneven emission patterns, non-linear chemistry, and changing meteorological impacts, the distribution of the concentration of urban air pollutant is often uncertain. This determines how we describe the data. In this study, we examined the data distribution with Shapiro–Wilk tests. It was found that the concentrations of most species studied did not follow a normal distribution, neither over the entire observation period nor within sub-periods defined by air mass categories, with only a few exceptions (e.g., palmitic acid in Case I and 2-MGA in Case II). Therefore, it is insufficient to analyze and discuss the data based only on the mean values. As a supplement, we also show the 25th percentile, median, and 75th percentile where necessary. However, to avoid redundancy, not all metrics are referenced in all discussions. Moreover, given the non-normal distribution of the data, non-parametric Mann–Whitney U tests were performed to compare any two sets of data. The significance levels are expressed as p values. Both the Shapiro–Wilk test and the Mann–Whitney U test were implemented using the scipy.stats package in Python. All correlation coefficients shown in this paper are derived from Pearson correlation analysis and are significant (p < 0.05), unless otherwise specified.
3.1 Overview of the sampling campaign
Figures 3 and S2 in the Supplement show the time series of the selected OA markers, PM1 compositions, trace gases, and meteorological conditions throughout the sampling period. The origins of air masses are also labeled. Table S4 in the Supplement lists the statistics of PM1-OM, sulfate, nitrate, and ammonium in PM1. PM1-OM was found to be the most abundant component, followed by sulfate, ammonium, and nitrate, whether based on the mean or median. The fraction of PM1-OM (47.1 ± 2.2 %) was comparable to that at an urban background site in HK (43.8 %) but significantly lower (p < 0.05) than that at a roadside site ∼ 350 m away (57.7 %) (Yao et al., 2021,2022). From the perspective of air mass categories, PM1-OM was the lowest in the most common marine air, followed by that in Case II with coastal air and Case I with continental air; this is the same for CO and O3 (Tables S5–S7 in the Supplement). The highest concentrations of sulfate and ammonium were observed in Case II, likely due to aqueous aging of regional air pollution (Huo et al., 2024). Although the marine air was supposed to be relatively clean, it contained elevated levels of SO2 and NOx, which correlated well with each other (r = 0.87). This phenomenon was in line with that at the three roadside sites in HK but was not identified at the general urban sites (Fig. S3 in the Supplement). Therefore, the close relationship between SO2 and NOx on the days with marine air were likely attributable to local vehicle emissions rather than ship emissions. For all types of air masses, we also note that the variation in NOx throughout the day was highly consistent with that observed at a nearby roadside site (Fig. S4 in the Supplement). Moreover, there was no correlation between NOx and levoglucosan, even during the period with elevated levels of levoglucosan, eliminating the likelihood of high biomass burning contributions to NOx. Therefore, NOx is regarded as a marker of vehicle emissions in this study. Under the conditions of marine air, the concentrations of many air pollutants, including both primary and secondary species, increased significantly (p < 0.05) on 10–14 and 24–26 June, when HK was affected by the troughs of low pressure with cloudy weather and low wind speeds. This might be related to unfavorable dispersion conditions and enhanced chemistry under special meteorological conditions and is further discussed below.
The primary cooking OA (PCOA) markers, such as oleic acid, palmitic acid, and fructose isomers, did not show obvious inclination toward the trough periods and exhibited some periodic spikes in marine air. Therefore, it seemed that local cooking emissions somewhat overwhelmed the effects of atmospheric mixing and transformation. However, the levels of PCOA markers were much lower (p < 0.05) in the case with continental air than in marine air. On the one hand, this could be partially explained by the quicker chemical losses, due to the higher concentrations of oxidants, e.g., O3 (Tables S5–S7). Oleic acid with a carbon–carbon double bond in the molecule can be efficiently oxidized by O3 and other oxidants (Zeng et al., 2020; Wang and Yu, 2021). The argument is supported by the fact that 9-oxononanoic acid, a typical OCOA marker (Lyu et al., 2021), in the two cases was 1.47–2.00 times (or 1.36–1.53 times by median) the level in marine air. On the other hand, the differences could be related to the uneven distribution of restaurants in different air paths. As shown in Fig. 1, the restaurant density in the areas where the continental and coastal airflows passed is substantially lower than south of the sampling site. Moreover, it cannot be ruled out that the limited number of samples in the two cases coincidently did not capture the cooking emissions well. Differently, levoglucosan and some odd n-alkanes (e.g., n-C27) with a few spikes were more abundant in Case II (p < 0.05). Furthermore, we found that high levels of levoglucosan were associated with easterly winds (Fig. S5). As stated in Sect. 2.1, the burning of incense, candles, banknotes, and paper products was common within 1 km east of the site. There was no known source of biomass burning further east, and east of HK only water is found. Therefore, the observed variations in levoglucosan were mainly attributed to the combined effect of local emissions and wind patterns, which is different from the regional transport of biomass burning plumes from the mainland to HK in cool seasons (Sang et al., 2011; Chow et al., 2015). The wind dependence was not identified for the other species, except that the strong southwest winds caused low levels of many OA markers due to the dilution by the relatively clean marine air.
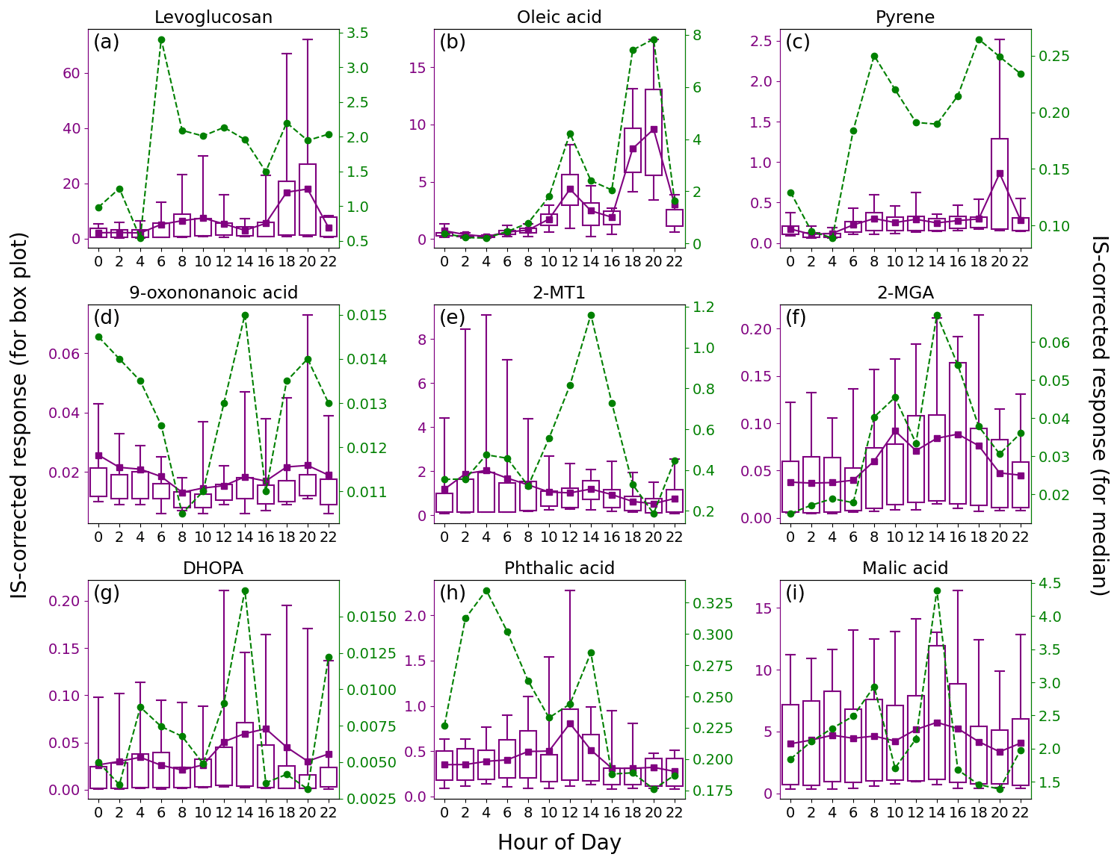
Figure 4Average diurnal patterns of nine representative OA markers. Tip of the top (bottom) whisker is the 95th (5th) percentile. Top and bottom of the box denote the 75th and 25th percentiles, respectively. The mean value is indicated by a purple square, and a green circle represents the median value.
The temporal variations in SOA markers were quite different. The mean (median) values of 2-MTs (e.g., 2-MT1), C5-alkenetriols (e.g., cis-2-MBT), and 2-MGA increased significantly (p < 0.05) by 13.1 (7.3), 18.4 (19.5), and 13.8 (9.8) times in Case I when the continental air arrived. Consistent with that at an urban background site (Lyu et al., 2020), higher levels of 2-MTs (isoprene SOA in an NOx-lean environment) were observed at night and 2-MGA (isoprene SOA in an NOx-rich environment) exhibited the peak in the afternoon. The temperature and UV were not exclusively high in Case I, and we presume the same for biogenic emissions locally. Therefore, the notable levels of isoprene SOA markers suggested that the continental air transported biogenic SOA and/or the precursors to this site. Succinic acid correlated fairly well with 2-MGA in Case I (r = 0.92), indicating that it was a degradation product of isoprene under high-NOx conditions. Moreover, the first day of Case I also experienced the highest levels of DHOPA and phthalic acid, two anthropogenic SOA markers derived from aromatics (Bunce et al., 1997; Jang and McDow, 1997; Kleindienst et al., 2004). This could also be related to regional transport, given the notable rise in other anthropogenic air pollutants (e.g., CO) simultaneously. In addition, it was likely that the enhancement of atmospheric oxidation capacity, as indicated by the highest level of O3 over the sampling campaign, facilitated the formation of many SOA species on this day. These factors might also play a role in maintaining the high levels of OHDCA, such as malic acid and tartaric acid, which were elevated during a low-pressure trough in the previous days with marine air. In fact, the troughs witnessed enhancements of a wide range of species relative to their levels in marine air without troughs (Table S7). The highest change ratio for the mean values of POA markers was 5.3 for benzo[a]pyrene. However, more significant increases were observed for many SOA markers, including DHOPA, C5-alkenetriols, OHDCA species, and phthalic acid, implying the role of processes other than transport and atmospheric mixing. The conclusion also holds, based on median analysis. It is noteworthy that the troughs featured lower temperature and much weaker radiation, while RH and LWC were higher (Table S7). A recent study demonstrated the aqueous photochemical formation of OHDCA in HK (Huo et al., 2024). While it is unknown whether this was also responsible for the increases in the other SOA markers, a moderate correlation (r = 0.64) was identified between phthalic acid and the product of RH and UV during the trough periods and was not found at other times (Fig. S6 in the Supplement). Moreover, the rise in C5-alkenetriols resembled the changes in 2-MTs, which mainly occurred at night and could also be linked to aqueous processes, as discussed below. Therefore, the high RH and LWC might be one of the leading factors, if not all, of the SOA enhancements in the presence of troughs.
3.2 Diurnal patterns of representative OA markers
An advantage of TAG measurement is the time-resolved data of OA markers. Figure 4 presents the average diurnal profiles of nine representative species, and some others with lower priorities are shown in Figs. S7 and S8 in the Supplement. While both the mean and median are used in the following discussions, the much lower median values, if applicable, were generally observed in marine air and the high mean values resulted from a small number of samples influenced by continental air, coastal air, or intense local emissions.
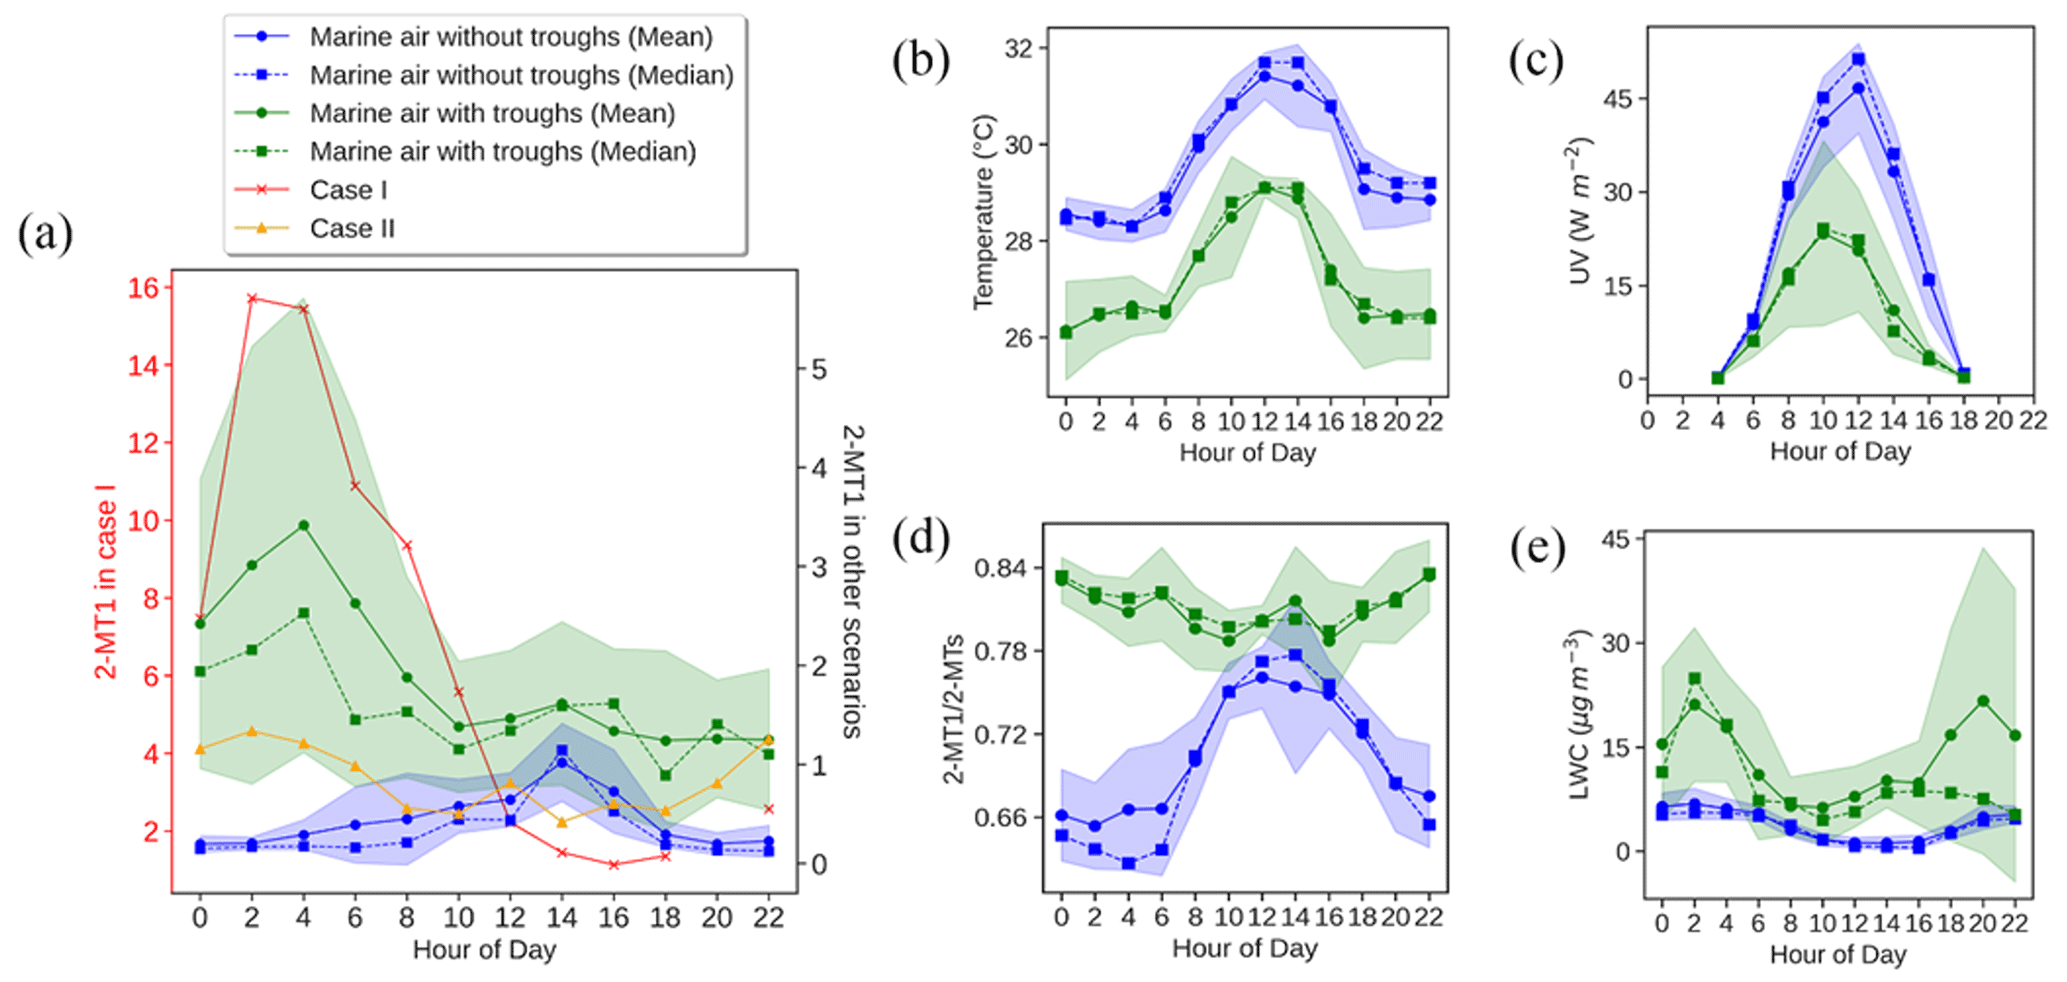
Figure 5Diurnal patterns of 2-MT1 in different cases (a) and comparisons of (b–e) temperature (b), UV (c), the 2-MT1 2-MTs ratio (d), and LWC (e) of the marine air with and without troughs. Shaded areas represent 95 % confidence intervals.
The consistently higher median values for levoglucosan between 06:00 and 22:00 LT (local time; GMT + 8) indicated it to be emissions from human activities. As discussed above, the elevated levels of levoglucosan were related to the combustion of biomass products nearby. Here, we note that the sporadic extreme high values caused a marked increase in mean values of levoglucosan during 18:00–20:00 LT, which roughly coincided with the timing of smoke from the funeral parlor chimneys, according to our observations. Some other species, including 4-OHBA, VA, mannosan, xylose, hydroxybutyric acid, and protocatechuic acid, showed consistent diurnal patterns (Figs. S7 and S8), indicating that they were mainly derived from biomass burning. Moreover, both the bihourly mean and median C26–C31 n-alkanes were observed with obvious peaks at 08:00 and 20:00 LT and might also be related to the burning of incense, candles, joss paper, and paper artifacts nearby, which was confirmed in other scenes (Lyu et al., 2021; Song et al., 2023). Other sources, e.g., vehicle emissions, might also contribute to the peak at 08:00 LT that was more pronounced than levoglucosan. Oleic acid was obviously enhanced at noon and in the early evening, when intensive cooking activities took place in restaurants and at home; this is the same for fatty acids, azelaic acid, and fructoses (Figs. S7 and S8). The consistency of azelaic acid with oleic acid (r = 0.76) indicated that a considerable fraction of the azelaic acid was derived from or quickly formed in primary cooking emissions. Pyrene, as a representative of PAHs, was observed with higher median and mean values during 06:00–22:00 LT. The median values showed peaks in the morning and early evening, while the mean value was highest at 20:00 LT. Interestingly, the high levels of pyrene correlated well with levoglucosan (r = 0.94) at 20:00 LT (Fig. S9 in the Supplement) and exhibited no correlation with oleic acid, which also had the highest levels in the early evening. Therefore, the burning of biomass products nearby was responsible for the occasionally elevated levels of PAHs in the early evening. At the other times, the variation in pyrene was consistent with that of NOx (r = 0.80), indicating their common source of vehicle emissions. This also explained the bimodal distribution of the bihourly median values of pyrene.
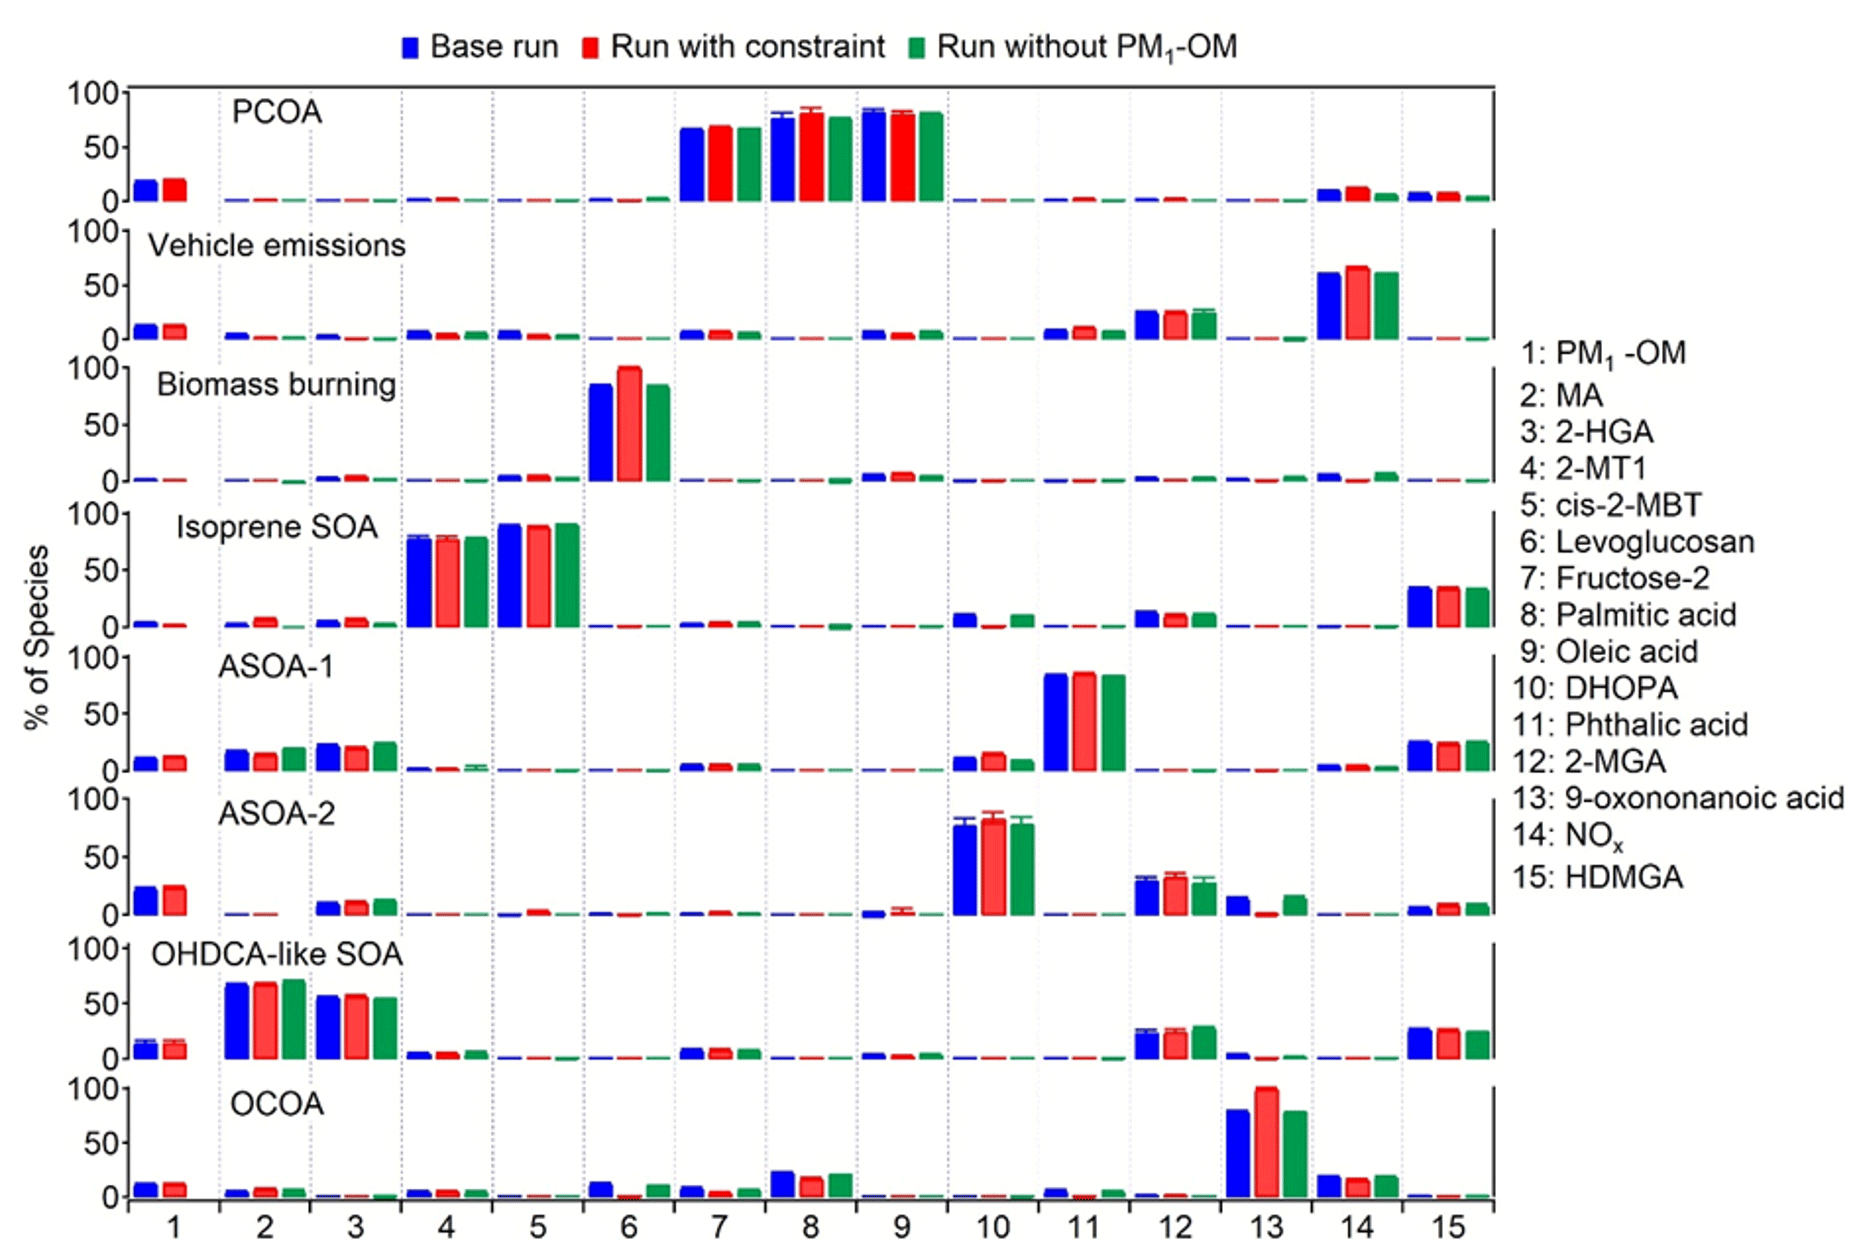
Figure 6Average profiles of the eight factors resolved by PMF. The error bars represent 95 % confidence intervals estimated by the bootstrapping (BS) method.
As a marker of OCOA, 9-oxononanoic acid got high levels at night and showed a peak in the early afternoon. The nighttime enhancement was in line with the observations in a study on indoor air quality (Lyu et al., 2021) and was due to the O3-initiated oxidation of cooking emissions that occurred in the early evening. For the same reason, the bihourly median 9-oxononanoic acid peaked at 14:00 LT, 2 h after the peak of oleic acid. Although the diurnal pattern of 9-oxononanoic acid was totally different from that of oleic acid and azelaic acid, the variation in the ratio of 9-oxononanoic acid to oleic acid was consistent with that in the ratio of azelaic acid to oleic acid (Fig. S10 in the Supplement), both reflecting the chemical aging of cooking emissions. The bihourly mean 2-MTs showed higher levels between midnight and dawn, as did C5-alkenetriols, contrary to the common understanding. This however was in line with previous observations at two background sites in HK conducted by us and another team (Lyu et al., 2020; Wang et al., 2022). Nevertheless, a significant daytime enhancement was observed for the bihourly median 2-MTs. Day-by-day inspections found inconsistent diurnal patterns for 2-MTs, which were grouped into four categories, as shown in Fig. 5. As speculated in previous studies (Lyu et al., 2020), the higher levels of 2-MTs in the two cases with non-marine air might result from transboundary transport and diurnal evolution of the boundary layer. On the days with marine air, two distinct patterns were identified. Similar nighttime enhancement was observed in the presence of troughs. Interestingly, 2-MTs exhibited the highest levels in the afternoon without the influence of the troughs, which resulted in the different patterns of bihourly mean and median values. These days were accompanied by higher temperature and UV intensity but lower RH and LWC (Fig. 5). Therefore, the afternoon peak was likely attributed to the more intensive emissions and photochemical oxidation of isoprene. Moreover, we uncovered some clues that nocturnal chemistry might regulate the diurnal patterns of 2-MTs. According to Nozière et al. (2011), the ratio of 2-methylerythritol to the sum of 2-methylerythritol and 2-methylthreitol, referred to as 2-MT1 2-MTs hereinafter, indicates the sources of 2-MTs: primary emissions (0.35), NOx-lean photooxidation (0.61), NOx-rich photooxidation (0.76), and aqueous-phase oxidation (0.90). Under the assumption that the instrument sensitivity to the two 2-MT isomers were the same, the average 2-MT1 2-MTs ratio was 0.70 in marine air without troughs. However, it was much higher (0.81) in presence of troughs, especially at night, in line with the patterns of LWC. Hence, the higher levels of 2-MTs at night during the trough periods might be related to aqueous chemistry. Nevertheless, it could not be the sole reason for the counterintuitive patterns of 2-MTs in the continental and coastal cases, where the average 2-MT1 2-MTs ratio was 0.76 and 0.77, respectively. The influence of other factors, such as transport and atmospheric mixing, deserves study.
Conversely, 2-MGA exhibited a typical diurnal pattern of photochemical pollution, with the bihourly mean and median values increasing from morning to afternoon. Daytime enhancements were also observed for the mean values of DHOPA and phthalic acid, although their bihourly median was also high at some nighttime hours. The results suggest that photochemistry was involved in the formation of these SOA markers. It is noteworthy that the peak of bihourly mean phthalic acid appeared at 12:00 LT, ∼ 4 h earlier than the peaks of 2-MGA and DHOPA, which might be due to differences in formation mechanisms and/or oxidation states. For example, Yao et al. (2022) found that the peak of more oxidized oxygenated OA was several hours later than that of less oxidized OA, and aqueous processes were suspected between the two peaks. Despite a slight rebound at 12:00–14:00 LT, the diurnal variation in bihourly mean malic acid was small and much less pronounced than that at an urban background site (Lyu et al., 2020). This pattern also applied to the other OHDCA species, which might be partially attributed to the lower atmospheric oxidation capacity, as reflected by the difference in odd oxygen (Ox = O3 + NO2) levels, i.e., 29.5 ppbv at this site vs. 49.8 ppbv at the background site. In contrast, the bihourly median value increased from 18:00 to 08:00 LT and had another peak at 14:00 LT. These much lower levels of malic acid were observed in marine air, and the diurnal pattern was likely a combination of sea–land breezes (increase at night) and photochemical formation (afternoon peak).
3.3 Source apportionment of PM1-OM
Figure 6 shows the source profiles of the eight factors resolved by PMF. Levoglucosan was assigned to multiple factors in the base run, although the factor of biomass burning accounted for the highest fraction. Constraints were applied to reduce the levoglucosan loadings in other factors, thereby lowering rotational ambiguity. Similarly, the loading of 9-oxononanoic acid in factors other than OCOA was also pulled down. Moreover, we also performed PMF modeling without PM1-OM as was measured by AMS. This was to examine if it was appropriate to mix the components measured by two different instruments in the source apportionment. As shown, the source profiles did not change much between these tests. Table S8 in the Supplement summarizes the r, slope, and intercept for the linear regression between the PMF-modeled and observed values of individual species, which are in reasonable ranges. The scaled residuals for all species were within the range of −3 to 3. These metrics indicated that the observed magnitudes and variations in the PMF species were reproduced well. To evaluate the model stability and uncertainty in the results, bootstrapping (BS) and displacement (DISP) analyses were conducted. Based on BS tests, the factor mappings ranged from 92 % to 100 %, above the threshold of 80 % representing robust factors recommended by the PMF user guide. Namely, there was no observation that disproportionately influenced the solution. Moreover, no factor swap was found from the DISP analysis. The BS and DISP results indicated the robustness of the eight-factor solution.
The eight factors were identified as PCOA, vehicle emissions, biomass burning, isoprene SOA (low NOx), anthropogenic SOA represented by phthalic acid (ASOA-1), anthropogenic SOA represented by DHOPA (ASOA-2), OHDCA-like SOA, and OCOA. The first factor was dominated by oleic acid, palmitic acid, and fructose isomers, indicating the source of primary cooking emissions (To et al., 2000; Lyu et al., 2021; Huo et al., 2022). The second factor was regarded to be vehicle emissions, due to the high loading of NOx (see discussions in Sect. 3.1). The third factor with the dominance of levoglucosan was biomass burning (Fabbri et al., 2009). The fourth factor was identified by 2-MT2 and cis-2-MBT, both of which were isoprene SOA markers formed in NOx-lean environments (Claeys et al., 2004). We define the fifth and sixth factor as ASOA-1 and ASOA-2 based on the highest percentage of phthalic acid and DHOPA, respectively, because phthalic acid and DHOPA have been shown to be the oxidation products of aromatics (Bunce et al., 1997; Jang and McDow, 1997; Kleindienst et al., 2004). The seventh factor was characterized by its high contribution to MA and moderate contribution to 2-HGA, both of which were OHDCA species. Our previous studies (Lyu et al., 2020; Huo et al., 2024) indicated that OHDCA in HK was attributed to aqueous photochemical formation rather than direct emissions, so this factor was termed OHDCA-like SOA. Lastly, a high percentage of 9-oxononanoic acid was allocated to the eighth factor, which was deemed OCOA (Huang et al., 2021; Lyu et al., 2021).
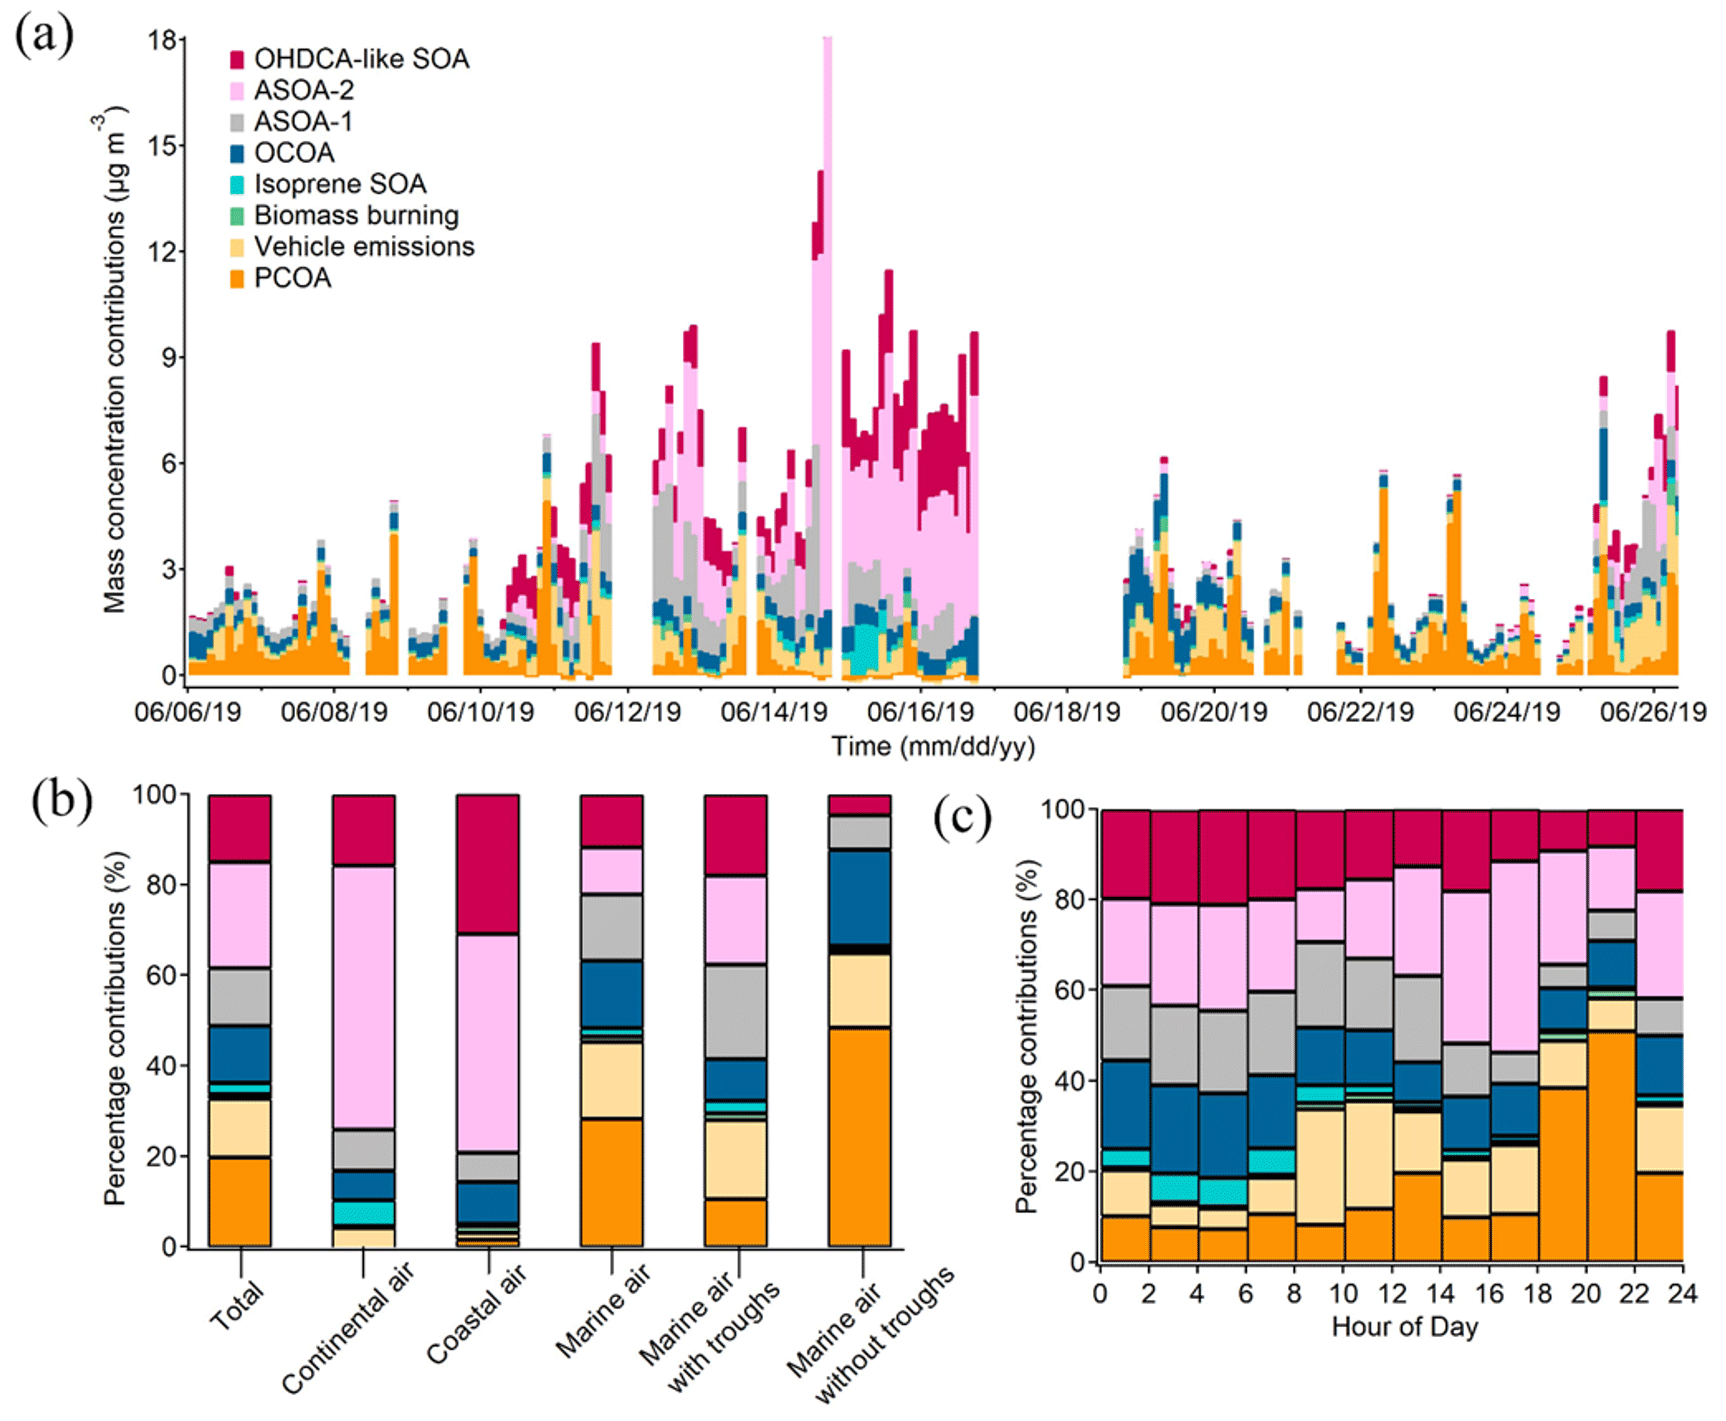
Figure 7Contributions of individual OA sources to PM1-OM: time series of bihourly data (a), averages for the cases of different air masses (b), and diurnal variations (c).
Furthermore, the source contributions to PM1-OM were determined. As shown in Fig. 7a, they varied noticeably over time, underlining the value of source apportionment based on in situ measurement of OA markers. Six sources explained a total of over 96 % of the PM1-OM. They were ASOA-2 (23.6 ± 7.1 %, source contribution, the same below), PCOA (19.8 ± 3.5 %), OHDCA-like SOA (14.8 ± 2.7 %), vehicle emissions (12.9 ± 1.9 %), ASOA-1 (12.7 ± 2.5 %), and OCOA (12.6 ± 1.1 %). Biomass burning and isoprene SOA (low NOx) only accounted for 2.4 ± 0.8 % and 1.1 ± 0.3 % of the PM1-OM, respectively. The results demonstrated significant anthropogenic air pollution, either primary or secondary, contributing to PM1-OM at this urban site. However, biogenic contributions might be somewhat underestimated because (i) isoprene SOA formed under high-NOx conditions or monoterpenes SOA were not identified, despite the inclusion of 2-MGA and HDMGA, and (ii) OHDCA-like SOA could be formed through the oxidation of biogenic precursors (Hu and Yu, 2013; Huo et al., 2024). The dominant sources, especially PCOA and vehicle emissions, were different from those at the urban background site (Lyu et al., 2020), likely due to the depletion of primary emissions during the course of their airborne migration to the background site. It is noteworthy that the high contribution of ASOA-2 was mainly attributed to several samples in Case I and Case II because the median contribution was much lower (4.5 %); this was the same for OHDCA-like SOA (6.5 %). The following discussion based on different air mass origins shows a reduction in the impact of these samples on the overall mean.
In the most common case of marine air, PCOA (28.3 ± 4.8 %) ranked the largest source of PM1-OM, followed by vehicle emissions (17.0 ± 2.5 %), OCOA (14.8 ± 1.3 %), and ASOA-1 (14.7 ± 3.0 %). As discussed in Sect. 3.1, possibly due to the enhancement of aqueous processes, some OA markers were elevated under the influence of the low-pressure troughs when backward trajectories still indicated marine air. Correspondingly, the contributions of ASOA-1 and OHDCA-like SOA to PM1-OM increased to 20.9 ± 4.0 % and 18.0 ± 2.3 % during the trough periods, respectively, with a reduction in the proportion of primary sources. While the troughs appeared to increase the levels of 2-MTs (see Sect. 3.2), the contribution of isoprene SOA (low NOx) to PM1-OM was still low (2.8 %). In contrast, PCOA became the largest source of PM1-OM (48.5 ± 9.0 %) in the case of marine air without troughs, and in second and third place were OCOA (21.2 %) and vehicle emissions (16.4 %), respectively. Their total contribution of over 86 % was striking but not necessarily unreasonable because the marine air added few pollutants into the local air. Hence, OA pollution in this case exhibited predominantly local characteristics.
In Case I with continental air, ASOA-2 and OHDCA-like SOA with a contribution to PM1-OM of 58.3 ± 21.4 % and 15.8 ± 4.2 % were the most predominant sources (Fig. 7b). It is noteworthy that anthropogenic SOA, the sum of ASOA-1, ASOA-2, and OCOA, accounted for 73.9 ± 21.3 % of PM1-OM. Except for OCOA, the enhancement of anthropogenic SOA in Case I was likely due to transboundary transport, given the increased concentrations of CO. Similarly, ASOA-2 and OHDCA-like SOA were also the leading sources in Case II with coastal air, contributing 48.3 ± 6.8 % and 30.9 ± 2.4 % to PM1-OM, respectively. Although the mass concentration of PM1-OM attributed to OCOA in Case I (0.67 µg m−3) and Case II (0.73 µg m−3) was higher than in marine air (0.47 µg m−3), the percentage contributions were much lower (6.5 % and 9.3 % in Case I and Case II, respectively). Overall, the SOA contributions increased significantly with the rise in PM1-OM concentration (Fig. S11 in the Supplement), consistent with the findings at a suburban site that PM2.5 pollution events witnessed a notable rise in SOA marker levels (Wang et al., 2022). However, it is noteworthy that PCOA made many fewer and even negligible contributions to the PM1-OM in the two cases. The reasons might be the same as those for the deficiency of PCOA markers in the non-marine air, as discussed in Sect. 3.1.
Lastly, the diurnal variations in source contributions were also evident (Fig. 7c). PCOA was responsible for up to 44.2 ± 7.8 % of PM1-OM during 18:00–20:00 LT. Almost at the same time, biomass burning also contributed 2.4 ± 1.9 % to PM1-OM, although it was on average a small source. Therefore, short-term exposure to emissions of these sources might be a concern, especially due to the fact that the highest levels of PAHs were related to biomass burning as discussed above. The total percentage contribution of SOA was relatively high and stable between 00:00 and 16:00 LT and decreased in the early evening as the cooking and biomass burning emissions intensified. The special diurnal pattern of total SOA contribution was a result of superposition of five SOA factors with different diurnal patterns, as shown in Fig. S12 in the Supplement. It is worth mentioning that the contribution of anthropogenic SOA could reach 54.3 ± 20.2 % in the early afternoon (12:00–14:00 LT).
As a ubiquitous component of atmospheric fine PM, OA has been extensively studied. Nevertheless, it is still a major obstacle to further improving PM air quality in many places around the world and also a meeting point in the control of an air pollution complex, such as PM2.5 and O3 in photochemical smog.
Taking advantage of an emerging technique for the in situ measurement of OA molecular markers, we reported by far the highest-resolution temporal variations in dozens of OA markers in a summer month in urban HK. The time-resolved data allowed for discussing the effects of transboundary transport and weather patterns (e.g., troughs) on primary and secondary OA markers. DHOPA, phthalic acid, and isoprene SOA markers were more enriched in the short-duration case with continental air, probably due to more abundant precursors and a higher atmospheric oxidation capacity. The high RH brought on by troughs might have facilitated the formation of some OA species, such as OHDCA, phthalic acid, and 2-MTs. Furthermore, the diurnal variations in OA markers indicated emission patterns and SOA evolutions, such as the most intense cooking emissions in early evening and the subsequent OCOA formation. Regarding the sources of PM1-OM, we uncovered the dominance of cooking and vehicle emissions in the case of marine air without troughs, which was the cleanest case. Even as a whole, primary cooking emissions explained ∼ 44 % of the PM1-OM in the early evening of this summer month. Anthropogenic SOA and OHDCA-like SOA were the main sources of PM1-OM in the two cases with the intrusion of continental and coastal air. The SOA contributions, mainly from anthropogenic components, substantially increased when the PM air quality deteriorated. The findings demonstrated the need to properly manage local cooking and vehicle emissions and to control aromatics-derived SOA with concerted efforts on a regional or even superregional scale.
While this study provides valuable insights, we acknowledge there are several limitations. First, the molecular markers were not quantified, making it impossible to compare with the measurements elsewhere or compare them among the detected species for absolute concentrations. It also hinders the reuse of the data by other studies, such as concentration-based health risk assessments for some species. Second, some SOA markers, such as those derived from monoterpenes and sesquiterpenes, were not fully characterized. This increased the uncertainty in OA source apportionment to some extent. Third, we reiterated the unexpected diurnal patterns of 2-MTs, but the analysis of the underlying reasons is speculative. Therefore, future work will be dedicated to improving the analytical performance of TAG and exploring complex mechanisms responsible for unique features of SOA markers, including 2-MTs.
All raw data are available upon request from the corresponding author, Xiaopu Lyu.
The supplement related to this article is available online at: https://doi.org/10.5194/acp-24-7085-2024-supplement.
HLi performed the study and drafted the manuscript. XL designed the study, oversaw interpretation of the results, and revised the manuscript. YH, DY, and HLu assisted in the field campaign and processed relevant data. LX and HG led the project and revised the manuscript.
The contact author has declared that none of the authors has any competing interests.
Publisher's note: Copernicus Publications remains neutral with regard to jurisdictional claims made in the text, published maps, institutional affiliations, or any other geographical representation in this paper. While Copernicus Publications makes every effort to include appropriate place names, the final responsibility lies with the authors.
This study was supported by the Hong Kong Research Grants Council (RGC) via the National Natural Science Foundation of China–RGC joint research scheme (grant no. N_PolyU530/20), the National Natural Science Foundation of China (grant no. 42061160478), and the General Research Fund (grant nos. HKBU 15219621, HKBU 15209223).
This research has been supported by the Research Grants Council, the University Grants Committee (grant nos. N_PolyU530/20, HKBU 15219621, HKBU 15209223), the National Natural Science Foundation of China (grant no. 42061160478), Hong Kong Baptist University (grant no. 162912), and the Research Institute for Land and Space of the Hong Kong Polytechnic University (grant no. 1-CD7G).
This paper was edited by Dara Salcedo and reviewed by Omar Amador-Munoz and two anonymous referees.
Bunce, N. J., Liu, L., Zhu, J., and Lane, D. A.: Reaction of naphthalene and its derivatives with hydroxyl radicals in the gas phase, Environ. Sci. Technol., 31, 2252–2259, https://doi.org/10.1021/es960813g, 1997.
Cheng, Y., Ma, Y., and Hu, D.: Tracer-based source apportioning of atmospheric organic carbon and the influence of anthropogenic emissions on secondary organic aerosol formation in Hong Kong, Atmos. Chem. Phys., 21, 10589–10608, https://doi.org/10.5194/acp-21-10589-2021, 2021.
Chow, K. S., Huang, X. H. H., and Yu, J. Z.: Quantification of nitroaromatic compounds in atmospheric fine particulate matter in Hong Kong over 3 years: field measurement evidence for secondary formation derived from biomass burning emissions, Environ. Chem., 13, 665, https://doi.org/10.1071/EN15174, 2015.
Chow, W. S., Huang, X. H. H., Leung, K. F., Huang, L., Wu, X., and Yu, J. Z.: Molecular and elemental marker-based source apportionment of fine particulate matter at six sites in Hong Kong, China, Sci. Total Environ., 813, 152652, https://doi.org/10.1016/j.scitotenv.2021.152652, 2022.
Claeys, M., Graham, B., Vas, G., Wang, W., Vermeylen, R., Pashynska, V., Cafmeyer, J., Guyon, P., Andreae, M. O., Artaxo, P., and Maenhaut, W.: Formation of secondary organic aerosols through photooxidation of isoprene, Science, 303, 1173–1176, https://doi.org/10.1126/science.1092805, 2004.
Dai, Q., Liu, B., Bi, X., Wu, J., Liang, D., Zhang, Y., Feng, Y., and Hopke, P. K.: Dispersion normalized PMF provides insights into the significant changes in source contributions to PM2.5 after the COVID-19 outbreak, Environ. Sci. Technol., 54, 9917–9927, https://doi.org/10.1021/acs.est.0c02776, 2020.
Ding, X., Wang, X. M., Gao, B., Fu, X. X., He, Q. F., Zhao, X. Y., Yu, J. Z., and Zheng, M.: Tracer-based estimation of secondary organic carbon in the Pearl River Delta, south China, J. Geophys. Res.-Atmos., 117, 1–14, https://doi.org/10.1029/2011JD016596, 2012.
Edney, E. O., Kleindienst, T. E., Jaoui, M., Lewandowski, M., Offenberg, J. H., Wang, W., and Claeys, M.: Formation of 2-methyl tetrols and 2-methylglyceric acid in secondary organic aerosol from laboratory irradiated isoprene/NOX/SO2/air mixtures and their detection in ambient PM2.5 samples collected in the eastern United States, Atmos. Environ., 39, 5281–5289, https://doi.org/10.1016/j.atmosenv.2005.05.031, 2005.
Fabbri, D., Torri, C., Simoneit, B. R., Marynowski, L., Rushdi, A. I., Fabianska, M. J.: Levoglucosan and other cellulose and lignin markers in emissions from burning of Miocene lignites, Atmos. Environ., 43, 2286−2295, https://doi.org/10.1016/j.atmosenv.2009.01.030, 2009.
Fu, P., Aggarwal, S. G., Chen, J., Li, J., Sun, Y., Wang, Z., Chen, H., Liao, H., Ding, A., and Umarji, G. S.: Molecular markers of secondary organic aerosol in Mumbai, India, Environ. Sci. Technol., 50, 4659–4667, https://doi.org/10.1021/acs.est.6b00372, 2016.
Guo, H., Lee, S. C., Ho, K. F., Wang, X. M., and Zou, S. C.: Particle-associated polycyclic aromatic hydrocarbons in urban air of Hong Kong, Atmos. Environ., 37, 5307–5317, https://doi.org/10.1016/j.atmosenv.2003.09.011, 2003.
Guo, H., Ling, Z. H., Cheung, K., Jiang, F., Wang, D. W., Simpson, I. J., Barletta, B., Meinardi, S., Wang, T. J., Wang, X. M., and Saunders, S. M.: Characterization of photochemical pollution at different elevations in mountainous areas in Hong Kong, Atmos. Chem. Phys., 13, 3881–3898, https://doi.org/10.5194/acp-13-3881-2013, 2013.
Ho, K. F., Lee, S. C., Cao, J. J., Kawamura, K., Watanabe, T., Cheng, Y., and Chow, J. C.: Dicarboxylic acids, ketocarboxylic acids and dicarbonyls in the urban roadside area of Hong Kong, Atmos. Environ., 40, 3030–3040, https://doi.org/10.1016/j.atmosenv.2005.11.069, 2006.
Ho, K. F., Engling, G., Ho, S. S. H., Huang, R. J., Lai, S. C., Cao, J. J., and Lee, S. C.: Seasonal variations of anhydrosugars in PM2.5 in the Pearl River Delta Region, China, Tellus B, 66, 22577, https://doi.org/10.3402/tellusb.v66.22577, 2014.
Hu, D. and Yu, J. Z.: Secondary organic aerosol tracers and malic acid in Hong Kong: Seasonal trends and origins, Environ. Chem., 10, 381–394, https://doi.org/10.1071/EN13104, 2013.
Hu, D., Bian, Q., Lau, A. K. H., and Yu, J. Z.: Source apportioning of primary and secondary organic carbon in summer PM2.5 in Hong Kong using positive matrix factorization of secondary and primary organic tracer data, J. Geophys. Res.-Atmos., 115, D16204, https://doi.org/10.1029/2009JD012498, 2010.
Huang, D. D., Zhu, S., An, J., Wang, Q., Qiao, L., Zhou, M., He, X., Ma, Y., Sun, Y., Huang, C., Yu, J. Z., and Zhang, Q.: Comparative assessment of cooking emission contributions to urban organic aerosol using online molecular tracers and Aerosol Mass Spectrometry measurements, Environ. Sci. Technol., 55, 14526–14535, https://doi.org/10.1021/acs.est.1c03280, 2021.
Huang, R. J., Zhang, Y., Bozzetti, C., Ho, K. F., Cao, J. J., Han, Y., Daellenbach, K. R., Slowik, J. G., Platt, S. M., and Canonaco, F.: High secondary aerosol contribution to particulate pollution during haze events in China, Nature, 514, 218–222, https://doi.org/10.1038/nature13774, 2014a.
Huang, X. H. H., Bian, Q. J., Louie, P. K. K., and Yu, J. Z.: Contributions of vehicular carbonaceous aerosols to PM2.5 in a roadside environment in Hong Kong, Atmos. Chem. Phys., 14, 9279–9293, https://doi.org/10.5194/acp-14-9279-2014, 2014b.
Huo, Y. X., Guo, H., Lyu, X. P., and Yao, D. W.: Emission characteristics, sources, and airborne fate of speciated organics in particulate matters in a Hong Kong residence, Indoor Air, 32, 13017, https://doi.org/10.1111/ina.13017, 2022.
Huo, Y., Lyu, X., Yao, D., Zhou, B., Yuan, Q., Lee, S. C., and Guo, H.: Exploring the formation of high levels of hydroxyl dicarboxylic acids at an urban background site in South China, J. Geophys. Res.-Atmos., 129, p.e2023JD040096, https://doi.org/10.1029/2023JD040096, 2024.
Huang, D. D., Zhu, S., An, J., Wang, Q., Qiao, L., Zhou, M., He, X., Ma, Y., Sun, Y., Huang, C., Yu, J. Z., and Zhang, Q.: Comparative assessment of cooking emission contributions to urban organic aerosol using online molecular tracers and Aerosol Mass Spectrometry measurements, Environ. Sci. Technol., 55, 14526–14535, https://doi.org/10.1021/acs.est.1c03280, 2021.
Jang, M. and McDow, S. R.: Products of benz[a]anthracene photodegradation in the presence of known organic constituents of atmospheric aerosols, Environ. Sci. Technol., 31, 1046–1053, https://doi.org/10.1021/es960559s, 1997.
Jimenez, J. L., Canagaratna, M. R., Donahue, N. M., Prevot, A. S., Zhang, Q., Kroll, J. H., DeCarlo, P. F., Allan, J. D., Coe, H., and Ng, N. L.: Evolution of organic aerosols in the atmosphere, Science, 326, 1525−1529, https://doi.org/10.1126/science.1180353, 2009.
Kanakidou, M., Seinfeld, J. H., Pandis, S. N., Barnes, I., Dentener, F. J., Facchini, M. C., Van Dingenen, R., Ervens, B., Nenes, A., Nielsen, C. J., Swietlicki, E., Putaud, J. P., Balkanski, Y., Fuzzi, S., Horth, J., Moortgat, G. K., Winterhalter, R., Myhre, C. E. L., Tsigaridis, K., Vignati, E., Stephanou, E. G., and Wilson, J.: Organic aerosol and global climate modelling: a review, Atmos. Chem. Phys., 5, 1053–1123, https://doi.org/10.5194/acp-5-1053-2005, 2005.
Kang, M. J., Fu, P. Q., Aggarwal, S. G., Kumar, S., Zhao, Y., Sun, Y. L., and Wang, Z. F.: Size distributions of n-alkanes, fatty acids and fatty alcohols in springtime aerosols from New Delhi, India, Environ. Pollut., 219, 957–966, https://doi.org/10.1016/j.envpol.2016.09.077, 2016a.
Kawamura, K., Ishimura, Y., and Yamazaki, K.: Four years' observations of terrestrial lipid class compounds in marine aerosols from the western North Pacific, Global Biogeochem. Cy., 17, 1–19, https://doi.org/10.1029/2001GB001810, 2003.
Kleindienst, T. E., Conver, T. S., McIver, C. D., and Edney, E. O.: Determination of secondary organic aerosol products from the photooxidation of toluene and their implications in ambient PM2.5, J. Atmos. Chem., 47, 79–100, https://doi.org/10.1023/B:JOCH.0000012305.94498.28, 2004.
Lee, B. P., Li, Y. J., Yu, J. Z., Louie, P. K., and Chan, C. K.: Characteristics of submicron particulate matter at the urban roadside in downtown Hong Kong – Overview of 4 months of continuous high-resolution aerosol mass spectrometer measurements, J. Geophys. Res.-Atmos., 120, 7040−7058, https://doi.org/10.1002/2015JD023311, 2015.
Lee, S. C., Cheng, Y., Ho, K. F., Cao, J. J., Louie, P. K. K., Chow, J. C., and Watson, J. G.: PM1.0 and PM2.5 characteristics in the roadside environment of Hong Kong, Aerosol Sci. Technol., 40, 157–165, https://doi.org/10.1080/02786820500494544, 2006.
Lelieveld, J., Barlas, C., Giannadaki, D., and Pozzer, A.: Model calculated global, regional and megacity premature mortality due to air pollution, Atmos. Chem. Phys., 13, 7023–7037, https://doi.org/10.5194/acp-13-7023-2013, 2013.
Li, R., Wang, Q., He, X., Zhu, S., Zhang, K., Duan, Y., Fu, Q., Qiao, L., Wang, Y., Huang, L., Li, L., and Yu, J. Z.: Source apportionment of PM2.5 in Shanghai based on hourly organic molecular markers and other source tracers, Atmos. Chem. Phys., 20, 12047–12061, https://doi.org/10.5194/acp-20-12047-2020, 2020.
Li, Y. J., Lee, B. Y. L., Yu, J. Z., Ng, N. L., and Chan, C. K.: Evaluating the degree of oxygenation of organic aerosol during foggy and hazy days in Hong Kong using high-resolution time-of-flight aerosol mass spectrometry (HR-ToF-AMS), Atmos. Chem. Phys., 13, 8739–8753, https://doi.org/10.5194/acp-13-8739-2013, 2013.
Liao, K. Z. and Yu, J. Z.: Abundance and sources of benzo[a]pyrene and other PAHs in ambient air in Hong Kong: A review of 20-year measurements (1997–2016), Chemosphere, 259, 127518. https://doi.org/10.1016/j.chemosphere.2020.127518, 2020.
Liu, T., Zhou, L., Liu, Q., Lee, B. P., Yao, D., Lu, H., Lyu, X., Guo, H., and Chan, C. K.: Secondary organic aerosol formation from urban roadside air in Hong Kong, Environ. Sci. Technol., 53, 3001–3009, https://doi.org/10.1021/acs.est.8b06587, 2019.
Lyu, X. P., Guo, H., Cheng, H. R., Wang, X. M., Ding, X., Lu, H. X., Yao, D. W., and Xu, C.: Observation of SOA tracers at a mountainous site in Hong Kong: Chemical characteristics, origins and implication on particle growth, Sci. Total Environ., 605, 180–189, https://doi.org/10.1016/j.scitotenv.2017.06.161, 2017.
Lyu, X. P., Guo, H., Yao, D. W., Lu, H. X., Huo, Y. X., Xu, W., Kreisberg, N., Goldstein, A. H., Jayne, J., Worsnop, D., Tan, Y., Lee, S. C., and Wang, T.: In situ measurements of molecular markers facilitate understanding of dynamic sources of atmospheric organic aerosols, Environ. Sci. Technol., 54, 11058–11069, https://doi.org/10.1021/acs.est.0c02277, 2020.
Lyu, X. P., Huo, Y. X., Yang, J., Yao, D. W., Li, K. M., Lu, H. X., Zeren, Y., and Guo, H.: Real-time molecular characterization of air pollutants in a Hong Kong residence: Implication of indoor source emissions and heterogeneous chemistry, Indoor Air, 31, 1340–1352, https://doi.org/10.1111/ina.12826, 2021.
Nozière, B., González, N. J. D., Borg-Karlson, A.-K., Pei, Y., Redeby, J. P., Krejci, R., Dommen, J., Prevot, A. S. H., and Anthonsen, T.: Atmospheric chemistry in stereo: A new look at secondary organic aerosols from isoprene, Geophys. Res. Lett., 38, L11807, https://doi.org/10.1029/2011GL047323, 2011.
Pöschl, U.: Atmospheric aerosols: composition, transformation, climate and health effects, Angew. Chem. Int. Ed., 44, 7520–7540, https://doi.org/10.1002/anie.200501122, 2005.
Ramanathan, V., Crutzen, P. J., Kiehl, J. T., and Rosenfeld, D.: Aerosols, climate, and the hydrological cycle, Science, 294, 2119–2124, https://doi.org/10.1126/science.1064034, 2001.
Ren, H. X., Xue, M., An, Z. J., and Jiang, J. K.: Improving thermal desorption aerosol gas chromatography using a dual-trap design, J. Chromatogr. A, 1599, 247–252, https://doi.org/10.1016/j.chroma.2019.04.045, 2019.
Sang, X. F., Chan, C. Y., Engling, G., Chan, L. Y., Wang, X. M., Zhang, Y. N., Shi, S., Zhang, Z. S., Zhang, T., and Hu, M.: Levoglucosan enhancement in ambient aerosol during springtime transport events of biomass burning smoke to Southeast China, Tellus B, 63, 129–139, https://doi.org/10.1111/j.1600-0889.2010.00515.x, 2011.
Shen, R.-Q., Ding, X., He, Q.-F., Cong, Z.-Y., Yu, Q.-Q., and Wang, X.-M.: Seasonal variation of secondary organic aerosol tracers in Central Tibetan Plateau, Atmos. Chem. Phys., 15, 8781–8793, https://doi.org/10.5194/acp-15-8781-2015, 2015.
Simoneit, B. R. T., Kobayashi, M., Mochida, M., Kawamura, K., and Huebert, B. J.: Aerosol particles collected on aircraft flights over the northwestern Pacific region during the ACE-Asia campaign: composition and major sources of the organic compounds, J. Geophys. Res., 109, D19S09, https://doi.org/10.1029/2004JD004565, 2004.
Song, K., Tang, R., Li, A., Wan, Z., Zhang, Y., Gong, Y., Lv, D., Lu, S., Tan, Y., Yan, S., and Yan, S.: Particulate organic emissions from incense-burning smoke: chemical compositions and emission characteristics, Sci. Total Environ., 897, 165319, https://doi.org/10.1016/j.scitotenv.2023.165319, 2023.
Sun, C., Lee, B. P., Huang, D., Jie Li, Y., Schurman, M. I., Louie, P. K. K., Luk, C., and Chan, C. K.: Continuous measurements at the urban roadside in an Asian megacity by Aerosol Chemical Speciation Monitor (ACSM): particulate matter characteristics during fall and winter seasons in Hong Kong, Atmos. Chem. Phys., 16, 1713–1728, https://doi.org/10.5194/acp-16-1713-2016, 2016.
Sun, Y., Xu, W., Zhang, Q., Jiang, Q., Canonaco, F., Prévôt, A. S. H., Fu, P., Li, J., Jayne, J., Worsnop, D. R., and Wang, Z.: Source apportionment of organic aerosol from 2-year highly time-resolved measurements by an aerosol chemical speciation monitor in Beijing, China, Atmos. Chem. Phys., 18, 8469–8489, https://doi.org/10.5194/acp-18-8469-2018, 2018.
Sun, Y.-L., Zhang, Q., Schwab, J. J., Demerjian, K. L., Chen, W.-N., Bae, M.-S., Hung, H.-M., Hogrefe, O., Frank, B., Rattigan, O. V., and Lin, Y.-C.: Characterization of the sources and processes of organic and inorganic aerosols in New York city with a high-resolution time-of-flight aerosol mass apectrometer, Atmos. Chem. Phys., 11, 1581–1602, https://doi.org/10.5194/acp-11-1581-2011, 2011.
Surratt, J. D., Chan, A. W. H., Eddingsaas, N. C., Chan, M. N., Loza, C. L., Kwan, A. J., Hersey, S. P., Flagan, R. C., Wennberg, P. O., and Seinfeld, J. H.: Reactive intermediates revealed in secondary organic aerosol formation from isoprene, P. Natl. Acad. Sci. USA, 107, 6640–6645, https://doi.org/10.1073/pnas.0911114107, 2010.
To, W. M., Yeung, L. L., and Chao, C. Y. H.: Characterisation of gas phase organic emissions from hot cooking oil in commercial kitchens, Indoor Built Environ., 9, 228–232, https://doi.org/10.1159/000057511, 2000.
Wang, Q., Wang, S., Cheng, Y. Y., Chen, H., Zhang, Z., Li, J., Gu, D., Wang, Z., and Yu, J. Z.: Chemical evolution of secondary organic aerosol tracers during high-PM2.5 episodes at a suburban site in Hong Kong over 4 months of continuous measurement, Atmos. Chem. Phys., 22, 11239–11253, https://doi.org/10.5194/acp-22-11239-2022, 2022.
Wang, Q. Q., Qiao, L. P., Zhou, M., Zhu, S. H., Griffith, S., Li, L., and Yu, J. Z.: Source apportionment of PM2.5 using hourly measurements of elemental tracers and major constituents in an urban environment: investigation of time-resolution influence, J. Geophys. Res.-Atmos., 123, 5284–5300, https://doi.org/10.1029/2017JD027877, 2018.
Wang, Q. Q., He, X., Zhou, M., Huang, D. D., Qiao, L. P., Zhu, S. H., Ma, Y. G., Wang, H. L., Li, L., Huang, C., Huang, X. H. H., Xu, W., Worsnop, D., Goldstein, A. H., Guo, H., and Yu, J. Z.: Hourly measurements of organic molecular markers in urban shanghai, china: primary organic aerosol source identification and observation of cooking aerosol aging, ACS Earth Space Chem., 4, 1670–1685, https://doi.org/10.1021/acsearthspacechem.0c00205, 2020.
Williams, B. J., Goldstein, A. H., Kreisberg, N. M., and Hering, S. V.: An in-situ instrument for speciated organic composition of atmospheric aerosols: Thermal desorption aerosol GC/MS-FID (TAG), Aerosol Sci. Tech., 40, 627–638, https://doi.org/10.1080/02786820600754631, 2006.
Williams, B. J., Goldstein, A. H., Kreisberg, N. M., and Hering, S. V.: In situ measurements of gas/particle-phase transitions for atmospheric semivolatile organic compounds, P. Natl. Acad. Sci. USA, 107, 6676–6681, https://doi.org/10.1073/pnas.0911858107, 2010.
Xing, L., Fu, T. M., Liu, T. Y., Qin, Y. M., Zhou, L. Y., Chan, C. K., Guo, H., Yao, D. W., and Duan, K. Q.: Estimating organic aerosol emissions from cooking in winter over the Pearl River Delta region, China, Environ. Pollut., 292, 118266, https://doi.org/10.1016/j.envpol.2021.118266, 2022.
Yang, Y., Tang, R., Qiu, H., Lai, P. C., Wong, P., Thach, T. Q., Allen, R., Brauer, M., Tian, L. W., and Barratt, B.: Long term exposure to air pollution and mortality in an elderly cohort in Hong Kong, Environ. Int., 117, 99–106, https://doi.org/10.1016/j.envint.2018.04.034, 2018.
Yao, D. W., Lyu, X. P., Lu, H. X., Zeng, L. W., Liu, T. Y., Chan, C. K., and Guo H.: Characteristics, sources and evolution processes of atmospheric organic aerosols at a roadside site in Hong Kong, Atmos. Environ., 252, 118298, https://doi.org/10.1016/j.atmosenv.2021.118298, 2021.
Yao, D. W., Guo, H., Lyu, X. P., Lu, H. X., and Huo, Y. X.: Secondary organic aerosol formation at an urban background site on the coastline of South China: Precursors and aging processes, Environ. Pollut., 309, 119778, https://doi.org/10.1016/j.envpol.2022.119778, 2022.
Yao, X. H., Fang, M., Chan, C. K., Ho, K. F., and Lee, S. C.: Characterization of dicarboxylic acids in PM2.5 in Hong Kong, Atmos. Environ., 38, 963–970, https://doi.org/10.1016/j.atmosenv.2003.10.048, 2004.
Yu, J. Z., Huang, X. H., Ho, S. S., and Bian, Q.: Nonpolar organic compounds in fine particles: quantification by thermal desorption-GC/MS and evidence for their significant oxidation in ambient aerosols in Hong Kong, Anal. Bioanal. Chem., 401, 3125–3139, https://doi.org/10.1007/s00216-011-5458-5, 2011.
Zeng, J., Yu, Z., Mekic, M., Liu, J., Li, S., Loisel, G., Gao, W., Gandolfo, A., Zhou, Z., Wang, X., Herrmann, H., Gligorovski, S., and Li, X.: Evolution of indoor cooking emissions captured by using secondary electrospray ionization high-resolution mass spectrometry, Environ. Sci. Techn. Let., 7, 76–81, https://doi.org/10.1021/acs.estlett.0c00044, 2020.
Zhang, Q., Zheng, Y., Tong, D., Shao, M., Wang, S., Zhang, Y., Xu, X., Wang, J., He, H., and Liu, W.: Drivers of improved PM2.5 air quality in China from 2013 to 2017, P. Natl. Acad. Sci. USA, 116, 24463−24469, https://doi.org/10.1073/pnas.1907956116, 2019.
Zhang, Y. N., Zhang, Z. S., Chan, C. Y., Engling, G., Sang, X. F., Shi, S., and Wang, X. M.: Levoglucosan and carbonaceous species in the background aerosol of coastal southeast China: case study on transport of biomass burning smoke from the Philippines, Environ. Sci. Pollut. R., 19, 244–255, https://doi.org/10.1007/s11356-011-0548-7, 2012.