the Creative Commons Attribution 4.0 License.
the Creative Commons Attribution 4.0 License.
 | 14 Jun 2024
Probing Iceland's dust-emitting sediments: particle size distribution, mineralogy, cohesion, Fe mode of occurrence, and reflectance spectra signatures
Cristina González-Flórez
Agnesh Panta
Jesús Yus-Díez
Patricia Córdoba
Andres Alastuey
Natalia Moreno
Konrad Kandler
Martina Klose
Roger N. Clark
Bethany L. Ehlmann
Rebecca N. Greenberger
Abigail M. Keebler
Phil Brodrick
Robert O. Green
Xavier Querol
Carlos Pérez García-Pando
Characterising the physico-chemical properties of dust-emitting sediments in arid regions is fundamental to understanding the effects of dust on climate and ecosystems. However, knowledge regarding high-latitude dust (HLD) remains limited. This study focuses on analysing the particle size distribution (PSD), mineralogy, cohesion, iron (Fe) mode of occurrence, and visible–near infrared (VNIR) reflectance spectra of dust-emitting sediments from dust hotspots in Iceland (HLD region). Extensive analysis was conducted on samples of top sediments, sediments, and aeolian ripples collected from seven dust sources, with particular emphasis on the Jökulsá basin, encompassing the desert of Dyngjunsandur. Both fully and minimally dispersed PSDs and their respective mass median particle diameters revealed remarkable similarities (56 ± 69 and 55 ± 62 µm, respectively). Mineralogical analyses indicated the prevalence of amorphous phases (68 ± 26 %), feldspars (17 ± 13 %), and pyroxenes (9.3 ± 7.2 %), consistent with thorough analyses of VNIR reflectance spectra. The Fe content reached 9.5 ± 0.40 wt %, predominantly within silicate structures (80 ± 6.3 %), complemented by magnetite (16 ± 5.5 %), hematite/goethite (4.5 ± 2.7 %), and readily exchangeable Fe ions or Fe nano-oxides (1.6 ± 0.63 %). Icelandic top sediments exhibited coarser PSDs compared to the high dust-emitting crusts from mid-latitude arid regions, distinctive mineralogy, and a 3-fold bulk Fe content, with a significant presence of magnetite. The congruence between fully and minimally dispersed PSDs underscores reduced particle aggregation and cohesion of Icelandic top sediments, suggesting that aerodynamic entrainment of dust could also play a role upon emission in this region, alongside saltation bombardment. The extensive analysis in Dyngjusandur enabled the development of a conceptual model to encapsulate Iceland's rapidly evolving high dust-emitting environments.
- Article
(13426 KB) - Full-text XML
- Companion paper
-
Supplement
(642 KB) - BibTeX
- EndNote


Dust particles created by wind erosion of arid surfaces can traverse considerable distances, spanning continents and oceans, influencing the Earth's climate (Kok et al., 2023). The impact of dust on climate and the environment strongly depends upon its particle size distribution (PSD), composition, and shape, which to a large extent are determined by the properties of the parent source of sediments (Perlwitz et al., 2015a; Gonçalves Ageitos et al., 2023). While most of the dust is produced in hot, arid, subtropical sources like the Sahara (Kok et al., 2021), and most studies have concentrated on these regions, dust produced in cold high-latitude environments, defined as dust emitted from latitudes ≥ 50° N and ≥ 40° S, receives increasing attention due to its regional and potentially global significance and sensitivity to global warming (Bullard et al., 2016; Meinander et al., 2022). High-latitude dust (HLD) is emitted from regions such as Iceland, Greenland, Svalbard, Alaska, Canada, Antarctica, New Zealand, and Patagonia. Its physical, chemical, and optical properties can differ strongly from those of crustal dust produced in lower-latitude sources and affect, for example, atmospheric (Johnson et al., 2010), marine (Jickells et al., 2005), and cryospheric (Oerlemans et al., 2009) processes.
Numerous geological processes, especially glacial and periglacial ones, and volcanic activity, occurring in high-latitude regions, promote the emission of contemporary dust (Bullard, 2013; Bullard et al., 2016). Initially, large volumes of volcanic fine volcanic ash are deposited and trapped by glacier ice over geological epochs, later released as sediment into glacial rivers upon glacier retreat. Moreover, the physical weathering of rocks by glaciers produces a vast amount of silt and sand, transported from beneath glacial margins by glacial rivers (Palacios et al., 2021). Additionally, during dust events, fine dust is deposited and trapped within glacier ice, re-emerging as sediment during melting. Eventually, these glacial rivers discharge from the glacier, forming floodplains where the silt and sand accumulate, facilitating dust emission to the atmosphere by strong winds. Such regions are common in Iceland and include Dyngjusandur, Skeiðarársandur, Mælifellssandur, and Mýrdalssandur (Arnalds et al., 2001). Glaciers like Vatnajökull, Iceland's and Europe's largest, additionally face significant ice loss due to climate change. Models suggest that warming rates of ≥ 2 °C per century could result in a 50 % reduction in ice cap volume and area within 200 years (Flowers et al., 2005), eventually increasing the amount of sediment released into glacial rivers. Besides warming, factors such as volcanic activity contribute to accelerated melting and frequent sediment-laden flooding events, followed by rapid drying and subsequent dust emissions.
As it could be expected melting is accelerated in summer and at midday (Carrivick and Tweed, 2019). Thus, with insolation the melting increases, and then the glacier fluvial discharges reach a maximum after midday, causing frequent flooding episodes during the afternoon. After the flooding the high permeability of these sediments favours a fast infiltration of the ponded waters, followed by a fast drying of the surfaces. During the next days, in the morning drying of the surfaces and convective and/or synoptic winds favours the emissions of dust.
In Iceland, active volcanoes erupt every 3–5 years, depositing thick layers of tephra ranging from millimetres to centimetres (Arnalds et al., 2016). This deposition process has the potential to lead to the formation of new dust sources when new basalt fields obstruct river flows and create ephemeral lakes. All these processes together make Iceland one of the most active dust hotspots in the world, with > 20 000 km2 of sandy deserts (≈ 20 % of Iceland) exposed to aggressive aeolian activity releasing millions of tonnes of dust to the atmosphere (Arnalds et al., 2016; Baldo et al., 2020). Icelandic dust is emitted, transported, and deposited over land, sea, and ice of the North Atlantic, covering areas in Iceland, north-western Europe, north-eastern America, and Greenland (Arnalds et al., 2014; Baldo et al., 2020). Icelandic dust can reduce surface albedo and either increase or decrease melting of glaciers and ice caps via deposition depending on the deposited layer thickness (Dragosics et al., 2016; Wittmann et al., 2017; Möller et al., 2016, 2018). Icelandic dust is also rich in iron (Fe) (e.g. Arnalds et al., 2014), which depending on its mode of occurrence can exert different climate and ecological effects. Fe-oxide minerals strongly absorb solar radiation (Formenti et al., 2014; Engelbrecht et al., 2016; Di Biagio et al., 2019; Zubko et al., 2019), potentially contributing to direct radiative effects in the Arctic (Kylling et al., 2018). The deposition of soluble Fe from Icelandic dust to the ocean can impact Fe biogeochemistry and primary productivity in the subpolar North Atlantic Ocean, which is seasonally Fe limited (Arnalds et al., 2014). Icelandic dust can also be a sporadically important source of ice-nucleating particles (INPs) at mid-latitudes to high latitudes (Sanchez-Marroquin et al., 2020; Shi et al., 2022), relevant to the cloud-phase climate feedback (Murray et al., 2021).
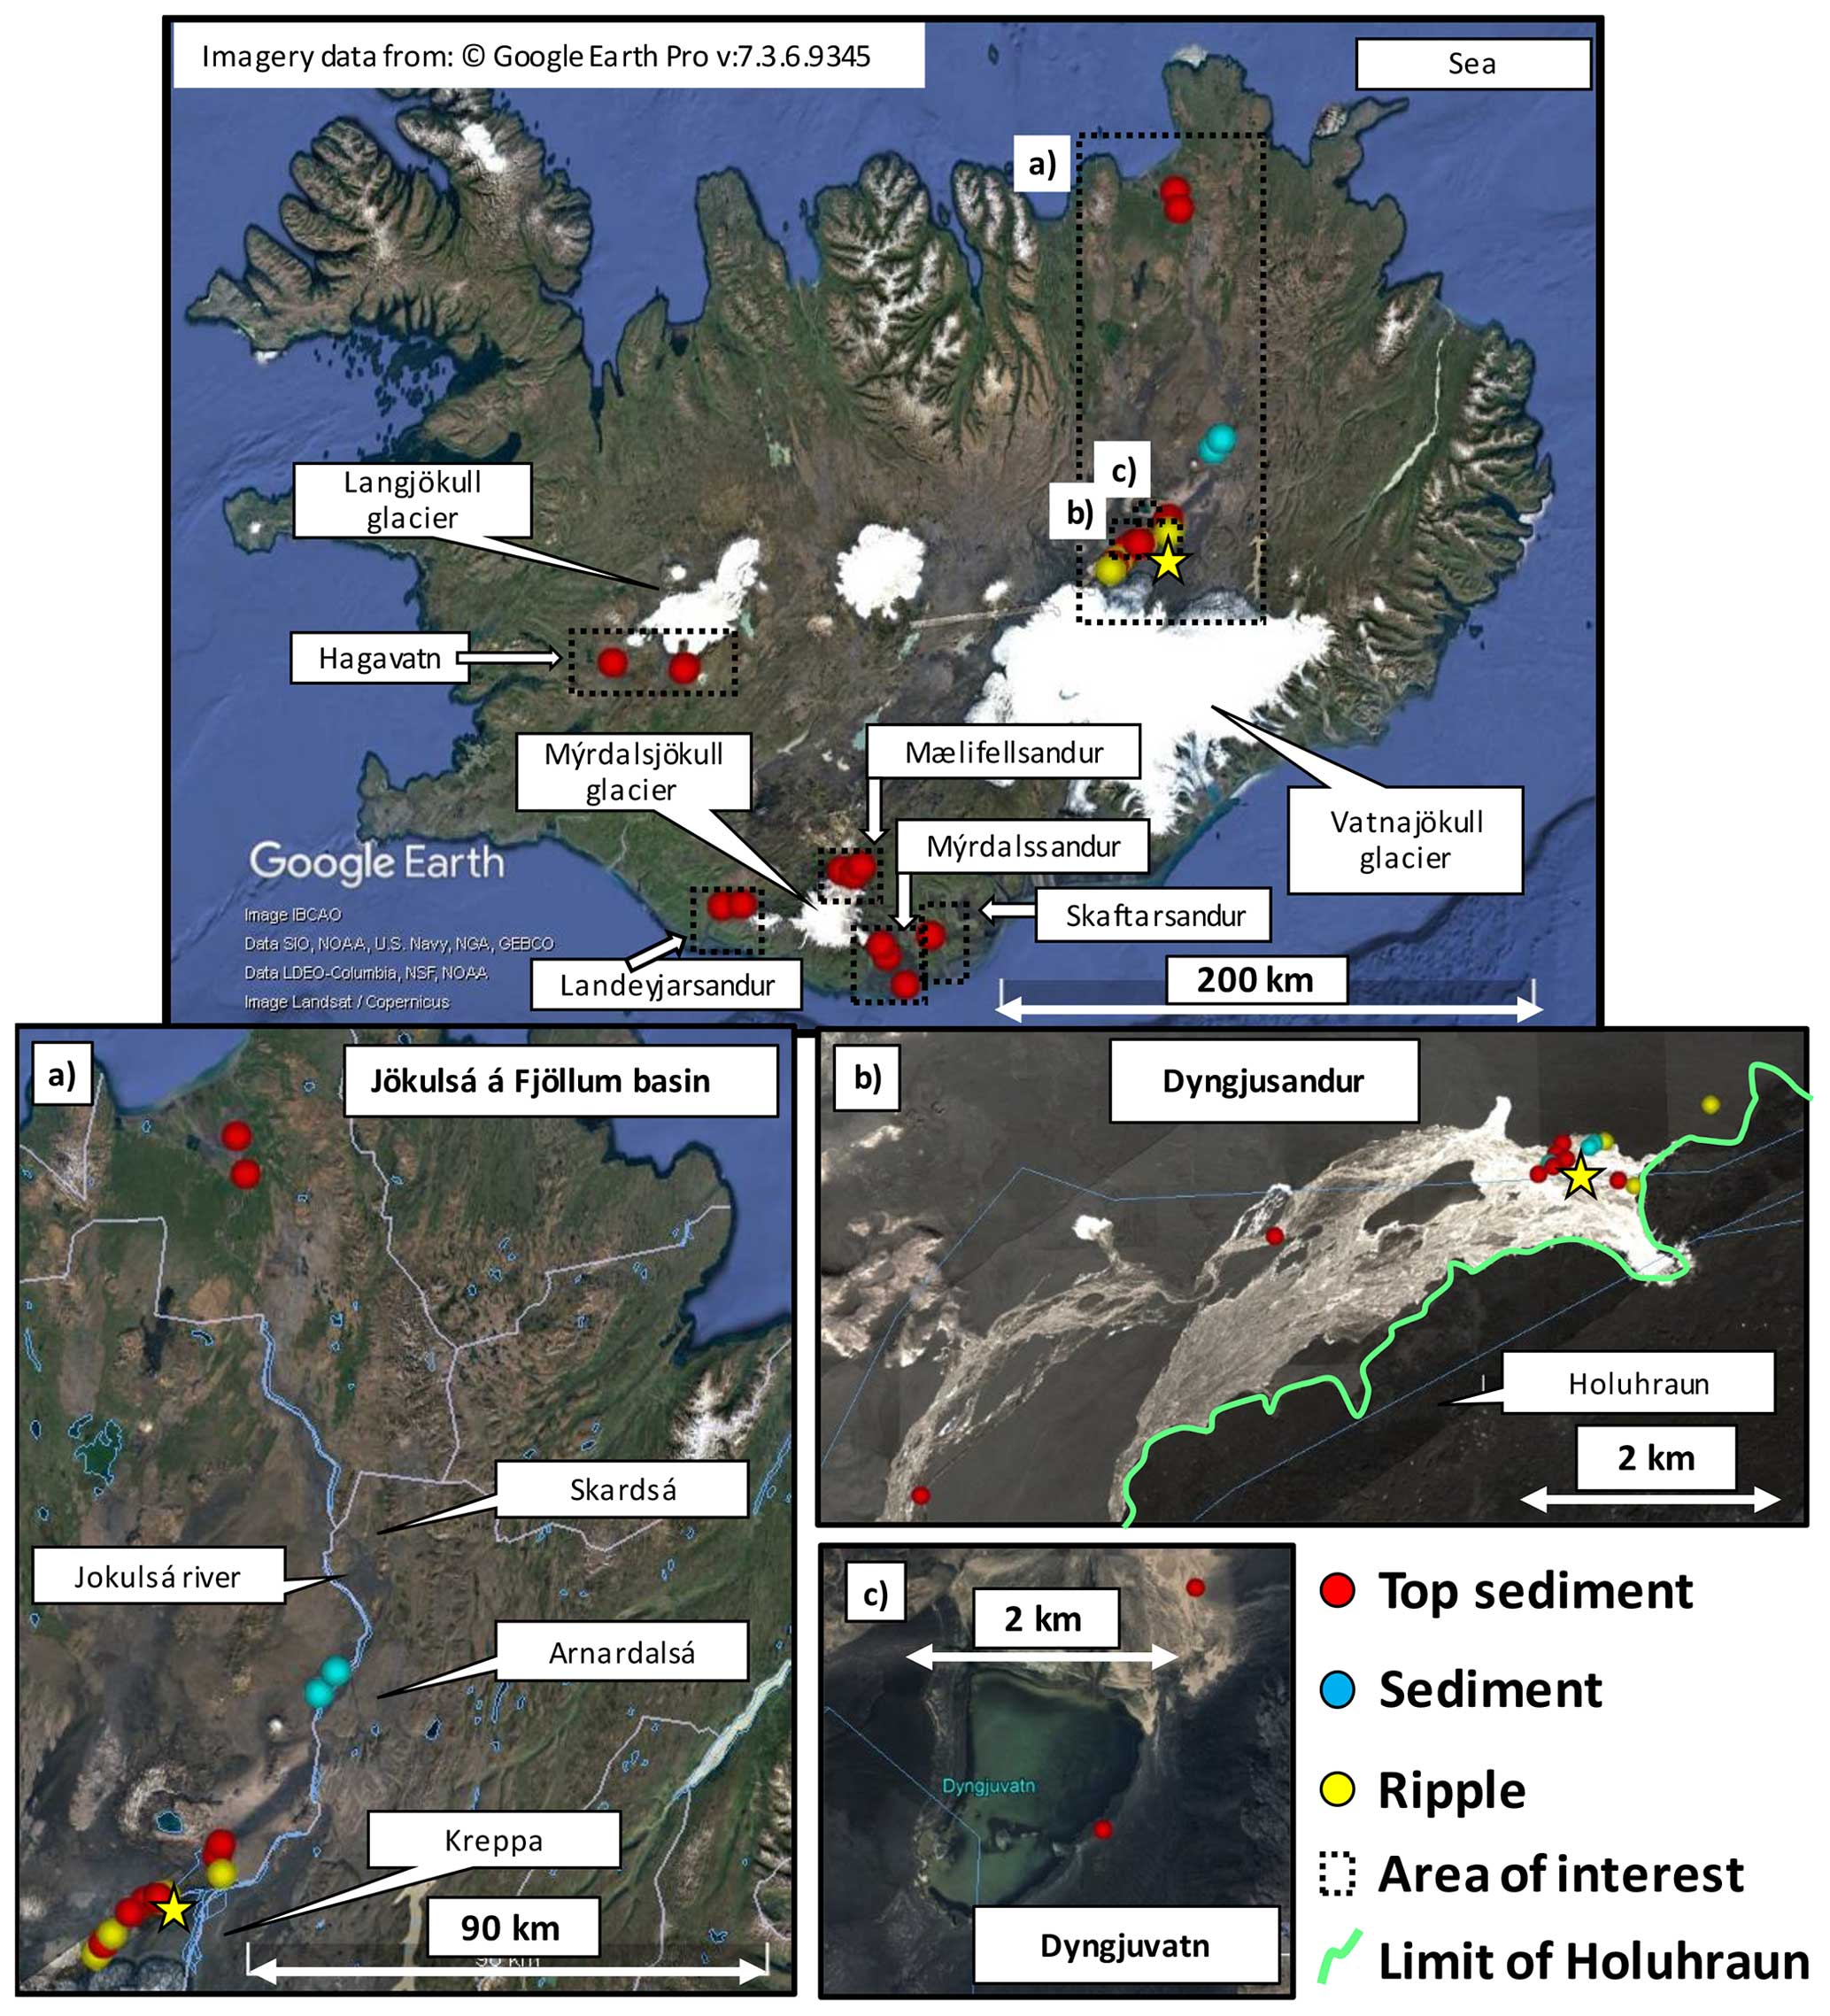
Figure 1Location of Iceland dust hotspots and samples. The green polygon marks the limits of Holuhraun lava field. Dashed black lines mark the area of the different dust hotspots in Iceland, and dots represent samples as top sediments (red), sediments (blue), and aeolian ripples (yellow). Basemap: imagery data from © Google Earth Pro v: 7.3.6.9345. Jökulsá á Fjöllum is marked as (a), and AVIRIS data flight images were used in the zoom-in of Dyngjusandur (b) and Dyngjuvatn (c) for a more updated vision of the lakes. The yellow star represents the experimental site.
Desert dust can also affect air quality and, accordingly, human health (Goudie and Middleton, 2006; De Longeville et al., 2010; Karanasiou et al., 2012; Pérez García-Pando et al., 2014). Thorsteinsson et al. (2011) reported ambient concentrations of atmospheric particulate matter (PM) < 10 µm (PM10) higher than 100 µg m−3, on a 30 min basis, during various dust storms in Reykjavik, with dust transport from the Landeyjarsandur area (100 km ESE of the capital). Dagsson-Waldhauserova et al. (2016) reported mean 5 min average PM10 and PM1 levels of 158–583 and 97–241 µg m−3, respectively, at Landeyjarsandur and 7–486 µg m−3 PM10 at Hagavatn (both major dust hotspots; Fig. 1). Dagsson-Waldhauserova et al. (2015) reported similar PM10 levels in Reykjavik but higher levels in Kirkjubæjarklaustur (up to 6500 µg m−3, 1 min basis).
Dyngjusandur, Dyngjuvatn, Hagavatn, Mælifellsandur, Mýrdalssandur, Landeyjarsandur, and Skaftarsandur (Fig. 1) are the most active dust emission areas in Iceland (Arnalds, 2010). The emission of dust from these regions depends on the season. In the long cold periods, the snow cover prevents dust emissions (Arnalds, 2010). After thawing, soil moisture hinders dust emission; nonetheless, during summer (mostly August) there is a higher probability for dust emission, especially in inland areas, such as Dyngjusandur (Fig. 1), where the periodic passage of fronts from the Arctic and low-pressure systems is common and is associated with high wind speed, generally between 5 and 15 m s−1, with peaks of up to 30–50 m s−1 and 10 m height (Einarsson, 1984; Ólafsson et al., 2007).
Glaciofluvial sediments in Iceland may exhibit distinct particle size characteristics. Samples collected in Dyngjusandur, Hagavatn, Landeyjarsandur, Mælifellssandur, Mýrdalssandur, and Sandkluftavatn generally display unimodal distributions with a notably diverse profile, featuring average diameters ranging from 20 to 98 µm (Meinander et al., 2022). Icelandic dust is mostly made up of basaltic particles (Baratoux et al., 2011; Thorpe et al., 2019). The dust-emitting sediments mainly consist of volcanic glass, with minor proportions of anorthite (0 %–20 %), augite (0 %–10 %), and traces of forsterite, microcline, Ti magnetite, and quartz (Baldo et al., 2020). Wada et al. (1992) reported the occurrence of plagioclase, augite, halloysite, allophane, and imogolite in sediment samples at Thingvallasveit, Myrdalur, Biskupstungnaafrettur, and Goðafoss, while Thorpe et al. (2019) reported that of plagioclase, augite, olivine, volcanic glass, and secondary minerals in soil samples at Hvítá. Baratoux et al. (2011) reported that dust near Dyngjusandur was made up of 80 %–90 % of volcanic glass and traces of pyroxene, olivine, and plagioclase and that from Lambahraun was made up of 0 %–20 % of volcanic glass with very high plagioclase and olivine contents. Dagsson-Waldhauserova et al. (2015) showed that a deposited dust sample from a top snow layer in Reykjavik reflected the major basaltic composition of the source lands, with mean values of 40 %–50 % SiO2, 14 %–20 % Al2O3, 8 %–16 % CaO, 2 %–4 % Na2O + K2O, 4 %–9 % MgO, 10 %–17 % FeO, and 0.8 %–5 % of TiO2, which is in concordance with that of PM10 and PM20 obtained by resuspension of sediment samples in a chamber (Baldo et al., 2020). Dagsson-Waldhauserova et al. (2015) also showed that deposited dust from Mælifellsandur and Skeiðarársandur were similar in composition, with 42 %–45 % SiO2, 14 %–15 % Al2O3, 11 %–12 % CaO, 4.0 %–4.1 % Na2O + K2O, 4.9 %–6.2 % MgO, 14 %–17 % FeO, and 3.5 %–5.6 % of TiO2.
Several atmospheric modelling studies have already attempted at representing HLD (Thorsteinsson et al., 2011; Groot Zwaaftink et al., 2017; Beckett et al., 2017; Cvetkovic et al., 2022; Meinander et al., 2022). However, the inclusion of HLD in Earth system models is only at its early stages (Shi et al., 2022), and it is currently a challenge. While the fundamental processes governing aeolian dust emissions in HLD should be broadly consistent with those in temperate regions, many HLD source regions exhibit additional or amplified processes unique to their environment. These include the highly dynamic nature of many of HLD sources, their potential expansion driven by glacier melting and retreat in a warming climate (Meinander et al., 2022), the potentially distinct emission mechanisms, and different physicochemical properties. Currently, there is a lack of information on the PSD and mineralogy of dust sources to feed model simulations of emission and transport of dust for climate and environmental impact assessment (Laurent et al., 2008; Perlwitz et al., 2015a, b; Kok et al., 2021). This is especially evident for HLD, where dust observations are scarce (Cvetkovic et al., 2022), and mineralogical maps for dust modelling are not available (Claquin et al., 1999; Journet et al., 2014; Green et al., 2020). Specifically, the size and mode of occurrence of Fe require investigation (Mahowald et al., 2005). It is known that hematite/goethite increases the radiative forcing of dust, whereas nano-Fe oxides and easily exchangeable Fe might increase the fertilising effect of dust in ocean and terrestrial ecosystems (Baldo et al., 2020). However, magnetite has different wavelength-dependent optical properties than hematite/goethite (Matsui et al., 2018), and for Icelandic dust it might be the principal contributor to its radiative absorption effect on climate. Also, the high proportions of volcanic glass can influence the radiative forcing of Icelandic dust (Baldo et al., 2023). All in all, there is a pressing need for an improved understanding of the formation and distribution of sediments in HLD hotspots, encompassing an in-depth examination of their compositional and physical attributes. Specifically, a characterisation of the PSD, mineral composition, the mode of occurrence of Fe and visible–near-infrared (VNIR) reflectance spectral signatures is essential for accurate representation of HLD sources and the associated dust effects in forthcoming Earth system models. The analysis of both minimally disturbed PSD (MDPSD) and fully disturbed PSD (FDPSD) can further help in understanding the degree of particle aggregation and sediment cohesion (González-Romero et al., 2023), which should contribute towards understanding and constraining dust emission schemes in these regions.
This study aims at investigating the major patterns of sediments and processes that account for the high dust emission in Dyngjusandur (Fig. 1), one of the most active dust emission areas in Iceland and, more generally, in HLD sources. The major focus is to understand the geological controls for sediment accumulation while characterising the mineralogical composition, PSD, mode of occurrence of Fe, degree of cohesion, and VNIR reflectance spectra of the dust-emitting sediments in the Jökulsá á Fjöllum basin from Vatnajökull (front of the glacier) to Holuhraun (lava field in the middle of the basin) and towards the sea (Fig. 1). As a result, a conceptual model for the accumulation of fine-grained sediments and dust emission in the region is elaborated. Additionally, the analyses of samples from other prominent Icelandic dust sources, including Dyngjuvatn, Hagavatn, Landeyjasandur, Mælifellsandur, Mýrdalssandur, and Skaftarsandur (Fig. 1), are used to evaluate to what extent sediment properties differ across Icelandic dust hotspots. Finally, the properties of Iceland's dust-emitting sediments are compared with those from a hotspot recently analysed with the same techniques in the Moroccan Sahara (González-Romero et al., 2023).
2.1 FRAGMENT field campaigns
This study is part of the FRontiers in dust minerAloGical coMposition and its Effects upoN climaTe (FRAGMENT) project, which has conducted a series of coordinated and interdisciplinary field campaigns across remote dust sources. The project aims to enhance understanding and quantification of dust-source properties and their relationship with emitted dust characteristics, evaluate and refine ongoing spaceborne spectroscopy retrievals of surface minerals (Green et al., 2020), and improve the representation of dust mineralogy in Earth system models (Perlwitz et al., 2015b; Li et al., 2021; Gonçalves Ageitos et al., 2023; Obiso et al., 2024). FRAGMENT campaigns entail regional sediment sampling alongside intensive wind erosion and dust emission measurements at selected sites. Notable examples of these activities can be found in studies by González-Romero et al. (2023), González-Flórez et al. (2023a), Panta et al. (2023), Gonzalez-Romero et al. (2024), and Yus-Díez et al. (2024). FRAGMENT campaigns have been executed in diverse geographic locations, including Morocco (2019), Iceland (2021), the United States (2022), and Jordan (2022).
This study presents results from the sediment sampling carried out from 9 August to 10 September 2021 in Iceland. Sampling in the Jökulsá á Fjöllum basin, encompassing Dyngjusandur, took place between 10 and 12 August, while samples from other dust emission hotspots across Iceland were collected throughout the extended period. The intensive field campaign on wind erosion and dust emission took place in Dyngjusandur (64°54′55′′ N 16°46′35′′ W), situated 300 m upstream from the newest sections of the Holuhraun lava field, where water can accumulate after flash floods, forming an endorheic lake. While some measurements from the intensive field campaign are used in this study to support the sediment sampling analysis in Dyngjusandur, the detailed results concerning the emitted (airborne) dust PSD, composition, and optical properties are presented in forthcoming companion studies (see e.g. González-Flórez et al., 2023b, for preliminary findings), following the approach of previous FRAGMENT campaigns.
2.2 Sediment sampling across Iceland
In northern Iceland, within the Jökulsá á Fjöllum basin, Dyngjusandur stands out as the largest and most active dust-emitting area, as reported by Arnalds (2010) (Fig. 1). Originating from the Vatnajökull glacier sand, silt, and clay size particles are transported northwards via the Jökulsá á Fjöllum river and its tributaries such as Kreppa, Arnardalsá, and Skarðsá, eventually reaching the sea (Fig. 1). The Bárðarbunga eruption and subsequent formation of the Holuhraun lava field (from 29 July 2014 to 27 February 2015 covering an area of 85 km2; Geiger et al., 2016) resulted in a natural dam that intercepted the basin's flow approximately 16 km downstream from Vatnajökull, leading to the formation of the ephemeral Dyngjusandurvatn lake (referred to in this study as Dyngjusandur). This area experiences recurrent flooding events every summer (Fig. 1). The ponded waters percolate through the Holuhraun lava field, eventually reconnecting again with the Jökulsá á Fjöllum river downstream (Arnalds et al., 2016), facilitating the deposition of fresh sediments at Dyngjusandur, which emits dust under favourable conditions.
Sediment samples were collected along the river to characterise the variability in particle size and composition of sediments from the Vatnajökull moraine itself (front moraine) down to the sea (Jökulsá á Fjöllum basin). This exhaustive sampling aimed to provide a comprehensive characterisation of sediments from this dust emission hotspot, located in the vicinity of the Dyngjusandur lake, prior to encountering the Holuhraun lava field (Fig. 1).
Moreover, sediment samples from other dust-emitting sources across Iceland were collected. These include Dyngjuvatn (an endorheic lake near the Jókulsá á Fjöllum basin, but not directly connected to it and distinct from Dyngjusandur), Hagavatn (an ephemeral lake where sediments pond, sediment and sort), Skaftarsandur (riverine sediments near the coastline), Landeyjarsandur (riverine sediments that flow towards the ocean and depositing), Mælifellsandur (river surrounding the glacier contributing with fresh sediment), and Mýrdalssandur (riverine sediments on a wide riverbed) (Fig. 1).

Figure 2Examples of samples collected in Iceland from top sediments (a), sediments (a), and aeolian ripples (b).
The collected samples represent surfaces typically found in dust-emitting and sandy areas across Iceland. These samples comprise the top 1 cm (referred to as top sediment in this study) of recently deposited sediments, typically within a few days of flooding events, originating from dust-emission hotspots. Additionally, samples include underlying sediments located 1 to 5 cm beneath the surface (referred to as fluvial sediments in this study), as well as aeolian ripples found in proximity of these hotspots (Fig. 2). Sampling was conducted using a metallic shovel, consistent with the approach described in González-Romero et al. (2023), with a sampling area of 5 cm2 and a height of 2 cm. Detailed records, including coordinates, photographs of the locations and sampled area, and sample characteristics, were documented. Subsequently, samples were stored in plastic bags and transported to the laboratory. Upon arrival at the laboratory, samples were dried for 24–48 h at 50 °C and riffled into smaller, equal, and homogeneous sub-samples for further treatment and analysis. A total of 119 samples were collected, of which 45 were selected for comprehensive analysis (29 top sediments, 8 fluvial sediments, and 8 aeolian ripples). The remaining samples were subjected to XRD and particle size distribution analysis, although the Fe mode of occurrence was not analysed in these samples.
2.3 Meteorology and airborne dust measurements in Dyngjusandur
As part of the intensive wind erosion and dust emission field campaign in Dyngjusandur, a variety of instruments were deployed, following a setup similar to that utilised in Morocco (González-Flórez et al., 2023a). The measurement site was situated 300 m upstream from the newest sections of the Holuhraun lava field, where water can accumulate after flash floods, forming an endorheic lake. For this specific study, we relied on a reduced set of measurements including temperature, winds, soil humidity, and airborne dust concentration to describe the daily cycles of glacier melting, flooding, sediment discharge, and dust emission in Dyngjusandur.
The dust concentration and PSD were derived from a FIDAS 200S (Palas GmbH) optical particle counter placed at ∼ 2 m height. We recorded 1 s average number concentrations of suspended dust across 65 diameter size bins of equal logarithmic width, ranging from 0.39 to 42.17 µm, which were subsequently averaged over 15 min intervals and converted to mass concentration for analysis. Data from the first three bins were disregarded due to an unrealistic abrupt decline in concentration, stemming from measurement limitations at the lower end of the size spectrum. Therefore, for analytical purposes we deemed the FIDAS instrument effective from the fourth bin, starting at 0.49 µm, onwards.
Additionally, a second FIDAS instrument was positioned at a higher elevation, enabling the determination of the diffusive dust flux following the methodology outlined in González-Flórez et al. (2023b). For the purposes of this study, the obtained diffusive dust flux was solely employed to identify all 15 min periods characterised by dust emission, indicated by positive diffusive dust flux in all size bins between 0.65 and 27.38 µm. These dust emission periods were used to calculate the average mass median diameter of the surface concentration of freshly emitted dust. A forthcoming companion paper will provide a detailed analysis of the diffusive flux PSD during the campaign.
Both FIDAS underwent calibration in the field at the onset of the campaign, utilising monodisperse (non-absorbing) polystyrene latex spheres (PSLs). Consequently, the default optical diameters correspond to PSLs that produce the same scattered light intensity as the measured dust particles.
Measurements with the FIDAS instruments started on 11 August 2021, at 17:30 UTC and continued until 4 September at 11:00 UTC. Within this time frame, we also used 15 min averaged wind data from five 2-D sonic anemometers (Campbell Scientific WINDSONIC4-L) positioned at heights of 0.4, 0.8, 2, 5, and 9.9 m in a 10 m meteorological tower. Additionally, we used temperature from a probe (Campbell Scientific HC2A-S3) installed near the tower at a height of 0.5 m and from three soil water content reflectometers (Campbell Scientific CS616). Two of these reflectometers were positioned horizontally at depths of approximately 2 cm (referred to as VWC1) and 5 cm (referred to as VWC2), respectively. The third reflectometer was positioned vertically at a depth of approximately 30 cm (referred to as VWC3).
The FIDAS instruments underwent temporarily dismantling from 24 August at 18:00 UTC to 27 August at 12:00 UTC due a significant flooding event at our measurement site, prompting concerns about potential instrument damage. Additionally, throughout the campaign, minor data gaps occurred due to power failures and other technical issues. The temperature probe and the soil water reflectometers were also dismantled on the morning after the flooding. They were subsequently re-installed on 27 August at 13:00 UTC and 28 August at 12:45 UTC, respectively, to resume data collection.
In addition, throughout the campaign, images of our measurement site were recorded by a Raspberry Pi 3B+ (Raspberry Pi Ltd., Cambridge, UK) using a Webcam with a OV5647 camera module (OmniVision, Santa Clara, CA, USA) with a 160° diagonal fisheye lens attached. The image resolution is 2592 × 1944 pixels. The camera was positioned to capture the upward view of the floodplain facing the direction of the incoming water from the glacier (Fig. S1 in the Supplement). Images were taken at intervals of every 15 min from 8 August at 18:00 UTC to 25 August at 13:30 UTC and subsequently at intervals of every 5 min until 5 September at 16:00 UTC. The images were manually inspected for rain or flooding occurrence. Typically, this inspection was feasible during daytime hours (approximately from 04:00 to 22:00 UTC) depending on lighting conditions. However, for some nights, information was available due to illumination from full moonlight. The following conditions were classified based on the images: “rain at site” was identified by falling droplets visible in the image or droplets present on the camera housing, which changed from image to image; “flooding visible in distance” was identified by filled water channels or ponding water visible in the image; “flooding at site” was identified when a water surface stretched towards the bottom of the image and apparently beyond (the lower image edge shows the ground in approx. 1 m distance of the camera) (Fig. S1).
2.4 Analyses of sediment samples
2.4.1 Particle size distribution
Particle size distributions (PSDs) were analysed through fully dispersed (natural aggregates totally dispersed, as much as possible through a dispersion shaking) and minimally dispersed methods (natural aggregates minimally dispersed, dry measurements) according to González-Romero et al. (2023). A coarser minimally dispersed PSD indicates high aggregation, while similarity between the minimally and totally dispersed PSDs indicates a low aggregation of particles in dust-emitting sediments; this has key implications for the mechanisms of dust emission. In both cases, PSDs were determined by laser diffraction with a Malvern Mastersizer 2000 Scirocco and Hydro G accessories, for minimally and fully dispersed conditions, respectively. For the fully dispersed conditions, we followed the procedure presented in Sperazza et al. (2004).
2.4.2 Mineralogical composition
X-Ray diffraction (XRD), coupled with the Rietveld method, has been increasingly used as a fast and reliable method to evaluate the content of the crystalline and amorphous phases in inorganic materials (Rietveld, 1969; Cheary and Coelho, 1992; Young, 1993; TOPAS, 2018). Quantification of mixtures via the Rietveld method is generally restricted to crystalline phases for which structures are well known. However, the addition of a known amount of an internal standard material allows the quantification of any amorphous (non-crystalline) material in the mixture that has not been included in the model, in our case, volcanic glass or amorphous alteration products like allophane, imogolite, and silica (De la Torre et al., 2001; Madsen et al., 2001; Scarlett and Madsen, 2006; Machiels et al., 2010; Ibañez et al., 2013). Sample preparation for quantitative mineralogical analysis consisted of preliminary dry grinding of the samples in an agate mortar, mixed with a known amount (10 %–20 %) of CaF2 powder (Merck), as an internal standard to allow the determination of amorphous contents, and finally dry ground again to reduce the grain size distribution and homogenise the mixture. The analysis was carried out by a Bruker D8 A25 Advance powder X-ray diffractometer equipped with a LynxEye 1D position sensitive detector, monochromatic Cu Kα radiation ( Å) operating at 40 kV and 40 mA. The diffractograms were recorded by scanning from 4 to 120° of 2θ with a step size of 0.015° and a counting time of 1 s per step maintaining the sample in rotation (15 min−1). The mineral identification was performed by searches and comparisons of the patterns from the International Centre for Diffraction Database (ICDD, PDF-2) using DIFFRAC.EVA software package (Bruker AXS). The quantitative analysis of the mineral phases was carried out by Rietveld full-pattern analyses performed with the TOPAS 5 software (Bruker AXS), which uses least-square procedures to minimise the differences between the observed and calculated diffractograms. The abundances of the crystalline and amorphous phases were normalised to 100 wt % (weight percentage). The quality of the fitting was evaluated by visually comparing the observed and calculated diffractograms to achieve a realistic model and checking the residual factors (RB, Rwp, Rexp) and goodness of fit (GOF) calculated by the TOPAS model (Rietveld, 1969; Toby, 2006).
2.4.3 Mode of occurrence of Fe
The samples were subject to a series of sequential extractions (Fig. S2) aimed at quantifying the content of Fe, including readily exchangeable Fe, hematite, and goethite; magnetite; and Fe-bearing minerals and volcanic glass. Initially, a portion of each collected sample was subject to duplicate acid digestion using a specialised two-step acid digestion method (Fig. S2a) (Querol, 1993; Querol et al., 1997). This process was employed to ascertain the total Fe content. To validate the accuracy of the analytical and digestion methods, reagent blanks and the standard reference materials NIST SRM 1633b (FA) were also subject to digestion. The determination of readily exchangeable Fe ions and nano Fe oxides, the quantification of crystalline Fe oxides as hematite and goethite, and the assessment of crystalline magnetite were all conducted using the laboratory-based sequential extraction method described by Shi et al. (2009) and Baldo et al. (2020). The initial sequential extraction step involved combining 30 mg of the sample with 10 mL of the first extractant solution (ascorbate solution as described in Fig. S2b). The mixture was agitated for a period of 24 h in a light-controlled environment and subsequently filtered. Following this, another 30 mg of the same samples underwent leaching with 10 mL of the second extraction solution (dithionite solution as described in Fig. S2c), with 2 h of shaking under in a light-controlled environment, followed by filtration. The solid residue resulting from this latter extraction was once again leached in a light-controlled environment, this time using 10 mL of a third extraction solution (oxalate solution as described in Fig. S2d), and was shaken for a duration of 6 h before undergoing another filtration. The quantification of the dissolved Fe in each of the three solutions, as well as the bulk acidic digestion, was performed using inductively coupled plasma atomic emission spectrometry (ICP-AES).
The bulk Fe content is referred to as FeT. The Fe that is the extractable from the initial leaching process is denoted as FeA, representing the Fe that is readily exchangeable, as well as the Fe present as nano-Fe oxides. The Fe extracted from the second stage, minus FeA, is referred to as FeD, which corresponds to the Fe content of goethite and hematite. Additionally, the Fe content of the third extraction is referred to as FeM, equivalent to the Fe magnetite content. The sum of FeD and FeM is equivalent to the total Fe present in crystalline Fe oxides. Finally, the FeT minus the sum of FeA, FeD, and FeM is designated as FeS, representing the content of structural Fe or Fe incorporated within the structure of other minerals, such as pyroxenes, other Fe-bearing minerals, and volcanic glass.
For quality control purposes in each laboratory-based sequential extraction, 30 mg of the Arizona Test Dust (ATD; ISO 12103-1, A1 Ultrafine Test Dust; Powder Technology Inc.) was subject to the same extraction procedure. The averaged Fe content of the reference material 1633b was found to be 7.6 ± 0.5 % (certified 7.8 %). Furthermore, the average values of the sequential Fe extraction of the ATD reference material were 0.062 ± 0.005 %, 0.45 ± 0.01 %, and 0.042 ± 0.002 % for FeA, FeA + FeD, and FeM, respectively, while the certified contents are 0.067 %, 0.48 %, and 0.047 %, respectively.
2.4.4 Electron microscopy of samples
Particles from sediment samples were deposited on graphite stubs and sputter coated with C for size, morphology, mineralogy, and aggregate evaluation analysis with a JEOM JSM-7001F SEM-EDX scanning electron microscope (SEM).
2.5 In situ and airborne VNIR spectroscopy
Reflectance spectra were measured at 17 sampling locations before and after sample collection using an ASD Fieldspec 3 with contact probe attachment. This instrument measures wavelengths 350–2500 nm with spectral resolutions of 3 nm at 0.7 µm and 10 nm at 1.4 and 2.1 µm. Spectra are measured at 1.4 nm sampling for wavelengths 0.35–1.0 µm and 2 nm for 1.0–2.5 µm but are internally resampled and output with 1 nm spacing. All measurements are relative to Spectralon and corrected for the known reflectance properties of Spectralon. While we measured the exposed surface after sampling (below the collected sample), we did not use those measurements as the soils were too saturated to see the mineralogy well. Surface spectra are reported and compared with spectral libraries and the literature (e.g. Kokaly et al., 2017), and band depths (Table S1) were calculated for key absorption features following the methods of Clark and Roush (1984).
Additionally, airborne imaging spectrometer (AVIRIS) data operated by NASA–JPL was acquired at the Jökulsá á Fjöllum basin, from the glacier down to Holuhraun lava field during the field campaign. Three AVIRIS scenes with 224 contiguous channels of 10 nm and a wavelength range of 0.35–2.5 µm were used to map spectral reflectance characteristics with the expert Tetracorder system (a modified absorption band-shaped comparison technique between obtained data and a library reference spectrum; Clark et al., 2003). The AVIRIS raw data were calibrated to radiance and ratioed to the solar spectrum; the atmospheric scattering and absorptions were removed to derive apparent surface reflectance (Thompson et al., 2019, and Brodrick et al., 2021). The AVIRIS reflectance image cubes were mapped with Tetracorder, which analysed the spectra for hundreds of minerals, mineral mixtures, coatings, vegetation, human-made materials, and other compounds. Tetracorder analyses different spectral regions for different compounds. While some minerals have unique spectral features (e.g. hematite, pyroxene), others have broadly overlapping absorption features and only categories can be determined (e.g. Fe2+-bearing minerals).
3.1 Glacier melting, flooding, sediment discharge, and dust emission cycles in Dyngjusandur
Strong winds in Iceland typically coincide with extratropical cyclones featuring robust precipitating systems, commonly known as fronts. During such weather events, dry conditions prevail on the downstream side of Iceland's central highlands, providing favourable conditions for dust emission (Dagsson-Waldhauserova et al., 2014). Wind patterns vary monthly, with the windiest months in northeastern (NE) Iceland being May–June and September, correlating with high dust frequency. Dust episodes in Dyngjusandur are most commonly occurring during the warm season when the surface is free of snow and glacier melting is accelerated, especially at midday. The plains cool rapidly during the night, but they warm up fast in the sunshine of the long summer days, implying large daily fluctuations in temperature and wind, the latter partly driven by katabatic winds from the Vatnajökull glacier (Baratoux et al., 2011; Björnsson, 2017).
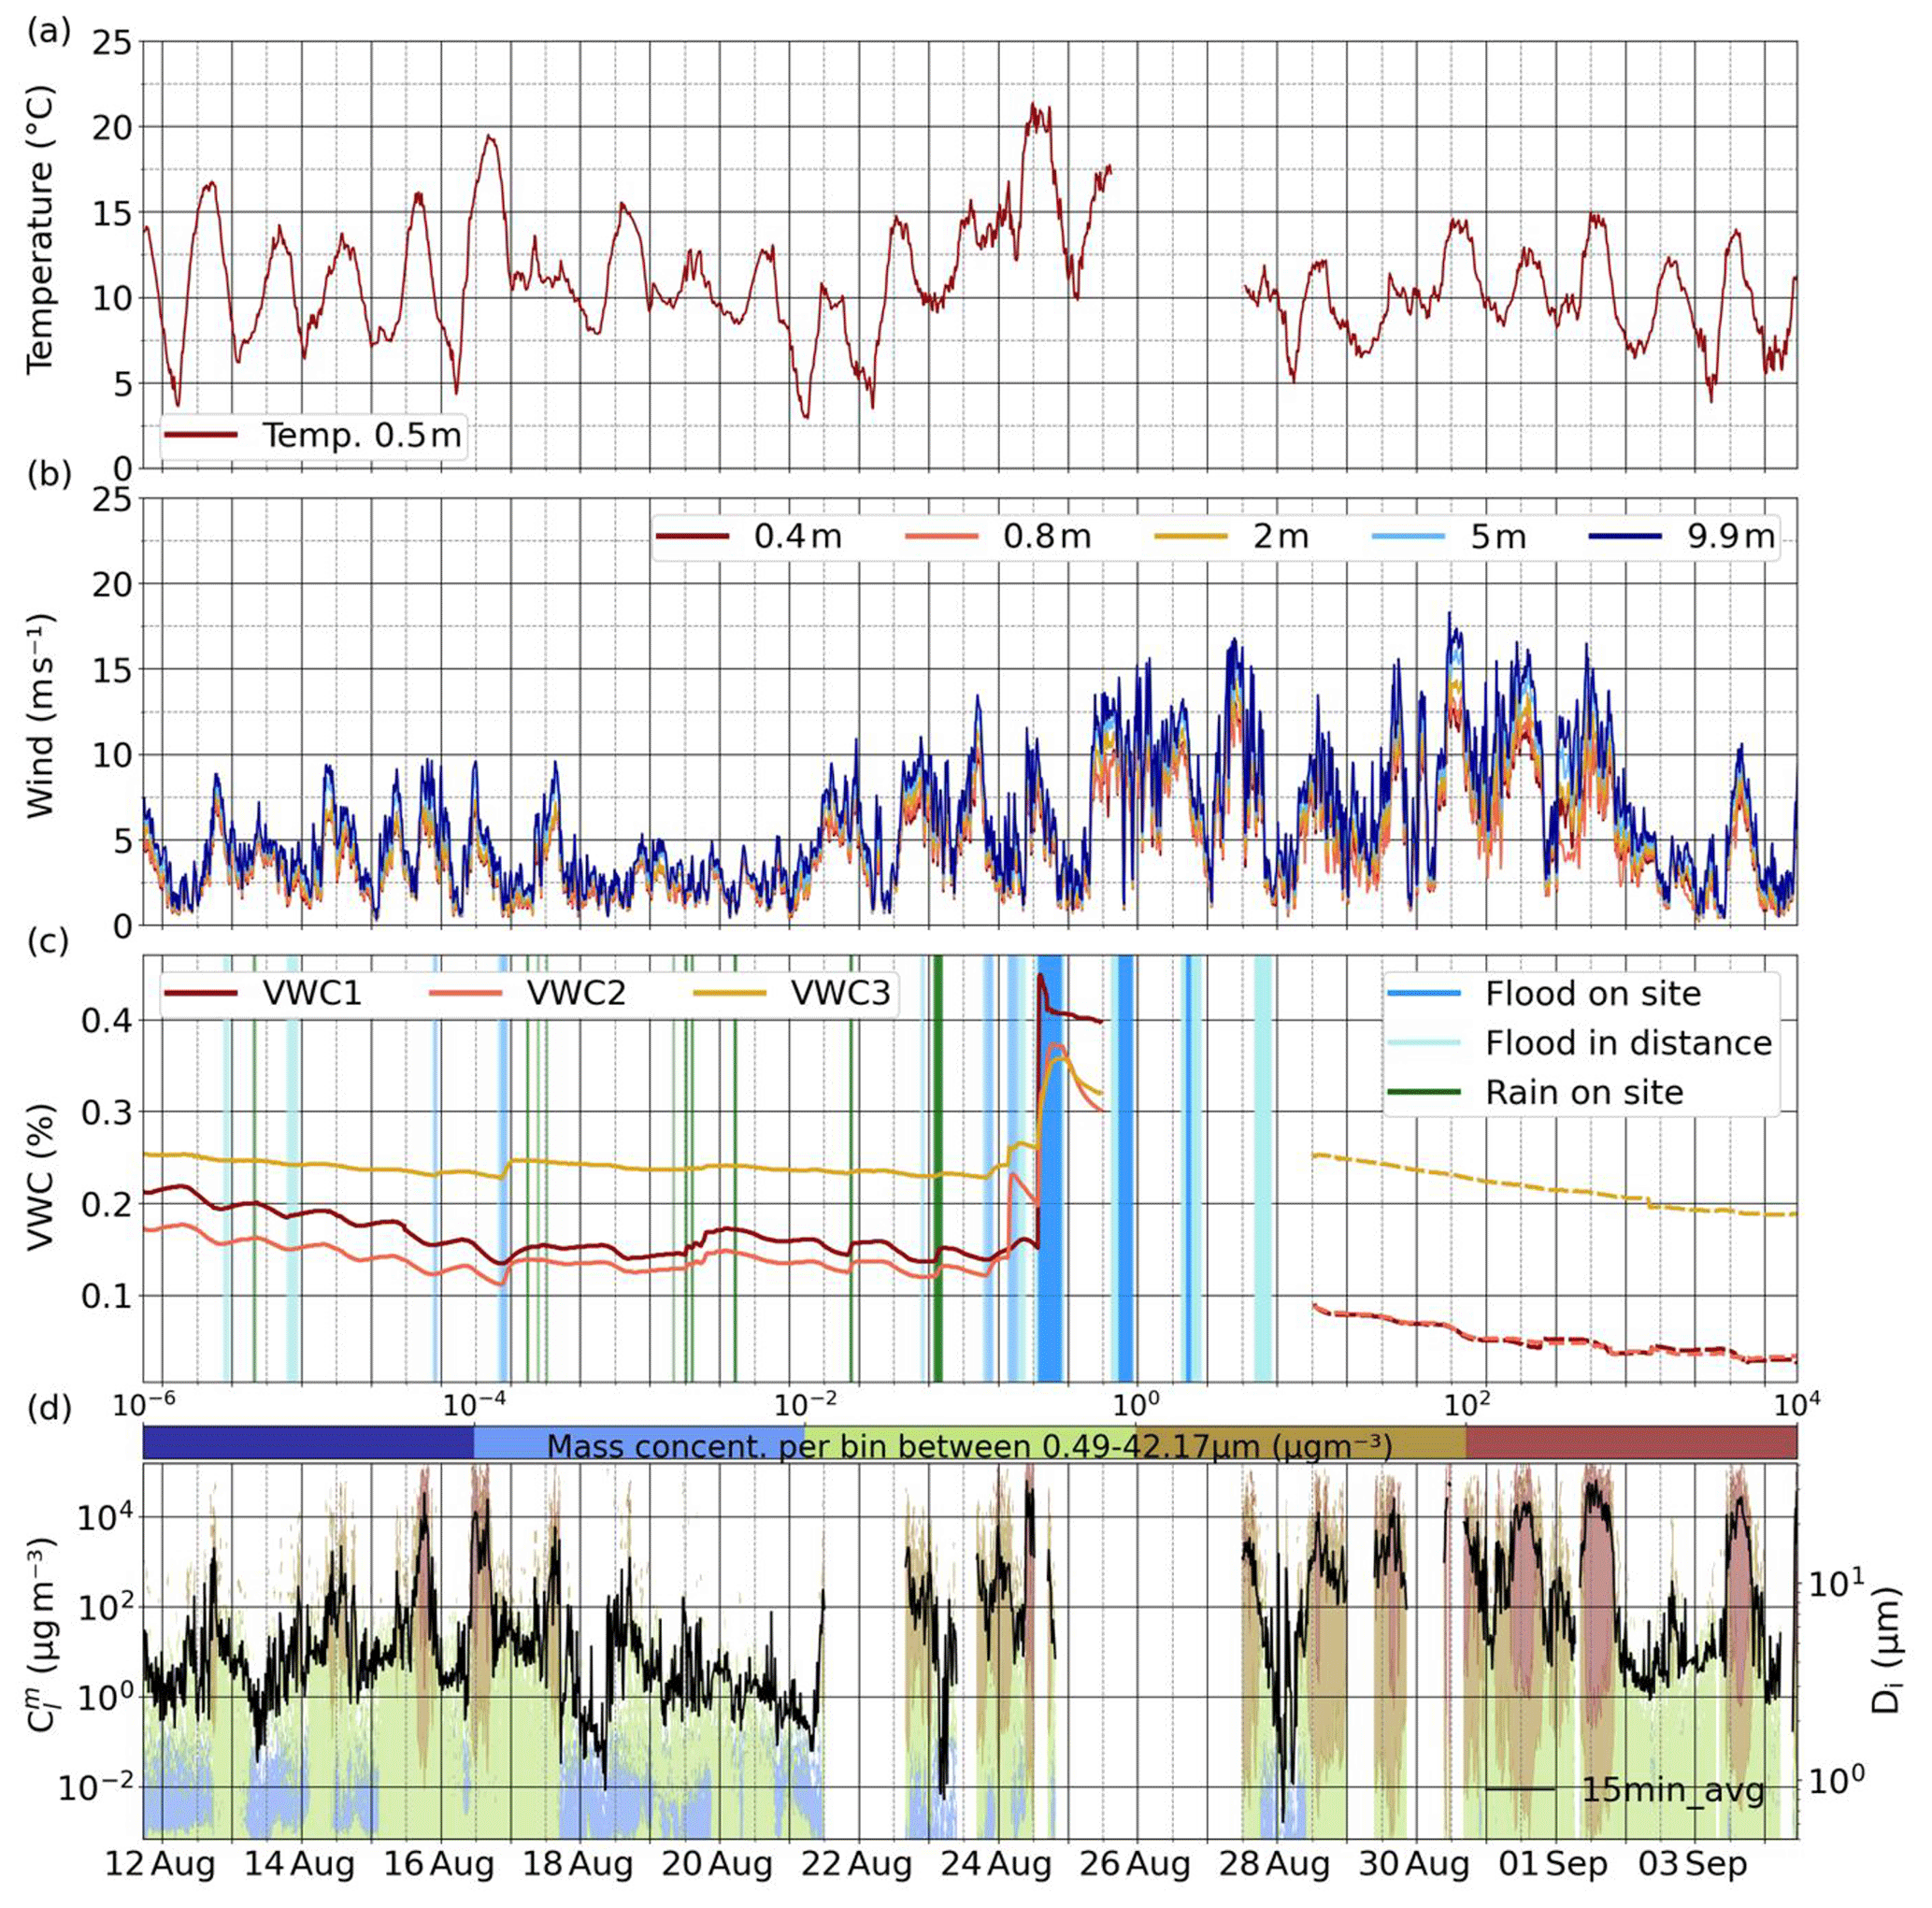
Figure 3The 15 min average time series of temperature, winds, volumetric soil water content, and dust concentration in Dyngjusandur from 12 August to 4 September 2021 (see location in Fig. 1). (a) Ambient temperature at 0.5 m a.g.l. (°C); (b) wind speed measured at 0.4, 0.8, 2.0, 5.0, and 9.9 m a.g.l. (m s−1); (c) volumetric water content at depths 2 cm (VWC2), 5 cm (WVC1), and 30 cm (VWC3) beneath the surface (%), alongside periods marked by flooding on site (dark blue vertical lines), flooding in distance (light blue vertical lines), and rain on site (green vertical lines); (d) total ambient dust concentration displayed with a black line (left y axis) and concentrations for individual size bins represented as colour contours, with the corresponding colour bar reflecting the concentration ranges.
Figure 3 illustrates the time series of temperature, wind speeds, soil humidity, and near-surface dust concentrations, along with the periods with “rain on site”, “flooding visible in distance”, and “flooding visible on site” at the measurement site. Typically, temperatures ranged between 5 and 15 °C (Fig. 3a). However, only six days experienced temperatures exceeding 15 °C, with the highest peak recorded on 24 August, when a new maximum temperature record for August was registered in Iceland (https://en.vedur.is/about-imo/news/the-weather-in-iceland-in-2021, last access: 6 June 2024). This temperature surge intensified the daily meltwater discharge cycle of the Vatnajökull glacier, resulting in complete flooding of our measurement site. This event coincided with the peak of volumetric water content recorded during this period (Fig. 3c), with a significant amount of sediment transported and deposited by the glacial meltwater. Subsequent days were marked by vigorous winds, with 15 min average velocities at 9.9 m height exceeding 18 m s−1 (Fig. 3b) and gusts reaching speeds beyond 25 m s−1. These windy conditions led to a fast drying of the surface and intense dust storms, with persistent dust concentrations exceeding 10 000 µg m−3 (Fig. 3d). The strong winds exposed the horizontal reflectometers, necessitating multiple re-installation attempts to maintain adequate coverage. Consequently, the reliability of measurements from sensors VWC1 and VWC2 declined after the flooding event, reflected in their representation as dotted lines in Fig. 3c.
Before the significant flooding event, winds were weaker (Fig. 3b), rain was frequent (vertical green lines in Fig. 3c), and milder flooding events were visible in our camera recurrently during the afternoon (vertical blue lines in Fig. 3c), the latter particularly before 17 August. (Flooding events between the moraine and the measurement site occurred daily, although our camera could only capture those reaching areas near the measurement site.) Dust events during this period were shorter-lived and less severe, with background concentrations around 1 µg m−3 (Fig. 3d). The volumetric soil water content tended to decrease, and its diurnal variations were more pronounced near the surface (VWC1 and VWC2), with peak values typically occurring in the early morning and decreasing throughout the afternoon due to evaporation. The periods of identified flooding, particularly those with flooding visible on site (vertical dark blue lines in Fig. 3c), or rain (vertical green lines in Fig. 3c) were clearly reflected in abrupt increases in volumetric water content.
3.2 Sediment particle size distribution
The PSDs of the sediments collected were analysed, and the obtained minimally dispersed particle size distributions (MDPSD, i.e. near-natural aggregation state) and fully dispersed particle size distributions (FDPSD, i.e. aggregates completely dispersed) were compared to evaluate the state of particle aggregation in dust-emitting sediments.
3.2.1 Particle size distribution in the Jökulsá á Fjöllum basin
Both the MDPSD and FDPSD of the three types of sediments (top surface, fluvial, and aeolian ripples) are characterised by left-skewed log-normal PSDs. PSDs of top sediments, fluvial sediments, and aeolian ripples differ considerably, with an increasingly coarser PSD (Fig. 4). The mean of the median diameters (mean median diameters) from the FDPSDs of all samples types collected in the basin was 133 ± 174 µm [6.8, 738, minimum and maximum], while that of MDPSDs reached 107 ± 129 µm [6.4, 502], indicating the variability of particle sizes. FDPSDs of top sediments had a much finer mean median diameter (31 ± 15 µm) compared to the other type of samples: 102 ± 91 and 354 ± 203 µm for fluvial sediments and aeolian ripples, respectively (Table 1). Similar results, in absolute and relative values, were obtained for MDPSDs for all types of samples (Table 1). The fact that FDPSD and MDPSD yielded similar mean median diameters indicates a significant level of particle disaggregation, which is unusual for dust-emitting sediments in hot deserts (González-Romero et al., 2023).

Figure 4Minimally dispersed particle size distribution (MDPSD) and fully dispersed particle size distribution (FDPSD) of top sediment, fluvial sediments, and aeolian ripple samples.
Table 1Mean median diameters, standard deviation, minimum, and maximum (µm) of top sediments, underlying fluvial sediments, and aeolian ripples from the Jökulsá á Fjöllum basin and the Sahara, for minimally dispersed particle size distribution (MDPSD) and fully dispersed particle size distribution (FDPSD).
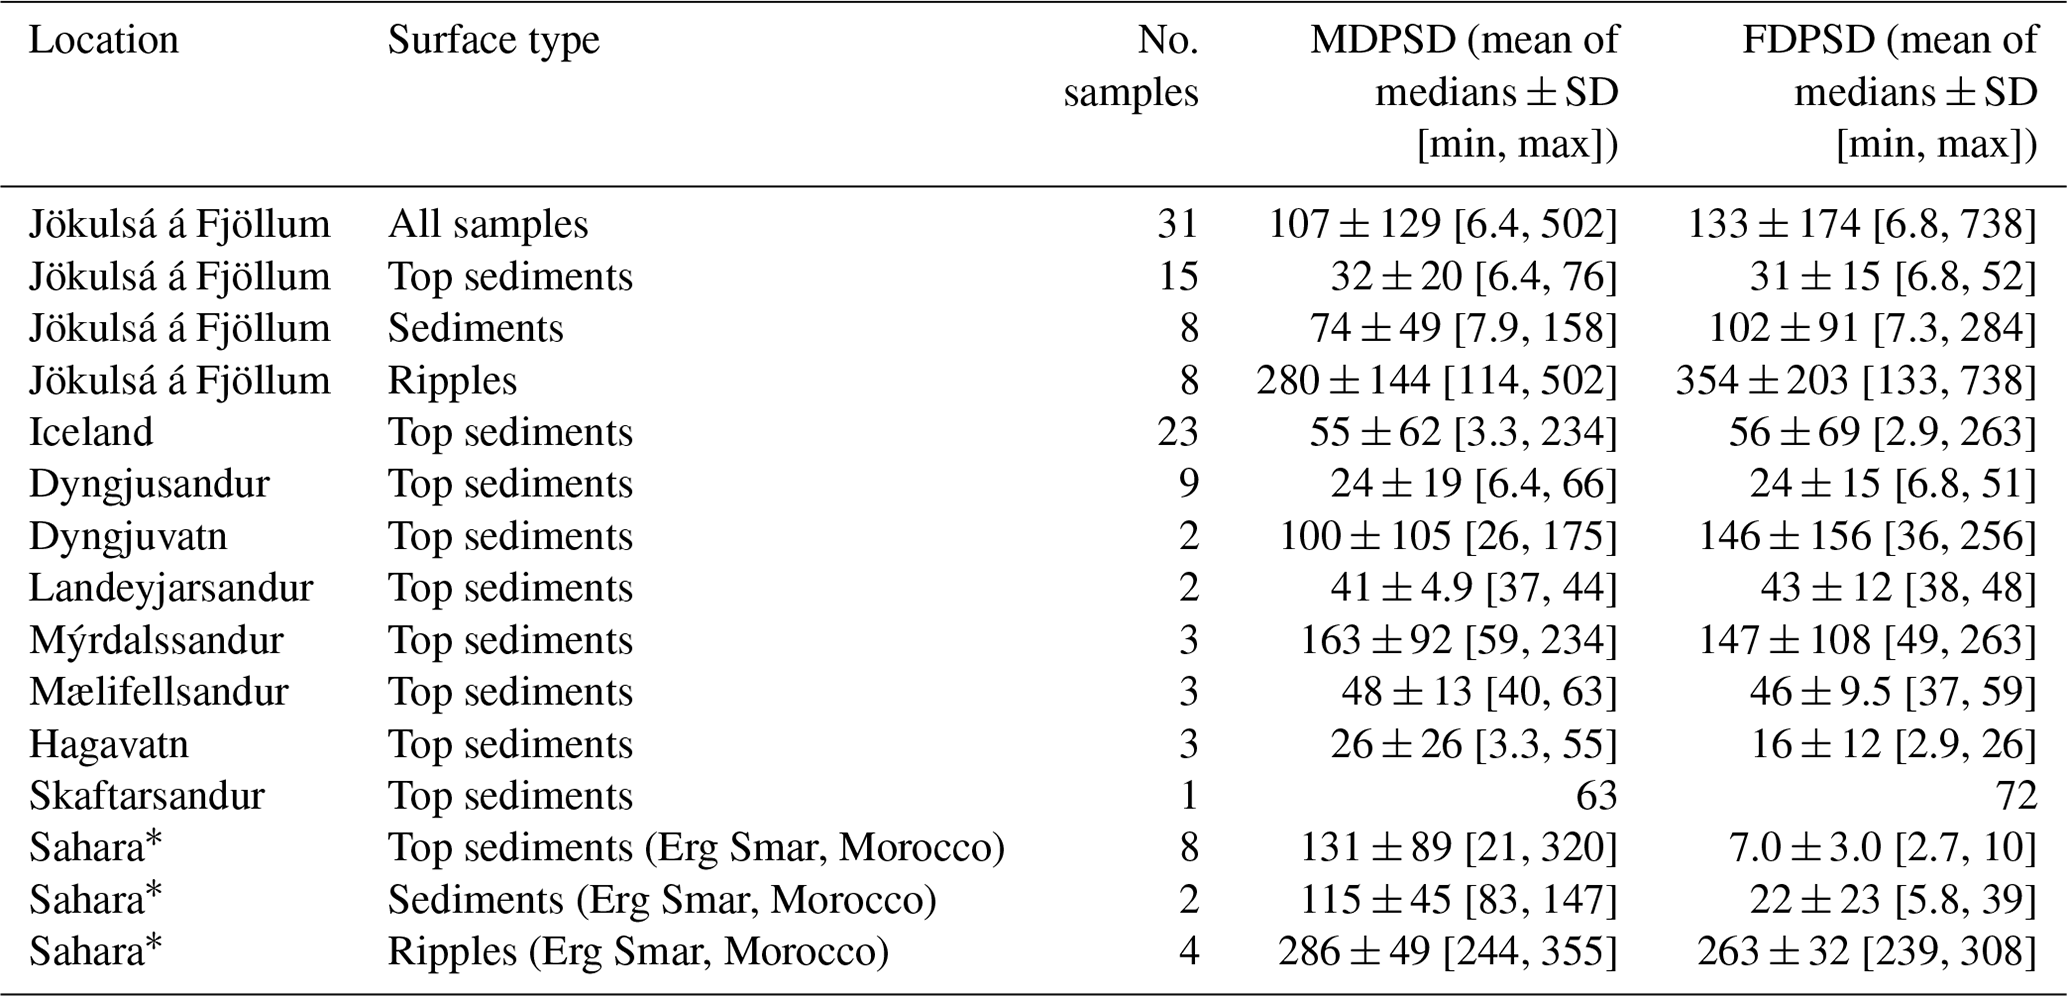
∗ Extracted from González-Romero et al. (2023).
The mean median diameter of top sediments along the basin, ranging from the glacier to the sea, clearly decreases, first transitioning from 76 µm for FDPSD and 52 µm for MDPSD near the moraine to 19 µm for FDPSD and MDPSD just before the Holuhraun lava field (Fig. 5). Notably, just before the Holuhraun lava field, where the intensive measurements were conducted, the mass median diameter the dust concentration during dust events averaged ∼ 12 µm between 0.5 and 40 µm. For reference, the mean mass diameter of the MDPSD and FDPSD of the top sediments around the measurement site within the same size range is ∼ 15 µm.
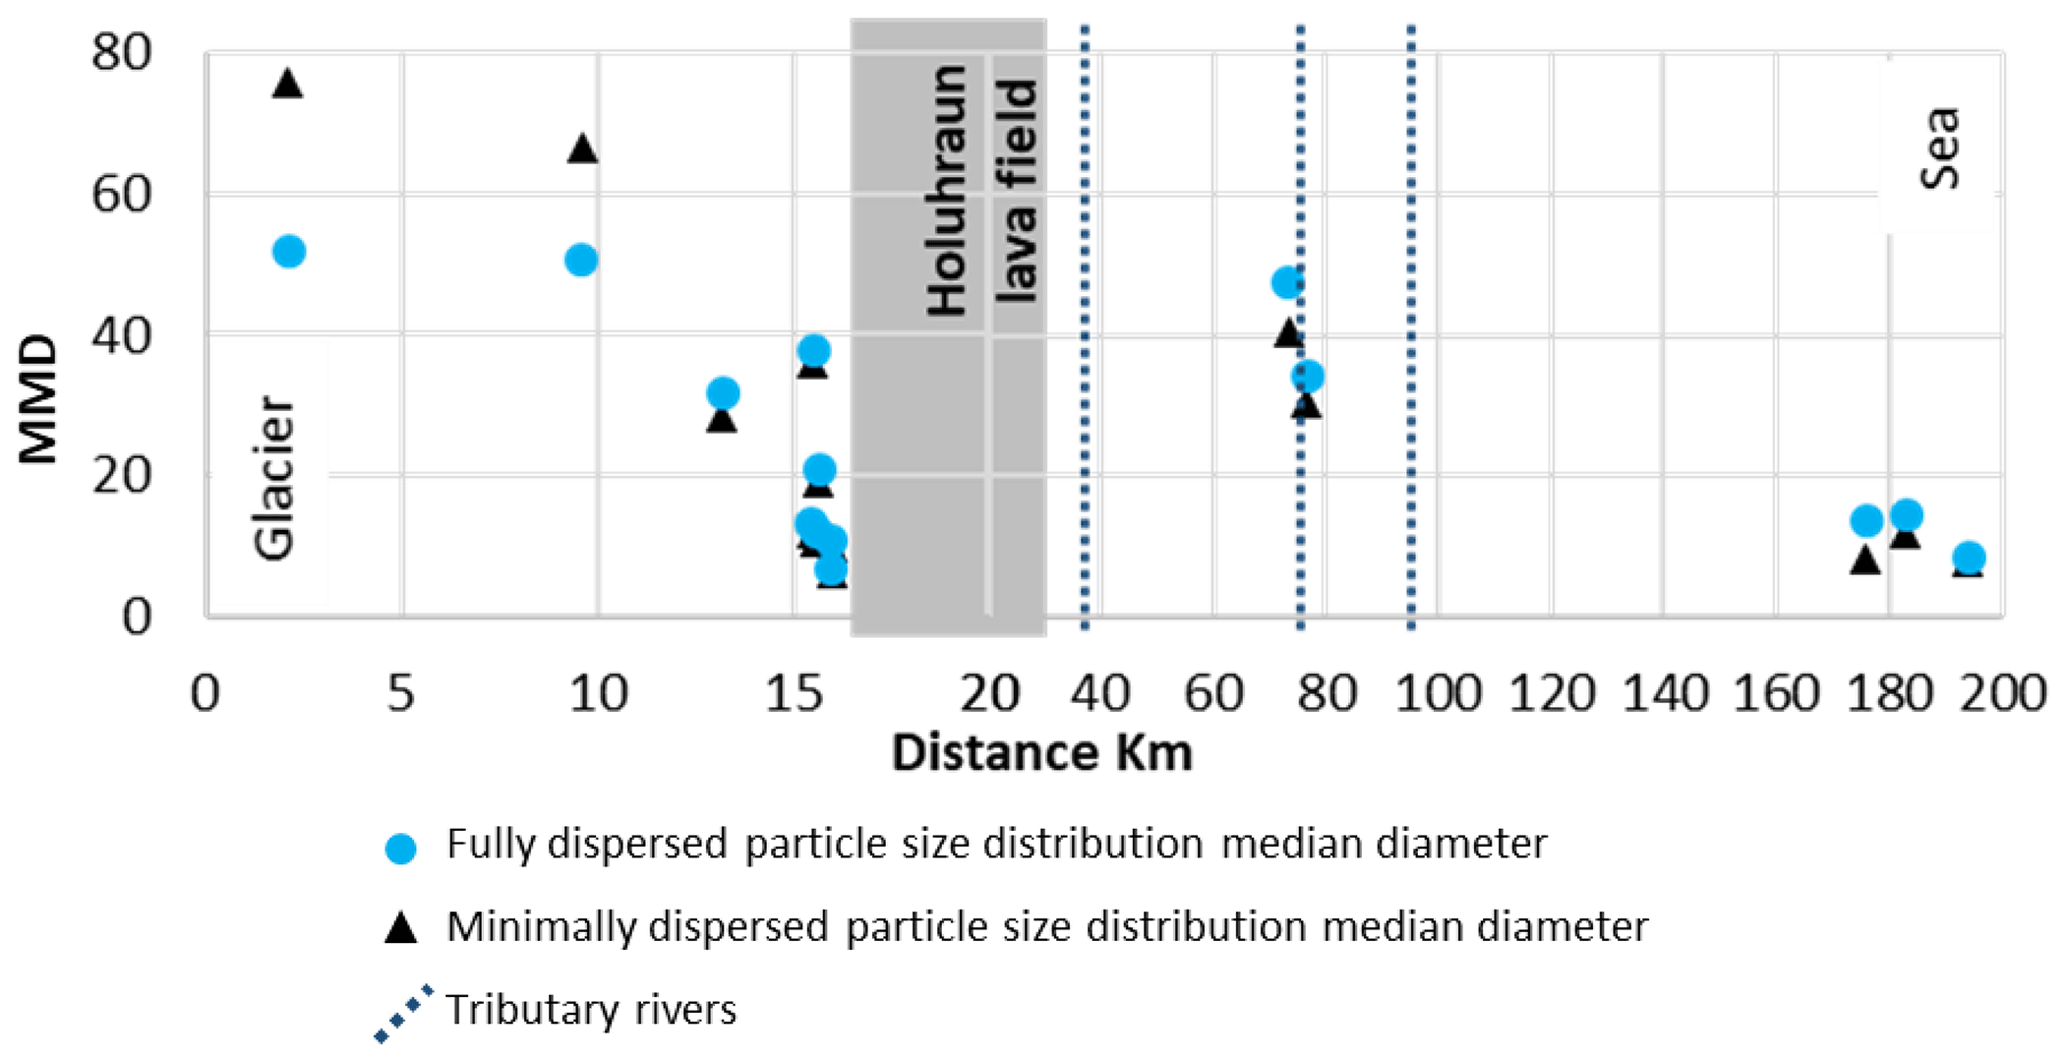
Figure 5Mean median diameters of top sediments along the Jökulsá á Fjöllum river, according to the distance to the glacier moraine. The grey column indicates the location of the Holuhraun lava field and the red vertical line, a tributary channel of Jökulsá á Fjöllum.
The reduction in the median diameter of the top sediments along the path from the glacier to the lava field occurs due to several factors. On the one hand, there is particle size segregation driven by fluvial transport that carries sediment from the moraine to more distant areas. On the other hand, vertical micro-segregation occurs during deposition at the ephemeral lake formed by the Holuhraun lava field, which effectively acts as a natural dam. Because of this dam-like effect, sediment-laden waters are temporarily impounded. Finer-grained top sediments gradually accumulate on top of the coarser sediment layer deposited during the initial stage of the flooding–ponding–drying cycle. As shown in Sect. 3.1, these episodic events are recurrent during the summer season.
The fine pattern of these surface sediments likely stems from various factors:
- i.
Sediments trapped within glacial ice from fine volcanic ash deposits accumulated over the glacier's geological history, along with nearby dust emissions that are released during melting.
- ii.
Fine sediments are transported from moraines to floodplains via fluvial channels, where further segregation occurs through ponding. During drying phases, finer particles settle atop, following the initial deposition of coarser particles.
- iii.
Dust emissions contribute to segregating finer particles on rock surfaces, sediments, and ice, which are then transported to floodplains during subsequent flooding or rain events. We term this latter process as aeolian recycling of fine sediments.
Frequently, layers of former top sediments were buried beneath fluviatile sediments. Flood events led to the inundation of unpaved roads towards the moraine typically in the midday to late afternoon hours. Conversely, when insolation and temperature markedly decreased, these flooding episodes were reduced. Low wind speeds facilitated the preservation of surface sediments, which were subsequently covered by flood deposits during days of minimal water flow, preventing erosion of the now-buried top layers. During the sunny August days, a recurring cycle often ensued: midday to late afternoon flooding followed by drying and dust emission the following day (Fig. 3). However, instances of reduced drying due to rain or diminished insolation inhibited dust emission on subsequent days (Fig. 3). Additionally, if flooding intensity peaked on a particular day, insufficient drying prevented dust emission the following day.
After the Holuhraun lava field, the mean median diameter of top sediments increases again peaking at 47 µm for FDPSD and 41 µm for MDPSD, owing to sediment input from tributary channels of the Jökulsá river (Fig. 5). The water accumulated in this natural dam gradually permeates through the rocks and sediments and subsequently flows through the Holuhraun lava field. These processes lead to sediment removal from the water. This filtered water continues its course until it connects with tributary channels and the segment of the Jökulsá á Fjöllum river that encircles the lava field. At this juncture, these sediment-laden channels merge with clearer waters originating from the lava field post-filtration. Moreover, beyond the lava field, the channels are typically incised, and flooding events are infrequent. The deepening of fluvial channels due to erosion renders the floodplains incapable of inundation. Consequently, there are no floodplains with surface sediments available for sampling, and the spatial prevalence of fine-grained top sediments along this stretch, on the way to the sea, is rare. This reduction in fine sediment cover significantly diminishes the potential for dust emissions. Subsequently, near the sea, the diameter decreases again, reaching 29 µm for FDPSD and 27 µm for MDPSD (Fig. 5). There, sediment deposition leads to extensive mudflats adorned with top sediments, where emission becomes more likely once again if conditions are favourable. For fluvial sediments and ripples there are not enough samples, and the decreasing trend was not observed.
The analysis revealed consistent findings between MDPSD and FDPSD for samples exhibiting relatively fine mean median diameters. However, we note that the MDPSD showed finer particles than FDPSD in samples with finer mean diameters (Fig. 5). This discrepancy is likely attributable to the presence of pumice particles. Pumice, characterised by its fragility and low density, is common across Iceland, forming layers several centimetres thick, as observed in Dyngjuvatn. These particles, with sizes ranging from a few micrometres to approximately 65 µm, are buoyant in water and easily fragmented. This poses a challenge during FDPSD wet analysis, as these water-buoyant particles evade capture within the measurement chamber, because a homogeneous particle dispersion is required. Consequently, FDPSD measurements tend to underestimate the presence of finer pumice particles, resulting in a coarser PSD. Conversely, MDPSD measurements, conducted in dry conditions, circumvent this issue by accurately detecting finer pumice particles. Thus, MDPSD yields a finer median diameter, reflecting the inclusion of these smaller particles in the analysis.
Close to the moraine the energy of the fluviatile system is so high that the pumice particles are transported far from the ice-thawing areas. When flooding occurs in the lowlands fluviatile suspended particles are deposited first and the buoyant pumice particles only when ponded waters percolate and or dry. This leads to a segregation of pumice particles, with a progressive enrichment downstream of the fluviatile system and in ponded lowlands. Furthermore, these processes lead to an enrichment of pumice in the surface of the ponded areas, and this favours dust emissions of fine and light particles.
However, top sediments near the glacier are more consolidated because in this high-water energy environment the outcrops of fine top sediment layers are the ones exposed by erosion of the old sedimentary sequences composed of a conglomerate in the base, sandy sediments in the middle part, and fine ones in the top, but not from the recent flooding. These older top sediments are much more consolidated and, as shown by Fig. 5, the averaged mean diameters of the MDPSD are much coarser than those of the FDPSD.
3.2.2 Particle size distribution at different Icelandic dust hotspots
The median FDPSDs of top sediments found in most Iceland's dust-emitting regions (Dyngjusandur, Skaftarsandur, Landeyjarsandur, and Mælifellsandur) closely resemble the MDPSDs (Fig. 6). This underscores the limited degree of particle aggregation in these areas. However, in the cases of Dyngjuvatn, Mýrdalssandur, and Hagavatn the FDPSDs and MDPSDs of top sediments differ slightly (Fig. 6).
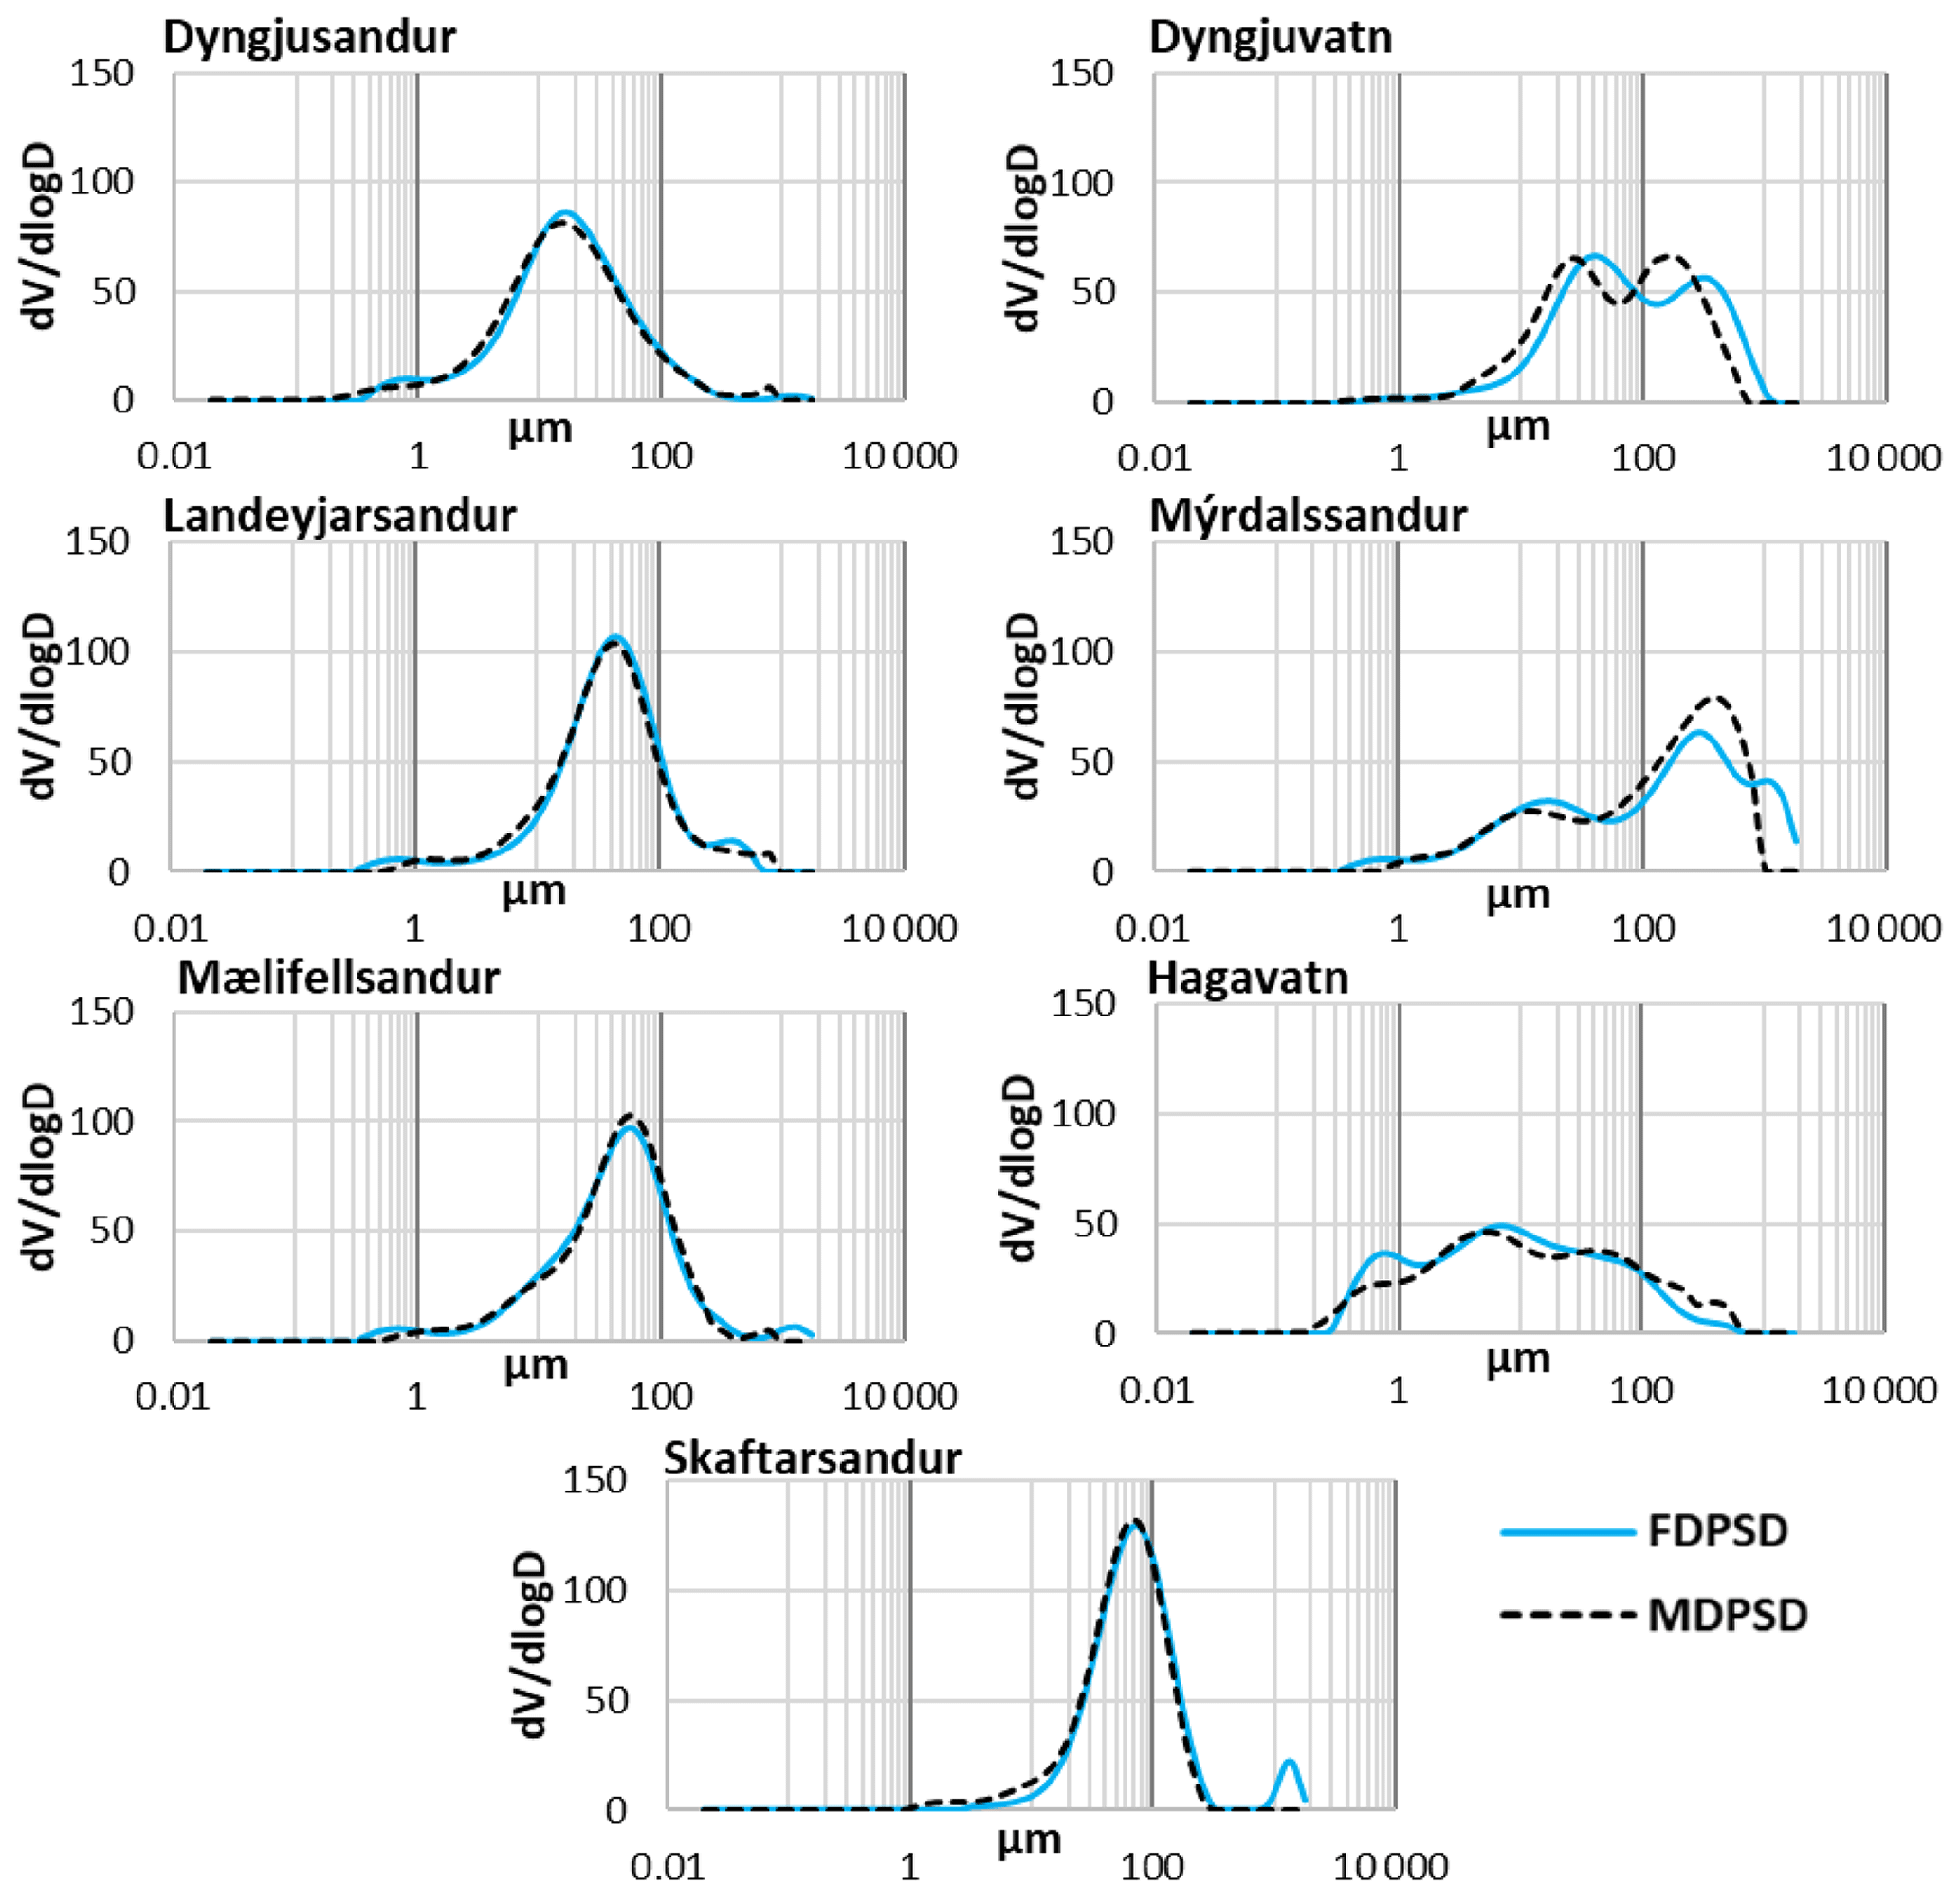
Figure 6Particle size distributions of top sediment samples from different dust-emitting hotspots in Iceland as determined by MDPSD and FDPSD.
The mean median diameter of both the FDPSD and MDPSD for the 23 top sediments sampled across Iceland is 56 ± 69 µm [2.9, 263, min, max] and 55 ± 62 µm [3.3, 234], respectively. Notably, top sediments from Mýrdalssandur and Dyngjuvatn exhibit coarser mean median diameters, measuring 147 ± 108 and 146 ± 156 µm for FDPSD and 163 ± 92 and 100 ± 105 µm for MDPSD, respectively. These diameters are more than 2 times coarser than the overall Iceland mean median diameter (Table 1). Conversely, Skaftarsandur, Mælifellsandur, and Landeyjarsandur show mean median diameters that are similar those of the average top sediments in Iceland (Table 1). On the other hand, the top sediments from Dyngjusandur and Hagavatn (the largest dust hotspots associated with ephemeral lakes) exhibit the finest mean median diameters, specifically 24 ± 15 and 16 ± 12 µm for FDPSD and 24 ± 1 and 26 ± 26 µm for MDPSD, respectively. These diameters are approximately 2 times finer than the average of top sediments in Iceland (Table 1).
Our results show a general lack of cohesion in the dust-emitting top sediments of Iceland sources, as evidenced by the similar FDPSD and MDPSD results. As discussed in Sects. 4 and 5, this suggests that in addition to saltation, aerodynamic entrainment of dust without saltation as an intermediate process is likely a complementary dust emission process in Iceland due to reduced cohesive forces.
3.3 Mineralogy
3.3.1 Mineralogy of sediments at the Jökulsá á Fjöllum basin
Different sediments and locations of the Jökulsá á Fjöllum basin were analysed to describe the variability in the region and therefore explain probable mineralogic fingerprints important for dust emission models. The results show that amorphous phase is the prevailing component of the samples analysed (79 ± 11 wt %), being most probably volcanic glass and its nano-sized weathering product (hydrated amorphous Si-bearing). Also showed are anorthite (11 ± 6.6 %, a Ca plagioclase, [Ca0.95–1Na0.05–0]Al2Si2O8), augite (7.7 ± 5.4 %, a pyroxene, [CaxMgyFez][Mgy1Fez1]Si2O6), andesine (1.7 ± 5.9 %, a plagioclase, [Na0.5–0.7Ca0.5–0.3]Al2Si2O8), analcime (0.19 ± 0.36 %, a Na zeolite probably formed from the devitrification of volcanic glass during weathering, Na[AlSi2O6]•H2O), magnetite (< 0.5 %, Fe2O4) and Ca mordenite (< 0.1 %, a Ca zeolite, Ca4[Al8Si40]O96•28H2O) (Fig. 7, Table S2).
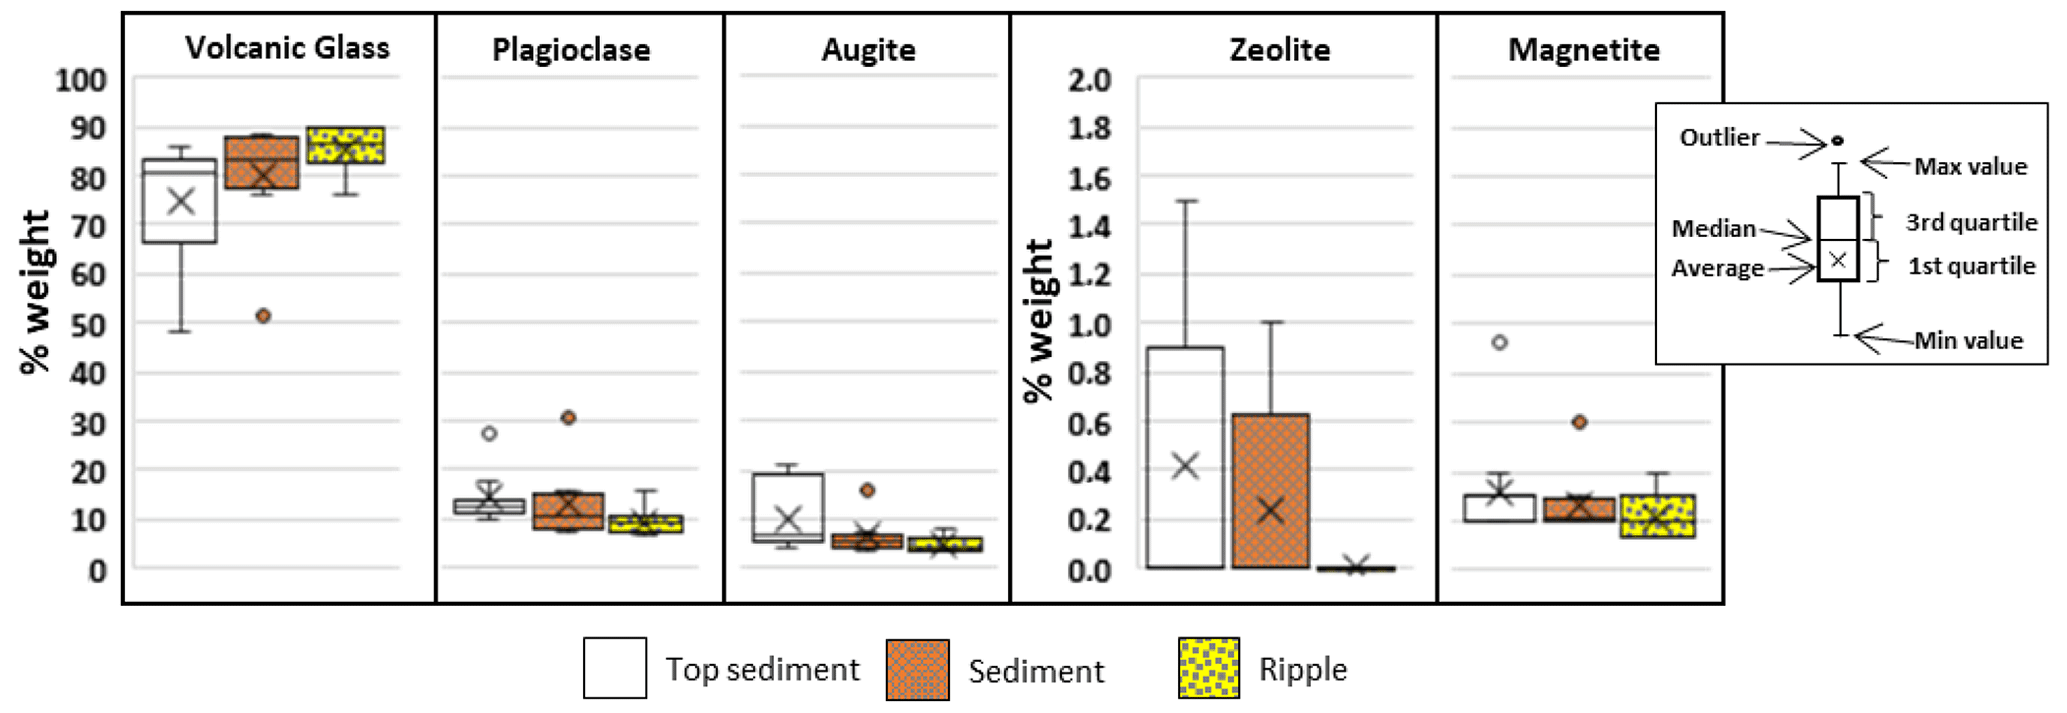
Figure 7Contents of volcanic glass and crystalline minerals in top sediments (n = 15), underlying fluvial sediments (n = 8), and aeolian ripples (n = 8) from the Jökulsá á Fjöllum basin.
The average composition of the top sediment samples comprises approximately 75 ± 12 % volcanic glass, 11 ± 7.4 % anorthite, 9.9 ± 6.4 % augite, and 3.6 ± 8.1 % andesine, along with trace amounts of 0.26 ± 0.40 % analcime, 0.16 ± 0.34 % Ca mordenite, and < 0.5 % magnetite. Fluvial sediments and aeolian ripples have similar (or slightly higher) contents of amorphous phases (80 ± 12 and 86 ± 4.7 %, respectively), augite (6.6 ± 4.0 % and 4.8 ± 1.7 %), and magnetite (< 0.5 % and < 0.5 %). Anorthite is enriched in fluvial sediments and aeolian ripples compared to top sediments (13 ± 7.7 % and 9.6 ± 2.9 %, respectively) and also analcime for the underlying fluvial sediments (0.23 ± 0.43 %), with andesine and Ca mordenite contents being below the XRD detection limits in both the underlying fluvial sediments and aeolian ripples (Fig. 7, Table S2). The slight enrichment of fluvial sediments and aeolian ripples in amorphous phases and the slight depletion in augite is likely due to the coarser particle size and the prevalence of relatively large particles of high glass basalt with fine inclusions of crystalline minerals. As these coarser particles break down into finer particles, the occurrence of particles made of the crystalline inclusions might increase. Thus, the finer top sediments might be slightly enriched in these crystalline fine minerals (and slightly depleted in glass) in comparison to the coarser underlying fluvial sediments and aeolian ripples.
The mineral composition of fluvial sediments is very homogeneous across the Jökulsá á Fjöllum basin; however slight differences were observed for top sediment samples before and after the natural dam of the Holuhraun lava field (Fig. S3, Table S2). Before the natural dam, top sediments are enriched in amorphous phases or volcanic glass relative to those between the Holuhraun lava field and the sea (82 ± 2.2 % and 60 ± 9.5 %, respectively). Furthermore, after the Holuhraun field, andesine and traces of Ca mordenite and hematite are detected (11 ± 11 %, 0.48 ± 0.46 %, and < 0.5 %, respectively). For fluvial sediments we observe similar trends with volcanic glass or amorphous phase enrichment before the Holuhraun lava field (85 ± 2.9 % and 51 ± 18 %) and minerals such as andesine (16 ± 18 %), forsterite (Mg2SiO4) (2.8 %, 1 sample), and analcime (0.25 %, 1 sample) being detected only after the Holuhraun lava field (Table S2). No trends were found for ripples due to a lack of samples after the Holuhraun lava field. These differences are probably due to the different source areas for pre- and post-Holuhraun lava field samples.

Figure 8Reflectance spectra measured of surfaces in the field: (a) ripples in Iceland, (b) top sediments in Iceland, and (c) example spectra from Morocco. In (a) and (b), spectra are offset for clarity and are ordered by distance from the glacier.
Reflectance spectra of aeolian ripples (Fig. 8a) have broad electronic transitions due to Fe2+ with a minimum at ∼ 1.05 µm. Most spectra also have an inflection indicating a second electronic transition of Fe2+ at ∼ 2 µm (e.g. Burns, 1993). These spectra also have vibrational absorption features, with combination bands of H2O at 1.91 µm and Si–OH and/or Al–OH at 2.2 µ m (e.g. Clark et al., 1990). Overall, spectra are consistent with volcanic glass (Bell et al., 1976; Horgan et al., 2014) with possible minor contributions of pyroxene (e.g. Cloutis and Gaffey, 1991) and weak hydration, likely mostly from a hydrated amorphous silica product such as hydrated basaltic glass, allophane, imogolite, or opal (e.g. Anderson and Wickersheim, 1964; Goryniuk et al., 2004; Rampe et al., 2012).
Spectra of top sediments are more variable (Fig. 8b). All have broad Fe2+ electronic transitions centred at 1.00–1.05 µm likely due to volcanic glass and pyroxene, as in the aeolian ripples. Most lack an electronic transition near 2.0 µm, although one sample from a floodplain appears to have a weak feature. All spectra have H2O combinations at 1.91 µm, and most have OH overtones at 1.41–1.44 µm (e.g. Clark et al., 1990). Other than from a few places on the moraine, all top sediment spectra also have narrower features at 2.20–2.22 µm, which are combination bands of Si–OH and/or Al–OH (e.g. Clark et al., 1990). One spectrum (#21) also has a weaker Fe(III)–OH combination band at 2.29 µm, seen in hydroxylated Fe-bearing minerals such as Fe smectite clay or ferrihydrite (e.g. Bishop et al., 2008). Spectra from three sites on the moraine have broader, deeper 1.4 and 1.9 µm features, indicating that the soil was wetter than in other sampled sites.

Figure 9Imaging spectrometer data from AVIRIS and analysed with Tetracorder (Clark et al., 2003, 2024). (a) Grey scale image of three AVIRIS flight lines mosaicked for this study. The white circle is the primary study area, and the grey rectangle is secondary sampling. Red dots are top sediments, blue dots sediment and yellow dots aeolian ripples. (b) Pyroxene composition map. The pyroxene dominant in the region is clinopyroxenes. (c) Olivine composition map, which indicates the olivines have high iron content. However, areas of significant Fe2+-bearing volcanic glass could bias this result. (d) Fe2+-bearing minerals, which in this area is probably mostly due to volcanic glass. Note that few locations mapped any Fe3+-bearing minerals. (e) Map of eight minerals with absorptions in the 2–2.5 µm spectral region. Only trace calcite and outcrops of chlorite/serpentine were found. (f) Tetracorder map of water and significant water-bearing sediments. Where strong water absorptions are seen, detection of other minerals is difficult and usually blank in panels (b)–(e).
AVIRIS imaging spectroscopy data from the glacier to Holuhraun lava field show the presence of water in the sediments (absorption features between 1 to 1.5 µm), with clinopyroxene presence (absorption features at 2 µm band), olivine, and Fe2+-bearing minerals, some of which may be Fe2+ in the volcanic glass. These results are aligned with mineralogy from XRD and in situ reflectance spectra (Fig. 9). In the main study areas, at AVIRIS scale, there are only trace to small local outcrops of minerals as hematite, goethite, calcite, dolomite, chlorite/serpentine, gypsum, illite, muscovite, montmorillonite, and vermiculite (Green et al., 2020). Some trace calcite is seen in Fig. 9 and local outcrops of chlorite/serpentine. The strong signatures of Fe2+-bearing minerals in the dark soils and rocks make it difficult to detect hematite and goethite unless the concentration is high enough for the Fe3+ absorptions to be stronger than Fe2+ absorptions.
3.3.2 Mineralogy of sediments from different Icelandic dust-emitting hotspots
The average composition of the top sediments from the Iceland's dust-emitting hotspots is also dominated by volcanic glass or amorphous phases (68 ± 26 wt %), followed by anorthite, augite, and andesine (15 ± 11 % and 8.6 ± 9.0 % and 7.4 ± 19 %), Fe diopside (1.4 ± 3.4 %, a pyroxene with a > 50 % MgSiO3 and 45 %–50 % CaSiO3 composition), and traces of quartz (0.21 ± 0.47 %), forsterite (0.61 ± 1.7 %), wairakite (0.19 ± 0.92 %), analcime (0.11 ± 0.28 %), Ca mordenite (< 0.1 %), magnetite and hematite (< 0.5 % and < 0.5 %), and pyrite (FeS2 < 0.5 %) (Fig. 10, Table S3).
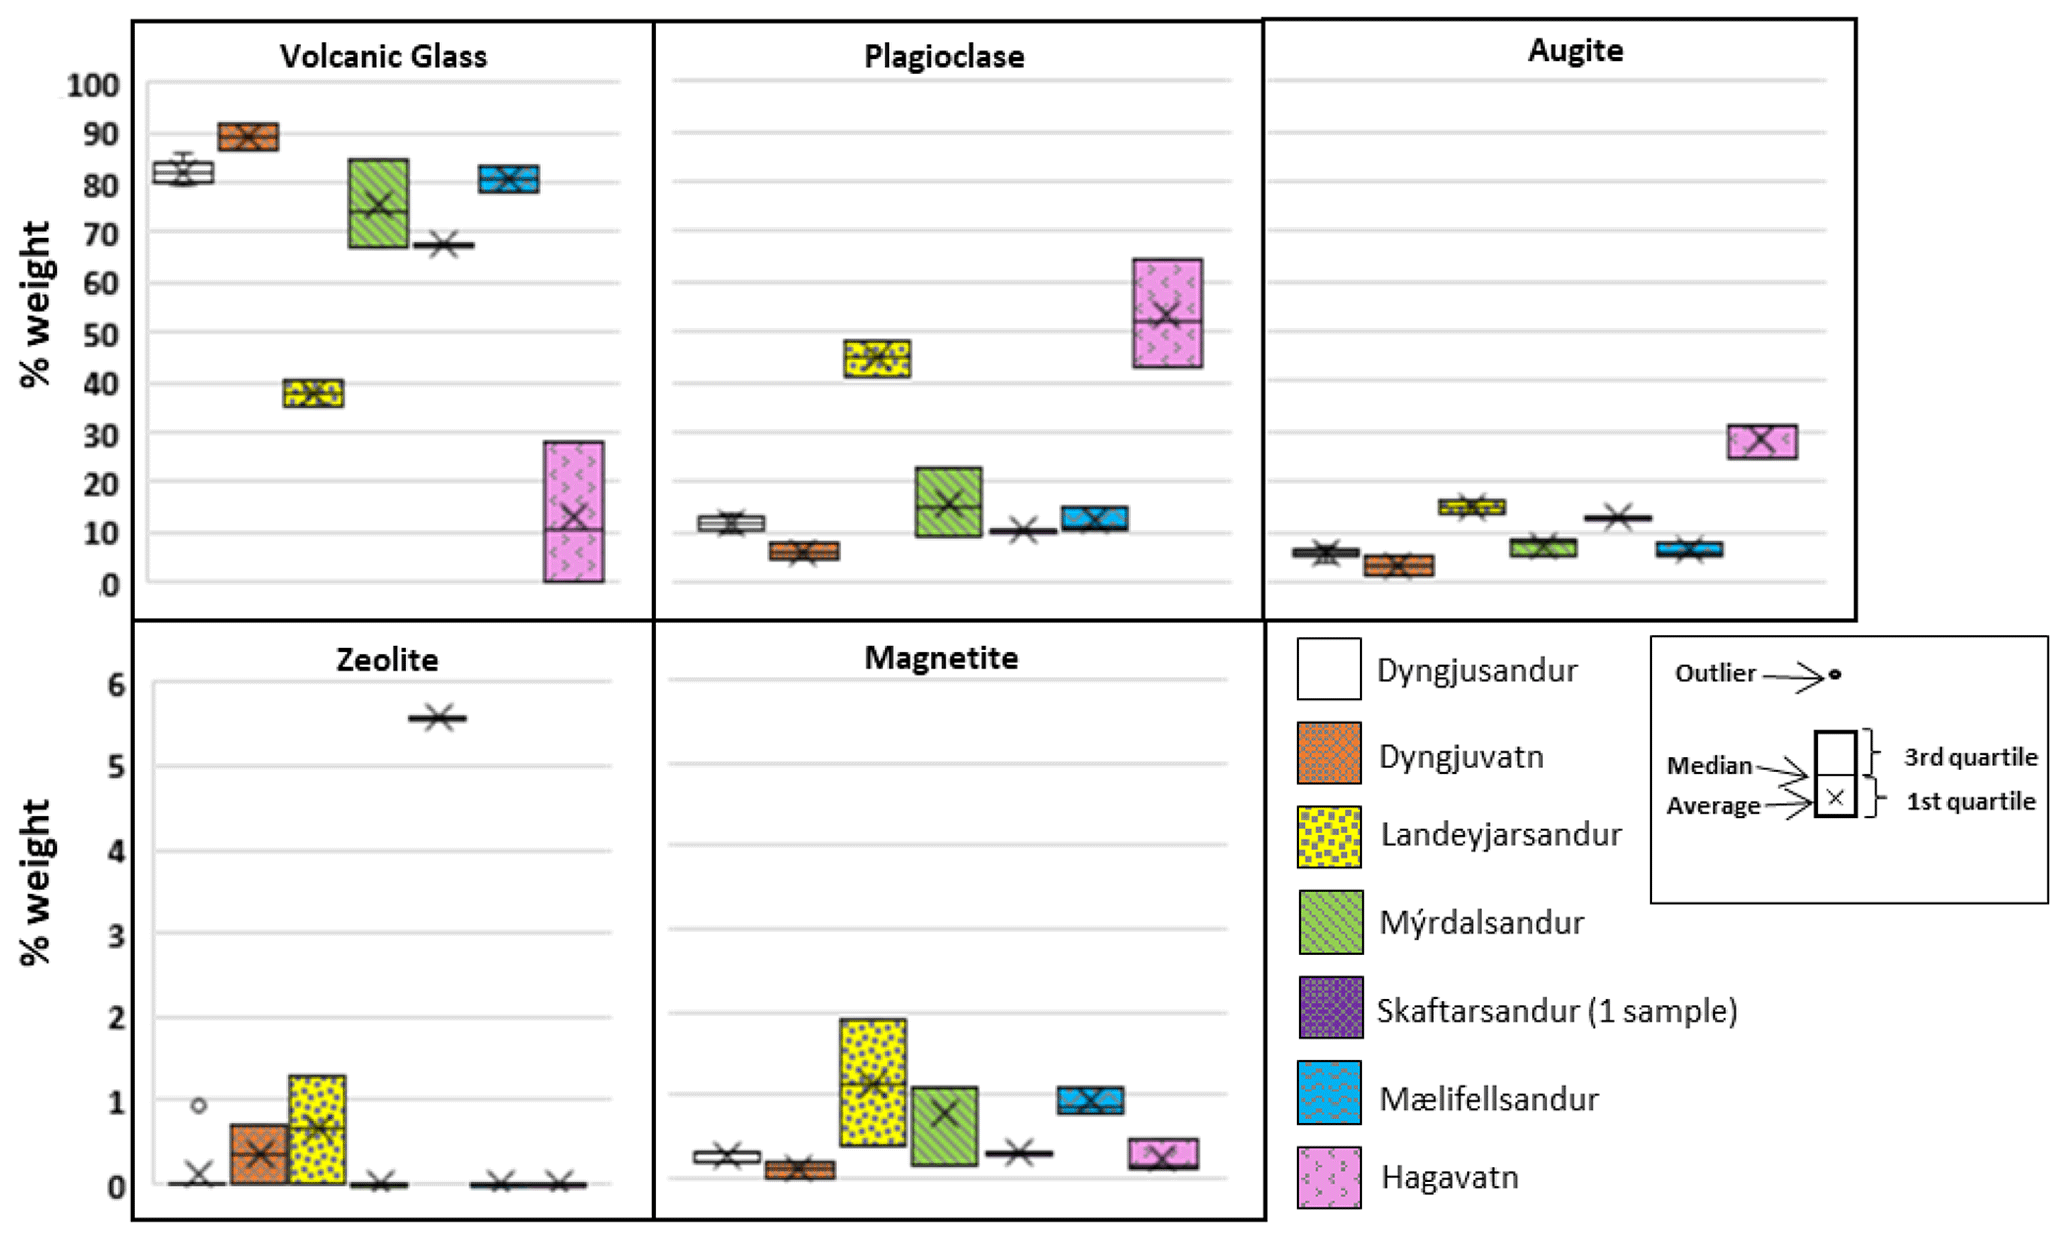
Figure 10Contents of volcanic glass and crystalline minerals in top sediments, underlying fluvial sediments, and aeolian ripples from different dust-emitting hotspots. Dyn: Dyngjusandur, Dvt: Dyngjuvatn, Lan: Landeyjarsandur, Mýr: Mýrdalssandur, Ska: Skaftarsandur, Mæl: Mælifellsandur, Hgv: Hagavatn.
Volcanic glass or amorphous phase content is higher at Dyngjuvatn, where top sediments are enriched in pumice, with a contribution of 89 ± 3.8 %, followed by 82 ± 2.3 % at Dyngjusandur, 81 ± 2.8 % at Mælifellsandur, 75 ± 8.9 % at Mýrdalssandur, 68 % (1 sample) at Skaftarsandur, and 38 ± 3.9 % at Landeyjarsandur (Fig. 10, Table S3). At Hagavatn, however, the glass content reached only 13 ± 14 %, with the mineralogy being dominated by andesine (53 ± 11 %) and augite (29 ± 3.8 %), with minor proportions of forsterite (4.7 ± 1.3 %), hematite (< 0.5 %), and magnetite (< 0.5 %) (Fig. 10, Table S3). Thus, in this case, the very high content of crystalline phases indicates a sediment originating from a slowly cooled lava allowing a widespread crystallisation of minerals from the melt.
A very similar mineral composition was found among top sediments from Mælifellsandur, Dyngjusandur, Skaftarsandur, and Mýrdalssandur, where the main content was amorphous phases like volcanic glass with some plagioclase and pyroxene species (Fig. 10, Table S3). The highest content of volcanic glass was found at Dyngjuvatn and the lowest content at Hagavatn. The occurrence of magnetite was higher at Landeyjarsandur, Mælifellsandur, and Mýrdalssandur than in other dust-emitting hotspots, according to XRD analysis. As seen in Sect. 3.1.2, Hagavatn's and Dyngjusandur's top sediments have the smallest particle size, coinciding with the lowest volcanic glass content, in the first case, but quite high in the second. Meanwhile Dyngjuvatn's (pumice-rich) top sediments have the coarser particle size and the highest volcanic glass content. Mælifellsandur's and Mýrdalssandur's top sediments have similar mineral composition, but those of Mýrdalssandur are coarser (near the river mouth) in particle size compared to Mælifellsandur (upstream near the glacier). Landeyjarsandur's top sediments are similar in particle size to the ones from Mælifellsandur, but with half of the volcanic glass, and therefore with more plagioclase and pyroxene.
Compared to Baldo et al. (2020), who analysed PM10 mineralogy sampled in laboratory resuspension of Icelandic sediments, samples for the current study are very similar for Hagavatn, Mælifellsandur, and Dyngjusandur. Meanwhile for Landeyjarsandur and Mýrdalssandur, the present results are lower for volcanic glass and so higher for pyroxene and plagioclase. Baratoux et al. (2011) found a similar mineral composition of sediments from aeolian ripples at Dyngjusandur, with predominance of volcanic glass (80 %–90 %). Moroni et al. (2018) found that the mineral composition of glaciofluvial sediments was dominantly volcanic glass in Dyngjusandur, Mýrdalssandur, and Mælifellsandur, with lower proportions of plagioclase and pyroxene.
3.4 Mode of occurrence of Fe
3.4.1 Mode of occurrence of Fe at Jökulsá á Fjöllum basin
Iron speciation in dust-emitting sediments and surfaces controls the amount of iron in the emitted dust and therefore the effect in ocean and terrestrial ecosystems and climate. The average of FeT content in the dust-emitting sediments of the Jökulsá á Fjöllum basin is 9.5 ± 0.40 wt % (Table S4). Top sediments, underlying fluvial sediments, and aeolian ripples exhibit similar average FeT contents with values of 9.5 ± 0.39 %, 9.5 ± 0.43 %, and 9.4 ± 0.41 %, respectively (Fig. 11, Table S4). FeS, which represents structural Fe found in volcanic glass and certain Fe-bearing crystalline species, constitutes the majority of FeT content, accounting for 80 ± 6.3 %. This is followed by smaller proportions of FeM (magnetite) at 16 ± 5.5 %, FeD (hematite/goethite) at 2.6 ± 1.6 %, and FeA (readily exchangeable Fe) at 1.2 ± 0.40 % (Fig. 11, Table S4). It is worth noting that these proportions are quite consistent across top sediments, fluvial sediments, and aeolian ripples, with FeS, FeM, FeD, and FeA percentages of 79 ± 6.5 %, 16 ± 5.4 %, 3.5 ± 1.5 %, and 1.3 ± 0.39 % in the top sediments. In fluvial sediments, these values are 82 ± 8.7 %, 15 ± 7.8 %, 2.2 ± 1.4 %, and 1.2 ± 0.44 %, and in aeolian ripples, they are 80 ± 2.4 %, 18 ± 2.4 %, 1.2 ± 0.41 %, and 0.85 ± 0.22 % respectively (Fig. 11, Table S4). Notably, there is a difference in magnetite proportions between fluvial sediments from the pre-Holuhraun lava field and those from the post-Holuhraun, with FeM accounting for 19 ± 4.5 % and 11 ± 1.3 % of total Fe, respectively. This variation results in a reverse scenario for FeS, with percentages of 77 ± 6.4 % and 84 ± 1.9 %, respectively (Fig. 11, Table S4).
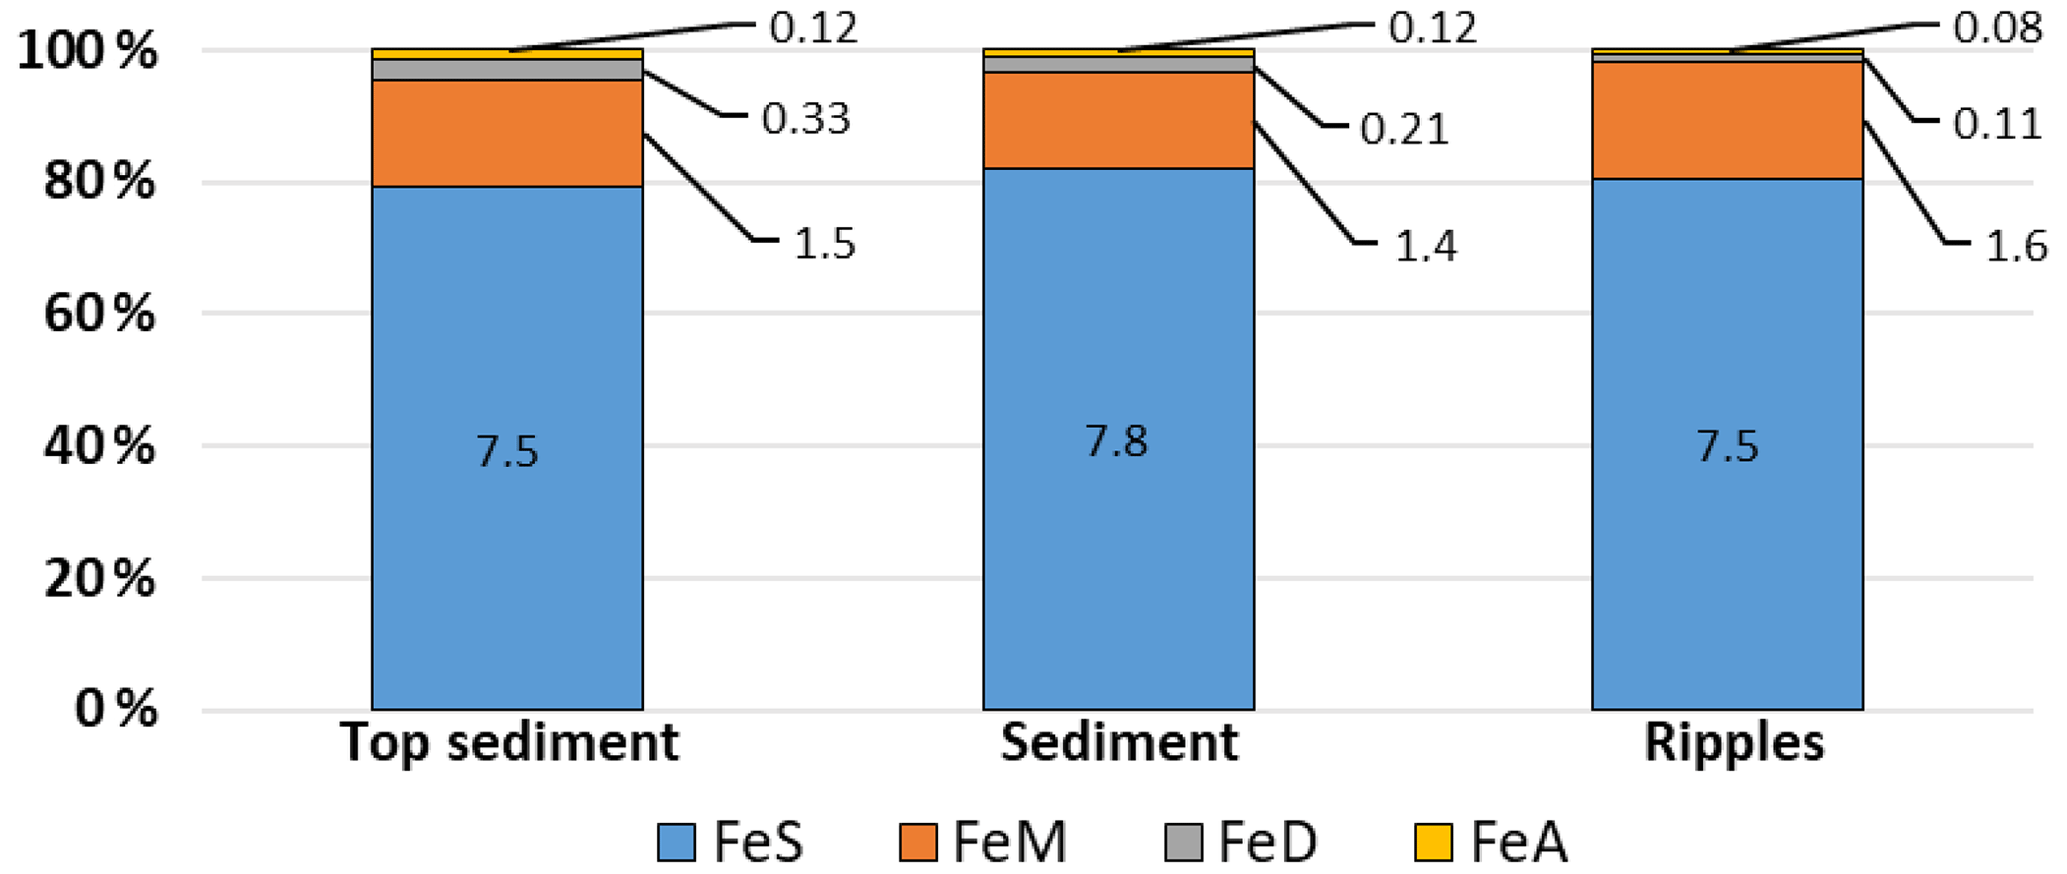
Figure 11Average percentage of FeS, FeM, FeD, and FeA with respect to total Fe content for the Jökulsá á Fjöllum basin in bars (y axis) for top sediments, sediments, and ripples. The respective amounts are also indicated in terms of mg g−1, where the denominator refers to grams of sediment.
3.4.2 Mode of occurrence of Fe at different Icelandic dust-emitting hotspots
The content of FeT and proportions of FeS, FeA, FeD, and FeM in sediments from Iceland's dust-emitting hotspots are summarised in Table S5 and Fig. 12.
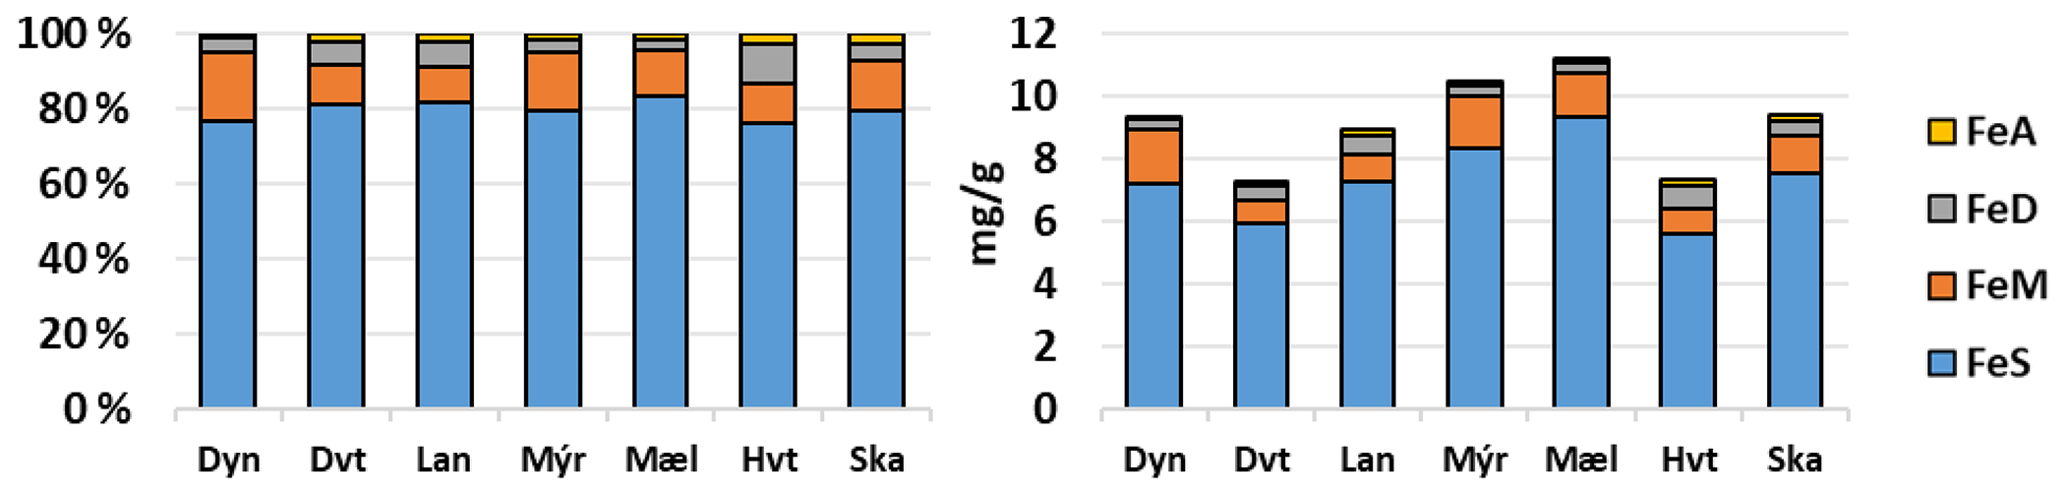
Figure 12Average percentage of FeS, FeM, FeD, and FeA for Dyngjusandur (Dyn), Dyngjuvatn (Dvt), Landeyjarsandur (Lan), Mýrdalssandur (Mýr), Mælifellsandur (Mæl), Hagavatn (Hvt), and Skaftarsandur (Ska) and average amount of each Fe mode of occurrence according to the total content of Fe of the same dust emitting sources.
The average FeT content in Iceland's top sediments is 9.3 ± 1.5 %, with the highest concentrations observed in Mælifellsandur and Mýrdalssandur, ranging from 10.0 wt % to 11.6 wt %, while the lowest are found at Hagavatn and Dyngjuvatn, ranging from 5.5 wt % to 9.1 wt %. On average, FeS accounts for 79 ± 5.4 % of the FeT, with minimum proportions of 65 % in one sample from Dyngjusandur and a maximum of 89 % in one from Mælifellsandur. However, most samples are in the range of 75 %–80 %.
FeM constitutes 15 ± 4.6 % of FeT, with minimum proportions of 7.2 % in one sample from Landeyjarsandur and a maximum of 25 % in one from Dyngjusandur, but most samples fall within the 10 %–20 % range, with the highest proportions typically exceeding 20 % in Dyngjusandur. FeD accounts for 5.0 ± 3.1 % of FeT, with minimum proportions of 1.4 % in one sample from Dyngjusandur and a maximum of 12 % in one from Hagavatn, but most samples fall within the 2 %–9 % range. FeA represents only 1.6 ± 0.74 % of FeT, with minimum proportions of 0.75 % in one sample from Dyngjusandur and a maximum of 3.4 % in one from Hagavatn, but the majority of samples fall within the 1 %–2 % range.
The absolute contents of magnetite and hematite/goethite are quite low in the samples, making XRD quantitative analysis uncertain. Consequently, the correlation with FeM and FeD is weak. This highlights the importance of employing the chemical sequential extraction (Shi et al., 2009) to assess the mode of occurrence of Fe and further constrain the mineral content of iron oxides. As mentioned in previous sections (Sect. 3.1.2 and 3.2.2), Dyngjusandur and Hagavatn have similar mean median particle size but different volcanic glass content. The content of FeS is similar between them, but on the other hand, Hagavatn has higher proportions of FeA and FeD than FeM, and Dyngjusandur has a higher proportion of FeM than FeA and FeD. Nevertheless, no correlation was found between mineralogy (from XRD) and Fe speciation.
3.5 Spectroscopic indicators of mineral sorting
Consistent with the PSD and mineralogical analyses, spectra acquired in situ of top sediments and ripples also show systematic variations with distance from their source (Fig. 13). Aeolian ripples, composed of ∼ 100 µm sized grains weathered out of recent lava flows, were generally measured on or near the lavas from which they are sourced and are coarser grained than top sediments. Thus, their spectra are dominated by primary volcanic phases, including volcanic glass and pyroxene, with minor alteration, either by magmatic fluids (hydrating the volcanic glass) or later alteration. Their spectra are dark (low albedo), have weaker H2O combination bands at 1.91 µm, and have stronger Fe2+ electronic transitions near 1 and 2 µm than most top sediments. Interestingly, the depth of the absorption features around 2.21 µm is slightly stronger in these samples and most likely is from a hydrated amorphous silica phase (Fig. 13c). These samples unsurprisingly show no systematic trends with distance from the glacier.
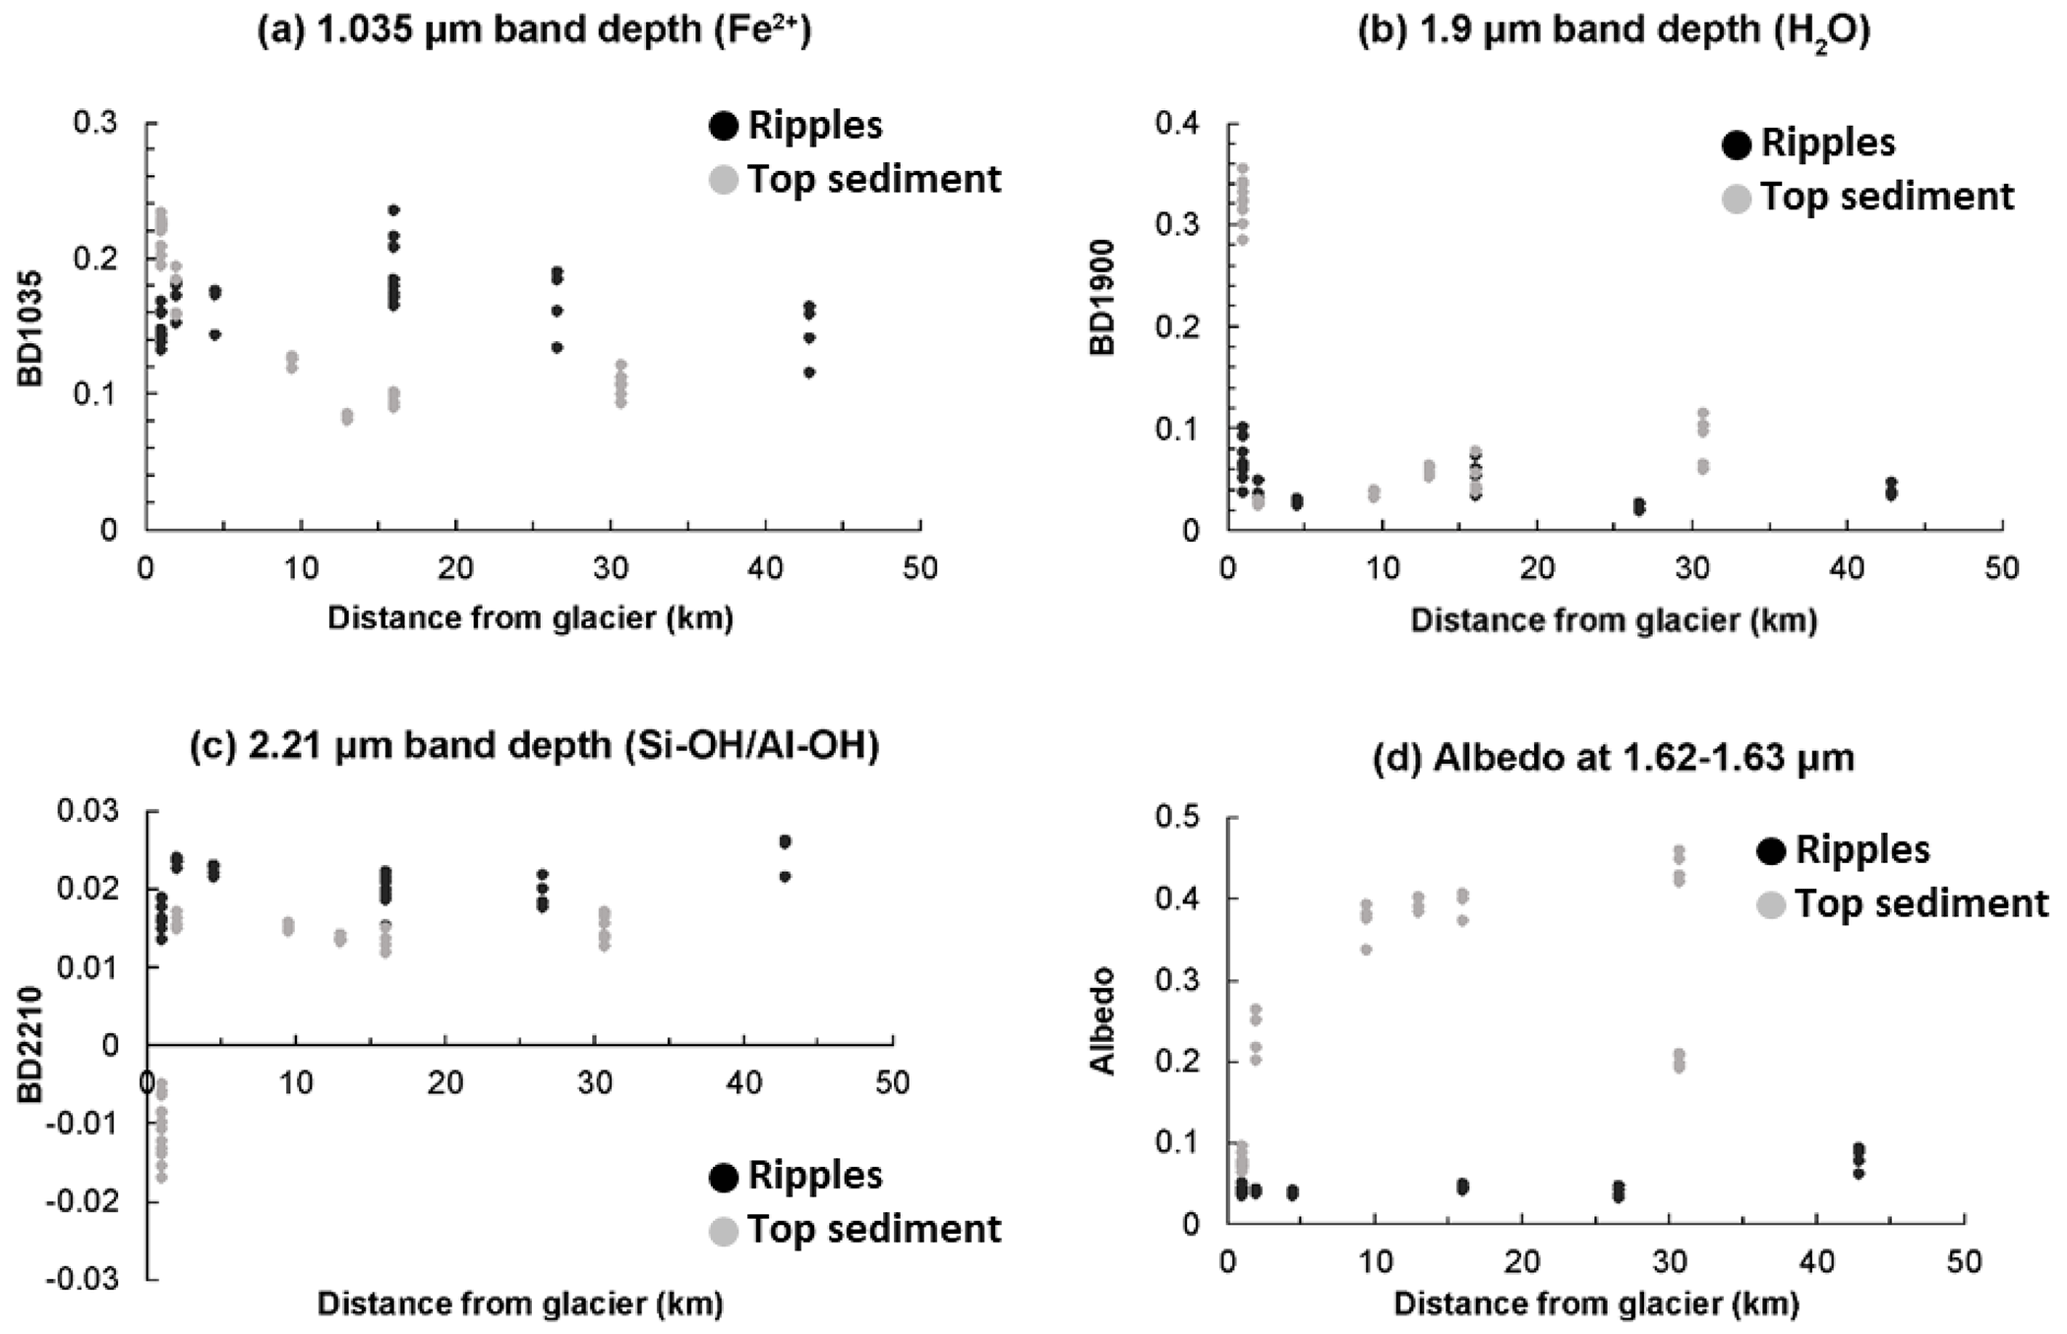
Figure 13Trends in infrared spectral features with distance from the glacier. (a) The depth of a broad absorption feature at 1.035 µm (BD1035) due to Fe2+ in volcanic glass and/or pyroxene. (b) The depth of an absorption feature at 1.9 µm (BD1900) due to H2O. (c) The depth of an absorption feature at 2.21 µm (BD2210) due to Si–OH or Al–OH. (d) The albedo (brightness), calculated as the mean reflectance at 1.62–1.63 µm. Black points are spectra of ripples, and grey points are spectra of top sediments.
Top sediments, on the other hand, show stronger trends with distance from the glacier (Fig. 13). The albedo, measured as the mean from 1.62–1.63 µm, is brighter with increasing distance (Fig. 13d). This may be due to a change in mineralogy from primary volcanic glass, olivine, and pyroxene to brighter alteration products, including zeolites and phyllosilicate minerals, or due to decreasing particle size, as volume scattering is enhanced with smaller grains. More likely, it is a combination of both factors. With the exception of locations on the moraine that were wetter at the surface, the depth of the absorption features due to H2O at 1.91 µm increases with distance from the glacier (Fig. 13b). Conversely, the depth of the ≈ 1 µm Fe2+ electronic transition decreases (Fig. 13a). As discussed in Sect. 3.2.1, these variations are most likely the result of mechanical sorting, with finer-grained hydrated, altered phases becoming dominant downstream relative to coarser, unaltered volcanic glass.
The loss of volcanic glass and potentially amorphous hydrated silica within top sediments is also supported by closer examination of the spectra. In spectra of some top sediments, the ≈ 1.0 µm Fe2+ electronic transition minimum shifts to slightly shorter wavelengths (≈ 1.03 µm in top sediments vs. 1.05 µm in ripples), and a secondary electronic feature at ≈ 1.2 µm is typically weaker or absent. These shifts are consistent with the proportion of pyroxene to volcanic glass increasing (Horgan et al., 2014). In addition, the ≈ 2.2 µm combination feature shifts from 2.22–2.25 µm in the ripples to 2.21 µm in some top sediment samples. The longer wavelength minima and broader features are more typical of hydrated amorphous silica (e.g. opal), whereas the shorter wavelength minima suggest the presence of a more ordered phase with Al–OH bonds.
3.6 Contrasts between Icelandic hotspots and a typical hot desert dust hotspot
Our findings reveal significant differences between sediments from the Moroccan Sahara (as described in Gonzalez-Romero et al., 2023) and those collected and analysed in Iceland. It is important to note that the Moroccan samples used for comparison were obtained from the Lower Drâa Valley, an arid inland drainage basin and a prominent dust hotspot, which is broadly representative of numerous crustal dust source areas in hot desert environments.
The differences in sediment composition are closely intertwined with the particle size distribution and aggregation/cohesion characteristics of these sediments. For instance, when we examine the mean median diameters of the FDPSD and MDPSD for top sediments collected from the lowlands and the ephemeral lakes of Iceland (Dyngjusandur), we observe a relatively close similarity in sizes (31 and 32 µm, respectively) (as detailed in Table 1). In contrast, crusts from the lowlands in the Saharan source exhibit markedly different mean median diameters (7 and 131 µm, as reported by González-Romero et al., 2023) (Table 1). Therefore, the FDPSD mean diameters for just crusts in the lowlands of the Saharan source are 4 times finer than those found in top sediments in Iceland. For the underlying fluvial sediments, we found that the MDPSD median diameters are 1.5 times coarser in the Saharan source in comparison to Iceland (115 and 74 µm, respectively). In contrast, for the FDPSD the mean median diameter is finer in the Saharan source than in Iceland (22 and 102 µm, respectively).
The resemblance between the FDPSD and MDPSD of top sediments in Dyngjusandur and the significant disparity with those from the Sahara are attributed to the varying levels of aggregation and cohesion. These differences in aggregation are further substantiated by SEM observations (as shown in Fig. 14a and b). They are likely a consequence of the paucity of cementing minerals in the Iceland top sediments, namely low levels of carbonate and sulfate content, as well as the absence of clay minerals. These factors contribute to the prevalence of dispersed and non-cohesive sediments in Iceland. The underlying fluvial sediments, which consist mainly of coarse particles, primarily individual granules derived from volcanic rock (as depicted in Fig. 14c), also stand in contrast to the Sahara's dust-emitting sediments, which often exhibit particle aggregation. Notably distinct were Iceland's dust-emitting top sediments that showed a high enrichment of pumice, an exceedingly fragile and low-density volcanic rock, as seen in the Dyngjuvatn samples. In these cases, the particles often displayed elongated shapes and were accompanied by aggregation of finer particles (refer to Fig. 14d, e, and f). This distinctive characteristic led to a measurement artifact that resulted in unusually coarser FDPSD readings compared to MDPSD.

Figure 14SEM microphotographs of collected dust samples: (a) particles of a top sediment sample from Dyngjusandur showing dispersed particles. (b) Particles of a top sediment sample from the lowlands of M'Hamid, Morocco (see González-Romero et al., 2023), showing finer particle size and a high degree of agglomeration. (c) Particles from underlying fluvial sediments, from Dyngjusandur, showing a large particle size and fresh volcanic glassy material. (d, e, f) Samples of top sediments (d, e) from Dyngjuvatn, showing abundant elongated particles and agglomerates of particles derived from the breaking of larger pumice particles. (g) Image showing particles with magnetite inclusions.
The lack of aggregation and cohesion of Icelandic dust-emitting sediments in comparison to the Saharan source strongly suggests that saltation in Iceland should be efficient, while at the same time dust could be emitted also by direct aerodynamic entrainment. Usually, dust emission due to aerodynamic entrainment is much less efficient than that generated by saltation bombardment, because interparticle cohesive forces, encompassing van der Waals forces, electrodynamic forces, and chemical forces (e.g. Castellanos, 2005), increase on average with decreasing particle size. This results in an average minimum entrainment threshold for sand-size particles of around 70–100 µm (Shao and Lu, 2000; Shao and Klose, 2016). Toward smaller and larger particle sizes, increasing cohesive and gravitational forces, respectively, require stronger lifting forces for particle entrainment. However, if cohesive forces are weaker than on average, as it is the case in Iceland, the entrainment threshold for dust-size particles can be reduced to a value similar to or possibly even lower than for sand-size particles, enabling efficient direct aerodynamic dust emission without saltation as an intermediate process (Klose and Shao, 2013; Shao and Klose, 2016).
Table 2Fe mode of occurrence from different locations and types of sample. The content of FeT is in wt %, and for every mode of occurrence it is in % of the total Fe content. FeA: content of readily exchangeable Fe; FeD: Fe content from hematite, goethite, and pyrite; FeM: Fe content from magnetite; FeS: Fe content from non-Fe minerals such as Fe silicates and volcanic glass. NaN: not a number.
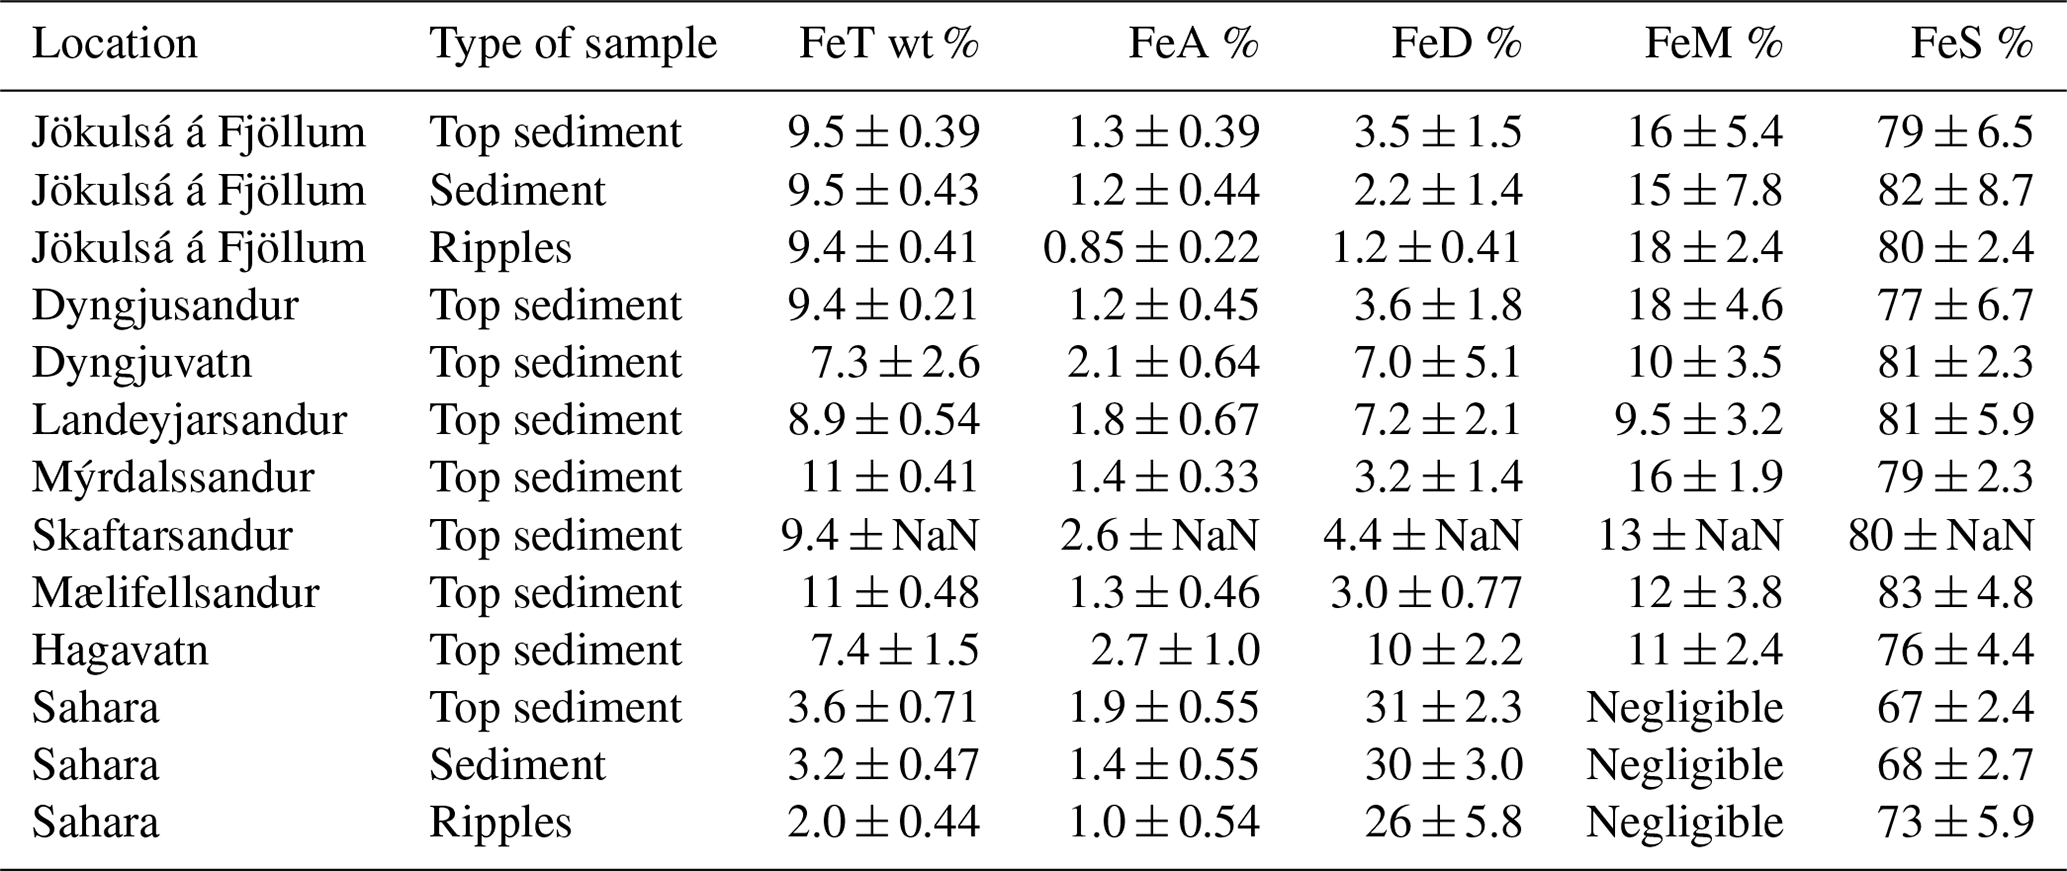
In contrast to Saharan dust-emitting sediments, which comprise quartz, feldspars, clays, calcite, dolomite, hematite/goethite, and halite, sediments from Iceland's dust sources are predominantly composed of amorphous phases and volcanic glass. They also contain anorthite (Ca plagioclase), augite (pyroxene), and andesine (plagioclase), with smaller quantities of analcime, magnetite, Ca modernite, and hematite. These pronounced differences in composition have distinct implications for ice nucleation, radiative forcing, and nutrient deposition. While the effects of the main minerals in hot deserts on these processes are relatively well-understood, the impact of volcanic glass, which constitutes the majority of Icelandic dust, remains largely unexplored and requires further research. One notable difference is the average iron (FeT) content in Icelandic sediments, which is approximately 3 times higher than that in Saharan sediments. Additionally, the proportion of FeS in FeT is greater in Iceland than in the Sahara, comprising 79 % vs. 67 % for top sediments, 82 % vs. 68 % for underlying fluvial sediments, and 80 % vs. 73 % for aeolian ripples (as detailed in Table 2 and Fig. 15). The proportion of Fe from hematite and goethite (FeD %) in Iceland is lower than in the Sahara (1 %–7 % vs. 31 %), while the proportion of FeM is higher in Iceland (9.5 %–18 % vs. negligible) yielding to a potentially different climate effect from the emitted dust (Table 2 and Fig. 15). Furthermore, the proportion of FeA, which is highly bioavailable, is lower in Iceland for top sediments (1.3 % vs. 1.9 % of the FeT content), fluvial sediments (1.2 % vs. 1.4 %), and aeolian ripples (0.85 % vs. 1.0 %) (as shown in Table 2 and Fig. 15). It is important to note that, even though the % FeA in Icelandic sediments is slightly lower, the amount of bioavailable Fe per mass in Iceland's dust-emitting sediments is higher than that of Saharan sediments due to the higher FeT contents in Icelandic samples. Similar mineralogical content was found by Baldo et al. (2020), with a major proportion of volcanic glass in the sediments, followed by anorthite and augite at Dyngjuvatn and Hagavatn. Fe proportions and total amount are also very similar to those obtained by Baldo et al. (2020).
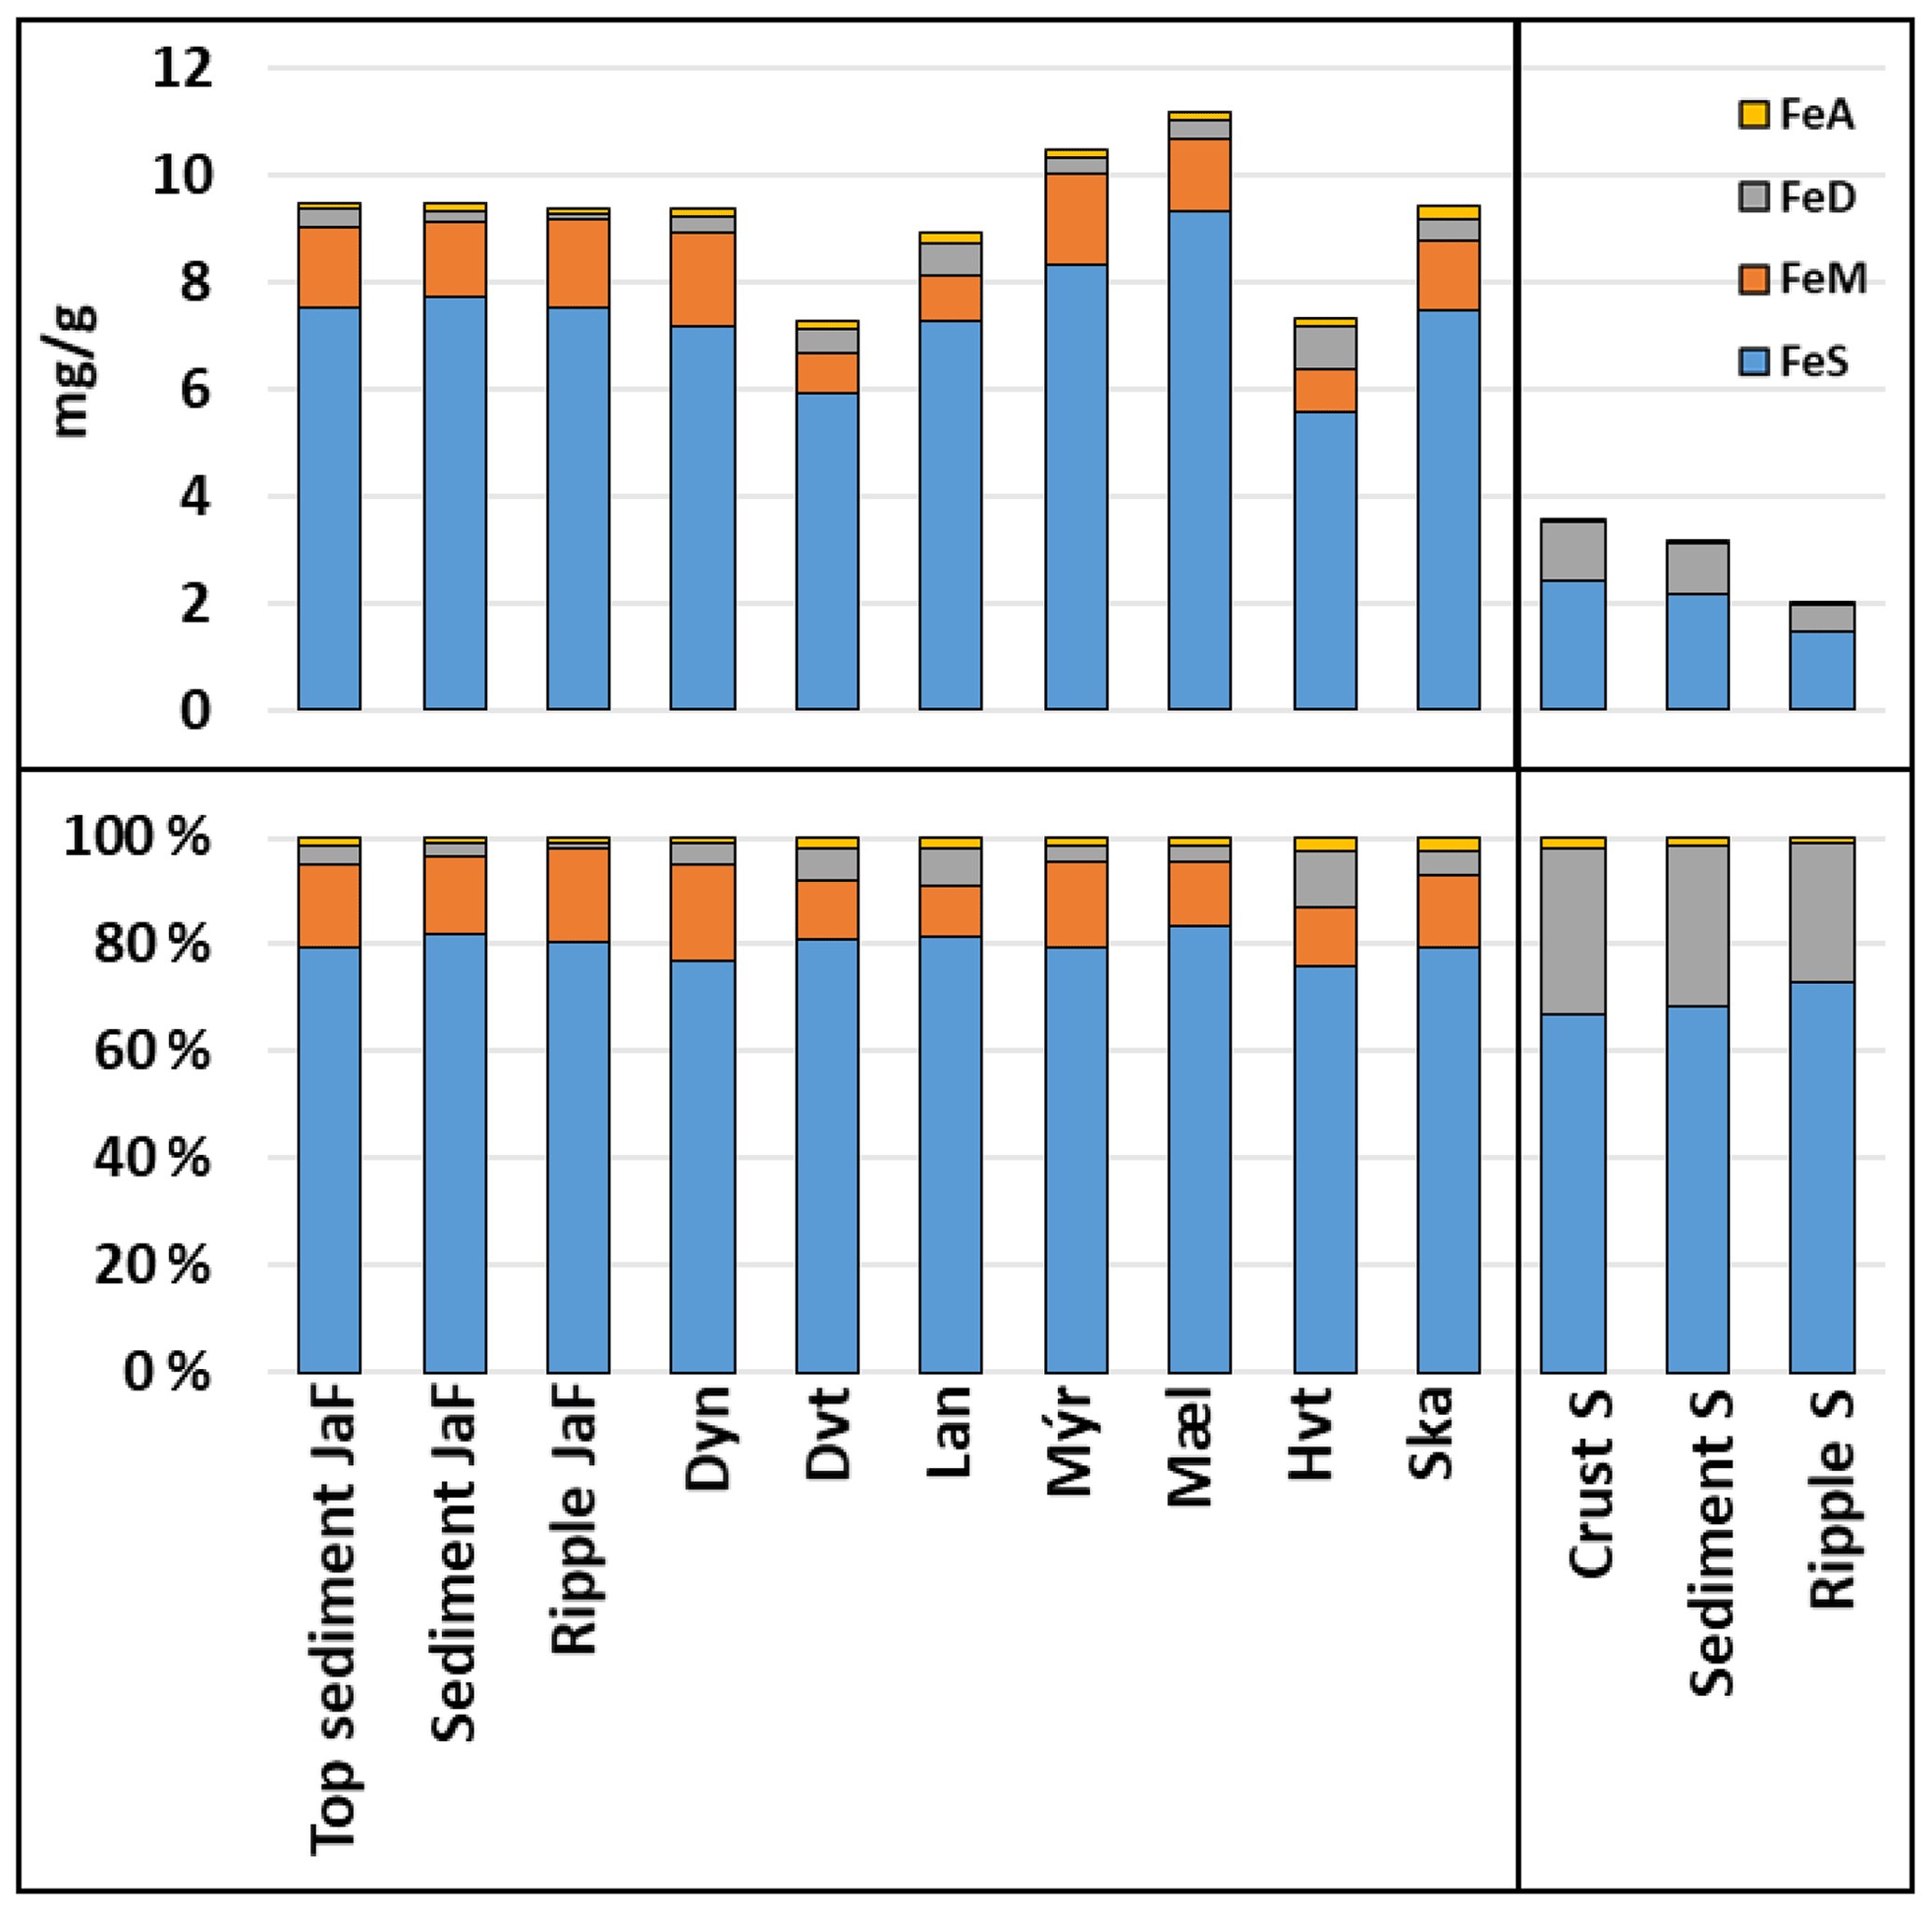
Figure 15Average amount of each Fe mode of occurrence for top sediment JaF: Jökulsá á Fjöllum top sediment average, sediment JaF: Jökulsá á Fjöllum sediment average, ripple JaF: Jökulsá á Fjöllum ripple average, Dyn: Dyngjusandur, Dvt: Dyngjuvatn, Lan: Landeyjarsandur, Mýr: Mýrdalssandur, Mæl: Mælifellsandur, Hvt: Hagavatn, Ska: Skaftarsandur, crust S: average crust from the Sahara, sediment S: average sediment from the Sahara and ripple S: average ripple from the Sahara and average percentage of FeS, FeM, FeD, and FeA normalised by the amount of FeT.
Spectra of dust source sediments from Morocco are markedly different than those from Iceland as seen also in the mineralogy (Fig. 8a, b, and c). Spectra from Morocco have electronic transitions and charge transfers of Fe3+ at wavelengths < 1 µm, related to hematite and goethite presence (Fig. 8a, b, and c), whereas spectra from Iceland have broader Fe2+ electronic transitions at wavelengths > 1 µm and sometimes near 2 µm, related to the volcanic glass and pyroxene proportion (Fig. 8c). At longer wavelengths, spectra of sediments from Morocco show features of phyllosilicates, including illites and smectites, whereas in Iceland this is not observed, except the 2.2 µm feature in Fig. 8 may be due to hydrated silica plus phyllosilicates such as montmorillonite.
3.7 Conceptual model for dust emission, particle size, and mineralogy for Dyngjusandur, a major Iceland dust hotspot
Dust emission in Iceland is primarily governed by glaciofluvial environments. These regions are characterised by the melting of glaciers that have accumulated substantial fine volcanic ash over geological time. Subsequently, the fluvial streams transport significant quantities of fine materials, which are deposited in extensive, flat areas during floods (Fig. 16). The fine nature of the sediments can be attributed to several factors. Firstly, it can be attributed to the fine volcanic ash preserved in the melting ice. Secondly, particle size segregation occurs during transportation from the moraine to the flooding plains. Additionally, the recycling of aeolian dust may play a significant role. Dust emitted from the plains is redeposited in the ice and surface sediments of the basin, eventually washed out towards the plains during subsequent events. Furthermore, the accumulation of fine- and light-particle pumice top layers in the ponded areas of the lowlands also favour the emission of dust. These processes are particularly prevalent in the Jökulsá á Fjöllum basin and other similar locations like Dyngjuvatn, Mælifellsandur, and Mýrdalssandur, with heightened activity during the summer months when glacial melting accelerates. Once these deposited fine sediments dry out, they become prone to dust emission when appropriate wind patterns prevail.
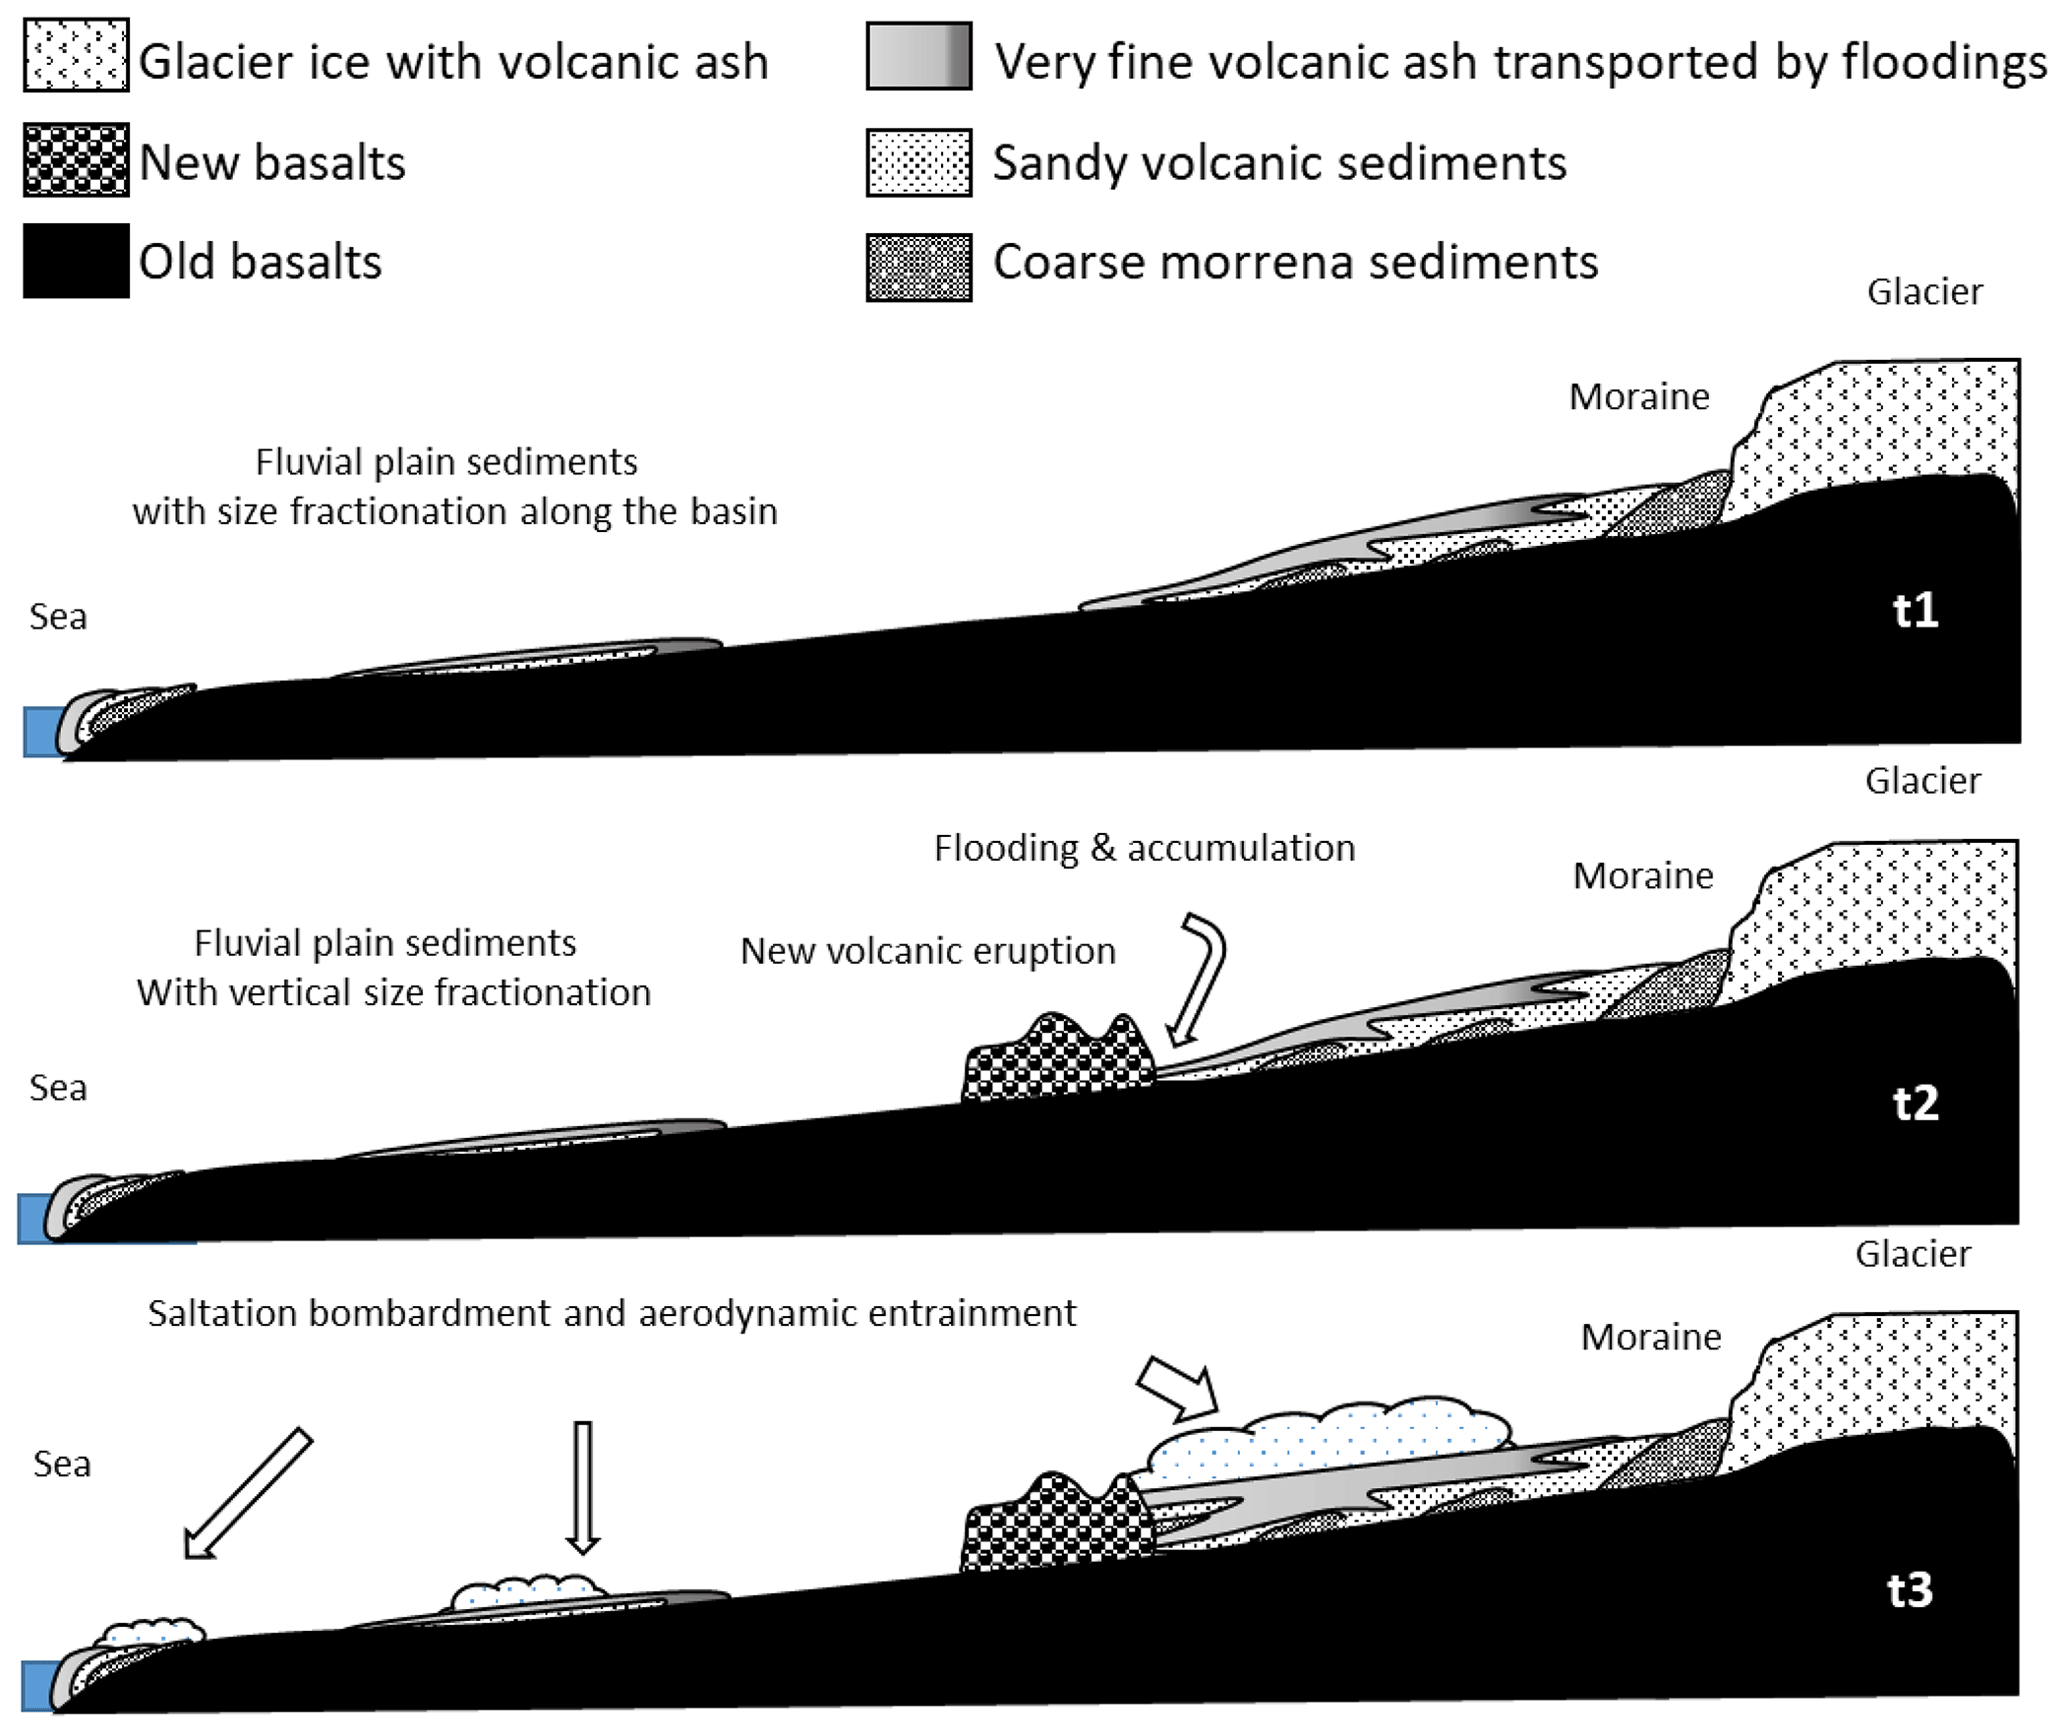
Figure 16Conceptualisation of the origin, transport, sedimentation, and emission of dust emitting sources, sediments, and dust along Iceland, using the example of the Jökulsá á Fjöllum basin. t1: the glacier feeds the fluvial systems with fine particles that are transported and size segregated along the basin; t2: in flat areas or if a volcanic eruption forms a dam, the sediments deposits; t3: under favourable conditions the dust emission occurs in different parts of the basin by saltation and potentially aerodynamic entrainment.
In the Jökulsá á Fjöllum basin, this scenario is generated thanks to the natural dam created after the Bárðarbunga eruption, when fluvial channels deposit large volumes of sediments across Dyngjusandur, a flat and extensive region (Fig. 16). In this endorheic flat, continuous summer floods lead to cyclic sediment deposition. Coarser fluvial sediments are deposited first and are subsequently covered by top sediments of very fine grains formed after each cycle through the deposition of suspended fine particles following drying or infiltration of ponded waters (Fig. 17). The frequency of flooding was nearly daily under insolation, and this leaves a cyclic pattern (top sediment, fluvial sediments) in the sedimentary record. Thus, in sunny days of August there was a typical daily cycle of midday to late afternoon flooding followed by drying and dust emission the next day. Also, during intensive flooding episodes, a large amount of top sediment covers very large surfaces, and if sunny days or adequate synoptic flows occur the subsequent day, high dust emissions are recorded. Following sediment deposition, waters infiltrate and traverse the lava field, flowing to the other side of the natural dam with minimal sediment load. On the other side of the dam, these pristine waters join those from the other channels unaffected by the dam and flow toward the sea. Because the dam stops part of the floods and because the river is more incised, overflows and sediment flats alongside the river are very reduced from the dam to the sea. However, large flooding flats at the sea once again contain sediments prone to dust emission. Such sedimentation, particle size fractionation, drying, and dust emission processes are generally repeated daily under favourable conditions in summer. The aeolian ripples are formed in the dry part of the cycle and can be mobilised by the wind and trigger the emission of dust by saltation. However, the lack of cohesive forces in the sediments may also allow direct aerodynamic entrainment of dust at lower wind speeds without the need of saltation (Fig. 17).

Figure 17Example of how particles, mainly volcanic glass with minor proportions of pyroxenes, feldspars, and some iron oxides, are transported, segregated, and after drying and under favourable conditions subject to emission.
This study has undertaken a comprehensive examination of dust-emitting sediments in Iceland, focusing on their particle size distributions, mineralogy, and Fe mode of occurrence. Our findings reveal distinctive characteristics among various sites, with Hagavatn and Dyngjusandur exhibiting the finest particle size distributions and Mýrdalssandur and Dyngjuvatn showing the coarsest. Despite these variations, the overall particle size distributions in Iceland's top sediments, whether fully or minimally dispersed, exhibit remarkable similarities. Notably, these distributions sharply contrast with those observed in a dust hotspot in the Moroccan Sahara. Iceland's top sediments are approximately 4 times coarser than fully dispersed Moroccan crusts, yet these fully dispersed Iceland top sediments are finer than the minimally dispersed Moroccan crusts, prevalent in the Moroccan Sahara. These distinctions underscore the relatively limited interparticle cohesion in Iceland, a characteristic that sets it apart. The scarcity of cohesion implies an efficient saltation bombardment process and, at the same time, suggests the possibility of direct aerodynamic entrainment of dust in this region. This contrasts with the cohesive sediments typically found in hot desert environments, where interparticle cohesion hinders dust aerodynamic entrainment, making saltation the primary mechanism for dust emission.
Iceland's dust-emitting sediments primarily consist of black volcanic glass or amorphous phases, constituting a substantial proportion ranging from 70 % to 85 % by weight. Plagioclase and pyroxenes contribute 10 % to 15 % and 4 % to 8 %, respectively, with traces of zeolites and Fe oxides present. Consistent compositional patterns emerge across most dust-emitting regions in Iceland, except for Landeyjarsandur and Hagavatn. In these regions, sediments display diminished glass content (35 % and < 0.1 %, respectively) and heightened levels of plagioclase and pyroxenes, reaching up to 65 % and 31 %, respectively. These compositional variations are starkly distinct from Saharan dust-emitting sediments, owing to the differing volcanic and sedimentary origins of the respective dust sources. Notably, in Saharan sediments, the presence of salts, carbonates, and clays promotes the formation of aggregates that increase particle size and sediment cohesion. The composition of Fe oxides also varies between the two regions, with hematite and goethite being predominant in the Sahara, while Iceland's sediments predominantly contain magnetite. The specific role of black volcanic glass in dust–radiation and dust–cloud interactions remains inadequately described, contributing to a limited understanding of its impact on climate. Further research is essential to unravel the complexities of these interactions and their implications for climate.
The distribution of Fe in the top sediments of Jökulsá á Fjöllum, as well as in the underlying fluvial sediments and the aeolian ripples, exhibits homogeneity in its mode of occurrence. The averaged bulk Fe content (FeT) is 9.5 ± 0.40 wt %, with structural Fe (FeS) constituting 80 ± 6.3 % and Fe in magnetite (FeM) accounting for 16 ± 5.5 %. Minor variations are observed in the proportions of Fe as hematite/goethite (FeD) and readily exchangeable and nano-Fe (FeA). Notably, the top sediments display a significant presence of readily exchangeable Fe and hematite/goethite, attributed to heightened glass weathering in the fine top sediment compared to coarser underlying layers and aeolian ripples. Similar trends were identified in various Icelandic sources, with Mælifellsandur and Mýrdalssandur exhibiting higher mean FeT (11 ± 0.48 % and 11 ± 0.41 %, respectively). Hagavatn and Skaftarsandur each showed a maximum proportion of FeA (2.7 ± 1.0 % and 2.6 %, one sample), and Landeyjarsandur displayed the maximum FeD proportion (7.2 ± 2.1 %), while Dyngjusandur exhibited the highest proportion of FeM (18 ± 4.6 %). In comparison to the Moroccan Saharan, although proportions are similar, the bulk Fe content in Iceland is 3-fold higher. Consequently, for the same emitted dust mass, the absolute mass of FeA is 3 times greater, with FeD being smaller and FeM emerging as the major contributor, resulting in a potentially distinct impact on oceans and terrestrial ecosystems and yielding diverse implications for climate.
Airborne and in situ spectroscopy results are broadly consistent with XRD and PSD results. The spectra of ripples are dark (low albedo) and dominated by primary volcanic phases and show no systematic trends with distance from the glacier. Top sediments show trends with distance from the glacier (Fig. 13), with the albedo being brighter with increasing distance partly due to decreasing particle size, which most likely is the result of mechanical sorting, with finer-grained hydrated, altered phases becoming more prevalent downstream relative to coarser, unaltered volcanic glass. There is lack of significant clay minerals, carbonates, and salts. The marked differences in composition between Icelandic and Moroccan sources are also captured. Spectra from Morocco have electronic transitions and charge transfers of Fe3+ at wavelengths < 1 µm, related to hematite and goethite, while spectra from Iceland have broader Fe2+ electronic transitions at longer wavelengths, related to the volcanic glass and pyroxene.
A conceptual model has been formulated to elucidate the elevated dust emissions observed in Dyngjusandur, Iceland. This model encompasses several key factors contributing to the phenomenon. Firstly, the historical entrapment of substantial amounts of fine volcanic ash by the glacier has established a reservoir of materials awaiting liberation. The accelerated melting of the glacier, particularly intensified during summer and influenced by underlying volcanism, releases significant volumes of fresh sediment. Notably, a volcanic field active in 2014–2015 functions as a natural dam, triggering extensive floods that inundate large plains with sediments prone to inducing dust emissions. The high pumice top layers in the lowlands also favour dust emissions because of the fine and low-density patterns of the pumice particles. The emitted dust can be deposited on the ice of the glacier and the surfaces of the basin and in turn be washed out towards the plains of the lowlands during subsequent flooding episodes and rain. These floods are recurrent under specific summer conditions (high insolation and temperature) causing melting of ice leading to flooding and fostering particle sedimentation and fractionation. Subsequently, dry weather and high-wind patterns facilitate dust emission.
The inherent nature of the sediments, characterised by black basalt detritus and volcanic ash with a predominant glassy composition, results in minimal particle aggregation and cohesion. Moreover, the frequent and extensive vertical particle size segregation during the flooding cycles contributes to the coverage of vast areas with very fine sediments, thereby facilitating dust emission. Numerous studies (Flowers et al., 2005; Magnússon et al., 2005; Hauser and Schmitt, 2021) have highlighted the region's high sensitivity to climate change, with projections suggesting increased ice melting in the future. These conditions are expected to further exacerbate dust emissions, indicating a potential escalation in the future.
The synergy of these geological, climatic, and environmental factors provides a comprehensive understanding of the intricate processes driving high dust emissions in Dyngjusandur.
The code used in this paper is provided by Clark (2024, https://doi.org/10.5281/zenodo.11204505).
Data used in this paper are given in the main paper itself and in the Supplement. If needed, data are also available upon request by emailing the authors.
The supplement related to this article is available online at: https://doi.org/10.5194/acp-24-6883-2024-supplement.
CPGP proposed and designed the field campaign with contributions of AA, KK, MK, and XQ. The campaign was implemented by CPGP, AA, CGF, AGR, KK, MK, AP, XQ, and JYD. The samples were collected by CPGP, AA, AGR, MK, AMK, RNG, ROG, and XQ and analysed by AGR, PC, and NM. Spectroscopy was analysed by AMK, ROG, BLE, PB, and RNC. AGR performed the visualisation and writing of the original draft manuscript, and CPGP and XQ supervised the work. CPGP and XQ re-edited the manuscript, and all authors contributed in data discussion, reviewing, and manuscript finalisation.
At least one of the (co-)authors is a member of the editorial board of Atmospheric Chemistry and Physics. The peer-review process was guided by an independent editor, and the authors also have no other competing interests to declare.
Publisher's note: Copernicus Publications remains neutral with regard to jurisdictional claims made in the text, published maps, institutional affiliations, or any other geographical representation in this paper. While Copernicus Publications makes every effort to include appropriate place names, the final responsibility lies with the authors.
The field campaign and its associated research, including this work, was funded by the European Research Council under the Horizon 2020 research and innovation programme through the ERC Consolidator Grant FRAGMENT (grant agreement no. 773051) and the AXA Research Fund through the AXA Chair on Sand and Dust Storms at BSC. Cristina González-Flórez was supported by a PhD fellowship from the Agència de Gestió d'Ajuts Universitaris i de Recerca (AGAUR) grant no. 2020_FI B 00678. Konrad Kandler was funded by the Deutsche Forschungsgemeinschaft (DFG, German Research Foundation) grant nos. 264907654 and 416816480. Martina Klose has received funding through the Helmholtz Association's Initiative and Networking Fund (grant agreement no. VH-NG-1533). We acknowledge the EMIT project, which is supported by the NASA Earth Venture Instrument programme, under the Earth Science Division of the Science Mission Directorate. We thank Eva L. Scheller for the help during the field spectroscopy measurements. We thank Pavla Dagsson Waldhauserova from the Agricultural University of Iceland for the invaluable support and help during the field campaign. We thank Thomas Dirsch for the uncountable driving hours and mechanical support during the soil sampling. We thank Paul Ginoux for providing high-resolution global dust source maps, which were very helpful for the identification of the FRAGMENT experimental sites. We thank the staff from the ranger station at Dreki as well as the wardens of the Dreki campsite and the Dreki mountain rescue service for their valuable support and advice. We also thank Vilhjalmur Vernharðsson and his crew from Fjalladyìrð for their permanent logistic help. Without all of them, the measurement campaign would not have been successfully feasible.
This research has been supported by the European Research Council, EU H2020 European Research Council (grant no. 773051), the AXA Research Fund (AXA Chair on Sand and Dust Storms), the Agència de Gestió d'Ajuts Universitaris i de Recerca (grant no. 2020_FI B 00678), the Deutsche Forschungsgemeinschaft (grant nos. 264907654 and 416816480), and the Helmholtz Association (grant no. VH-NG-1533).
The article processing charges for this open-access publication were covered by the CSIC Open Access Publication Support Initiative through its Unit of Information Resources for Research (URICI).
This paper was edited by Stelios Kazadzis and reviewed by two anonymous referees.
Anderson, J. H. and Wickersheim, K. A.: Near Infrared Characterization of Water and Hydroxyl Groups on Silica Surfaces, Surf. Sci., 2, 252–260, https://doi.org/10.1016/0039-6028(64)90064-0, 1964.
Arnalds, Ó.: Dust sources and deposition of aeolian materials in Iceland, Iceland. Agr. Sci., 23, 3–21, 2010.
Arnalds, Ó., Gisladottir, F. O., and Sigurjonsson, H.: Sandy deserts of Iceland: an overview, J. Arid Environ., 47, 359–371, 2001.
Arnalds, O., Olafsson, H., and Dagsson-Waldhauserova, P.: Quantification of iron-rich volcanogenic dust emissions and deposition over the ocean from Icelandic dust sources, Biogeosciences, 11, 6623–6632, https://doi.org/10.5194/bg-11-6623-2014, 2014.
Arnalds, Ó., Dagsson-Waldhauserova, P., and Olafsson, H.: The Icelandic volcanic aeolian environment: Processes and impacts – A review, Aeolian Res., 20, 176–195, 2016.
Baldo, C., Formenti, P., Nowak, S., Chevaillier, S., Cazaunau, M., Pangui, E., Di Biagio, C., Doussin, J.-F., Ignatyev, K., Dagsson-Waldhauserova, P., Arnalds, O., MacKenzie, A. R., and Shi, Z.: Distinct chemical and mineralogical composition of Icelandic dust compared to northern African and Asian dust, Atmos. Chem. Phys., 20, 13521–13539, https://doi.org/10.5194/acp-20-13521-2020, 2020.
Baldo, C., Formenti, P., Di Biagio, C., Lu, G., Song, C., Cazaunau, M., Pangui, E., Doussin, J.-F., Dagsson-Waldhauserova, P., Arnalds, O., Beddows, D., MacKenzie, A. R., and Shi, Z.: Complex refractive index and single scattering albedo of Icelandic dust in the shortwave part of the spectrum, Atmos. Chem. Phys., 23, 7975–8000, https://doi.org/10.5194/acp-23-7975-2023, 2023.
Baratoux, D., Mangold, N., Arnalds, O., Bardintzeff, J. M., Platevoët, B., Grégoire, M., and Pinet, P.: Volcanic sands of Iceland – Diverse origins of aeolian sand deposits revealed at Dyngjusandurand Lambahraun, Earth Surf. Proc. Land., 36, 1789–1808, 2011.
Beckett, F., Kylling, A., Sigurðardóttir, G., von Löwis, S., and Witham, C.: Quantifying the mass loading of particles in an ash cloud remobilized from tephra deposits on Iceland, Atmos. Chem. Phys., 17, 4401–4418, https://doi.org/10.5194/acp-17-4401-2017, 2017.
Bell, P. M., Mao, H. K., and Weeks, R. A.: Optical spectra and electron paramagnetic resonance of lunar and synthetic glasses – A study of the effects of controlled atmosphere, composition, and temperature, in: 7th Lunar Science Conference, Houston, Texas, USA, 15–19 March 1976, Proceedings, New York, Pergamon Press, Inc., vol. 3, 2543–2559, 1976.
Bishop, J. L., Lane, M. D., Dyar, M. D., and Brown, A. J.: Reflectance and Emission Spectroscopy Study of Four Groups of Phyllosilicates: Smectites, Kaolinite-Serpentines, Chlorites and Micas, Clay Miner., 43, 35–54, https://doi.org/10.1180/claymin.2008.043.1.03, 2008.
Björnsson, H.: History of Glaciology in Iceland, in: The Glaciers of Iceland. Atlantis Advances in Quaternary Science, Atlantis Press, Paris, vol. 2, https://doi.org/10.2991/978-94-6239-207-6_4, 2017.
Brodrick, P. G., Thompson, D. R., Fahlen, J. E., Eastwood, M. L., Sarture, C. M., Lundeen, S. R., Olson-Duvall, W., Carmon, N., and Green, R. O.: Generalized radiative transfer emulation for imaging spectroscopy reflectance retrievals, Remote Sens. Environ., 261, 112476, https://doi.org/10.1016/j.rse.2021.112476, 2021.
Bullard, J. E.: Contemporary glacigenic inputs to the dust cycle, Earth Surf. Proc. Land., 38, 71–89, https://doi.org/10.1002/esp.3315, 2013.
Bullard, J. E., Baddock, M., Bradwell, T., Crusius, J., Darlington, E., Gaiero, D., Gassó, S., Gisladottir, G., Hodgkins, R., McCulloch, R., McKenna-Neuman, C., Mockord, T., Stewart, H., and Thorsteinsson, T.: High-latitude dust in the Earth system, Rev. Geophys., 54, 447–485, https://doi.org/10.1002/2016RG000518, 2016.
Burns, R. G.: Mineralogical Applications of Crystal Field Theory, Cambridge University Press, ISBN 0-521-43077-1, 1993.
Carrivick, J. L. and Tweed, F. S.: A review of glacier outburst floods in Iceland and Greenland with a megafloods perspective, Earth-Sci. Rev., 196, 102876, https://doi.org/10.1016/j.earscirev.2019.102876, 2019.
Castellanos, A.: The Relationship Between Attractive Interparticle Forces and Bulk Behaviour in Dry and Uncharged Fine Powders, Adv. Phys., 54, 263–376, 2005.
Cheary, R. W. and Coelho, A.: A fundamental parameters approach to X-ray line profile fitting, J. Appl. Crystallogr., 25, 109–121, 1992.
Claquin, T., Schulz, M., and Balkanski, Y. J.: Modeling the mineralogy of atmospheric dust sources, J. Geophys. Res., 104, 22243–22256, 1999.
Clark, R. N.: PSI-edu/spectroscopy-tetracorder: Tetracorder 5.27 with expert systems to 5.27e + specpr, spectral libraries, and radiative transfer models (v5.27.0), Zenodo [code], https://doi.org/10.5281/zenodo.11204505, 2024.
Clark, R. N. and Roush, T. L.: Reflectance Spectroscopy: Quantitative Analysis Techniques for Remote Sensing Applications, J. Geophys. Res., 89, 6329–6340, https://doi.org/10.1029/JB089iB07p06329, 1984.
Clark, R. N., King, T. V. V., Klejwa, M., Swayze, G. A., and Vergo, N.: High Spectral Resolution Reflectance Spectroscopy of Minerals, J. Geophys. Res., 95, 12653–12680, https://doi.org/10.1029/JB095iB08p12653, 1990.
Clark, R. N., Swayze, G. A., Livo, K. E., Kokaly, R. F., Sutley, S. J., Dalton, J. B., McDougal, R. R., and Gent, C. A.: Imaging spectroscopy: Earth and planetary remote sensing with the USGS Tetracorder and expert systems, J. Geophys. Res., 108, 5131, https://doi.org/10.1029/2002JE001847, 2003.
Clark, R. N., Swayze, G. A., Livo, K. E., Brodrick, P., Noe Dobrea, E., Vijayarangan, S., Green, R. O., Wettergreen, D., Garza, A. C., Hendrix, A., García-Pando, C. P., Pearson, N., Lane, M., González-Romero, A., Querol, X., and the EMIT and TREX teams: Imaging spectroscopy: Earth and planetary remote sensing with the PSI Tetracorder and expert systems: from Rovers to EMIT and Beyond, Planetary Science J., in review, 2024.
Cloutis, E. A. and Gaffey, M. J.: Pyroxene Spectroscopy Revisited: Spectral-Compositional Correlations and Relationship to Geothermometry, J. Geophys. Res., 96, 22809–22826, https://doi.org/10.1029/91JE02512, 1991.
Cvetkovic, B., Dagsson-Waldhauserova, P., Petkovic, S., Arnalds, O., Madonna, F., Proestakis, E., Gkikas, A., Vimic, A. V., Pejanovic, G., Rosoldi, M., Ceburnis, D., Amiridis, V., Lisá, L., Nickovic, S., and Nikolic,J.: Fully dynamic high-resolution model for dispersion of icelandic airborne mineral dust, Atmosphere, 13, 1345, https://doi.org/10.3390/atmos13091345, 2022.
Dagsson-Waldhauserova, P., Arnalds, O., and Olafsson, H.: Long-term variability of dust events in Iceland (1949–2011), Atmos. Chem. Phys., 14, 13411–13422, https://doi.org/10.5194/acp-14-13411-2014, 2014.
Dagsson-Waldhauserova P., Arnalds O., Olafsson H., Hladil J., Skala R., Navratil T., Chadimova L., and Meinander O.: Snow–Dust Storm: Unique case study from Iceland, March 6–7, 2013, Aeolian Res., 16, 69–74, https://doi.org/10.1016/j.aeolia.2014.11.001, 2015.
Dagsson-Waldhauserova, P., Magnusdottir, A. Ö., Olafsson, H., and Arnalds, O.: The spatial variation of dust particulate matter concentrations during two Icelandic dust storms in 2015, Atmosphere, 7, 77, https://doi.org/10.3390/atmos7060077, 2016.
De la Torre, A. G., Bruque, S., and Aranda, M. A. G.: Rietveld quantitative amorphous content analysis, J. Appl. Crystallogr., 34, 196–202, 2001.
De Longueville, F., Hountondji, Y. C., Henry, S., and Ozer, P.: What do we know about effects of desert dust on air quality and human health in West Africa compared to other regions?, Sci. Total Environ., 409, 1–8, 2010.
Di Biagio, C., Formenti, P., Balkanski, Y., Caponi, L., Cazaunau, M., Pangui, E., Journet, E., Nowak, S., Andreae, M. O., Kandler, K., Saeed, T., Piketh, S., Seibert, D., Williams, E., and Doussin, J.-F.: Complex refractive indices and single-scattering albedo of global dust aerosols in the shortwave spectrum and relationship to size and iron content, Atmos. Chem. Phys., 19, 15503–15531, https://doi.org/10.5194/acp-19-15503-2019, 2019.
Dragosics, M., Meinander, O., Jónsdóttír, T., Dürig, T., De Leeuw, G., Pálsson, F., Dagsson-Waldhauserova, P., and Thorsteinsson, T.: Insulation effects of Icelandic dust and volcanic ash on snow and ice, Arab. J. Geosci., 9, 126, https://doi.org/10.1007/s12517-015-2224-6, 2016.
Einarsson, M. Á.: Climate of Iceland, in: World Survey of Climatology, 15, 673–697, https://doi.org/10.1002/joc.3370050110, 1984.
Engelbrecht, J. P., Moosmüller, H., Pincock, S., Jayanty, R. K. M., Lersch, T., and Casuccio, G.: Technical note: Mineralogical, chemical, morphological, and optical interrelationships of mineral dust re-suspensions, Atmos. Chem. Phys., 16, 10809–10830, https://doi.org/10.5194/acp-16-10809-2016, 2016.
Flowers, G. E., Marshall, S. J., Björnsson, H., and Clarke, G. K.: Sensitivity of Vatnajökull ice cap hydrology and dynamics to climate warming over the next 2 centuries, J. Geophys. Res.-Earth, 110, F02011, https://doi.org/10.1029/2004JF000200, 2005.
Formenti, P., Caquineau, S., Chevaillier, S., Klaver, A., Desboeufs, K., Rajot, J. L., Belin, S., and Briois, V.: Dominance of goethite over hematite in iron oxides of mineral dust from Western Africa: Quantitative partitioning by X-ray absorption spectroscopy, J. Geophys. Res.-Atmos., 119, 12740–12754, https://doi.org/10.1002/2014jd021668, 2014.
Geiger, H., Mattson, T., Deegan, F. M., Troll, V. R., Burchardt, S., Gudmundsson, Ó., Tryggvason, A., Krumbholz, M., and Harris, C.: Magma plumbing for the 2014–2015 Holuhraun eruption, Iceland, Geochem. Geophy. Geosy., 17, 2953–2968, 2016.
Gonçalves Ageitos, M., Obiso, V., Miller, R. L., Jorba, O., Klose, M., Dawson, M., Balkanski, Y., Perlwitz, J., Basart, S., Di Tomaso, E., Escribano, J., Macchia, F., Montané, G., Mahowald, N. M., Green, R. O., Thompson, D. R., and Pérez García-Pando, C.: Modeling dust mineralogical composition: sensitivity to soil mineralogy atlases and their expected climate impacts, Atmos. Chem. Phys., 23, 8623–8657, https://doi.org/10.5194/acp-23-8623-2023, 2023.
González-Flórez, C., Klose, M., Alastuey, A., Dupont, S., Escribano, J., Etyemezian, V., Gonzalez-Romero, A., Huang, Y., Kandler, K., Nikolich, G., Panta, A., Querol, X., Reche, C., Yus-Díez, J., and Pérez García-Pando, C.: Insights into the size-resolved dust emission from field measurements in the Moroccan Sahara, Atmos. Chem. Phys., 23, 7177–7212, https://doi.org/10.5194/acp-23-7177-2023, 2023a.
González-Flórez, C., Klose, M., Alastuey, A., Dagsson-Waldhauserová, P., Dupont, S., Escribano, J., González-Romero, A., Irvine, M., Kandler, K., Panta, A., Querol, X., Schepanski, K., Yus-Díez, J., and Pérez García-Pando, C.: Comparing the emitted dust particle size distribution in Iceland and Morocco from intensive field measurements, AGU23, San Francisco, USA, 11–15 December 2023, Abstract (AE14B-1234), 2023b.
González-Romero, A., González-Flórez, C., Panta, A., Yus-Díez, J., Reche, C., Córdoba, P., Moreno, N., Alastuey, A., Kandler, K., Klose, M., Baldo, C., Clark, R. N., Shi, Z., Querol, X., and Pérez García-Pando, C.: Variability in sediment particle size, mineralogy, and Fe mode of occurrence across dust-source inland drainage basins: the case of the lower Drâa Valley, Morocco, Atmos. Chem. Phys., 23, 15815–15834, https://doi.org/10.5194/acp-23-15815-2023, 2023.
González-Romero, A., González-Flórez, C., Panta, A., Yus-Díez, J., Córdoba, P., Alastuey, A., Moreno, N., Hernández-Chiriboga, M., Kandler, K., Klose, M., Clark, R. N., Ehlmann, B. L., Greenberger, R. N., Keebler, A. M., Brodrick, P., Green, R., Ginoux, P., Querol, X., and Pérez García-Pando, C.: Characterization of the particle size distribution, mineralogy and Fe mode of occurrence of dust-emitting sediments across the Mojave Desert, California, USA, EGUsphere [preprint], https://doi.org/10.5194/egusphere-2024-434, 2024.
Goryniuk, M. C., Rivard, B. A., and Jones, B.: The Reflectance Spectra of Opal-A (0.5–25 Mm) from the Taupo Volcanic Zone: Spectra That May Identify Hydrothermal Systems on Planetary Surfaces, Geophys. Res. Lett., 31, L24701, https://doi.org/10.1029/2004GL021481, 2004.
Goudie, A. S. and Middleton, N. J.: Desert dust in the global system, Springer, Heidelberg, ISBN 978-786 3-540-32355-6, 288 pp., 2006.
Green, R. O., Mahowald, N., Ung, C., Thompson, D. R., Bator, L., Bennet, M., and Zan, J.: The Earth Surface Mineral Dust Source Investigation: An Earth Science Imaging Spectroscopy Mission, 2020 IEEE Aerospace Conference, Big Sky, MT, USA, 7–14 March 2020, IEEE Computer Society, https://doi.org/10.1109/AERO47225.2020.9172731, 2020.
Groot Zwaaftink, C. D., Arnalds, Ó., Dagsson-Waldhauserova, P., Eckhardt, S., Prospero, J. M., and Stohl, A.: Temporal and spatial variability of Icelandic dust emissions and atmospheric transport, Atmos. Chem. Phys., 17, 10865–10878, https://doi.org/10.5194/acp-17-10865-2017, 2017.
Hauser, S. and Schmitt, A.: Glacier retreat in Iceland mapped from SPACE: Time series analysis of geodata from 1941 to 2018, PFG – Journal of Photogrammetry, Remote Sensing and Geoinformation Science, 89, 273–291, 2021.
Horgan, B. H. N., Cloutis, E. A., Mann, P., and Bell, J. F.: Near-Infrared Spectra of Ferrous Mineral Mixtures and Methods for Their Identification in Planetary Surface Spectra, Icarus, 234, 132–154, https://doi.org/10.1016/j.icarus.2014.02.031, 2014.
Ibáñez, J., Font, O., Moreno, N., Elvira, J. J., Alvarez, S., and Querol, X.: Quantitative Rietveld analysis of the crystalline and amorphous phases in coal fly ashes, Fuel, 105, 314–317, 2013.
Jickells, T. D., An, Z. S., Andersen, K. K., Baker, A. R., Bergametti, G., Brooks, N., Cao, J. J., Boyd, P. W., Duce, R. A., Hunter, K. A., Kawahata, H., Kubilay, N., Laroche, J., Liss, P. S., Mahowald, N., Prospero, J. M., Ridgwell, A. J., Tegen, I., and Torres, R.: Global iron connections between desert dust, ocean biogeochemistry, and climate, Science, 308, 67–71, https://doi.org/10.1126/science.1105959, 2005.
Johnson, M. S., Meskhidze, N., Solmon, F., Gassó, S., Chuang, P. Y., Gaiero, D. M., Yantosca, R. M., Wu, S., Wang, Y., and Carouge, C.: Modeling dust and soluble iron deposition to the South Atlantic Ocean, J. Geophys. Res., 115, D15202, https://doi.org/10.1029/2009JD013311, 2010.
Journet, E., Balkanski, Y., and Harrison, S. P.: A new data set of soil mineralogy for dust-cycle modeling, Atmos. Chem. Phys., 14, 3801–3816, https://doi.org/10.5194/acp-14-3801-2014, 2014.
Karanasiou, A., Moreno, N., Moreno, T., Viana, M., de Leeuw, F., and Querol, X.: Health effects from Sahara dust episodes in Europe: Literature review and research gaps, Environ. Int., 47, 107–14, 2012.
Klose, M. and Shao, Y.: Large-eddy simulation of turbulent dust emission, Aeolian Res., 8, 49–58, https://doi.org/10.1016/j.aeolia.2012.10.010, 2013.
Kok, J. F., Adebiyi, A. A., Albani, S., Balkanski, Y., Checa-Garcia, R., Chin, M., Colarco, P. R., Hamilton, D. S., Huang, Y., Ito, A., Klose, M., Li, L., Mahowald, N. M., Miller, R. L., Obiso, V., Pérez García-Pando, C., Rocha-Lima, A., and Wan, J. S.: Contribution of the world's main dust source regions to the global cycle of desert dust, Atmos. Chem. Phys., 21, 8169–8193, https://doi.org/10.5194/acp-21-8169-2021, 2021.
Kok, J. F., Storelvmo, T., Karydis, V. A., Adebiyi, A. A., Mahowald, N. M., Eva, A. T., He, C., and Leung, D. M.: Mineral dust aerosol impacts on global climate and climate change, Nat. Rev. Earth Environ., 4, 71–86, https://doi.org/10.1038/s43017-022-00379-5, 2023.
Kokaly, R. F., Clark, R. N., Swayze, G. A., Livo, K. E., Hoefen, T. M., Pearson, N. C., Wise, R. A., Benzel, W. M., Lowers, H. A., and Driscoll, R. L.: USGS Spectral Library Version 7, U.S. Geological Survey Data Series 1035, 61 pp., https://doi.org/10.3133/ds1035, 2017.
Kylling, A., Zwaaftink, C. D. G., and Stohl, A.: Mineral Dust Instantaneous Radiative Forcing in the Arctic, Geophys. Res. Lett., 45, 4290–4298, 2018.
Laurent, B., Marticorena, B., Bergametti, G., Léon, J. F., and Mahowald, N. M.: Modeling Mineral Dust Emissions from the Sahara Desert Using New Surface Properties and Soil Database, J. Geophys. Res., 113, D14218, https://doi.org/10.1029/2007JD009484, 2008.
Li, L., Mahowald, N. M., Miller, R. L., Pérez García-Pando, C., Klose, M., Hamilton, D. S., Gonçalves Ageitos, M., Ginoux, P., Balkanski, Y., Green, R. O., Kalashnikova, O., Kok, J. F., Obiso, V., Paynter, D., and Thompson, D. R.: Quantifying the range of the dust direct radiative effect due to source mineralogy uncertainty, Atmos. Chem. Phys., 21, 3973–4005, https://doi.org/10.5194/acp-21-3973-2021, 2021.
Machiels, L., Mertens, G., and Elsen, J.: Rietveld Refinement strategy for Quantitative Phase analysis of Partially Amorphous zeolitized tuffaceous, Geol. Belg., 13, 183–196, 2010.
Madsen, I. C., Scarlett, N. V. Y., Cranswick, L. M. D., and Lwin, T.: Outcomes of the international union of crystallography commission on powder diffraction round robin on quantitative phase analysis: Samples 1a to 1h, J. Appl. Crystallogr., 34, 409–426, 2001.
Magnússon, E., Björnsson, H., Dall, J., and Pálsson, F.: The 20th century retreat of ice caps in Iceland derived from airborne SAR: W-Vatnajökull and N-Mýrdalsjökull, Earth Planet. Sc. Lett., 237, 508–515, 2005.
Mahowald, N. M., Baker, A. R., Bergametti, G., Brooks, N., Duce, R. A., Jickells, T. D., Kubilay, N., Prospero, J. M., and Tegen, I.: Atmospheric global dust cycle and iron inputs to the ocean, Global Biogeochem. Cy., 19, GB4025, https://doi.org/10.1029/2004GB002402, 2005.
Matsui, H., Yamane, M., Tonami, T., Nagami, T., Watanabe, K., Kishi, R., Kitagawa, Y., and Nakano, M.: Theoretical study on gigantic effect of external static electric field application on nonlinear optical properties of 1,2,3,5-dithiadiazolyl π-radical dimer, Mater. Chem. Front., 2, 785–790, https://doi.org/10.1039/C7QM00549K, 2018.
Meinander, O., Dagsson-Waldhauserova, P., Amosov, P., Aseyeva, E., Atkins, C., Baklanov, A., Baldo, C., Barr, S. L., Barzycka, B., Benning, L. G., Cvetkovic, B., Enchilik, P., Frolov, D., Gassó, S., Kandler, K., Kasimov, N., Kavan, J., King, J., Koroleva, T., Krupskaya, V., Kulmala, M., Kusiak, M., Lappalainen, H. K., Laska, M., Lasne, J., Lewandowski, M., Luks, B., McQuaid, J. B., Moroni, B., Murray, B., Möhler, O., Nawrot, A., Nickovic, S., O’Neill, N. T., Pejanovic, G., Popovicheva, O., Ranjbar, K., Romanias, M., Samonova, O., Sanchez-Marroquin, A., Schepanski, K., Semenkov, I., Sharapova, A., Shevnina, E., Shi, Z., Sofiev, M., Thevenet, F., Thorsteinsson, T., Timofeev, M., Umo, N. S., Uppstu, A., Urupina, D., Varga, G., Werner, T., Arnalds, O., and Vukovic Vimic, A.: Newly identified climatically and environmentally significant high-latitude dust sources, Atmos. Chem. Phys., 22, 11889–11930, https://doi.org/10.5194/acp-22-11889-2022, 2022.
Möller, R., Möller, M., Kukla, P. A., Scneider, C., Römer, W., Lehmkuhl, F., and Gudmundsson, M. T.: Analyzing relationships between geochemical composition, spectral reflectance, broad-band albedo and thickness of supra-glacial tephra deposits from the eruptions of Eyafjallajökull and Grímsvötn volcanoes in 2010 and 2011, Am. Geoph. Union, Fall meeting, 12 December 2016, San Francsico, USA, abstract #C13B-082, 2016.
Möller, R., Möller, M., Kukla, P. A., and Schneider, C.: Modulation of glacier ablation by tephra coverage from Eyjafjallajökull and Grímsvötn volcanoes, Iceland: an automated field experiment, Earth Syst. Sci. Data, 10, 53–60, https://doi.org/10.5194/essd-10-53-2018, 2018.
Moroni, B., Arnalds, O., Dagsson-Waldhauserová, P., Crocchianti, S., Vivani, R., and Cappelletti, D.: Mineralogical and chemical records of Icelandic dust sources upon Ny-Ålesund (Svalbard Islands), Front. Earth Sci., 6, 187, https://doi.org/10.3389/feart.2018.00187, 2018.
Murray, B. J., Carslaw, K. S., and Field, P. R.: Opinion: Cloud-phase climate feedback and the importance of ice-nucleating particles, Atmos. Chem. Phys., 21, 665–679, https://doi.org/10.5194/acp-21-665-2021, 2021.
Obiso, V., Gonçalves Ageitos, M., Pérez García-Pando, C., Perlwitz, J. P., Schuster, G. L., Bauer, S. E., Di Biagio, C., Formenti, P., Tsigaridis, K., and Miller, R. L.: Observationally constrained regional variations of shortwave absorption by iron oxides emphasize the cooling effect of dust, Atmos. Chem. Phys., 24, 5337–5367, https://doi.org/10.5194/acp-24-5337-2024, 2024.
Oerlemans, J., Giesen, R., and Van Den Broeke, M.: Retreating alpine glaciers: Increased melt rates due to accumulation of dust (Vadret da Morteratsch, Switzerland), J. Glaciol., 55, 729–736, https://doi.org/10.3189/002214309789470969, 2009.
Ólafsson, H., Furger, M., and Brümmer, B.: The weather and climate of Iceland, Meteorol. Z., 16, 5–8, https://doi.org/10.1127/0941-2948/2007/0185, 2007.
Palacios, D., Hughes, D. H., and García-Ruiz, J. M. (Eds.): European Glacial Landscapes. The last deglaciation, Elsevier, Amsterdam, the Netherlands, ISBN 9780323918992, 2021.
Panta, A., Kandler, K., Alastuey, A., González-Flórez, C., González-Romero, A., Klose, M., Querol, X., Reche, C., Yus-Díez, J., and Pérez García-Pando, C.: Insights into the single-particle composition, size, mixing state, and aspect ratio of freshly emitted mineral dust from field measurements in the Moroccan Sahara using electron microscopy, Atmos. Chem. Phys., 23, 3861–3885, https://doi.org/10.5194/acp-23-3861-2023, 2023.
Pérez García-Pando, C., Stanton, M. C., Diggle, P. J., Trzaska, S., Miller, R. L., Perlwitz, J. P., Baldasano, J. M., Cuevas, E., Ceccato, P., Yaka, P., and Thomson, M. C.: Soil dust aerosols and wind as predictors of seasonal meningitis incidence in Niger, Environ. Health Perspect., 122, 7679–7686, 2014.
Perlwitz, J. P., Pérez García-Pando, C., and Miller, R. L.: Predicting the mineral composition of dust aerosols – Part 1: Representing key processes, Atmos. Chem. Phys., 15, 11593–11627, https://doi.org/10.5194/acp-15-11593-2015, 2015a.
Perlwitz, J. P., Pérez García-Pando, C., and Miller, R. L.: Predicting the mineral composition of dust aerosols – Part 2: Model evaluation and identification of key processes with observations, Atmos. Chem. Phys., 15, 11629–11652, https://doi.org/10.5194/acp-15-11629-2015, 2015b.
Querol X.: The Occurrence and Distribution of Trace Elements in the Teruel Mining District Coals and their Behaviour during Coal Combustion, European Coal and Steel Community Project 7220/ED/014, Instituto de Ciencias de la Tierra Jaume Almera, 1993.
Querol, X., Whateley, M. K. G., Fernandez-Turiel, J. L., and Tuncali, E.: Geological controls on the mineralogy and geochemistry of the Beypazari lignite, Central Anatolia, Turkey, Int. J. Coal. Geol., 33, 255–271, 1997.
Rampe, E. B., Kraft, M. D., Sharp, T. G., Golden, D. C., Ming, D. W., and Christensen, P. R.: Allophane Detection on Mars with Thermal Emission Spectrometer Data and Implications for Regional-Scale Chemical Weathering Processes, Geology, 40, 995–98, https://doi.org/10.1130/G33215.1, 2012.
Rietveld, H. M.: A profile refinement method for nuclear and magnetic structures, J. Appl. Crystallogr., 2, 65–71, 1969.
Sanchez-Marroquin, A., Arnalds, O., Baustian-Dorsi, K. J., Browse, J., Dagsson-Waldhauserova, P., Harrison, A. D., Maters, E. C., Pringle, K. J., Vergara-Temprado, J., Burke, I. T., Mcquaid, J. B., Carslaw, K. S., and Murray, B. J.: Iceland is an episodic source of atmospheric ice-nucleating particles relevant for mixed-phased clouds, Science Advances, 6, 8137, https://doi.org/10.1126/sciadv.aba8137, 2020.
Scarlett, N. and Madsen, I.: Quantification of phases with partial or no known crystal structures, Powder Diffr., 21, 278–284, 2006.
Shao, Y. and Klose, M.: A note on the stochastic nature of particle cohesive force and implications to threshold friction velocity for aerodynamic dust entrainment, Aeolian Res., 22, 123–125, https://doi.org/10.1016/j.aeolia.2016.08.004, 2016.
Shao, Y. and Lu, H.: A simple expression for wind erosion threshold friction velocity, J. Geophys. Res.-Atmos., 105, 22437–22443, https://doi.org/10.1029/2000JD900304, 2000.
Shi, Y., Liu, X., Wu, M., Zhao, X., Ke, Z., and Brown, H.: Relative importance of high-latitude local and long-range-transported dust for Arctic ice-nucleating particles and impacts on Arctic mixed-phase clouds, Atmos. Chem. Phys., 22, 2909–2935, https://doi.org/10.5194/acp-22-2909-2022, 2022.
Shi, Z. B., Krom, M. D., and Bonneville, S.: Formation of Iron Nanoparticles and Increase in Iron Reactivity in Mineral Dust during Simulated Cloud Processing, Environ. Sci. Technol., 43, 6592–6596, 2009.
Sperazza, M., Moore, J. N., and Hendrix, M.: High-Resolution particle size analysis of naturally occurring very fine-grained sediment through laser diffractometry, J. Sediment. Res., 74, 736–743, 2004.
Thompson, D. R., Babu, K., Braverman, A. J., Eastwood, M. L., Green, R. O., Hobbs, J. M., Jewell, J. B., Kindel, B., Massie, S., and Mishra, M.: Optimal estimation of spectral surface reflectance in challenging atmospheres, Remote Sens. Environ., 232, 111258, https://doi.org/10.1016/j.rse.2019.111258, 2019.
Thorpe, M. T., Hurowitz, J. A., and Dehouck E.: Sediment geochemistry and mineralogy from a glacial terrain river system in southwest Iceland, Geochim. Cosmochim. Ac., 263, 140–166, https://doi.org/10.1016/j.gca.2019.08.003, 2019.
Thorsteinsson, T., Gísladóttir, G., Bullard, J., and McTainsh, G.: Dust storm contributions to airborne particulate matter in Reykjavík, Iceland, Atmos. Environ., 45, 5924–5933, https://doi.org/10.1016/j.atmosenv.2011.05.023, 2011.
Toby, B. H.: R factors in Rietveld analysis: How good is good enough?, Powder Diffr., 21, 67–70, https://doi.org/10.1154/1.2179804, 2006.
TOPAS: TOPAS and TOPAS-Academic: an optimization program integrating computer algebra and crystallographic objects written in C++, J. Appl. Cryst., 51, 210–218, 2018.
Wada, K., Arnalds, O., Kakuto, Y., Wilding, L. P., and Hallmark, C. T.: Clay minerals of four soils formed in eolian and tephra materials in Iceland, Geoderma, 52, 351–365, https://doi.org/10.1016/0016-7061(92)90046-A, 1992.
Wittmann, M., Groot Zwaaftink, C. D., Steffensen Schmidt, L., Guðmundsson, S., Pálsson, F., Arnalds, O., Björnsson, H., Thorsteinsson, T., and Stohl, A.: Impact of dust deposition on the albedo of Vatnajökull ice cap, Iceland, The Cryosphere, 11, 741–754, https://doi.org/10.5194/tc-11-741-2017, 2017.
Young, R. A.: The Rietveld method. International Union of Crystallography, Oxford University Press, UK, https://doi.org/10.1017/S0885715600019497, 1993.
Yus-Díez, J., Pandolfi, M., Alastuey, A., González-Florez, C., Escribano, J., González-Romero, A., Ivančič, M., Rigler, M., Klose, M., Kandler, K., Panta, A., Querol, X., Reche, C., and Pérez García-Pando, C.: Quantifying variations in multi-wavelength optical properties of freshly-emitted Saharan dust from the Lower Drâa Valley, Moroccan Sahara, in preparation, 2024.
Zubko, N., Munoz, O., Zubko, E., Gritsevich, M., Escobar-Cerezo, J., Berg, M. J., and Peltoniemi, J.: Light scattering from volcanic-sand particles in deposited and aerosol form, Atmos. Environ., 215, 116813, https://doi.org/10.1016/j.atmosenv.2019.06.051, 2019.