the Creative Commons Attribution 4.0 License.
the Creative Commons Attribution 4.0 License.
 | 10 Jun 2024
Sources of organic gases and aerosol particles and their roles in nighttime particle growth at a rural forested site in southwest Germany
Feng Jiang
Linyu Gao
Hengheng Zhang
Thomas Leisner
The composition, sources and chemical transformation of volatile organic compounds (VOCs) and organic aerosol (OA) particles were investigated during July–August 2021 at a rural forested site in southwest Germany, 10 km north of the city of Karlsruhe. VOCs and semi-volatile OA particles were measured with a proton-transfer-reaction mass spectrometer coupled to the CHemical Analysis of aeRosols ONline particle inlet (CHARON–PTR-MS). The CHARON-measured OA mass accounted for 62 ± 18 % on average of the total OA mass (4.2 ± 2.8 µg m−3) measured concurrently with an aerosol mass spectrometer (AMS). The total concentrations of measured VOCs ranged from 7.6 to 88.9 ppb with an average of 31.2 ± 13.4 ppb. Positive matrix factorization (PMF) was used to identify major source factors of VOCs and OA particles. Three types of oxygenated VOC (OVOC), namely aromatic OVOCs, biogenic OVOCs and aged OVOCs, contributed on average 11 % ± 9 %, 37 % ± 29 % and 29 % ± 21 % of total VOC concentrations, respectively. The results of AMS–PMF indicated substantial contributions of oxygenated organic compounds to OA particle mass. Three secondary OA (SOA) factors determined by CHARON–PMF analysis, namely aromatic SOA (5 % ± 7 %), daytime biogenic SOA (17 % ± 17 %) and nighttime biogenic SOA (28 % ± 21 %), consistently showed high contributions to the total CHARON-measured OA mass. Nighttime particle growth was observed regularly in this area, which was mainly attributed to the semi-volatile organic compounds and organic nitrates formed from the oxidation of monoterpenes and sesquiterpenes. This study presents the major sources, real-time transformations of VOCs and OA particles, and nighttime particle formation characteristics for central European forested areas.
- Article
(5877 KB) - Full-text XML
-
Supplement
(2687 KB) - BibTeX
- EndNote


Organic aerosol (OA) represents the majority of submicron aerosol mass (20 %–90 %) in the atmosphere (Crippa et al., 2014; Zhang et al., 2011; Chen et al., 2022) and has adverse impacts on climate, air quality and human health (IPCC, 2021; Burnett et al., 2014; Seinfeld and Pandis, 2016; Hallquist et al., 2009). OA particles can be either directly emitted from different sources (primary organic aerosol; POA) or formed by the oxidation of volatile organic compounds (VOCs) as secondary organic aerosol (SOA; Shrivastava et al., 2017; Hallquist et al., 2009). Based on numerous field observations, SOA is often found to be the largest fraction of the submicron OA mass in different urban, rural and forested areas across Europe (44 %–100 %; Crippa et al., 2014; Chen et al., 2022), the southeastern United States (47 %–79 %; Xu et al., 2015) and Asian countries (43 %–83 %; Zhou et al., 2020). However, the SOA concentrations are generally underestimated by current models, mainly due to an incomplete understanding of sources and the transformation of VOCs to SOA (Jiang et al., 2019; Shen et al., 2019; Hodzic et al., 2016).
Aerosol mass spectrometers (AMS) are widely used to quantify the OA mass at time resolutions of minutes (Decarlo et al., 2006). Mass spectral data from the AMS coupled with positive matrix factorization (PMF) allow us to characterize the sources and evolution of OA (Ulbrich et al., 2009). AMS–PMF analysis is able to distinguish POA sources like traffic, cooking and biomass burning and resolve factors for SOA such as semi-volatile oxygenated OA (SV-OOA) and low-volatility oxygenated OA (LV-OOA) based on oxygenation degree and thus presumed volatility (Ng et al., 2010; Zhang et al., 2011; Crippa et al., 2014). The correlation of SV-OOA and LV-OOA with external tracers (e.g., ozone, temperature and relative humidity) can provide indirect evidence for their sources and formation mechanisms (Zhang et al., 2011). For instance, Canonaco et al. (2015) found that SV-OOA and LV-OOA were positively correlated with ambient temperature in Switzerland in summer, a fact that was attributed to the impacts of both photochemistry and/or biogenic VOC (BVOC) emissions enhanced by higher temperatures. In contrast, Crippa et al. (2014) reported a pattern for SV-OOA anticorrelated with temperature based on 25 AMS measurements across different European stations. Therefore, it remains difficult to assign SOA factors (SV-OOA and LV-OOA) to specific sources or formation mechanisms using AMS–PMF analysis without information on the VOCs acting as SOA precursors. Proton-transfer-reaction mass spectrometers (PTR-MS) are powerful instruments for detecting many VOC species, especially SOA precursors like aromatic hydrocarbons, terpenoids and oxygenated VOCs (OVOCs; Jordan et al., 2009). The PMF analysis of VOC mass spectra from PTR-MS can constrain the sources of VOCs and resolve secondary contributions of OVOCs (L. Wang et al., 2020; Gkatzelis et al., 2021; Yuan et al., 2012). Furthermore, the CHemical Analysis of aeRosols ONline (CHARON) inlet coupled to the PTR-MS can detect the semi-volatile OA particles qualitatively and quantitatively (Eichler et al., 2015; Muller et al., 2017; Leglise et al., 2019). Compared to the AMS, CHARON–PTR-MS subjects OA molecules to no significant thermal decomposition and to less ionization-induced fragmentation (Gkatzelis et al., 2018a); thus, it provides additional information on the detailed chemical composition of OA (Gkatzelis et al., 2018b; Muller et al., 2017). The concurrent measurements of AMS and CHARON–PTR-MS combined with PMF analysis can provide a comprehensive understanding of the sources of VOCs and the formation processes of SOA.
The chemical reactions of VOCs with atmospheric oxidants, e.g., hydroxyl radicals (OH), ozone (O3) and nitrate radicals (NO3), can generate semi-volatile, low-volatility and extremely low volatility organic compounds (SVOC, LVOC and ELVOC; Jimenez et al., 2009). These organic products are able to nucleate, leading to new particle formation (NPF), and/or condense onto pre-existing particles, contributing to particle growth and SOA mass (Ehn et al., 2014; Kirkby et al., 2016). In ambient observations, NPF has been mainly observed during daytime and is related to photochemical oxidation involving the formation of sulfuric acid and organic compounds (Kerminen et al., 2018). So far, only a few nighttime NPF events and/or particle growth events, which are likely related to the oxidation of BVOCs, have been observed in European rural and forested areas (Debevec et al., 2018; Huang et al., 2019; Kammer et al., 2018; Eerdekens et al., 2009). Kammer et al. (2018) observed high concentrations of monoterpenes and decreased O3 during nighttime particle nucleation and growth stages in the Landes forest, France. Recently, we found that highly functionalized organic nitrates generated from the reaction of NO3 radicals with VOCs can contribute significantly to the nighttime particle growth at a rural forested area in southwest Germany (Huang et al., 2019). However, the specific roles of oxidation of biogenic- and anthropogenic-VOC-to-SOA formation and nighttime particle growth events are still not understood well due to missing simultaneous measurements of VOCs and OA.
To follow our previous study (Huang et al., 2019), we performed online measurements of VOCs and OA particles using CHARON–PTR-MS and an AMS during July–August 2021 at a rural forested area in southwest Germany. We present the composition of OA detected by CHARON–PTR-MS in comparison to AMS measurements. The sources and evolution of OA and VOCs were investigated using the PMF analysis of VOCs and OA in combination with meteorological conditions. In addition, we illustrate the roles of VOC oxidation and SOA formation for nighttime high OA mass and particle growth. Thereby, this study contributes to an improved understanding of the evolution processes of VOCs and OA particles and the characterization of nighttime particle growth occurring in summer in rural central European forested areas.
2.1 Measurement location
The campaign was carried out from 17 July to 17 August 2021 at a rural site in southwest Germany. As shown in Fig. 1, the measurement site (8.43° E, 49.10° N) is located on the rooftop of a temperature-controlled building (25 °C) about 8 m above ground level on the campus north of the Karlsruhe Institute of Technology (hereafter KITcn). A canteen is located 300 m south of the sampling site on the campus, which is generally open for lunchtime, 11:30–14:00 local time (LT), on weekdays. Geographically, the campus is mostly surrounded by the Hardwald forest, composed mainly of pine trees (e.g., Scots pine and European beech), which are important contributors to BVOC emissions. Besides, the measurement site is ∼ 2–3 km east of the village of Eggenstein-Leopoldshafen (pop. 15 000), a mainly rural residential area,; ∼ 11 km north of downtown Karlsruhe (pop. 300 000); and ∼ 8–10 km northeast of the Karlsruhe industrial areas, including an 1815 MW coal-fired power plant and a refinery with a 15.5 Mt yr−1 capacity.
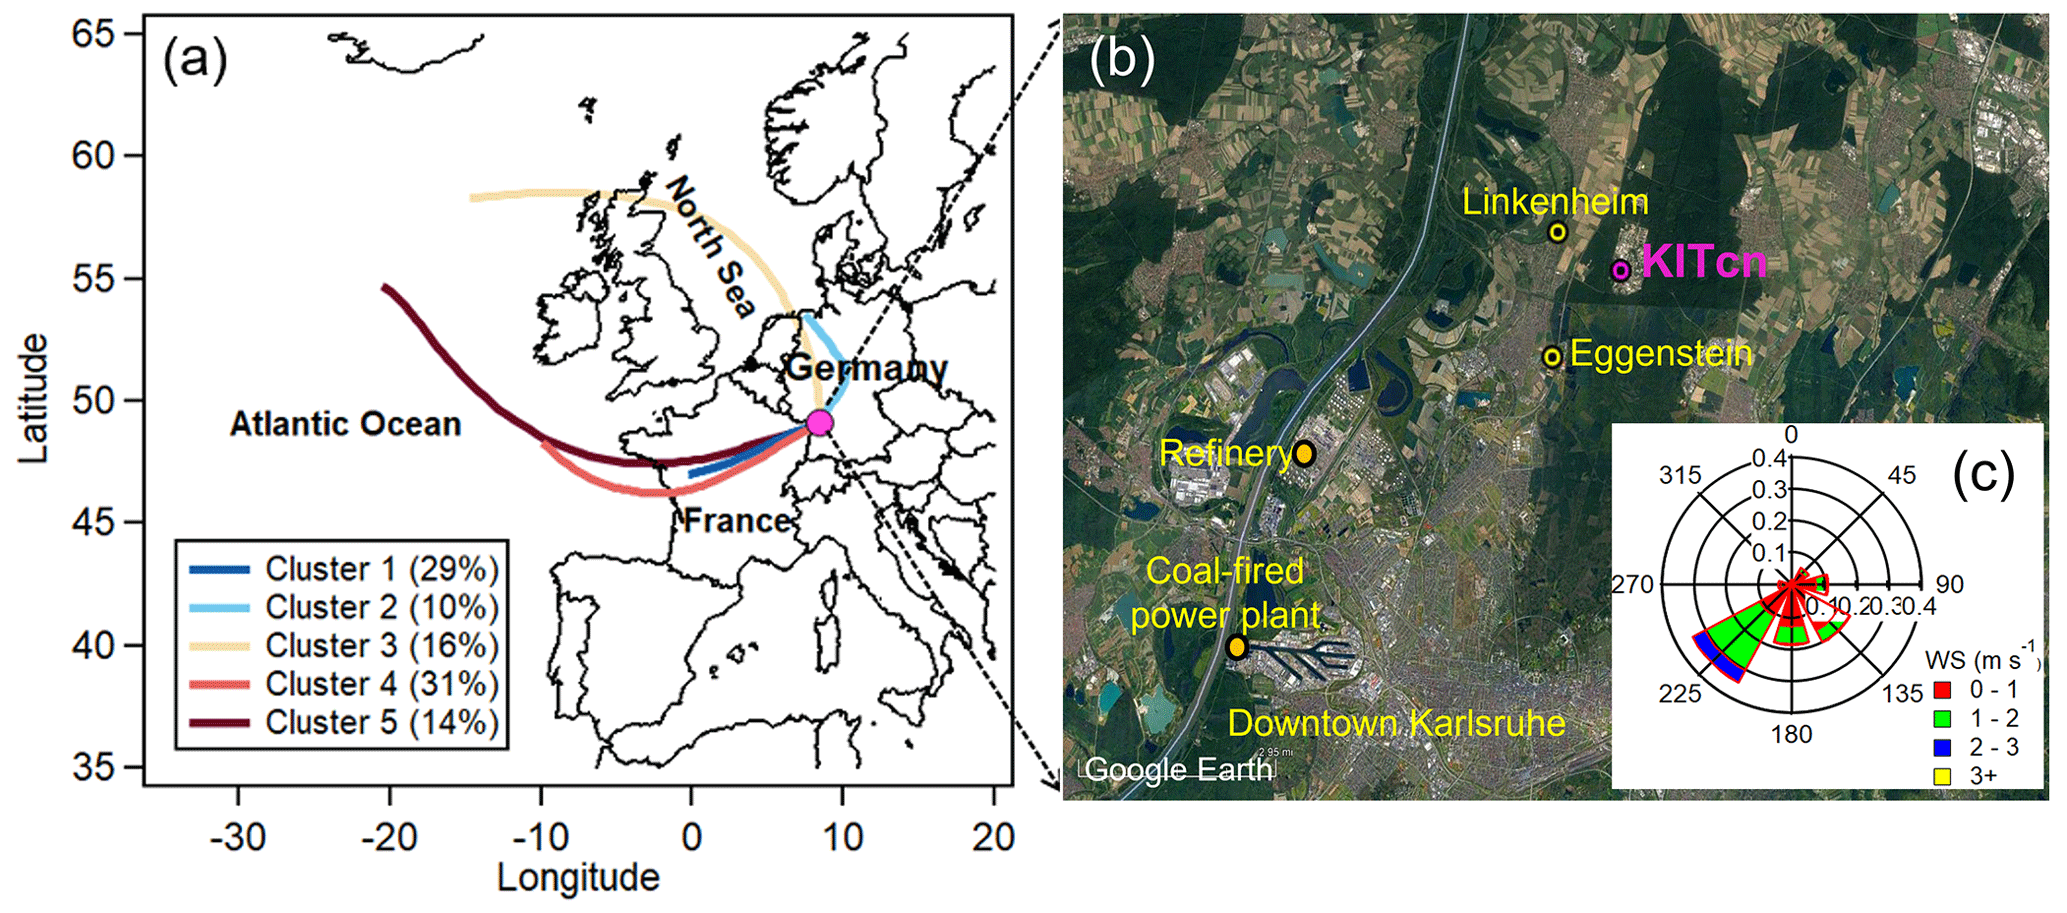
Figure 1Location of the measurement site along with the clusters of air mass back trajectories. (a) Five major air mass clusters and (b) map of the sampling location (KITcn), Eggenstein (LUBW air quality monitor station), two industrial sources (a refinery and a coal-fired power plant) and Linkenheim (a sampling site in summer 2016; Huang et al., 2019). (c) Wind rose plot for the entire campaign (satellite image © Google Earth).
2.2 Instrumentation
An overview of all instruments used for this campaign is given in Table S1 in the Supplement. Major instruments are described in the following sections.
2.2.1 CHARON–PTR-ToF-MS
A proton-transfer-reaction time-of-flight mass spectrometer (PTR-ToF-MS 4000X2; Ionicon Analytik GmbH) coupled with a particle inlet (Chemical Analysis of aeRosol ONline; CHARON) was employed to measure the VOCs and semi-volatile aerosol particles. The details of conventional PTR-ToF-MS can be found elsewhere (Jordan et al., 2009). The PTR-ToF-MS 4000X2 used here is equipped with an ion funnel that reduces the ion loss and thus enhances the sensitivity (Pugliese et al., 2020). The CHARON inlet has been described in detail elsewhere (Eichler et al., 2015; Muller et al., 2017). Briefly, the CHARON inlet consists of a charcoal denuder for stripping off gaseous organics, an aerodynamic lens for enriching particles in the instrument sub-sampling flow and a thermo-desorption unit for particle evaporation prior to chemical analysis by the downstream PTR-ToF-MS. The particle-enrichment factor of the CHARON inlet was calibrated with size-selected ammonium nitrate particles (60–700 nm) at the beginning and end of the campaign. The average enrichment factor for 150–700 nm particles was 18.6 ± 2.4 (Fig. S1). Decreasing efficiency was found for smaller particles (< 150 nm).
In this campaign, CHARON–PTR-MS was operated by alternatingly measuring gas and particle phases as was programmed by the data acquisition software (IoniTOF 4.0; Ionicon Analytik GmbH). We set the program sequence with one full alternating measurement cycle lasting 1 h, including 5 min high efficiency particulate air (HEPA) filter measurement of the particle background, 25 min for the CHARON particle-phase measurement, 3 min transition to gas-phase measurements, 25 min of VOC gas-phase measurement and another 2 min transition. Generally, 2–3 min is sufficient for the re-equilibrium of instrumental conditions between different measurement modes (Piel et al., 2021). The PTR drift tube pressure, voltage and temperature were maintained constantly at 2.7 mbar, 450 V and 100 °C, respectively, and the ion funnel was activated with a voltage of 45 V. These conditions result in a total (E is the electric field, and N is the number density of the gas molecules in the drift tube) of ∼ 120 Td for the VOC measurement. For the particle measurement, the thermo-desorption unit of the CHARON inlet was set at a temperature of 150 °C and a pressure of 7–8 mbar, and the downstream PTR was automatically switched to 60 Td. In both gas and particle measurements, raw mass spectra including ions from 15 to 398 Th were collected at a time resolution of 10 s. The mass resolution was ∼ 2000–2800 , where Δm is the full width at half mass for an ion peak of mass m.
During the gas-phase measurement, ambient air was sampled continuously from a 4.5 m perfluoroalkoxy (PFA; in. o.d.) tube at a total flow of 8 L min−1, and then a small subset of the flow (50–100 mL min−1) was sampled by the PTR-ToF-MS through polyetheretherketone (PEEK) tubing maintained at 80 °C. The gas background was determined manually every 2 d by measuring synthetic air for 20–30 min. During the particle-phase measurements, ambient particles were sampled using a PM2.5 inlet (Comde-Derenda GmbH; 16.7 L min−1) through a 3.45 m stainless-steel tube, and then a subset flow of ∼ 550 mL min−1 was directed to the CHARON inlet. Particle background was determined automatically via the HEPA filter measurement. The residence time of ambient air was less than 1 s to minimize the loss of semi-volatile organic compounds.
Gas calibrations were performed at the beginning and end of the campaign via dynamic dilution of a gas cylinder (Ionicon Analytik GmbH) containing 11 VOC species, i.e., methanol, acetone, isoprene, benzene, toluene, -xylenes, 1,3,5-trimethylbenezene, α-pinene and limonene (accuracy 10 % at ∼ 100 ppb). The sensitivity was in the range of ∼ 1000 cps ppb−1 for isoprene to 3000 cps ppb−1 for 1,3,5-trimethylbenzene. Raw data from CHARON–PTR-MS were processed using the IONICON Data Analyzer software (IDA 1.0.2; Ionicon Analytik) based on the algorithms by Müller et al. (2013). The details of CHARON–PTR-MS data analysis are given in Sect. S1 in the Supplement.
2.2.2 HR-ToF-AMS
A high-resolution time-of-flight AMS (Aerodyne Research Inc.) equipped with a PM2.5 aerodynamic lens was used to measure the non-refractory PM2.5 (NR-PM2.5) components, including OA, nitrate, sulfate, ammonium and chloride, at a time resolution of 1 min (Decarlo et al., 2006; Williams et al., 2013). The operation of the AMS is explained in our previous publications (Song et al., 2022; Huang et al., 2019). Briefly, ambient air was sampled by a PM2.5 inlet (flow rate 1 m3 h−1) shared with CHARON through a 3.45 m stainless-steel tube, and then a subset of the flow was sampled by the AMS at a flow rate of ∼ 84 cm3 min−1. The aerosol particles were then focused into a narrow beam by a PM2.5 aerodynamic lens with an effective transmission for particle sizes ranging from ∼ 70 to ∼ 2500 nm (vacuum aerodynamic diameter; dva) and heated by a vaporizer at 600 °C. The resulting vapors are ionized by electron impact (70 eV) and characterized by a time-of-flight mass spectrometer. The AMS ionization efficiency was calibrated using ∼ 400 nm dried ammonium nitrate aerosol particles. The AMS data were analyzed using the software packages SQUIRREL 1.60C and PIKA 1.20C. To account for the effect of particle bouncing loss, chemical-composition-based collection efficiencies (∼ 0.5) were applied to calculate the particle mass concentration (Middlebrook et al., 2012). Elemental analysis of OA, including the hydrogen-to-carbon ratio (H : C) and the oxygen-to-carbon ratio (O : C), was calculated using the improved ambient method (Canagaratna et al., 2015).
2.2.3 Other instruments
The mass concentrations of PM2.5 and PM10 were measured by an optical particle counter (OPC; Fidas200, Palas). The mass concentration of black carbon (BC) was measured by an aethalometer (AE33; Magee Scientific) with a time resolution of 5 min. Particle number concentrations (> 2.5 nm) were measured using a water-based condensation particle counter (CPC3789; TSI Inc.). Particle number size distributions ranging from 10 to 410 nm were measured using a nanoparticle sizer (NanoScan; TSI Inc.) at a time resolution of 1 min, and distributions ranging from 13.6 to 763.5 nm were measured using a scanning mobility particle sizer (SMPS; TSI Inc.) at a time resolution of 7 min. A chemical ionization mass spectrometer utilizing iodide as the reagent ion coupled with a Filter Inlet for Gases and AEROsols (FIGAERO–CIMS; Aerodyne Research Inc.) was deployed for measuring oxygenated organic molecules in both gas and particle phases from 27 July to 9 August (Huang et al., 2019).
The mixing ratios of ammonia (NH3) were measured using cavity ring-down spectroscopy (G2103; Picarro Inc.). The concentrations of O3 and NO2 were measured using the gas monitors O341M and AS32M (both Environment S.A.). Due to a data acquisition malfunction of the gas monitors, we adopted the hourly gaseous data of O3, NO2, NO and SO2 obtained from the air quality monitor station Eggenstein (LUBW), located about 2.5 km southwest of the measurement site (Sect. S2, Figs. S2–S3). Meteorological data, including temperature, relative humidity, wind direction and speed, global radiation, and precipitation, were measured on the rooftop by a compact sensor (WS700; Lufft). Planetary boundary layer (PBL) height data were extracted from the European Centre for Medium-Range Weather Forecasts ERA5 reanalysis hourly data (Hersbach et al., 2020).
2.3 PMF receptor model
PMF analysis is widely used to identify the sources of VOCs (Gkatzelis et al., 2021; L. Wang et al., 2021, 2020; Li et al., 2022; Pallavi et al., 2019; Yuan et al., 2012) and OA (Crippa et al., 2014; Chen et al., 2022; Zhang et al., 2011; Xu et al., 2015; Song et al., 2022). The details of the PMF model can be found elsewhere (Paatero and Tapper, 1994). In this study, PMF analyses were performed using the Igor-Pro-based PMF evaluation tool (PET v3.0) on the VOC and OA datasets measured individually by CHARON–PTR-MS and AMS.
For preparation of the PMF analysis, low-molecular-weight VOC species like formaldehyde and methanol were excluded because they can come from many sources and cannot provide additional source information. In addition, less abundant VOC species with a large amount of missing data (≥ 20 %) were also excluded from the input of the PMF analysis. Finally, the dataset including 98 major VOC ions was used for the PMF analysis (Table S2). The average fraction of the 98 VOC ions to the total VOC signals was 85 % ± 3 % during the entire measurement period. Note that PTR-ToF-MS cannot detect some VOCs well, such as small alkanes, alkenes with a proton affinity lower than H2O and/or highly oxidized organic species. However, the PMF analysis of VOC data measured by the PTR-ToF-MS still has advantages in understanding biogenic and anthropogenic emission sources and their potential contributions to secondary VOC and particle formation (L. Wang et al., 2020; Gkatzelis et al., 2021; Li et al., 2022; Wu et al., 2022). In this study, the uncertainty matrix data were determined according to the method detection limit (MDL) of each VOC ion and the error fraction (Paatero et al., 2014).
Based on the high-resolution mass spectra of AMS-measured OA ( 12–120), an unconstrained PMF analysis was performed to resolve the sources of OA (Ulbrich et al., 2009). Note that no constrained PMF analysis of AMS-measured OA was performed in this study as it cannot improve the interpretation of SOA factors. In addition, we performed a PMF analysis of CHARON-measured OA mass spectra ( 60–300) with chemical-formula-assigned organic molecules. We excluded some small particulate ions like C3H and C3H from the PMF analysis because they could have been contributed by fragmentation of multiple organic compounds and cannot provide useful source information.
2.4 Air mass back trajectory analysis
To investigate the impact of air mass origins on atmospheric pollutants, 72 h back trajectories with an altitude of 100 m were computed for every hour using the National Oceanic and Atmospheric Administration (NOAA) Air Resources Laboratory Hybrid Single-Particle Lagrangian Integrated Trajectory (HYSPLIT) model (Stein et al., 2015). Finally, all trajectories were grouped into different clusters based on their similarity in spatial distributions (Petit et al., 2017).
We first give an overview of our measurements and then discuss the assignment of different sources according to the PTR-MS-measured VOCs, AMS-measured OA particles and CHARON-measured semi-volatile OA particles. Then we discuss the role of air mass origins on sources of VOCs and OA particles. Finally, we discuss the contribution of semi-volatile organic compounds to nighttime particle formation and growth.
3.1 Overview of the field observations
The time series of meteorological parameters during the entire campaign is given in Fig. 2. The ambient temperature and relative humidity ranged from 10.8 to 32.2 °C (average – 20.2 ± 4.3 °C) and 32 % to 99 % (71 % ± 17 %), respectively. The wind speeds varied from < 0.1 to 3.9 m s−1 (0.97 ± 0.6 m s−1). The measurement site was subject to urban and industrial emissions, especially from southwesterly wind directions (Fig. 1). Using the HYSPLIT analysis, 783 air mass backward trajectories in total were obtained for the entire campaign, which were grouped into five clusters. Cluster 1 (C1) shows the southwesterly air masses passing through France and the urban area of Karlsruhe (29 % fraction), while C2 reflects air masses from northern Germany (10 % fraction) also transported over forested areas, and C3 (16 % fraction) is the air masses originating from the North Sea and also passing through forested areas. In addition, C4 (31 %) and C5 (14 %) are air masses transported from the Atlantic Ocean.
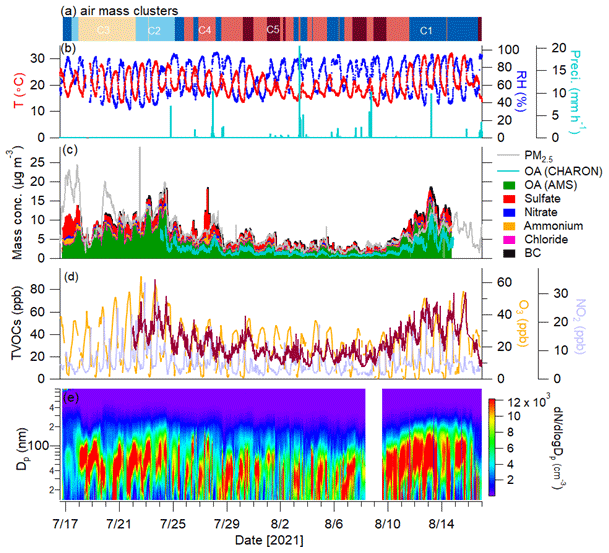
Figure 2Time series of (a) origins of air mass clusters and (b) temperature (T), relative humidity (RH) and precipitation. Time series of (c) mass concentrations of PM2.5 measured by the OPC; OA measured by CHARON; OA, sulfate, nitrate, ammonium, and chloride measured by the AMS; and BC. Time series of (d) concentrations of total VOCs (TVOCs; brown line), O3 and NO2 and (e) particle number size distribution measured by the SMPS.
The total mixing ratios of measured VOCs (98 VOC ions) ranged from 7.6 to 88.9 ppb with an average of 31.2 ± 13.4 ppb. As shown in Fig. S4, the average mixing ratios of isoprene, monoterpenes and sesquiterpenes were 1.61 ± 0.96 ppb, 1.71 ± 2.48 ppb and 6.5 ± 14.8 ppt, respectively. The diurnal variation in isoprene showed a clear increase during daytime, which was related to the emissions of isoprene enhanced by temperature and sunlight (Fig. S5). In contrast, monoterpenes and sesquiterpenes showed higher concentrations at night and very low levels during daytime. Generally, higher temperatures lead to increased emissions of monoterpenes and sesquiterpenes, while their concentrations can be rapidly depleted by photochemical oxidation as well as by increased PBL height during the daytime (Hellén et al., 2018). Compared to isoprene and monoterpenes, lower concentrations of benzene (0.30 ± 0.23 ppb) and toluene (0.28 ± 0.22 ppb) were observed.
The average mass concentration of PM2.5 measured by the OPC was 6.0 ± 3.6 µg m−3 over the entire campaign (Fig. 2c). The time series of mass concentrations of NR-PM2.5 measured by the AMS (plus BC) agrees well with the OPC-measured PM2.5 (Fig. S6). OA was the largest contributor, with an average contribution of 67 % ± 11 % to the total PM2.5 mass, followed by sulfate (23 % ± 9 %), BC (7 % ± 3 %), ammonium (6 % ± 2 %), nitrate (3 % ± 2 %) and chloride (< 1 %). The average OA mass (4.2 ± 2.8 µg m−3) was within the range (0.9–8.2 µg m−3) observed at other rural European sites (Crippa et al., 2014). However, the OA mass was slightly lower than that (5.0 ± 3.3 µg m−3) reported by our previous study conducted at Linkenheim in summer 2016, ∼ 2 km northwest of the current measurement site (Huang et al., 2019). This could have been caused by wet scavenging due to frequent rainfall in the present study (Fig. 2b). During the campaign, the particle number size distributions showed regular particle growth starting after sunset and lasting well into the morning of the following day. Similar nighttime particle growth has been observed near our measurement location during previous summers (Huang et al., 2019). More discussions of nighttime particle growth are presented in Sect. 3.4.
The time series of OA in the ion mass range of 60–300 measured by CHARON showed a good agreement with that of AMS-measured OA (r = 0.93). On average, CHARON can detect 62 % ± 18 % of total OA mass measured by the AMS, which is comparable to the mass recovery of biogenic SOA measured by CHARON–PTR-MS to SMPS mass (80 % ± 10 %) in chamber experiments (Gkatzelis et al., 2018a). Figure S7 shows the median OA mass spectra of CHARON–PTR-MS measurements averaged over the entire campaign. Mass concentrations associated with an individual signal ranged from 0.2 to 183 ng m−3. A total of 191 species are assigned well (Fig. 3 and Table S3), contributing 72 % ± 5 % of total CHARON-measured OA mass. The majority of ions detected by CHARON are present in the lower mass range ( < 250), which is mainly due to the fragmentation of larger masses during the ionization processes of PTR-MS (Muller et al., 2017; Gkatzelis et al., 2018a). Figure 3a shows the mass distributions associated with pure and oxygenated hydrocarbon ions (CxH and CxHyO) resolved by carbon and oxygen atom numbers. The most abundant species are characterized by a formula of CxHyO, accounting for 30 % ± 4 % of total OA measured by CHARON, followed by CxH (13 % ± 3 %), CxHyO (11 % ± 3 %) and CxHyO (10 % ± 2 %). Consistent with previous studies, CHARON–PTR-MS is suitable for measuring the semi-volatile and less oxidized organic compounds (CxHyO) in the particle phase. However, the detection of highly oxidized organic species is limited due to the thermo-desorption temperature of CHARON (150 °C) and fragmentation during PTR ionization. Figure 3 shows the diurnal variations in CxHyO during the entire measurement period. The groups of CxHyO showed higher concentrations during nighttime. Previous studies have reported that CxH can be attributed to hydrocarbon-like compounds or to the fragmented ions of oxygenated ions through neutral loss of water (–H2O), a carbonyl group (–CO) or a carboxyl group (–CO2) (Gkatzelis et al., 2018b; Peng et al., 2023). The time series of CxH is strongly correlated with CxHyO (r = 0.98) and CxHyO (r = 0.82), suggesting that they were mainly contributed by the fragmentation of oxygenated ions at higher masses. In contrast, CxHyO showed peak concentrations at noon, suggesting that they were related to daytime photooxidation processes.
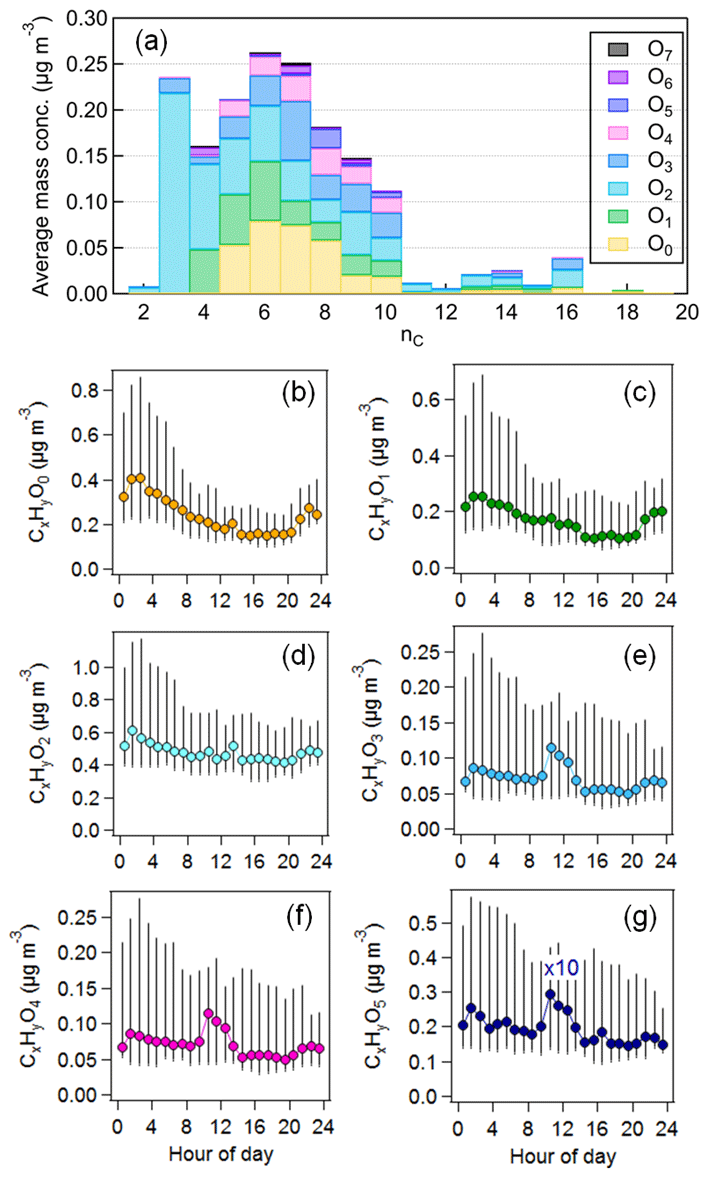
Figure 3(a) Average mass distributions of identified particulate organic species (CxHyOz) resolved by the carbon and oxygen numbers (nC and nO) from CHARON–PTR-MS. (b–g) Average diurnal variations in CxHyO0–5. Vertical lines represent the 25th and 75th percentiles.
3.2 Source identification of organic aerosol compounds
3.2.1 Source attribution of VOCs (PTR-MS)
In this study, a five-factor solution was selected as the optimum interpretable solution for the PMF analysis of VOCs. After carefully checking the factor profiles, diurnal patterns and correlations with external tracers (Figs. 4 and S8), we assigned these five VOC factors to traffic VOCs, terpenes, OVOCs related to aromatic hydrocarbon oxidation (aromatic OVOCs), OVOCs related to BVOC oxidation (biogenic OVOCs) and OVOCs related to aged air masses (aged OVOCs). They constituted an average of 12 % ± 13 %, 11 % ± 16 %, 11 % ± 9 %, 37 % ± 29 % and 29 ± 21 %, respectively, of total VOC mixing ratios during the entire campaign.
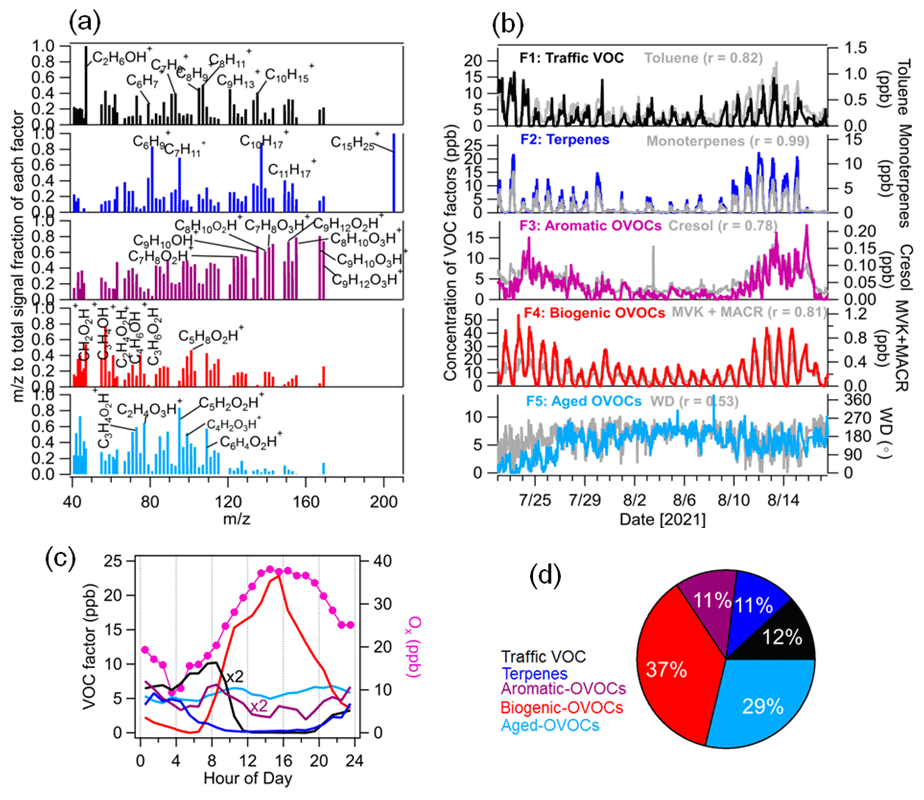
Figure 4Source apportionment of VOCs measured by the PTR-MS. (a) Normalized VOC factor spectra from PMF analysis on the peaks (relative contribution of each factor to each ion). (b) Time series of VOC factors including traffic, terpenes, aromatic OVOCs, biogenic OVOCs and aged OVOCs with external tracer species including toluene, monoterpenes, cresol, MVK + MACR and wind direction (WD). (c) Median diurnal variations in VOC factors and Ox (NO2 + O3). (d) The relative contribution of each VOC factor to total VOC concentrations.
The first factor was identified as traffic VOC emissions with high contributions to aromatic hydrocarbon ions such as C6H ( 79.05), C7H ( 93.07), C8H ( 105.07), C8H ( 107.09), C9H ( 121.10) and C10H ( 135.12). They can be assigned to benzene, toluene, styrene, xylenes, C9-aromatics and C10-aromatics, respectively, which are typical tracers for vehicular emissions (Gkatzelis et al., 2021; Wang et al., 2021; Crippa et al., 2013b). This factor also had the predominant contribution to C2H7O+ ( 47.05, ethanol), which was mainly attributed to the emissions of ethanol-gasoline-fueled cars on the campus. Good correlations were found for the traffic VOC factor with ethanol (r = 0.82), benzene (r = 0.67) and toluene (r = 0.82). The diurnal variation in this factor peaked during the morning rush hour (07:00–09:00 LT), supporting the theory that it was related to traffic emissions. As shown in Fig. S9, the bivariate polar plot analysis showed that higher concentrations of the traffic VOC factor were observed in the northeast wind sector with low wind speeds (0–1.5 m s−1), suggesting that it was related to local traffic emissions.
The second VOC factor was characterized as terpenes with dominant contributions to C5H ( 67.50), C6H ( 81.70), C7H ( 95.80), C10H ( 137.13), C11H ( 149.10) and C15H ( 205.20). C10H and C15H were assigned as monoterpenes and sesquiterpenes, respectively, while C5H, C6H, C7H and C11H are ion fragments from monoterpenes and sesquiterpenes formed inside the PTR instrument (Kari et al., 2018; Tani et al., 2003; Kim et al., 2009). The O C ratio of the terpene factor was low (0.07). As expected, the time series of the terpene factor correlated tightly with that of the monoterpenes (r = 0.99) and sesquiterpenes (r = 0.88). The diurnal cycle of the terpene factor showed higher concentrations during nighttime. However, a fast decrease in terpenes was observed during daytime, which is due to rapid consumption of monoterpenes and sesquiterpenes by photochemical oxidation and by increasing PBL heights.
The third VOC factor contains abundant oxygenated aromatic hydrocarbon ions such as C7H8O1–3H+, C8H10O2–3H+, C9H10O1–3H+ and C9H12O1–3H+, which are attributed to gaseous products of aromatic hydrocarbon oxidation. For example, C7H8O1H+, C7H8O2H+ and C7H8O3H+ can be assigned to cresol, dihydroxy-toluene and dicarbonyl-epoxide, which have been identified as products from toluene oxidation in simulation chamber studies (Zaytsev et al., 2019). Y. Wang et al. (2020) identified C9H10O1–3H+ and C9H12O1–3H+ as gaseous products of trimethylbenzene oxidation in laboratory experiments. The time series of the third VOC factor correlated well with those of gaseous products of aromatic oxidation, e.g., C7H8O1–3H+ (r = 0.78-0.85) and C9H10O1–3H+ (r = 0.88-0.92). Therefore, we defined it as an oxygenated VOC factor related to aromatic hydrocarbon oxidation (aromatic OVOCs). The diurnal cycle of aromatic OVOCs showed a peak during the morning rush hour (07:00–09:00 LT), which was likely related to the oxidation of aromatic hydrocarbons from traffic emissions. We also observed a weaker peak of aromatic OVOCs during the afternoon rush hour (16:00–17:00 LT). This can be explained by a stronger dilution of the expanded PBL for the afternoon rush hour.
The fourth VOC factor was characterized by high contributions to smaller oxygenated VOCs (OVOCs) such as CH2O2H+, C3H4OH+, C2H4O2H+ and C3H6O2H+, which can be assigned to formic acid, acrolein, acetic acid and propionic acid, respectively. In addition, C4H6OH+ is an important constituent of this factor, which was attributed to the isoprene oxidation products such as methyl vinyl ketone and/or methacrolein (MVK + MACR; Wennberg et al., 2018). The O C ratios of this factor (0.39) were higher than those of the terpene factor (0.07). The time series of this factor showed strong correlations with that of formic acid (r = 0.96), acetic acid (r = 0.95) and MVK + MACR (r = 0.81) as well as with Ox (NO2 + O3, r = 0.86), an indicator of photochemical oxidation processes. It suggests that this VOC factor was mainly related to the photochemical oxidation processes of BVOCs. The diurnal variations in this factor showed significantly higher concentrations during daytime. Moreover, the bivariate polar plot analysis showed that high concentrations of this factor were observed in the east and southeast wind sectors, suggesting that it was mainly related to the biogenic emissions. Therefore, this VOC factor can be attributed to OVOCs related to BVOC oxidation (biogenic OVOCs). Recently, Li et al. (2021) reported that the daytime oxidation of monoterpenes could produce more-oxidized gaseous organic compounds (e.g., C10H15O4–6H+ and C10H16O4–6H+) in the French Landes forest, according to the binned PMF analysis of VOCs detected by a Vocus-PTR-MS. In the present study, these more oxidized monoterpene-derived gaseous organic compounds in the gas phase cannot be detected well by our PTR-MS and thus are not included in further PMF analysis.
The fifth VOC factor consists of lower molecular weight OVOCs such as C3H4O2H+, C2H4O3H+, C3H4O3H+, C5H2O2H+, C4H2O3H+ and C6H4O2H+. This VOC factor had no specific marker ions related to sources and/or formation processes. Its time series exhibited insignificant temporal variation compared to other VOC factors but showed a similar trend to the variation in wind direction (r = 0.53). The diurnal variations in this factor were less pronounced during the entire campaign. The O C ratio of this factor (r = 0.39) was higher than that of other VOC factors like terpenes and traffic VOC (0.07–0.31). The bivariate polar plot analysis showed that high concentrations of this factor were observed in the west or southwest wind sectors with high wind speeds. Consistently, the long-range-transported Atlantic air mass clusters (C4 and C5) had high fractions of this factor compared to total VOC mixing ratios. Based on these results, the fifth VOC factor can be denoted “OVOCs associated with the advection of aged air masses” (aged OVOCs).
3.2.2 Source apportionment of OA particles (AMS)
A five-factor solution was selected as the optimal result of PMF analysis of AMS-measured OA (Figs. 5 and S10). These five factors were categorized as a hydrocarbon-like OA (HOA), two semi-volatile oxygenated OAs (SV-OOA1 and SV-OOA2), a low-volatility oxygenated OA (LV-OOA) and a marine-related oxygenated OA (MOOA). They constituted 6 % ± 5 %, 20 % ± 12 %, 17 % ± 9 %, 35 % ± 17 % and 22 % ± 16 % of total OA mass on average during the entire campaign.
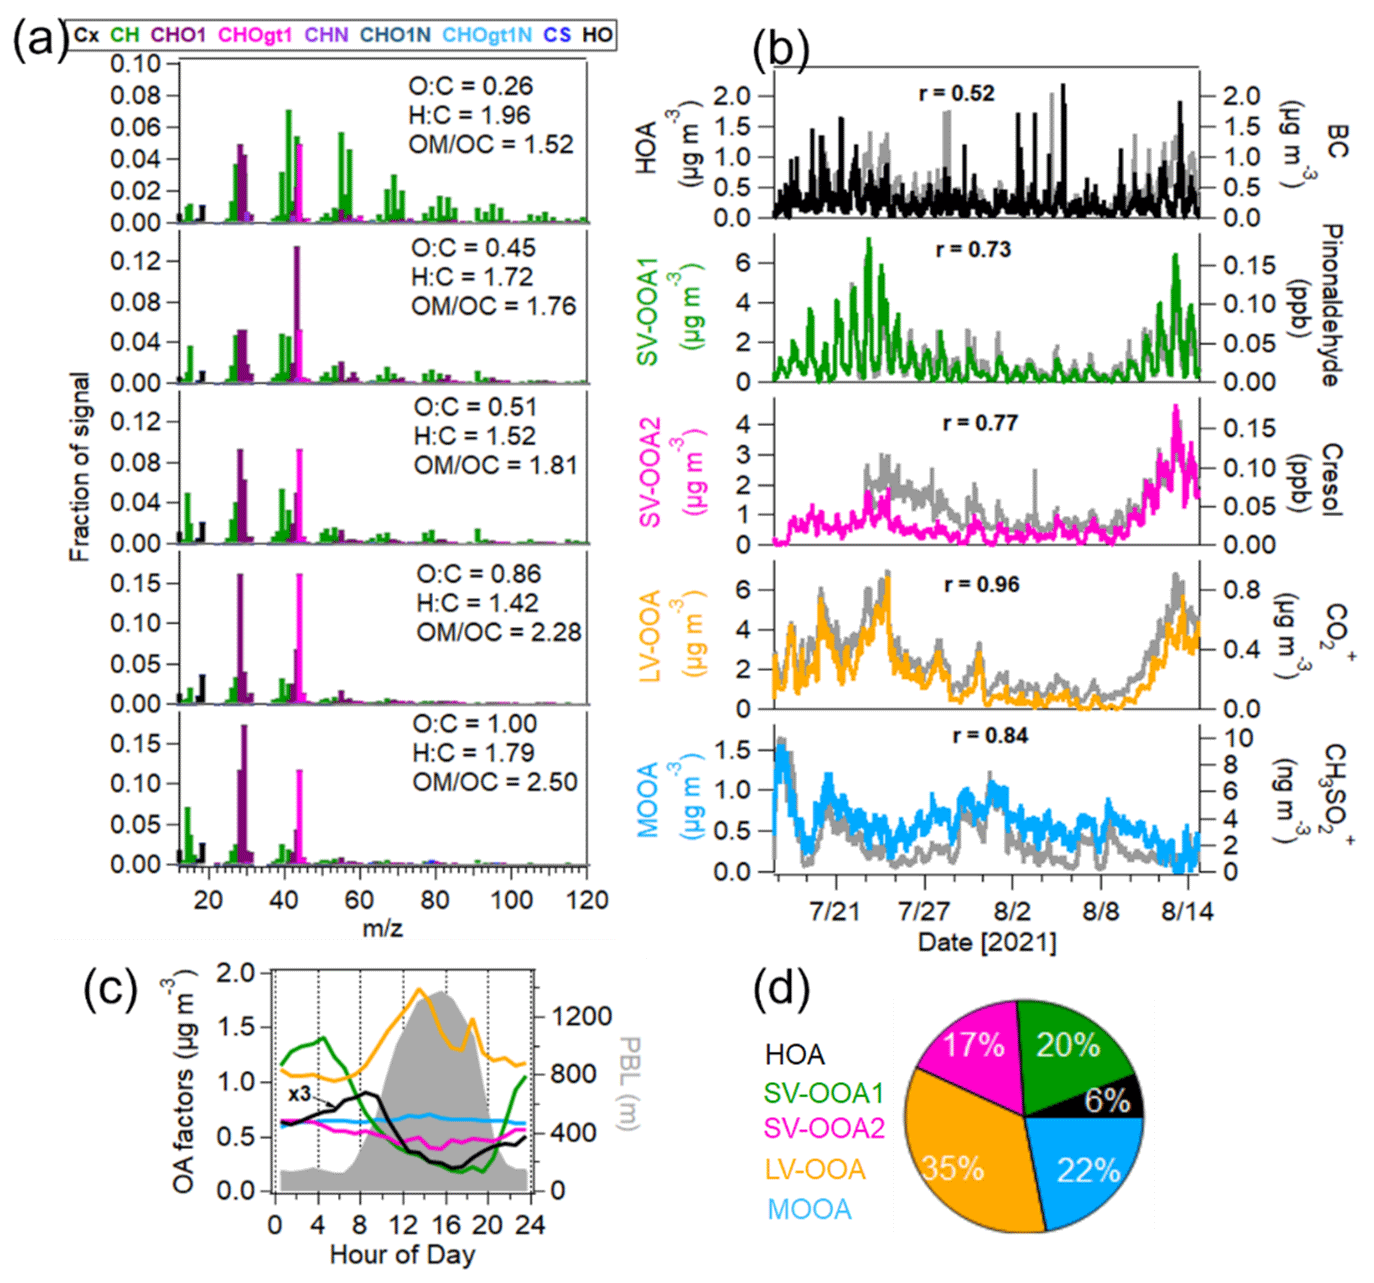
Figure 5Source apportionment of OA measured by the AMS. (a) Mass spectra of OA factors – hydrocarbon-like OA (HOA), two semi-volatile oxygenated OAs (SV-OOA1 and SV-OOA2), low-volatility oxygenated OA (LV-OOA) and marine oxygenated OA (MOOA). (b) Time series of OA factors and external tracer species (BC, pinonaldehyde and cresol measured by the PTR-MS and CO and CH3SO measured by the AMS). (c) Median diurnal variations in OA factors and PBL height. (d) Mass fraction of OA factors in the total OA mass.
The first OA factor was HOA, dominated by alkyl fragments such as C3H, C3H, C4H and C4H, which was similar to that from traffic emissions reported in previous studies (Canagaratna et al., 2004; Crippa et al., 2014). The time series of HOA correlated well with the traffic VOC factor (r = 0.72) and moderately with BC (r = 0.52), confirming that they are related to primary traffic emissions. The correlation of HOA and BC could have deteriorated due to the different emission ratios of HOA BC of different fuel types and vehicles passing the sampling site. Generally, gasoline vehicles have higher emission ratios of HOA BC (0.9–1.7) than diesel vehicles (0.03–0.61; DeWitt et al., 2015). In this study, the average HOA BC was 0.38 ± 0.31, suggesting dominant contributions of diesel vehicles. The diurnal cycle of HOA showed a peak during the morning rush hour (08:00–09:00 LT). No HOA peak was found in the afternoon, which is likely associated with the fact that strong photochemical oxidation, high wind speeds and expanded PBL in the afternoon lead to a decrease in HOA mass. In addition, the bivariate polar plot analysis also showed that HOA was associated with northeast sector wind with low wind speeds (0–1.5 m s−1), suggesting that HOA was mainly attributed to local traffic emissions.
The second and third OA factors were two semi-volatile oxygenated OA (SV-OOA) factors with different mass spectra and temporal variations. The O : C ratios of SV-OOA1 and SV-OOA2 were 0.45 and 0.51, respectively, which are within the typical range of 0.2–0.6 reported for SV-OOA identified by many AMS measurements (Ng et al., 2010). A good correlation was found between SV-OOA1 and particulate nitrate (r = 0.73), indicating their semi-volatile natures. Besides, SV-OOA1 showed a good correlation with the VOC terpene factor (r = 0.71). SV-OOA1 showed distinct diurnal patterns with higher mass concentrations during nighttime. Therefore, SV-OOA1 was related to the nighttime oxidation of terpenes. In contrast, SV-OOA2 had less pronounced diurnal variation. SV-OOA2 showed a good correlation with the aromatic OVOC factor (r = 0.70). Furthermore, we observed that the mass concentrations of SV-OOA2 increased from 10 to 14 August when the air masses were transported from urban Karlsruhe. Therefore, SV-OOA2 was likely related to urban emissions. Please note that we cannot attribute SV-OOA1 and SV-OOA2 to specific anthropogenic and biogenic sources solely based on the AMS–PMF analysis.
The fourth OA factor was identified as low-volatility oxygenated OA (LV-OOA) with a higher O : C ratio of 0.86. The mass spectrum of LV-OOA was distinguished by the predominant ions of 44 (CO) and 28 (CO+), which is consistent with previous observations for LV-OOA from AMS measurements (Ng et al., 2010). LV-OOA showed a good correlation with CO (R = 0.96) and fair correlations with Ox(r = 0.48) and the biogenic OVOC factor (r = 0.58). This indicates that LV-OOA mainly comes from the photochemical oxidation of BVOCs. As expected, the diurnal cycle of LV-OOA showed a peak in the afternoon (12:00–14:00 LT) with higher temperatures and O3 levels as well as intensive radiation. The bivariate polar plot analysis showed that high concentrations of LV-OOA were observed in the east and/or southeast wind sectors, suggesting that it was mainly associated with the oxidation of biogenic emissions.
The fifth OA factor was denoted “marine oxygenated OA” (MOOA), with the highest O C ratio of 1.00. The time series of MOOA strongly correlated with 79 (CH3SO; r = 0.84), an ion derived from the fragmentation of methanesulfonic acid (MSA) and a marker of marine sources (Crippa et al., 2013a; Huang et al., 2018). Based on the back trajectory analysis, the concentrations of MOOA showed a significant increase on dry days when the measurement site was influenced by the air masses from the Atlantic Ocean. Crippa et al. (2013a) identified an MOOA factor in Paris, France, in summer 2009, where a significant increase in MOOA mass was also observed in air masses from the Atlantic Ocean. In this study, MOOA showed a higher O : C ratio compared to that (0.57) observed in Paris in summer 2009 (Crippa et al., 2013a). Furthermore, the diurnal variation in MOOA was relatively flat during the entire measurement period. The bivariate polar plot analysis also showed that high concentrations of MOOA were observed in the western wind sectors with high wind speeds. The results confirm that MOOA was associated with aged marine emissions from the Atlantic Ocean. This is in line with the finding by Shen et al. (2019) that the aerosol particles in this region are influenced by marine emission from the Atlantic Ocean in summer.
3.2.3 Source attribution of semi-volatile OA particles (CHARON)
In this study, a six-factor solution including two factors that could not be assigned to a specific source (F5 and F6; Figs. 6 and S11) was selected as the best interpretable solution for the PMF analysis of OA measured by CHARON–PTR-MS. The four factors assigned can be defined as cooking-related OA (COA), SOA related to aromatic oxidation (aromatic SOA), and SOA related to daytime and nighttime BVOC oxidation (daytime and nighttime BSOA; see Fig. 6). During the entire campaign they contributed 9 % ± 9 %, 5 % ± 5 %, 17 % ± 17 % and 28 % ± 21 % to the total OA mass measured by CHARON, respectively, and the unassigned factors (F5 and F6) accounted for 16 % ± 18 % and 26 % ± 23 %.
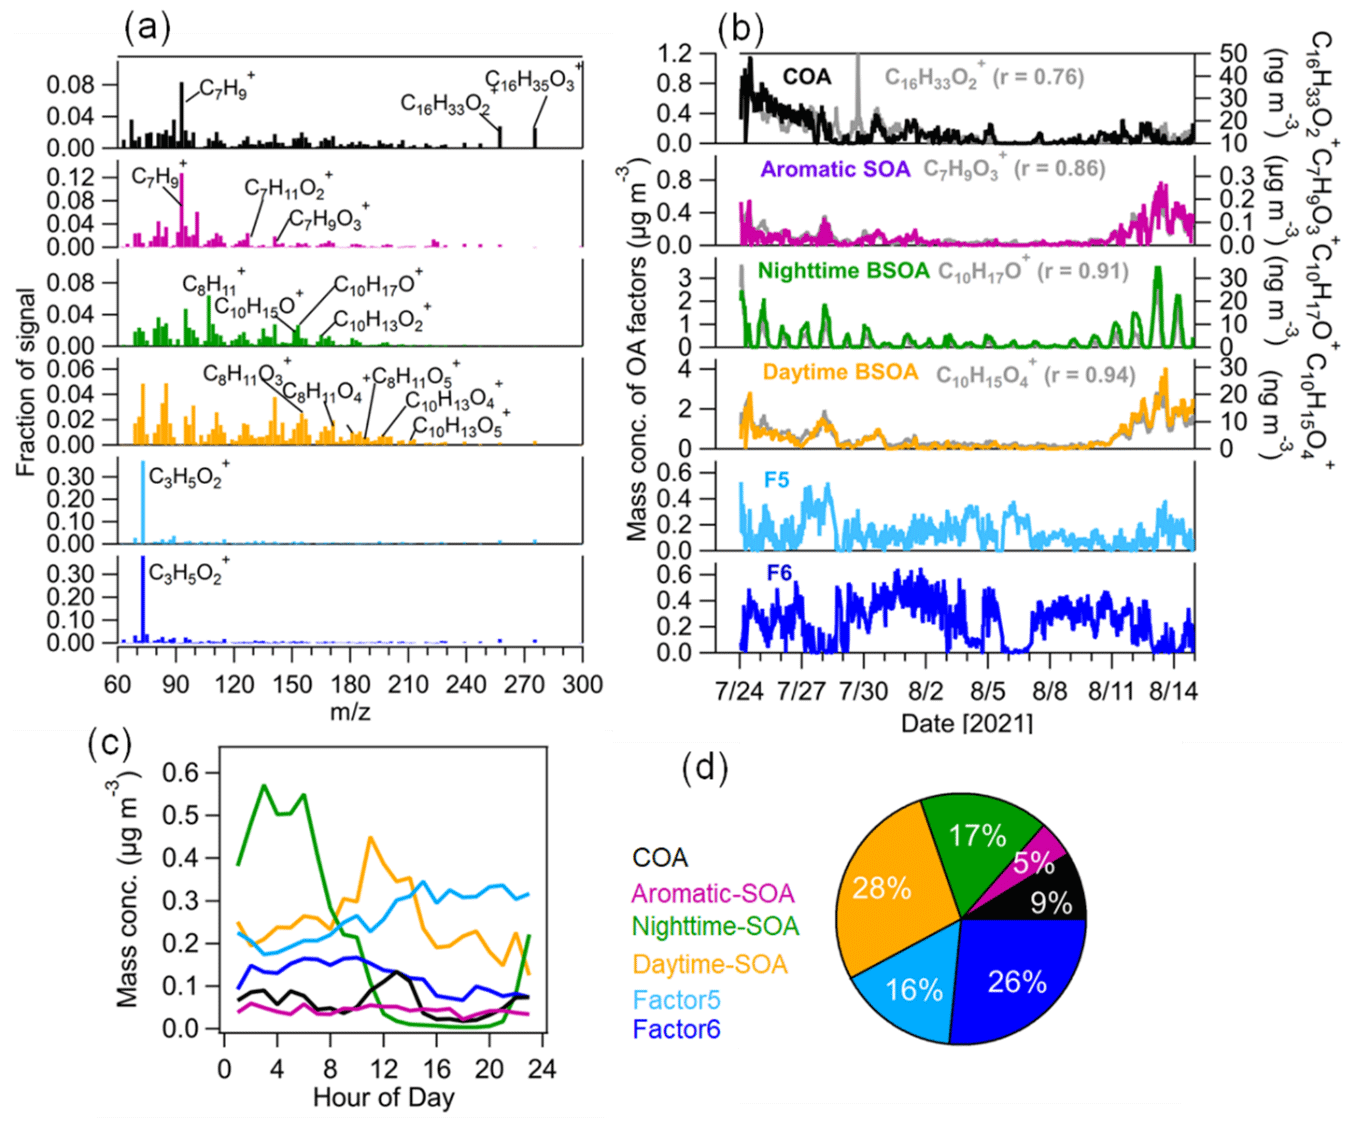
Figure 6Source apportionment of OA measured by CHARON–PTR-MS. (a) Mass spectra of the six factors of OA from the PMF analysis; (b) time series of the six OA factors including cooking-related OA (COA), aromatic-hydrocarbon-oxidation-related SOA (aromatic SOA), and nighttime and daytime biogenic SOA (daytime SOA and nighttime SOA) with marker ions including C16H33O, C7H9O, C10H17O+ and C10H15O, respectively. Two factors (F5 and F6) dominated by C3H5O could not be assigned to specific sources. (c) Median diurnal variations in OA factors and (d) relative contributions of each OA factor to total OA mass.
The first OA factor was characterized by a high fraction of C7H, C16H33O and C16H35O. C16H33O and C16H35O can be tentatively assigned to long-chain fatty acids. For example, C16H33O was tentatively assigned to palmitic acid, which is a fatty acid mainly released from cooking emissions. Palmitic acid can be used as a tracer for cooking-related OA (Reyes-Villegas et al., 2018). Furthermore, the diurnal variation in this factor showed a peak at lunchtime (12:00–14:00 LT), which is in line with the opening hours of the canteen located 300 m south of the sampling site in the campus. Therefore, it is reasonable to call this a factor associated with cooking emissions. As expected, the time series of COA correlated well with C16H33O. Note that we cannot assign the particulate C7H ion, which is likely produced from the fragmentation of oxidized organic compounds at higher mass, to specific organic compounds. In this study, the COA factor was not resolved from the unconstrained AMS–PMF analysis, which is likely due to the lack of specific marker ions of cooking emissions measured by the AMS. On other hand, cooking-related oxidized species may be mixed into HOA resolved from the AMS–PMF analysis, which leads to the HOA having a high O : C value (0.26; Mohr et al., 2012).
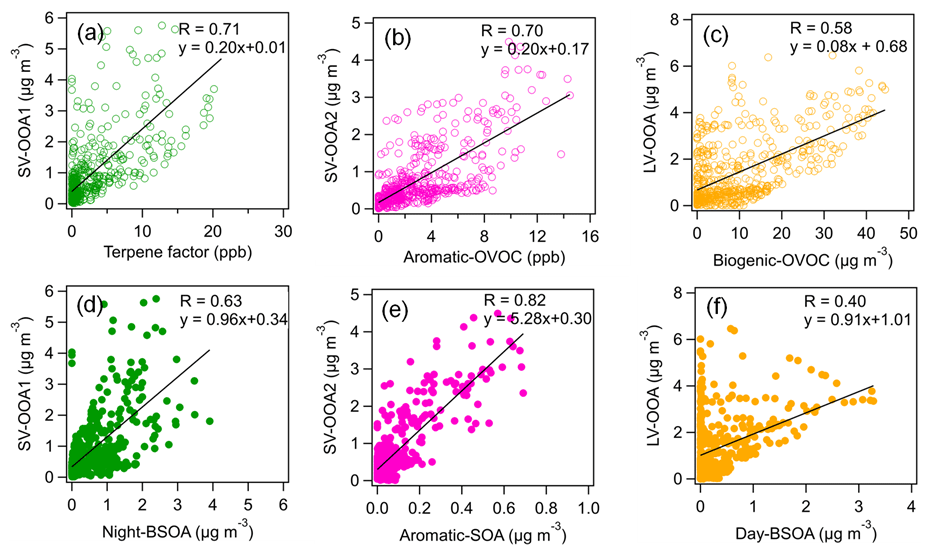
Figure 7Correlations of three AMS-measured SOA factors (SV-OOA1, SV-OOA2 and LV-OOA) with VOC factors (terpene, aromatic OVOC and biogenic OVOC) and CHARON-measured SOA factors (nighttime BSOA, aromatic SOA and daytime BSOA).
The second OA factor was defined as aromatic SOA characterized by high fractions of C6–9HyO, which are likely oxidation products of aromatic hydrocarbons as indicated by previous chamber studies (Y. Wang et al., 2020; Zaytsev et al., 2019). The time series of this factor correlated with oxygenated aromatic hydrocarbon ions, e.g., C7H9O (r = 0.86). Furthermore, we observed an enhancement of aromatic SOA during 10–14 August with the influence of urban air masses (Fig. 6). Despite the dilution of the boundary layer during the day, there is little daytime variation in the aromatic SOA concentration. The transport of aromatic SOA from urban Karlsruhe might offset the dilution effects of the expanding boundary layer. The time series of aromatic SOA showed a good correlation (r = 0.82) with SV-OOA2 from the AMS–PMF analysis (Fig. 7), indicating that SV-OOA2 can be attributed to the oxidation of aromatic hydrocarbons.
The third OA factor contains high contributions from ions such as C10H15O+, C10H17O+ and C10H13O, which can be identified as weakly oxidized products of monoterpenes or their fragments (Li et al., 2021; Gkatzelis et al., 2018b). As expected, the time series of this factor correlated tightly with C10H17O+ (r = 0.91). This factor showed a distinct diurnal pattern with high concentrations during nighttime, suggesting that it was associated with the nighttime chemistry and thus was defined as nighttime BSOA. Besides, the time series of nighttime BSOA correlated well with SV-OOA1 from the AMS–PMF analysis (r = 0.63; Fig. 7). This confirms that SV-OOA1 was mainly attributed to the less oxidized organic compounds formed from the nighttime oxidation of terpenes.
The fourth OA factor shows high contributions from ions such as C8H13O, C9H13O, C10H13O and C10H15O. These ions can be related to more oxidized products of monoterpene oxidation and/or their fragments, as reported in previous chamber studies and field observations (Li et al., 2021; Gkatzelis et al., 2018b). The diurnal variation in this factor showed increased concentrations during daytime. These results suggest that this factor is associated with SOA formed from the oxidation of biogenic VOCs during daytime and thus was denoted “daytime BSOA”. The time series of daytime BSOA showed a weak correlation with LV-OOA from the AMS–PMF analysis (r = 0.40). Note that CHARON–PTR-MS cannot measure low-volatility organic compounds well, which may degrade the correlation between daytime BSOA and LV-OOA to some extent.
In addition, two other factors (F5 and F6) were resolved from the PMF analysis of CHARON-measured OA. The mass spectra of both F5 and F6 were dominated by the ion C3H5O. Figure S12 shows the time evolution of particulate C3H5O at an individual alternating CHARON–PTR-MS measurement cycle. It can be seen that CHARON showed a slow response to particulate C3H5O compared to other low-molecular weight ions such as C4H7O+ and C4H9O+. This suggests that particulate C3H5O can be associated with less volatile organic compounds. Note that C3H5O is attributed to the fragmentation of multiple species, and it cannot be regarded as a source marker ion. We found that the time series of F6 correlated better with MOOA resolved from the AMS–PMF analysis (r = 0.4) compared to the time series of F5 (r = 0.1). The time series of F5 + F6 showed a better correlation with MOOA (r = 0.59; Fig. S14). The results suggest that F6 was likely related to long-range transported Atlantic air masses. Due to the lack of source marker compounds, we currently cannot explicitly assign these two factors to specific sources or formation processes in this study.
3.3 Impact of air mass origin on VOC and OA sources
Figure 8 shows the relative contributions of VOC factors to total VOC mixing ratios and OA factors to total OA mass measured by the AMS for five different air mass clusters. Continental air mass clusters C1 and C2 both showed the highest fractions of biogenic OVOC to total VOC mixing ratios (40 % and 55 %), indicating the importance of biogenic VOC oxidation to OVOC contribution. Comparatively, lower fraction of biogenic OVOCs (30 % and 35 %) were observed for long-range transported air masses from the Atlantic Ocean (C4–C5). Furthermore, C4 and C5 had high fractions of aged OVOCs in the total VOC mixing ratios, suggesting the importance of long-range transport of air masses for the variations in VOCs. Compared to other air mass clusters, we found the highest fractions of aromatic OVOCs in C1, which reflects increased anthropogenic emissions from downtown Karlsruhe. Besides, high fractions of traffic VOCs were observed for C2 and C3, which were mainly related to local traffic emissions.
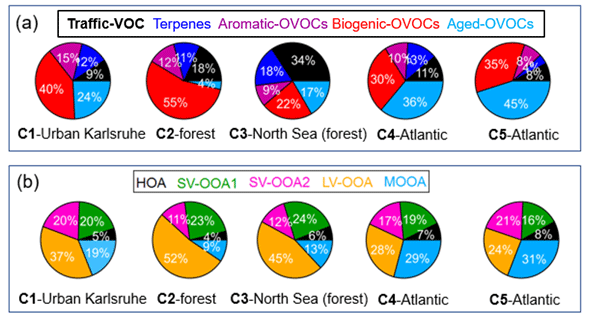
Figure 8Relative contributions of (a) VOC factors to total VOC mixing ratios and (b) OA factors to AMS-measured OA mass for five different air mass clusters: C1 – urban Karlsruhe, C2 – forest, C3 – North Sea (forest), C4 – Atlantic and C5 – Atlantic.
All air mass clusters showed high fractions of LV-OOA in the total OA mass (24 %–52 %), indicating the importance of photochemical oxidation of biogenic VOCs to SOA formation. High fractions of MOOA in the total OA mass were observed in the Atlantic air masses (C4 and C5). Please note that MOOA played an important role in relatively clean periods with low OA mass. Interestingly, high fractions of SV-OOA2 in the total OA mass were observed for C1, C4 and C5 (17 %–21 %), the air masses that passed over urban Karlsruhe, compared to those for C2 and C3 (10 %–11 %), which passed over forested areas. However, the fractions of SV-OOA1 in the total OA mass showed no significant changes among different air mass clusters. In total, high fractions of SOA factors including SV-OOA1, SV-OOA2 and LV-OOA, from 63 % for C5 to 87 % for C2, were found, emphasizing the important secondary aerosol contributions over the primary HOA and long-range-transported MOOA.
Overall, we conclude that local BVOC oxidation can produce low-molecular-weight biogenic OVOCs and LV-OOA during daytime while leading to the formation of SV-OOA1 during nighttime. In contrast, the air masses transported from urban Karlsruhe can increase the role of aromatic OVOCs and SV-OOA2 in the variations in VOCs and OA.
3.4 Contribution of semi-volatile organic compounds to nighttime particle growth
Figure 9 shows the diurnal variations in geometric mean particle diameters; traffic VOC and terpene factors; atmospheric oxidants; mass concentrations; and fractions of OA, SV-OOA1, and SV-OOA2 during the periods influenced by five different air mass clusters. The geometric mean particle diameter showed evident increases during nighttime (from 20:00 to 06:00 LT the next day), especially for the air mass clusters of C1–C3. Simultaneously, the diurnal variations in OA mass also exhibited significant increases in air mass clusters C1–C3 during the nighttime. Among the OA components, both SV-OOA1 and SV-OOA2 masses showed rapid increases during nighttime. Note that the mass increases in OA, SV-OOA1 and SV-OOA2 could be related to nighttime chemistry and the shrinking of the boundary layer. No significant differences in diurnal patterns of boundary layer height were found among different air mass clusters, except for C5 with slightly high boundary layer height during nighttime (Fig. S15). Furthermore, we calculated the diurnal variations for the mass fractions of SV-OOA1 and SV-OOA2 in the total OA mass to normalize the impact of meteorology. The mass fraction of SV-OOA1 still showed significant increases during nighttime, from 10 % to 40 % for C1–C3 and 10 % to 25 % for C4–C5. In contrast, the mass fraction of SV-OOA2 showed less pronounced diurnal variations for all air mass clusters. This indicates that the formation of SV-OOA1 rather than SV-OOA2 dominated the nighttime particle growth and high OA mass. Furthermore, high concentrations of terpenes were observed along with the decrease in O3 during nighttime, supporting the formation of SV-OOA1. Although the traffic VOC factor containing mainly aromatic hydrocarbons also showed higher concentrations during nighttime, these species have lower reactivity towards O3 compared to terpenes (Atkinson, 2000). Therefore, we exclude the possibility of nighttime oxidation of aromatic hydrocarbons leading to the enhancement of SV-OOA1 formation.
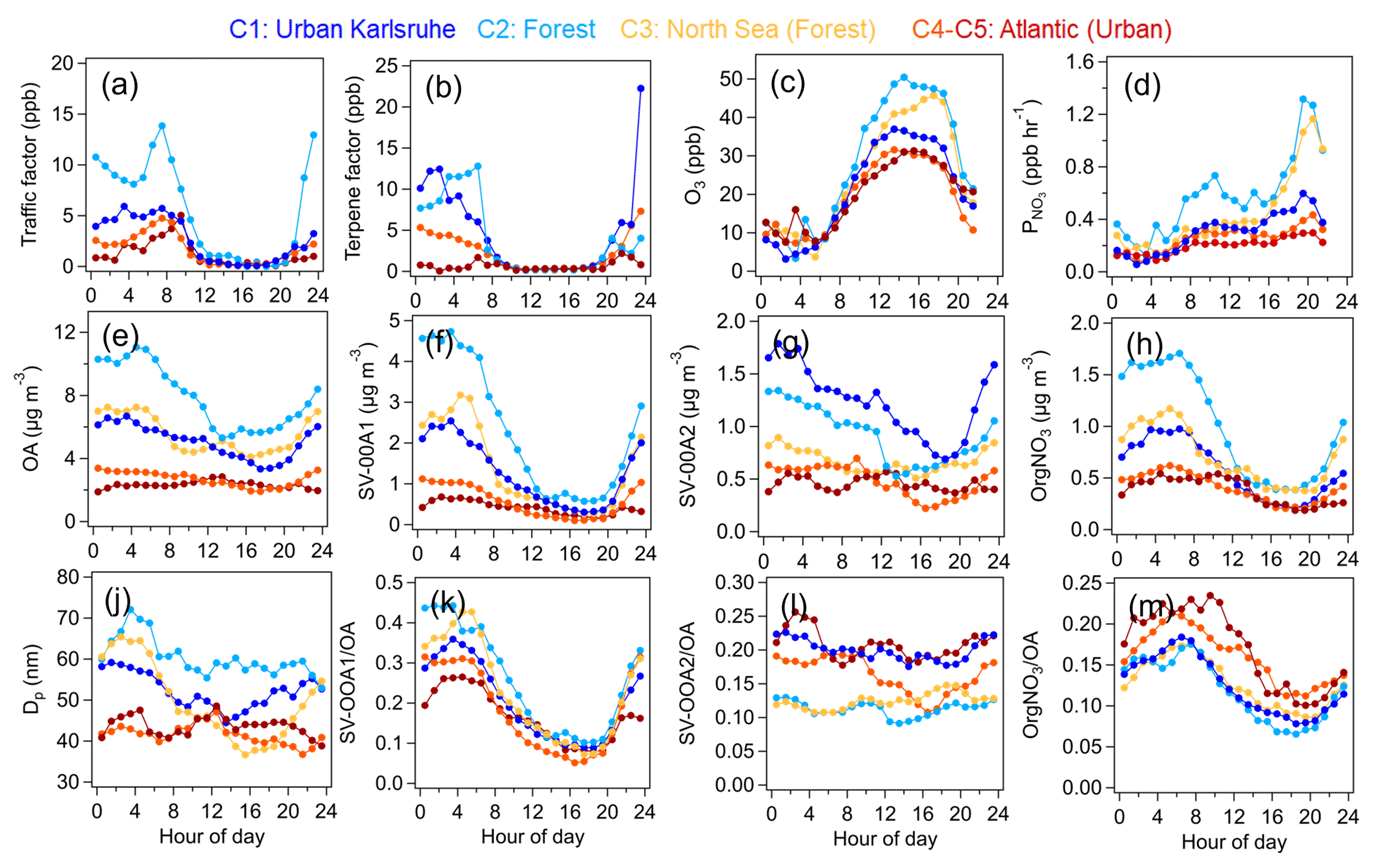
Figure 9Diurnal variations in VOC precursors, oxidants, SOA factors and particle size for different air mass clusters: (a–b) traffic VOC and terpene factors measured by the PTR-MS; (c) O3 mixing ratios; (d) production rate of NO3 radicals; (e–h) mass concentrations of OA, SV-OOA1, SV-OOA2, and organic nitrate (OrgNO3) measured by the AMS; (j) geometric mean particle size (Dp); and (k–m) mass fractions of SV-OOA1, SV-OOA2, and OrgNO3 in the total OA mass.
In addition to O3, terpenes can react with nitrate radicals (NO3) during nighttime, resulting in the formation of organic nitrate. In this study, we calculated the total organic nitrate from the AMS measurement (Xu et al., 2015; see details in Sect. S3). We also calculated the production rate of NO3 radicals ( = k[NO2][O3], k = 3.5 × 10⁻¹⁷ cm3 molec.−1 s−1, at 298 K; IUPAC) using the measured concentrations of O3 and NO2 (Huang et al., 2019). The diurnal variations in showed significant increases after 20:00 LT in all air mass clusters but especially for C2 and C3 in the forest air masses. Simultaneously, the mass concentrations of organic nitrate showed rapid increases over the nighttime. Furthermore, the mass fraction of organic nitrate in OA showed a significant increase during nighttime in all air mass clusters. Given the high concentrations of monoterpenes and sesquiterpenes during nighttime, we assume that the organic nitrate was mainly formed from the oxidation of biogenic VOCs by NO3 radicals. Furthermore, we found that organic nitrate showed better correlations with the particulate organic nitrate molecules C10H15O7N (r = 0.46) and C15H23O7N (r = 0.55) compared to the C5H7O7N (r = 0.22) measured by the FIGAERO–CIMS (Fig. S16). According to chamber studies and field observations, C5H7O7N, C10H15O7N and C15H23O7N can be attributed to organic nitrate products formed from isoprene, monoterpenes and sesquiterpenes, respectively (Huang et al., 2019; Chen et al., 2020; Faxon et al., 2018; Wu et al., 2021; Gao et al., 2022). Based on the above results, we can conclude that organic nitrate mainly comes from by the NO3-radical-induced oxidation of monoterpenes and sesquiterpenes. The concentrations of steady-state NO3 radicals were also roughly estimated in Sect. S3. We observed rapid decreases in steady-state NO3 radicals during early nighttime and low concentrations at night, which was mainly due to the sink of terpene oxidation.
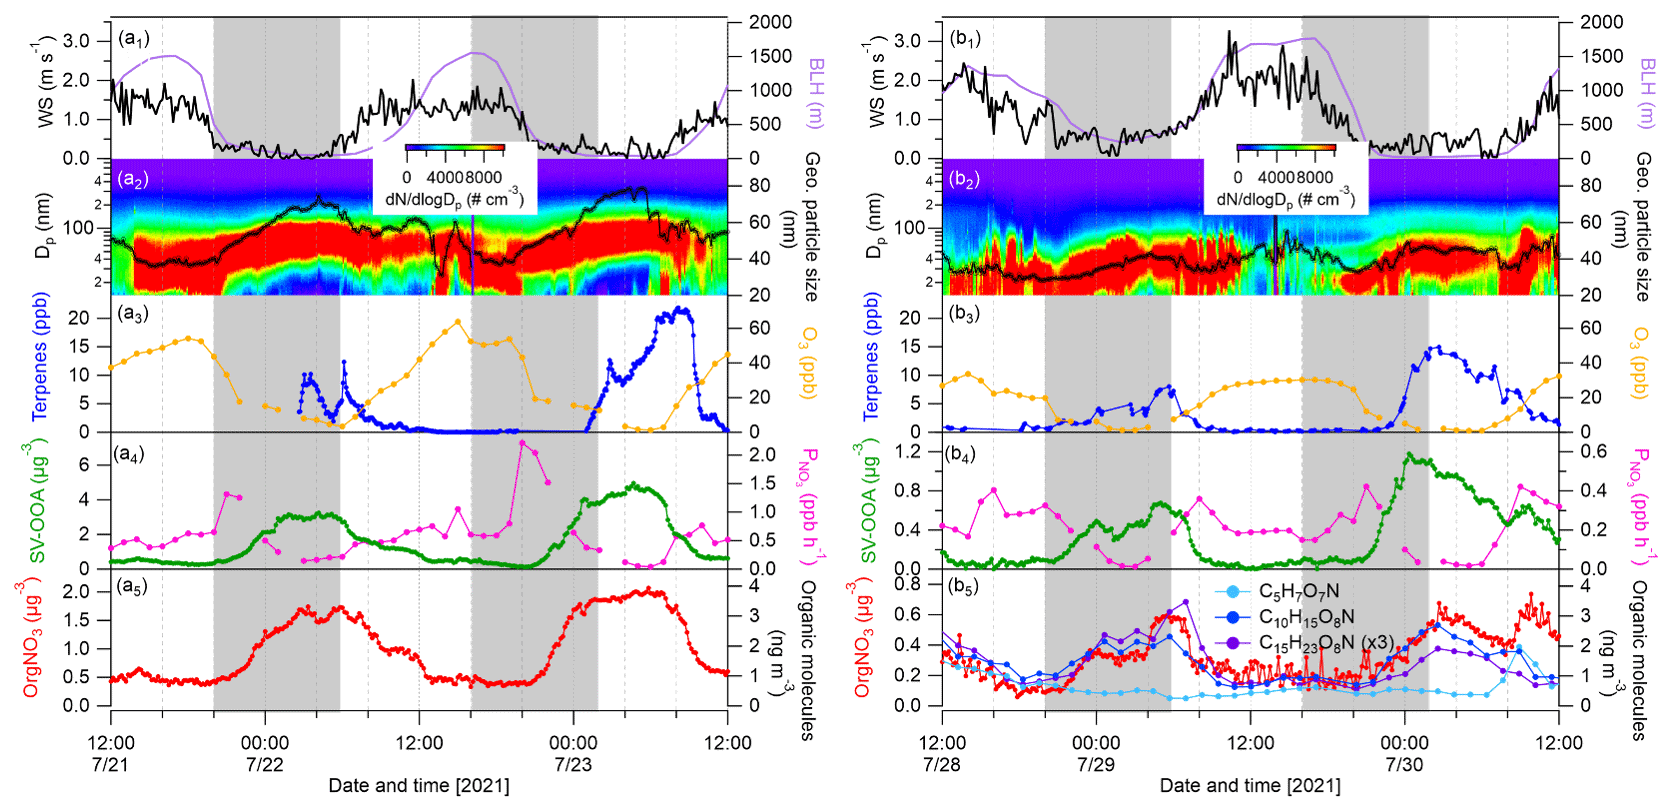
Figure 10Cases showing nighttime particle growth events as marked by gray-shaded areas. Time series of wind speed, boundary layer height, particle number size distributions and geometric mean particle size, mixing ratios of terpenes and O3, production rate of nitrate radicals (), and mass concentrations of SV-OOA1 and organic nitrate calculated from the AMS during 21–23 July 2021 (a1–a5) and 28–30 July 2021. (b1–b5) Three particulate organic nitrate molecules (C5H7O7N, C10H15O8N and C15H23O8N) detected by FIGAERO–CIMS are plotted in (b5).
Finally, we present two cases showing nighttime particle growth with increased OA mass (Fig. 10). Please note that this is actually a phenomenon observed regularly in this area in summer (Huang et al., 2019). The first case (case 1) was from 21–23 July 2021 with the influence of forest air masses, while the second one (case 2) was from 28–30 July 2021 with impact of long-range-transported Atlantic air masses. It can be clearly seen that the particle growth during nighttime started from 20:00 LT with linear increases in geometric mean particle sizes reaching maximum values from 04:00–06:00 LT the next day in both cases. We calculated the particle growth rate by averaging the geometric mean particle diameter difference from 20:00–04:00 LT the next day. The particle growth rates for the two nights of case 1 were 3.9 and 4.0 nm h−1, respectively, which were close to those (5.3 ± 3.1 nm h−1) observed in the same area in summer 2016 and 2018 (Huang et al., 2019) and lower than the nighttime growth rates observed in Landes forest (9.0–15.7 nm h−1; Kammer et al., 2018). Lower particle growth rates by a factor of 2 were found for the two nights of case 2: 1.8 and 1.5 nm h−1, respectively. In the same way, we calculated the mass increase rate of SV-OOA1 and organic nitrate by averaging the mass differences correspondingly. Consequently, the mass increase rates of SV-OOA1 were 0.36 and 0.53 µg m−3 h−1 for the two nights of case 1 – higher than 0.05 and 0.11 µg m−3 h−1 for the two nights of case 2. The mass increase rates of organic nitrate were also significantly higher during the two nights of case 1 (0.13 and 0.19 µg m−3 h−1) than during the nights of case 2 (0.04 and 0.06 µg m−3 h−1). The difference in particle growth and mass increase rates between case 1 and case 2 could be associated with the concentrations of VOC precursors and/or nighttime oxidants (O3 and NO3 radicals). Note that the mass concentrations of organic nitrate show strong correlations with C10H15O7N and C15H23O7N, especially during nighttime (Fig. 10), indicating that organic nitrates were formed from the oxidation of monoterpenes and sesquiterpenes by NO3 radicals. This is in line with our previous study, which showed that highly functionalized organic nitrates can contribute to nighttime particle growth and OA mass observed at the same area in summer 2016 and 2018 (Huang et al., 2019). In this study, higher concentrations of terpenes were observed during nighttime in both cases. In contrast, during non-particle-growth events during nighttime, low concentrations of terpenes and SV-OOA1 were generally observed (Fig. S17). Besides high concentrations of terpenes, the decrease rate of O3 was stronger during the nighttime particle growth periods in case 1 (−4.6 and −5.0 ppb h−1) than in case 2 (−2.1 and −2.9 ppb h−1). The results suggest the importance of atmospheric oxidants (O3 and NO3 radicals) for nighttime SOA and organic nitrate formation and thus for particle growth. The formation of O3 and NO3 radicals is tightly associated with NOx; thus, a reduction in NOx and O3 would be helpful to lower the nighttime biogenic SOA formation including potentially toxicologically relevant organic nitrates (Lei et al., 2023), in order to improve regional air quality.
In this study, the composition, sources, and evolution processes of VOCs and OA were concurrently investigated by the combination of online mass spectrometry and PMF analysis in a rural forested area in southwest Germany in summer. OA measured by the AMS is the most abundant particulate component, contributing 67 % ± 11 % of total PM2.5 mass. Semi-volatile OA measured by CHARON–PTR-MS accounted for 62 % ± 18 % of AMS-measured OA. The PMF analysis of VOCs revealed that OVOCs, including biogenic OVOCs, aromatic OVOCs and aged OVOCs, contributed a total of 77 % ± 20 % to the total VOC mixing ratios. AMS-measured OA particle mass was mainly contributed by oxygenated organic compounds, including SV-OOA1, SV-OOA2, LV-OOA and MOOA, according to the PMF analysis. Please note that the relatively large contribution of the marine factor (MOOA; 22 % ± 16 %) is not unexpected in central Europe since we detected substantial contributions of sea salt aerosol in a previous study at a location 2 km west (Shen et al., 2019). Three SOA factors, including an aromatic SOA, a daytime-biogenic SOA, a nighttime-biogenic SOA determined from the CHARON-PMF analysis, in total accounted for 50 % ± 20 % of the total CHARON-measured OA mass. We conclude that there were substantial contributions of oxygenated organic compounds in both the gas and particle phases. Meanwhile, we illustrated that the oxidation of biogenic terpenes formed more oxidized VOCs and LV-OOA during daytime, while producing less oxidized VOCs and SV-OOA during nighttime. Combined with air mass back trajectory analysis, we found that urban air masses significantly enhanced the anthropogenic contributions to OVOCs and SOA related to aromatic hydrocarbon oxidation. Additionally, particle growth events were frequently observed in this area during early nighttime, similar to recently reported observations in other European forested areas in summer (Kammer et al., 2018; Debevec et al., 2018). We revealed that nighttime particle growth was mainly attributed to the rapid mass increase in semi-volatile organic compounds and organic nitrates from the oxidation of monoterpenes and sesquiterpenes. This study elucidates the relative importance of biogenic and anthropogenic emissions through the combination of PMF analysis of VOCs, OA mass spectral data and meteorological conditions. In the future, a comparison between the PMF analysis of CHARON–PTR-MS and concurrent FIGAERO–CIMS measurement should be done to provide detailed oxidation pathways of VOCs leading to SOA formation.
Data related to this paper will be available at the KIT open data portal (https://doi.org/10.35097/zjacMoCUyEYFyvBR, Song et al., 2024).
The supplement related to this article is available online at: https://doi.org/10.5194/acp-24-6699-2024-supplement.
JS and HS designed the measurement campaign. JS, FJ, HZ, LG and HS performed the experimental work. JS did the AMS and PTR-MS data analyses. FJ did the CIMS and aethalometer data analyses. HS and HZ processed the trace gas and meteorological data, respectively. TL gave general comments on this paper. JS wrote the paper with contributions from all co-authors.
At least one of the (co-)authors is a member of the editorial board of Atmospheric Chemistry and Physics. The peer-review process was guided by an independent editor, and the authors also have no other competing interests to declare.
Publisher’s note: Copernicus Publications remains neutral with regard to jurisdictional claims made in the text, published maps, institutional affiliations, or any other geographical representation in this paper. While Copernicus Publications makes every effort to include appropriate place names, the final responsibility lies with the authors.
Technical support from the staff at IMK-AAF and financial support from the China Scholarship Council (CSC) for Junwei Song, Feng Jiang and Linyu Gao is gratefully acknowledged. Financial support for CHARON–PTR-MS from the Modular Observation Solutions for Earth Systems (MOSES) project, a novel observing system of the Helmholtz Association, is gratefully acknowledged.
This research has been supported by the China Scholarship Council (CSC) and the Helmholtz Association (Modular Observation Solutions for Earth Systems (MOSES) project).
The article processing charges for this open-access publication were covered by the Karlsruhe Institute of Technology (KIT).
This paper was edited by Alex Lee and reviewed by Federico Bianchi and two anonymous referees.
Atkinson, R.: Atmospheric chemistry of VOCs and NOx, Atmos. Environ., 34, 2063–2101, https://doi.org/10.1016/S1352-2310(99)00460-4, 2000.
Burnett, R. T., Pope, C. A., Ezzati, M., Olives, C., Lim, S. S., Mehta, S., Shin, H. H., Singh, G., Hubbell, B., Brauer, M., Anderson, H. R., Smith, K. R., Balmes, J. R., Bruce, N. G., Kan, H., Laden, F., Prüss-Ustün, A., Turner, M. C., Gapstur, S. M., Diver, W. R., and Cohen, A.: An Integrated Risk Function for Estimating the Global Burden of Disease Attributable to Ambient Fine Particulate Matter Exposure, Environ. Health Persp., 122, 397–403, https://doi.org/10.1289/ehp.1307049, 2014.
Canagaratna, M. R., Jayne, J. T., Ghertner, D. A., Herndon, S., Shi, Q., Jimenez, J. L., Silva, P. J., Williams, P., Lanni, T., Drewnick, F., Demerjian, K. L., Kolb, C. E., and Worsnop, D. R.: Chase Studies of Particulate Emissions from in-use New York City Vehicles, Aerosol. Sci. Tech., 38, 555–573, https://doi.org/10.1080/02786820490465504, 2004.
Canagaratna, M. R., Jimenez, J. L., Kroll, J. H., Chen, Q., Kessler, S. H., Massoli, P., Hildebrandt Ruiz, L., Fortner, E., Williams, L. R., Wilson, K. R., Surratt, J. D., Donahue, N. M., Jayne, J. T., and Worsnop, D. R.: Elemental ratio measurements of organic compounds using aerosol mass spectrometry: characterization, improved calibration, and implications, Atmos. Chem. Phys., 15, 253–272, https://doi.org/10.5194/acp-15-253-2015, 2015.
Canonaco, F., Slowik, J. G., Baltensperger, U., and Prévôt, A. S. H.: Seasonal differences in oxygenated organic aerosol composition: implications for emissions sources and factor analysis, Atmos. Chem. Phys., 15, 6993–7002, https://doi.org/10.5194/acp-15-6993-2015, 2015.
Chen, G., Canonaco, F., Tobler, A., Aas, W., Alastuey, A., Allan, J., Atabakhsh, S., Aurela, M., Baltensperger, U., Bougiatioti, A., De Brito, J. F., Ceburnis, D., Chazeau, B., Chebaicheb, H., Daellenbach, K. R., Ehn, M., El Haddad, I., Eleftheriadis, K., Favez, O., Flentje, H., Font, A., Fossum, K., Freney, E., Gini, M., Green, D. C., Heikkinen, L., Herrmann, H., Kalogridis, A.-C., Keernik, H., Lhotka, R., Lin, C., Lunder, C., Maasikmets, M., Manousakas, M. I., Marchand, N., Marin, C., Marmureanu, L., Mihalopoulos, N., Močnik, G., Nęcki, J., O'Dowd, C., Ovadnevaite, J., Peter, T., Petit, J.-E., Pikridas, M., Matthew Platt, S., Pokorná, P., Poulain, L., Priestman, M., Riffault, V., Rinaldi, M., Różański, K., Schwarz, J., Sciare, J., Simon, L., Skiba, A., Slowik, J. G., Sosedova, Y., Stavroulas, I., Styszko, K., Teinemaa, E., Timonen, H., Tremper, A., Vasilescu, J., Via, M., Vodička, P., Wiedensohler, A., Zografou, O., Cruz Minguillón, M., and Prévôt, A. S. H.: European aerosol phenomenology – 8: Harmonised source apportionment of organic aerosol using 22 Year-long ACSM/AMS datasets, Environ. Int., 166, 107325, https://doi.org/10.1016/j.envint.2022.107325, 2022.
Chen, Y., Takeuchi, M., Nah, T., Xu, L., Canagaratna, M. R., Stark, H., Baumann, K., Canonaco, F., Prévôt, A. S. H., Huey, L. G., Weber, R. J., and Ng, N. L.: Chemical characterization of secondary organic aerosol at a rural site in the southeastern US: insights from simultaneous high-resolution time-of-flight aerosol mass spectrometer (HR-ToF-AMS) and FIGAERO chemical ionization mass spectrometer (CIMS) measurements, Atmos. Chem. Phys., 20, 8421–8440, https://doi.org/10.5194/acp-20-8421-2020, 2020.
Crippa, M., El Haddad, I., Slowik, J. G., DeCarlo, P. F., Mohr, C., Heringa, M. F., Chirico, R., Marchand, N., Sciare, J., Baltensperger, U., and Prevot, A. S. H.: Identification of marine and continental aerosol sources in Paris using high resolution aerosol mass spectrometry, J. Geophys. Res.-Atmos., 118, 1950–1963, https://doi.org/10.1002/jgrd.50151, 2013a.
Crippa, M., Canonaco, F., Slowik, J. G., El Haddad, I., DeCarlo, P. F., Mohr, C., Heringa, M. F., Chirico, R., Marchand, N., Temime-Roussel, B., Abidi, E., Poulain, L., Wiedensohler, A., Baltensperger, U., and Prévôt, A. S. H.: Primary and secondary organic aerosol origin by combined gas-particle phase source apportionment, Atmos. Chem. Phys., 13, 8411–8426, https://doi.org/10.5194/acp-13-8411-2013, 2013b.
Crippa, M., Canonaco, F., Lanz, V. A., Äijälä, M., Allan, J. D., Carbone, S., Capes, G., Ceburnis, D., Dall'Osto, M., Day, D. A., DeCarlo, P. F., Ehn, M., Eriksson, A., Freney, E., Hildebrandt Ruiz, L., Hillamo, R., Jimenez, J. L., Junninen, H., Kiendler-Scharr, A., Kortelainen, A.-M., Kulmala, M., Laaksonen, A., Mensah, A. A., Mohr, C., Nemitz, E., O'Dowd, C., Ovadnevaite, J., Pandis, S. N., Petäjä, T., Poulain, L., Saarikoski, S., Sellegri, K., Swietlicki, E., Tiitta, P., Worsnop, D. R., Baltensperger, U., and Prévôt, A. S. H.: Organic aerosol components derived from 25 AMS data sets across Europe using a consistent ME-2 based source apportionment approach, Atmos. Chem. Phys., 14, 6159–6176, https://doi.org/10.5194/acp-14-6159-2014, 2014.
Debevec, C., Sauvage, S., Gros, V., Sellegri, K., Sciare, J., Pikridas, M., Stavroulas, I., Leonardis, T., Gaudion, V., Depelchin, L., Fronval, I., Sarda-Esteve, R., Baisnée, D., Bonsang, B., Savvides, C., Vrekoussis, M., and Locoge, N.: Driving parameters of biogenic volatile organic compounds and consequences on new particle formation observed at an eastern Mediterranean background site, Atmos. Chem. Phys., 18, 14297–14325, https://doi.org/10.5194/acp-18-14297-2018, 2018.
DeCarlo, P. F., Kimmel, J. R., Trimborn, A., Northway, M. J., Jayne, J. T., Aiken, A. C., Gonin, M., Fuhrer, K., Horvath, T., Docherty, K. S., Worsnop, D. R., and Jimenez, J. L.: Field-deployable, high-resolution, time-of-flight aerosol mass spectrometer, Anal. Chem., 78, 8281–8289, https://doi.org/10.1021/ac061249n, 2006.
DeWitt, H. L., Hellebust, S., Temime-Roussel, B., Ravier, S., Polo, L., Jacob, V., Buisson, C., Charron, A., André, M., Pasquier, A., Besombes, J. L., Jaffrezo, J. L., Wortham, H., and Marchand, N.: Near-highway aerosol and gas-phase measurements in a high-diesel environment, Atmos. Chem. Phys., 15, 4373–4387, https://doi.org/10.5194/acp-15-4373-2015, 2015.
Eerdekens, G., Yassaa, N., Sinha, V., Aalto, P. P., Aufmhoff, H., Arnold, F., Fiedler, V., Kulmala, M., and Williams, J.: VOC measurements within a boreal forest during spring 2005: on the occurrence of elevated monoterpene concentrations during night time intense particle concentration events, Atmos. Chem. Phys., 9, 8331–8350, https://doi.org/10.5194/acp-9-8331-2009, 2009.
Ehn, M., Thornton, J. A., Kleist, E., Sipilä, M., Junninen, H., Pullinen, I., Springer, M., Rubach, F., Tillmann, R., Lee, B., Lopez-Hilfiker, F., Andres, S., Acir, I.-H., Rissanen, M., Jokinen, T., Schobesberger, S., Kangasluoma, J., Kontkanen, J., Nieminen, T., Kurtén, T., Nielsen, L. B., Jørgensen, S., Kjaergaard, H. G., Canagaratna, M., Maso, M. D., Berndt, T., Petäjä, T., Wahner, A., Kerminen, V.-M., Kulmala, M., Worsnop, D. R., Wildt, J., and Mentel, T. F.: A large source of low-volatility secondary organic aerosol, Nature, 506, 476–479, https://doi.org/10.1038/nature13032, 2014.
Eichler, P., Müller, M., D'Anna, B., and Wisthaler, A.: A novel inlet system for online chemical analysis of semi-volatile submicron particulate matter, Atmos. Meas. Tech., 8, 1353–1360, https://doi.org/10.5194/amt-8-1353-2015, 2015.
Faxon, C., Hammes, J., Le Breton, M., Pathak, R. K., and Hallquist, M.: Characterization of organic nitrate constituents of secondary organic aerosol (SOA) from nitrate-radical-initiated oxidation of limonene using high-resolution chemical ionization mass spectrometry, Atmos. Chem. Phys., 18, 5467–5481, https://doi.org/10.5194/acp-18-5467-2018, 2018.
Gao, L., Song, J., Mohr, C., Huang, W., Vallon, M., Jiang, F., Leisner, T., and Saathoff, H.: Kinetics, SOA yields, and chemical composition of secondary organic aerosol from β-caryophyllene ozonolysis with and without nitrogen oxides between 213 and 313 K, Atmos. Chem. Phys., 22, 6001–6020, https://doi.org/10.5194/acp-22-6001-2022, 2022.
Gkatzelis, G. I., Tillmann, R., Hohaus, T., Müller, M., Eichler, P., Xu, K.-M., Schlag, P., Schmitt, S. H., Wegener, R., Kaminski, M., Holzinger, R., Wisthaler, A., and Kiendler-Scharr, A.: Comparison of three aerosol chemical characterization techniques utilizing PTR-ToF-MS: a study on freshly formed and aged biogenic SOA, Atmos. Meas. Tech., 11, 1481–1500, https://doi.org/10.5194/amt-11-1481-2018, 2018a.
Gkatzelis, G. I., Hohaus, T., Tillmann, R., Gensch, I., Müller, M., Eichler, P., Xu, K.-M., Schlag, P., Schmitt, S. H., Yu, Z., Wegener, R., Kaminski, M., Holzinger, R., Wisthaler, A., and Kiendler-Scharr, A.: Gas-to-particle partitioning of major biogenic oxidation products: a study on freshly formed and aged biogenic SOA, Atmos. Chem. Phys., 18, 12969–12989, https://doi.org/10.5194/acp-18-12969-2018, 2018b.
Gkatzelis, G. I., Coggon, M. M., McDonald, B. C., Peischl, J., Gilman, J. B., Aikin, K. C., Robinson, M. A., Canonaco, F., Prevot, A. S. H., Trainer, M., and Warneke, C.: Observations Confirm that Volatile Chemical Products Are a Major Source of Petrochemical Emissions in U.S. Cities, Environ. Sci. Technol., 55, 4332–4343, https://doi.org/10.1021/acs.est.0c05471, 2021.
Hallquist, M., Wenger, J. C., Baltensperger, U., Rudich, Y., Simpson, D., Claeys, M., Dommen, J., Donahue, N. M., George, C., Goldstein, A. H., Hamilton, J. F., Herrmann, H., Hoffmann, T., Iinuma, Y., Jang, M., Jenkin, M. E., Jimenez, J. L., Kiendler-Scharr, A., Maenhaut, W., McFiggans, G., Mentel, Th. F., Monod, A., Prévôt, A. S. H., Seinfeld, J. H., Surratt, J. D., Szmigielski, R., and Wildt, J.: The formation, properties and impact of secondary organic aerosol: current and emerging issues, Atmos. Chem. Phys., 9, 5155–5236, https://doi.org/10.5194/acp-9-5155-2009, 2009.
Hellén, H., Praplan, A. P., Tykkä, T., Ylivinkka, I., Vakkari, V., Bäck, J., Petäjä, T., Kulmala, M., and Hakola, H.: Long-term measurements of volatile organic compounds highlight the importance of sesquiterpenes for the atmospheric chemistry of a boreal forest, Atmos. Chem. Phys., 18, 13839–13863, https://doi.org/10.5194/acp-18-13839-2018, 2018.
Hersbach, H., Bell, B., Berrisford, P., Hirahara, S., Horányi, A., Muñoz-Sabater, J., Nicolas, J., Peubey, C., Radu, R., Schepers, D., Simmons, A., Soci, C., Abdalla, S., Abellan, X., Balsamo, G., Bechtold, P., Biavati, G., Bidlot, J., Bonavita, M., De Chiara, G., Dahlgren, P., Dee, D., Diamantakis, M., Dragani, R., Flemming, J., Forbes, R., Fuentes, M., Geer, A., Haimberger, L., Healy, S., Hogan, R. J., Hólm, E., Janisková, M., Keeley, S., Laloyaux, P., Lopez, P., Lupu, C., Radnoti, G., de Rosnay, P., Rozum, I., Vamborg, F., Villaume, S., and Thépaut, J.-N.: The ERA5 global reanalysis, Q. J. Roy. Meteor. Soc., 146, 1999–2049, https://doi.org/10.1002/qj.3803, 2020.
Hodzic, A., Kasibhatla, P. S., Jo, D. S., Cappa, C. D., Jimenez, J. L., Madronich, S., and Park, R. J.: Rethinking the global secondary organic aerosol (SOA) budget: stronger production, faster removal, shorter lifetime, Atmos. Chem. Phys., 16, 7917–7941, https://doi.org/10.5194/acp-16-7917-2016, 2016.
Huang, S., Wu, Z., Poulain, L., van Pinxteren, M., Merkel, M., Assmann, D., Herrmann, H., and Wiedensohler, A.: Source apportionment of the organic aerosol over the Atlantic Ocean from 53° N to 53° S: significant contributions from marine emissions and long-range transport, Atmos. Chem. Phys., 18, 18043–18062, https://doi.org/10.5194/acp-18-18043-2018, 2018.
Huang, W., Saathoff, H., Shen, X., Ramisetty, R., Leisner, T., and Mohr, C.: Chemical Characterization of Highly Functionalized Organonitrates Contributing to Night-Time Organic Aerosol Mass Loadings and Particle Growth, Environ. Sci. Technol., 53, 1165–1174, https://doi.org/10.1021/acs.est.8b05826, 2019.
IPCC: Climate Change 2021: The Physical Science Basis. Contribution ofWorking Group I to the Sixth Assessment Report of the Intergovernmental Panel on Climate Change, edited by: Masson-Delmotte, V., Zhai, P., Pirani, A., Connors, S. L., Péan, C., Berger, S., Caud, N., Chen, Y., Goldfarb, L., and Gomis, M. I., Cambridge University Press, Cambridge, United Kingdom and New York, NY, USA, https://doi.org/10.1017/9781009157896, 2021.
Jiang, J., Aksoyoglu, S., El-Haddad, I., Ciarelli, G., Denier van der Gon, H. A. C., Canonaco, F., Gilardoni, S., Paglione, M., Minguillón, M. C., Favez, O., Zhang, Y., Marchand, N., Hao, L., Virtanen, A., Florou, K., O'Dowd, C., Ovadnevaite, J., Baltensperger, U., and Prévôt, A. S. H.: Sources of organic aerosols in Europe: a modeling study using CAMx with modified volatility basis set scheme, Atmos. Chem. Phys., 19, 15247–15270, https://doi.org/10.5194/acp-19-15247-2019, 2019.
Jimenez, J. L., Canagaratna, M. R., Donahue, N. M., Prevot, A. S. H., Zhang, Q., Kroll, J. H., DeCarlo, P. F., Allan, J. D., Coe, H., Ng, N. L., Aiken, A. C., Docherty, K. S., Ulbrich, I. M., Grieshop, A. P., Robinson, A. L., Duplissy, J., Smith, J. D., Wilson, K. R., Lanz, V. A., Hueglin, C., Sun, Y. L., Tian, J., Laaksonen, A., Raatikainen, T., Rautiainen, J., Vaattovaara, P., Ehn, M., Kulmala, M., Tomlinson, J. M., Collins, D. R., Cubison, M. J., Dunlea, E. J., Huffman, J. A., Onasch, T. B., Alfarra, M. R., Williams, P. I., Bower, K., Kondo, Y., Schneider, J., Drewnick, F., Borrmann, S., Weimer, S., Demerjian, K., Salcedo, D., Cottrell, L., Griffin, R., Takami, A., Miyoshi, T., Hatakeyama, S., Shimono, A., Sun, J. Y., Zhang, Y. M., Dzepina, K., Kimmel, J. R., Sueper, D., Jayne, J. T., Herndon, S. C., Trimborn, A. M., Williams, L. R., Wood, E. C., Middlebrook, A. M., Kolb, C. E., Baltensperger, U., and Worsnop, D. R.: Evolution of Organic Aerosols in the Atmosphere, Science, 326, 1525–1529, 2009.
Jordan, A., Haidacher, S., Hanel, G., Hartungen, E., Märk, L., Seehauser, H., Schottkowsky, R., Sulzer, P., and Märk, T. D.: A high resolution and high sensitivity proton-transfer-reaction time-of-flight mass spectrometer (PTR-TOF-MS), Int. J. Mass Spectrom., 286, 122–128, https://doi.org/10.1016/j.ijms.2009.07.005, 2009.
Kammer, J., Perraudin, E., Flaud, P. M., Lamaud, E., Bonnefond, J. M., and Villenave, E.: Observation of nighttime new particle formation over the French Landes forest, Sci. Total Environ., 621, 1084–1092, https://doi.org/10.1016/j.scitotenv.2017.10.118, 2018.
Kari, E., Miettinen, P., Yli-Pirilä, P., Virtanen, A., and Faiola, C. L.: PTR-ToF-MS product ion distributions and humidity-dependence of biogenic volatile organic compounds, Int. J. Mass Spectrom., 430, 87–97, https://doi.org/10.1016/j.ijms.2018.05.003, 2018.
Kerminen, V.-M., Chen, X., Vakkari, V., Petäjä, T., Kulmala, M., and Bianchi, F.: Atmospheric new particle formation and growth: review of field observations, Environ. Res. Lett., 13, 103003, https://doi.org/10.1088/1748-9326/aadf3c, 2018.
Kim, S., Karl, T., Helmig, D., Daly, R., Rasmussen, R., and Guenther, A.: Measurement of atmospheric sesquiterpenes by proton transfer reaction-mass spectrometry (PTR-MS), Atmos. Meas. Tech., 2, 99–112, https://doi.org/10.5194/amt-2-99-2009, 2009.
Kirkby, J., Duplissy, J., Sengupta, K., Frege, C., Gordon, H., Williamson, C., Heinritzi, M., Simon, M., Yan, C., Almeida, J., Tröstl, J., Nieminen, T., Ortega, I. K., Wagner, R., Adamov, A., Amorim, A., Bernhammer, A.-K., Bianchi, F., Breitenlechner, M., Brilke, S., Chen, X., Craven, J., Dias, A., Ehrhart, S., Flagan, R. C., Franchin, A., Fuchs, C., Guida, R., Hakala, J., Hoyle, C. R., Jokinen, T., Junninen, H., Kangasluoma, J., Kim, J., Krapf, M., Kürten, A., Laaksonen, A., Lehtipalo, K., Makhmutov, V., Mathot, S., Molteni, U., Onnela, A., Peräkylä, O., Piel, F., Petäjä, T., Praplan, A. P., Pringle, K., Rap, A., Richards, N. A. D., Riipinen, I., Rissanen, M. P., Rondo, L., Sarnela, N., Schobesberger, S., Scott, C. E., Seinfeld, J. H., Sipilä, M., Steiner, G., Stozhkov, Y., Stratmann, F., Tomé, A., Virtanen, A., Vogel, A. L., Wagner, A. C., Wagner, P. E., Weingartner, E., Wimmer, D., Winkler, P. M., Ye, P., Zhang, X., Hansel, A., Dommen, J., Donahue, N. M., Worsnop, D. R., Baltensperger, U., Kulmala, M., Carslaw, K. S., and Curtius, J.: Ion-induced nucleation of pure biogenic particles, Nature, 533, 521–526, https://doi.org/10.1038/nature17953, 2016.
Leglise, J., Müller, M., Piel, F., Otto, T., and Wisthaler, A.: Bulk Organic Aerosol Analysis by Proton-Transfer-Reaction Mass Spectrometry: An Improved Methodology for the Determination of Total Organic Mass, O : C and H : C Elemental Ratios, and the Average Molecular Formula, Anal. Chem., 91, 12619–12624, https://doi.org/10.1021/acs.analchem.9b02949, 2019.
Lei, R., Wei, Z., Chen, M., Meng, H., Wu, Y., and Ge, X.: Aging Effects on the Toxicity Alteration of Different Types of Organic Aerosols: A Review, Current Pollution Reports, 9, 590–601, https://doi.org/10.1007/s40726-023-00272-9, 2023.
Li, H., Canagaratna, M. R., Riva, M., Rantala, P., Zhang, Y., Thomas, S., Heikkinen, L., Flaud, P.-M., Villenave, E., Perraudin, E., Worsnop, D., Kulmala, M., Ehn, M., and Bianchi, F.: Atmospheric organic vapors in two European pine forests measured by a Vocus PTR-TOF: insights into monoterpene and sesquiterpene oxidation processes, Atmos. Chem. Phys., 21, 4123–4147, https://doi.org/10.5194/acp-21-4123-2021, 2021.
Li, X.-B., Yuan, B., Wang, S., Wang, C., Lan, J., Liu, Z., Song, Y., He, X., Huangfu, Y., Pei, C., Cheng, P., Yang, S., Qi, J., Wu, C., Huang, S., You, Y., Chang, M., Zheng, H., Yang, W., Wang, X., and Shao, M.: Variations and sources of volatile organic compounds (VOCs) in urban region: insights from measurements on a tall tower, Atmos. Chem. Phys., 22, 10567–10587, https://doi.org/10.5194/acp-22-10567-2022, 2022.
Middlebrook, A. M., Bahreini, R., Jimenez, J. L., and Canagaratna, M. R.: Evaluation of Composition-Dependent Collection Efficiencies for the Aerodyne Aerosol Mass Spectrometer using Field Data, Aerosol. Sci. Tech., 46, 258–271, https://doi.org/10.1080/02786826.2011.620041, 2012.
Mohr, C., DeCarlo, P. F., Heringa, M. F., Chirico, R., Slowik, J. G., Richter, R., Reche, C., Alastuey, A., Querol, X., Seco, R., Peñuelas, J., Jiménez, J. L., Crippa, M., Zimmermann, R., Baltensperger, U., and Prévôt, A. S. H.: Identification and quantification of organic aerosol from cooking and other sources in Barcelona using aerosol mass spectrometer data, Atmos. Chem. Phys., 12, 1649–1665, https://doi.org/10.5194/acp-12-1649-2012, 2012.
Müller, M., Mikoviny, T., Jud, W., D'Anna, B., and Wisthaler, A.: A new software tool for the analysis of high resolution PTR-TOF mass spectra, Chemometr. Intell. Lab., 127, 158–165, https://doi.org/10.1016/j.chemolab.2013.06.011, 2013.
Muller, M., Eicher, P., D'Anna, B., Tan, W., and Wisthaler, A.: Direct Sampling and Analysis of Atmospheric Particulate Organic Matter by Proton-Transfer-Reaction Mass Spectrometry, Anal. Chem., 89, 10889–10897, https://doi.org/10.1021/acs.analchem.7b02582, 2017.
Ng, N. L., Canagaratna, M. R., Zhang, Q., Jimenez, J. L., Tian, J., Ulbrich, I. M., Kroll, J. H., Docherty, K. S., Chhabra, P. S., Bahreini, R., Murphy, S. M., Seinfeld, J. H., Hildebrandt, L., Donahue, N. M., DeCarlo, P. F., Lanz, V. A., Prévôt, A. S. H., Dinar, E., Rudich, Y., and Worsnop, D. R.: Organic aerosol components observed in Northern Hemispheric datasets from Aerosol Mass Spectrometry, Atmos. Chem. Phys., 10, 4625–4641, https://doi.org/10.5194/acp-10-4625-2010, 2010.
Paatero, P. and Tapper, U.: Positive Matrix Factorization – a Nonnegative Factor Model with Optimal Utilization of Error-Estimates of Data Values, Environmetrics, 5, 111–126, 1994.
Paatero, P., Eberly, S., Brown, S. G., and Norris, G. A.: Methods for estimating uncertainty in factor analytic solutions, Atmos. Meas. Tech., 7, 781–797, https://doi.org/10.5194/amt-7-781-2014, 2014.
Pallavi, Sinha, B., and Sinha, V.: Source apportionment of volatile organic compounds in the northwest Indo-Gangetic Plain using a positive matrix factorization model, Atmos. Chem. Phys., 19, 15467–15482, https://doi.org/10.5194/acp-19-15467-2019, 2019.
Peng, Y., Wang, H., Gao, Y., Jing, S., Zhu, S., Huang, D., Hao, P., Lou, S., Cheng, T., Huang, C., and Zhang, X.: Real-time measurement of phase partitioning of organic compounds using a proton-transfer-reaction time-of-flight mass spectrometer coupled to a CHARON inlet, Atmos. Meas. Tech., 16, 15–28, https://doi.org/10.5194/amt-16-15-2023, 2023.
Petit, J. E., Favez, O., Albinet, A., and Canonaco, F.: A user-friendly tool for comprehensive evaluation of the geographical origins of atmospheric pollution: Wind and trajectory analyses, Environ. Modell. Softw., 88, 183–187, https://doi.org/10.1016/j.envsoft.2016.11.022, 2017.
Piel, F., Müller, M., Winkler, K., Skytte af Sätra, J., and Wisthaler, A.: Introducing the extended volatility range proton-transfer-reaction mass spectrometer (EVR PTR-MS), Atmos. Meas. Tech., 14, 1355–1363, https://doi.org/10.5194/amt-14-1355-2021, 2021.
Pugliese, G., Piel, F., Trefz, P., Sulzer, P., Schubert, J. K., and Miekisch, W.: Effects of modular ion-funnel technology onto analysis of breath VOCs by means of real-time mass spectrometry, Anal. Bioanal. Chem., 412, 7131–7140, https://doi.org/10.1007/s00216-020-02846-8, 2020.
Reyes-Villegas, E., Bannan, T., Le Breton, M., Mehra, A., Priestley, M., Percival, C., Coe, H., and Allan, J. D.: Online Chemical Characterization of Food-Cooking Organic Aerosols: Implications for Source Apportionment, Environ. Sci. Technol., 52, 5308–5318, https://doi.org/10.1021/acs.est.7b06278, 2018.
Seinfeld, J. H. and Pandis, S. N.: Atmospheric chemistry and physics: from air pollution to climate change, John Wiley & Sons, ISBN 9781118947401, 2016.
Shen, X., Vogel, H., Vogel, B., Huang, W., Mohr, C., Ramisetty, R., Leisner, T., Prévôt, A. S. H., and Saathoff, H.: Composition and origin of PM2.5 aerosol particles in the upper Rhine valley in summer, Atmos. Chem. Phys., 19, 13189–13208, https://doi.org/10.5194/acp-19-13189-2019, 2019.
Shrivastava, M., Cappa, C. D., Fan, J., Goldstein, A. H., Guenther, A. B., Jimenez, J. L., Kuang, C., Laskin, A., Martin, S. T., Ng, N. L., Petaja, T., Pierce, J. R., Rasch, P. J., Roldin, P., Seinfeld, J. H., Shilling, J., Smith, J. N., Thornton, J. A., Volkamer, R., Wang, J., Worsnop, D. R., Zaveri, R. A., Zelenyuk, A., and Zhang, Q.: Recent advances in understanding secondary organic aerosol: Implications for global climate forcing, Rev. Geophys., 55, 509–559, https://doi.org/10.1002/2016RG000540, 2017.
Song, J., Saathoff, H., Gao, L., Gebhardt, R., Jiang, F., Vallon, M., Bauer, J., Norra, S., and Leisner, T.: Variations of PM2.5 sources in the context of meteorology and seasonality at an urban street canyon in Southwest Germany, Atmos. Environ., 282, 119147, https://doi.org/10.1016/j.atmosenv.2022.119147, 2022.
Song, J., Saathoff, H., Jiang, F., Gao, L., Zhang, H., and Leisner, T.: Sources of organic gases and aerosol particles and their roles in nighttime particle growth at a rural forested site in southwest Germany, Repository KITopen [data set], https://doi.org/10.35097/zjacMoCUyEYFyvBR, 2024.
Stein, A. F., Draxler, R. R., Rolph, G. D., Stunder, B. J. B., Cohen, M. D., and Ngan, F.: Noaa's Hysplit Atmospheric Transport and Dispersion Modeling System, B. Am. Meteorol. Soc., 96, 2059–2077, https://doi.org/10.1175/Bams-D-14-00110.1, 2015.
Tani, A., Hayward, S., and Hewitt, C. N.: Measurement of monoterpenes and related compounds by proton transfer reaction-mass spectrometry (PTR-MS), Int. J. Mass Spectrom., 223–224, 561–578, https://doi.org/10.1016/S1387-3806(02)00880-1, 2003.
Ulbrich, I. M., Canagaratna, M. R., Zhang, Q., Worsnop, D. R., and Jimenez, J. L.: Interpretation of organic components from Positive Matrix Factorization of aerosol mass spectrometric data, Atmos. Chem. Phys., 9, 2891–2918, https://doi.org/10.5194/acp-9-2891-2009, 2009.
Wang, L., Slowik, J. G., Tripathi, N., Bhattu, D., Rai, P., Kumar, V., Vats, P., Satish, R., Baltensperger, U., Ganguly, D., Rastogi, N., Sahu, L. K., Tripathi, S. N., and Prévôt, A. S. H.: Source characterization of volatile organic compounds measured by proton-transfer-reaction time-of-flight mass spectrometers in Delhi, India, Atmos. Chem. Phys., 20, 9753–9770, https://doi.org/10.5194/acp-20-9753-2020, 2020.
Wang, L., Slowik, J. G., Tong, Y., Duan, J., Gu, Y., Rai, P., Qi, L., Stefenelli, G., Baltensperger, U., Huang, R.-J., Cao, J., and Prévôt, A. S. H.: Characteristics of wintertime VOCs in urban Beijing: Composition and source apportionment, Atmos. Environ. X, 9, 100100, https://doi.org/10.1016/j.aeaoa.2020.100100, 2021.
Wang, Y., Mehra, A., Krechmer, J. E., Yang, G., Hu, X., Lu, Y., Lambe, A., Canagaratna, M., Chen, J., Worsnop, D., Coe, H., and Wang, L.: Oxygenated products formed from OH-initiated reactions of trimethylbenzene: autoxidation and accretion, Atmos. Chem. Phys., 20, 9563–9579, https://doi.org/10.5194/acp-20-9563-2020, 2020.
Wennberg, P. O., Bates, K. H., Crounse, J. D., Dodson, L. G., McVay, R. C., Mertens, L. A., Nguyen, T. B., Praske, E., Schwantes, R. H., Smarte, M. D., St Clair, J. M., Teng, A. P., Zhang, X., and Seinfeld, J. H.: Gas-Phase Reactions of Isoprene and Its Major Oxidation Products, Chem. Rev., 118, 3337–3390, https://doi.org/10.1021/acs.chemrev.7b00439, 2018.
Williams, L. R., Gonzalez, L. A., Peck, J., Trimborn, D., McInnis, J., Farrar, M. R., Moore, K. D., Jayne, J. T., Robinson, W. A., Lewis, D. K., Onasch, T. B., Canagaratna, M. R., Trimborn, A., Timko, M. T., Magoon, G., Deng, R., Tang, D., de la Rosa Blanco, E., Prévôt, A. S. H., Smith, K. A., and Worsnop, D. R.: Characterization of an aerodynamic lens for transmitting particles greater than 1 micrometer in diameter into the Aerodyne aerosol mass spectrometer, Atmos. Meas. Tech., 6, 3271–3280, https://doi.org/10.5194/amt-6-3271-2013, 2013.
Wu, C., Bell, D. M., Graham, E. L., Haslett, S., Riipinen, I., Baltensperger, U., Bertrand, A., Giannoukos, S., Schoonbaert, J., El Haddad, I., Prevot, A. S. H., Huang, W., and Mohr, C.: Photolytically induced changes in composition and volatility of biogenic secondary organic aerosol from nitrate radical oxidation during night-to-day transition, Atmos. Chem. Phys., 21, 14907–14925, https://doi.org/10.5194/acp-21-14907-2021, 2021.
Wu, Y., Liu, D., Tian, P., Sheng, J., Liu, Q., Li, R., Hu, K., Jiang, X., Li, S., Bi, K., Zhao, D., Huang, M., Ding, D., and Wang, J.: Tracing the Formation of Secondary Aerosols Influenced by Solar Radiation and Relative Humidity in Suburban Environment, J. Geophys. Res.-Atmos., 127, e2022JD036913, https://doi.org/10.1029/2022JD036913, 2022.
Xu, L., Suresh, S., Guo, H., Weber, R. J., and Ng, N. L.: Aerosol characterization over the southeastern United States using high-resolution aerosol mass spectrometry: spatial and seasonal variation of aerosol composition and sources with a focus on organic nitrates, Atmos. Chem. Phys., 15, 7307–7336, https://doi.org/10.5194/acp-15-7307-2015, 2015.
Yuan, B., Shao, M., de Gouw, J., Parrish, D. D., Lu, S., Wang, M., Zeng, L., Zhang, Q., Song, Y., Zhang, J., and Hu, M.: Volatile organic compounds (VOCs) in urban air: How chemistry affects the interpretation of positive matrix factorization (PMF) analysis, J. Geophys. Res.-Atmos., 117, D24302, https://doi.org/10.1029/2012JD018236, 2012.
Zaytsev, A., Koss, A. R., Breitenlechner, M., Krechmer, J. E., Nihill, K. J., Lim, C. Y., Rowe, J. C., Cox, J. L., Moss, J., Roscioli, J. R., Canagaratna, M. R., Worsnop, D. R., Kroll, J. H., and Keutsch, F. N.: Mechanistic study of the formation of ring-retaining and ring-opening products from the oxidation of aromatic compounds under urban atmospheric conditions, Atmos. Chem. Phys., 19, 15117–15129, https://doi.org/10.5194/acp-19-15117-2019, 2019.
Zhang, Q., Jimenez, J. L., Canagaratna, M. R., Ulbrich, I. M., Ng, N. L., Worsnop, D. R., and Sun, Y. L.: Understanding atmospheric organic aerosols via factor analysis of aerosol mass spectrometry: a review, Anal. Bioanal. Chem., 401, 3045–3067, 2011.
Zhou, W., Xu, W., Kim, H., Zhang, Q., Fu, P., Worsnop, D. R., and Sun, Y.: A review of aerosol chemistry in Asia: insights from aerosol mass spectrometer measurements, Environ. Sci. Proc. Imp., 22, 1616–1653, https://doi.org/10.1039/D0EM00212G, 2020.