the Creative Commons Attribution 4.0 License.
the Creative Commons Attribution 4.0 License.
 | 10 Jun 2024
Broadband and filter radiometers at Ross Island, Antarctica: detection of cloud ice phase versus liquid water influences on shortwave and longwave radiation
Kristopher Scarci
Ryan C. Scott
Madison L. Ghiz
Andrew M. Vogelmann
Dan Lubin
Surface radiometer data from Ross Island, Antarctica, collected during the austral summer 2015–2016 by the US Department of Energy Atmospheric Radiation Measurement (ARM) program West Antarctic Radiation Experiment (AWARE), are used to evaluate how shortwave and longwave irradiance respond to changing cloud properties as governed by contrasting meteorological regimes. Shortwave atmospheric transmittance is derived from pyranometer measurements, and cloud conservative-scattering optical depth is derived from filter radiometer measurements at 870 nm. With onshore flow associated with marine air masses, clouds contain mostly liquid water. With southerly flow over the Transantarctic Mountains, orographic forcing induces substantial cloud ice water content. These ice and mixed-phase clouds attenuate more surface shortwave irradiance than the maritime-influenced clouds and also emit less longwave irradiance due to colder cloud base temperature. These detected irradiance changes are in a range that can mean onset or inhibition of surface melt over ice shelves. This study demonstrates how basic and relatively low-cost broadband and filter radiometers can be used to detect subtle climatological influences of contrasting cloud microphysical properties at very remote locations.
- Article
(6501 KB) - Full-text XML
- BibTeX
- EndNote


Even with the numerous recent advances in atmospheric measurement technology, there are many remote regions on Earth that can be sampled with only very basic and fully automated instruments. Such locations naturally include much of the high latitudes but also include isolated islands or sea-based platforms, remote forest, desert or alpine locations, or locations where atmospheric observations are made as ancillary data to some other environmental monitoring priority. The purpose of this paper is to demonstrate what can be learned about a region's climate from basic atmospheric irradiance measurements made by pyranometers, pyrgeometers, and filter radiometers, with the aid of meteorological reanalysis and satellite remote sensing.
The Antarctic is one critical region for terrestrial climate change whose extreme remoteness and numerous logistical challenges have led researchers to rely heavily on networks of basic instruments such as automatic weather stations (AWSs, Lazzara et al., 2012). In one example, shortly after the collapse of the Larsen-B Ice Shelf (Glasser and Scambos, 2008) an AWS provided the only in situ data conclusively demonstrating the effect of a circulation anomaly that transported warm air directly to the ice shelf surface, spurring melt-ponding, hydrofracturing, and the rapid ice shelf collapse (van den Broeke, 2005). In another example, pyranometers deployed aboard the Australian research vessel RSV Aurora Australis throughout several years of Southern Ocean transects were analyzed in conjunction with shipboard sky and sea ice observations and detailed radiative transfer modeling to derive valuable climatological cloud optical and radiative properties over sea ice and open ocean (Fitzpatrick et al., 2004; Fitzpatrick and Warren, 2005, 2007).
Since these earlier studies the role of Antarctica in cryospheric mass loss and sea level rise has seen increasing attention. Between 1979–2017 the total mass loss from the Antarctic continent has increased by a factor of 6, and most recently this mass loss has been dominated by the Amundsen Sea and Bellingshausen Sea sectors of West Antarctica and Wilkes Land in East Antarctica (Rignot et al., 2019). The main concern about the stability of the West Antarctic Ice Sheet (WAIS) has centered on its response to a warming Southern Ocean in the form of ice sheet grounding line retreat inland on downward slopes, a mechanically unstable system that potentially results in large-scale loss of WAIS ice mass if the warming process reaches a tipping point (Alley et al., 2015). At the same time, the adjacent floating ice shelves comprise a critical buffer to ice sheet loss by being anchored to adjacent land formations, thereby providing mechanical buttressing. This ice sheet buttressing occurs substantially throughout all the West Antarctic ice outflows of most critical concern in today's warming climate (Fürst et al., 2016). Recent ice sheet modeling (Pollard et al., 2015) and observational studies (e.g., Scambos et al., 2009; McGrath et al., 2012) emphasize that surface melt on ice shelves – induced by atmospheric warming – can potentially accelerate mass loss in West Antarctica and on the Antarctic Peninsula. At high latitudes during summer the radiative fluxes are generally the largest individual components of the surface energy balance (SEB), and radiative fluxes over West Antarctica are strongly modulated by cloud variability, including changes in microphysical and optical properties (Scott et al., 2017). Determining the cloud influences on the SEB therefore has increasing relevance for understanding cryospheric change. Specifically, changes in net surface radiative flux on the order of 10 W m−2 or less can make the difference between a SEB having a positive–negative diurnal cycle or remaining positive for several days and inducing or sustaining surface melt (Nicolas et al., 2017; Ghiz et al., 2021).
These issues, ultimately related to sea level rise, in 2015 motivated the US Department of Energy (DOE) Atmospheric Radiation Measurement (ARM) program and the US Antarctic Program (USAP) to jointly deploy an advanced and comprehensive suite of atmospheric science equipment to Antarctica (Lubin et al., 2020). This campaign, the ARM West Antarctic Radiation Experiment (AWARE), installed the Second ARM Mobile Facility (AMF2; Mather and Voyles, 2013) at McMurdo Station on Ross Island (77.85° S, 166.66° E), where it operated over a full annual cycle with all instruments starting on 1 December 2015 and ending on 5 January 2017. AMF2 instrumentation included a set of triple-frequency cloud research radars, cloud and aerosol polarized lidars, meteorological equipment, rawinsondes, aerosol microphysical and chemical sampling equipment, and a variety of upward- and downward-looking radiometers. The AMF2 was installed at the site of the USAP Cosmic Ray Laboratory (CosRay) in an open area approximately 1 km from McMurdo Station and along the main road leading to New Zealand's Scott Base. A second component of AWARE deployed a smaller suite of instruments optimized for SEB measurement to the WAIS Divide Ice Camp (79.47° S, 112.09° W), where it operated from 4 December 2015 until 17 January 2016. At WAIS Divide the AWARE campaign was able to sample the SEB during a major surface melt event, directly related to the cryospheric change issues discussed above, including the role of cloud microphysical properties (Nicolas et al., 2017; Wilson et al., 2018). Here we analyze radiometer data from the main AMF deployment at the CosRay site on Ross Island, encompassing 91 d of measurements from the austral summer 2015–2016. A map of Antarctica showing the AWARE deployments and other locations discussed in this paper is shown in Fig. 1.
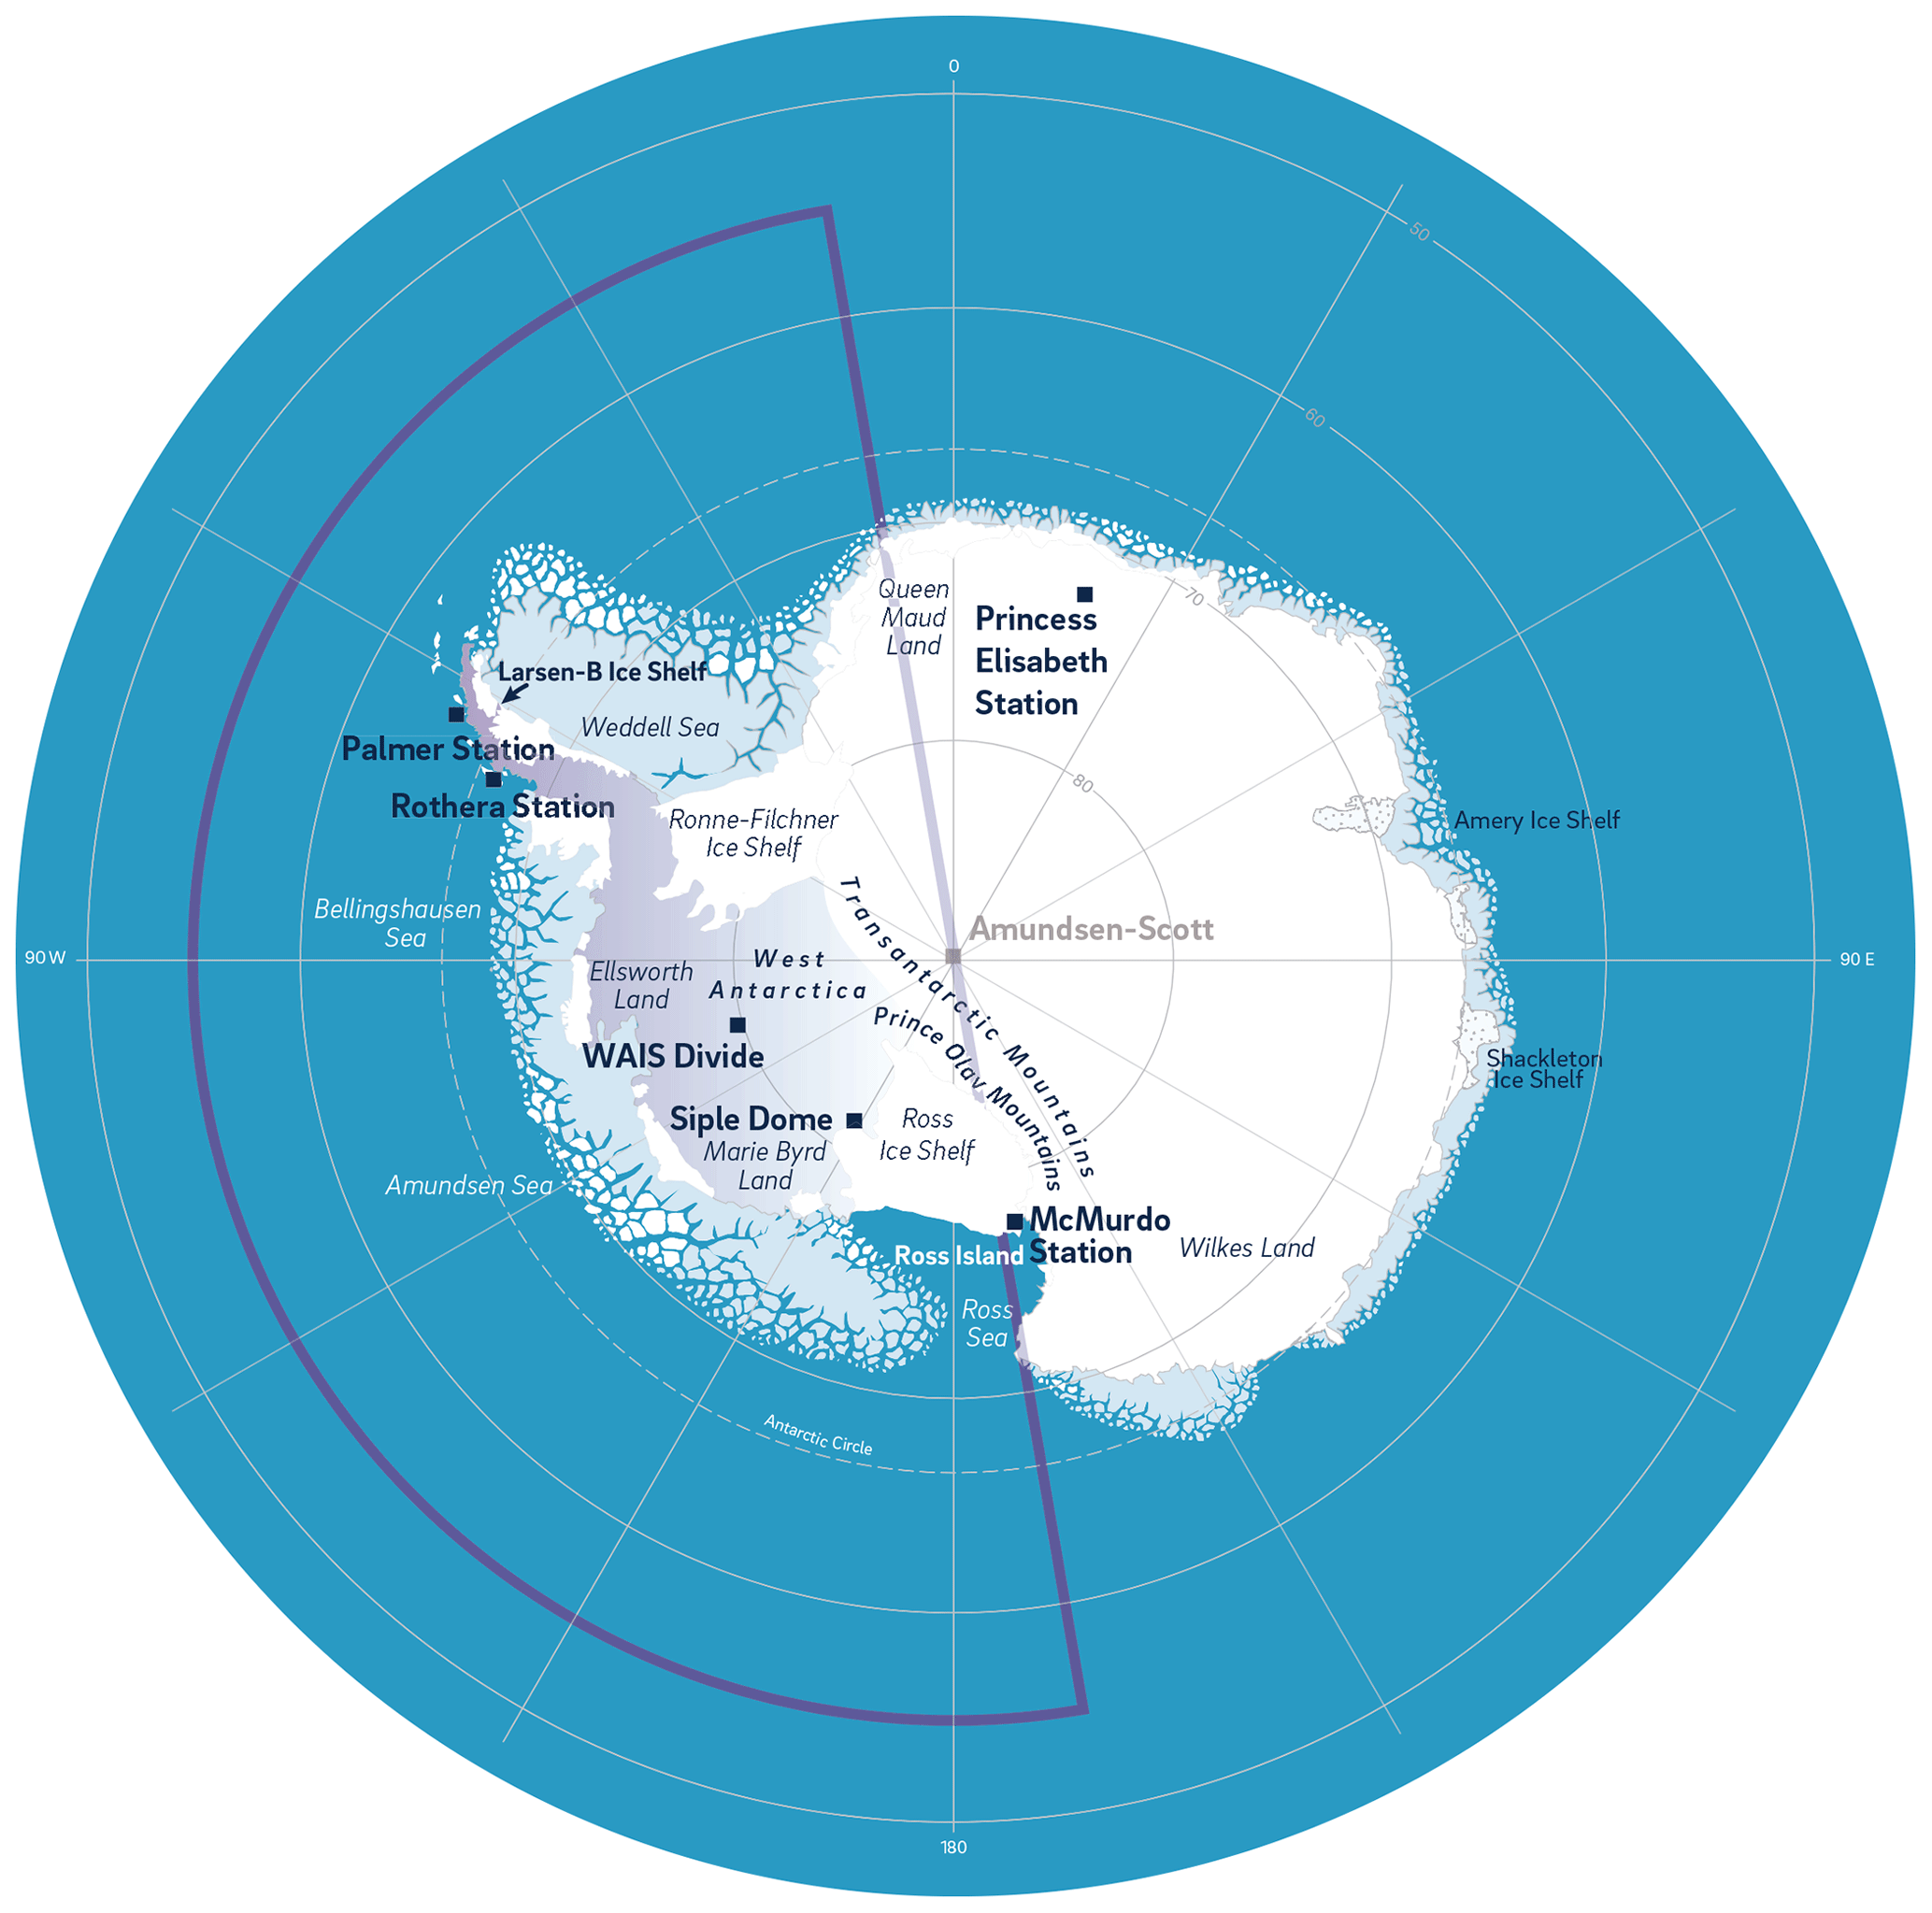
Figure 1Map of Antarctica showing the locations of AWARE at McMurdo Station on Ross Island and the WAIS Divide, along with other research stations and geographic regions mentioned throughout the text. The semicircle denoted by the magenta border encloses the geographic region over which ERA-Interim data were analyzed in the k-means clustering algorithm.
Data from AWARE's most sophisticated instruments have now been extensively analyzed in climatological studies that include contrasts in cloud microphysical properties between the Antarctic and Arctic (Zhang et al., 2019) and the response of cloud microphysics and radiation to changes in the prevailing meteorological regimes (Silber et al., 2019). The challenge for polar research, especially in the Antarctic, is that the most sophisticated instruments usually cannot be deployed at very many locations or for long periods of time. For the foreseeable future, it will be necessary to incrementally build atmospheric science capabilities with relatively simple instruments that can operate long term at a variety of locations.
Here we analyze data from three basic and well-established ARM Program instruments for radiation and cloud properties that have long and established field records at many sites worldwide. We show how these datasets, combined with meteorological and satellite remote sensing analysis, can detect how significant cloud microphysical changes can result in statistically significant variations in surface shortwave radiation. Our first objective is to determine the prevailing meteorological regimes bringing contrasting air masses to Ross Island during summer 2015–2016. We then analyze ARM radiometer data to determine corresponding contrasts in surface shortwave irradiance related to changing cloud properties. NASA Moderate-resolution Imaging Spectroradiometer (MODIS) retrievals of cloud thermodynamic phase and geometric top height over Ross Island help to explain and corroborate the surface irradiance contrasts we detect in the ARM radiometer data.
Data
We use two standard ARM Program radiometric measurements. The Sky Radiometers on Stand for Downwelling Radiation (SKYRAD; e.g., Long and Ackerman, 2000; Dong et al., 2010) measures downwelling surface shortwave irradiance using Eppley precision spectral pyranometers that have a broadband response over the wavelength range 295–3000 nm. SKYRAD measures downwelling longwave irradiance using Eppley precision infrared radiometers that have a broadband response over the wavelength range 3.5–50 µm. A complementary ARM suite for upwelling shortwave and longwave radiation reflected and emitted by the surface (GNDRAD) uses the same instruments in a downward-looking configuration. The Multi-Filter Rotation Shadowband Radiometer (MFRSR, Harrison et al., 1994; Michalsky and Long, 2016) measures narrowband surface irradiance suitable for retrieving cloud scattering optical depth. The standard MFRSR, manufactured by Yankee Environmental Systems (Inc.), comprises six narrowband filter–detector combinations with nominal wavelengths of 415, 500, 615, 673, 870, and 940 nm. This wavelength combination allows for retrievals of aerosol and cloud optical depth, total column ozone abundance, and total column water vapor. The use of an automated rotating shadowband allows measurement of the global hemispheric irradiance and the diffuse irradiance, from which the direct solar irradiance is obtained by subtraction. A complementary ARM instrument for upwelling irradiance at these wavelengths, the Multifilter Radiometer (MFR), without a shadowband, allows us to measure the spectral surface albedo for use with radiative transfer calculations. Here we use the 870 nm irradiance from MFRSR and MFR for cloud optical depth retrieval.
We also use the Total Sky Imager (TSI; e.g., Kassianov et al., 2005, 2011) to identify the periods of overcast sky conditions that we interpret in this study. The TSI, also manufactured by Yankee Environmental Systems (Inc.), uses a downward-looking CCD color camera viewing a concave mirror to image the entire sky with an effective field of view of 160°. The ARM TSI algorithm, applied when the sun elevation is greater than 10° above the horizon, splits the cloud fractional coverage measurements into two variables, percent_opaque and percent_thin. We sum these values to determine the total cloud cover and classify the scene as overcast if this sum is greater than or equal to 95 %.
In the spirit of this study's objective to obtain maximum climatological information from simple yet rugged instruments deployed at very remote locations, we note three aspects of the instruments chosen here. First, pyranometers and pyrgeometers have been used worldwide for many decades. Second, the MFRSR is representative of several emerging shortwave measurement capabilities adopted by the ARM Facility for long-term observations (Riihimaki et al., 2021). Finally, the TSI itself is generally not an instrument that can be left unattended at remote locations. It normally requires standard AC power, and the relatively large concave mirror requires regular cleaning. However, there are now compact, low-power, and fully automated digital all-sky imagers such as those manufactured by ALCOR System™. One of these cameras was successfully deployed at Siple Dome in West Antarctica during the austral summer 2019–2020 (Lubin et al., 2023). Therefore, the combination of all-sky imagery with broadband and narrowband radiometry is viable for remote deployments and, with careful analysis aided by meteorological reanalysis and satellite remote sensing data, can reveal much about a location's atmospheric properties.
Subtle changes in the Antarctic SEB can trigger or sustain surface melt. As clouds are the largest modulator of Antarctic surface radiation, it is useful to identify prevailing meteorological regimes in a given Antarctic region and determine their associated cloud properties. Scott et al. (2019) performed a k-means clustering analysis for the West Antarctic Amundsen Sea embayment region, home to many of the most vulnerable ice sheets and ice shelves. That study identified nine characteristic meteorological regimes that can occur in all seasons and either favor or inhibit surface melt by virtue of relatively small differences in atmospheric thermodynamic and cloud properties. Here we use the k-means clustering technique of Mülmenstädt et al. (2012) to objectively identify the prevailing meteorological regimes impacting Ross Island. The observations used as input data for this technique are the ERA-Interim reanalysis (Dee et al., 2011) 700 hPa geopotential height (Z700) anomalies and 2 m near-surface air temperature (T2m) anomalies, covering a sector of Antarctica and the Southern Ocean ranging from 55° S to the South Pole and from 160 to 340° E, thus including the entire Ross Ice Shelf (RIS) and WAIS.
The anomalies were obtained by computing daily mean fields from the 6-hourly (00:00, 06:00, 12:00, 18:00 UTC) fields of Z700 and T2m over a full 10-year period leading up to and including AWARE from 2007–2016. Following this, by averaging them for each calendar day, the raw seasonal cycle at each grid point was computed. This time series was then smoothed using fast Fourier transform (FFT) to remove the high frequencies, followed by inverse FFT to get a smoothed seasonal cycle. Daily anomalies were computed by subtracting the smoothed seasonal cycle from the raw daily means at each grid point. A k-means clustering algorithm was then applied to identify characteristic Z700 centroids and to composite the T2m anomalies. These anomalies were computed for each of four seasons (3-month periods), and in each season four stable clusters could be identified, each related to a specific orientation of low- versus high-pressure centers in the Ross, Amundsen, and Bellingshausen seas.
During summer (DJF), two clusters are associated with warm meteorological regimes, a third cluster is associated with cold conditions, and a fourth describes a unique large-scale circulation pattern. The corresponding ERA-Interim-based 2 m near-surface temperature anomalies for each cluster (regime) are shown in Fig. 2. Regime 1 is characterized by a blocking high over the Amundsen Sea that drives marine air advection and Föhn wind-induced warming of Marie Byrd Land and the RIS. Similar forcing triggered the January 2016 large-scale surface melt event recorded by AWARE data (Nicolas et al., 2017). In this regime, northerly-to-northeasterly flow brings warm temperatures and low-level clouds to Ross Island of the typical cold maritime stratiform variety. The most likely air mass source region for these clouds is the Ross and western Amundsen Seas and the eastern Ross Ice Shelf.
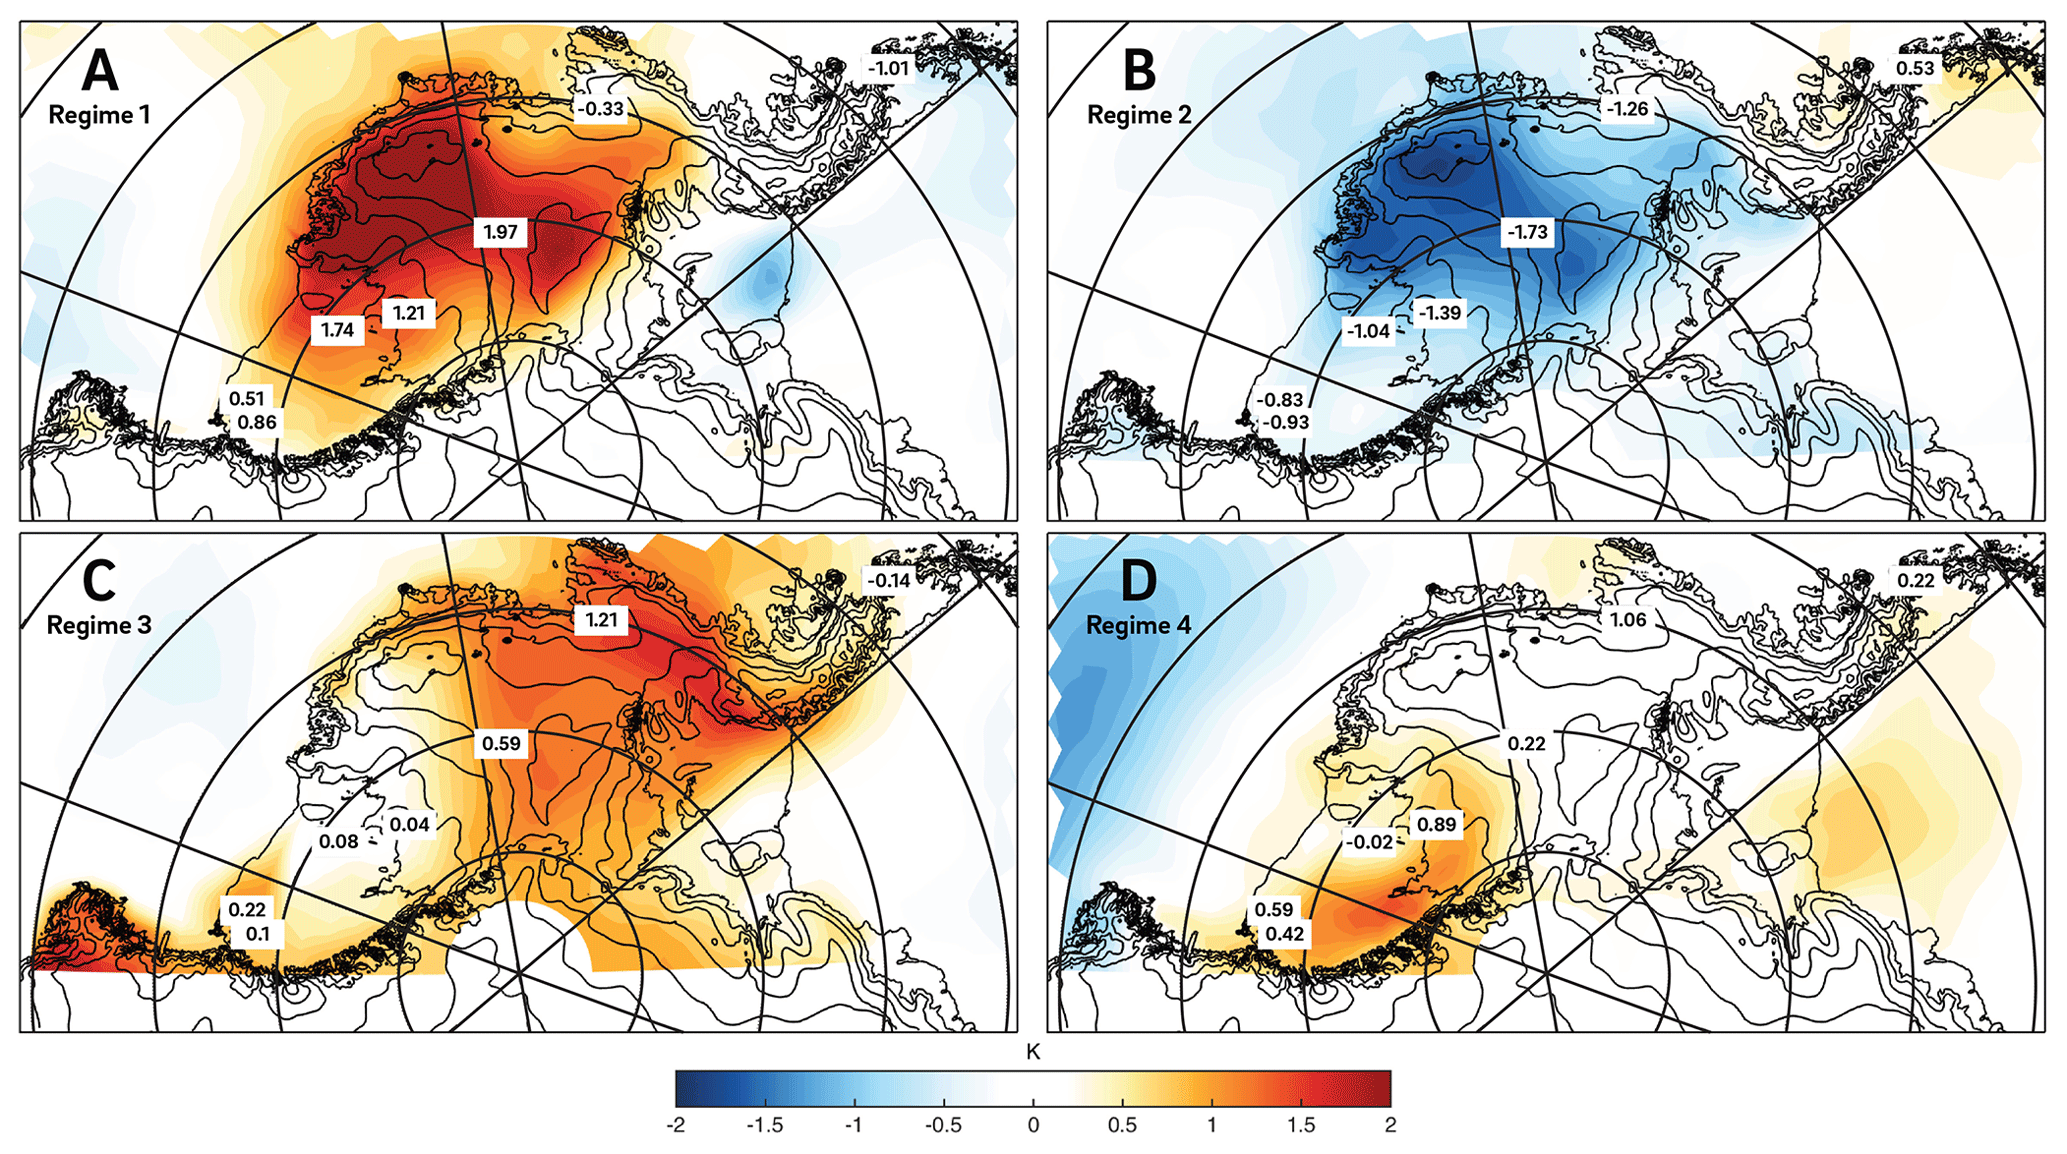
Figure 2Anomalies of ERA-Interim-based 2 m near-surface air temperature (color bar) for each of the four meteorological regimes identified by the k-means clustering technique for the summer months (DJF). Numbers overlaid on these maps are observed 2 m air temperature anomalies computed from six University of Wisconsin automatic weather stations (Lazzara et al., 2012). Solid lines depict topography in steps of 500 m.
Regime 2 is characterized by a low-pressure center over the Bellingshausen Sea that draws continental polar air northward, promoting cooling of West Antarctica (cf. Nicolas and Bromwich, 2011). At the same time, Föhn wind warming occurs on the eastern AP. Regime 2 is the “cold” regime impacting Ross Island. Associated with a positive Southern Annular Mode (SAM) index, it favors the coldest average summertime conditions. When present, clouds over Ross Island likely contain significant ice water.
Regime 3 is driven by a strong negative phase of the SAM and a weak Amundsen Sea low. Two ridging centers over the Ross Sea and the AP favor warming along their western flanks and moderate Föhn warming in Ellsworth Land. Similar but not identical to Regime 1, anticyclonic flow over the Ross Sea advects marine air from the western Ross Sea directly toward Ross Island.
Regime 4 describes a unique circulation pattern in which a deep Ross Sea cyclone injects warm, moist air over Marie Byrd Land, which subsequently descends onto the southern RIS, downwind of the Prince Olav Mountains. Cyclonic intrusions of marine air support a well-developed marine cloud band over West Antarctica. At Ross Island, strong southerly-to-southeasterly winds prevail throughout the lower troposphere, bringing ice and mixed-phase cloud systems influenced by local and remote orographic forcing, with the latter induced by the Transantarctic Mountains (Scott et al., 2017).
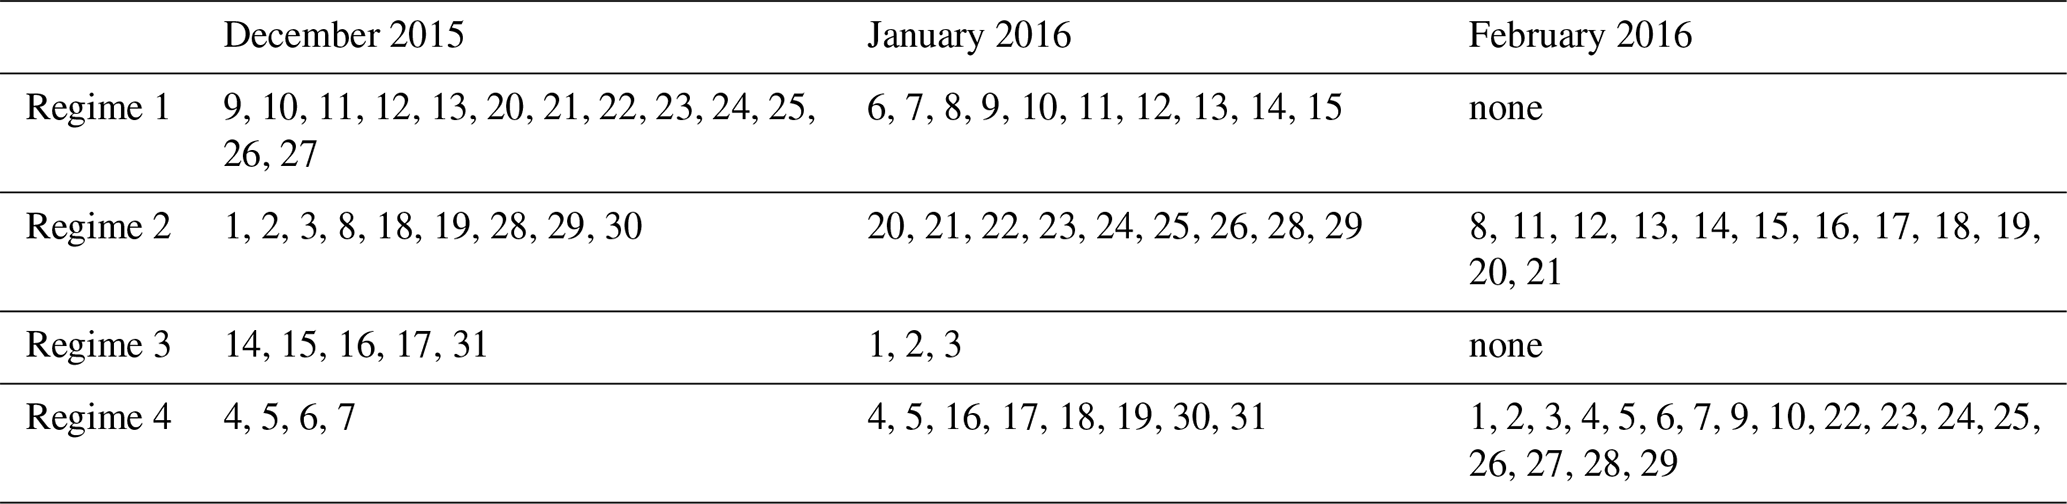
Figure 2 contains markers that specify 2 m air temperature anomalies computed from Antarctic automatic weather station (AWS) data (Lazzara et al., 2012), and these independent measurements provide additional confidence in the k-means clustering results through their consistency with the ERA-Interim-based temperature anomalies. ERA-Interim has been superseded by ERA5 (Hersbach et al., 2020), and it is worth considering if differences in the dynamical fields between the two reanalyses potentially give different k-means clustering results. In Fig. 3, we compare the 700 hPa geopotential heights between the two for a region over the eastern Ross Sea and RIS. The Pearson correlation between the two is R=0.9973, and there is a slight low bias on the order of 10 m in ERA-Interim compared with ERA5. This tight consistency between the two reanalyses suggests that the same four clusters would emerge if the work were redone with ERA5. During the summer months sampled by the AWARE campaign on Ross Island when skies were overcast, regimes 1–4 occurred with frequencies of 25.7 %, 32.9 %, 7.1 %, and 34.3 %, respectively, and their specific days of occurrence are given in Table 1.
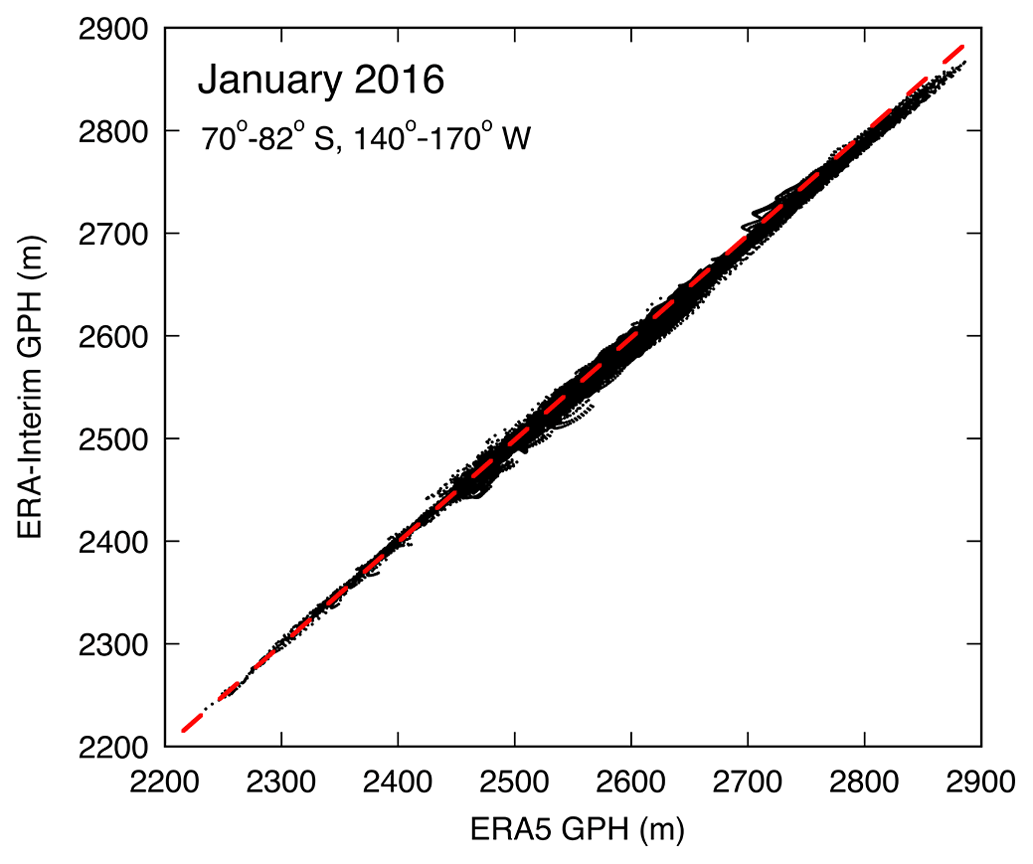
Figure 3Geopotential heights at 700 hPa for ERA-Interim versus ERA5 reanalyses for an area over the eastern Ross Sea and Ross Ice Shelf. The dashed red line is the one-to-one correspondence.
Table 1Daily occurrences of each k-means clustering meteorological regime throughout the austral summer 2015–2016.
Scott et al. (2019) applied the k-means clustering technique to ERA-Interim data over a larger domain to derive nine synoptic patterns influencing surface melt in West Antarctica. Our Regime 1 here is analogous to Pattern 7 of Scott et al. (2019), which favors surface melt. Our cold Regime 2 here is similar to Pattern 2 of Scott et al. (2019). Our Regime 3, which has a small impact on temperature anomalies on the RIS but features warming and melting on the Ronne–Filchner Ice Shelf, is similar to Pattern 5 of Scott et al. (2019). Our unique Regime 4 has similarities with Pattern 3 of Scott et al. (2019), particularly regarding warm temperature anomalies over the southern RIS, although in this analysis the driving cyclone appears stronger and is situated slightly west of the cyclone derived in Scott et al. (2019). Similarly, Silber et al. (2019) applied a self-organizing map (SOM) technique to classify synoptic regimes influencing Ross Island during AWARE. Our regimes 1–4 are similar to the Silber et al. (2019) SOM numbers 4, 3, 7, and 6, respectively.
The MODIS cloud products have within their retrieval algorithms a history of increasingly specialized improvements for polar regions (e.g., Frey et al., 2008; Marchant et al., 2016). MODIS cloud property retrievals provide insight into our meteorological regime contrasts. Figure 4a shows the 1 km cloud-phase retrievals (Platnick et al., 2003) in a 1° latitude by 1° longitude grid cell over McMurdo Station during summer 2015–2016. Regime 1 shows the largest incidence of liquid water cloud and smallest incidence of mixed-phase cloud. Similarly, Regime 3 shows a large incidence of liquid water cloud and the smallest incidence of ice cloud. Both results are consistent with onshore flow and marine air mass origin. Regime 2 shows ice or mixed-phase cloud 47 % of the time, compared with 27 % for liquid water. Regime 4 shows the largest incidence of ice cloud, and ice plus mixed-phase cloud comprise 62 % of the scene identification compared with 22 % for liquid water cloud and 16 % for clear sky. MODIS cloud top heights (Fig. 4b) show that the two warmer regimes have consistently lower clouds. Regime 4 has the largest range in cloud top height, consistent with orographic forcing by local terrain and the Transantarctic Mountains. Cloud top heights for the cold continental outflow regime are intermediate between the orographic and the two warmer regimes.
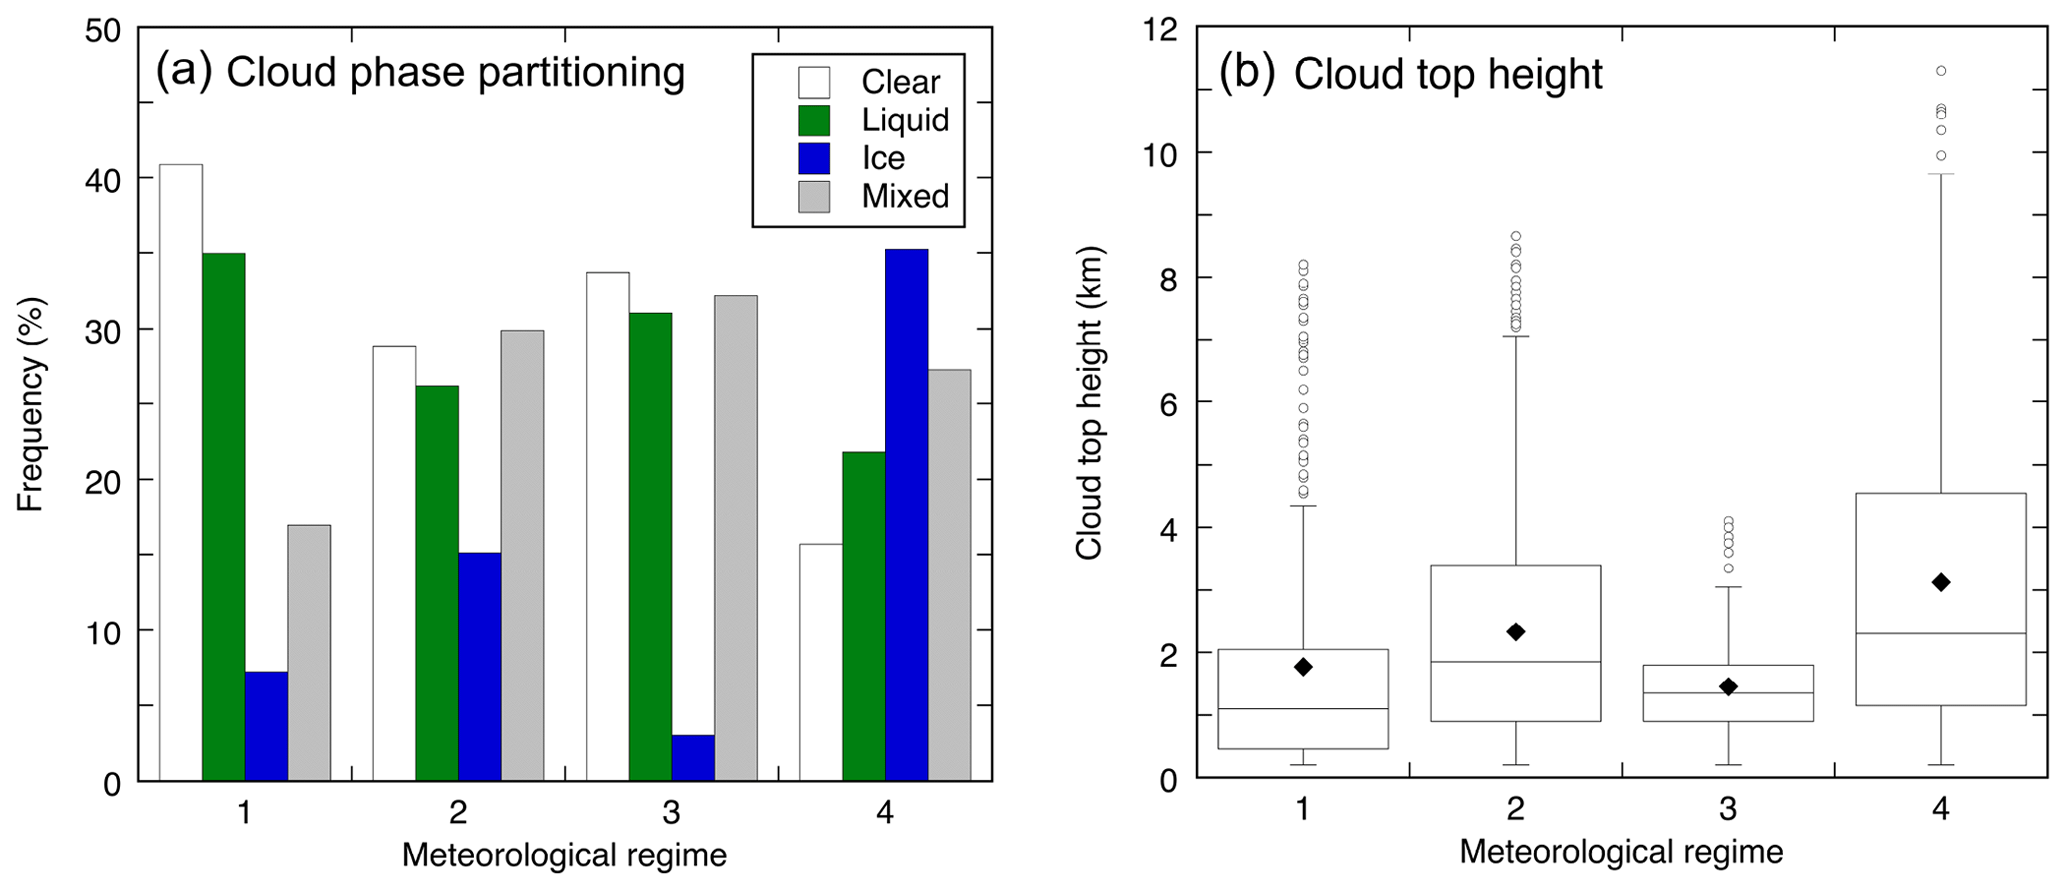
Figure 4MODIS retrievals of cloud properties throughout the austral summer 2015–2016 in a 1°×1° latitude × longitude grid cell over McMurdo Station and sorted by the four meteorological regimes from the k-means clustering analysis for (a) cloud thermodynamic phase and (b) cloud top height. In (b) the box encloses the middle 50 % of the distribution (lower quartile to upper quartile), the median is depicted by the dividing line, and the diamond depicts the mean value. The lines extending above and below each box depict nearly the entire distribution. Individual points above these lines represent individual outliers, whose values are greater than the upper quartile value plus 1.5 times the interquartile distance.
Although MODIS cloud property retrievals have shown improvements over successive data collections, some uncertainties remain over high-latitude regions that may never be fully mitigated. Cossich et al. (2021) compared MODIS cloud amount retrieval over the Antarctic Plateau with retrievals from surface-based spectral infrared remote sensing and found that MODIS consistently underestimated cloud amount by a factor of 2 or more year-round, although MODIS did reproduce the amplitude of the seasonal cycle in cloud amount. Marchant et al. (2016) note that MODIS cloud top detection becomes less reliable for optically thin clouds at colder temperatures < 240 K, and these associated errors propagate in a cloud-phase identification algorithm. Wilson et al. (2018) compared MODIS cloud single-phase microphysical retrievals (optical depth and effective radius) with retrievals from a surface-based shortwave spectroradiometer on the WAIS and noticed discrepancies likely related to phase detection errors in low clouds close to the snow surface.
For these reasons, we checked the conclusions in Fig. 4 against a surface-based ARM value-added product (VAP) from AWARE. We use the THERMOCLDPHASE VAP (de Boer et al., 2011), which contains phase identification in up to 10 cloud layers from the High Spectral Resolution Lidar (HSRL). Analogous to Fig. 4a, Fig. 5 shows the occurrence frequency of clear skies and cloud-phase classifications for each of the four regimes for the highest HSRL-detected cloud layer. There is some qualitative consistency with the MODIS results, particularly for Regime 4, which shows the lowest clear-sky frequency and highest ice cloud frequency. In addition, the warm Regime 1 shows the greatest occurrence of liquid water cloud. The obvious discrepancy is the severe under-detection of liquid water cloud compared with MODIS and strong preference for ice cloud in all regimes. This inevitably results from the HSRL's upward-looking view: Silber et al. (2021) analyzed AWARE data from multiple sensors and determined that ∼ 75 % of supercooled liquid-bearing clouds precipitate ice particles from the cloud base, and this is consistently detected by the upward-looking lidar, while it would almost always be missed by the MODIS satellite retrieval algorithm. Above these same predominantly liquid water clouds, the MODIS cloud-phase algorithm would identify most of them as containing mainly liquid water. Despite the discrepancies, both the VAP and MODIS retrievals show a relative preference for cloud liquid water in the warm regimes and ice water in Regime 4. We now investigate the potential manifestation of these phase contrasts in surface radiometric measurements.
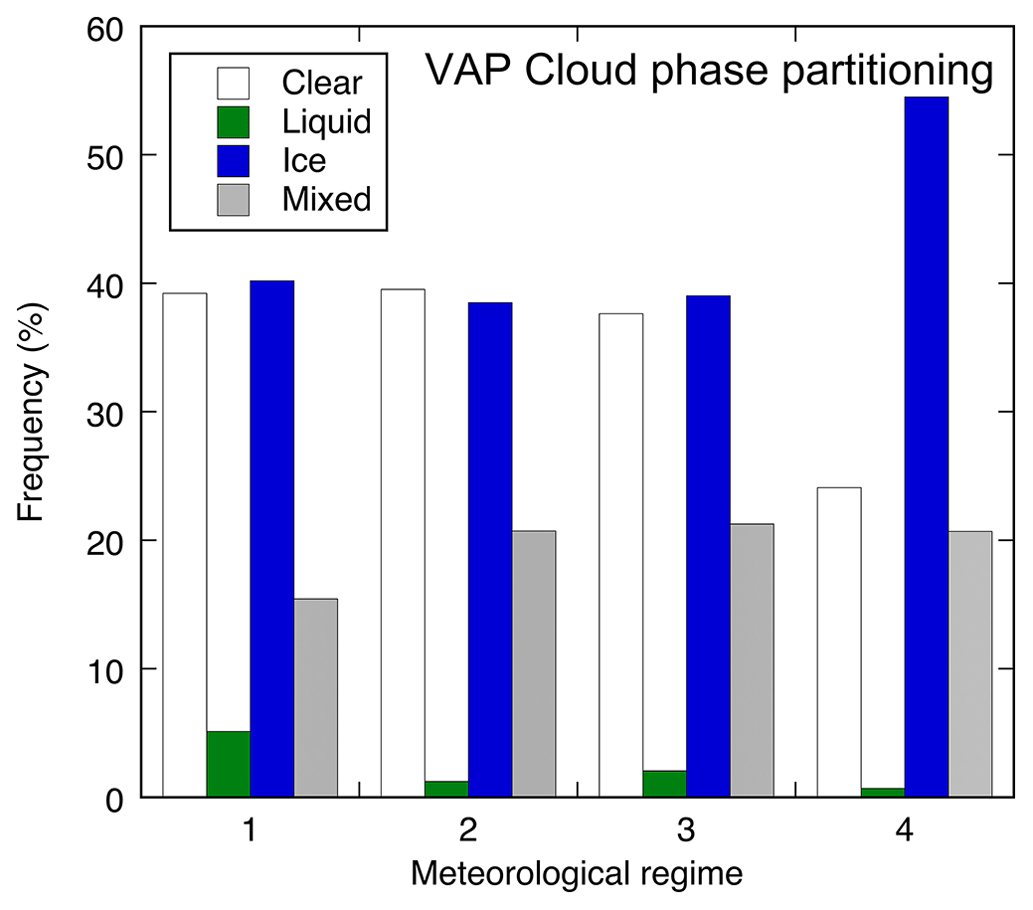
Figure 5As in Fig. 4a but for the ARM THERMOCLDPHASE High Spectral Resolution Lidar phase retrievals for the highest detected cloud layer above the AWARE site on Ross Island.
3.1 Cloud amount and longwave irradiance
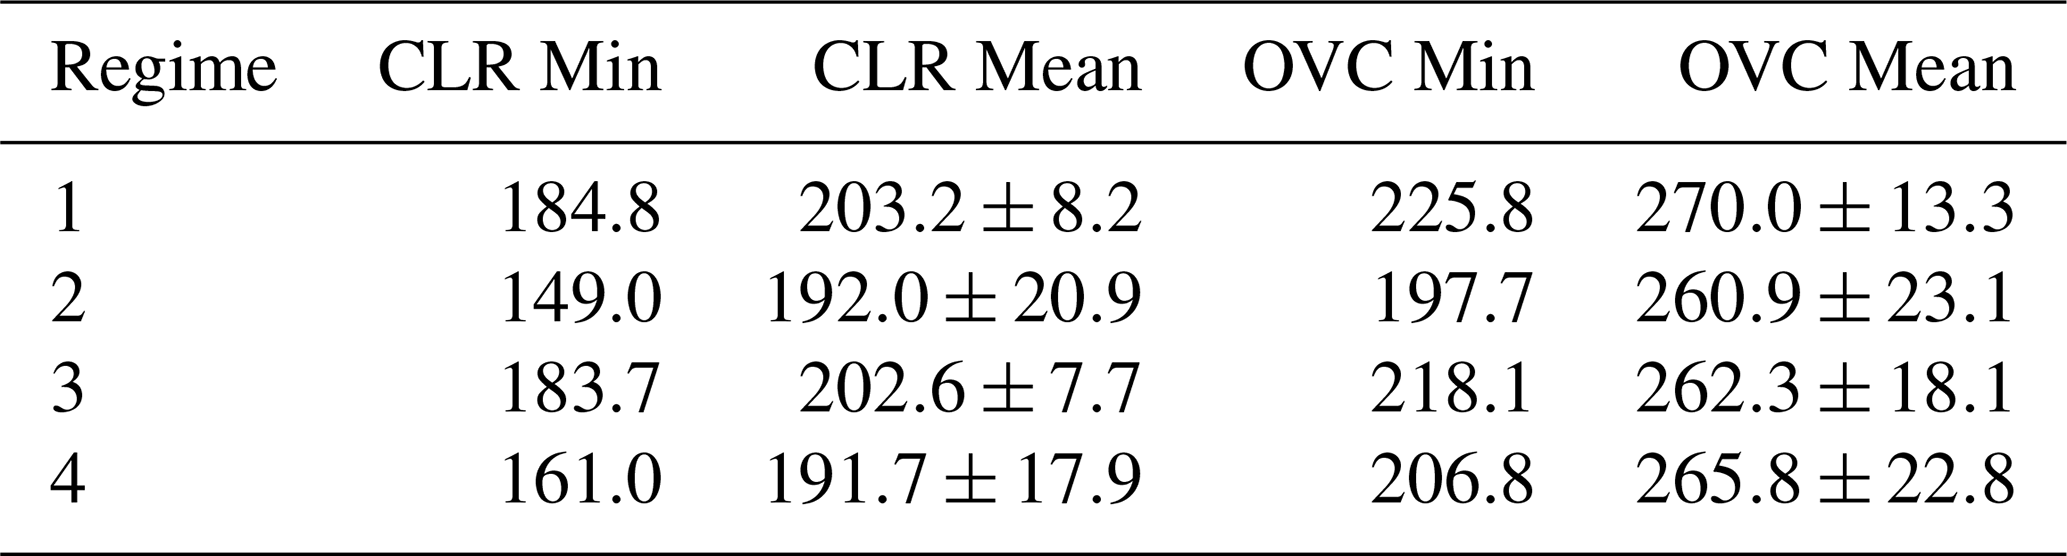
Figure 6 shows the frequency distribution of TSI-observed cloud coverage for each of the four meteorological regimes. All regimes show 60 %–70 % of sky conditions divided roughly equally between essentially clear skies (TSI cloud amount < 5 %) and nearly overcast to overcast (TSI cloud amount > 90 %). This is explained by most of the region's cloud coverage being driven by extensive storm systems originating in the Southern Ocean. Comparing Fig. 6 with Fig. 4a, we notice that MODIS identification of clear skies is 6 % larger than TSI in the warmer regimes (1 and 3), which is consistent with a known tendency of whole-sky imagers to underestimate clear sky fraction due to scattering artifacts near the position of the direct solar beam (Pfister et al., 2003; Long et al., 2006). The discrepancies for the warmer regimes are quite small considering the widely differing fields of view between the TSI all-sky camera and the MODIS satellite footprint. In the colder regimes MODIS identification of clear skies is 10 %–11 % smaller than TSI, and these discrepancies for the colder regimes may be analogous to those found in Cossich et al. (2021). Table 2 gives basic statistics for SKYRAD downwelling longwave measurements for each of the four meteorological regimes for TSI cloud amount < 5 % and > 95 %. These results are consistent with Regime 1 being the warmest regime and Regime 2 being the coldest. Regime 3, despite being one of the warmer regimes, shows relatively low mean downwelling longwave flux under overcast conditions, and this can be attributed to relatively low cloud optical depths, as discussed below.
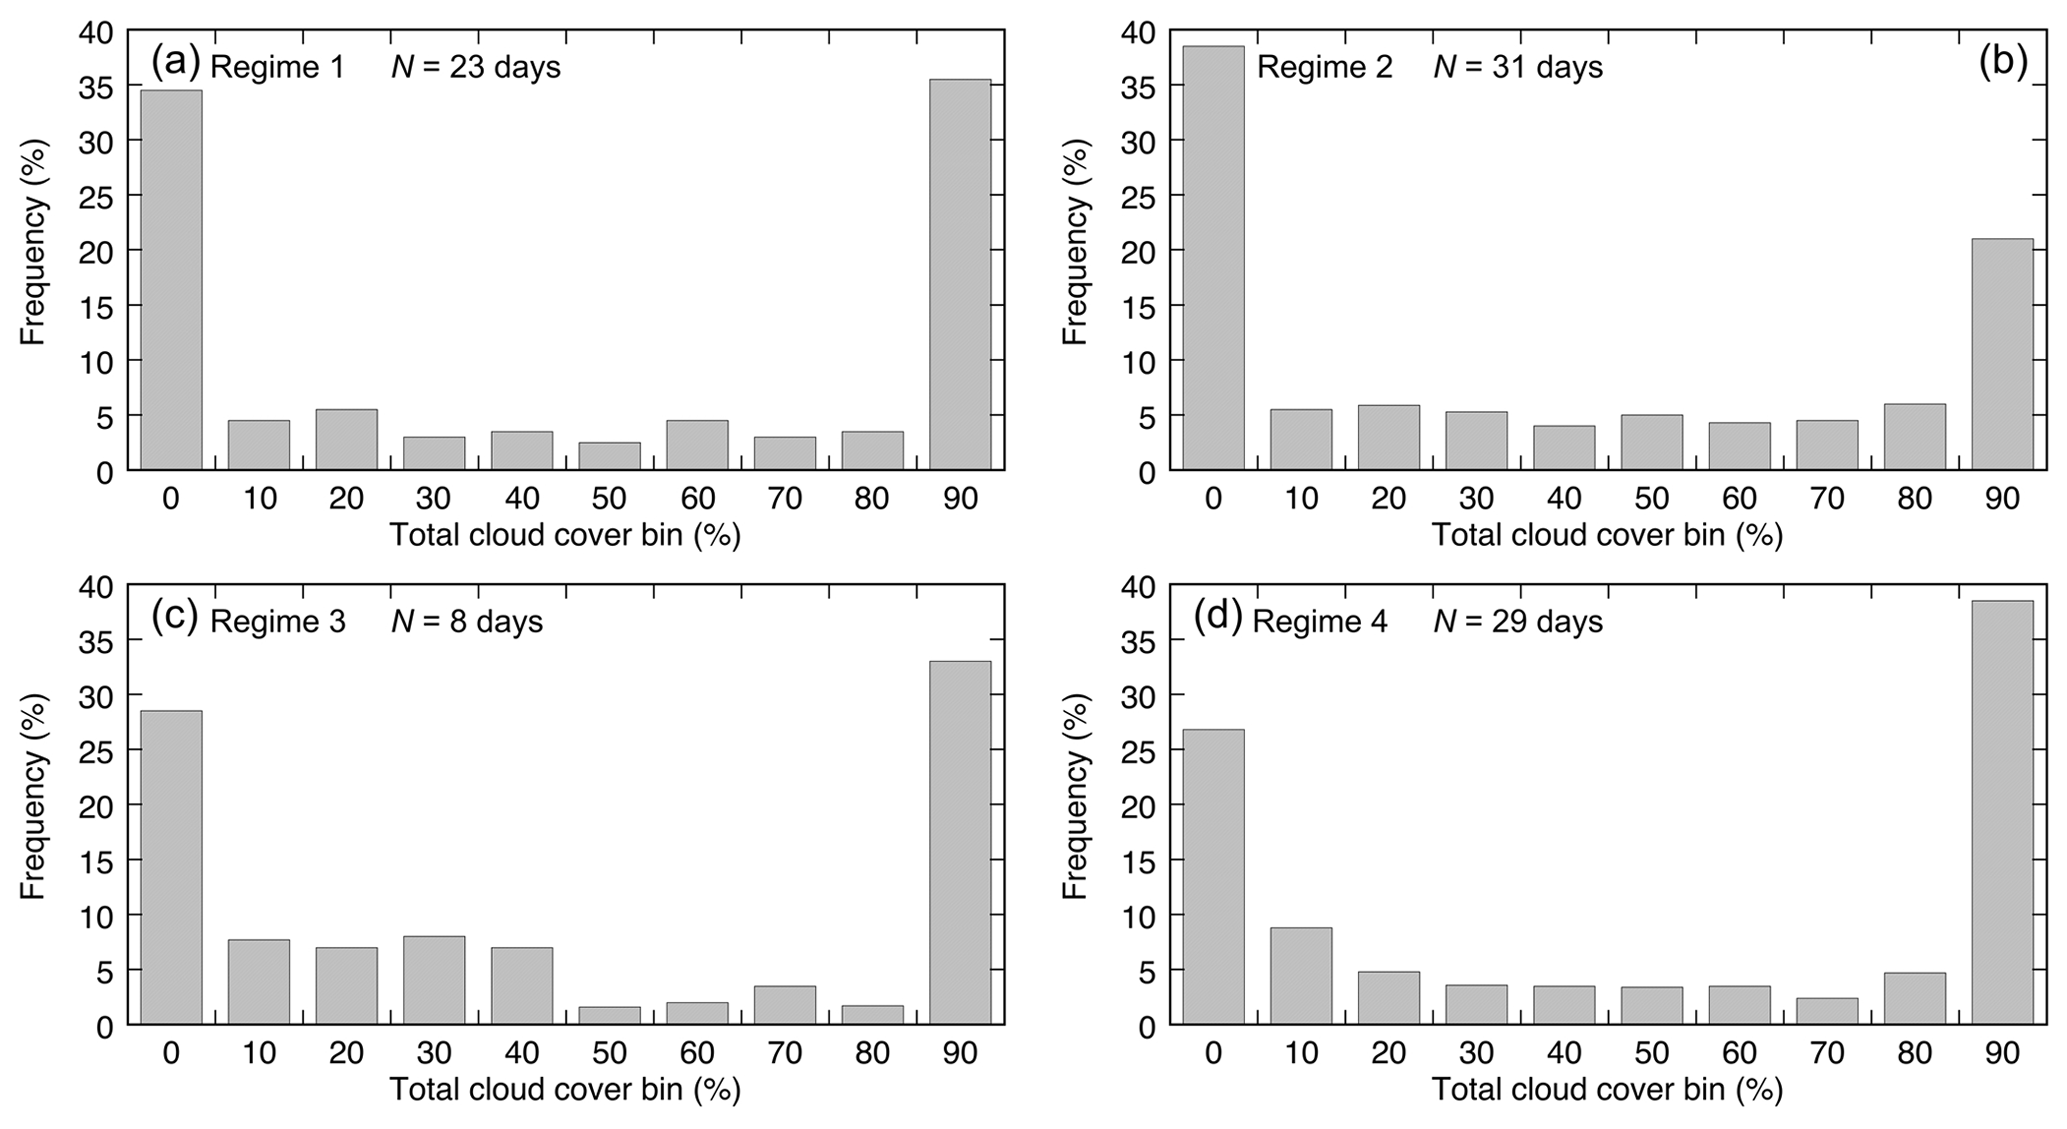
Figure 6Histograms of total cloud cover measured by the TSI on Ross Island throughout the austral summer 2015–2016 for each of the four meteorological regimes. The bins are identified by their lower bound, with the exception of the clear-sky bin, which depicts coverage in the range 0 %–5 %. The number of days each regime occurred is given in each panel.
Table 2Statistics for SKYRAD longwave irradiance measurements under each of the four meteorological regimes (W m−2) for TSI cloud amounts < 5 % (CLR) and > 95 % (OVC). The standard deviations are given along with the mean values.
3.2 Shortwave atmospheric transmittance
Our objective is to detect contrasts in cloud properties among the four meteorological regimes, and the key diagnostics are the atmospheric transmittances from the SKYRAD shortwave and MFRSR 870 nm measurements. Here the atmospheric transmittance is computed as the measured irradiance divided by the product of the extraterrestrial solar irradiance and the cosine of the solar zenith angle and also correcting for the varying Earth–Sun distance. For the SKYRAD shortwave, we use an extraterrestrial solar irradiance of 1350 W m−2, which is typical for the spectral interval covered by pyranometers. For the 870 nm MFRSR channel, we acquired the particular MFRSR Filter 5 spectral response function for the instrument used with AMF2 at AWARE. We used this as a weighting function when summing the MODTRAN (Berk et al., 2014) extraterrestrial solar spectral irradiance over the wavelength interval 851.5–891.5 nm to derive an extraterrestrial solar irradiance for the 870 nm channel of 0.9376 W m−2.
To determine if there are contrasting influences of cloud thermodynamic phase among the meteorological regimes, we examine the SKYRAD shortwave atmospheric transmittance as a function of the 870 nm atmospheric transmittance. The essential physical principle is that the 870 nm irradiance measurement is affected by conservative scattering by cloud particles. At wavelengths < 1100 nm, attenuation of solar radiation by cloud droplets or ice particles is overwhelmingly due to scattering and is nearly entirely independent of wavelength and, in turn, independent of thermodynamic phase or droplet and particle size (e.g., Lubin and Vogelmann, 2011). For measurements that include longer wavelengths, such as SKYRAD shortwave, absorption of radiation by the cloud layer is introduced by the spectral variabilities in the complex refractive indices of liquid and ice water as well as by the difference between the two phases. This spectrally variable absorption can be used to retrieve cloud thermodynamic phase and effective particle size if one has spectrally resolved surface irradiance measurements in the 1.6 µm window (e.g., McBride et al., 2011; Wilson et al., 2018). With respect to the surface energy budget, as measured in the shortwave by the SKYRAD pyranometers, a cloud-phase transition from mainly liquid water to substantial ice water content introduces supplemental absorption and attenuation of broadband shortwave surface irradiance for a cloud with the same conservative-scattering atmospheric transmittance. This supplemental attenuation occurs at near-infrared wavelengths and is typically in the range 5–10 W m−2 for Arctic mixed-phase stratiform clouds (Lubin and Vogelmann, 2011).
Figure 7 shows the SKYRAD shortwave atmospheric transmittance as a function of the 870 nm atmospheric transmittance for each of the four regimes. All of the SKYRAD transmittances lie below the one-to-one correspondence line due to absorption of radiation at near-infrared wavelengths. If this empirical function for one regime lies below that of another regime, this indicates greater near-infrared absorption. In the cold and dry Antarctic atmosphere, such differences are mainly due to contrasting cloud thermodynamic phase, with the presence of cloud ice water causing more absorption. In Fig. 7 we see that the coldest regime (2) has a shallower slope than that for either warm regime (1 or 3), signifying more absorption due to cloud ice, also consistent with Fig. 4. Regimes 1 and 4 show essentially the same slope, but Regime 4 shows a smaller intercept, and therefore its SKYRAD transmittances on average lie slightly below those of Regime 1, consistent with more cloud ice absorption from the clouds sampled under Regime 4.
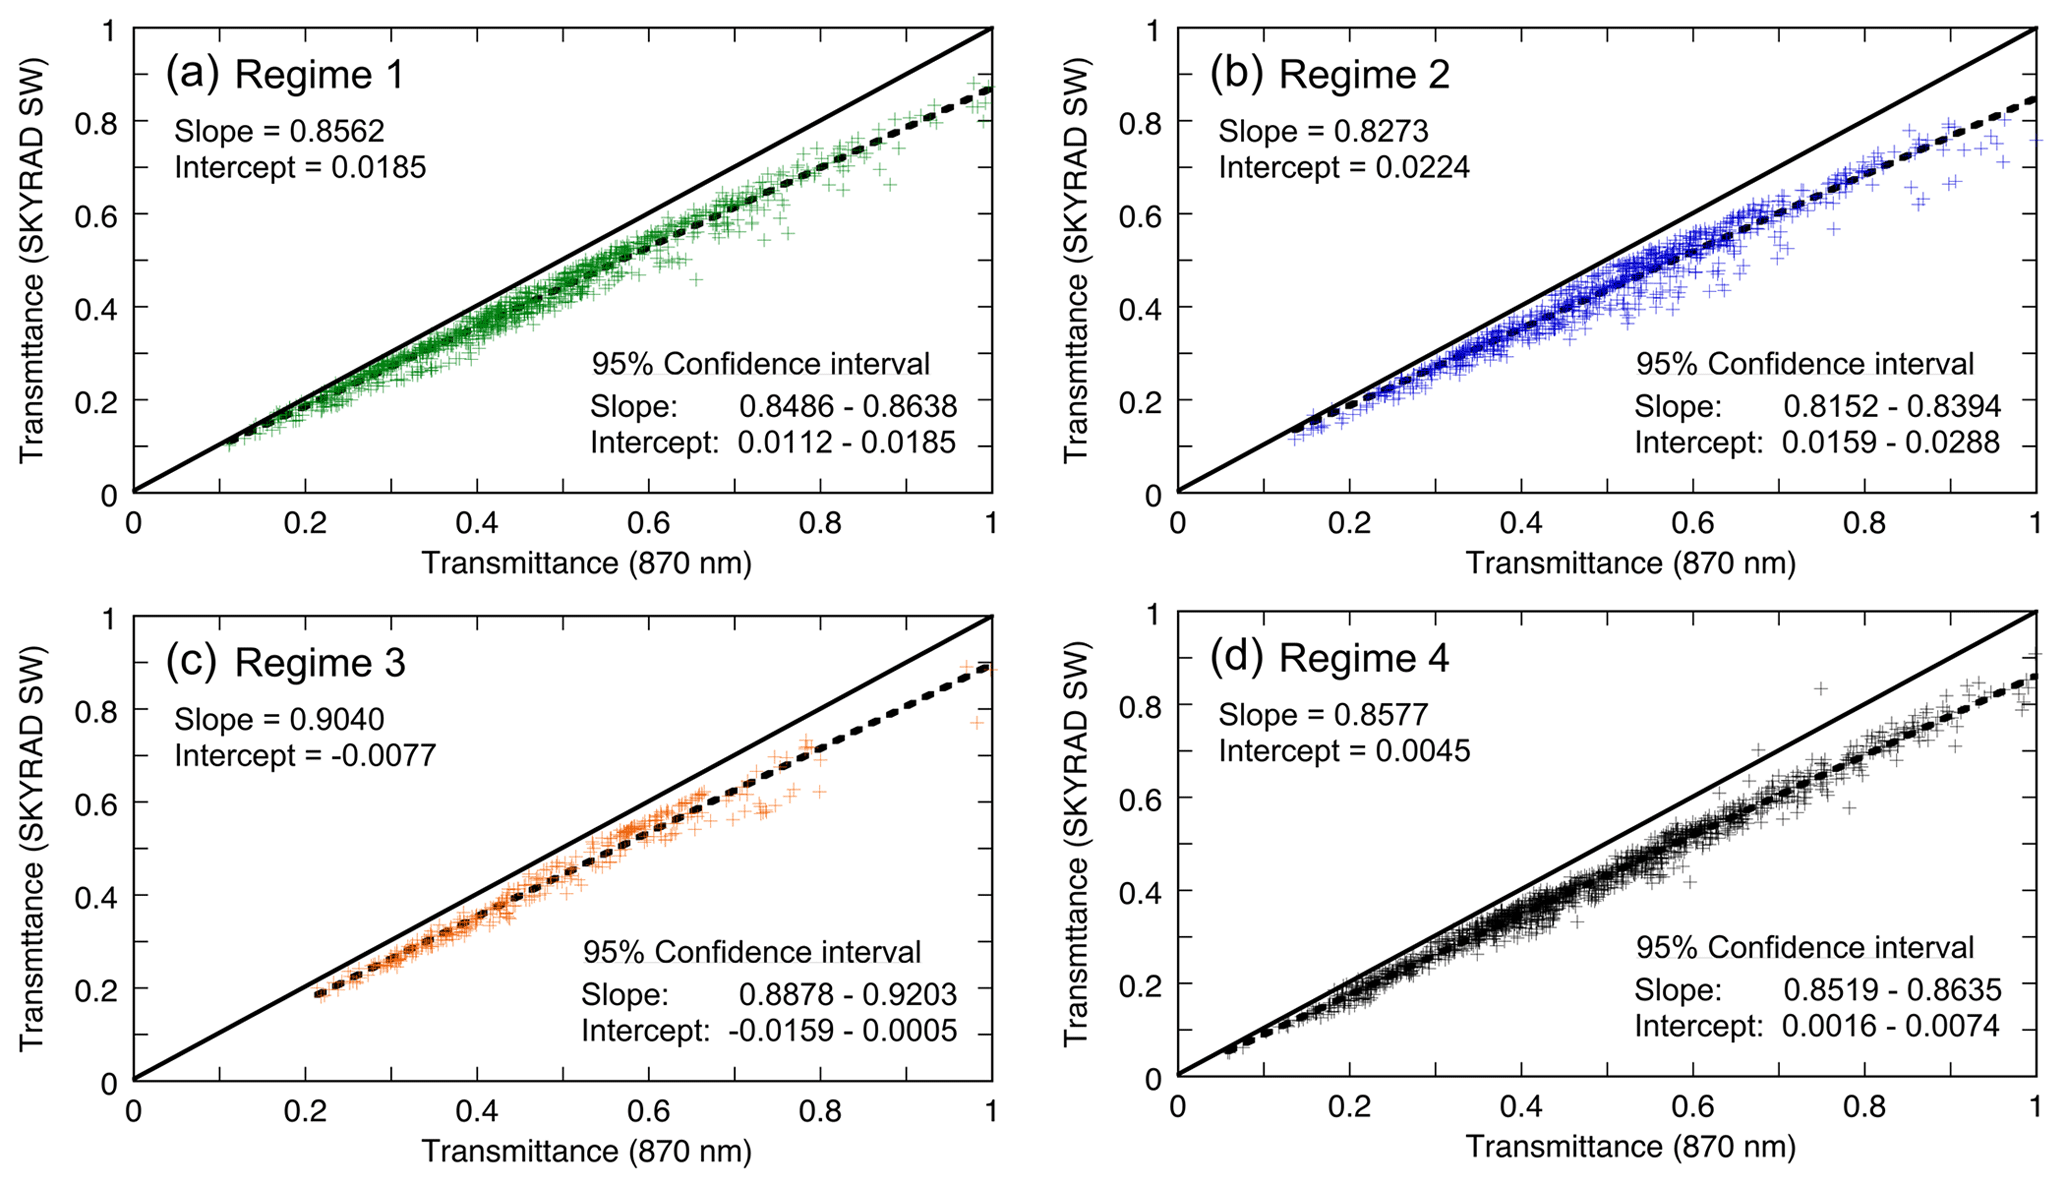
Figure 7Broadband shortwave transmittance as measured by the SKYRAD as a function of narrow-band transmittance at 870 nm as measured by the MFRSR under all overcast skies throughout the austral summer 2015–2016 for each of the four meteorological regimes. The solid line depicts one-to-one correspondence. The dotted line depicts a linear regression, with the slope and intercept and the 95 % confidence intervals on the slope and intercept given in each panel.
3.3 Cloud optical depth
While the atmospheric transmittance is sufficient to reveal the underlying cloud phase contrasts between meteorological regimes, we can obtain additional information by retrieving the effective cloud optical depth. To retrieve this optical depth we use the discrete-ordinates-based radiative transfer model (Stamnes et al., 1988) adapted for polar clouds by Lubin and Vogelmann (2011). In a plane-parallel model atmosphere based on AWARE sonde data, we iterate on cloud optical depth until the calculation matches the measured 870 nm surface irradiance. For this we need the 870 nm surface albedo, which is obtained as the ratio of the downward-facing MFR measurement to the upward-facing MFRSR measurement. During summer at the CosRay site the surface had little snow cover and featured mainly bare volcanic rock. Surface albedos evaluated every minute (when the solar elevation was above 10°) ranged from 0.015–0.524, with a seasonal mean value 0.088 ± 0.051. Therefore, local multiple reflection of photons between the surface and cloud base plays a minor role in the radiation transport, and the spectral surface irradiance is highly sensitive to cloud optical depth. At the same time we note that this site with its low surface albedo is not completely representative of a snow-covered ice shelf, and some assumptions about snow surface albedo and emissivity are required to generalize these results to other Antarctic locations.
Figure 8 shows the frequency distributions in effective cloud optical depth for each of the four meteorological regimes. These distributions are qualitatively similar to optical depth distributions derived over sea ice by Fitzpatrick and Warren (2005; see, for example, their Fig. 14) and by Fitzpatrick and Warren (2007; see, for example, their Fig. 2). Our optical depth distributions are amenable to an exponential fit, as in these references. However, comparing our distributions with Fitzpatrick and Warren (2007) for the latitude of McMurdo Station, we have overall a shallower decrease in frequency of occurrence with optical depth, more consistent with their result for the latitude range 67.5–70.0° S. This most likely results from our consideration of only summertime data, while their results encompass shipboard measurements from winter, spring, and summer seasons.
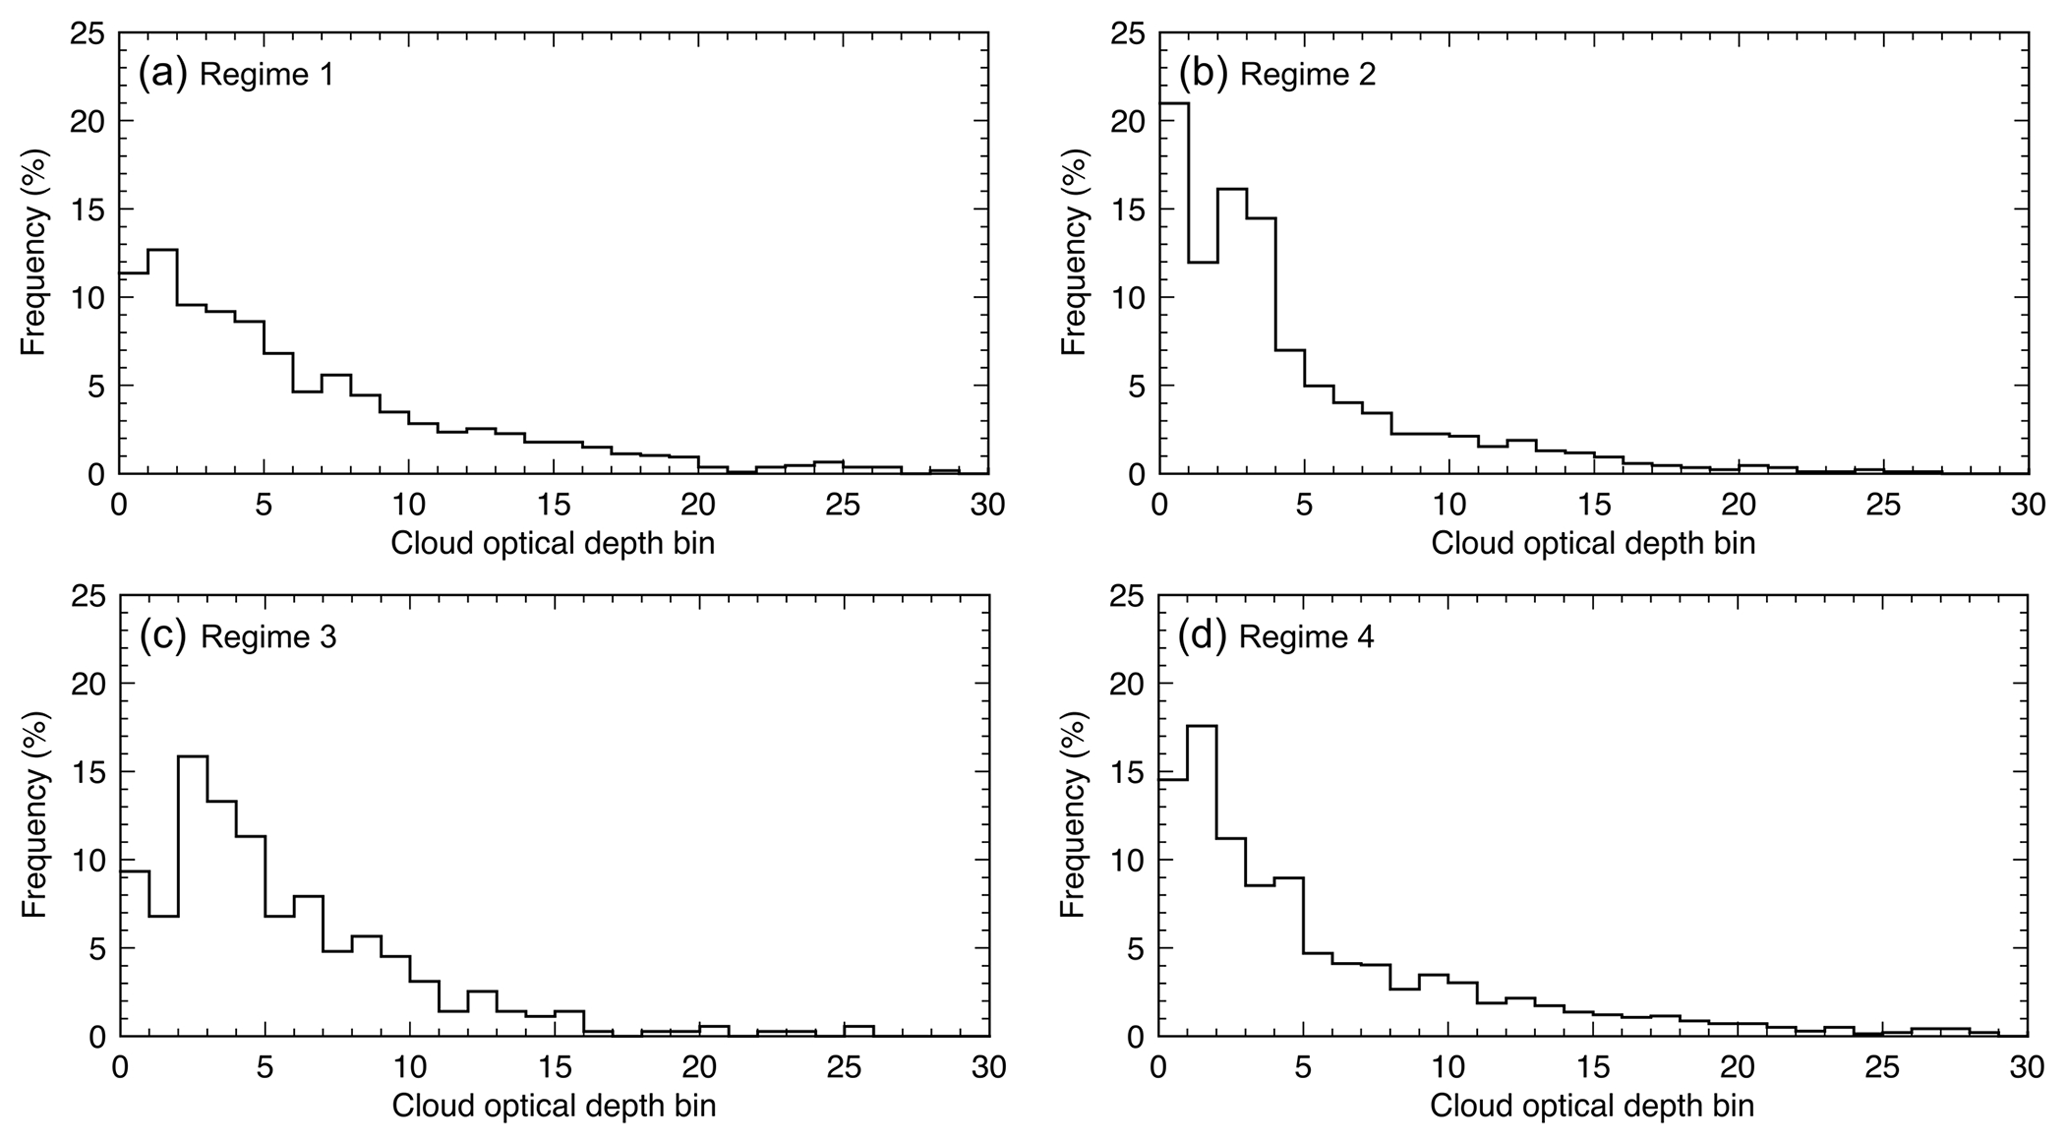
Figure 8Frequency distributions of conservative-scattering cloud optical depth retrieved from the 870 nm irradiances under overcast skies, for each of the four meteorological regimes.
Figure 9 shows the cumulative frequency distributions in effective cloud optical depth for each of the regimes. Regimes 1 (marine air) and 4 (orographic forcing) tend to have larger optical depths, with ∼ 75 % of the values being less than 9 and 8, respectively, and reaching ∼ 95 % of the total sample by optical depth values 20 and 19, respectively. Regimes 2 (cold outflow) and 3 (warm but infrequent) tend to have smaller optical depths, with ∼ 75 % of the values being less than 5 and 7, respectively, and reaching ∼ 95 % of the total sample by optical depth value 13. Although regimes 1 and 4 have similar conservative-scattering optical depth distributions, examination of the broadband shortwave SKYRAD observations reveal statistically significant differences in shortwave attenuation for various discrete ranges of optical depth, as described below. One significant result is that for all regimes, between 58 %–78 % of clouds have optical depths ≤ 5. At larger optical depths a cloud emits longwave radiation essentially as a blackbody. For optical depths ≤ 5, the cloud emissivity will vary (including spectrally) as a function of liquid and ice water content and cloud particle size. This introduces additional variation into the downwelling longwave radiation for all four meteorological regimes.
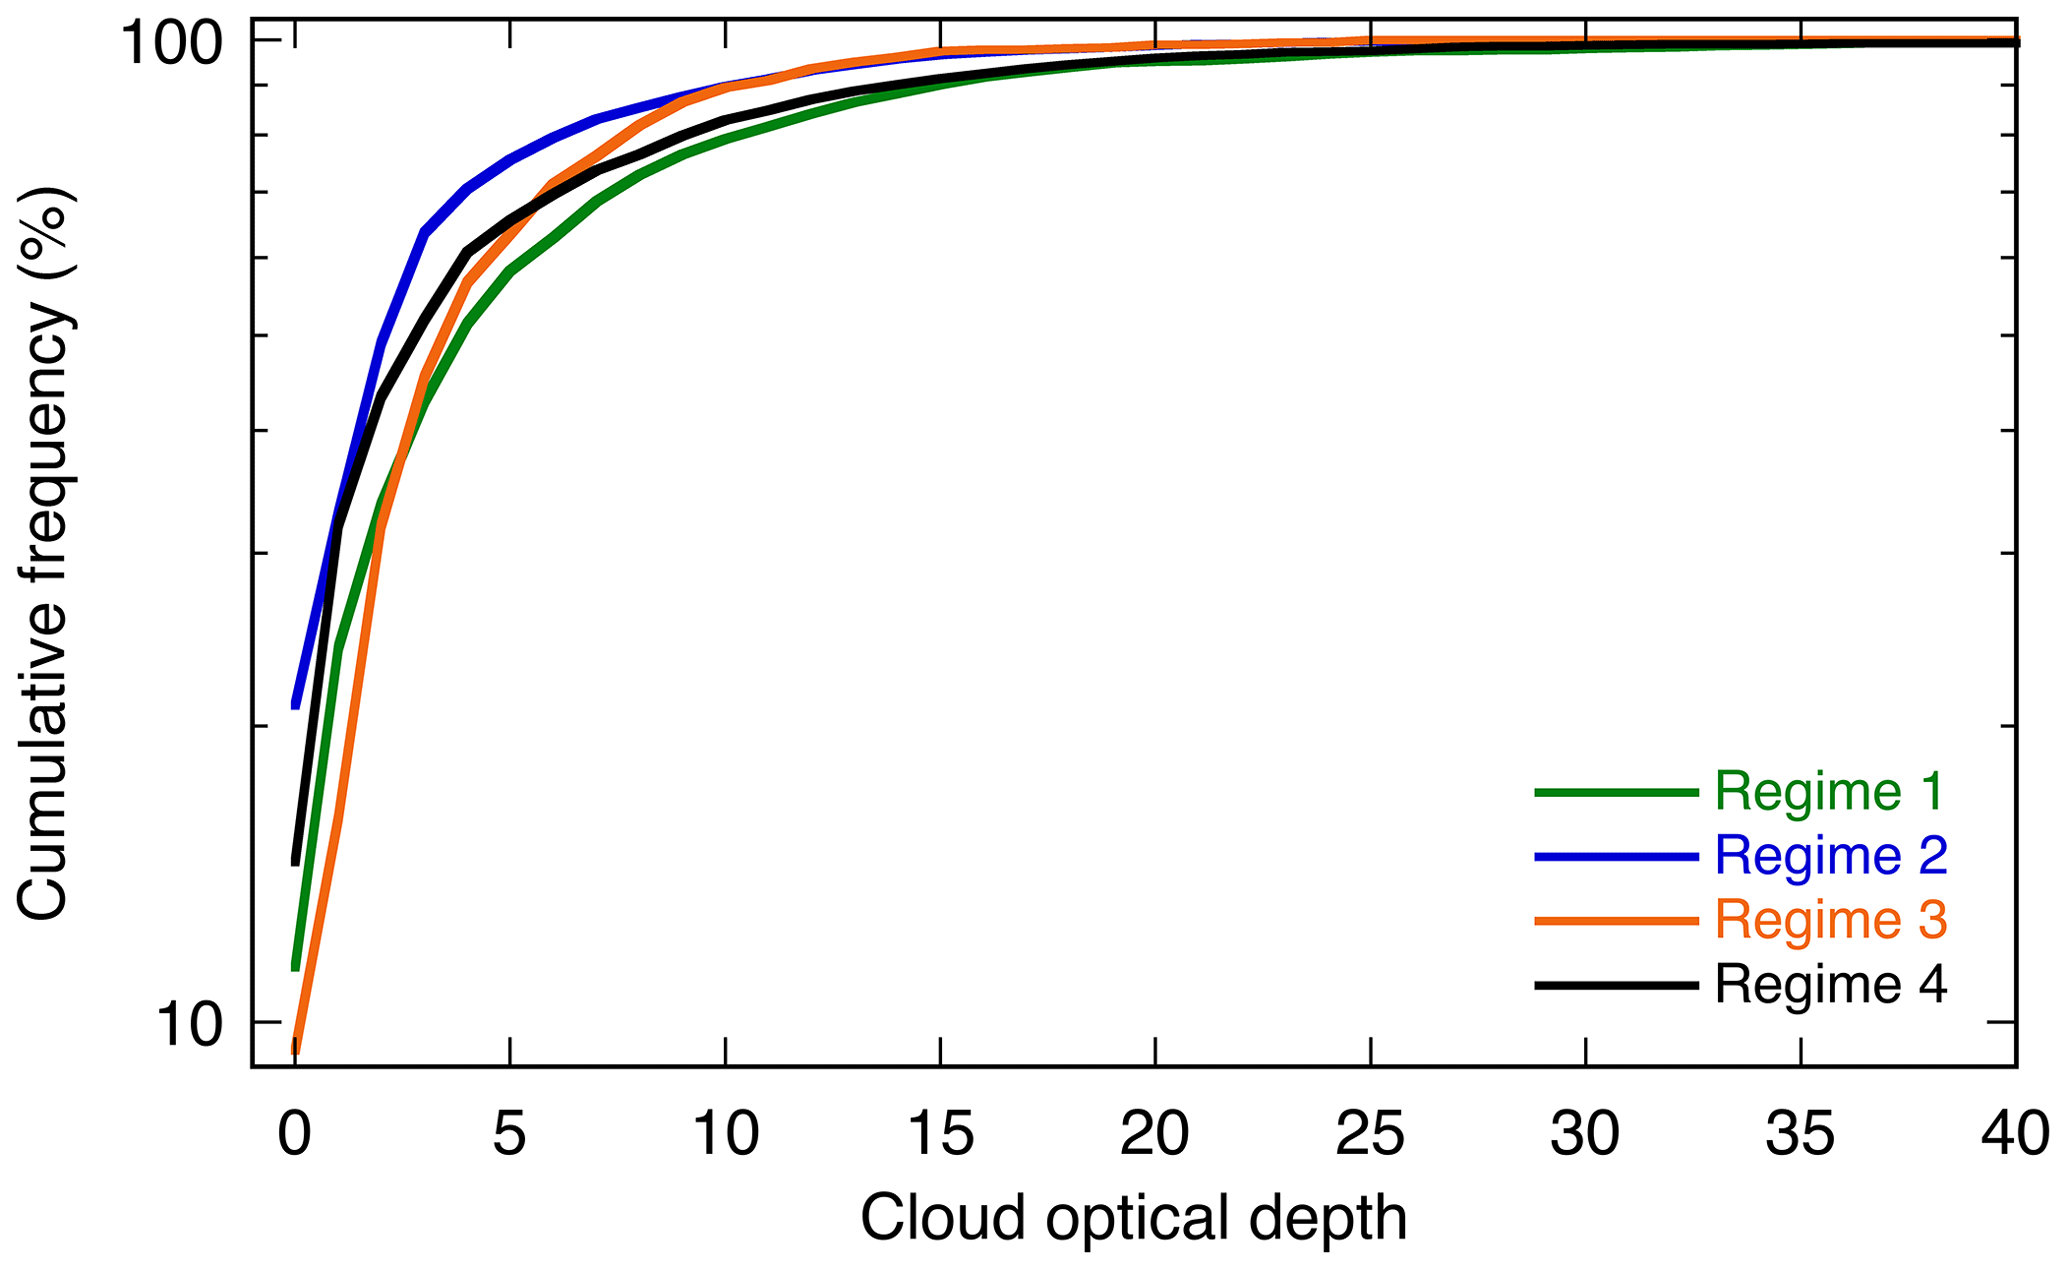
Figure 9Cumulative frequency distributions of conservative-scattering cloud optical depth under overcast skies for each of the four meteorological regimes.
3.4 Removing autocorrelation
The original irradiance measurements and optical depth retrievals are recorded in 1 min intervals. For cloud systems these are generally not independent observations. Significant autocorrelation, if not identified and removed, will artificially inflate the statistical significance in any subsequent analysis. We checked for autocorrelation using a time series between 15:00–17:00 UTC on 11 December 2015, during which both the SKYRAD shortwave transmission and the 870 nm cloud optical depth retrievals showed stationary trends. At the original 1 min time interval, both observations showed significant lag-one autocorrelations greater than 0.95. When we average over 10 min, the lag-one autocorrelation in shortwave transmission drops to 0.12, while the lag-one autocorrelation in optical depth drops to 0.55. Applying the analysis of Bretherton et al. (1999), these reduced autocorrelations signify that we can use the 10 min averages for statistical analysis if we further reduce the effective sample size to Neff=0.88° N.
3.5 Contrasts among the meteorological regimes
In Fig. 10 we compare the SKYRAD shortwave atmospheric transmission observations for meteorological regimes 1, 2, and 4. We do not consider the third cluster as it occurs much less frequently (most of its observations span a 4 d period 13 December 2015 through 3 January 2016). In Fig. 10 we have sorted the observations into conservative-scattering optical depth bins 0–2, 2–4, 4–6, 6–8, 8–10, 10–15, and 15–20. We omit the larger optical depths, which occur infrequently. For each optical depth bin we plot the mean and standard deviation of the corresponding SKYRAD shortwave transmissions. To emphasize the comparisons between pairs of meteorological regimes, a separate panel shows the transmission difference for each optical depth bin, along with the statistic from Student's t-test.
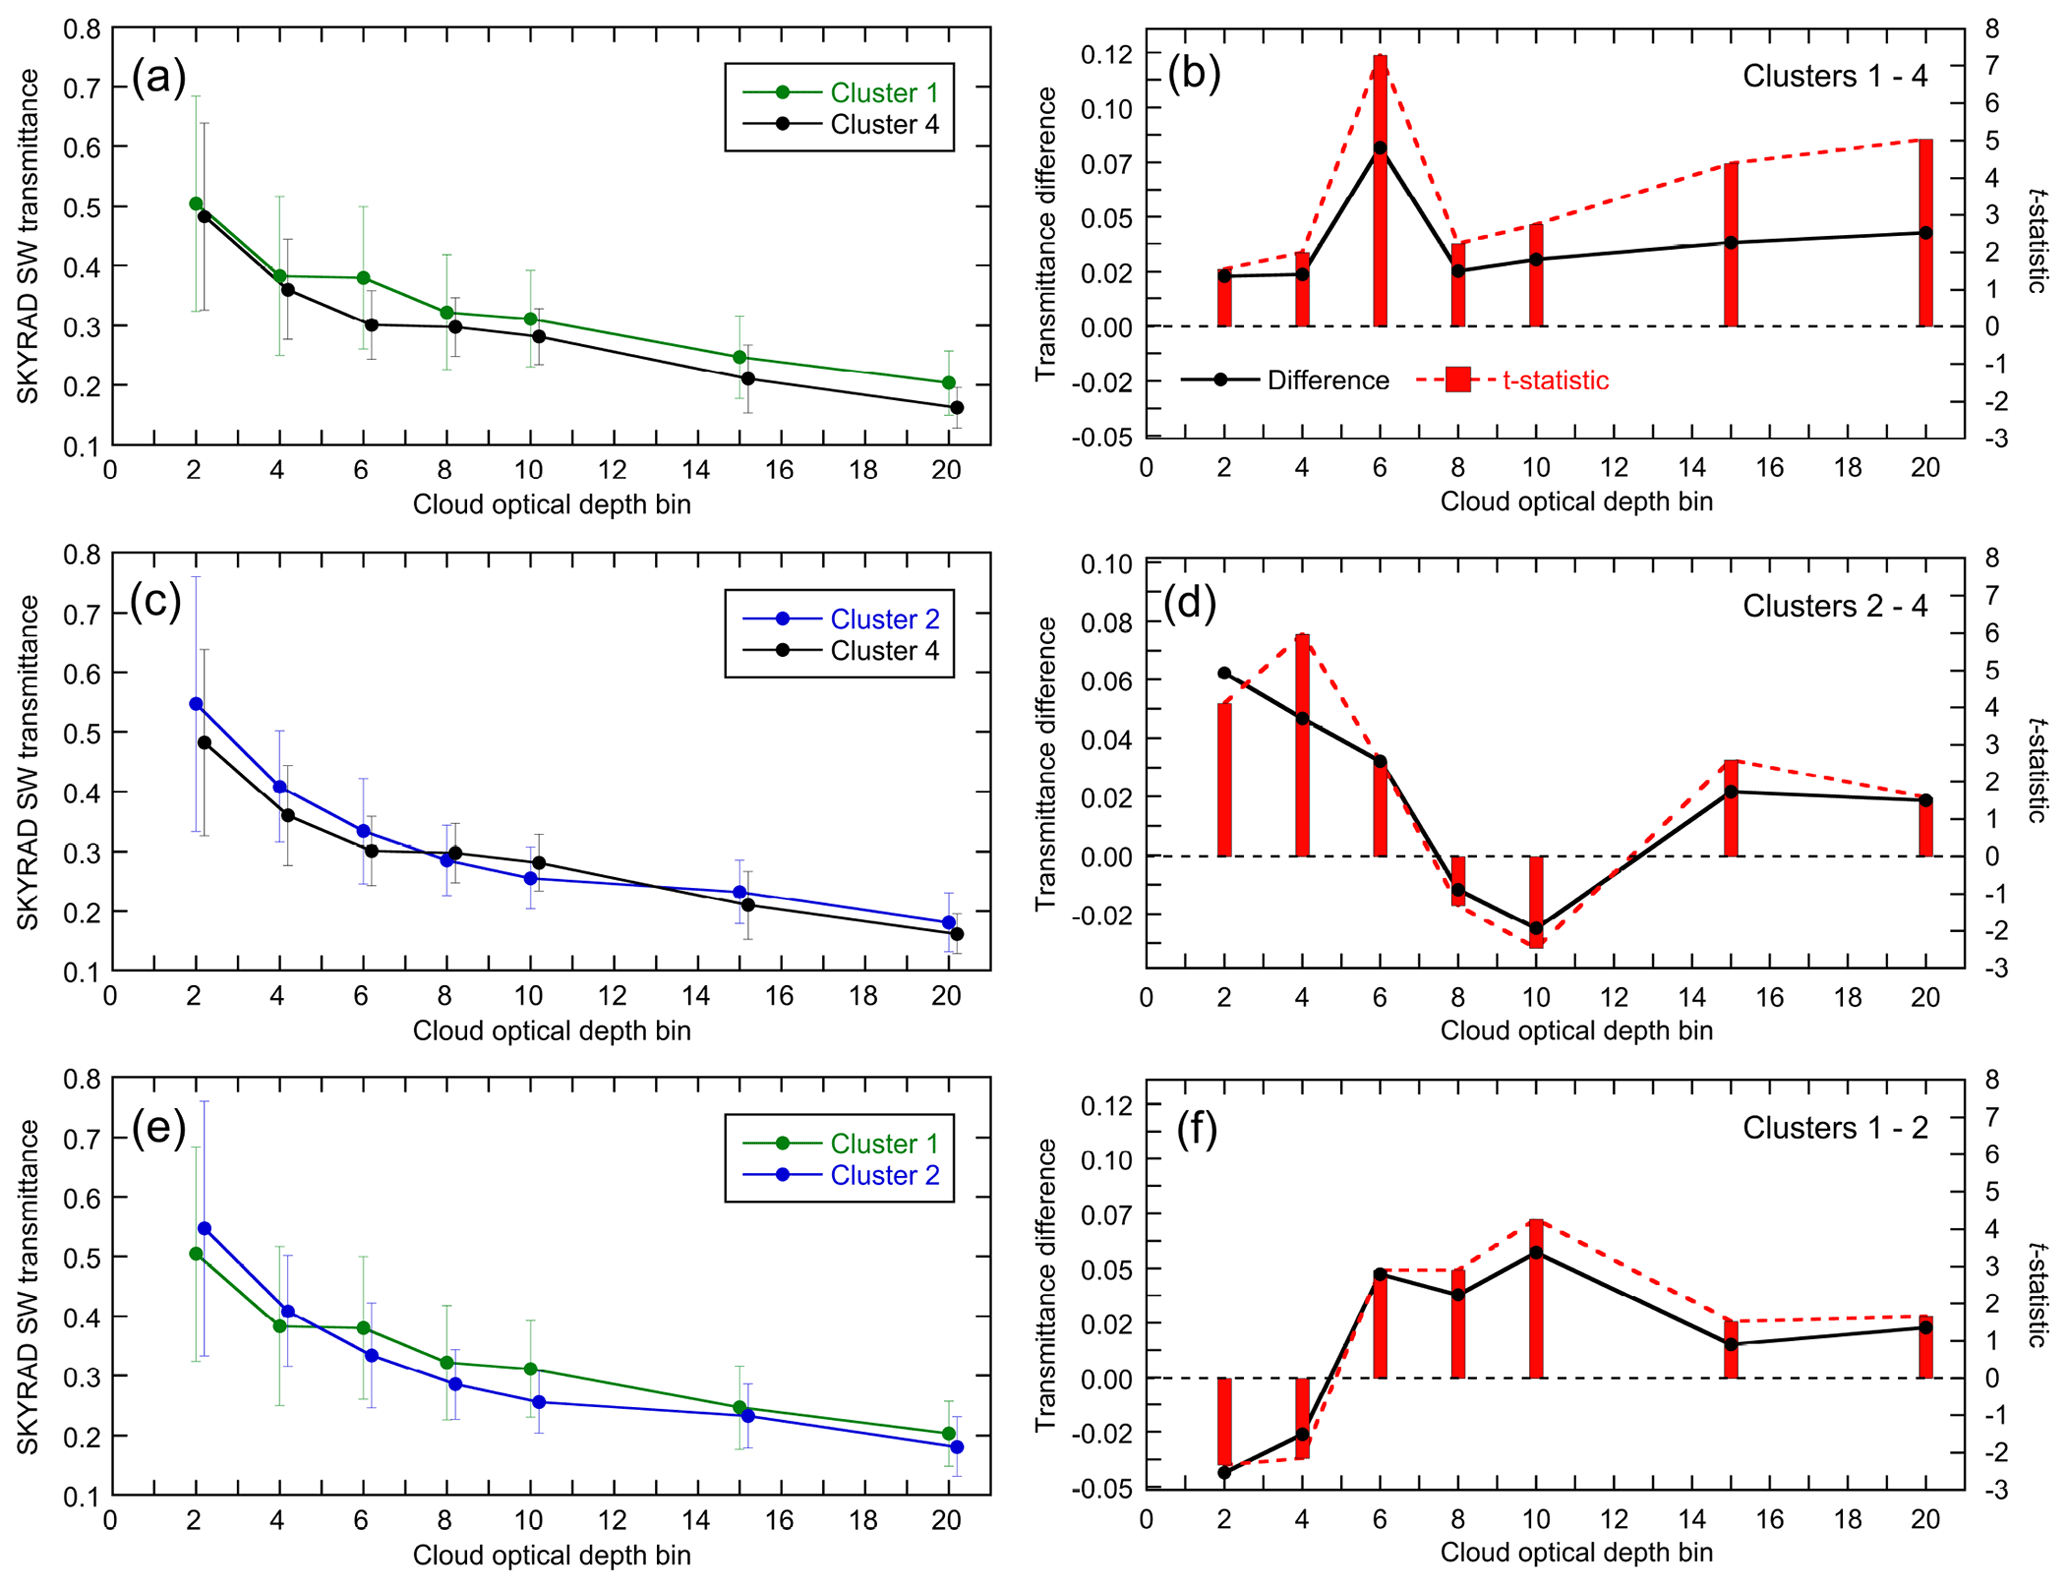
Figure 10SKYRAD-measured shortwave atmospheric transmittance as a function of conservative-scattering cloud optical depth bin, comparing meteorological regimes 1, 2, and 4. Each pair of panels shows the individual mean transmittances for the optical depth bins (a, c, e) and then the transmittance difference between the two compared regimes (in legend) along with the statistic from Student's t test (b, d, f). Error bars are plus or minus 1 standard deviation. Cloud optical depths are of width 2 for the first five bins and then 5 for the largest bins and are identified on these plots by their upper bound. For the range of sample sizes considered here, a t statistic≥2.0 indicates statistical significance.
Comparing regimes 1 and 4 (Fig. 10a and b), we see that shortwave surface irradiance is consistently smaller under the orographic regime's ice and mixed-phase clouds for all optical depth bins. This difference is statistically significant in all but the smallest optical depth bin. Comparing regimes 2 and 4 (Fig. 10c and d), shortwave transmission in the orographic regime is noticeably smaller than in the cold regime for five of the seven optical depth bins, and four of these bins show a statistically significant difference. The cold regime shows lower shortwave transmission than the orographic regime under moderate optical depths 6–10. Comparing regimes 1 and 2 (Fig. 10e and f), the cold regime shows lower shortwave irradiance for cloud optical depths 6 and larger, with statistical significance for the optical depth range 6–10. For smaller optical depths, the maritime regime has statistically significant lower shortwave irradiance.
We tested whether these results could be caused by differences per optical depth bin between the paired clusters. We evaluated the mean optical depths in all of the bins and found that they are all very similar, even in the largest two bins. In the largest bin (15–20), the mean optical depths differ by less than 0.4, and the differences are much smaller for all the other bins. Therefore, the shortwave irradiance differences described by Fig. 10 are not artifacts of contrasting optical depth distributions in the bins.
Table 3 summarizes the mean radiative flux differences between three of the regimes. For the longwave we can use the mean values from Table 2 directly. The shortwave has diurnal solar zenith angle dependence, and to compute a representative seasonal value for each regime we binned the observations by optical depth as described above, and then by solar zenith angle in 5° bins between 55 and 80°. The representative seasonal value is evaluated as the sum over all the optical depth and solar zenith angle bins, weighted by the observation's frequency of occurrence in each bin. As these observations from the CosRay site are not entirely representative of a snow-covered ice sheet or ice shelf, we can make a first-order estimate for a snow surface from these observations using representative values of 0.88 for broadband snow albedo under cloud cover (Lubin et al., 2023) and 0.99 for broadband snow emissivity (e.g., Warren, 1982). Table 3 shows overall that the shortwave differences are more significant than the longwave differences, although both are detectable with statistical significance.
Table 3Mean surface radiative flux differences between three pairs of meteorological regimes (W m−2). The downwelling values are derived from the observations as described in Fig. 10 and the text. The net radiative flux is an estimate extrapolating the Ross Island observations to an ice sheet using representative broadband snow albedo and emissivity values.
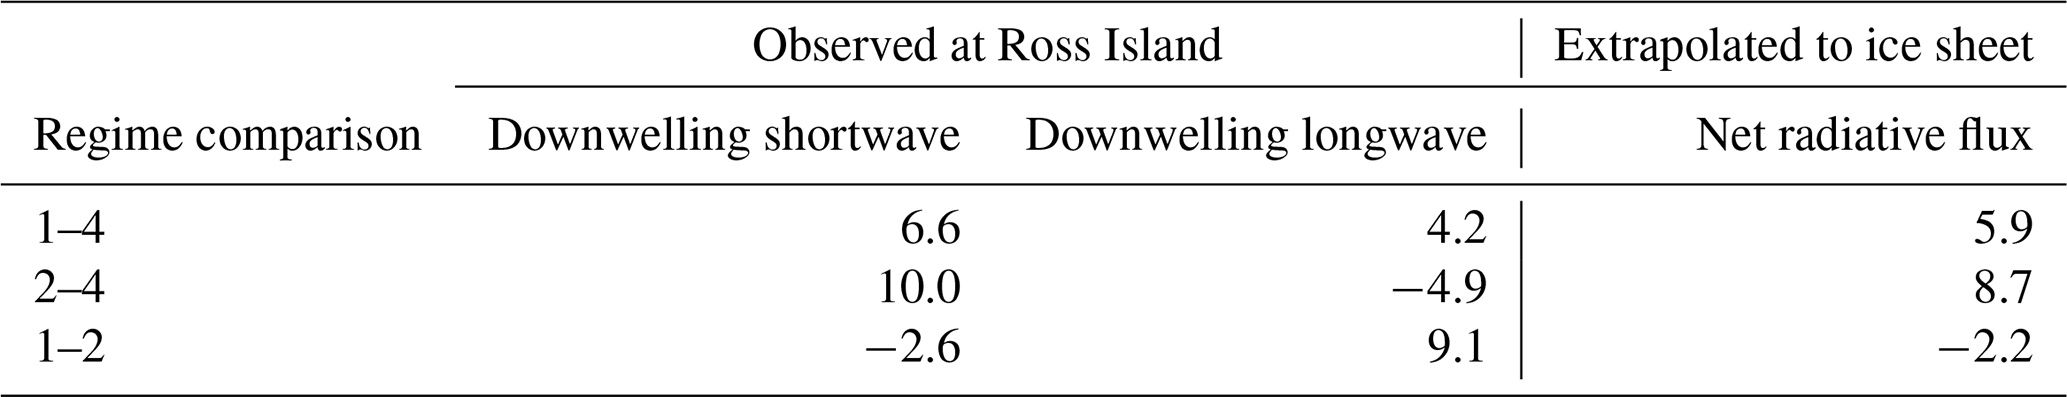
Regarding the longwave irradiance, we can also make a regime comparison binned by cloud optical depth as shown in Fig. 11. This figure reveals the contrasting influences of optically thin versus optically thick clouds to the longwave irradiance differences listed in Table 3. Comparing regimes 1 and 4, the positive longwave irradiance difference is due primarily to clouds with optical depths between 5–10 (radiating effectively as blackbodies), with a contribution from the optically thinnest clouds. Here the longwave irradiance difference between these regimes is then due mainly to differences in average cloud base temperature. Comparing regimes 2 and 4, the negative longwave irradiance difference is due mainly to optically thin clouds, and therefore it involves microphysical differences and cloud effective temperature. Comparing regimes 1 and 2, per Fig. 9 the warmer regime has larger cloud optical depth overall, and this accounts for the relatively large positive longwave flux difference between these regimes.
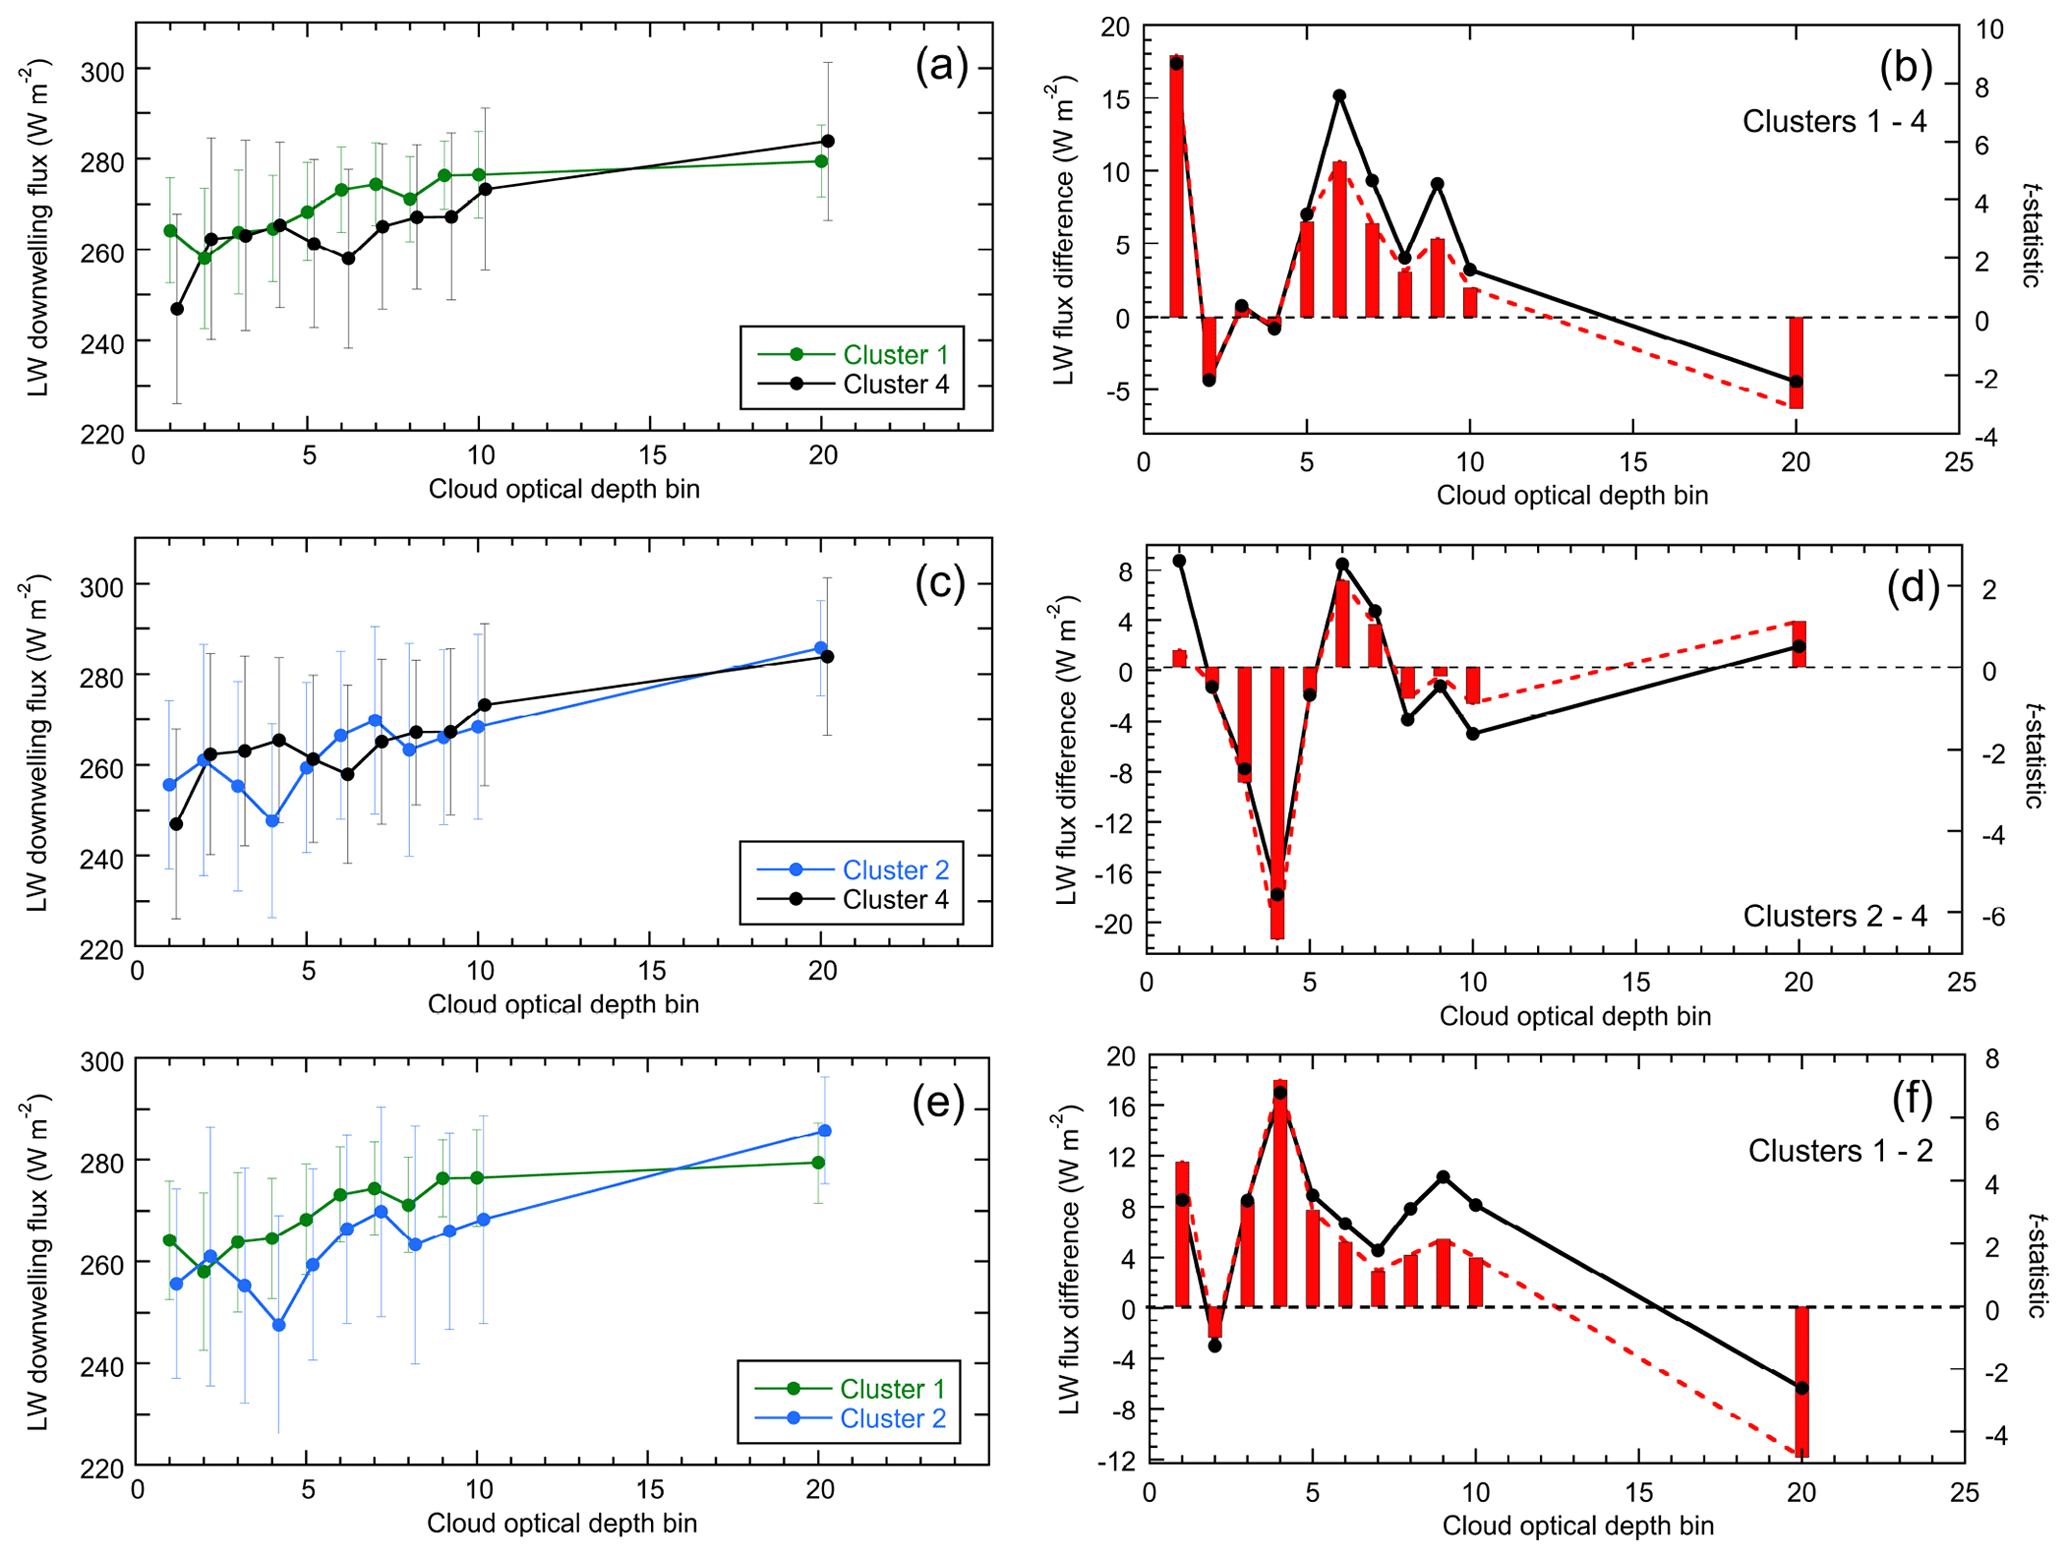
Figure 11SKYRAD-measured longwave irradiance (flux) as a function of conservative-scattering cloud optical depth bin, comparing meteorological regimes 1, 2, and 4. Each pair of panels shows the individual mean irradiances for the optical depth bins (a, c, e) and then the irradiance difference between the two compared regimes (in legend) along with the statistic from Student's t test (b, d, f). Error bars are plus or minus 1 standard deviation. Cloud optical depths are of width 1 for the first 10 bins and are identified by their upper bound, followed by a single bin for the optical depth range 10–20.
The contrast between the predominantly liquid water content of the low clouds in the onshore flow regime with marine air mass origin (Regime 1), versus the overwhelming ice water and mixed-phase content of the geometrically extensive clouds in the orographic southerly-flow regime (Regime 4), is consistent with the statistically significant differences in cloud attenuation of shortwave irradiance at the Antarctic surface for nearly all conservative-scattering cloud optical depths. Generally speaking, when applying this analysis involving near-infrared atmospheric absorption, one should account for influences of changing water vapor across meteorological regimes. However, in the very cold and dry Antarctic atmosphere considered here, the fact that the colder regimes (2 and 4) show greater shortwave attenuation than the warm regime signifies that these differences are due to not water vapor but contrasts in cloud ice water content.
We note that the goal of detecting net surface radiation balance changes on the order of 10 W m−2 is roughly the same order as the calibration uncertainty with pyranometers and pyrgeometers. However, one important consideration is that with overcast skies, under which the upwelling and downwelling radiation is generally diffuse, measurement precision with these instruments is generally very stable. Under partly cloudy or clear skies, where the direct solar beam is present, temperature differentials within the instruments can generate radiometric offsets in the range 10–15 W m−2 (Bush et al., 2000). Therefore, to associate measured differences on the order of 10 W m−2 with changes in ice melt or retention, one must have either (i) a well-calibrated time series of pyranometer and pyrgeometer measurements conclusively and independently associated with a specific surface melt event, as in Nicolas et al. (2017), or (ii) a large enough data sample that the measured differences become statistically significant. In this work we just barely meet the second criterion with 3 summer months of data sorted into four meteorological regimes. This study therefore indicates the need for long-duration radiometer deployment in the Antarctic to acquire datasets relevant to cryospheric change, and this in turn implies requirements for instrument maintenance and cleanliness that cannot be taken for granted in the deep field.
In support of these conclusions, Scott and Lubin (2016) identified a greater vertical extent of cloud ice water in Antarctic clouds as a marked contrast with the high Arctic. Additionally, Scott et al. (2017) show that orographically driven ice and mixed-phase clouds occur frequently and extensively not just in the vicinity of the Transantarctic Mountains but also in various climate-change-sensitive regions such as the northern extremity of the RIS, Ellsworth Land, and the Ronne–Filchner Ice Shelf. In studies of either summertime surface melting or longer-term ice mass balance, in which the SEB needs detailed evaluation, the impact of cloud phase on the radiative components should be accounted for and can be measured by the types of instruments used in this study.
A total of 3 years before AWARE, Scott and Lubin (2014) operated a shortwave spectroradiometer at Ross Island between October 2012 and February 2013 and analyzed the evolution of surface shortwave spectral irradiance in five case studies of several days each. One of these case studies involved an onshore flow consistent with the first meteorological regime described here, and these low marine stratiform clouds showed a wide range in optical depth and near-infrared attenuation mainly consistent with liquid water. Two other case studies involved cloud systems that were influenced by the Transantarctic Mountains, and these clouds showed greater vertical extent and near-infrared attenuation consistent with the excess absorption of cloud ice water relative to the liquid phase. This earlier study used measurements of spectral shortwave irradiance which to date are not commonly available except at well-instrumented sites such as the ARM User Facility (Riihimaki et al., 2021).
However, the low-cost, low-power, rugged, and readily transportable instruments used in this study can easily be configured to accompany deep-field glaciological or geological expeditions, and this concept was demonstrated recently at Siple Dome in West Antarctica (Lubin et al., 2023). There are naturally some limitations if these radiometers are left unattended, in particular ice accretion and riming on the optics (e.g., Cox et al., 2023). If the radiometers accompany an expedition then presumably a team member can ensure optical cleanliness on a daily basis. Also, if there is sufficient power to ventilate the radiometers with blowers, this will prevent most optical fouling except in the harshest conditions. At the same time, unattended shortwave and longwave radiometers have been successfully deployed with Antarctic automatic weather stations and have yielded long time series with useful results when relative values are analyzed or suitable parameterizations are developed to account for periods of icing (van den Broeke et al., 2004).
Additionally, some Antarctic research stations have existing atmospheric observation capabilities yielding important climatological results. For example, at Princess Elizabeth Station in East Antarctica, meteorological, ceilometer, and precipitation measurements have revealed the influence of atmospheric rivers on accumulation and ice mass balance (Gorodetskaya et al., 2014, 2015). The British Antarctic Survey has conducted aircraft in situ cloud microphysical measurements based out of Rothera Station, which have revealed the importance of secondary ice production at temperatures just below freezing (Lachlan-Cope et al., 2016). Augmenting programs such as these with long-term filter and broadband radiometer observations might further enhance their value. This study demonstrates that extremely remote regions on Earth do not necessarily need to wait for the most advanced atmospheric instrumentation to see advances in understanding and that careful use of basic radiometric instruments in conjunction with satellite remote sensing and meteorological reanalysis can yield useful results pertaining to a region's climatological questions.
All AWARE data are archived with the US Department of Energy Atmospheric Radiation Measurement (ARM) program (https://arm.gov/research/campaigns/amf2015aware, ARM, 2024). MODIS cloud satellite data products are obtained from the NASA Level-1 and Atmosphere Archive and Distribution System (LAADS) Distributed Active Archive Center (DAAC). ERA-Interim data were originally obtained from a downloadable archive at the European Centre for Medium-Range Weather Forecasts (ECMWF) and can still be obtained from ECMWF by special request. The download service has recently been discontinued for ERA-Interim as it has been superseded by ERA5 reanalysis, which is publicly available at the European Copernicus Climate Change Service (C3S) Climate Data Store. The AWS data are available at the University of Wisconsin Antarctic Meteorological Research Center (https://amrdcdata.ssec.wisc.edu, AMRDC, 2024).
KS performed the data analysis and interpretation as part of his Master of Science thesis at the Scripps Institution of Oceanography. RCS provided the k-means clustering analysis for identifying the meteorological regimes. MLG provided the satellite data and interpretation. AMV advised on radiative transfer analysis and manuscript preparation. DL served as thesis advisor for KS and prepared the manuscript for publication.
The contact author has declared that none of the authors has any competing interests.
Publisher's note: Copernicus Publications remains neutral with regard to jurisdictional claims made in the text, published maps, institutional affiliations, or any other geographical representation in this paper. While Copernicus Publications makes every effort to include appropriate place names, the final responsibility lies with the authors.
We thank the United States Antarctic Program and Chad Naughton (AWARE Project Implementer) for outstanding logistical support. We thank two anonymous reviewers for several suggestions that significantly improved the manuscript.
This work was supported by the US National Science Foundation (grant nos. PLR-1443549 and OPP-2130203), and the US Department of Energy (grant nos. DE-SC0017981 and DE-SC0021974).
This paper was edited by Armin Sorooshian and reviewed by two anonymous referees.
Alley, R. B., Anandakrishnan, S., Christianson, K., Horgan, H. J., Muto, A., Parizek, B. R., Pollard, D., and Walker, R. T.: Oceanic forcing of ice-sheet retreat: West Antarctica and more, Annu. Rev. Earth Pl. Sc., 43, 207–231, https://doi.org/10.1146/annurev-earth-060614-105344, 2015.
AMRDC: AMRDC Data Repository, AMRDC [data set], https://amrdcdata.ssec.wisc.edu, last access: 3 June 2024.
ARM: ARM West Antarctic Radiation Experiment (AWARE), ARM [data set], https://arm.gov/research/campaigns/amf2015aware, last access: 3 June 2024.
Berk, A., Conforti, P., Kennett, R., Perkins, T., Hawes, F., and van den Bosch, J.: MODTRAN6: A major upgrade of the MODTRAN radiative transfer code, Proc. SPIE 9088, Algorithms and Technologies for Multispectral, Hyperspectral, and Ultraspectral Imagery XX, 9088H, https://doi.org/10.1117/12.2050433, 2014.
Bretherton, C. S., Widmann, M., Dymnikov, V. P., Wallace, J. M., and Bladé, I.: The effective number of spatial degrees of freedom of a time-varying field, J. Climate, 12, 1990–2009, https://doi.org/10.1175/1520-0442(1999)012<1990:TENOSD>2.0.CO;2, 1999.
Bush, B. C., Valero, F. P. J., Simpson, A. S., and Bignone, L.: Characterization of thermal effects in pyranometers: A data correction algorithm for improved measurement of surface insolation, J. Atmos. Ocean. Tech., 17, 165–175, https://doi.org/10.1175/1520-0442(1999)012<1990:TENOSD>2.0.CO;2, 2000.
Cossich, W., Maestri, T., Magurno, D., Martinazzo, M., Di Natale, G., Palchetti, L., Bianchini, G., and Del Guasta, M.: Ice and mixed-phase cloud statistics on the Antarctic Plateau, Atmos. Chem. Phys., 21, 13811–13833, https://doi.org/10.5194/acp-21-13811-2021, 2021.
Cox, C. J., Gallagher, M. R., Shupe, M. D., Persson, P. O. G., Solomon, A., Fairall, C. W., Ayers, T., Blomquist, B., Brooks, I. M., Costa, D., Grachev, A., Gottas, D., Hutchings, J. K., Kutchenreiter, M., Leach, J., Morris, S. M., Morris, V., Osborn, J., Pezoa, S., Preusser, A., Riihimaki, L. D., and Uttal, T.: Continuous observations of the surface energy budget and meteorology over the Arctic sea ice during MOSAiC, Scientific Data, 10, 519, https://doi.org/10.1038/s41597-023-02415-5, 2023.
de Boer, G., Collins, W. D., Menon, S., and Long, C. N.: Using surface remote sensors to derive radiative characteristics of Mixed-Phase Clouds: an example from M-PACE, Atmos. Chem. Phys., 11, 11937–11949, https://doi.org/10.5194/acp-11-11937-2011, 2011.
Dee, D. P., Uppala, S. M., Simons, A. J., Berrisford, P., Poli, P., Kobayashi, S., Andrae, U., Balmaseda, M. A., Balsamo, G., Bauer, P., Bechtold, P., Beljaars, A. C. M., van de Berg, L., Bidlot, J., Bormann, N., Delsol, C., Dragani, R., Fuentes, M., Geer, A. J., Haimberger, L., Healy, S. B., Hersbach, H., Hólm, E. V., Isaksen, L., Kållberg, P., Köhler, M., Matricardi, M., McNally, A. P., Monge-Sanz, B. M., Morcrette, J.-J., Park, B.-K., Peubey, C., de Rosnay, P., Tavolato, C., Thépaut, J.-N., and Vitart, F.: The ERA-Interim reanalysis: configuration and performance of the data assimilation system, Q. J. Roy. Meteor. Soc. A, 137, 553–597, https://doi.org/10.1002/qj.828, 2011.
Dong, X., Xi, B., Crosby, K., Long, C. N., Stone, R. S., and Shupe, M. D.: A 10 year climatology of Arctic cloud fraction and radiative forcing at Barrow, Alaska, J. Geophys. Res., 115, D17212, https://doi.org/10.1029/2009JD013489, 2010.
Fitzpatrick, M. F. and Warren, S. G.: Transmission of solar radiation by clouds over snow and ice surfaces. Part II: Cloud optical depth and shortwave radiative forcing from pyranometer measurements in the Southern Ocean, J. Climate, 18, 4367–4648, https://doi.org/10.1175/JCLI3562.1, 2005.
Fitzpatrick, M. F. and Warren, S. G.: The relative importance of clouds and sea ice for the solar energy budget of the Southern Ocean, J. Climate, 20, 941–954, https://doi.org/10.1175/JCLI4040.1, 2007.
Fitzpatrick, M. F., Brandt, R. E., and Warren, S. G.: Transmission of solar radiation by clouds over snow and ice surfaces: A parameterization in terms of optical depth, solar zenith angle, and surface albedo, J. Climate, 17, 266–275, https://doi.org/10.1175/1520-0442(2004)017<0266:TOSRBC>2.0.CO;2, 2004.
Frey, R. A., Ackerman, S. A., Liu, Y., Strabala, K. I., Zhang, H., Key, J. R., and Wang, X.: Cloud detection with MODIS: Part I: Improvements in the MODIS cloud mask for Collection 5, J. Atmos. Ocean. Tech., 25, 1057–1072, https://doi.org/10.1175/2008JTECHA1052.1, 2008.
Fürst, J. J., Durand, G., Gillet-Chaulet, F., Tavard, L., Rankl, M., Braun, M., and Gagliardini, O.: The safety band of Antarctic ice shelves, Nat. Clim. Change, 6, 479–482, https://doi.org/10.1038/NCLIMATE2912, 2016.
Ghiz, M. L., Scott, R. C., Vogelmann, A. M., Lenaerts, J. T. M., Lazzara, M., and Lubin, D.: Energetics of surface melt in West Antarctica, The Cryosphere, 15, 3459–3494, https://doi.org/10.5194/tc-15-3459-2021, 2021.
Glasser, N. F. and Scambos, T. A.: A structural glaciological analysis of the 2002 Larsen B ice shelf collapse, J. Glaciol., 54, 3–16, https://doi.org/10.3189/002214308784409017, 2008.
Gorodetskaya, I. V., Tsukernik, M., Claes, K., Ralph, M. F., Neff, W. D., and Van Lipzig, N. P. M.: The role of atmospheric rivers in anomalous snow accumulation in East Antarctica, Geophys. Res. Lett., 41, 6199–6206, https://doi.org/10.1002/2014GL060881, 2014.
Gorodetskaya, I. V., Kneifel, S., Maahn, M., Van Tricht, K., Thiery, W., Schween, J. H., Mangold, A., Crewell, S., and Van Lipzig, N. P. M.: Cloud and precipitation properties from ground-based remote-sensing instruments in East Antarctica, The Cryosphere, 9, 285–304, https://doi.org/10.5194/tc-9-285-2015, 2015.
Harrison, L., Michalsky, J., and Berndt, J.: Automated multifilter rotating shadow-band radiometer: An instrument for optical depth and radiation measurements, Appl. Optics, 33, 5118–5125, https://doi.org/10.1364/AO.33.005118, 1994.
Hersbach, H., Bell, B., Berrisford, P., Hirahara, S., Horányi, A., Muñoz-Sabater, J., Nicolas, J., Peubey, C., Radu, R., Schepers, D., Simmons, A., Soci, C., Abdalla, S., Abellan, X., Balsamo, G., Bechtold, P., Biavati, G., Bidlot, J., Bonavita, M., De Chiara, G., Dahlgren, P., Dee, D., Diamantakis, M., Dragani, R., Flemming, J., Forbe, R., Fuentes, M., Geer, A., Haimberger, L., Healy, S., Hogan, R. J., Hólm, E., Janisková, M., Keeley, S., Laloyaux, P., Lopez, P., Lupu, C., Radnoti, G., de Rosnay, P., Rozum, I., Vamborg, F., Villaume, S., and Thépaut, J.-N.: The ERA5 global reanalysis, Q. J. Roy. Meteor. Soc., 146, 1999–2049, https://doi.org/10.1002/qj.3803, 2020.
Kassianov, E., Long, C. N., and Ovtchinnikov, M.: Cloud sky cover versus cloud fraction: Whole-sky simulations and observations, J. Appl. Meteorol., 44, 86–98, https://doi.org/10.1175/JAM-2184.1, 2005.
Kassianov, E., Barnard, J. C., Berg, L. K., Flynn, C., and Long, C. N.: Sky cover from MFRSR observations, Atmos. Meas. Tech., 4, 1463–1470, https://doi.org/10.5194/amt-4-1463-2011, 2011.
Lachlan-Cope, T., Listowski, C., and O'Shea, S.: The microphysics of clouds over the Antarctic Peninsula – Part 1: Observations, Atmos. Chem. Phys., 16, 15605–15617, https://doi.org/10.5194/acp-16-15605-2016, 2016.
Lazzara, M. A., Weidner, G. A., Keller, L. M., Thom, J. E., and Cassano, J. J.: Antarctic automatic weather station program: 30 years of polar observations, B. Am. Meteorol. Soc., 93, 1519–1537, https://doi.org/10.1175/BAMS-D-11-00015.1, 2012.
Long, C. N. and Ackerman, T. P.: Identification of clear skies from broadband pyranometer measurements and calculation of downwelling shortwave cloud effects, J. Geophys. Res., 105, 15609–15626, https://doi.org/10.1029/2000JD900077, 2000.
Long, C. N., Sabburg, J. M., Calbó, J., and Pagès, D.: Retrieving cloud characteristics from ground-based daytime color all-sky images, J. Atmos. Ocean. Tech., 23, 633–652, https://doi.org/10.1175/JTECH1875.1, 2006.
Lubin, D. and Vogelmann, A. M.: The influence of mixed-phase clouds on surface shortwave irradiance during the Arctic spring, J. Geophys. Res., 116, D00T05, https://doi.org/10.1029/2011JD015761, 2011.
Lubin, D., Zhang, D., Silber, I., Scott, R. C., Kalogeras, P., Battaglia, A., Bromwich D. H., Cadeddu, M., Eloranta, E., Fridlind, A., Frossard, A., Hines, K. M., Kneifel, S., Leaitch, W. R., Lin, W., Nicolas, J., Powers, H., Quinn, P. K., Rowe, P., Russell, L. M., Sharma, S., Verlinde, J., and Vogelmann A. M.: AWARE: The Atmospheric Radiation Measurement (ARM) West Antarctic Radiation Experiment, B. Am. Meteorol. Soc., 101, E1069–E1091, https://doi.org/10.1175/BAMS-D-18-0278.1, 2020.
Lubin, D., Ghiz, M. L., Castillo, S., Scott, R. C., LeBlanc, S. E., and Silber, I.: A surface radiation balance data set from Siple Dome in West Antarctica for atmospheric and climate model evaluation, J. Climate, 36, 6729–6748, https://doi.org/10.1175/JCLI-D-22-0731.1, 2023.
Marchant, B., Platnick, S., Meyer, K., Arnold, G. T., and Riedi, J.: MODIS Collection 6 shortwave-derived cloud phase classification algorithm and comparisons with CALIOP, Atmos. Meas. Tech., 9, 1587–1599, https://doi.org/10.5194/amt-9-1587-2016, 2016.
Mather, J. H. and Voyles, J. W.: The ARM Climate Research Facility: A review of structure and capabilities, B. Am. Meteorol. Soc., 94, 377–392, https://doi.org/10.1175/BAMS-D-11-00218.1, 2013.
McBride, P. J., Schmidt, K. S., Pilewskie, P., Kittelman, A. S., and Wolfe, D. E.: A spectral method for retrieving cloud optical thickness and effective radius from surface-based transmittance measurements, Atmos. Chem. Phys., 11, 7235–7252, https://doi.org/10.5194/acp-11-7235-2011, 2011.
McGrath, D., Steffen, K., Rajaram, H., Scambos, T., Abdalati, W., and Rignot, E.: Basal crevasses on the Larsen C Ice Shelf, Antarctica: Implications for meltwater ponding and hydrofracture, Geophys. Res. Lett., 39, L16504, https://doi.org/10.1029/2012GL052413, 2012.
Michalsky, J. J. and Long, C. N.: ARM solar and infrared broadband and filter radiometry, Meteor. Mon., 57, 16.1–16.15, https://doi.org/10.1175/AMSMONOGRAPHS-D-15-0031.1, 2016.
Mülmenstädt, J., Lubin, D., Russell, L. M., and Vogelmann, A. M.: Cloud properties over the North Slope of Alaska: Identifying the prevailing meteorological regimes, J. Climate, 25, 8238–8258, https://doi.org/10.1175/JCLI-D-11-00636.1, 2012.
Nicolas, J. P. and Bromwich, D. H.: Climate of West Antarctica and influence of marine air intrusions, J. Climate, 24, 49–67, https://doi.org/10.1175/2010JCLI3522.1, 2011.
Nicolas, J. P., Vogelmann, A. M., Scott, R. C., Wilson, A. B., Cadeddu, M. P., Bromwich, D. H., Verlinde, J., Lubin, D., Russell, L. M., Jenkinson, C., Powers, H. H., Ryczek, M., Stone, G., and Wille, J. D.: January 2016 extensive summer melt in West Antarctica favored by strong El Niño, Nat. Commun., 8, 15799, https://doi.org/10.1038/ncomms15799, 2017.
Pfister, G., McKenzie, R. L., Liley, J. B., Thomas, A., Forgan, B. W., and Long, C. N.: Cloud coverage based on all-sky imaging and its impact on surface solar irradiance, J. Appl. Meteorol. Clim., 42, 1421–1434, https://doi.org/10.1175/1520-0450(2003)042<1421:CCBOAI>2.0.CO;2, 2003.
Platnick, S., King, M. D., Ackerman, S. A., Menzel, W. P., Baum, B. A., Riédi, J., and Frey, R. A.: The MODIS cloud products: Algorithms and examples from Terra, IEEE T. Geosci. Remote, 41, 459–473, https://doi.org/10.1109/TGRS.2002.808301, 2003.
Pollard, D., DeConto, R. M., and Alley, R. B.: Potential Antarctic ice sheet retreat driven by hydrofracturing and ice cliff failure, Earth Planet. Sc. Lett., 412, 112–121, https://doi.org/10.1016/j.epsl.2014.12.035, 2015.
Rignot, E., Mouginot, J., Scheuchl, B., van den Broeke, M., van Wessem, M., and Morighem, M.: Four decades of Antarctic Ice Sheet mass balance from 1979–2017, P. Natl. Acad. Sci. USA, 116, 1095–1103, https://doi.org/10.1073/pnas.1812883116, 2019.
Riihimaki, L. D., Flynn, C. McComiskey, A., Lubin, D., Blanchard, Y., Chiu, J. C., Feingold, G., Feldman, D. R., Gristey, J. J., Herrera, C., Hodges, G., Kassianov, E., LeBlanc, S. E., Marshak, A., Michalsky, J. J., Pilewskie, P., Schmidt, S., Scott, R. C., Shea, Y., Thome, K., Wagener, R., and Wielicki, B.: The shortwave spectral radiometer for atmospheric science: Capabilities and applications from the ARM User Facility, B. Am. Meteorol. Soc., 102, E539–E554, https://doi.org/10.1175/BAMS-D-19-0227.1, 2021.
Scambos, T., Fricker, H. A., Liu, C. C., Bohlander, J., Fastook, J., Sargent, A., Massom, R., and Wu, A. M.: Ice shelf disintegration by plate bending and hydro-fracture: Satellite observations and model results of the 2008 Wilkins ice shelf break-ups, Earth Planet. Sc. Lett., 280, 51–60, https://doi.org/10.1016/j.epsl.2008.12.027, 2009.
Scott, R. C. and Lubin, D.: Mixed-phase cloud radiative properties over Ross Island: The influence of various synoptic-scale atmospheric circulation regimes, J. Geophys. Res., 119, 6702–6723, https://doi.org/10.1002/2013JD021132, 2014.
Scott, R. C. and Lubin, D.: Unique manifestations of mixed-phase cloud properties over Ross Island and the Ross Ice Shelf, Antarctica, Geophys. Res. Lett., 43, 2936–2945, https://doi.org/10.1002/2015GL067246, 2016.
Scott, R. C., Lubin, D., Vogelmann, A. M., and Kato, S.: West Antarctic Ice Sheet cloud cover and surface radiation budget form NASA A-Train satellites, J. Climate, 30, 6151–6170, https://doi.org/10.1175/JCLI-D-16-0644.1, 2017.
Scott, R. C., Nicolas, J. P., Bromwich, D. H., Norris, J. R., and Lubin, D.: Meteorological drivers and large-scale climate forcing of West Antarctic surface melt, J. Climate, 32, 665–684, https://doi.org/10.1175/JCLI-D-18-0233.1, 2019.
Silber, I., Verlinde, J., Cadeddu, M., Flynn, C. J., Vogelmann, A. M., and Eloranta, E. W.: Antarctic cloud macrophysical, thermodynamic phase, and atmospheric inversion coupling properties at McMurdo Station – Part II: Radiative impact during different synoptic regimes, J. Geophys. Res., 124, 1697–1719, https://doi.org/10.1029/2018JD029471, 2019.
Silber, I., Fridlind, A. M., Verlinde, J., Ackerman, A. S., Cesana, G. V., and Knopf, D. A.: The prevalence of precipitation from polar supercooled clouds, Atmos. Chem. Phys., 21, 3949–3971, https://doi.org/10.5194/acp-21-3949-2021, 2021.
Stamnes, K., Tsay, S.-C., Wiscombe, W., and Jayaweera, K.: Numerically stable algorithm for discrete-ordinate-method radiative transfer in multiple scattering and emitting layered media, Appl. Optics, 27, 2502–2509, https://doi.org/10.1364/AO.27.002502, 1988.
van den Broeke, M.: Strong surface melting preceded collapse of Antarctic Peninsula ice shelf, Geophys. Res. Lett., 32, L12815, https://doi.org/10.1029/2005GL023247, 2005.
van den Broeke, M., Reijmer, C., and van de Wal, R.: Surface radiation balance in Antarctica as measured with automatic weather stations, J. Geophys. Res., 109, D09103, https://doi.org/10.1029/2003JD004394, 2004.
Warren, S. G.: Optical properties of snow, Rev. Geophys., 20, 67–89, https://doi.org/10.1029/RG020i001p00067, 1982.
Wilson, A., Scott, R. C., Cadeddu, M. P., Ghate, V., and Lubin, D.: Cloud optical properties over West Antarctica from shortwave spectroradiometer measurements during AWARE, J. Geophys. Res., 123, 9559–9570, https://doi.org/10.1029/2018JD028347, 2018.
Zhang, D., Vogelmann, A., Kollias, P., Luke, E., Yang, F., Lubin, D., and Wang, Z.: Comparison of Antarctic and Arctic single-layer stratiform mixed-phase cloud properties using ground-based remote sensing measurements, J. Geophys. Res., 124, 10186–10204, https://doi.org/10.1029/2019JD030673, 2019.