the Creative Commons Attribution 4.0 License.
the Creative Commons Attribution 4.0 License.
 | 04 Jun 2024
Global source apportionment of aerosols into major emission regions and sectors over 1850–2017
Shaoxuan Mou
Hailong Wang
Pinya Wang
Baojie Li
Hong Liao
Anthropogenic emissions of aerosols and precursor gases have changed significantly in the past few decades around the world. In this study, the Explicit Aerosol Source Tagging (EAST) system is merged into the Energy Exascale Earth System Model version 1 (E3SMv1) to quantify the variations in anthropogenic aerosol concentrations, source contributions, and their subsequent radiative impact in four major emission regions across the globe during 1850–1980, 1980–2010, and 2010–2017. In North America and Europe, changes in anthropogenic PM2.5 were mainly caused by changes in emissions from local energy and industrial sectors. The local industrial sector caused the largest increase in PM2.5 in East Asia during 1980–2010 and decrease during 2010–2017. In South Asia, the increase in energy-related emissions dominated the rise in PM2.5 levels during 1980–2017. During 1850–1980, the increases in emissions from North America contributed to the increase in the European PM2.5 burden by 1.7 mg m−2 and the sources from the Europe were also responsible for the PM2.5 burden increase in East Asia and South Asia by about 1.0 mg m−2. During 1980–2010, East Asia contributed to an increase of 0.4–0.6 mg m−2 in the PM2.5 burden in North America and Europe, while South Asia contributed about 0.3 mg m−2. During 2010–2017, the contributions from East Asia to the PM2.5 burdens in the North America, Europe, and South Asia declined by 0.3–0.6 mg m−2 due to the clean air actions in China, while the contributions from South Asia still increased due to the continuous increase in emissions in South Asia. The historical changes in aerosols had an impact on effective radiative forcing through aerosol–radiation interactions (ERFari). During 1980–2010, a decline in North American aerosols resulted in a positive ERFari change (warming effect) in Europe and a decline in aerosols in Europe caused a warming effect in Russia and northern China. The changes in ERFari from the increase and decrease in aerosols in China during 1980–2010 and 2010–2017, respectively, are comparable in magnitude. The continuous aerosol increases in South Asia from 1980 to 2017 resulted in negative ERFari (cooling) changes in South Asia, Southeast Asia, and southern China.
- Article
(9160 KB) - Full-text XML
-
Supplement
(2556 KB) - BibTeX
- EndNote


Atmospheric aerosols, also known as particulate matter (PM), have significant influences on air quality and human health (Anenberg et al., 2010; Finlayson-Pitts and Pitts, 1997; Li et al., 2017; Pöschl, 2005). Aerosols also affect the energy budget of the Earth system by scattering and/or absorbing solar radiation, thus directly affecting the climate (Gao et al., 2022; Yang et al., 2020a, 2023; Wang et al., 2023). Meanwhile, they may act as cloud condensation nuclei and/or ice nuclei, changing cloud characteristics and the atmospheric water cycle, which indirectly affect the climate (Liao et al., 2015; Lohmann and Feichter, 2005; Rosenfeld et al., 2008; Yang et al., 2022a). Due to the absorption of solar radiation, aerosol-induced heating can strengthen temperature inversion and increase the atmospheric stability, which inhibits the vertical mixing and transport of aerosols and leads to a further increase in near-surface aerosol concentrations (Chen et al., 2021; Lou et al., 2019). Therefore, knowing the sources of aerosols and their variations has become vital in the field of environmental and atmospheric sciences.
Human activities have a great influence on global aerosol distributions and compositions. For example, many countries have taken various air quality control measures at different stages of their economic development, causing distinct historical temporal changes in aerosol emissions around the world. Since the start of industrialization, anthropogenic emissions of aerosols and precursor gases have substantially increased, which significantly affected the atmospheric environment and Earth's energy balance (Carslaw et al., 2017). European and North American countries became major contributors of pollutant emissions. Since the 1980s, coal emissions have declined steadily in Europe and North America, owing to legislation and effective environmental policies to reduce local anthropogenic emissions of aerosol and precursor gases (Smith et al., 2011). In contrast to North America and Europe, coal consumption in China and India has experienced a substantial increase and anthropogenic emissions from these regions has continued to rise (Hoesly et al., 2018; Lim et al., 2020). Zheng et al. (2018) also reported that due to active clean air policies and the emission control of power plants and industry, anthropogenic emissions of PM2.5 (particulate matter less than 2.5 µm in diameter) from China have significantly decreased by 33 % during 2013–2017. However, countries in South Asia still rely on coal and petroleum, and thus aerosol emissions from South Asia have kept increasing in recent years (Li et al., 2017).
Regional aerosol pollution can be induced by both local emissions and long-range transport of pollutants across regions, countries, or even continents, which impose a far-reaching impact on air quality and human health (Akimoto, 2003; Anenberg et al., 2014; Jaffe et al., 1999; Lin et al., 2014; Liu et al., 2009; Zhang et al., 2017). Studies reported that the air quality in Europe is largely impacted by the long-range aerosol transport from North America (Stohl and Trickl, 1999; Yang et al., 2018a, 2020b). Asian anthropogenic emissions in spring also have a significant effect on aerosol concentrations in North America (Jaffe et al., 1999). Moreover, studies found that air pollution from Africa and Europe moved eastward and merged with Asian pollution, affecting air quality in western North America (Liu and Mauzerall, 2005; Chin et al., 2007). Yang et al. (2017) also found that remote sources contributed the most to the regions with low emissions through long-range transport, which further impacted the local climate. Therefore, relying on domestic emission control alone may be insufficient to prevent air pollution due to the long-distance transport of air pollutants (Liu et al., 2009). A study revealed that approximately 12 % of global premature deaths caused by PM2.5 were related to non-local air pollutants (Zhang et al., 2017). About 16 % of premature deaths in India caused by PM2.5 were attributed to aerosol transport from external source regions (David et al., 2019). Within each emission source region, aerosols also come from different emission sectors. Many scientific control measures and policies are implemented based on the source attribution of air pollutants from individual sectors. Hence, it is of great significance to quantify source contributions of the long-range transport of aerosols from major emission regions around the world as well as aerosols from major emission sectors.
Anthropogenic emissions of aerosols and precursor gases have changed significantly in different source regions over the past century. Few studies focus on the source attributions of aerosols across the globe over such a long period of time. In this study, we focus on the changes in aerosols and the emission source region and sector contributions in major source regions (i.e., North America, Europe, East Asia, South Asia) during the three important periods of emission changes since industrialization (1850–1980, 1980–2010, and 2010–2017) based on the Energy Exascale Earth System Model version 1 (E3SMv1), equipped with the Explicit Aerosol Source Tagging (E3SMv1 EAST) system.
2.1 Model description and experimental design
To study variations in historical anthropogenic aerosols in the major source regions, E3SMv1 developed by the US Department of Energy (DOE) (Golaz et al., 2019) is used in this study. E3SMv1 is updated on the basis of the Community Atmosphere Model version 5 (CAM5) in order to explore several key emerging issues in the field of environment and climate studies and is a branch of the widely used Community Earth System Model (CESM) (Rasch et al., 2019). E3SMv1 consists of atmosphere, land surface, ocean, sea ice, and river model components. It features numerous upgrades to aerosol, turbulence, chemical, and cloud-related processes, offering multiple spatial resolution options. The model can run simulations for decades or more at higher resolution to help understand past, present, and future changes in Earth's behavior and to explore how the atmosphere interacts with other components of the Earth system. Aerosol microphysics and interactions with stratiform clouds are treated with the four-mode Modal Aerosols Module (MAM4) (Liu et al., 2016), which predicts the mass and number concentrations of sulfate, black carbon (BC), primary organic matter (POM), secondary organic aerosol (SOA), marine organic aerosol, mineral dust, and sea salt (Wang et al., 2020). EAMv1 applies the “Morrison and Gettelman version 2” (MG2) two-moment bulk microphysics parameterization for stratiform clouds (Gettelman and Morrison, 2015). It allows for aerosol–cloud interactions in all stratiform and shallow convective clouds but neglects them in deep convective clouds (Rasch et al., 2019). Liquid cloud drop activation is based on Abdul-Razzak and Ghan (2000), and ice nucleation parameterization based on classical nucleation theory for the heterogeneous ice formation in mixed-phase clouds follows Y. Wang et al. (2014). Hygroscopicity is specified for soluble aerosols to calculate the particle size based on relative humidity. The aerosols are assumed to mix internally in the same aerosol mode and externally between modes when calculating the aerosol optical properties (Ghan and Zaveri, 2007). The model has been applied to investigate the variations in anthropogenic and natural aerosols related to air–sea interactions (Yang et al., 2022b; Zeng et al., 2021). Compared to the regional model, the model of E3SMv1 with an aerosol-tagging tool introduced in this study is more suitable for the simulation of transboundary and intercontinental transport of aerosols across the globe. In this study, the model is configured at its standard horizontal spatial resolution of approximately 1° with 72 vertical layers.
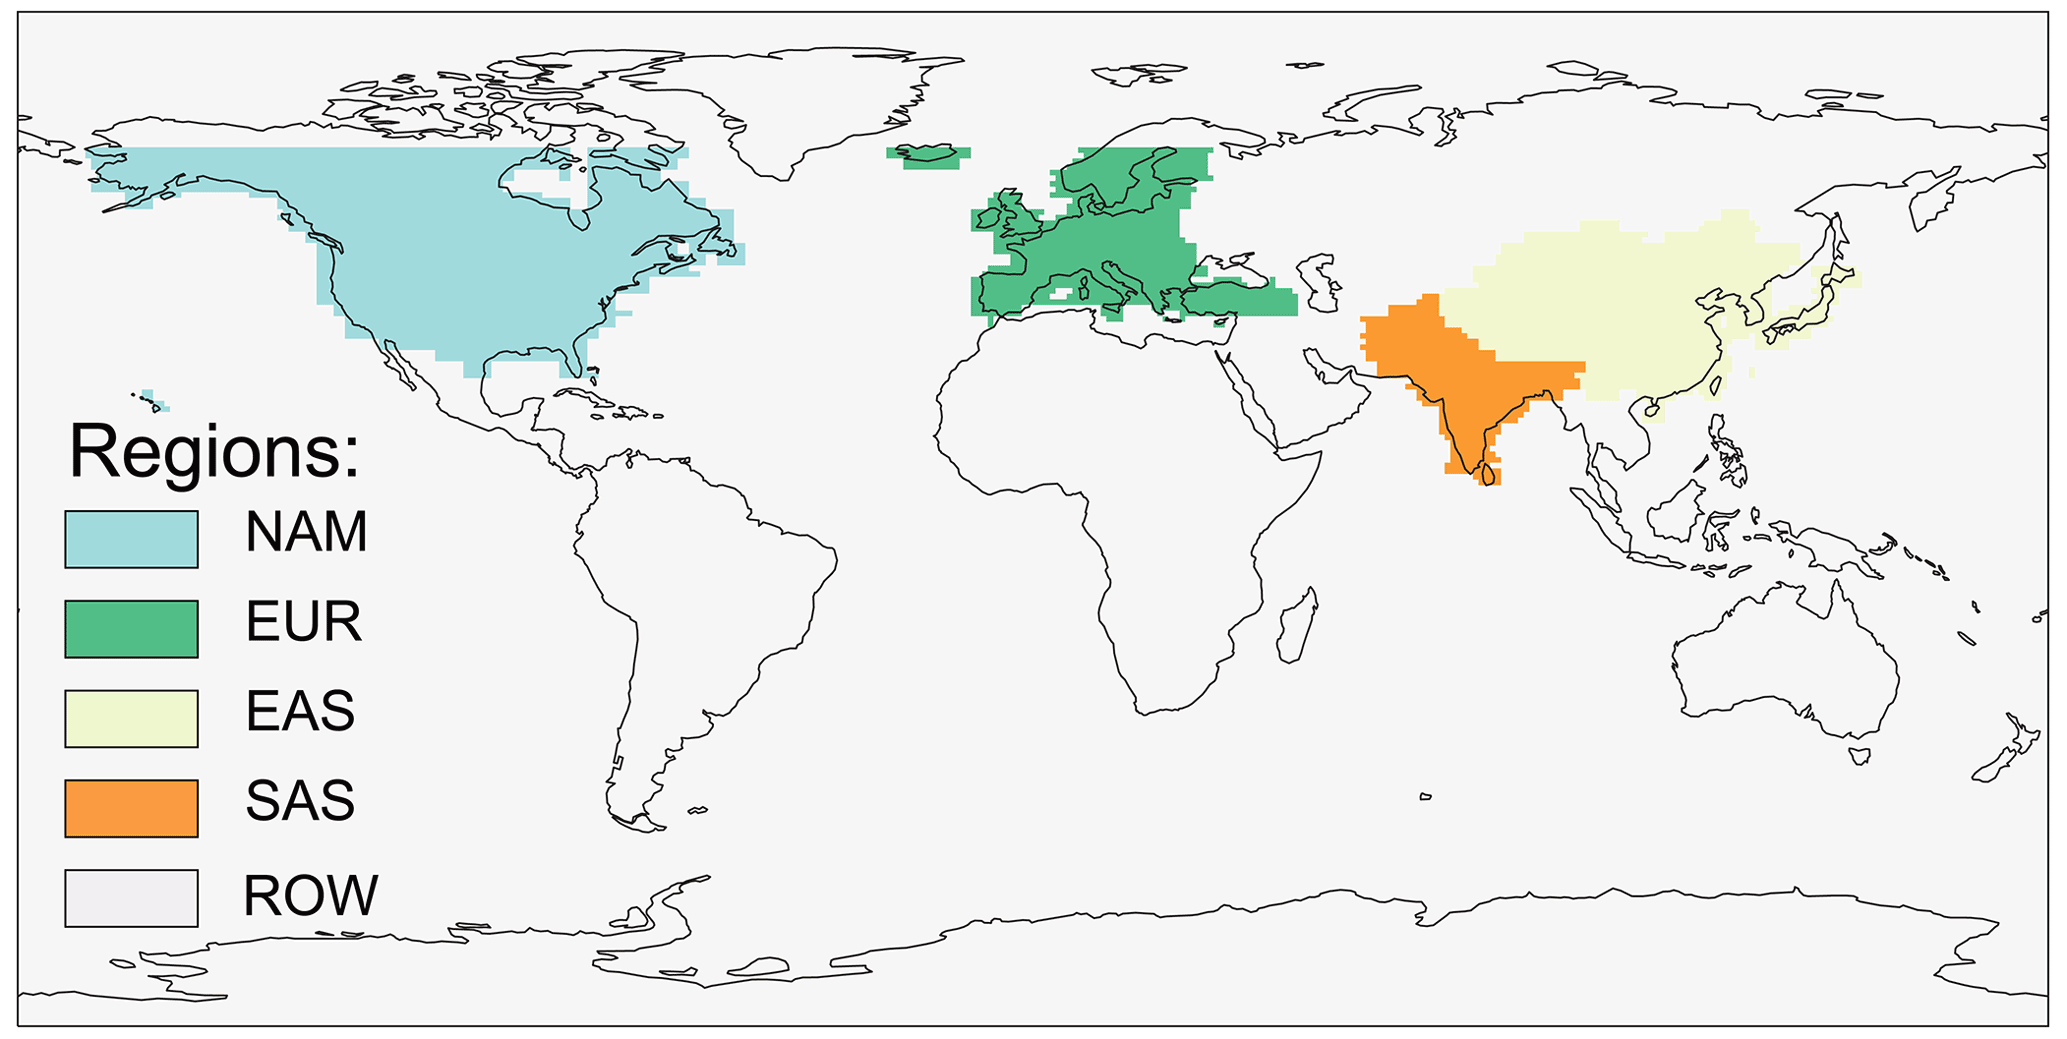
Figure 1Tagged source regions (NAM: North America; EUR: Europe; EAS: East Asia; SAS: South Asia; ROW: rest of the world).
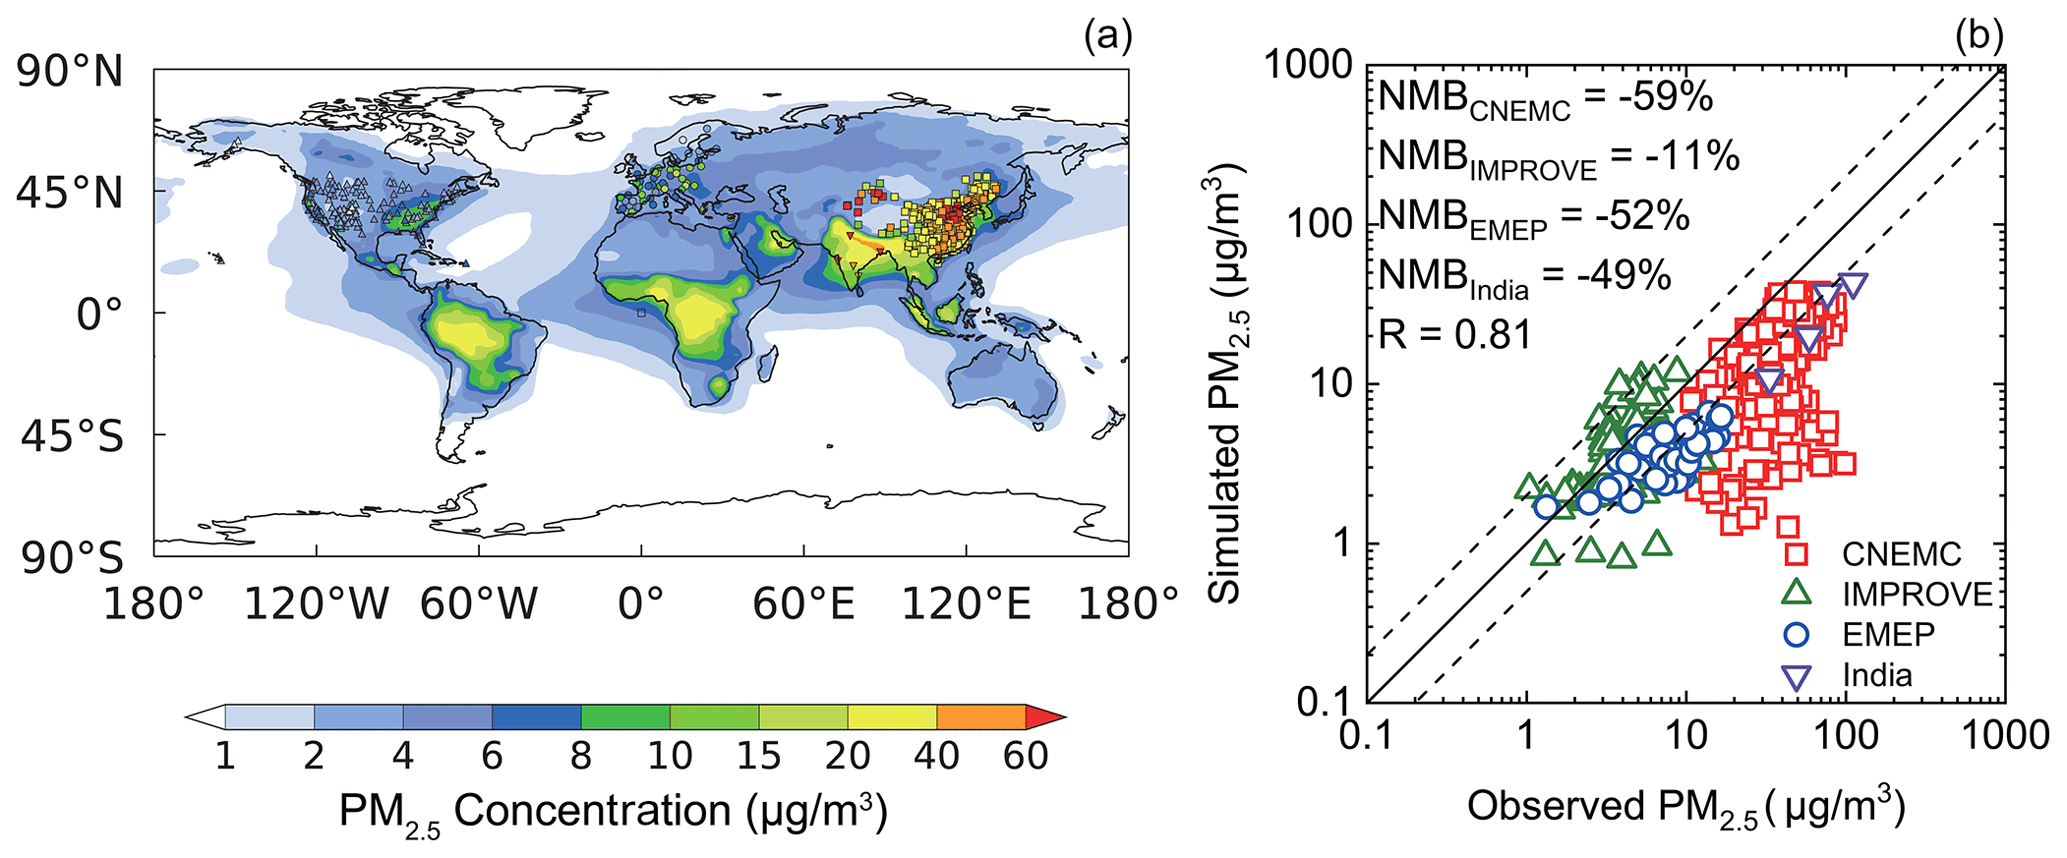
Figure 2(a) Spatial distribution and (b) scatter plot of the simulated and observed annual mean near-surface PM2.5 concentrations (µg m−3) in 2017. Observational data are from IMPROVE (triangle), EMEP (circle), India (inverted triangle), and CNEMC (square). The solid line marks the 1:1 ratio, and dashed lines mark the 1:2 and 2:1 ratios. Normalized mean bias (NMB) and correlation coefficient (R) between the observation and simulation are shown in the right panel. , where Mi and Oi are the modeled and observed values at site i, respectively.
Global emissions of aerosols and precursor gases used in the simulations are obtained from the CMIP6 (the Coupled Model Intercomparison Project Phase 6) datasets (Hoesly et al., 2018; van Marle et al., 2017). However, the anthropogenic emissions in China are replaced with the MEIC (Multi-resolution Emission Inventory for China) inventory, which fully considers the implementation of clean air actions over China since the 2010s (Gao et al., 2022, 2023; Li et al., 2021; Zheng et al., 2018). Following previous studies (Ren et al., 2021; Yang et al., 2018a), the near-surface concentrations of PM2.5 here are estimated as the sum of sulfate, BC, POM, and SOA concentrations. Effective radiative forcing (ERF) refers to the change in the net radiative flux at the top of the atmosphere (TOA) after the external forcing is applied. In this study, ERF due to aerosol–radiation interactions (ERFari) for the individual tagged source regions is derived as the difference in TOA net radiative fluxes from a pair of diagnostic radiation calculations with and without the particular tagged aerosols from the source regions for the all-sky condition following Ghan (2013).
This study focuses on the variations in the source region and sector contributions in four major emission regions of the world (North America, Europe, East Asia, and South Asia) during the three key historical periods of emission changes (1850–1980, 1980–2010, and 2010–2017). Four simulations with monthly anthropogenic emissions of aerosols and precursors fixed at the 1850, 1980, 2010, and 2017 levels, respectively, are conducted. All simulations are performed for 1 year following 6-month model spin-up. Greenhouse gas concentrations, solar insolation, sea surface temperature, and sea ice extent are prescribed at the 2000 levels. The meteorological fields including 3-dimensional temperature, specific humidity, and winds are nudged toward the MERRA-2 (Modern-Era Retrospective analysis for Research and Applications, Version 2) reanalysis (Gelaro et al., 2017) in 2017 at a 6-hourly relaxation timescale.
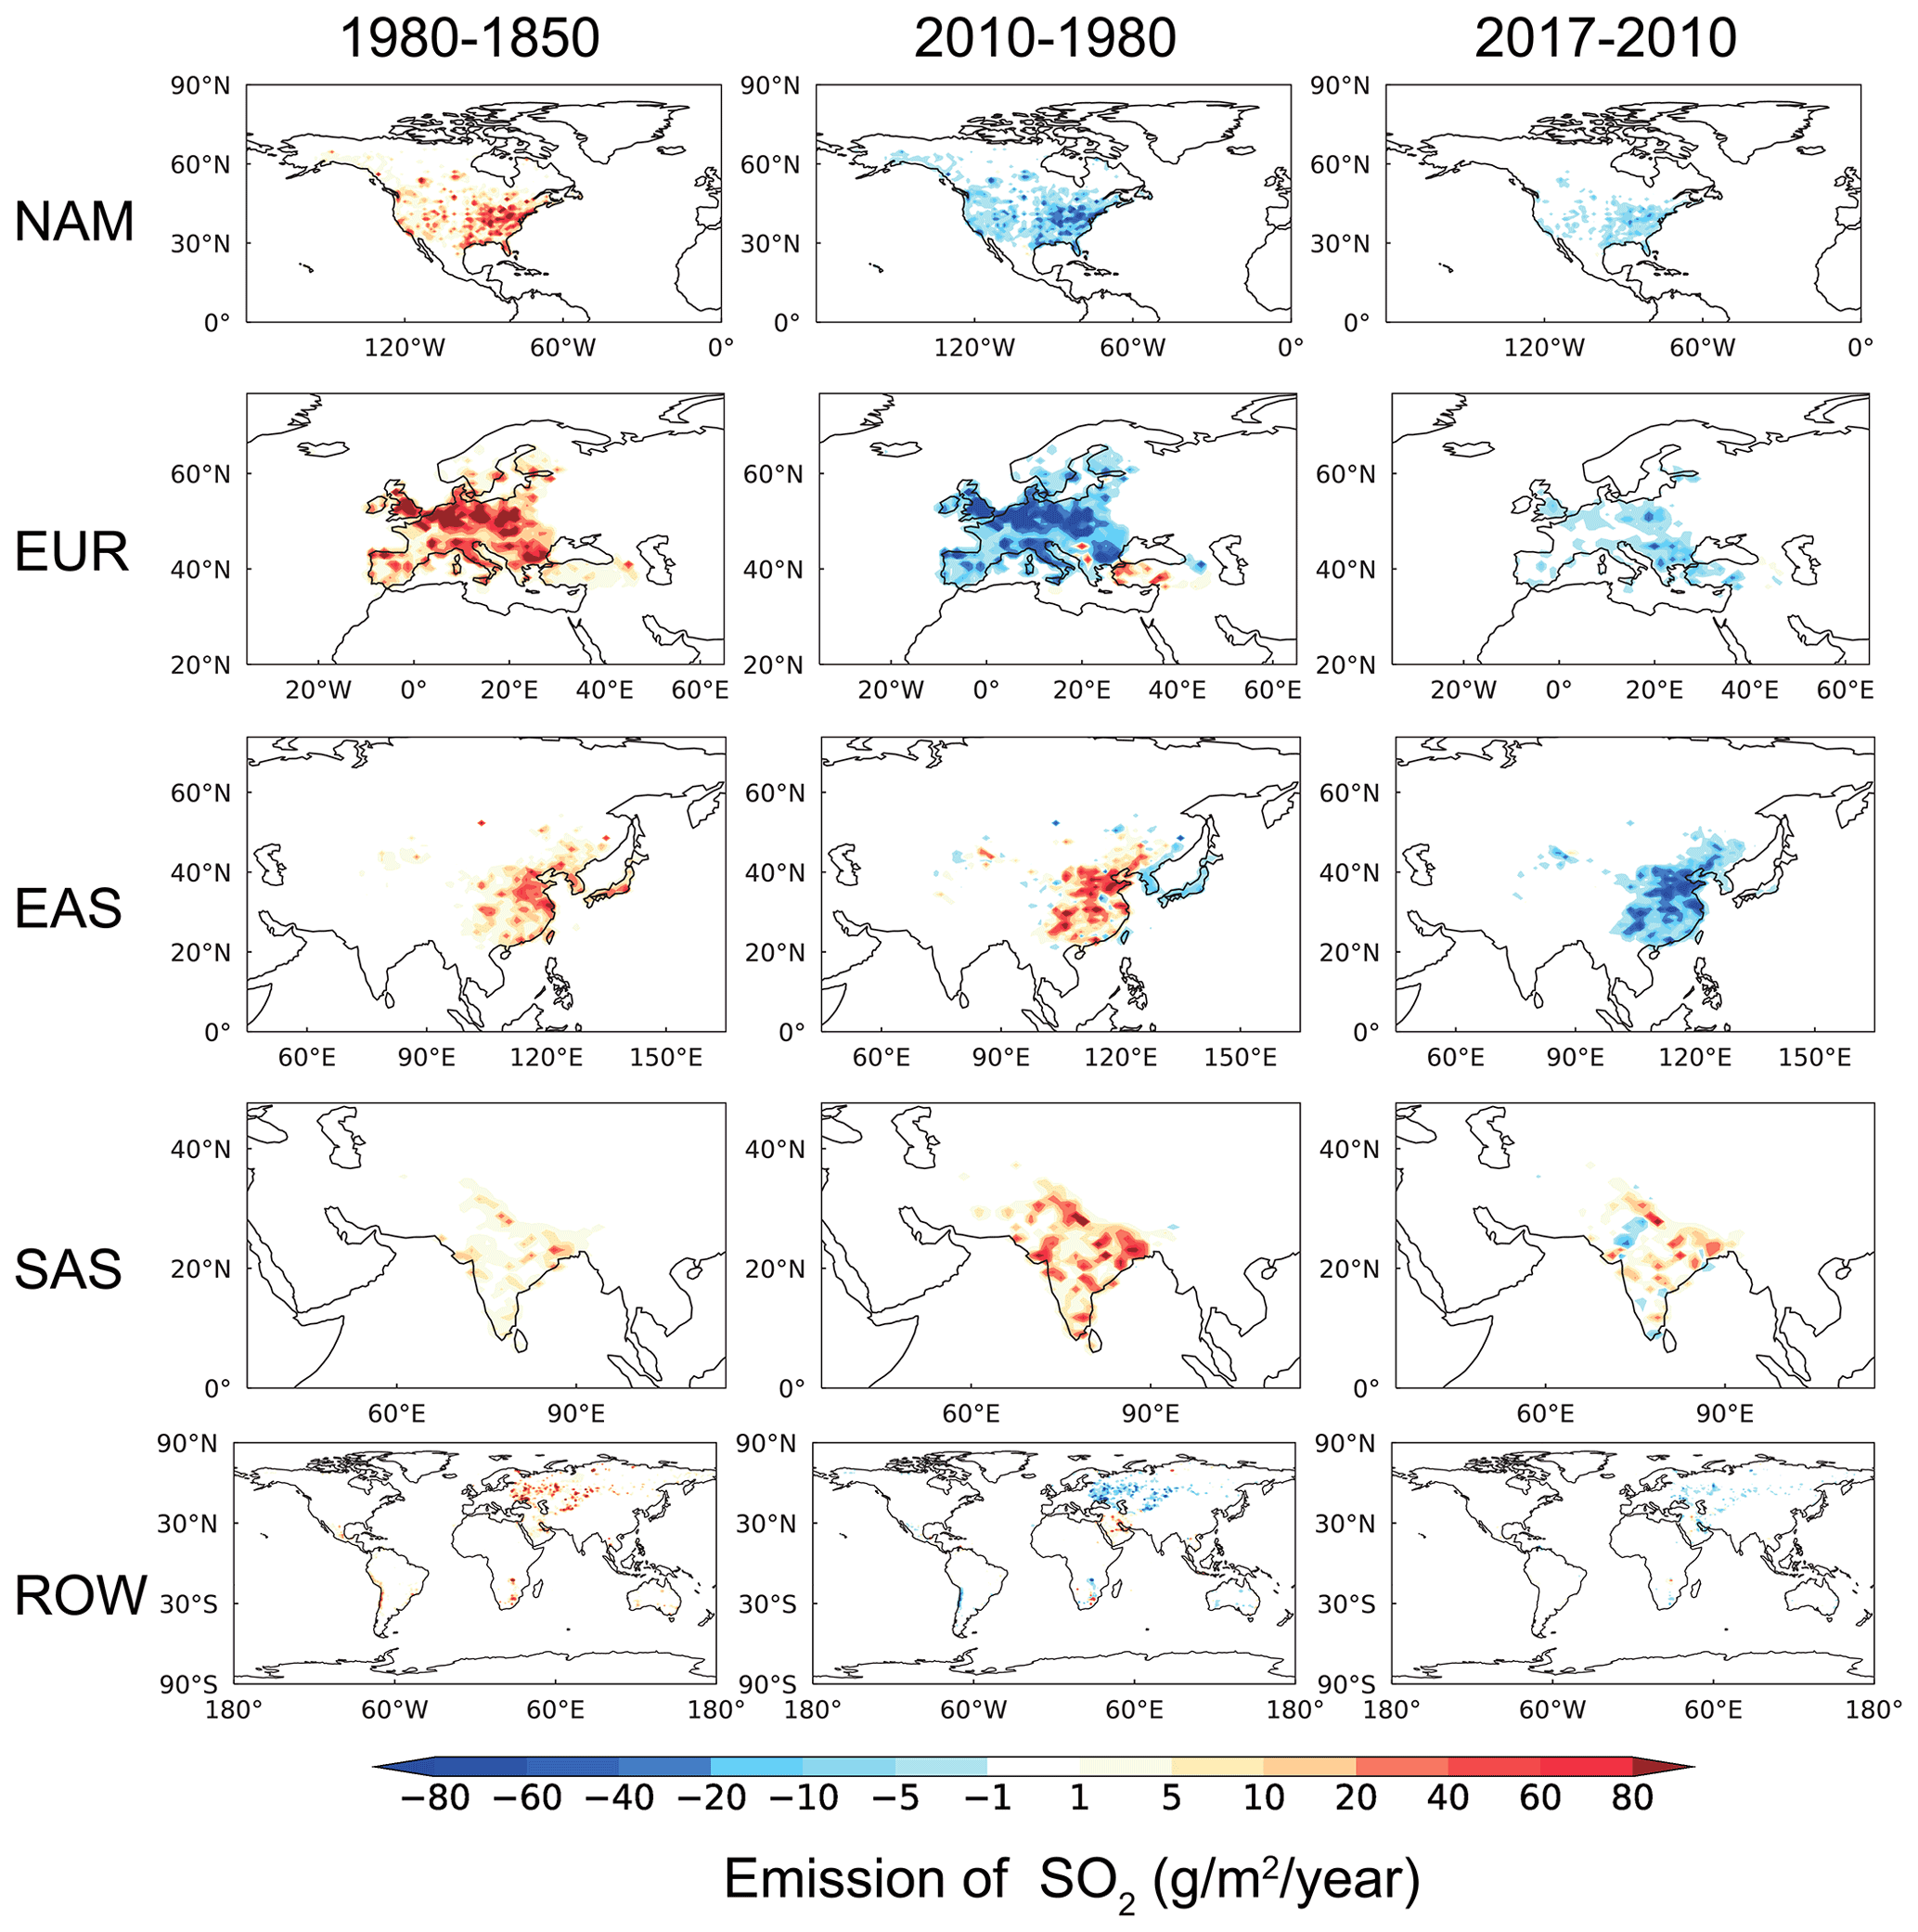
Figure 3Changes in anthropogenic sulfur dioxide (SO2) emissions () between 1850 and 1980 (left), between 1980 and 2010 (middle), and between 2010 and 2017 (right) in the five tagged source regions (NAM, EUR, EAS, SAS, and ROW from top to bottom).
2.2 Explicit Aerosol Source Tagging system
Source apportionment aims to quantify the contributions to aerosols from specific sources. To examine the source–receptor relationships of aerosols, we implemented the Explicit Aerosol Source Tagging (EAST) system in E3SMv1, which plays a critical role in attributing aerosol concentrations to their respective emission sources. EAST follows the BC-source-tagging technique introduced in H. Wang et al. (2014), the sulfate-source-tagging method used in Yang et al. (2017), and other carbonaceous aerosol tagging applied in Yang et al. (2018a), which was previously implemented in the Community Atmosphere Model version 5 (CAM5-EAST). This tagging system is different from the traditional emission sensitivity method that zeroes out or perturbs emissions from a given source region or sector in sensitivity simulations along with a baseline simulation, which has to assume a linear response to emission perturbation and requires many additional simulations for estimating the contributions from multiple sources (H. Wang et al., 2014). EAST independently considers all aerosol physical, chemical, and dynamical processes for each tagged source through introducing additional aerosol-related variables within one simulation, and it does not rely on a linear response to emission perturbations. These capabilities make it physically more accurate and time efficient than the sensitivity experiments. This tagging method has previously been adopted in regional models and has now implemented in the global E3SMv1 model to better understand intercontinental transport from sources outside the regional domain.
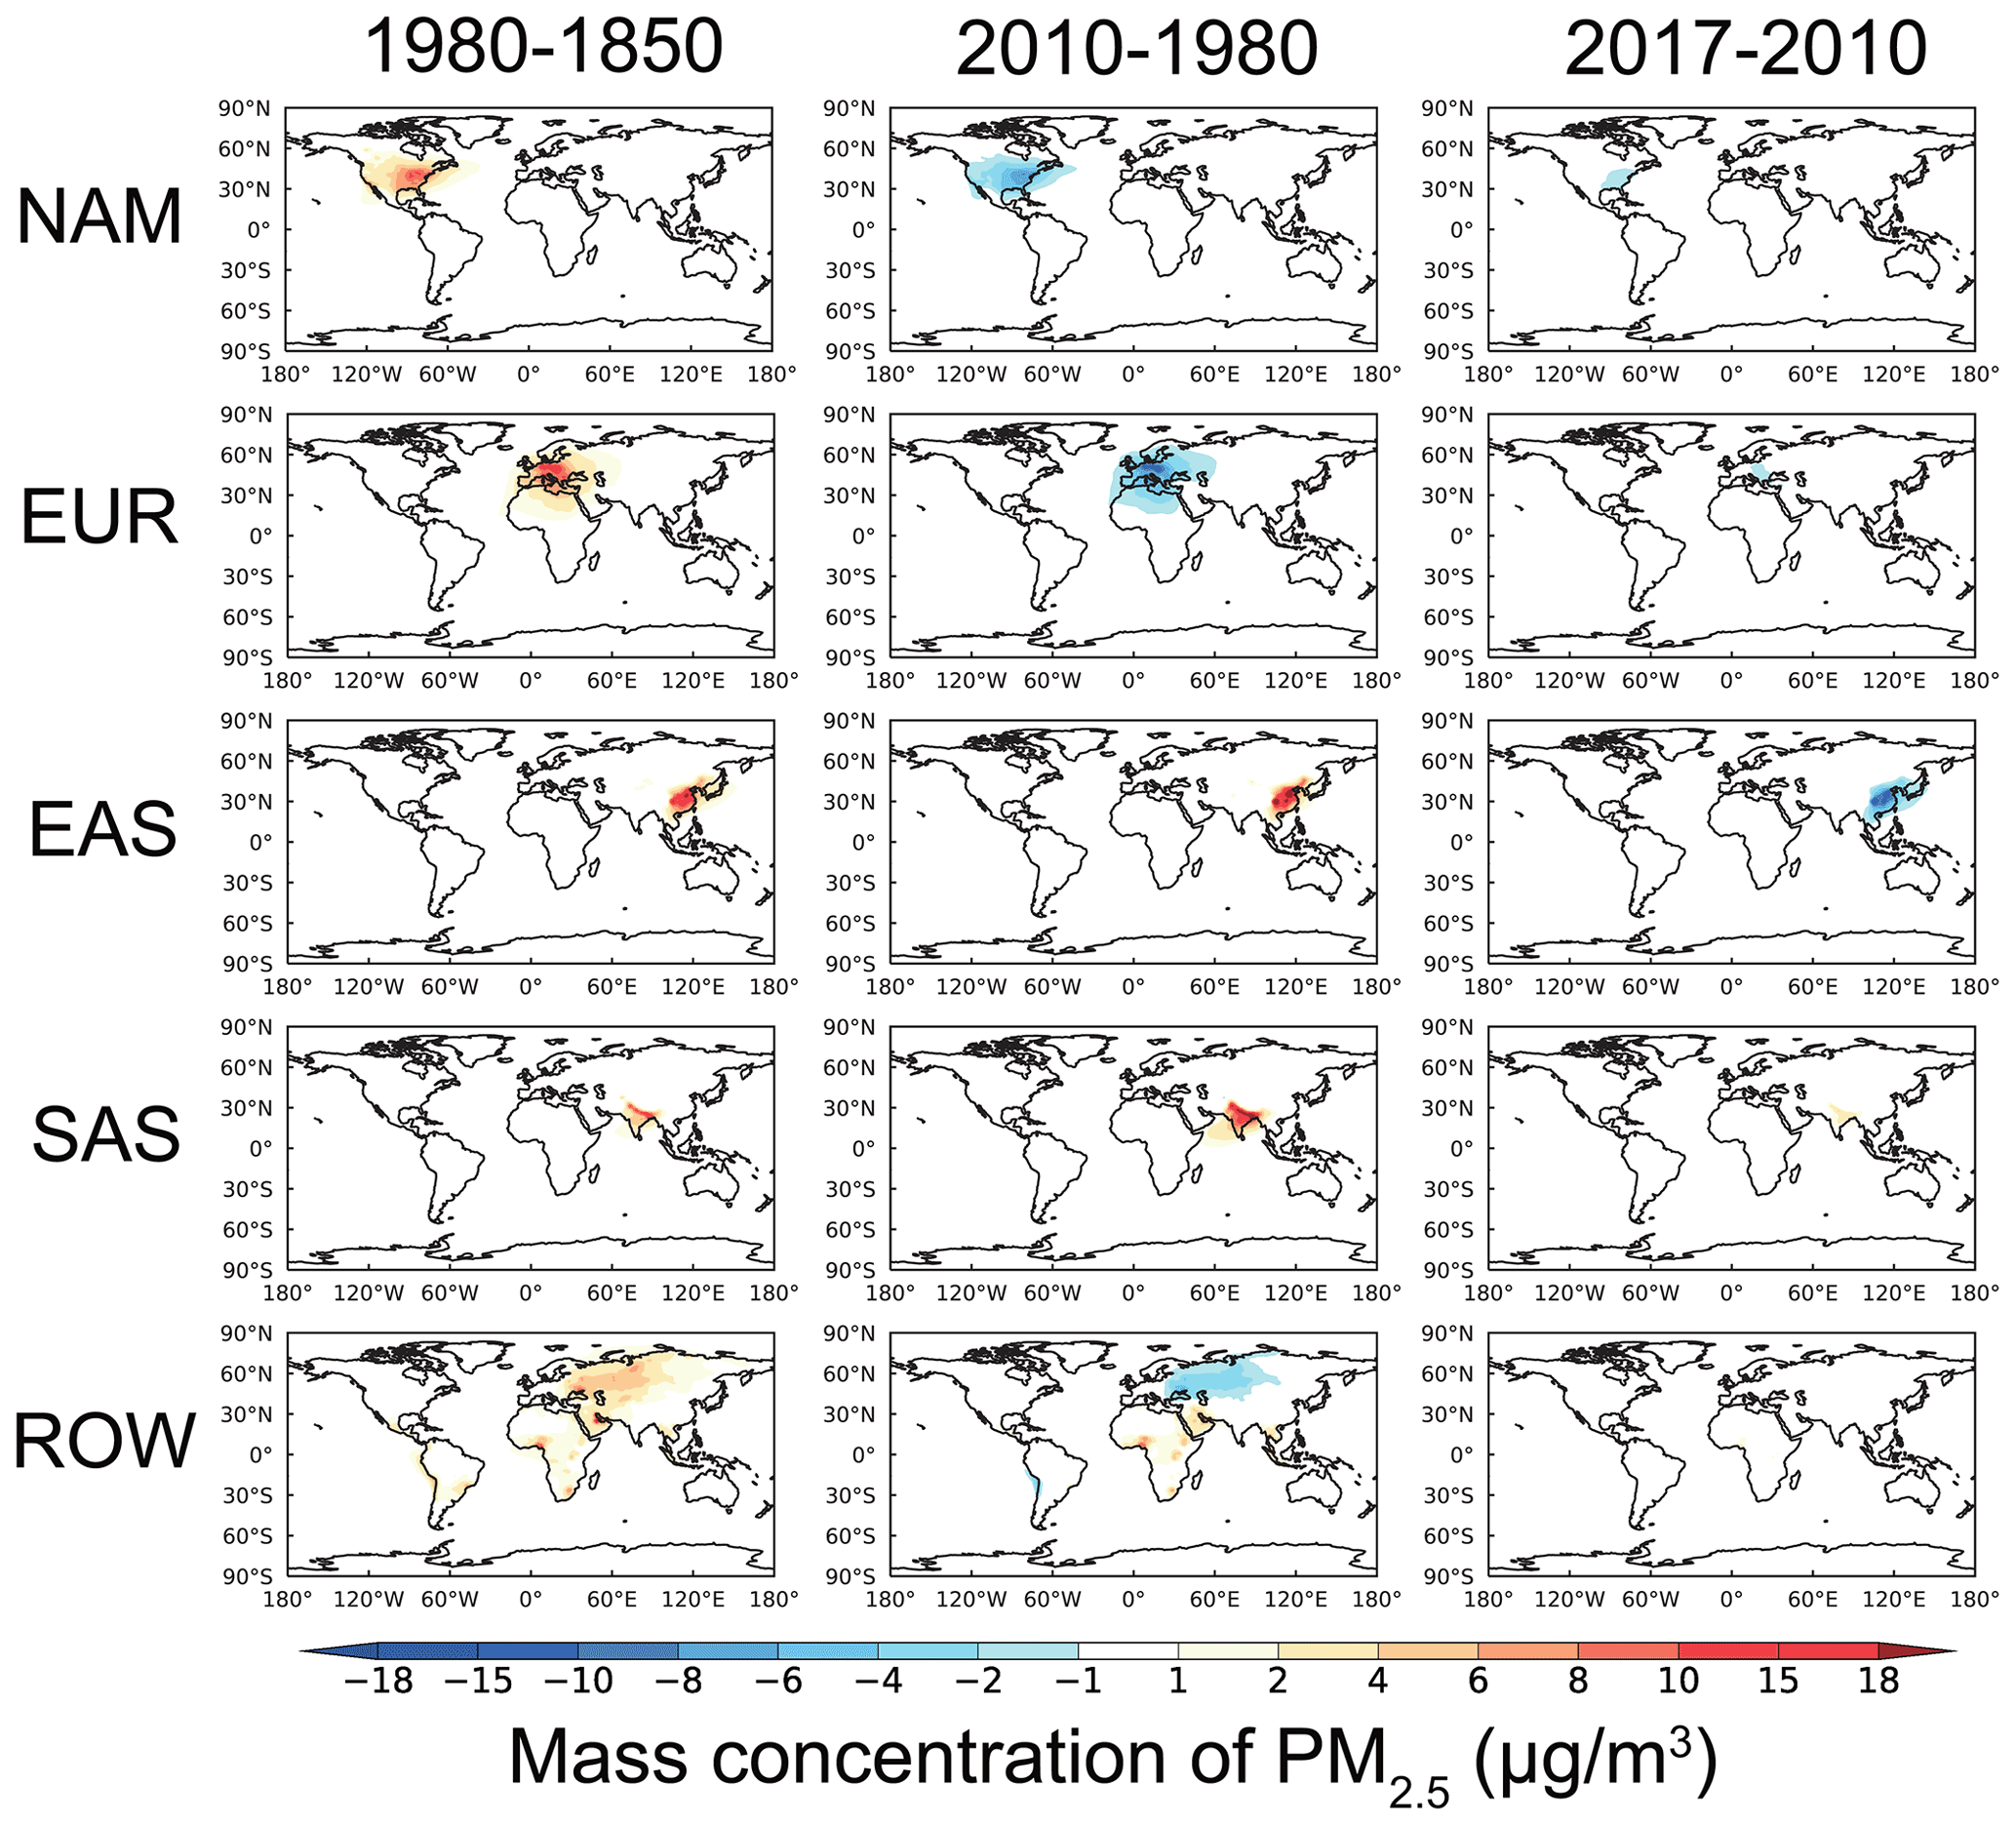
Figure 4Changes in near-surface mass concentration (µg m−3) of anthropogenic PM2.5 contributed by the five tagged source regions (NAM, EUR, EAS, SAS, and ROW from top to bottom) between 1850 and 1980 (left), between 1980 and 2010 (middle), and between 2010 and 2017 (right).
In this study, in total 18 tags are set for each anthropogenic species of aerosols and precursors. Each of the four major source regions, including North America (NAM), Europe (EUR), East Asia (EAS), and South Asia (SAS), has four tags for energy transformation and extraction (ENE); industrial combustion and processes (IND); residential, commercial, and other (RCO); and the rest of the anthropogenic-emission sectors (RST). One tag is assigned to the anthropogenic emissions from rest of the world (ROW), and the last tag is allocated for all the natural/biogenic sources including open biomass burning, volcanic emissions, and oceanic emissions.
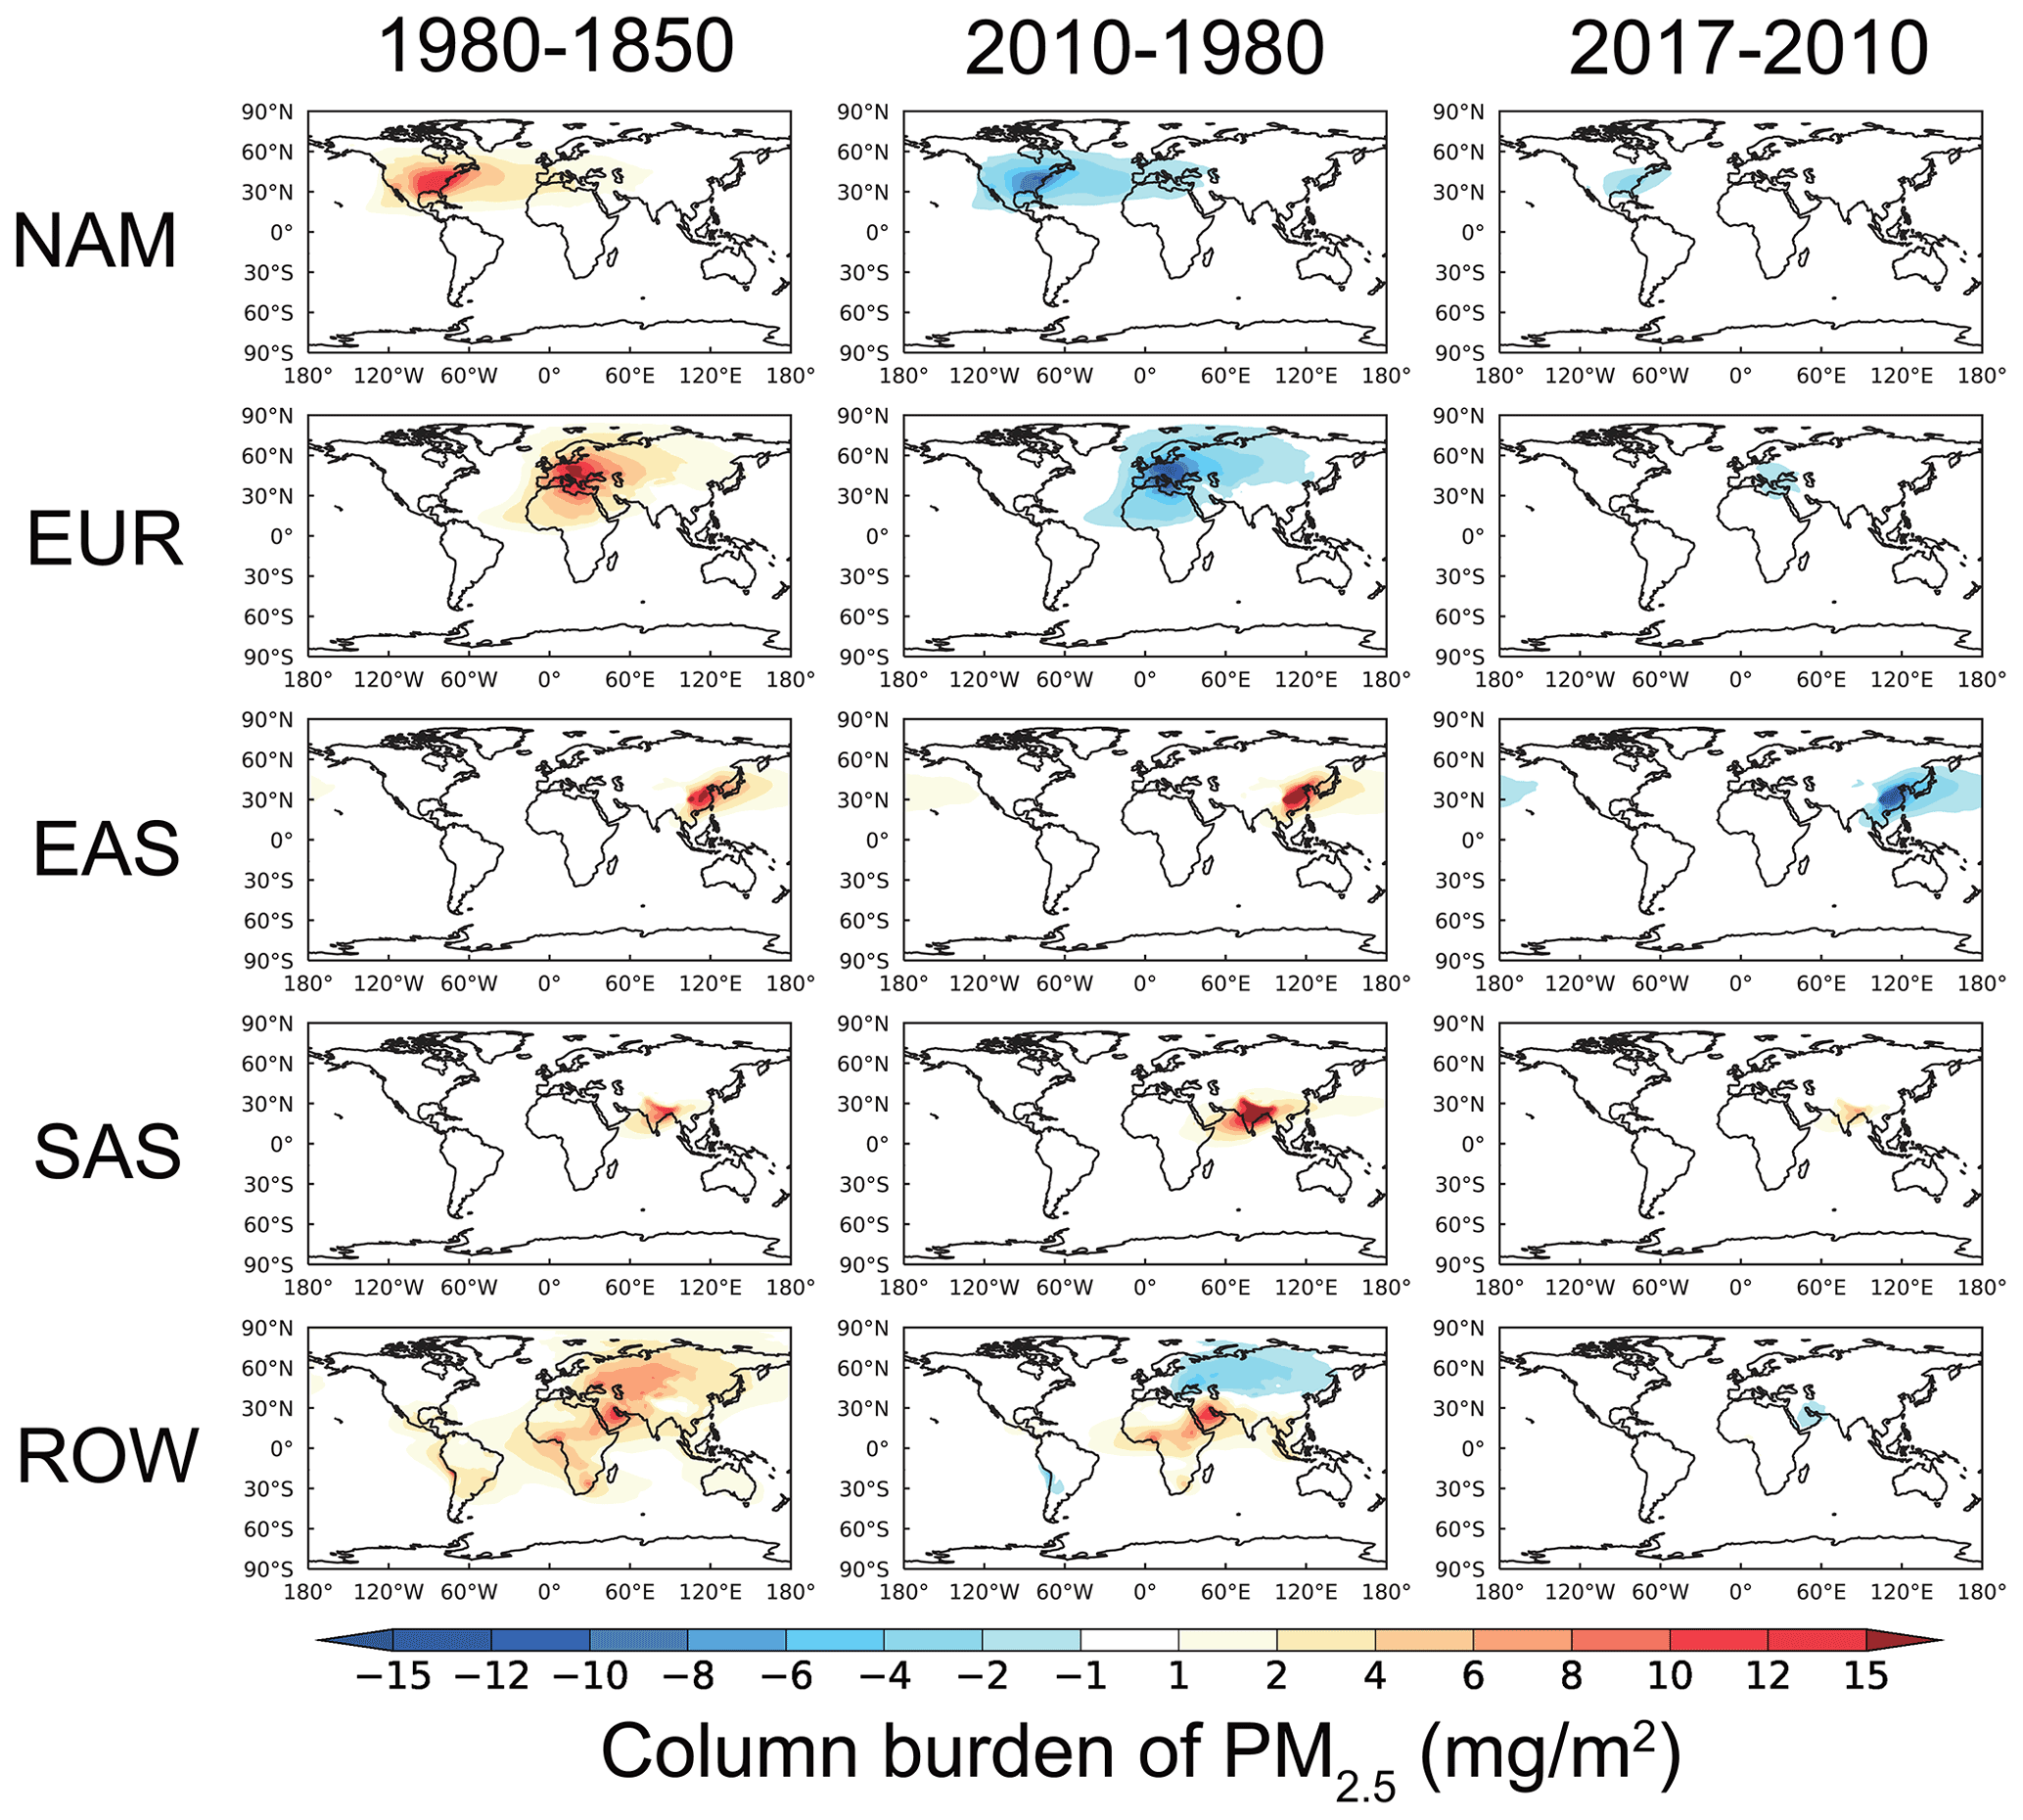
Figure 5Changes in column burden (mg m−2) of anthropogenic PM2.5 contributed by the five tagged source regions (NAM, EUR, EAS, SAS, and ROW from top to bottom) between 1850 and 1980 (left), between 1980 and 2010 (middle), and between 2010 and 2017 (right).
2.3 Model evaluation
In order to evaluate the performance of E3SMv1 in reproducing the aerosol concentrations, Fig. 2 compares the simulated near-surface PM2.5 concentrations with observations from the Interagency Monitoring of Protected Visual Environments (IMPROVE) over the US, the European Monitoring and Evaluation Programme (EMEP) over Europe, US embassies and consulates in India, and the China National Environmental Monitoring Center (CNEMC) over China in 2017. The model successfully reproduces the spatial distribution of PM2.5 concentrations, with relatively high concentrations in eastern China and India and low concentrations in the US and Europe. The spatial correlation coefficient (R) between the E3SMv1 PM2.5 concentration simulations and observations is +0.80. The model reproduces the PM2.5 concentrations in the US well with normalized mean biases (NMB) of −11 %. However, it largely underestimates the PM2.5 concentrations in China and Europe, which has also been revealed in several studies (e.g., Gao et al., 2018; Gao et al., 2023; Navinya et al., 2020; Zeng et al., 2021). This discrepancy is partly because E3SMv1 only considers limited aerosol species (BC, POM, SOA, and sulfate) without including nitrate and ammonium aerosols in the aerosol module. On the other hand, the overestimated wet scavenging at mid-latitudes and high latitudes and underestimated gas-to-particle conversion can also lead to the low bias (Zeng et al., 2021). The evaluation in 2010 also shows similar high correlation and biases (Fig. S3).
In order to evaluate the model performance in reproducing the historical changes in aerosol concentrations during the important periods of emission changes, the variations in near-surface PM2.5 concentrations are compared with observations (Fig. S4) and MERRA-2 reanalysis (Fig. S5). The model reproduces the decreases in PM2.5 concentrations in the eastern US and Europe and the increases in East Asia and South Asia during 1980–2010 well, with a spatial R value of 0.78 between model results and MERRA-2 data. The model also simulates the aerosol decline in North America, Europe, and East Asia and a continuous increase in South Asia during 2010–2017 well, with an R value of 0.81 between model results and observational data. However, the model simulation does not capture the increases in PM2.5 in southwestern Canada and eastern Russia. This is because the wildfire emissions were kept unchanged during the simulation, while wildfires occurred more frequently in these regions during the analyzed time period (Jolly et al., 2015; Goss et al., 2020), leading to the increases in PM2.5 in observations.
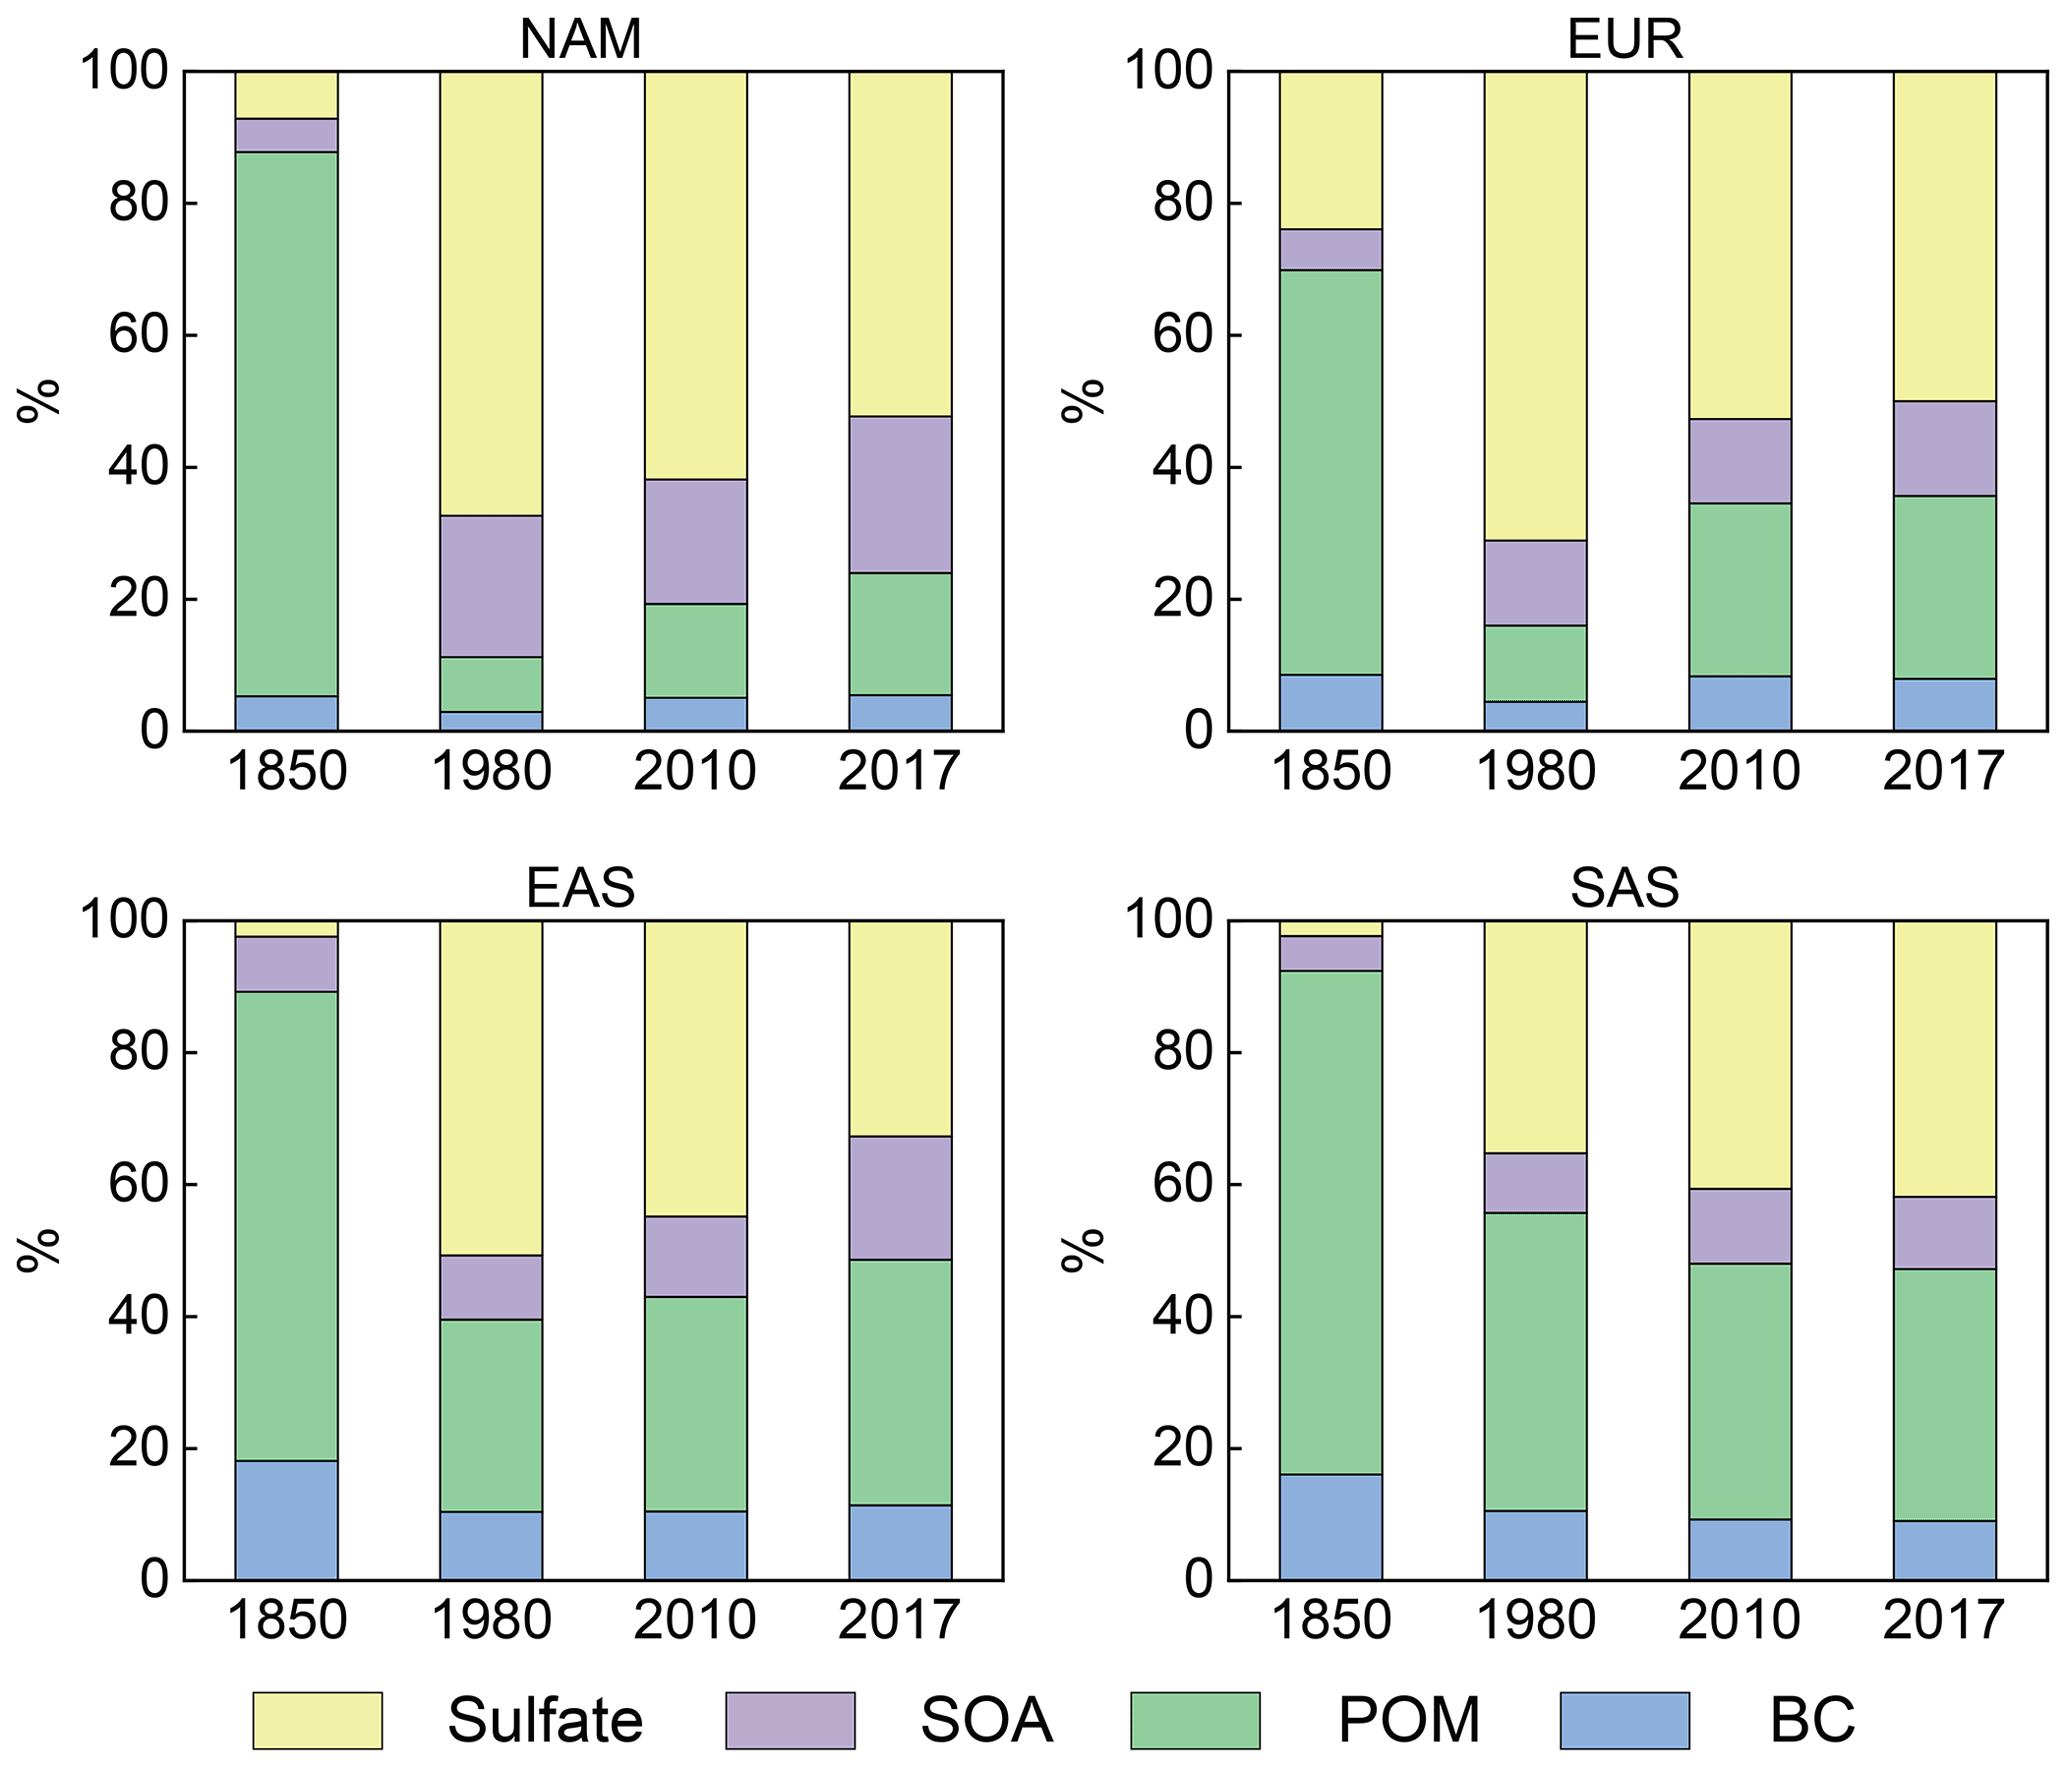
Figure 6Percentage contributions (%) of aerosol species including BC, POM, SOA, and sulfate to the near-surface mass concentrations of PM2.5 averaged over the four major emission source regions (NAM, EUR, EAS, and SAS) in the four years under investigation (1850, 1980, 2010, and 2017).
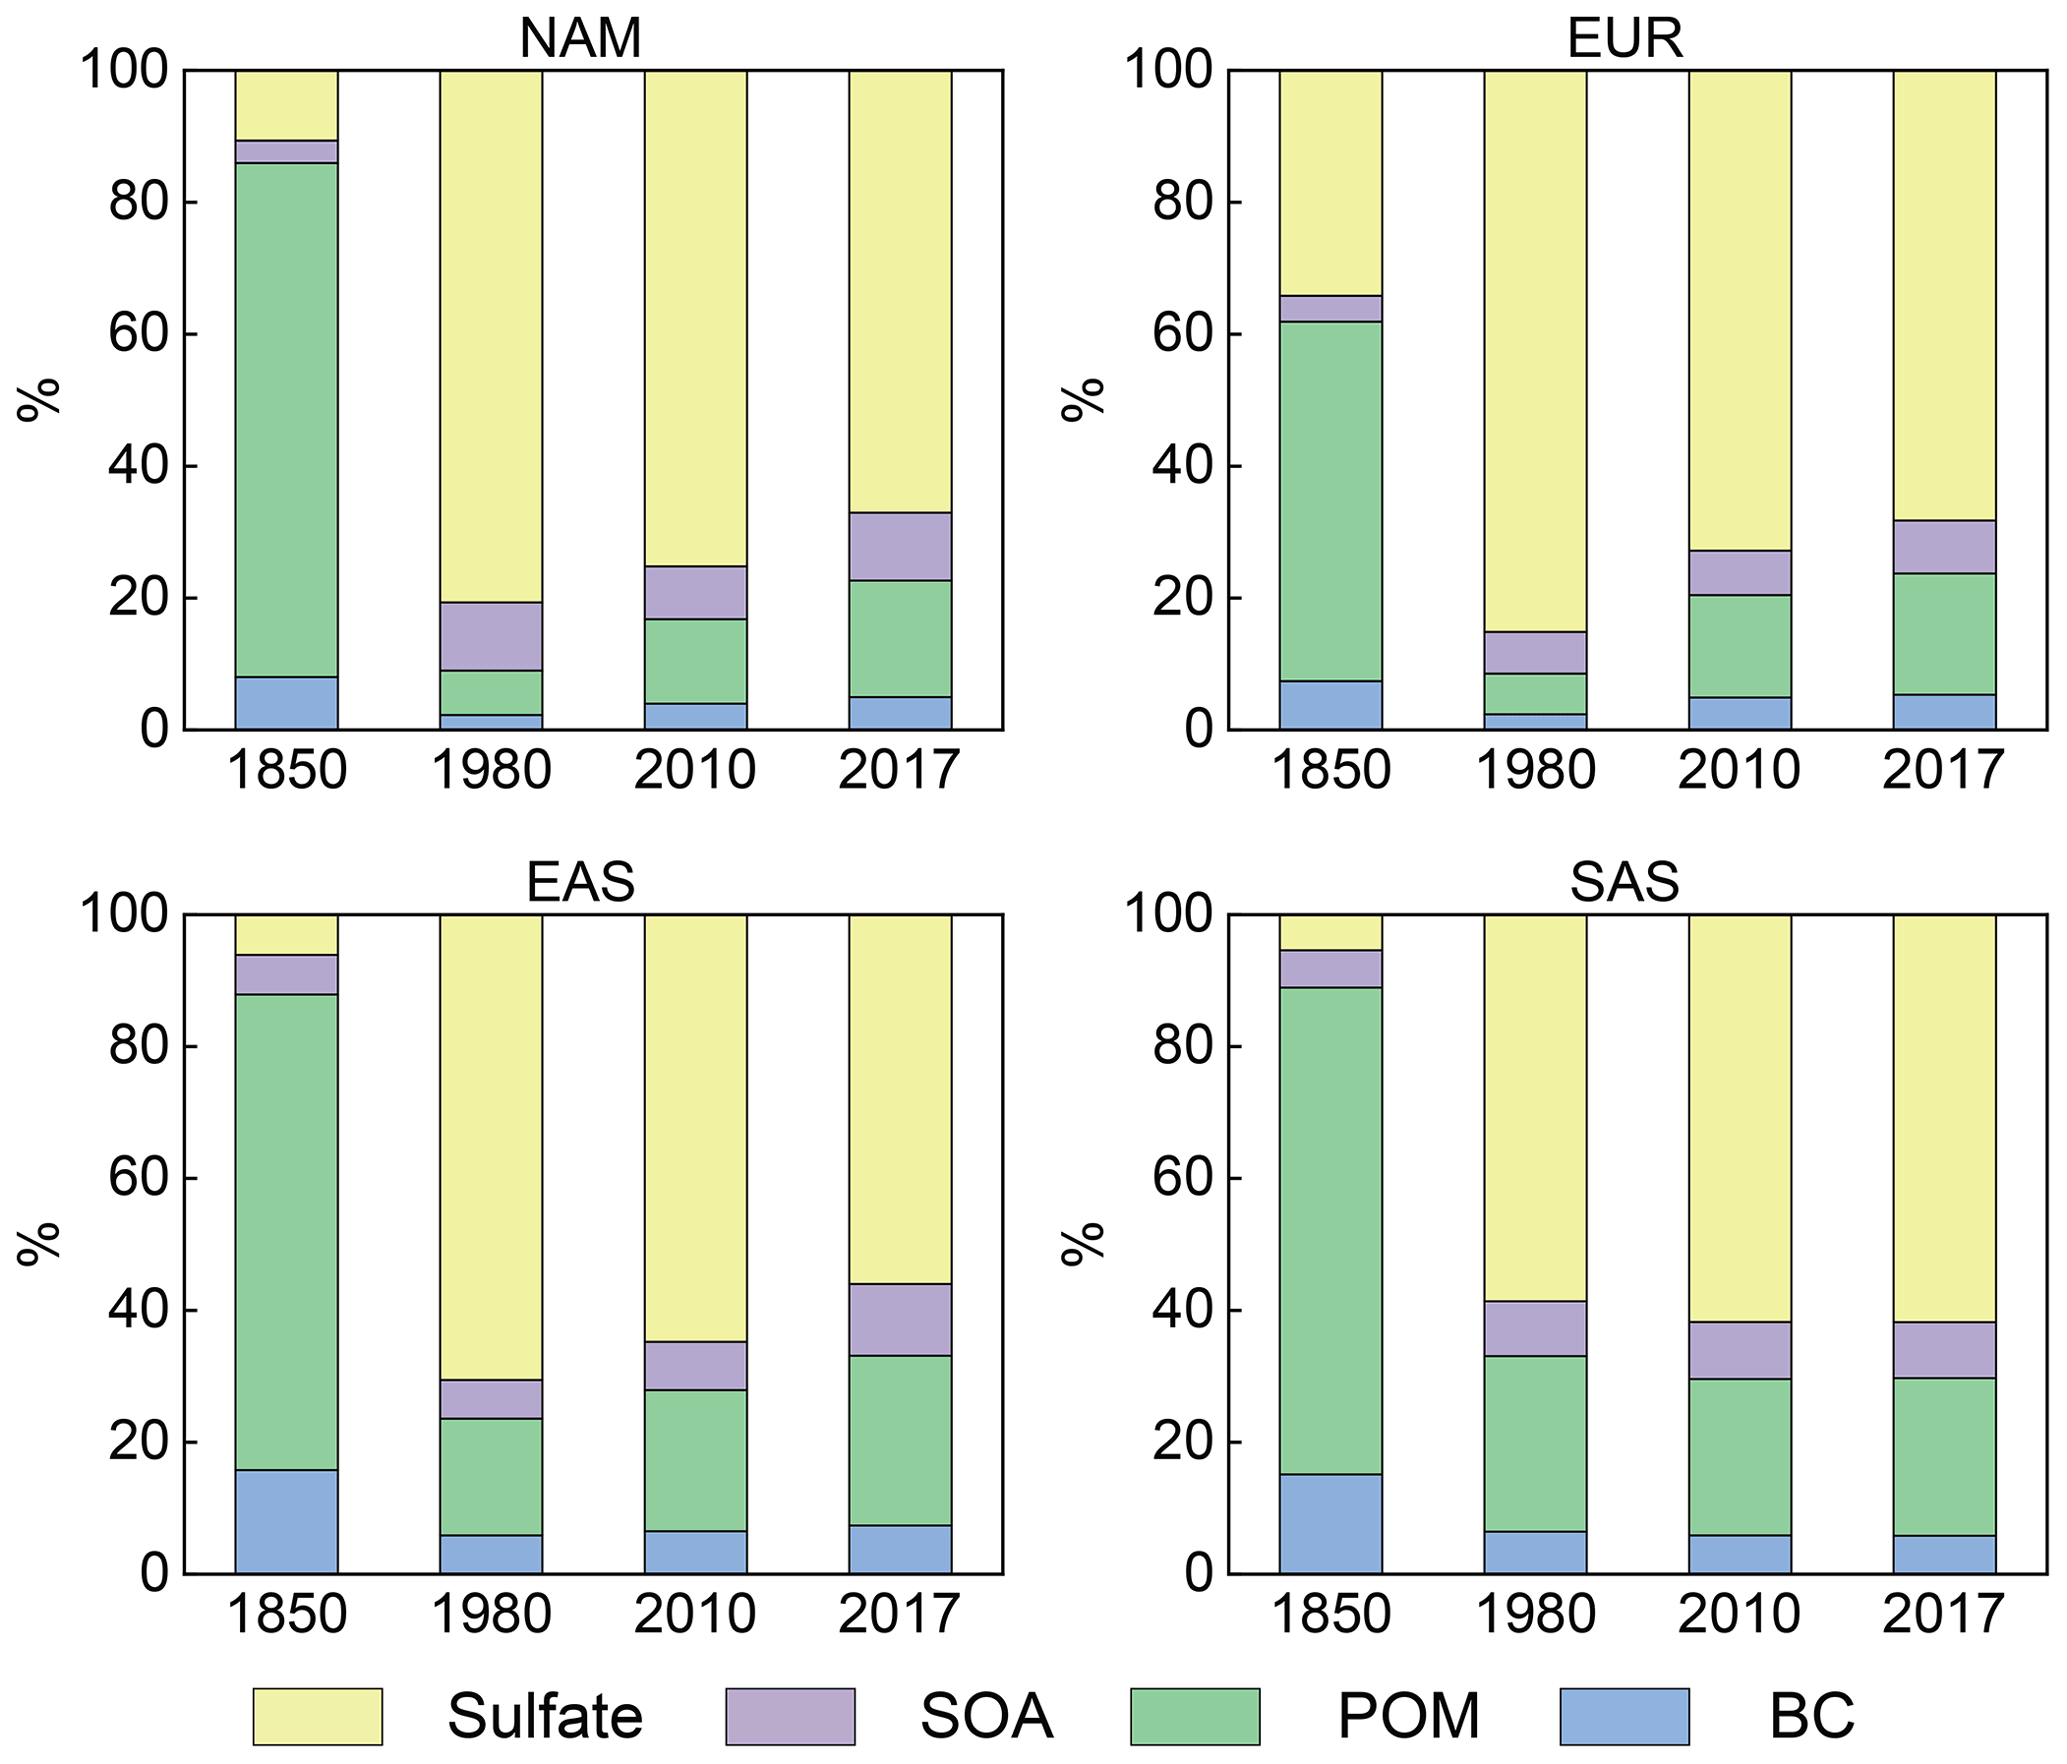
Figure 7Percentage contributions (%) of aerosol species including BC, POM, SOA, and sulfate to the column burden of PM2.5 averaged over the four major emission source regions (NAM, EUR, EAS, and SAS) in the four years under investigation (1850, 1980, 2010, and 2017).
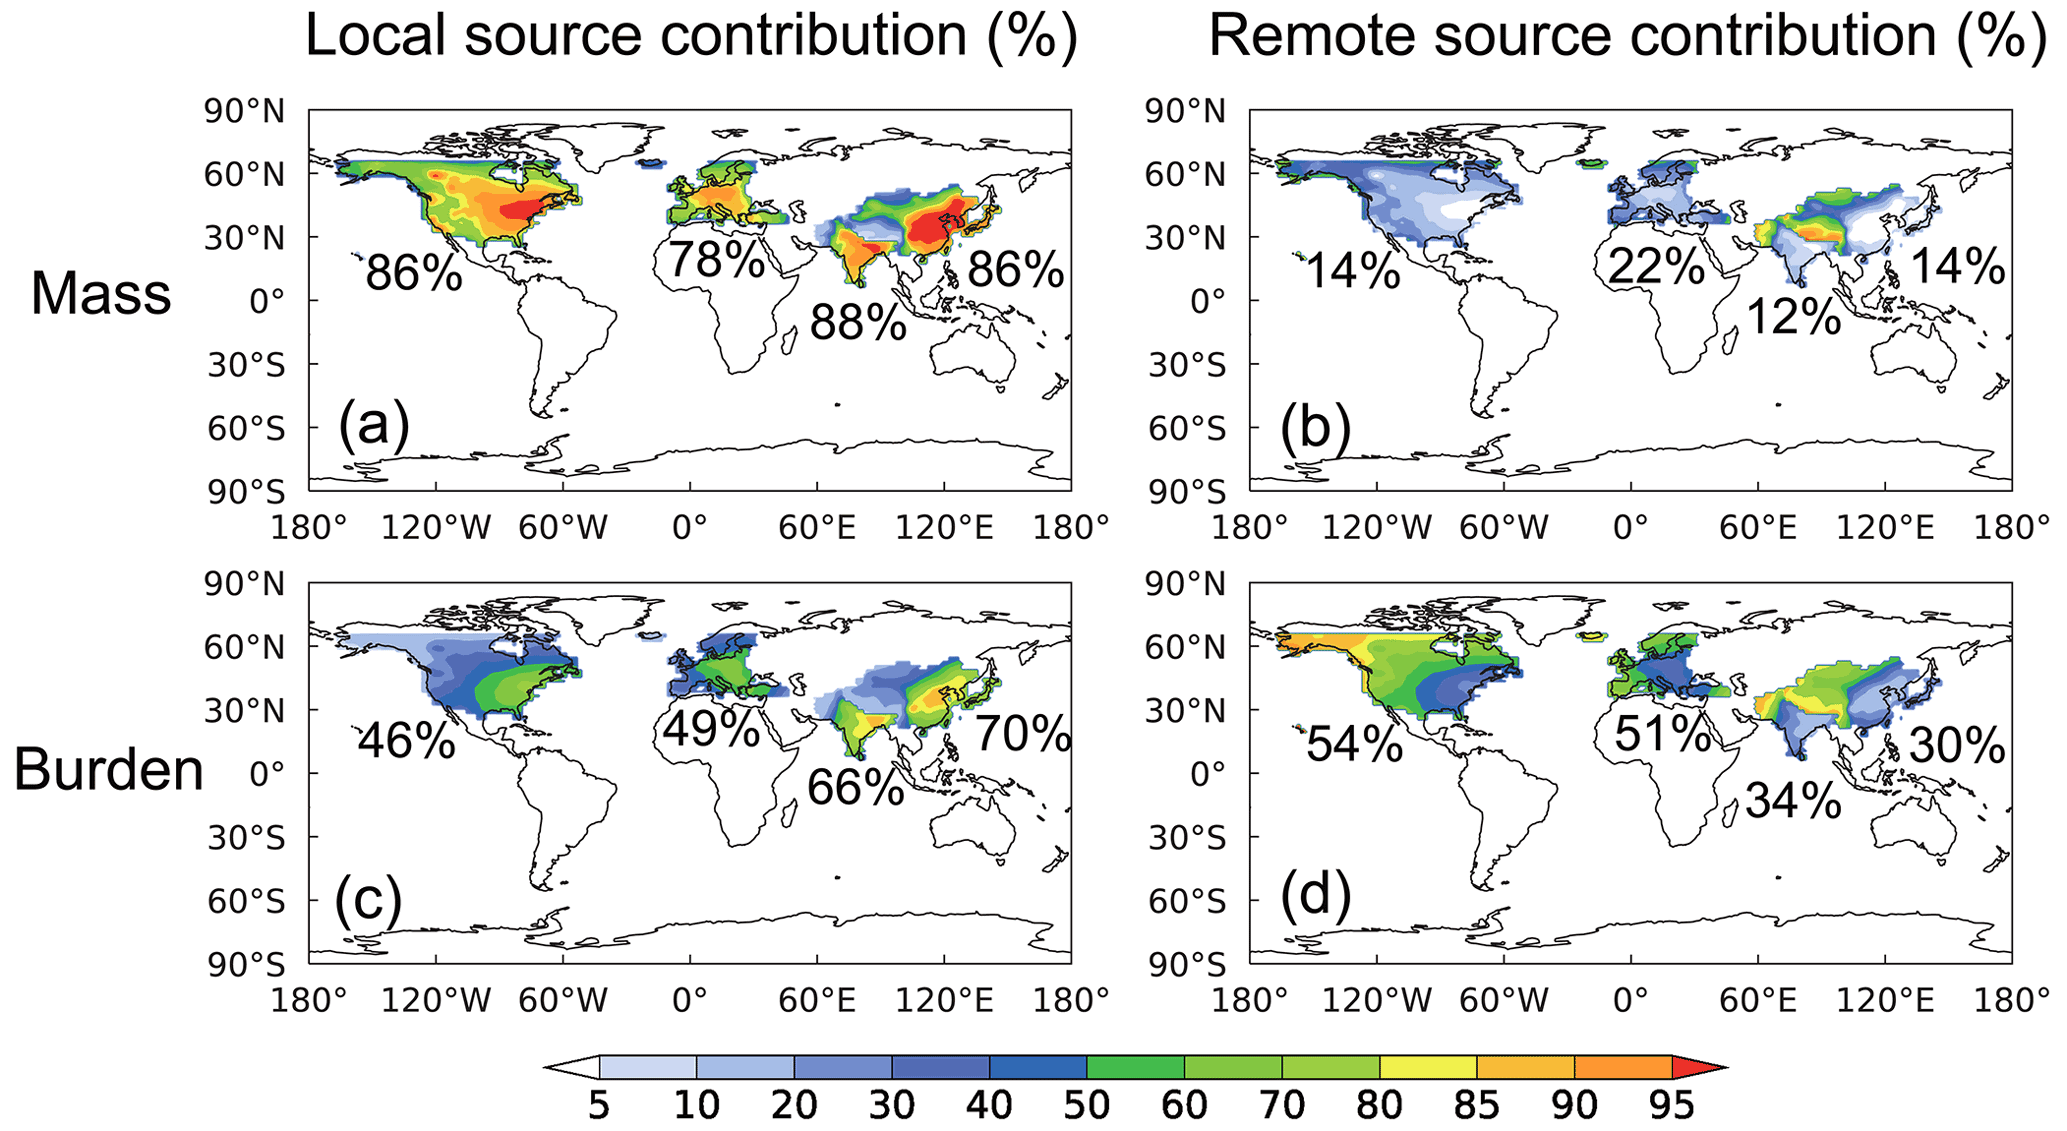
Figure 8Relative contributions (%) from (a, c) local and (b, d) remote anthropogenic emissions to the near-surface mass concentrations and column burdens of PM2.5 in the four targeted regions (NAM, EUR, EAS, and SAS) in 2010. Numbers marked in the figure are the regional average over the four individual targeted regions.
3.1 Historical changes in aerosols over major source regions
Figure 3 shows the variations in anthropogenic emissions of sulfur dioxide (SO2) during the three key periods of historical emission changes from the tagged source regions. Since industrialization, anthropogenic SO2 emissions had rising trends during 1850–1980, especially in Europe and North America. Due to the implementation of clean air actions in Western countries, SO2 emissions in North America and Europe declined considerably during 1980–2010, while the emissions in East Asia and South Asia continued to increase. After 2010, China issued several clean air policies, which led to significant decreases in anthropogenic SO2 emissions in East Asia, while the SO2 emissions in South Asia kept increasing during 2010–2017. The changes in anthropogenic BC and organic carbon (OC) emissions are similar to those of SO2 (shown in Figs. S1 and S2).
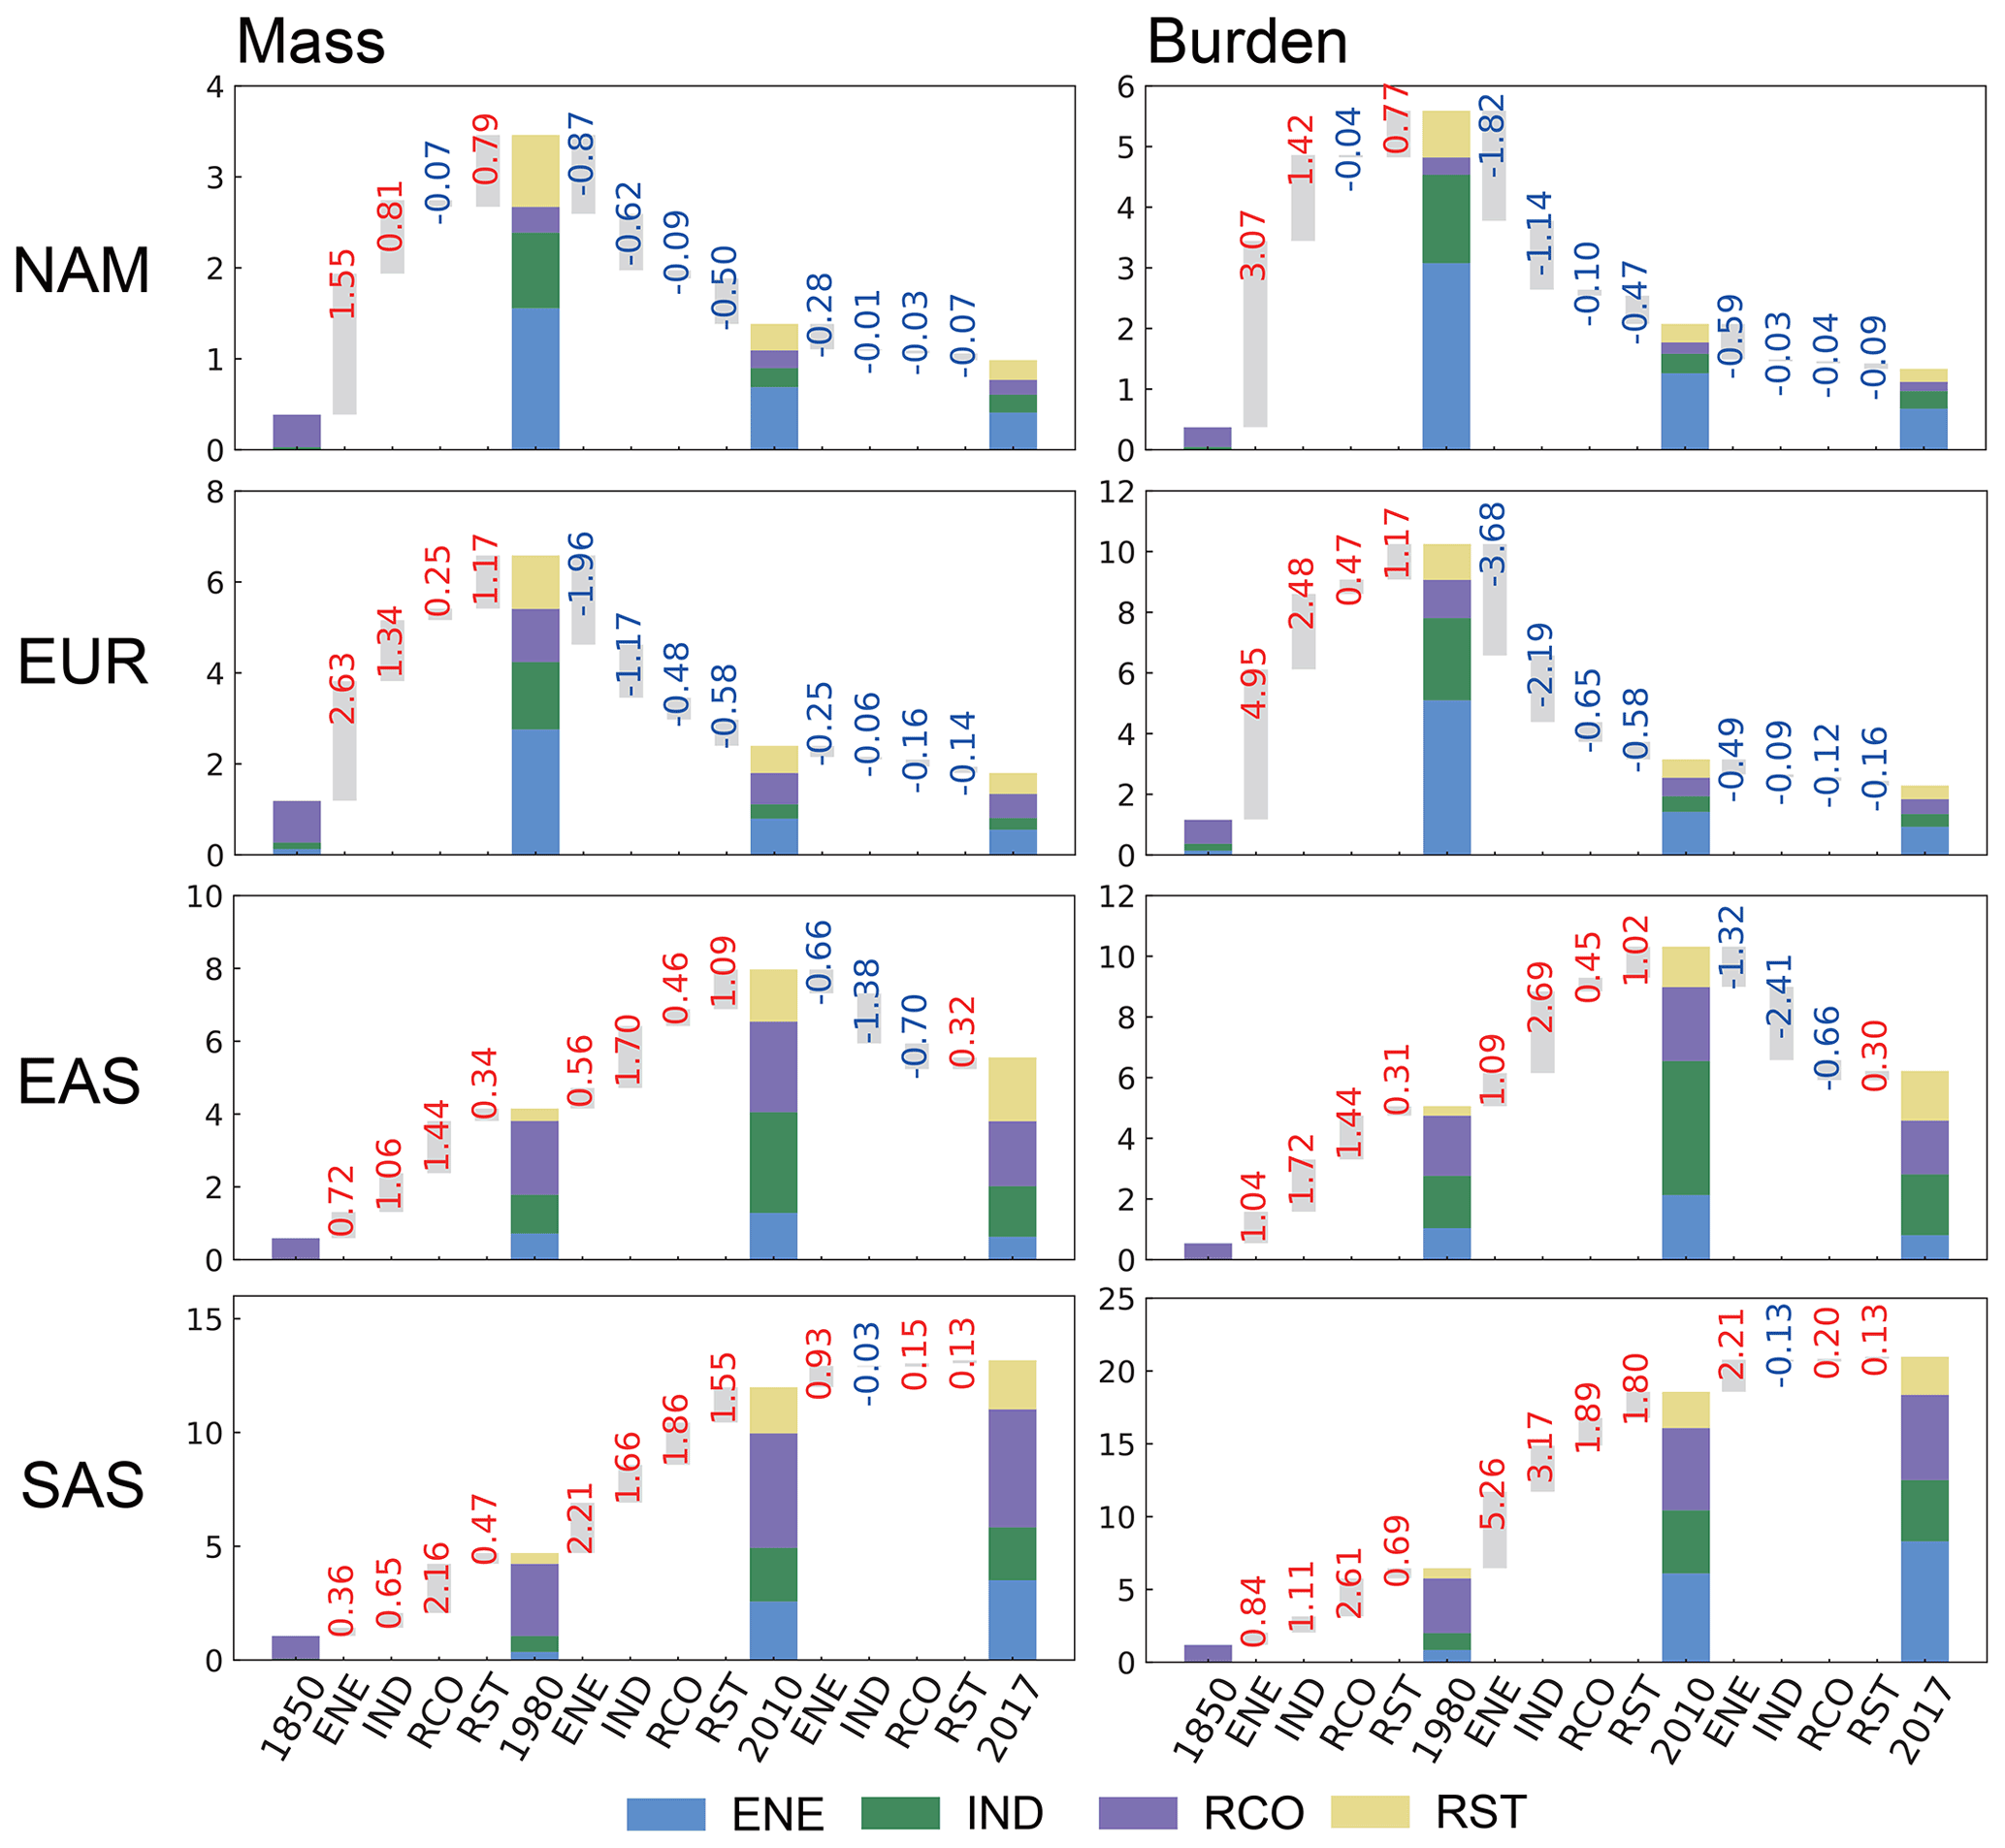
Figure 9Local source contributions from four individual emission sectors (ENE, IND, RCO, and RST) to the near-surface mass concentrations (µg m−3, left) and column burdens (mg m−2, right) of anthropogenic PM2.5 in the four targeted regions (NAM, EUR, EAS, and SAS from top to bottom) for 1850, 1980, 2010, and 2017 (in color bars). Grey bar and numbers in between two years show the change in sector contributions. Positive values are shown in red, and negative values are shown in blue.
The changes in near-surface mass concentrations (Fig. 4) and column burdens (Fig. 5) of anthropogenic PM2.5 contributed by the tagged source regions during the focused three historical time periods follow the corresponding changes in anthropogenic emissions. Column burden refers to the concentration of aerosols contained in the air column above a unit area with a top at 60 km, which can better reflect the aerosol transport within the air column and is more related to the aerosol radiative effect. The near-surface concentration of aerosols represents the concentration of aerosols in the air near the surface (from the surface to 997 hPa for the model layer), which is more related to air quality and human health. Local anthropogenic-emission changes drove the PM2.5 level to reach its peak in 1980 in North America and Europe and then to decrease. The maximum PM2.5 level appeared in 2010 in East Asia, and the anthropogenic PM2.5 level continued growing in South Asia during 1850–2017, consistent with previous studies (Dey et al., 2020; Guttikunda and Nishadh, 2022; Singh et al.,2023).
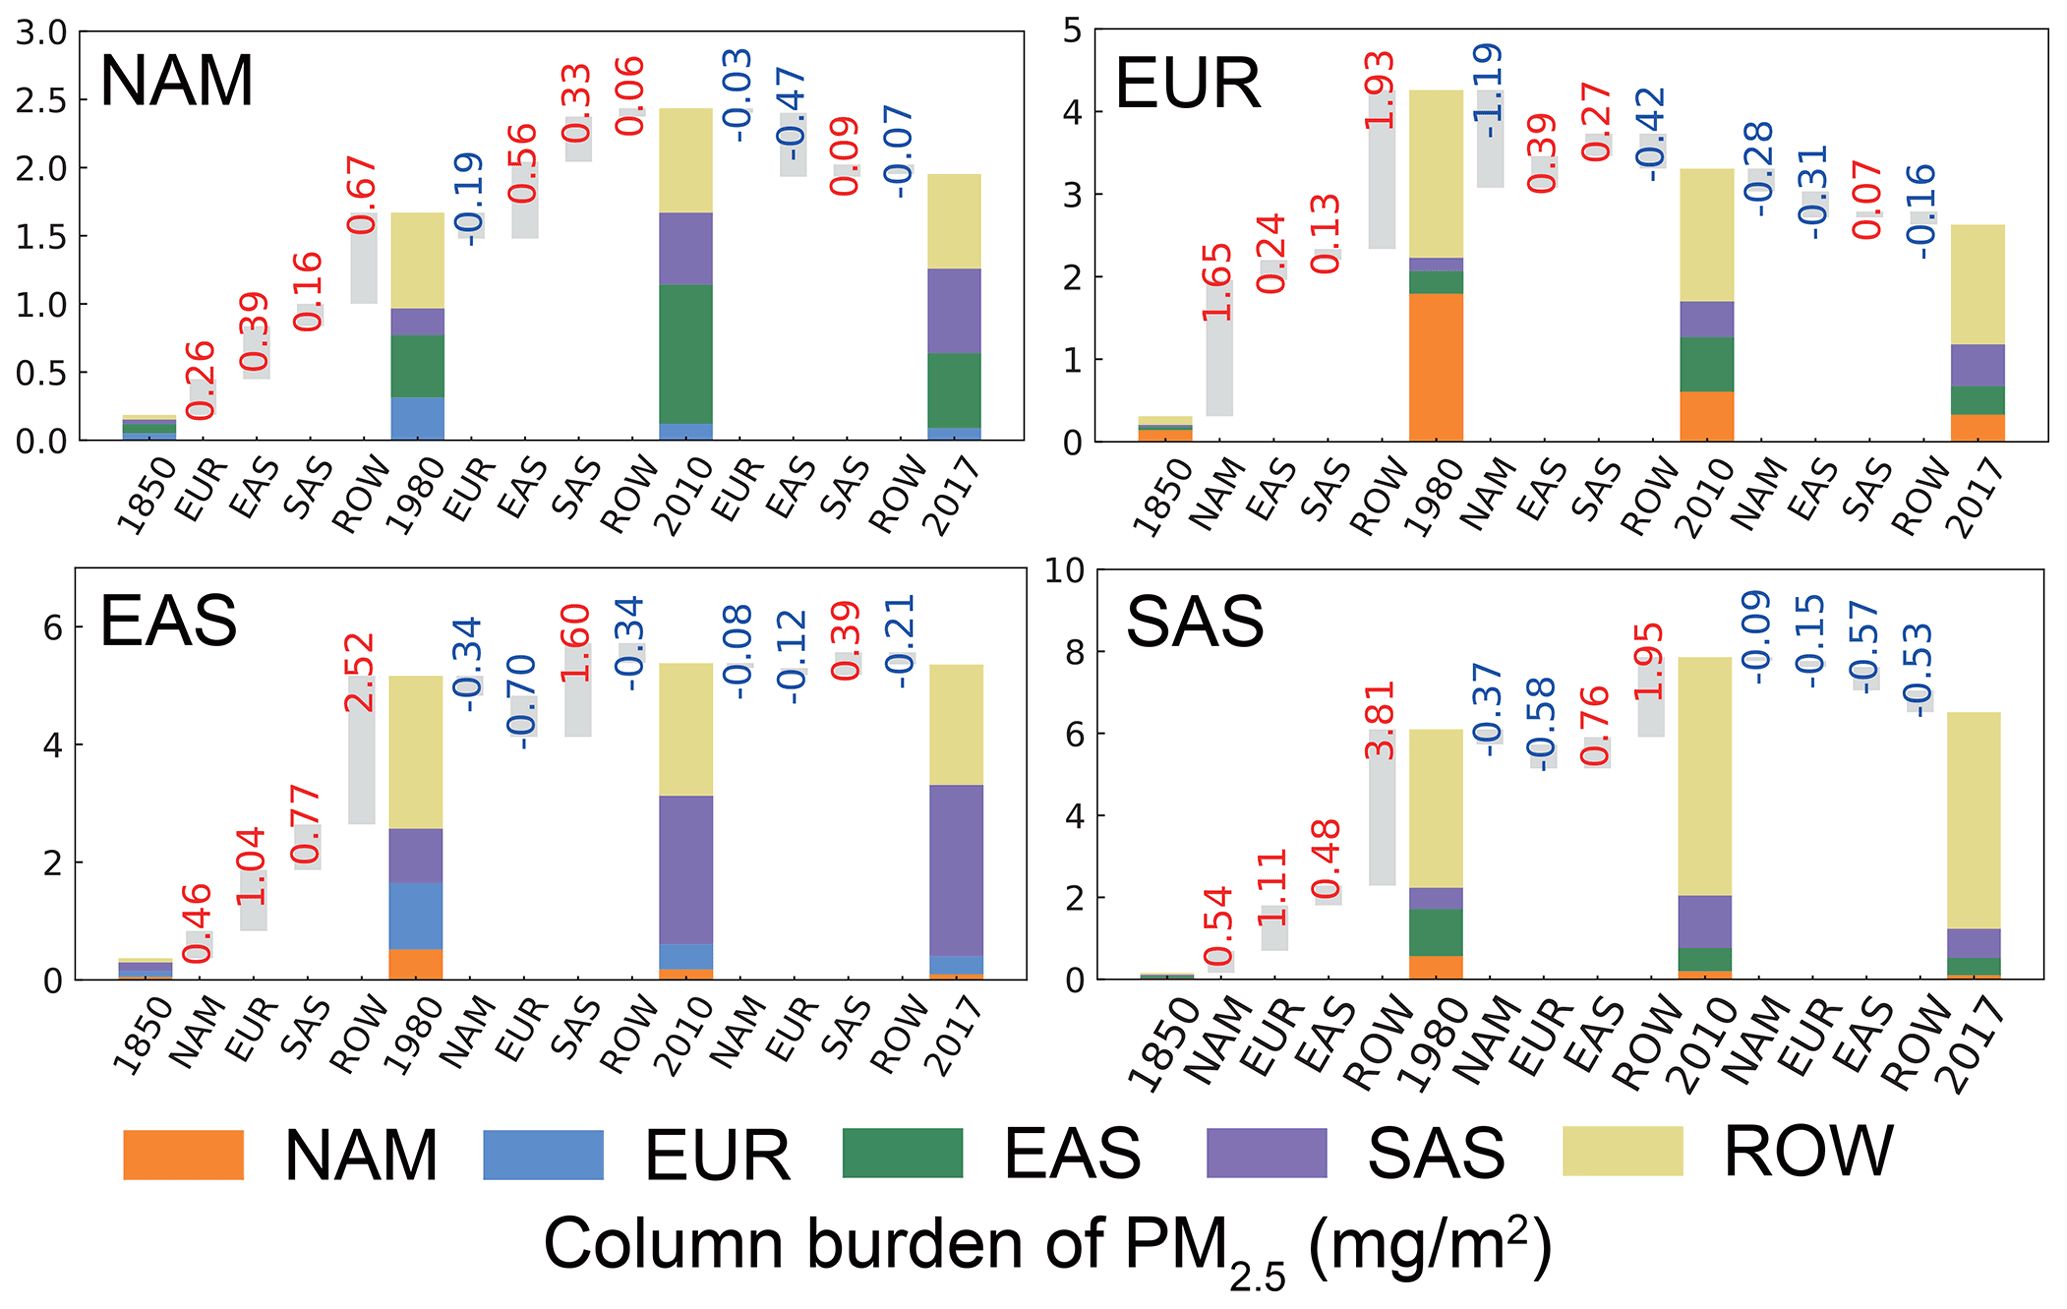
Figure 10Same as Fig. 9 but for contributions from the remote tagged source regions to the column burdens (mg m−2) of anthropogenic PM2.5 in the four targeted regions (NAM, EUR, EAS, and SAS).
To explore which aerosol species contributed the most to the changes in PM2.5 during the focused three historical time periods, Figs. 6 and 7 illustrate the relative contributions of individual aerosols to the simulated changes in near-surface PM2.5 mass concentrations and column burdens, respectively, in four major emission regions. In general, the historical changes in anthropogenic PM2.5 were primarily driven by the changes in sulfate. In North America, the contribution of sulfate to near-surface PM2.5 concentration (column burden) rose from 7 % (11 %) in 1850 to 67 % (81 %) in 1980 and then dropped to 52 % (67 %) in 2017. In Europe, sulfate contribution changed from 24 % (34 %) in 1850 to 71 % (85 %) in 1980 and then decreased to 50 % (68 %) in 2017. In East Asia, sulfate contribution changes from 2 % (6 %) in 1850 to 51 % (71 %) in 1980 and then decreased to 33 % (56 %) in 2017. It is interesting that the PM2.5 levels in East Asia increased during 1980–2010 but the sulfate contribution decreased in this time period. It is because the carbonaceous aerosols increased remarkably, which reduced the fractional contribution of sulfate. The sulfate contribution to the PM2.5 concentration (column burden) increased throughout the period of 1850–2017, from 2 % (5 %) to 42 % (62 %) in South Asia. Note that the carbonaceous aerosols, especially POM, dominated PM2.5 in all four targeted regions in 1850, resulting from the high heating demand from the residential sector.
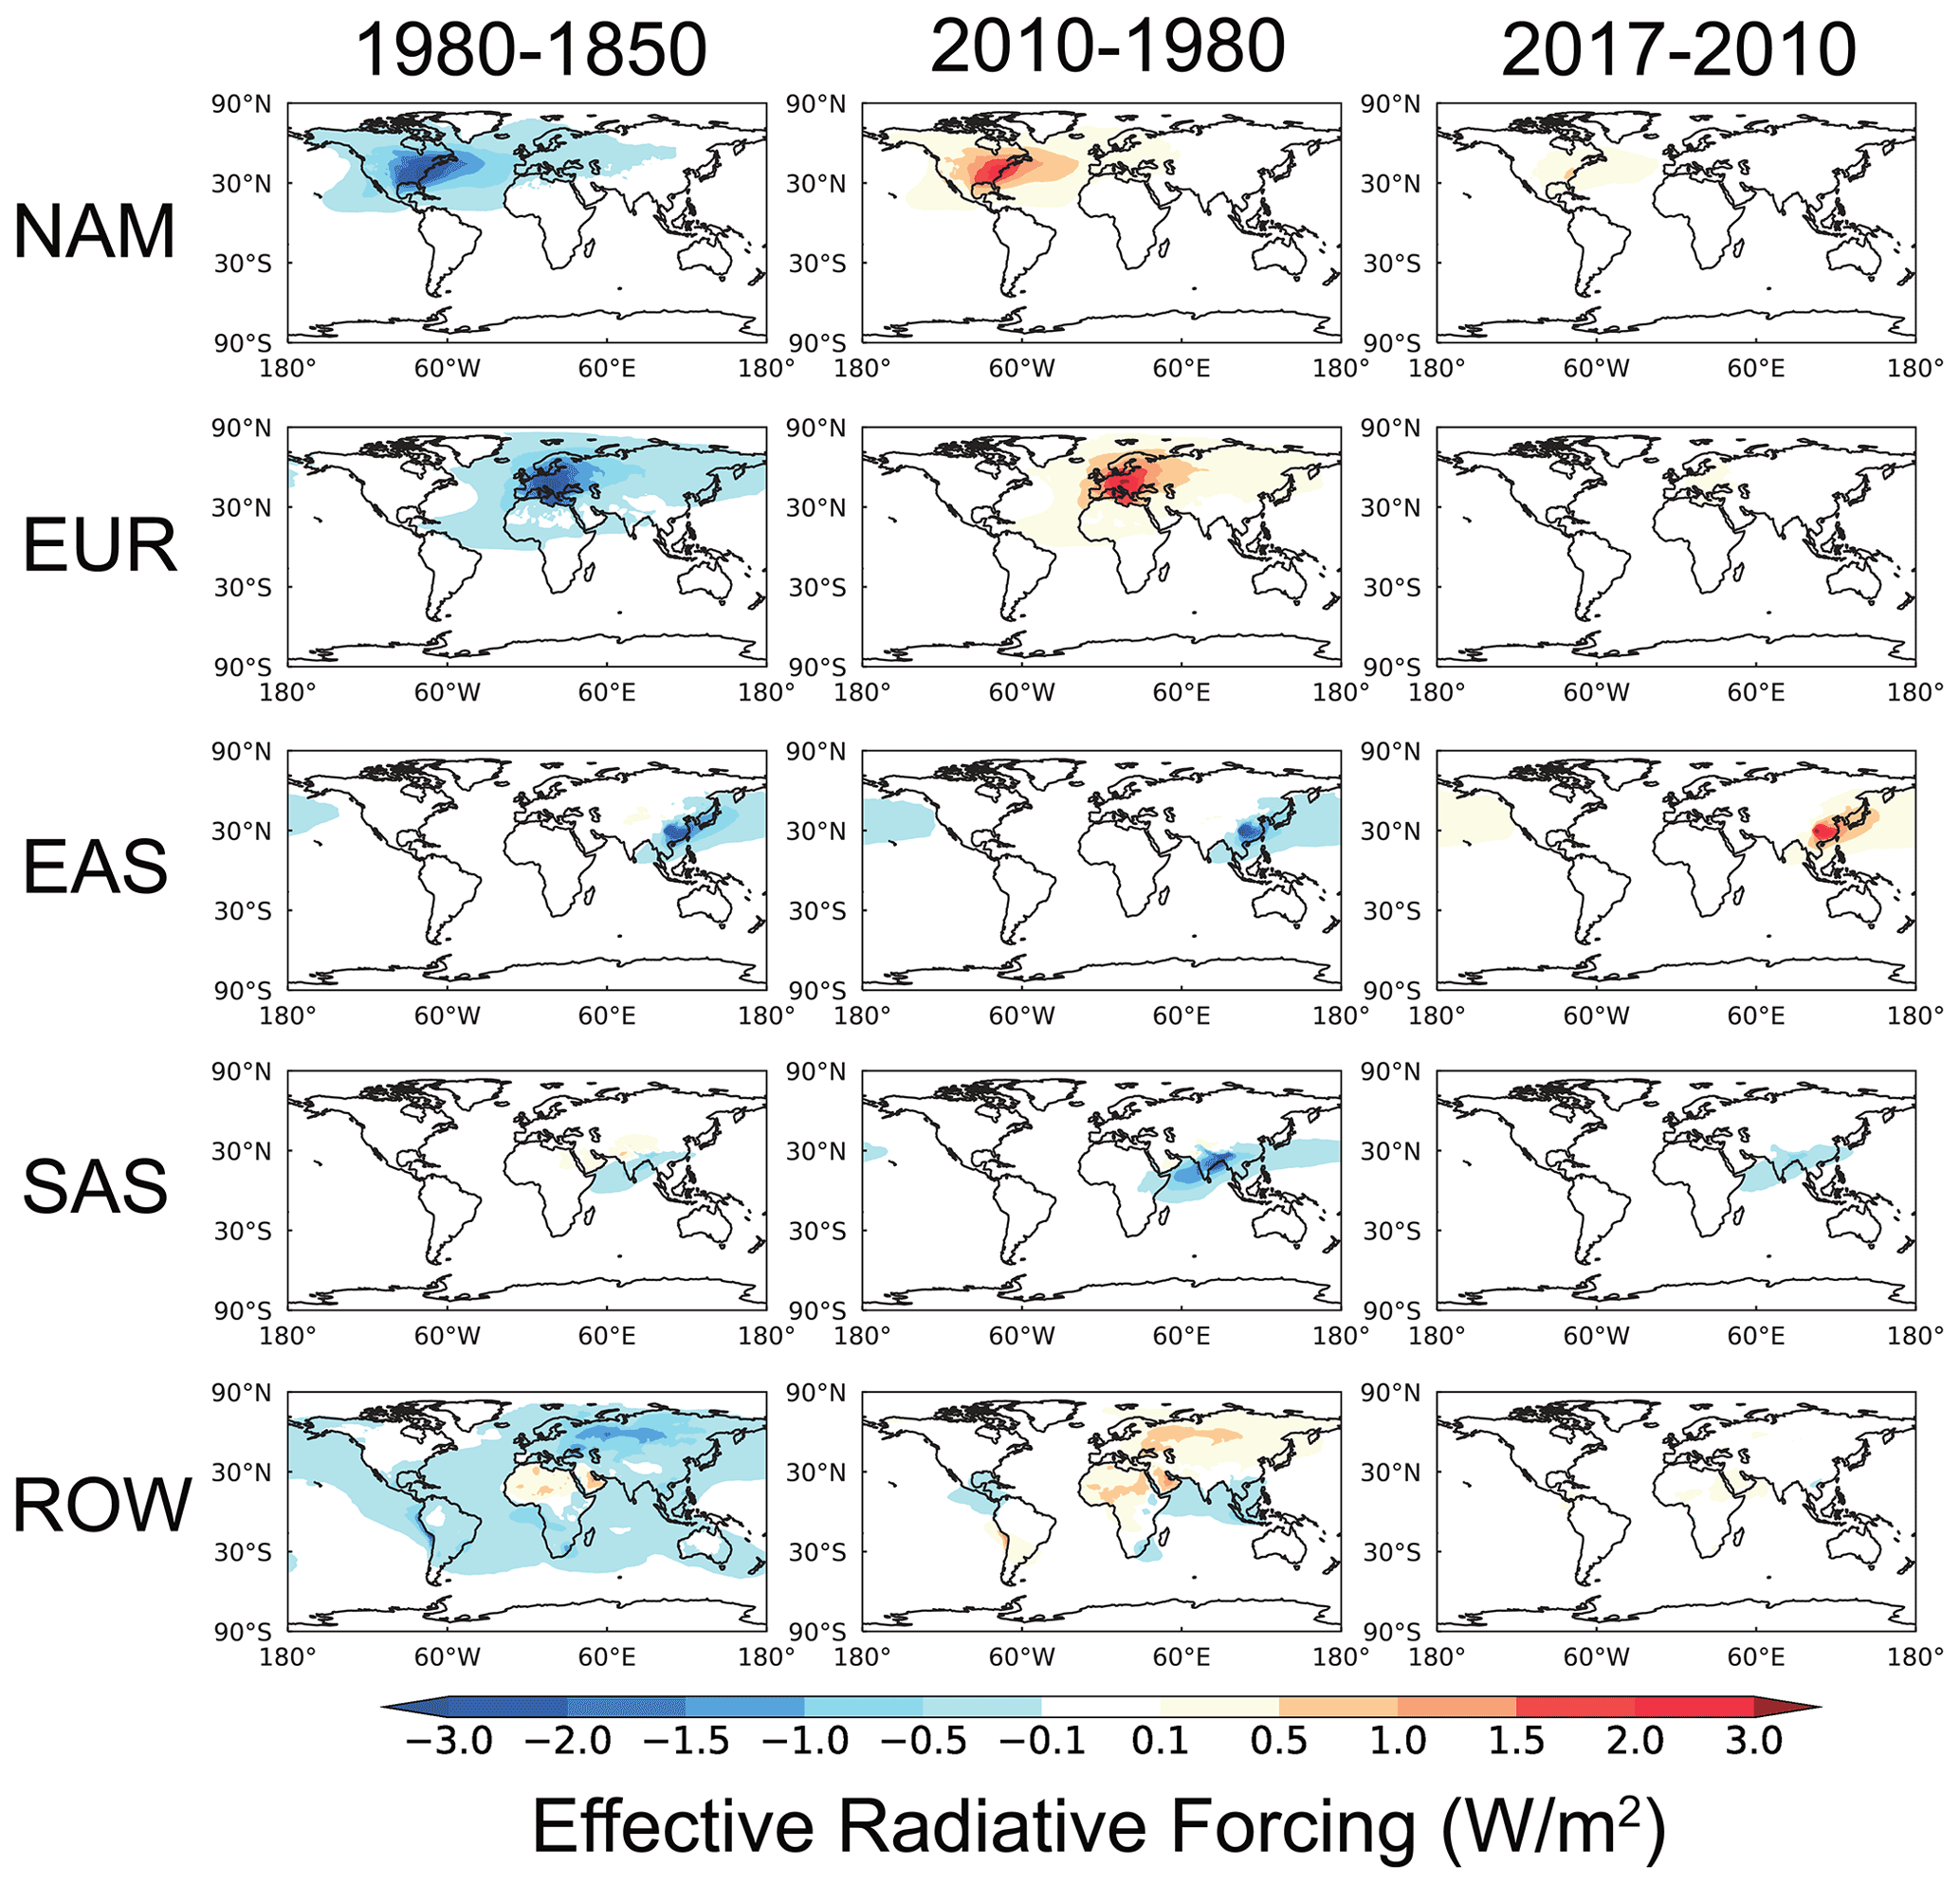
Figure 11Changes in effective radiative forcing (W m−2) at the top of the atmosphere due to aerosol–radiation interactions between 1850 and 1980 (left), between 1980 and 2010 (middle), and between 2010 and 2017 (right) attributed to the changes in anthropogenic emissions from NAM, EUR, EAS, SAS, and ROW (from top to bottom).
3.2 Changes in contributions from major source regions and sectors
Figure 8 shows the relative contributions from local and remote anthropogenic sources to the near-surface concentrations and column burdens of PM2.5 in the four targeted regions in 2010. Local sources dominated the near-surface anthropogenic PM2.5 concentrations over the high-emission regions including eastern China, the eastern US, and the Indo-Gangetic Plain, with local contributions being higher than 90 %. In the regions with low emissions, such as the Tibetan Plateau, the anthropogenic PM2.5 concentrations were largely contributed by the long-range transport of aerosols. The spatial distributions of burden contribution are similar to those of the corresponding contribution near the surface, but the long-range transport contributed more to the column burden than to the near-surface contribution due to the more efficient pollutant transport in the free troposphere than within the boundary layer. The long-range transport contributes 30 %–35 % of the PM2.5 burden in East Asia and South Asia and 50 %–55 % in North America and Europe, much higher than the 10 %–25 % for the near-surface concentrations over the four targeted regions.
Since both local and remote emissions can contribute to anthropogenic PM2.5, it is valuable to know the historical changes in these contributions, especially by the local sources from individual emission sectors and by remote sources from major emission regions. Figure 9 illustrates changes in the local source contributions from major emission sectors to the near-surface concentrations and column burdens of PM2.5 during 1850–2017. In North America and Europe, the historical changes in anthropogenic PM2.5 were largely induced by changes in emissions from the local energy (ENE) sector, followed by the industry (IND) sector, which increased before 1980 and decreased afterward. In East Asia, ENE, IND, and residential (RCO) sector emissions all had significant contributions to the increases in PM2.5 concentration and burden from 1850 to 1980. Then the contribution from the local IND sector showed the largest increases from 1980 to 2010 and decreases from 2010 to 2017. In South Asia, increases in anthropogenic PM2.5 from 1850 to 1980 were mainly attributed to the RCO emission increases. After that, increases in ENE emissions dominated the rising PM2.5 levels in South Asia during 1980–2017.
Figure 10 presents changes in remote emission contributions from the tagged source regions to the column burdens of PM2.5 during 1850–2017. The contributions from long-range transport to the near-surface concentrations and their historical variations over the four major emissions regions are relatively small, which were also reported in previous studies (e.g., Yang et al., 2018b) and are not discussed here. During 1850–1980, the long-range transport contributions to the PM2.5 burdens show increases and the contributions from ROW increased the most among the tagged source regions over all four targeted receptor regions. Note that aerosol emissions from North America contributed to the increase in the European PM2.5 burden by 1.7 mg m−2 and sources from Europe were also responsible for the PM2.5 burden increase by 1.0 mg m−2 in East Asia and 1.1 mg m−2 in South Asia. During 1980–2010, the long-range transport from North America and Europe decreased but that from East Asia and South Asia increased. East Asia contributed 0.4–0.6 mg m−2 to the PM2.5 burden increases in North America, while Europe and South Asia contributed about 0.3 mg m−2. In East Asia, 1.6 mg m−2 of the PM2.5 burden increase was attributed to South Asian sources, and 0.8 mg m−2 of the PM2.5 burden increase in South Asia during this time period was due to increases in East Asian emissions. From 2010 to 2017, owing to the clean air actions in China, contributions from East Asia to the PM2.5 burdens in the other three targeted regions decreased by 0.3–0.6 mg m−2. However, due to the continuous increases in South Asian emissions, South Asia still contributed to the PM2.5 burden increase in East Asia by 0.4 mg m−2 during this short time period.
3.3 Changes in effective radiative forcing due to aerosol–radiation interactions
The variation in aerosols can have a significant impact on ERF through aerosol–radiation and aerosol–cloud interactions. Figure 11 shows changes in ERF due to aerosol–radiation interactions (ERFari) at the top of the atmosphere (TOA) that can be attributed to changes in anthropogenic emissions from the tagged regions in the three key periods during 1850–2017. Due to the increases in aerosols from 1850 to 1980, a large negative ERFari was located over the major source regions and their downwind areas, with maximum ERFari changes being larger than 2 W m−2 over the eastern US, Europe, and eastern China. In 2010, there were positive ERFari changes (warming effect) by a maximum of 2 W m−2 in North America and Europe compared to 1980, which were due to the decreases in anthropogenic aerosols in these two regions. The positive ERFari changes due to the decrease in North American aerosols extended across the North Atlantic and caused an increase in incoming radiation by up to 0.5 W m−2 in Europe. Similarly, the decrease in aerosols from Europe also led to a positive ERFari change by up to 0.5 W m−2 in the downwind regions including Russia and northern China during 1980–2010. This is also revealed by previous studies that aerosol reduction has caused fast warming in downwind regions (Urdiales-Flores et al., 2023). Increases in aerosols in China during 1980–2010 and decreases during 2010–2017 produced negative (cooling) and positive (warming) changes in ERFari, respectively, over eastern China and the North Pacific, which largely contradicted each other. The continuously growing aerosols in South Asia induced negative ERFari changes (cooling) in South Asia, Southeast Asia, and southern China during both 1980–2010 and 2010–2017. Note that in this study we only quantify ERFari for the major emission regions based on the source-tagging technique. The quantification of ERF due to aerosol–cloud interactions (ERFari) requires additional simulations, which could be further examined in future studies.
Since the start of industrialization, aerosols have changed significantly in different regions of the world driven by global economic development and air pollution control measures. It is of great significance to quantify the contributions of aerosols from major emission source regions and sectors during the key periods of substantial emission changes. In this study, the Explicit Aerosol Source Tagging (EAST) technique is implemented in E3SMv1 to quantify the variations in the concentrations, source contributions, and subsequent effective radiative forcing of anthropogenic aerosols in four major source regions (NAM, EUR, EAS, and SAS) during three key historical periods of emission changes (1850–1980, 1980–2010, and 2010–2017).
Following the corresponding anthropogenic-emission changes, PM2.5 concentrations reached its peak in 1980 in North America and Europe, while the peak of PM2.5 in East Asia occurred in 2010. PM2.5 from anthropogenic sources in South Asia continued to grow during 1850–2017. These changes in anthropogenic PM2.5 were primarily dominated by changes in sulfate aerosol. In North America and Europe, historical changes in anthropogenic PM2.5 were mainly caused by changes in emissions from the local energy sector, followed by the industrial sector, which increased from 1850 to 1980 and decreased afterward. In East Asia, energy, industrial, and residential emissions contributed significantly to the increase in PM2.5 from 1850 to 1980, and then the local industrial sector caused the most increase from 1980 to 2010 and declined from 2010 to 2017. For South Asia, the increase in PM2.5 was mainly due to emission changes in the residential sector from 1850 to 1980, and then the increase in energy-related emissions became dominant in the rise in PM2.5 levels during 1980–2017.
Regional aerosol pollution comes from both local emissions and the long-range transport of remote emissions. Local emissions contribute the most in regions with high emissions, while in regions with low emissions the long-distance transport plays an important role. Due to the more efficient transport of air pollutants in the free troposphere, contributions of long-range transport to the column burden are greater than to the near-surface concentration over all four targeted receptor regions. From 1850 to 1980, increases in emissions from North America contributed to the increase in the European PM2.5 burden by 1.7 mg m−2 and emissions from Europe were also responsible for the PM2.5 burden increase by 1.0 mg m−2 in East Asia and 1.1 mg m−2 in South Asia. From 1980 to 2010, long-range transport from North America and Europe decreased, while that from East Asia and South Asia increased. East Asia contributed 0.4–0.6 mg m−2 to the PM2.5 burden increases in North America, while Europe and South Asia contributed about 0.3 mg m−2. In East Asia, 1.6 mg m−2 of the PM2.5 burden increase was attributed to South Asian sources, and 0.8 mg m−2 of the PM2.5 burden increase in South Asia during this time period was due to the increases in East Asian emissions. From 2010 to 2017, the contributions from East Asia to the PM2.5 burdens in the other three targeted regions declined by 0.3–0.6 mg m−2 due to clean air actions in China. However, due to the continuous increase in emissions in South Asia, the PM2.5 burden in East Asia still increased by 0.4 mg m−2.
Changes in aerosols can have a significant impact on ERF, which further imposes an impact on climate. Large negative ERFari levels appeared over the major source regions and their downwind areas during 1850–1980 due to the increases in aerosol emissions, with maximum ERFari changes being larger than 2 W m−2 over eastern North America, Europe, and eastern China. From 1980 to 2010, a positive ERFari change caused by a decline in North American aerosols extended over the North Atlantic, resulting in a warming of up to 0.5 W m−2 in Europe. Meanwhile, a decline in aerosols in Europe also caused warming of up to 0.5 W m−2 in Russia and northern China. The changes in ERFari from the increase (from 1980 to 2010) and decrease (from 2010 to 2017) of aerosols in China had an opposite sign. The continuous aerosol increases in South Asia from 1980 to 2017 resulted in negative ERFari changes in South Asia, Southeast Asia, and southern China.
This study provides an in-depth analysis of historical changes in anthropogenic aerosol concentrations, compositions, source contributions, and radiative impacts in the four major emission source regions across the globe, which has important implications for pollution prevention and control measures and decision-making for global collaboration. The spatial distribution and changes in anthropogenic aerosols are similar to those reported in previous studies (Hoesly et al., 2018; Lim et al., 2020). However, we also note that E3SMv1 underestimates the near-surface PM2.5 concentrations in Europe and East Asia, which could lead to an underestimate of the corresponding radiative and climate impact. Our analysis focuses on aerosols from anthropogenic emissions; however, with increasing attention to air quality in many countries around the world, anthropogenic aerosol concentrations are declining and contributions from biomass burning aerosols are becoming more and more important. The source contributions and impacts of biomass burning aerosols will be investigated in our future work. Also, this study only quantifies ERFari for individual major emission regions based on the source-tagging technique and radiation diagnostic calculations. The quantification of ERFari requires additional simulations, which could be further examined in future studies.
The E3SMv1 model is available at https://github.com/E3SM-Project/E3SM (E3SM, 2024) (https://doi.org/10.11578/E3SM/dc.20180418.36; E3SM Project, 2018). Our results can be made available upon request.
The supplement related to this article is available online at: https://doi.org/10.5194/acp-24-6509-2024-supplement.
YY designed the research, added the tagging code, and performed simulations; SM analyzed the data. All authors including HW, PW, and HL discussed the results and wrote the paper.
At least one of the (co-)authors is a member of the editorial board of Atmospheric Chemistry and Physics. The peer-review process was guided by an independent editor, and the authors also have no other competing interests to declare.
Publisher's note: Copernicus Publications remains neutral with regard to jurisdictional claims made in the text, published maps, institutional affiliations, or any other geographical representation in this paper. While Copernicus Publications makes every effort to include appropriate place names, the final responsibility lies with the authors.
Hailong Wang acknowledges the support by the US Department of Energy (DOE) Office of Science Biological and Environmental Research (BER) program, as part of the Earth and Environmental System Modeling program. The Pacific Northwest National Laboratory (PNNL) is operated for the DOE by the Battelle Memorial Institute (contract no. DE-AC05-76RLO1830).
This study was supported by the National Key Research and Development Program of China (grant no. 2020YFA0607803), Jiangsu Science Fund for Distinguished Young Scholars (grant no. BK20211541), and the Jiangsu Science Fund for Carbon Neutrality (grant no. BK20220031).
This paper was edited by Maria Kanakidou and reviewed by two anonymous referees.
Abdul-Razzak, H. and Ghan, S. J.: A parameterization of aerosol activation, 2. Multiple aerosol types, J. Geophys. Res., 105, 6837–6844, https://doi.org/10.1029/1999JD901161, 2000.
Akimoto, H.: Global Air Quality and Pollution, Science, 302, 1716–1719, https://doi.org/10.1126/science.1092666, 2003.
Anenberg, S. C., Horowitz, L. W., Tong, D. Q., and West, J. J.: An Estimate of the Global Burden of Anthropogenic Ozone and Fine Particulate Matter on Premature Human Mortality Using Atmospheric Modeling, Environ. Health Persp., 118, 1189–1195, https://doi.org/10.1289/ehp.0901220, 2010.
Anenberg, S. C., West, J. J., Yu, H., Chin, M., Schulz, M., Bergmann, D., Bey, I., Bian, H., Diehl, T., Fiore, A., Hess, P., Marmer, E., Montanaro, V., Park, R., Shindell, D., Takemura, T., and Dentener, F.: Impacts of intercontinental transport of anthropogenic fine particulate matter on human mortality, Air Qual. Atmos. Hlth., 7, 369–379, https://doi.org/10.1007/s11869-014-0248-9, 2014.
Carslaw, K. S., Gordon, H., Hamilton, D. S., Johnson, J. S., Regayre, L. A., Yoshioka, M., and Pringle, K. J.: Aerosols in the Pre-industrial Atmosphere, Curr. Clim. Change Rep., 3, 1–15, https://doi.org/10.1007/s40641-017-0061-2, 2017.
Chen, D., Liao, H., Yang, Y., Chen, L., and Wang, H.: Simulated aging processes of black carbon and its impact during a severe winter haze event in the Beijing–Tianjin–Hebei region, Sci. Total Environ., 755, 142712, https://doi.org/10.1016/j.scitotenv.2020.142712, 2021.
Chin, M., Diehl, T., Ginoux, P., and Malm, W.: Intercontinental transport of pollution and dust aerosols: implications for regional air quality, Atmos. Chem. Phys., 7, 5501–5517, https://doi.org/10.5194/acp-7-5501-2007, 2007.
David, L. M., Ravishankara, A. R., Kodros, J. K., Pierce, J. R., Venkataraman, C., and Sadavarte, P.: Premature mortality due to PM2.5 over India: Effect of atmospheric transport and anthropogenic emissions, Geohealth, 3, 2–10, https://doi.org/10.1029/2018GH000169, 2019.
Dey, S., Purohit, B., Balyan, P., Dixit, K., Bali, K., Kumar, A., Imam, F., Chowdhury, S., Ganguly, D., Gargava, P., and Shukla, V. K.: A satellite-based high-resolution (1-km) ambient PM2.5 database for India over two decades (2000–2019): applications for air quality management, Remote Sens., 12, 3872, https://doi.org/10.3390/rs12233872, 2020.
E3SM: E3SM-Project, GitHub [data set], https://github.com/E3SM-Project/E3SM (last access: 1 October 2022), 2024.
E3SM Project, DOE: Energy Exascale Earth System Model v1.0, Computer Software [code], https://doi.org/10.11578/E3SM/dc.20180418.36, 2018.
Finlayson-Pitts, B. J. and Pitts, J. N.: Tropospheric Air Pollution: Ozone, Airborne Toxics, Polycyclic Aromatic Hydrocarbons, and Particles, Science, 276, 1045–1051, https://doi.org/10.1126/science.276.5315.1045, 1997.
Gao, J., Yang, Y., Wang, H., Wang, P., Li, H., Li, M., Ren, L., Yue, X., and Liao, H.: Fast climate responses to emission reductions in aerosol and ozone precursors in China during 2013–2017, Atmos. Chem. Phys., 22, 7131–7142, https://doi.org/10.5194/acp-22-7131-2022, 2022.
Gao, J., Yang, Y., Wang, H., Wang, P., Li, B., Li, J., Wei, J., Gao, M., and Liao, H.: Climate responses in China to domestic and foreign aerosol changes due to clean air actions during 2013–2019, npj Clim. Atmos. Sci., 6, 160, https://doi.org/10.1038/s41612-023-00488-y, 2023.
Gao, M., Beig, G., Song, S., Zhang, H., Hu, J., Ying, Q., Liang, F., Liu, Y., Wang, H., Lu, X., Zhu, T., Carmichael, G. R., Nielsen, C. P., and McElroy, M. B.: The impact of power generation emissions on ambient PM2.5 pollution and human health in China and India, Environ. Int., 121, 250–259, https://doi.org/10.1016/j.envint.2018.09.015, 2018.
Gelaro, R., McCarty, W., Suaírez, M. J., Todling, R., Molod, A., Takacs, L., Randles, C. A., Darmenov, A., Bosilovich, M. G., Reichle, R., Wargan, K., Coy, L., Cullather, R., Draper, C., Akella, S., Buchard, V., Conaty, A., da Silva, A. M., Gu, W., Kim, G., Koster, R., Lucchesi, R., Merkova, D., Nielsen, J. E., Partyka, G., Pawson, S., Putman, W., Rienecker, M., Schubert, S. D., Sienkiewicz, M., and Zhao, B.: The Modern-Era Retrospective Analysis for Research and Applications, Version 2 (MERRA-2), J. Climate, 30, 5419–5454, https://doi.org/10.1175/JCLI-D-16-0758.1, 2017.
Gettelman, A. and Morrison, H.: Advanced two-moment bulk microphysics for global models. Part I: Off-line tests and comparison with other schemes, J. Clim., 28, 1268–1287, https://doi.org/10.1175/JCLI-D-14-00102.1, 2015.
Ghan, S. J.: Technical Note: Estimating aerosol effects on cloud radiative forcing, Atmos. Chem. Phys., 13, 9971–9974, https://doi.org/10.5194/acp-13-9971-2013, 2013.
Ghan, S. J. and Zaveri, R. A.: Parameterization of optical properties for hydrated internally mixed aerosol, J. Geophys. Res.-Atmos., 112, D10201, https://doi.org/10.1029/2006JD007927, 2007.
Golaz, J. C., Caldwell, P. M., Van Roekel, L. P., Petersen, M. R., Tang, Q., Wolfe, J. D., Abeshu, G., Anantharaj, V., Asay-Davis, X. S., Bader, D. C., Baldwin, S. A., Bisht, G., Bogenschutz, P. A., Branstetter, M., Brunke, M. A., Brus, S. R., Burrows, S. M., Cameron-Smith, P. J., Donahue, A. S., Deakin, M., Easter, R. C., Evans, K. J., Feng, Y., Flanner, M., Foucar, J. G., Fyke, J. G., Griffin, B. M., Hannay, C., Harrop, B. E., Hoffman, M. J., Hunke, E. C., Jacob, R. L., Jacobsen, D. W., Jeffery, N., Jones, P. W., Keen, N. D., Klein, S. A., Larson, V. E., Leung, L. R., Li, H. Y., Lin, W., Lipscomb, W. H., Ma, P., Mahajan, S., Maltrud, M. E., Mametjanov, A., McClean, J. L., McCoy, R. B., Neale, R. B., Price, S. F., Qian, Y., Rasch, P. J., Eyre, J. E. J. R., Riley, W. J., Ringler, T. D., Roberts, A. F., Roesler, E. L., Salinger, A. G., Shaheen, Z., Shi, X., Singh, B., Tang, J., Taylor, M. A., Thornton, P. E., Turner, A. K., Veneziani, M., Wan, H., Wang, H., Wang, S., Williams, D. N., Wolfram, P. J., Worley, P. H., Xie, S., Yang Y., Yoon, J., Zelinka, M. D., Zender, C. S., Zeng, X., Zhang, C., Zhang, K., Zhang, Y., Zheng, X., Zhou, T., and Zhu, Q.: The DOE E3SM Coupled Model Version 1: Overview and Evaluation at Standard Resolution, J. Adv. Model. Earth Sy., 11, 2089–2129. https://doi.org/10.1029/2018MS001603, 2019.
Goss, M., Swain, D. L., Abatzoglou, J. T., Sarhadi, A., Kolden, C. A., Williams A. P., and Diffenbaugh, N. S.: Climate change is increasing the likelihood of extreme autumn wildfire conditions across California, Environ. Res. Lett., 15, 094016, https://doi.org/10.1088/1748-9326/ab83a7, 2020.
Guttikunda, S. and Nishadh, K. A.: Evolution of India's PM2.5 pollution between 1998 and 2020 using global reanalysis fields coupled with satellite observations and fuel consumption patterns, Environ. Sci. Atmos., 2, 1502–1515, https://doi.org/10.1039/D2EA00027J, 2022.
Hoesly, R. M., Smith, S. J., Feng, L., Klimont, Z., Janssens-Maenhout, G., Pitkanen, T., Seibert, J. J., Vu, L., Andres, R. J., Bolt, R. M., Bond, T. C., Dawidowski, L., Kholod, N., Kurokawa, J.-I., Li, M., Liu, L., Lu, Z., Moura, M. C. P., O'Rourke, P. R., and Zhang, Q.: Historical (1750–2014) anthropogenic emissions of reactive gases and aerosols from the Community Emissions Data System (CEDS), Geosci. Model Dev., 11, 369–408, https://doi.org/10.5194/gmd-11-369-2018, 2018.
Jaffe, D., Anderson, T., Covert, D., Kotchenruther, R., Trost, B., Danielson, J., Simpson, W., Berntsen, T., Karlsdottir, S., Blake, D., Harris, J., Carmichael, G., and Uno, I.: Transport of Asian air pollution to North America, Geophys. Res. Lett., 26, 711–714, https://doi.org/10.1029/1999GL900100, 1999.
Jolly, W. M., Cochrane, M. A., Freeborn, P. H., Holden, Z. A., Brown, T. J., Williamson, G. J., and Bowman, D. M. J. S.: Climate-induced variations in global wildfire danger from 1979 to 2013, Nat. Commun., 6, 7537, https://doi.org/10.1038/ncomms8537, 2015.
Li, C., McLinden, C., Fioletov, V., Krotkov, N., Carn, S., Joiner, J., Streets, D., He, H., Ren, X., Li, Z., and Dickerson, R.: India Is Overtaking China as the World's Largest Emitter of Anthropogenic Sulfur Dioxide, Sci. Rep.-UK, 7, 14304, https://doi.org/10.1038/s41598-017-14639-8, 2017.
Li, H., Yang, Y., Wang, H., Li, B., Wang, P., Li, J., and Liao, H.: Constructing a spatiotemporally coherent long-term PM2.5 concentration dataset over China using a machine learning approach, Sci. Total Environ., 765, 144263, https://doi.org/10.1016/j.scitotenv.2020.144263, 2021.
Liao, H., Chang, W., and Yang, Y.: Climatic effects of air pollutants over China: A review, Adv. Atmos. Sci., 32, 115–139, https://doi.org/10.1007/s00376-014-0013-x, 2015.
Lim, C.-H., Ryu, J., Choi, Y., Jeon, S. W., and Lee, W.-K.: Understanding global PM2.5 concentrations and their drivers in recent decades (1998–2016), Environ. Int., 144, 106011, https://doi.org/10.1016/j.envint.2020.106011, 2020.
Lin, J., Pan, D., Davis, S. J., Zhang, Q., He, K., Wang, C., Streets, D. G., Wuebbles, D. J., and Guan, D.: China's international trade and air pollution in the United States, P. Natl. Acad. Sci. USA, 111, 1736–1741, https://doi.org/10.1073/pnas.1312860111, 2014.
Liu, J., and Mauzerall, D.: Estimating the average time for inter-continental transport of air pollutants, Geophys. Res. Lett., 32, L11814, https://doi.org/10.1029/2005GL022619, 2005.
Liu, J., Mauzerall, D. L., Horowitz, L. W., Ginoux, P., and Fiore, A. M.: Evaluating inter-continental transport of fine aerosols: (1) Methodology, global aerosol distribution and optical depth, Atmos. Environ., 43, 4327–4338, https://doi.org/10.1016/j.atmosenv.2009.03.054, 2009.
Liu, X., Ma, P.-L., Wang, H., Tilmes, S., Singh, B., Easter, R. C., Ghan, S. J., and Rasch, P. J.: Description and evaluation of a new four-mode version of the Modal Aerosol Module (MAM4) within version 5.3 of the Community Atmosphere Model, Geosci. Model Dev., 9, 505–522, https://doi.org/10.5194/gmd-9-505-2016, 2016.
Lohmann, U. and Feichter, J.: Global indirect aerosol effects: a review, Atmos. Chem. Phys., 5, 715–737, https://doi.org/10.5194/acp-5-715-2005, 2005.
Lou, S., Yang, Y., Wang, H., Smith, S. J., Qian, Y., and Rasch, P. J.: Black carbon amplifies haze over the North China Plain by weakening the East Asian winter monsoon, Geophys. Res. Lett., 46, 452–460, https://doi.org/10.1029/2018GL080941, 2019.
Navinya, C. D., Vinoj, V., and Pandey, S. K.: Evaluation of PM2.5 Surface Concentrations Simulated by NASA's MERRA Version 2 Aerosol Reanalysis over India and its relation to the Air Quality Index, Aerosol Air Qual. Res., 20, 1329–1339, https://doi.org/10.4209/aaqr.2019.12.0615, 2020.
Pöschl, U.: Atmospheric Aerosols: Composition, Transformation, Climate and Health Effects, Angew. Chem. Int. Ed., 44, 7520–7540, https://doi.org/10.1002/anie.200501122, 2005.
Rasch, P. J., Xie, S., Ma, P.-L., Lin, W., Wang, H., Tang, Q., Burrows, S. M., Caldwell, P., Zhang, K., Easter, R. C., Cameron-Smith, P., Singh, B., Wan, H., Golaz, J.-C., Harrop, B. E., Roesler, E., Bacmeister, J., Larson, V. E., Evans, K. J., Qian, Y., Taylor, M., Leung, L. R., Zhang, Y., Brent, L., Branstetter, M., Hannay, C., Mahajan, S., Mametjanov, A., Neale, R., Richter, J. H., Yoon, J.-H., Zender, C. S., Bader, D., Flanner, M., Foucar, J. G., Jacob, R., Keen, N., Klein, S. A., Liu, X., Salinger, A. G., Shrivastava, M., and Yang, Y.: An overview of the atmospheric component of the Energy Exascale Earth System Model, J. Adv. Model. Earth Sy., 11, 2377–2411, https://doi.org/10.1029/2019MS001629, 2019.
Ren, L., Yang, Y., Wang, H., Wang, P., Chen, L., Zhu, J., and Liao, H.: Aerosol transport pathways and source attribution in China during the COVID-19 outbreak, Atmos. Chem. Phys., 21, 15431–15445, https://doi.org/10.5194/acp-21-15431-2021, 2021.
Rosenfeld, D., Lohmann, U., Raga, G. B., Kulmala, M., Fuzzi, S., Reissell, A., and Andreae, M. O.: Flood or Drought: How Do Aerosols Affect Precipitation?, Science, 321, 1309–1313, https://doi.org/10.1126/science.1160606, 2008.
Singh, T., Matsumi, Y., Nakayama, T., Hayashida, S., Patra, P. K., Yasutomi, N., Kajino, M., Yamaji, K., Khatri, P., Takigawa, M., Araki, H., Kurogi, Y., Kuji, M., Muramatsu, K., Imasu, R., Ananda, A., Arbain, A. A., Ravindra, K., Bhardwaj, S., Kumar, S., Mor, S., Dhaka, S. K., Dimri, A. P., Sharma, A., Singh, N., Bhatti, M. S., Yadav, R., Vatta, K., and Mor, S.: Very high particulate pollution over northwest India captured by a high-density in situ sensor network, Sci. Rep.-UK, 13, 13201, https://doi.org/10.1038/s41598-023-39471-1, 2023.
Smith, S. J., van Aardenne, J., Klimont, Z., Andres, R. J., Volke, A., and Delgado Arias, S.: Anthropogenic sulfur dioxide emissions: 1850–2005, Atmos. Chem. Phys., 11, 1101–1116, https://doi.org/10.5194/acp-11-1101-2011, 2011.
Stohl, A., and Trickl, T.: A textbook example of long-range transport: Simultaneous observation of ozone maxima of stratospheric and North American origin in the free troposphere over Europe, J. Geophys. Res., 104, 30445–30462, https://doi.org/10.1029/1999JD900803, 1999.
Urdiales-Flores, D., Zittis, G., Hadjinicolaou, P., Osipov, S., Klingmüller, K., Mihalopoulos, N., Kanakidou, M., Economou, T., and Lelieveld, J.: Drivers of accelerated warming in Mediterranean climate-type regions, npj Clim. Atmos. Sci., 6, 97, https://doi.org/10.1038/s41612-023-00423-1, 2023.
van Marle, M. J. E., Kloster, S., Magi, B. I., Marlon, J. R., Daniau, A.-L., Field, R. D., Arneth, A., Forrest, M., Hantson, S., Kehrwald, N. M., Knorr, W., Lasslop, G., Li, F., Mangeon, S., Yue, C., Kaiser, J. W., and van der Werf, G. R.: Historic global biomass burning emissions for CMIP6 (BB4CMIP) based on merging satellite observations with proxies and fire models (1750–2015), Geosci. Model Dev., 10, 3329–3357, https://doi.org/10.5194/gmd-10-3329-2017, 2017.
Wang, H., Rasch, P. J., Easter, R. C., Singh, B., Zhang, R., Ma, P.-L., Qian, Y., Ghan, S. J., and Beagley, N.: Using an explicit emission tagging method in global modeling of source-receptor relationships for black carbon in the Arctic: Variations, sources, and transport pathways, J. Geophys. Res.-Atmos., 119, 12888–12909, https://doi.org/10.1002/2014JD022297, 2014.
Wang, H., Easter, R. C., Zhang, R., Ma, P.-L., Singh, B., Zhang, K., Ganguly, D., Rasch, P. J., Burrows, S. M., Ghan, S. J., Lou, S., Qian, Y., Yang, Y., Feng, Y., Flanner, M., Leung, L. R., Liu, X., Shrivastava, M., Sun, J., Tang, Q., Xie, S., and Yoon, J.-H.: Aerosols in the E3SM Version 1: New developments and their impacts on radiative forcing, J. Adv. Model. Earth Sy., 12, e2019MS001851, https://doi.org/10.1029/2019MS001851, 2020.
Wang, P., Yang, Y., Xue, D., Ren, L., Tang, J., Leung, L. R., and Liao, H.: Aerosols overtake greenhouse gases causing a warmer climate and more weather extremes toward carbon neutrality, Nat. Commun., 14, 7257, https://doi.org/10.1038/s41467-023-42891-2, 2023.
Wang, Y., Liu, X., Hoose, C., and Wang, B.: Different contact angle distributions for heterogeneous ice nucleation in the Community Atmospheric Model version 5, Atmos. Chem. Phys., 14, 10411–10430, https://doi.org/10.5194/acp-14-10411-2014, 2014.
Yang, Y., Wang, H., Smith, S. J., Easter, R., Ma, P.-L., Qian, Y., Yu, H., Li, C., and Rasch, P. J.: Global source attribution of sulfate concentration and direct and indirect radiative forcing, Atmos. Chem. Phys., 17, 8903–8922, https://doi.org/10.5194/acp-17-8903-2017, 2017.
Yang, Y., Wang, H., Smith, S. J., Zhang, R., Lou, S., Qian, Y., Ma, P., and Rasch P. J.: Recent intensification of winter haze in China linked to foreign emissions and meteorology, Sci. Rep.-UK, 8, 2107, https://doi.org/10.1038/s41598-018-20437-7, 2018a.
Yang, Y., Wang, H., Smith, S. J., Zhang, R., Lou, S., Yu, H., Li, C., and Rasch, P. J.: Source Apportionments of Aerosols and Their Direct Radiative Forcing and Long-Term Trends Over Continental United States, Earths Future, 6, 793–808, https://doi.org/10.1029/2018EF000859, 2018b.
Yang, Y., Ren, L., Li, H., Wang, H., Wang, P., Chen, L., Yue, X., and Hong, L.: Fast climate responses to aerosol emission reductions during the COVID-19 pandemic, Geophys. Res. Lett., 47, e2020GL089788, https://doi.org/10.1029/2020GL089788, 2020a.
Yang, Y., Lou, S., Wang, H., Wang, P., and Liao, H.: Trends and source apportionment of aerosols in Europe during 1980–2018, Atmos. Chem. Phys., 20, 2579–2590, https://doi.org/10.5194/acp-20-2579-2020, 2020b.
Yang, Y., Ren, L., Wu, M., Wang, H., Song, F., Leung, L. R., Hao, X., Li, J., Chen, L., Li, H., Zeng, L., Zhou, Y., Wang, P., Liao, H., Wang, J., and Zhou, Z.-Q.: Abrupt emissions reductions during COVID-19 contributed to record summer rainfall in China, Nat. Commun., 13, 959, https://doi.org/10.1038/s41467-022-28537-9, 2022a.
Yang, Y., Zeng, L., Wang, H., Wang, P., and Liao, H.: Dust pollution in China affected by different spatial and temporal types of El Niño, Atmos. Chem. Phys., 22, 14489–14502, https://doi.org/10.5194/acp-22-14489-2022, 2022b.
Yang, Y., Zeng, L., Wang, H., Wang, P., and Liao, H.: Climate effects of future aerosol reductions for achieving carbon neutrality in China, Sci. Bull., 68, 902–905, https://doi.org/10.1016/j.scib.2023.03.048, 2023.
Zeng, L., Yang, Y., Wang, H., Wang, J., Li, J., Ren, L., Li, H., Zhou, Y., Wang, P., and Liao, H.: Intensified modulation of winter aerosol pollution in China by El Niño with short duration, Atmos. Chem. Phys., 21, 10745–10761, https://doi.org/10.5194/acp-21-10745-2021, 2021.
Zhang, Q., Jiang, X., Tong, D., Davis, S. J., Zhao, H., Geng, G., Feng, T., Zheng, B., Lu, Z., Streets, D. G., Ni, R., Brauer, M., van Donkelaar, A., Martin, R. V., Huo, H., Liu, Z., Pan, D., Kan, H., Yan, Y., Lin, J., He, K., and Guan, D.: Transboundary health impacts of transported global air pollution and international trade, Nature, 543, 705–709, https://doi.org/10.1038/nature21712, 2017.
Zheng, B., Tong, D., Li, M., Liu, F., Hong, C., Geng, G., Li, H., Li, X., Peng, L., Qi, J., Yan, L., Zhang, Y., Zhao, H., Zheng, Y., He, K., and Zhang, Q.: Trends in China's anthropogenic emissions since 2010 as the consequence of clean air actions, Atmos. Chem. Phys., 18, 14095–14111, https://doi.org/10.5194/acp-18-14095-2018, 2018.