the Creative Commons Attribution 4.0 License.
the Creative Commons Attribution 4.0 License.
 | 30 May 2024
Shipborne observations of black carbon aerosols in the western Arctic Ocean during summer and autumn 2016–2020: impact of boreal fires
Yange Deng
Kohei Ikeda
Sohiko Kameyama
Sachiko Okamoto
Jinyoung Jung
Young Jun Yoon
Eun Jin Yang
Sung-Ho Kang
Black carbon (BC) aerosol is considered one of the most important contributors to rapid climate warming as well as snow and sea ice melting in the Arctic, yet the observations of BC aerosols in the Arctic Ocean have been limited due to infrastructural and logistical difficulties. We observed BC mass concentrations (mBC) using light absorption methods on board the icebreaker R/V Araon in the Arctic Ocean (< 80° N and 166° E to 156° W) as well as the North Pacific Ocean in summer and early autumn of 2016–2020. The levels, interannual variations, and pollution episodes of mBC in the Arctic were examined, and the emission sources responsible for the high-BC episodes were analyzed with global chemistry-transport-model simulations. The average mBC in the surface air over the Arctic Ocean (72–80° N) observed by the 2019 cruise exceeded 70 ng m−3, which was substantially higher than that observed by cruises in other years (approximately 10 ng m−3). The much higher mBC observed in 2019 was perhaps due to more frequent wildfires occurring in the Arctic region than in other years. The model suggested that biomass burning contributed most to the observed BC by mass in the western Arctic Ocean and the marginal seas. For these 5 years, we identified 10 high-BC episodes north of 65° N, including one in 2018 that was associated with co-enhancements of CO and CH4 but not CO2 and O3. The model analysis indicated that certain episodes were attributed to BC-containing air masses transported from boreal fire regions to the Arctic Ocean, with some transport occurring near the surface and others in the mid-troposphere. This study provides crucial datasets on BC mass concentrations and the mixing ratios of O3, CH4, CO, and CO2 in the western Arctic Ocean regions, and it highlights the significant impact of boreal fires on the observed Arctic BC during the summer and early autumn months.
- Article
(12946 KB) - Full-text XML
-
Supplement
(5634 KB) - BibTeX
- EndNote


The annual average surface temperature increase in the Arctic is more than 3 times the global average increase, resulting in a rapid decline in Arctic sea ice extent in all months, a decrease in extreme cold events, and other ecosystem changes (AMAP, 2021a; IPCC, 2021). While global anthropogenic carbon dioxide (CO2) emissions play the dominant role in driving Arctic climate change, short-lived climate forcers (SLCFs), such as methane (CH4), ozone (O3), nitrogen oxides, and aerosols, have considerable potential to mitigate climate warming in the Arctic (AMAP, 2015, 2021b). Arctic aerosol chemical composition may include black carbon (BC), sulfate (SO4), nitrate (NO3), organics, sea salt, and mineral dust (Sakerin et al., 2015; AMAP, 2021b; Schmale et al., 2022). Particularly, BC aerosols in the Arctic atmosphere can absorb solar radiation directly, which causes direct and/or semi-direct climate forcing (AMAP, 2011). In addition, BC aerosols can act as cloud condensation nuclei (CCN), which cause indirect climate forcing (AMAP, 2011; McFarquhar et al., 2011). When deposited onto a snow/ice surface, BC can also affect the radiation budget due to a reduction in the surface albedo, leading to an acceleration in the melting of snow and ice (AMAP, 2011). According to Oshima et al. (2020), BC in the Arctic provides the second largest contribution, after CO2, to positive effective radiative forcings. Therefore, BC plays an important role in Arctic climate forcing.
Systematic monitoring of BC in the Arctic is critical to provide a better scientific basis for making mitigation policies. Long-term BC observations have been carried out at ground-based Arctic observatories on the continental Arctic, such as Utqiaġvik, Alert, Zeppelin, Summit, Pallas and Tiksi, and Gruvebadet (e.g., Stohl et al., 2013; Schmale et al., 2022). Whereas these long-term datasets provided essential information on the seasonal and interannual variations in BC in the Arctic (e.g., Schmale et al., 2022), they are limited in representing the spatial variation in BC in the Arctic Ocean. Such limitations can be partially compensated for by shipborne and airborne observations. Airborne observations have illustrated the vertical distributions of BC above the Arctic Ocean surface (e.g., Schulz et al., 2019; Ohata et al., 2021a; Jurányi et al., 2023). Meanwhile, shipborne observations have facilitated in situ measurements in the remote Arctic Ocean, especially in summer and autumn when the Arctic sea ice is at its minimum, making access to the Arctic Ocean easier (Xie et al., 2007; Sierau et al., 2014; Kim et al., 2015; Sakerin et al., 2015, 2021; Taketani et al., 2016, 2022; Popovicheva et al., 2017; Ding et al., 2018; Terpugova et al., 2018; Shevchenko et al., 2019; Pankratova et al., 2020; Park et al., 2020; Nagovitsyna et al., 2023). In addition, Boyer et al. (2023) measured the BC mass concentration in the central Arctic (> 80° N) for a whole year from September 2019 to October 2020. These shipborne studies have provided BC mass concentration results used for model evaluation in the Arctic Ocean (e.g., Whaley et al., 2022). They also revealed important characteristics of the spatial distribution of BC in the Arctic Ocean, demonstrating that BC concentration diminishes in the northern direction and decreases as distance from the continent increases (Xie et al., 2007; Sakerin et al., 2015, 2021). The year-round observation in the central Arctic by Boyer et al. (2023) indicated that seasonal changes in BC are similar to those of the Arctic continent, but the changes are larger, with high values in winter and spring – the Arctic haze season (Barrie, 1986) – and low values in summer and early autumn. However, most of these studies were limited to the North Atlantic and Eurasian Arctic seas (Sierau et al., 2014; Sakerin et al., 2015, 2021; Popovicheva et al., 2017; Terpugova et al., 2018; Shevchenko et al., 2019; Pankratova et al., 2020; Nagovitsyna et al., 2023; Boyer et al., 2023) and the Bering, Chukchi, and Beaufort seas (Xie et al., 2007; Kim et al., 2015; Sakerin et al., 2015; Taketani et al., 2016, 2022; Ding et al., 2018; Nagovitsyna et al., 2023). To our knowledge, Xie et al. (2007) and Ding et al. (2018) are the only two studies that reported BC observations in the western Arctic Ocean north of 74° N, and the work of Shevchenko et al. (2019) is the only study related to BC observation in the East Siberian Sea. Furthermore, BC in Xie et al. (2007) was only qualitatively quantified. Therefore, for a better understanding of the spatial–temporal variations in BC in the Arctic Ocean and better model constraint, continuous shipborne observations of BC in the Arctic marine boundary layer, especially in the western central Arctic Ocean and East Siberian Sea, where data coverage is sparse, are highly necessary under the rapidly changing Arctic environments (AMAP, 2021a; Whaley et al., 2022; Jurányi et al., 2023).
The accurate location of BC sources is another important step toward mitigation measures. Atmospheric modeling is indispensable in understanding the distributions and sources of BC in the Arctic quantitatively. Current atmospheric models still have difficulties in accurately reproducing the BC abundance in the Arctic (e.g., Whaley et al., 2022; Jurányi et al., 2023). The main obstacles include poor understanding of long-range transport, vertical mixing, deposition, and emissions (e.g., Ikeda et al., 2017; Whaley et al., 2022). Preexisting modeling studies combined with field observations indicate that biomass burning from Siberia as well as Alaska and Canada contributed the most to surface BC mass concentration during summer and early autumn (e.g., Zhu et al., 2020; Popovicheva et al., 2022). In addition, according to McCarty et al. (2021), wildfire emissions of BC above 60° N increased from 2010 to 2020 and open biomass burning contributed 56 % of BC emissions above 65° N in 2020. In the context of climate change, the likelihood of extreme fire weather in the Arctic will increase (McCarty et al., 2021). Consequently, the impact of BC emissions from boreal vegetation fires on the Arctic atmospheric BC may increase (AMAP, 2021a, b). Therefore, continual studies combining field observations and modeling simulations on the impact and transport of biomass burning BC in boreal areas to the Arctic Ocean are urgently needed.
In this study, to enhance comprehension of the distribution and sources of BC in the Arctic, the mass concentration of BC (mBC) was monitored across five round-trip expeditions conducted between the North Pacific Ocean and the Arctic Ocean during the summer and early autumn of 2016–2020. Based on the observations, the spatial–temporal variations in mBC were characterized and the background mBC in the western Arctic Ocean was estimated. The observations were compared with BC tagged-tracer simulations using GEOS-Chem (Ikeda et al., 2017). The sources of observed BC and air masses containing high BC mass concentrations were interpreted based on the GEOS-Chem model and back trajectory analysis. The results from this study demonstrate the significant impacts of boreal fires on the observed BC in the western Arctic Ocean and its marginal seas.
The shipborne observations were conducted in summer and autumn during 2016–2020 (Fig. S1a in the Supplement) on board the icebreaker R/V Araon operated by the Korea Polar Research Institute (KOPRI), South Korea. The air intake was set at the handrail of the front upper deck to prevent contamination from ship exhaust pollution. Furthermore, detailed information regarding data filtering techniques to mitigate the impact of ship exhaust will be provided later. A cyclone was attached at the intake to selectively sample PM2.5 aerosols. The total airflow rate was 10 L min−1.
A continuous soot monitoring system (COSMOS; model 3130; Kanomax, Japan) and an Aethalometer (model AE22; Magee Scientific, USA) were used during the cruises to measure the mass concentrations of BC aerosols. Whereas both instruments use light absorption methods, COSMOS was equipped with a 400 °C heated inlet line. This feature effectively eliminated interference from volatile non-refractory aerosol chemical species internally mixed with BC, ensuring a high accuracy of mBC measurement. This aspect has been critically assessed in previous studies (Ohata et al., 2019; Sinha et al., 2017). Consequently, COSMOS measurements differ from traditional light absorption methods, where the mass concentration of BC is referred to as equivalent BC (eBC; Petzold et al., 2013). Therefore, instead of using eBC, the term BC can be used for COSMOS data in a general sense (Ohata et al., 2019). Henceforth, when comparing data from the two different instruments, we will use meBC to represent the BC mass concentration measured with the Aethalometer during the 2017, 2018, and 2020 cruises and mBC (COSMOS) to represent the BC mass concentration measured with COSMOS during the 2016–2019 cruises. Otherwise, BC mass concentration is denoted as mBC for simplicity.
COSMOS monitors changes in transmittance of 565 nm wavelength LED light across an automatically advancing quartz fiber filter tape. To achieve measurements with high sensitivity and a lower detectable light absorption coefficient, COSMOS uses a double-convex lens and optical bundle pipes to maintain high light intensity, and signal data are obtained at 1000 Hz. In addition, its sampling flow rate (0.9 L min−1) and optical unit temperature were actively controlled. The measurement interval was set to 1 min, which was then averaged to 1 h for further analysis. The default mass absorption cross section (MAC) of 10 m2 g−1 was applied for the derivation of mBC. The lowest detection limit of COSMOS at 1 min time resolution is 50 ng m−3. On an hourly basis, COSMOS can measure mBC in the range of 1–3000 ng m−3 with an average accuracy of ∼ 10 %, as compared with measurements by a single-particle soot photometer (SP2) (Moteki and Kondo, 2010), and its sensitivity to the changes in the BC size distributions was less than 10 %, within the typical BC sizes in ambient atmosphere (Ohata et al., 2019). SP2 was often used as a reference instrument in previous studies (e.g., Ohata et al., 2019; Sinha et al., 2017). Further details about the measurement principles of COSMOS can be found in previous studies (Ohata et al., 2019; Kondo et al., 2009).
The Aethalometer uses the absorption of light at a wavelength of 880 nm by ambient aerosols collected on a quartz filter tape to determine the BC concentration. The flow rate was set to 5 L min−1, and the accumulation area of the filter is 1.67 cm2. The filter was set to change every 24 h to minimize the loading effects. The data integration time was set to 5 min. For further analysis, hourly averages were used to minimize noise levels under clean atmospheric conditions. The default manufacturer-provided MAC value of 16.6 m2 g−1 was applied for all analyses since the study area covers a wide range of latitudes. The manufacturer's particle-free zero air testing meets a 24 h mean detection limit of 20 ng m−3 and a 5 min standard deviation limit of ±30 ng m−3. Comparison between meBC and mBC (COSMOS) for cruises in 2017 and 2018, when both data types are available, shows that the two data types are in high consistency (Pearson correlation coefficient R>0.96) and that meBC was 1.3–2.5 times mBC (COSMOS) (Fig. S2). Previous studies also show that the default parameter settings of the Aethalometer, as mentioned above, may cause the obtained BC mass concentrations to be 1–3 times the mass measured by SP2, depending on the sources and mixing states of the BC aerosols (Wang et al., 2014; Sharma et al., 2017; Laing et al., 2020). Due to the above reasons, the AE22 data in this study are mainly used as a reference. Hereinafter, for cruises conducted from 2016 to 2019, the analysis primarily relied on COSMOS data. In the case of the 2020 cruise, when only AE22 data were available, AE22 data were utilized for the analysis.
In addition, the atmospheric mixing ratios of CH4, carbon monoxide (CO), and CO2 were monitored using a cavity ring-down spectrometer (CRDS), the Picarro G2401 gas concentration analyzer (Picarro, USA), when the icebreaker R/V Araon was in the Arctic Ocean (north of 72° N) during the cruise in 2018. The Picarro G2401 analyzer was calibrated by running the standard CH4 gas (RIGAS, South Korea) for 8 min every day. The CH4, CO, and CO2 data were omitted during the instrument calibration period. The CH4, CO, and CO2 data were averaged to 1 min before being further analyzed. The mixing ratios of O3 were determined using ultraviolet absorption spectroscopy during the cruises in 2017 and 2018 with a time resolution of 1 min. The O3 monitor (model 1100; Dylec, Japan) utilized absorption at 253.7 nm emitted by a low-pressure mercury lamp and was calibrated through intercomparison with a reference photometer, which was referenced to the Standard Reference Photometer (SRP) no. 2 at the National Institute of Standards and Technology (NIST). Those gaseous data were used to assist the analysis of BC sources during high-BC episodes in 2018 (Sect. 4.4.2). The O3 data were also used to scrutinize the possible contamination from ship emissions (as explained in the next paragraph). Statistics of those gaseous data are shown in Table A1 in the Appendix; time series and concentration distributions of those data along the cruise tracks are presented in Figs. 6–8 and S18.
To avoid the influence of ship exhausts, we only used 1 or 5 min data records that occurred when the 1 min wind direction and speed relative to the ship's course were within ±60° of the bow and >3 m s−1, respectively, for a continuous 10 min centered around the current 1 or 5 min data record. Furthermore, for the 2017 and 2018 cruises, when the atmospheric mixing ratio of O3 was recorded (Fig. S18), the 1 min COSMOS BC and O3 data were further scrutinized for the possible contamination of ship exhausts considering the O3 titration effect by NO from ship emissions (Pfannerstill et al., 2019). When O3 decreased and BC increased at the same time, both 1 min BC and 1 min O3 data were considered invalid. Accordingly, 41 %–57 % of the observed 1 or 5 min BC data; 56 % of 1 min O3 data; and 63 % of 1 min CH4, CO, and CO2 data were removed from the analysis. It is noteworthy that the additional scrutiny based on the O3 criteria had minimal impact on the overall characteristics of the observed BC by COSMOS. This screening process resulted in the exclusion of less than 0.3 % and 0.4 % of the total valid data in 2017 and 2018, respectively. Furthermore, hourly values are only calculated when there are more than 40 min of valid data records in an hour, by averaging the 1 or 5 min values within that hour. Within the hourly BC mass concentration data, 5 %–13 % of COSMOS data fall below its detection limit.
Table 1Time and space coverage of R/V Araon as well as overall and background BC mass concentrations in the Arctic Ocean (≥ 72° N).
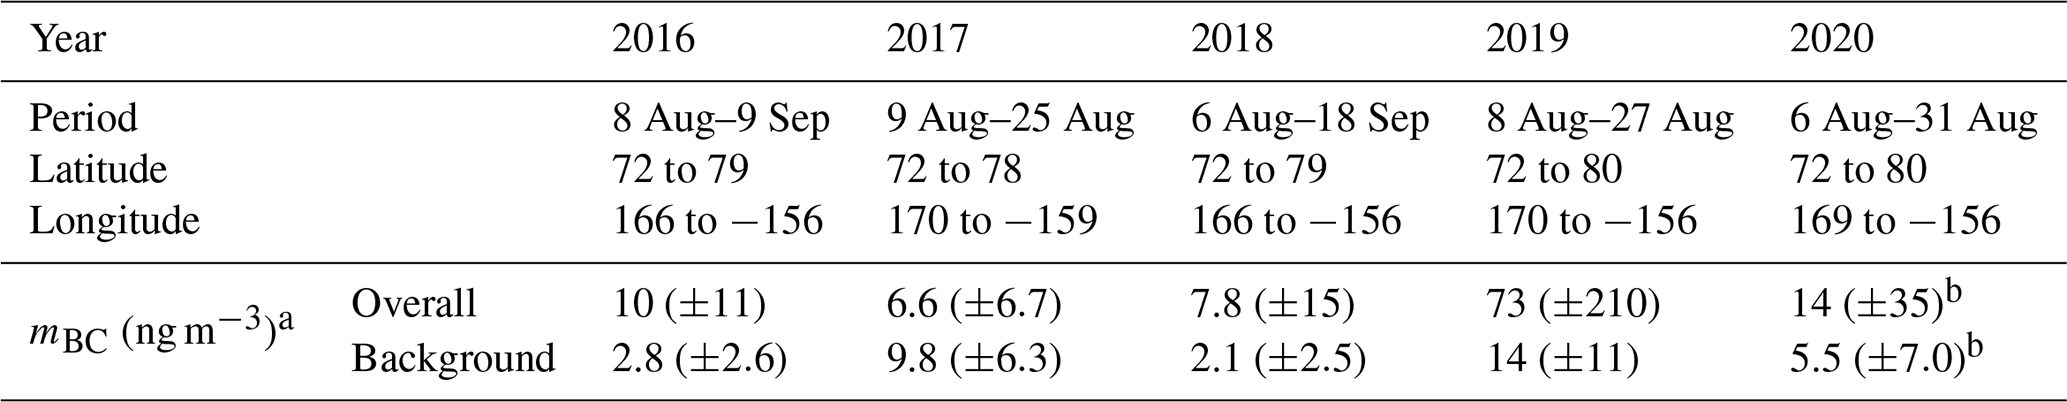
a Mean (± standard deviation). b meBC.
Tagged-tracer simulations of BC using the global chemistry-transport model GEOS-Chem (v13.1.2; Bey et al., 2001; Ikeda et al., 2017) were performed to assist in the interpretation of the sources and transport paths of observed BC in the Arctic Ocean. The horizontal resolution of GEOS-Chem was 2° × 2.5° with 47 vertical layers from the surface to 0.01 hPa. The meteorological data were supplied by Modern-Era Retrospective analysis for Research and Applications, version 2 (MERRA-2). Two BC tracers, namely anthropogenic BC (BCan) and biomass burning BC (BCbb), were defined for the simulations. Evaluating of the Climate and Air Quality Impacts of Short-Lived Pollutants version 6b (ECLIPSEv6b) was adopted as an anthropogenic emission source (Klimont et al., 2017). The Global Fire Emissions Database with small fires (GFED v4.1s, referred to as GFED4s hereafter) and 0.25° × 0.25° spatial resolution and daily temporal resolution was applied as a biomass burning emission source (van der Werf et al., 2017). In the following section, the simulated total BC mass concentration is noted as mBC,S and the simulated BC mass concentrations contributed by anthropogenic and biomass burning sources are noted as mBC,SAN and mBC,SBB, respectively.
Furthermore, backward trajectories were generated using the NOAA Air Resources Laboratory HYSPLIT model (Stein et al., 2015) to aid in interpreting the sources of the observed BC and identifying background periods in the western Arctic Ocean. These trajectories were calculated with a 1 h time step, initiated at the ship positions with starting heights of 10, 500, and 1000 m above model ground level, and extended for 5 d. The selection of a 5 d duration allows for identifying potential source regions of high-BC episodes (Sect. 4.4) while ensuring trajectory accuracy (Backman et al., 2021). The meteorological data used for HYSPLIT were the NCEP's GDAS data, featuring a horizontal resolution of 1° × 1° and 24 pressure levels extending from the ground to 20 hPa in the vertical direction. Note that for the source interpretation of the observed BC, only back trajectories starting at 500 m above model ground level were employed. Trajectories starting at 10, 500, and 1000 m above the model ground level were used for background period identification.
Table 2BC mass concentrations based on shipborne observations from previous studies.
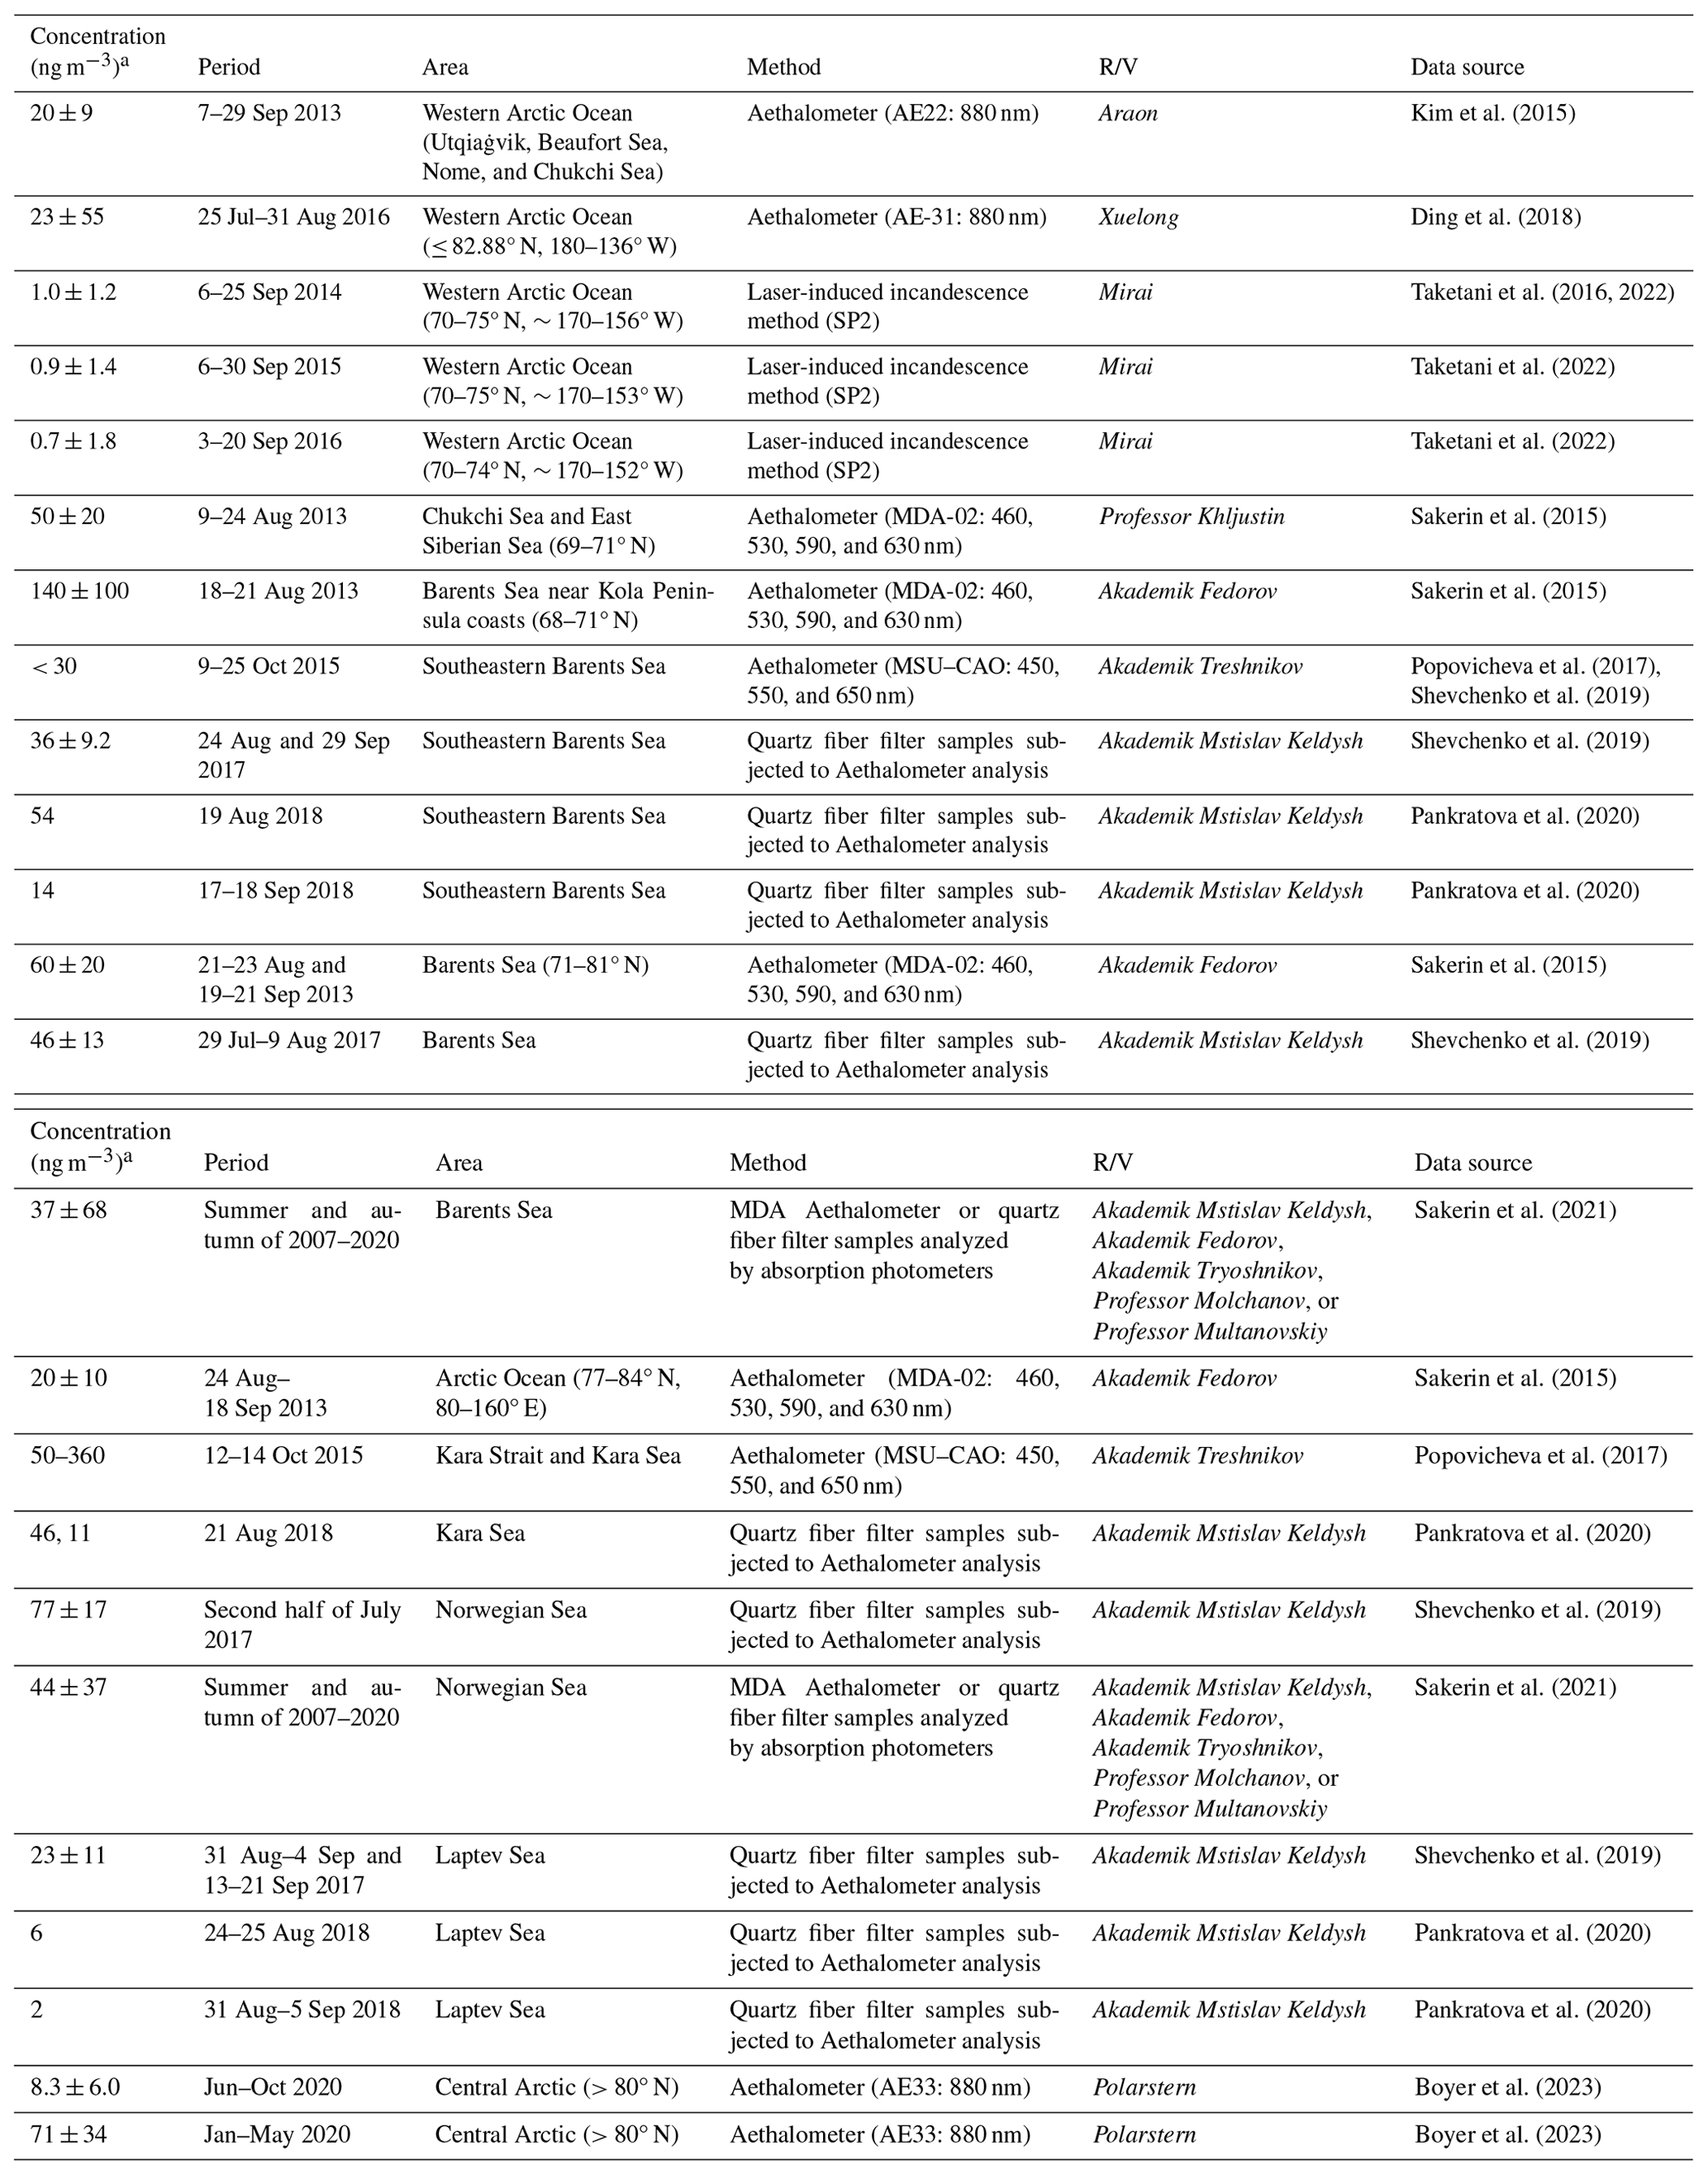
The ± values indicate mean ± standard deviation.
4.1 Spatial and temporal variations in BC mass concentrations
Figure 1 shows the shipborne observation cruise tracks north of 64° N during 2016–2020. Spatial distributions of the observed BC mass concentrations along the cruise tracks of respective years are indicated by filled color circles in Figs. 1b–f. For all the years, the cruises in the Arctic Ocean took place during August and early September, covering the region of ≤80° N and 166° E to 156° W (Fig. 1a; Table 1). The cruise region in the Arctic in this study either fully or partially covered the shipborne research regions in previous studies by Taketani et al. (2016, 2022), Xie et al. (2007), Dall'Osto et al. (2020), Park et al. (2020), and Ding et al. (2018).
The spatial–temporal distribution of BC mass concentrations along all the cruise tracks in respective years can be found in Fig. S1. To further investigate the spatial and temporal variations in observed BC, the mBC values in each cruise were categorized into three groups according to the latitude of the observations, i.e., south of 52° N (in the North Pacific Ocean), north of 72° N (mainly in the Canada Basin and the eastern part of the East Siberian Sea, which are noted as western central Arctic Ocean in the following sections of this study), and between 52 and 72° N (mainly in the Bering, Chukchi, and Beaufort seas). The groups were statistically analyzed and the results are presented in Fig. 2. Note that the grouping mentioned here does not comply with the latitudinal constraints (i.e., north of 65° N) used to select high-BC episodes in Sect. 4.4. Time series of the mBC and ship latitudes in each cruise are presented in Fig. 3. In general, mBC in high-latitude regions was relatively low, consistent with previous studies (Sakerin et al., 2021) demonstrating a decrease in mBC with increasing latitude. Additionally, high-latitude regions showed fewer spatial–temporal variations compared with low-latitude regions. However, frequent high mBC spikes were also observed at high latitudes in 2019. The high mBC observed in lower-latitude regions from the North Pacific Ocean to the southern Chukchi Sea near the Bering Strait can be explained by the fact that East Asia is the largest BC source region in the world (Ikeda et al., 2022) and that biomass burning in boreal regions, including Siberia, Alaska, and Canada, is also a large BC source in summer (Zhu et al., 2020).
Significant but not regular interannual variation in mBC was observed in regions south of 52° N. The highest mean and median mBC values were observed in 2018 and 2017, followed by 2019, 2020, and 2016 (Fig. 2a). At regions between 52 and 72° N and north of 72° N, except for the year 2019, mBC variations among other years were not evident (Fig. 2a). The median values of mBC at the former region were 10–12 ng m−3 except during the cruise in 2019, when they were around 17 ng m−3; at the latter region, the median values were 3–4 ng m−3 except for 2019, when they were around 15 ng m−3. The higher BC concentration and more frequent high BC spikes in 2019 than in other years at the Arctic Ocean and marginal sea regions were likely affected by more frequent outflows of smoke from boreal vegetation fires during the cruise observation period (Sakerin et al., 2020). This is supported by a few studies. For example, Antokhina et al. (2023) reported intensive fire activities during 3 July to 12 August 2019 in eastern Siberia (95–120° E); Bhatt et al. (2021) reported extreme fire activity which started in mid-August in south-central Alaska due to the extreme conditions of hot summer temperatures and prolonged drought; Voronova et al. (2020) reported that the total burned-out areas and the quantity of emissions of fine aerosols in Siberia were abnormally high in 2019, especially in August; Chen et al. (2023) reported that unprecedented vegetation fires were observed in eastern Siberia and Alaska in 2019; and Hayasaka (2022) reported that the number of hotspots in summer in the Arctic region in 2019 was much greater than those in 2016–2018 and 2020. In addition, at Utqiaġvik observatory (Fig. 1a), the surface station nearest to the cruise regions in the Arctic Ocean in this study, the interannual variation in BC mass concentrations measured by a similar COSMOS instrument and the absorption coefficient at 550 nm measured by two other filter-based absorption photometers in August and September also presented higher values in 2019 than in other years (Figs. S4 and S5; Ohata et al., 2021b), which is consistent with the interannual variations in BC mass concentrations observed in this study.
Table 3Time and space ranges, as well as observed and simulated BC mass concentrations, for the 10 episodes.
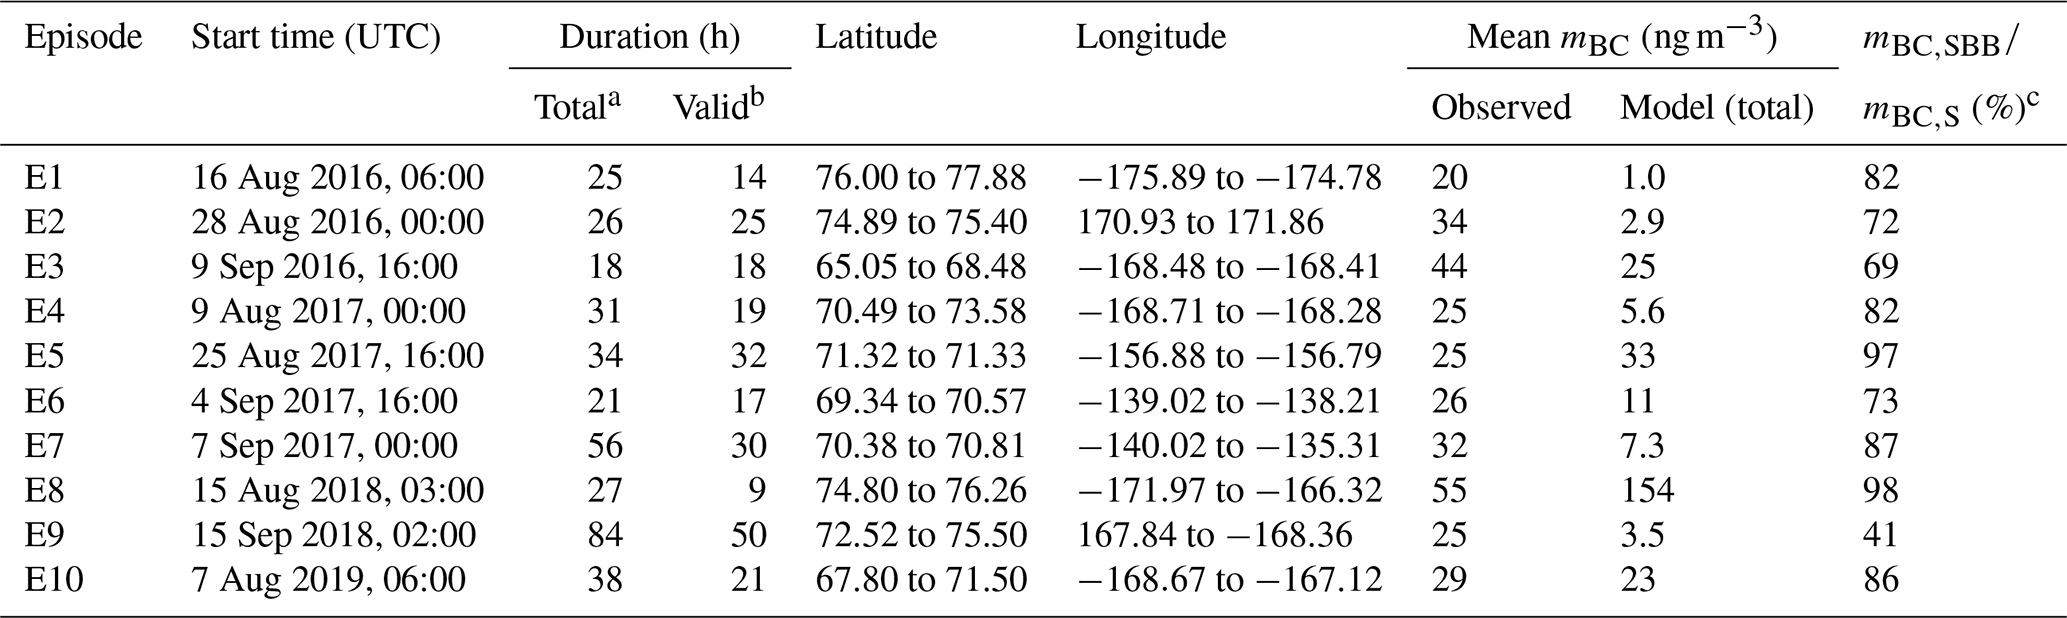
a The total duration of each episode. b The number of hours with valid 1 h BC mass concentration data in each episode. c GEOS-Chem-simulated ratio of biomass burning to total BC mass concentration.
The BC mass concentration measured in the western central Arctic Ocean is comparable to some of those in previous shipborne observation studies (Table 2), most of which adopted Aethalometer methods, except for those conducted by Taketani et al. (2016, 2021). In this study, the median and mean (± 1 standard deviation) meBC values measured with the AE22 in August 2020 were 3.4 and 14 (±35) ng m−3, respectively. These values are close to those measured in the central Arctic Ocean during the same period using a AE33 Aethalometer, where the median and mean (±1 standard deviation) values were 6.5 and 10 (±22) ng m−3, respectively (Boyer et al., 2023). In addition, the mean (±1 standard deviation) mBC (COSMOS) in August and early September 2016 was 10 (±11) ng m−3, aligning with the meBC value of 23 (±55) ng m−3 obtained in late July and August 2016 by Ding et al. (2018), considering the relative uncertainty factor of 1–3 for the Aethalometer as discussed in Sect. 2. However, this mBC (COSMOS) value is 10 times higher than that reported by Taketani et al. (2022). The large difference was likely caused by the spatial and temporal difference between the measurements in the two studies. The cruise routes in this study covered part of the East Siberian Sea region, whereas the route in Taketani et al. (2022) was within the Chukchi and Beaufort Sea regions; and the cruise in this study occurred mainly in August, whereas that in Taketani et al. (2022) occurred mainly in September. As a result, different air masses containing different BC concentrations could have been observed by this study and Taketani et al. (2022). Therefore, caution on the spatial and temporal ranges should be exercised when comparing the mass concentrations of BC observed in the Arctic Ocean. It is noteworthy that COSMOS can measure the BC mass concentration in the Arctic with ∼ 10 % accuracy compared with SP2 at 1 h time resolution (Ohata et al., 2019), as mentioned in Sect. 2; therefore, the instrument difference should not have influenced significantly the comparison between this study and Taketani et al. (2022). Furthermore, the mBC (COSMOS) measured in this study is lower than most of the meBC values observed in the Eurasian Arctic seas, except for that observed in the Laptev Sea in 2018 (Pankratova et al., 2020). This is also likely caused by differences in air mass resources.
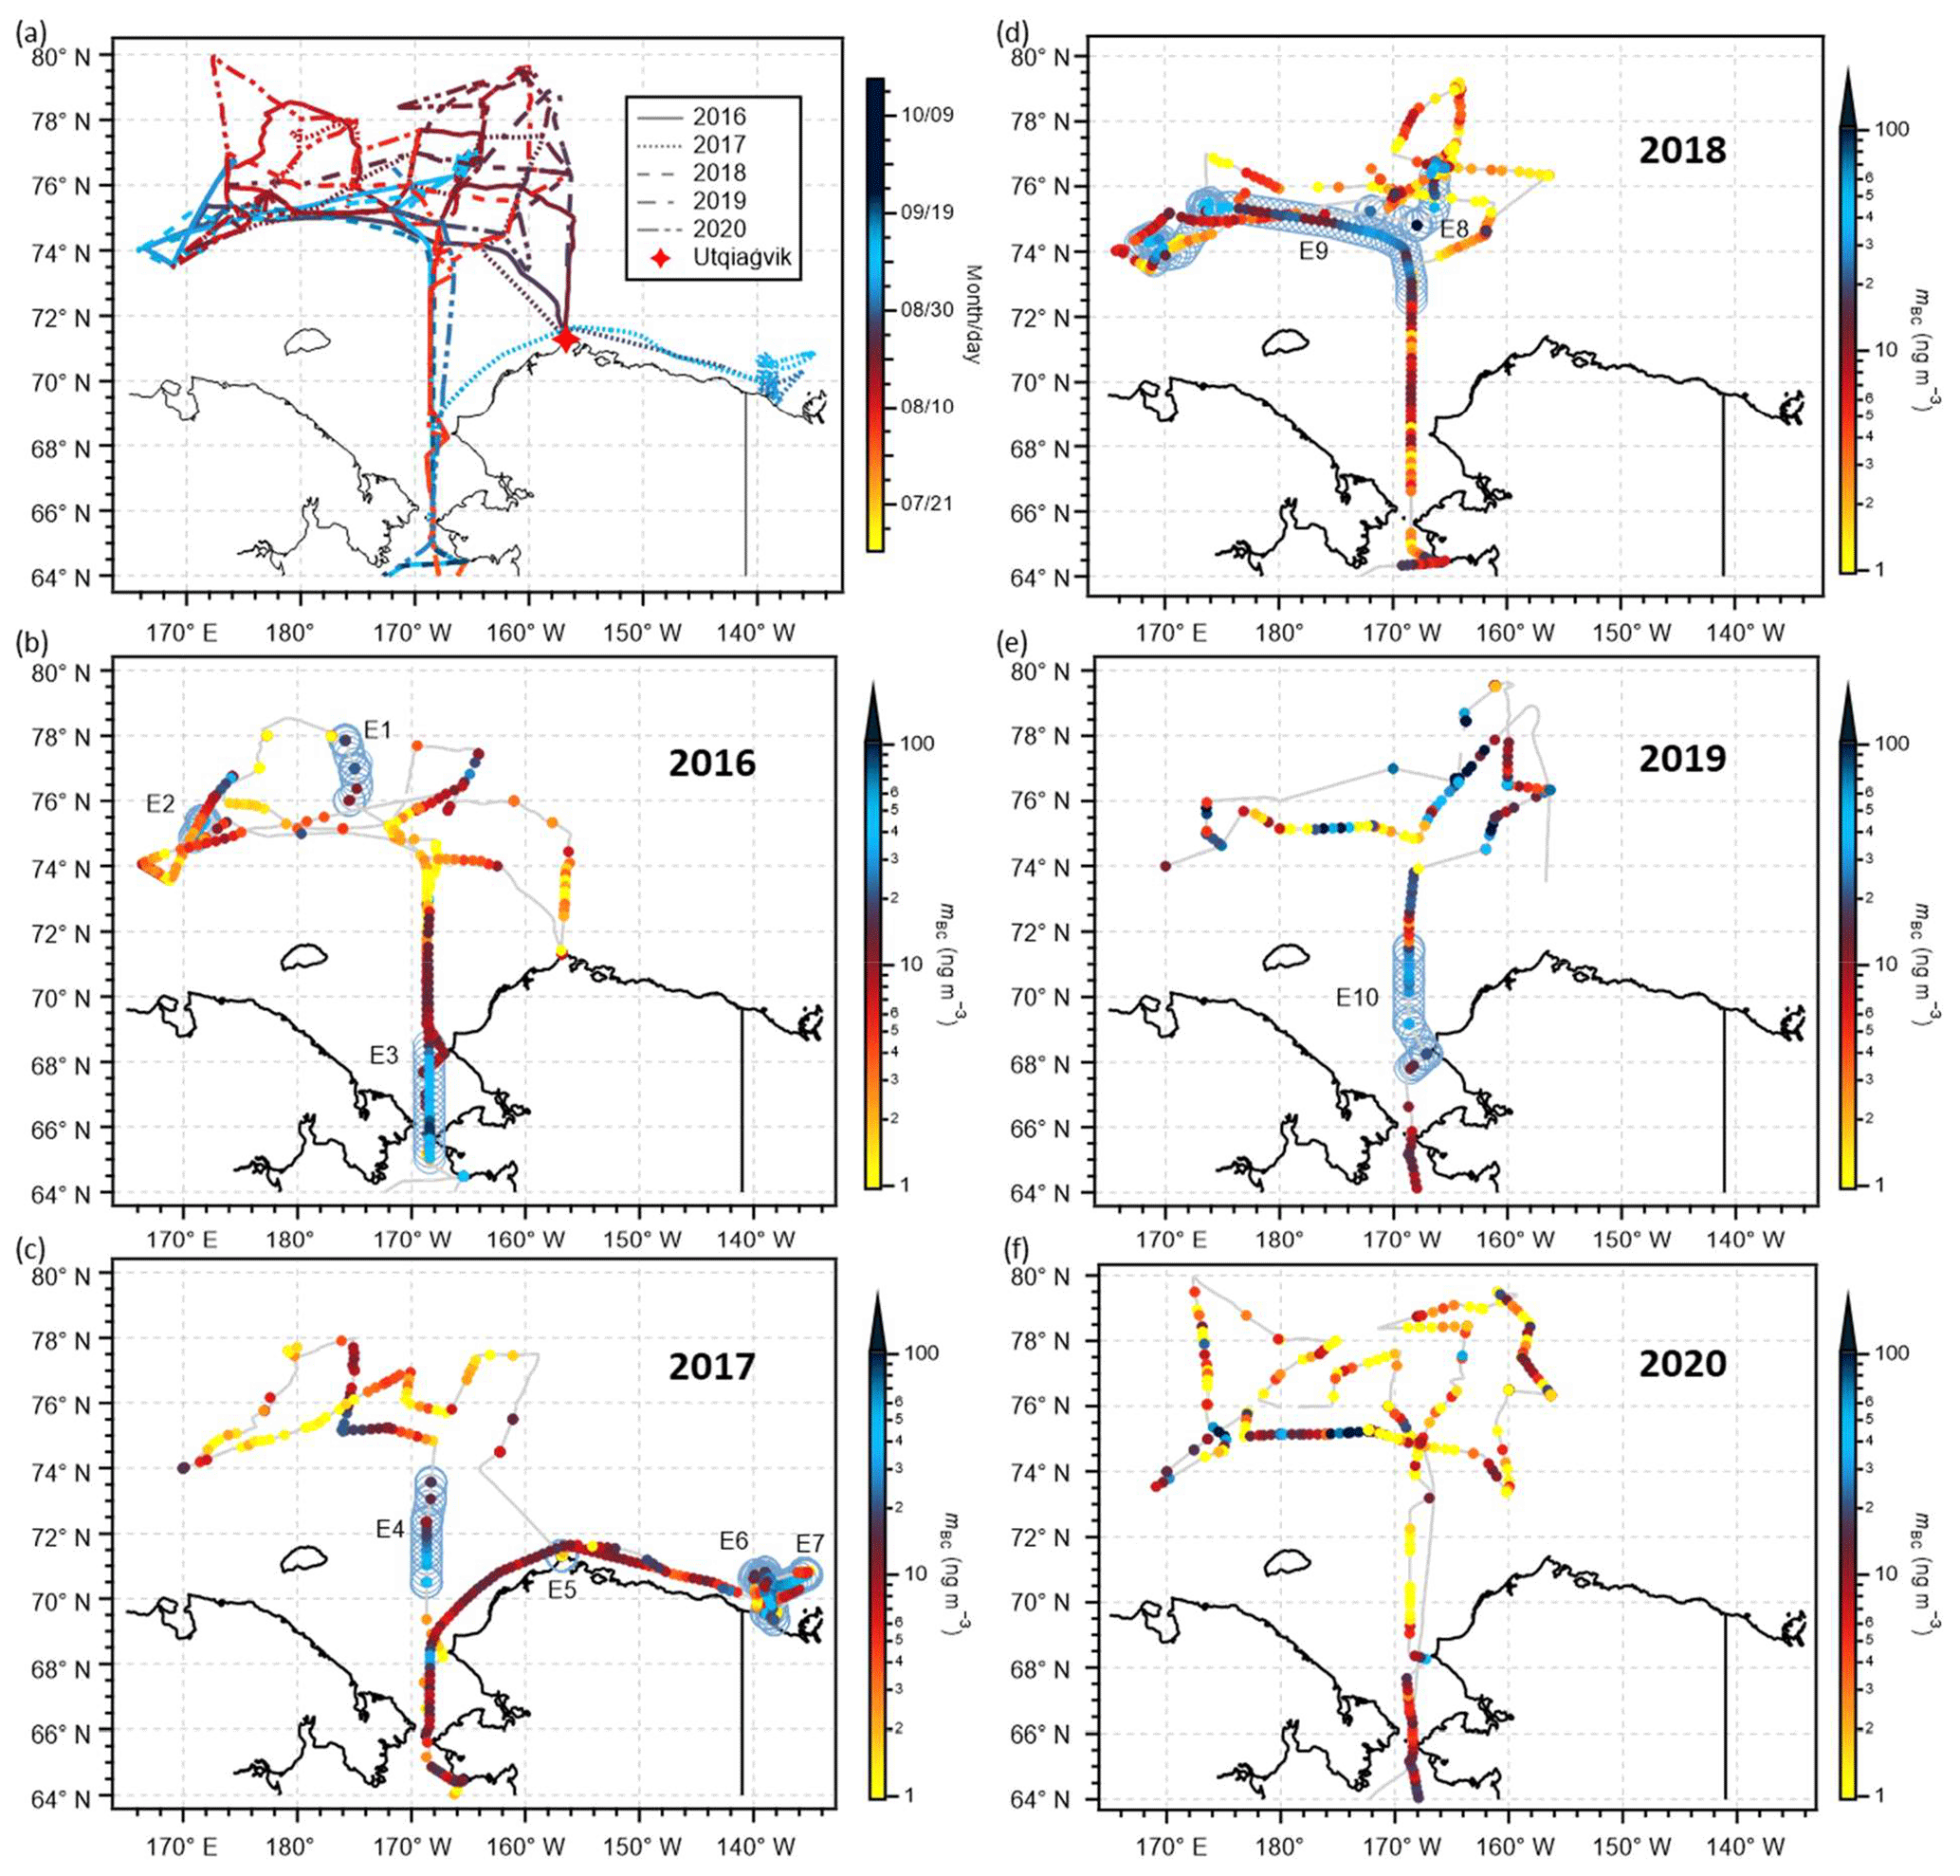
Figure 1Shipborne observation cruise tracks north of 64° N during 2016–2020. In (a) color indicates month/day and the star marker indicates the location of the Utqiaġvik observatory (71.29° N, 156.75° W). (b–f) Spatial distribution of BC mass concentrations along the cruise tracks in respective years. The gray line represents the cruise track, and the filled color circles superimposed on the track indicate the BC mass concentration. The mBC presented here is at 1 h time resolution, and the data influenced by ship exhaust have been removed. In (b)–(e), ship positions during the 10 episodes (E1–E10) are marked along the ship tracks as open circles. The spatial and temporal distributions of BC mass concentrations along all the cruise tracks in respective years can be found in Fig. S1.
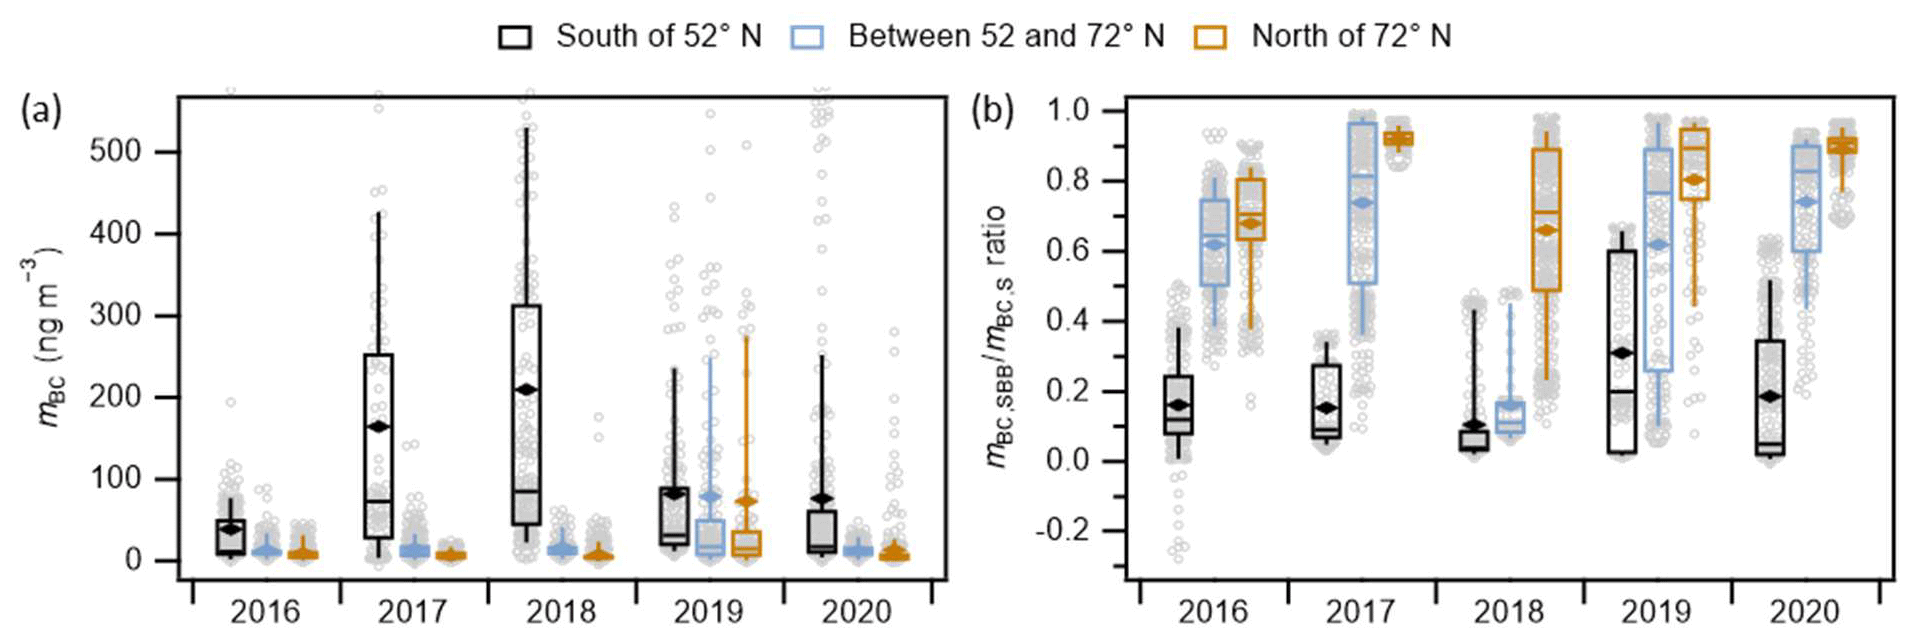
Figure 2Boxplots of (a) the observed BC mass concentration and (b) the model-simulated ratio of biomass burning BC to total BC ( along the ship tracks at latitudes south of 52° N, north of 72° N, and between 52 and 72° N for respective cruises during 2016–2020. Lower whisker: 9th percentile; upper whisker: 91st percentile; box bottom: first quartile; box top: third quartile; line in the box: median value; solid diamond marker: arithmetic mean; open circles: individual data. All data presented here are at 1 h time resolution, and the data influenced by ship exhaust have been removed. The full-scale panel (a) and a zoomed-in view of panel (a) with the y axis maximum set to 80 ng m−3 are shown in Fig. S3.
4.2 Background BC concentration in the western central Arctic Ocean
To evaluate the air quality and climate changes in the Arctic Ocean correctly, it is important to estimate the background BC mass concentration. While finding a situation entirely identical to the preindustrial atmosphere is challenging due to the pervasive influence of anthropogenic activities on even natural events like wildfires (McCarty et al., 2021), examining periods in the Arctic Ocean unaffected by regional transport could offer insights into preindustrial atmospheric situations. This assumes that the impact of natural terrestrial activities, such as wildfires, on BC in the preindustrial Arctic Ocean atmosphere was likely negligible, recognizing the inherent uncertainties in making such historical assessments.
Many anthropogenic and natural activities can bring BC aerosols to the Arctic Ocean atmosphere. Those activities include industry activities producing large quantities of air pollutants in lower-latitude regions that may be transported to the Arctic through long-range transport (Ikeda et al., 2017; Zhu et al., 2020), gas flaring and wildfire frequently occurring in the Arctic regions (Stohl et al., 2013), and expanding local activities such as cruise tourism along the Arctic coastal region driven by the warming Arctic climate (AMAP, 2021a). In winter and early spring, the buildup of terrestrial anthropogenic and natural pollutants occurs due to the expansion of the polar dome, which allows for the transport of pollutants from continental regions further south. This buildup, combined with stable atmospheric conditions, can result in monthly mean mBC levels exceeding 100 ng m−3 (e.g., Boyer et al., 2023). In summer and early autumn, intense wildfires in the boreal regions can also result in remarkably high mBC levels, as discussed in Sect. 4.1. However, during this period, the mBC in the Arctic Ocean surface layer atmosphere can be extremely low. This is due to changes in transport patterns and wet deposition processes, which efficiently prevent the transport of terrestrial aerosols to the Arctic Ocean (e.g., Bozem et al., 2019; Sierau et al., 2014). Therefore, the summer and early autumn months are considered the most suitable for evaluating the background level of mBC in the Arctic Ocean, with the assumption mentioned previously.
The background periods in the western central Arctic Ocean (> 72° N) were determined according to the following criteria: first, for each hour with effective BC data, all three 5 d HYSPLIT back trajectories initiated at starting heights of 10, 500, and 1000 m originated from the Arctic Ocean. Additionally, all 1 min mBC or 5 min meBC data within that hour were not removed due to ship exhaust according to data screening criteria described in Sect. 2. The second criterion is to ensure the accuracy of the selected data. As shown in Fig. 3, background periods of 8, 12, 17, 15, and 13 h were identified for the 2016, 2017, 2018, 2019, and 2020 cruises, respectively. The mean background mBC (meBC) values during the cruises in respective years are presented in Table 1, spanning a broad range from 2 to 14 ng m−3. Except during the 2017 cruise, the mean background mBC (meBC) values were lower than their respective overall means and exhibited a positive correlation (R=0.98) with the overall means. The former indicates that the Arctic Ocean could be frequently affected by local or regional BC pollutants. The positive correlation might indicate the accumulation of atmospheric pollutants within the Arctic Ocean planetary boundary layer even in the summer and early autumn months. For the 2017 cruise, the estimated background mBC was higher than the overall mean, possibly due to residual ship exhaust contamination, despite rigorous data screening procedures (Sect. 2). The overall mean of background mBC, calculated from COSMOS mBC at 1 h time resolution over 52 h, was 7.5 (±8.5) ng m−3. Despite the significantly higher lower detection limit of AE22 used for the 2020 cruise compared with that of COSMOS (Sect. 2), the combined data from both COSMOS mBC and AE22 meBC for 65 h resulted in a similar mean background mBC of 7.1 (±8.2) ng m−3.
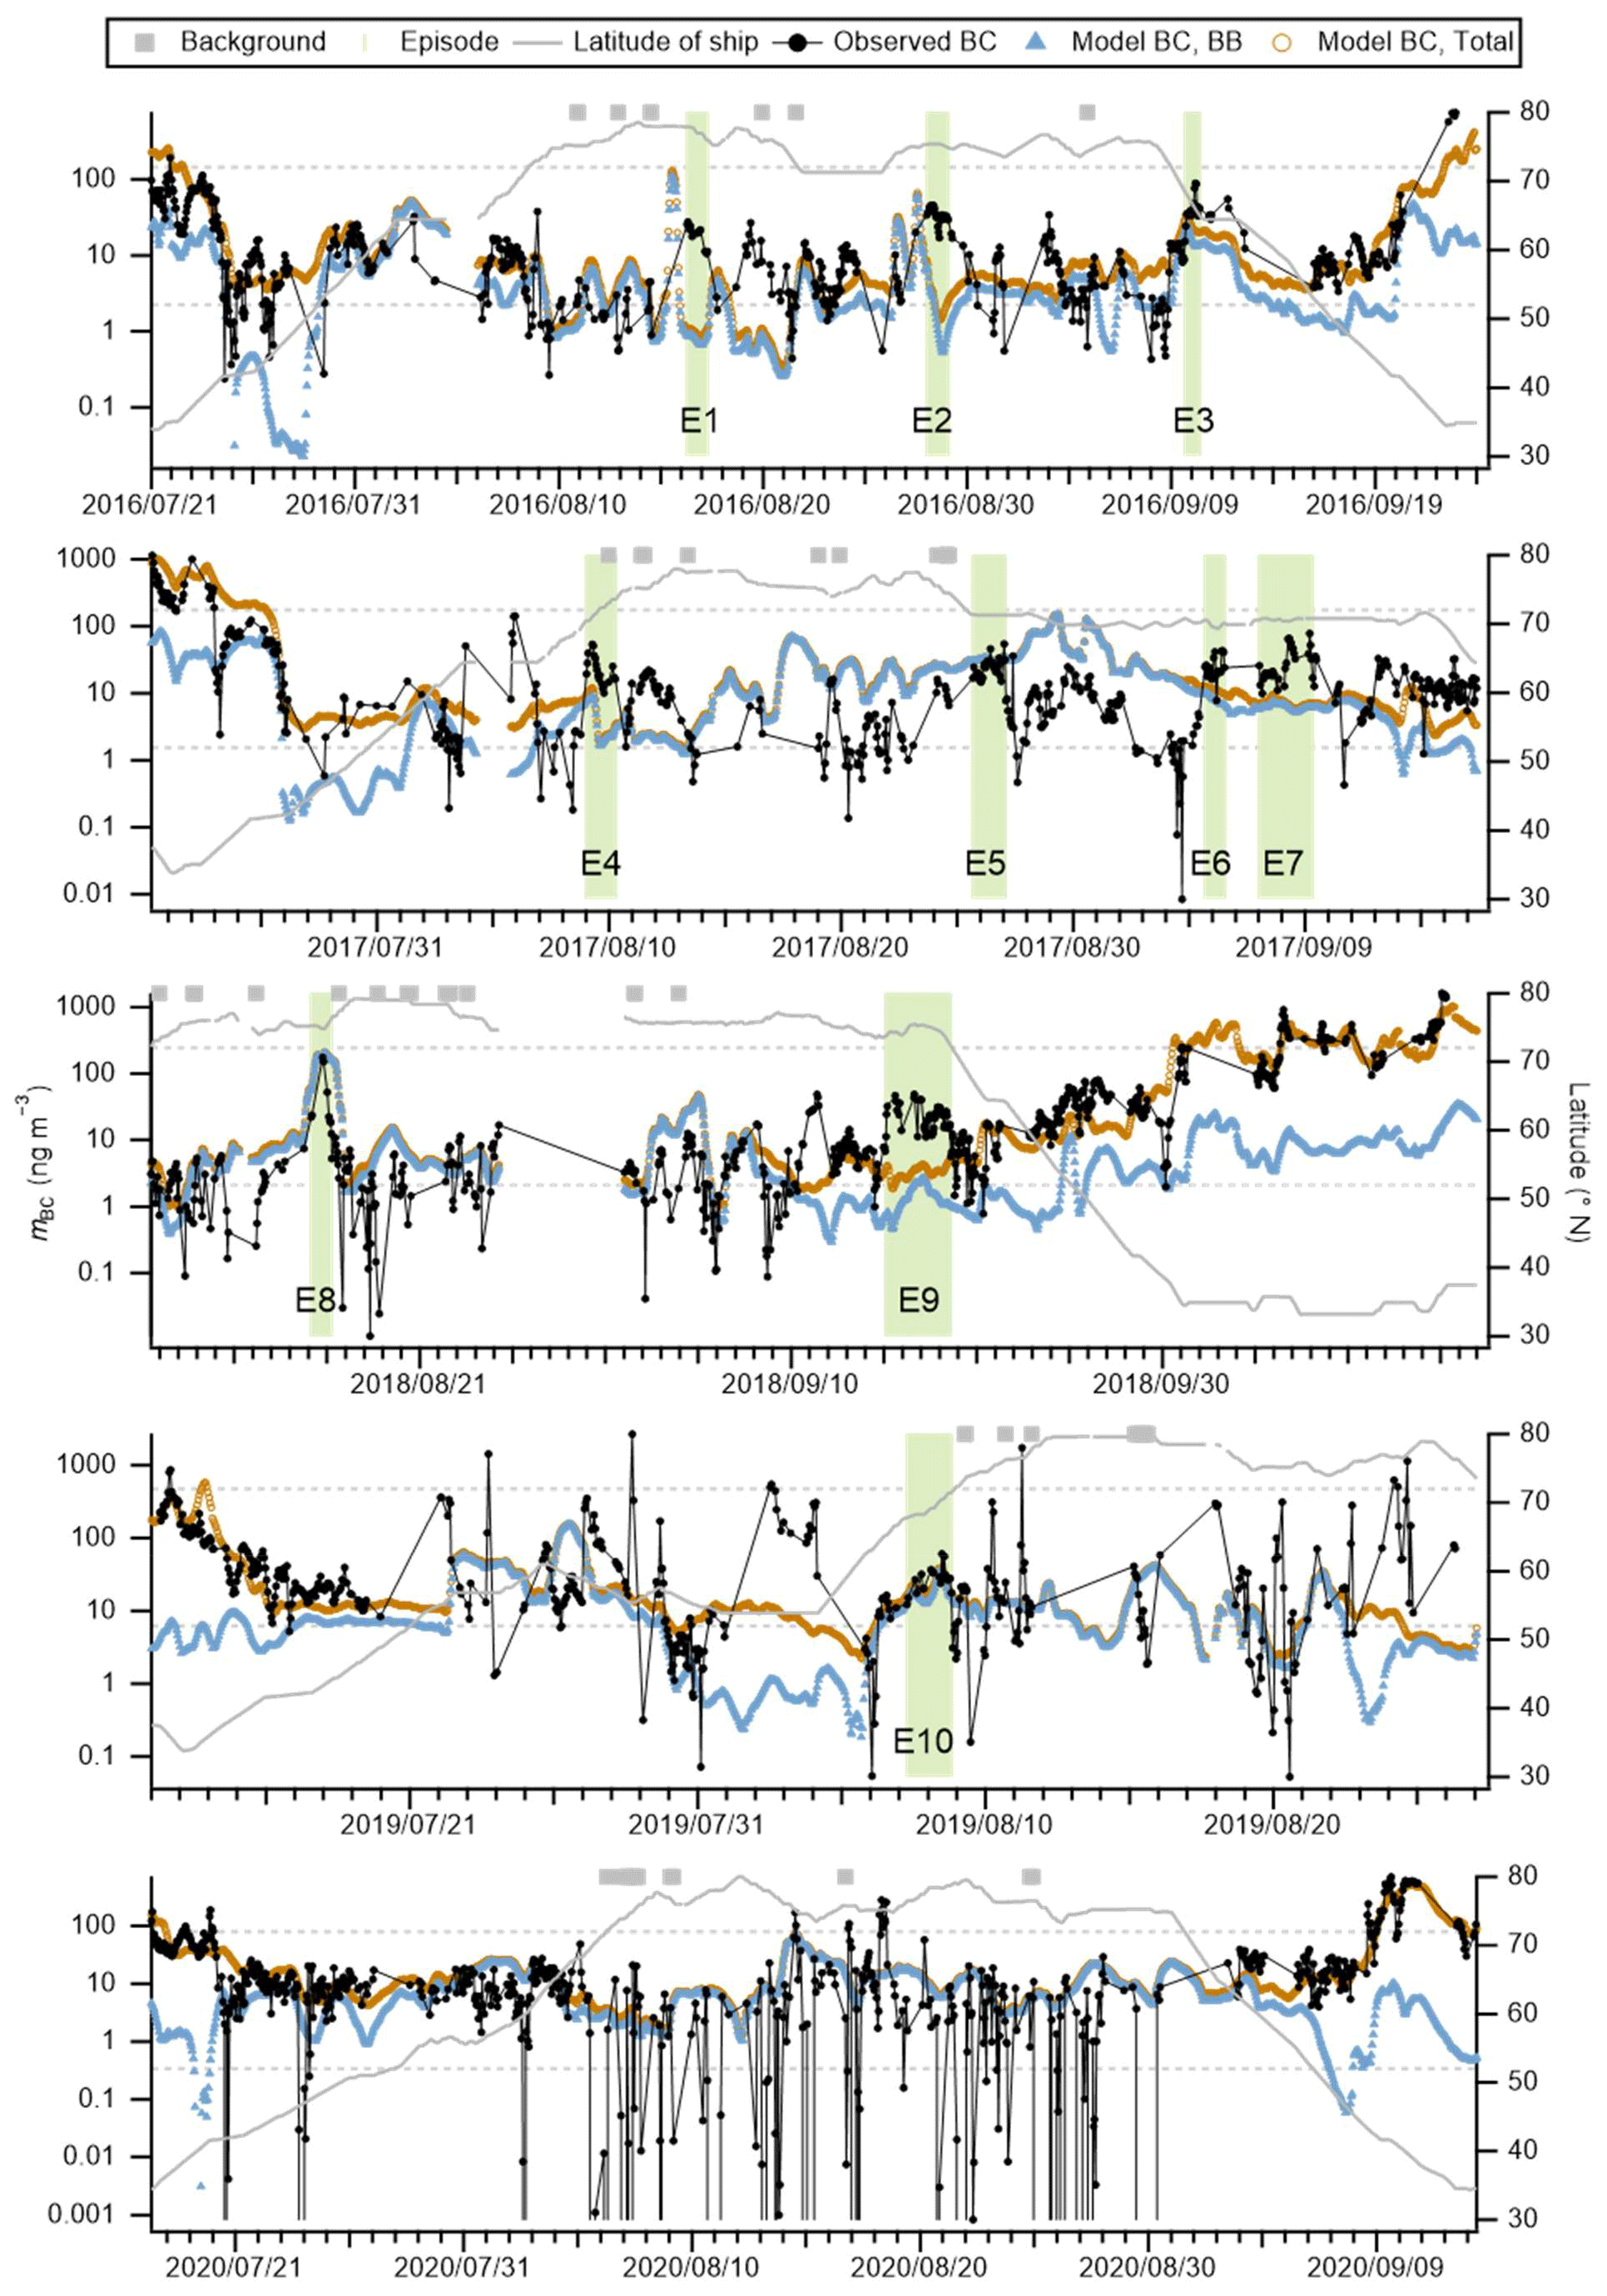
Figure 3Time series of mass concentrations of observed BC, model-simulated total BC and biomass burning BC, and latitude of ship positions. The Arctic Ocean background periods defined in Sect. 4.2 and 10 high-BC episodes (E1–E10) are also shown. The dashed light-gray lines represent latitudes 52 and 72° N. The mBC presented here is at 1 h time resolution, and the data influenced by ship exhaust have been removed. The time series of raw 1 h mBC before removing the influence of ship exhausts are presented in Fig. S6.
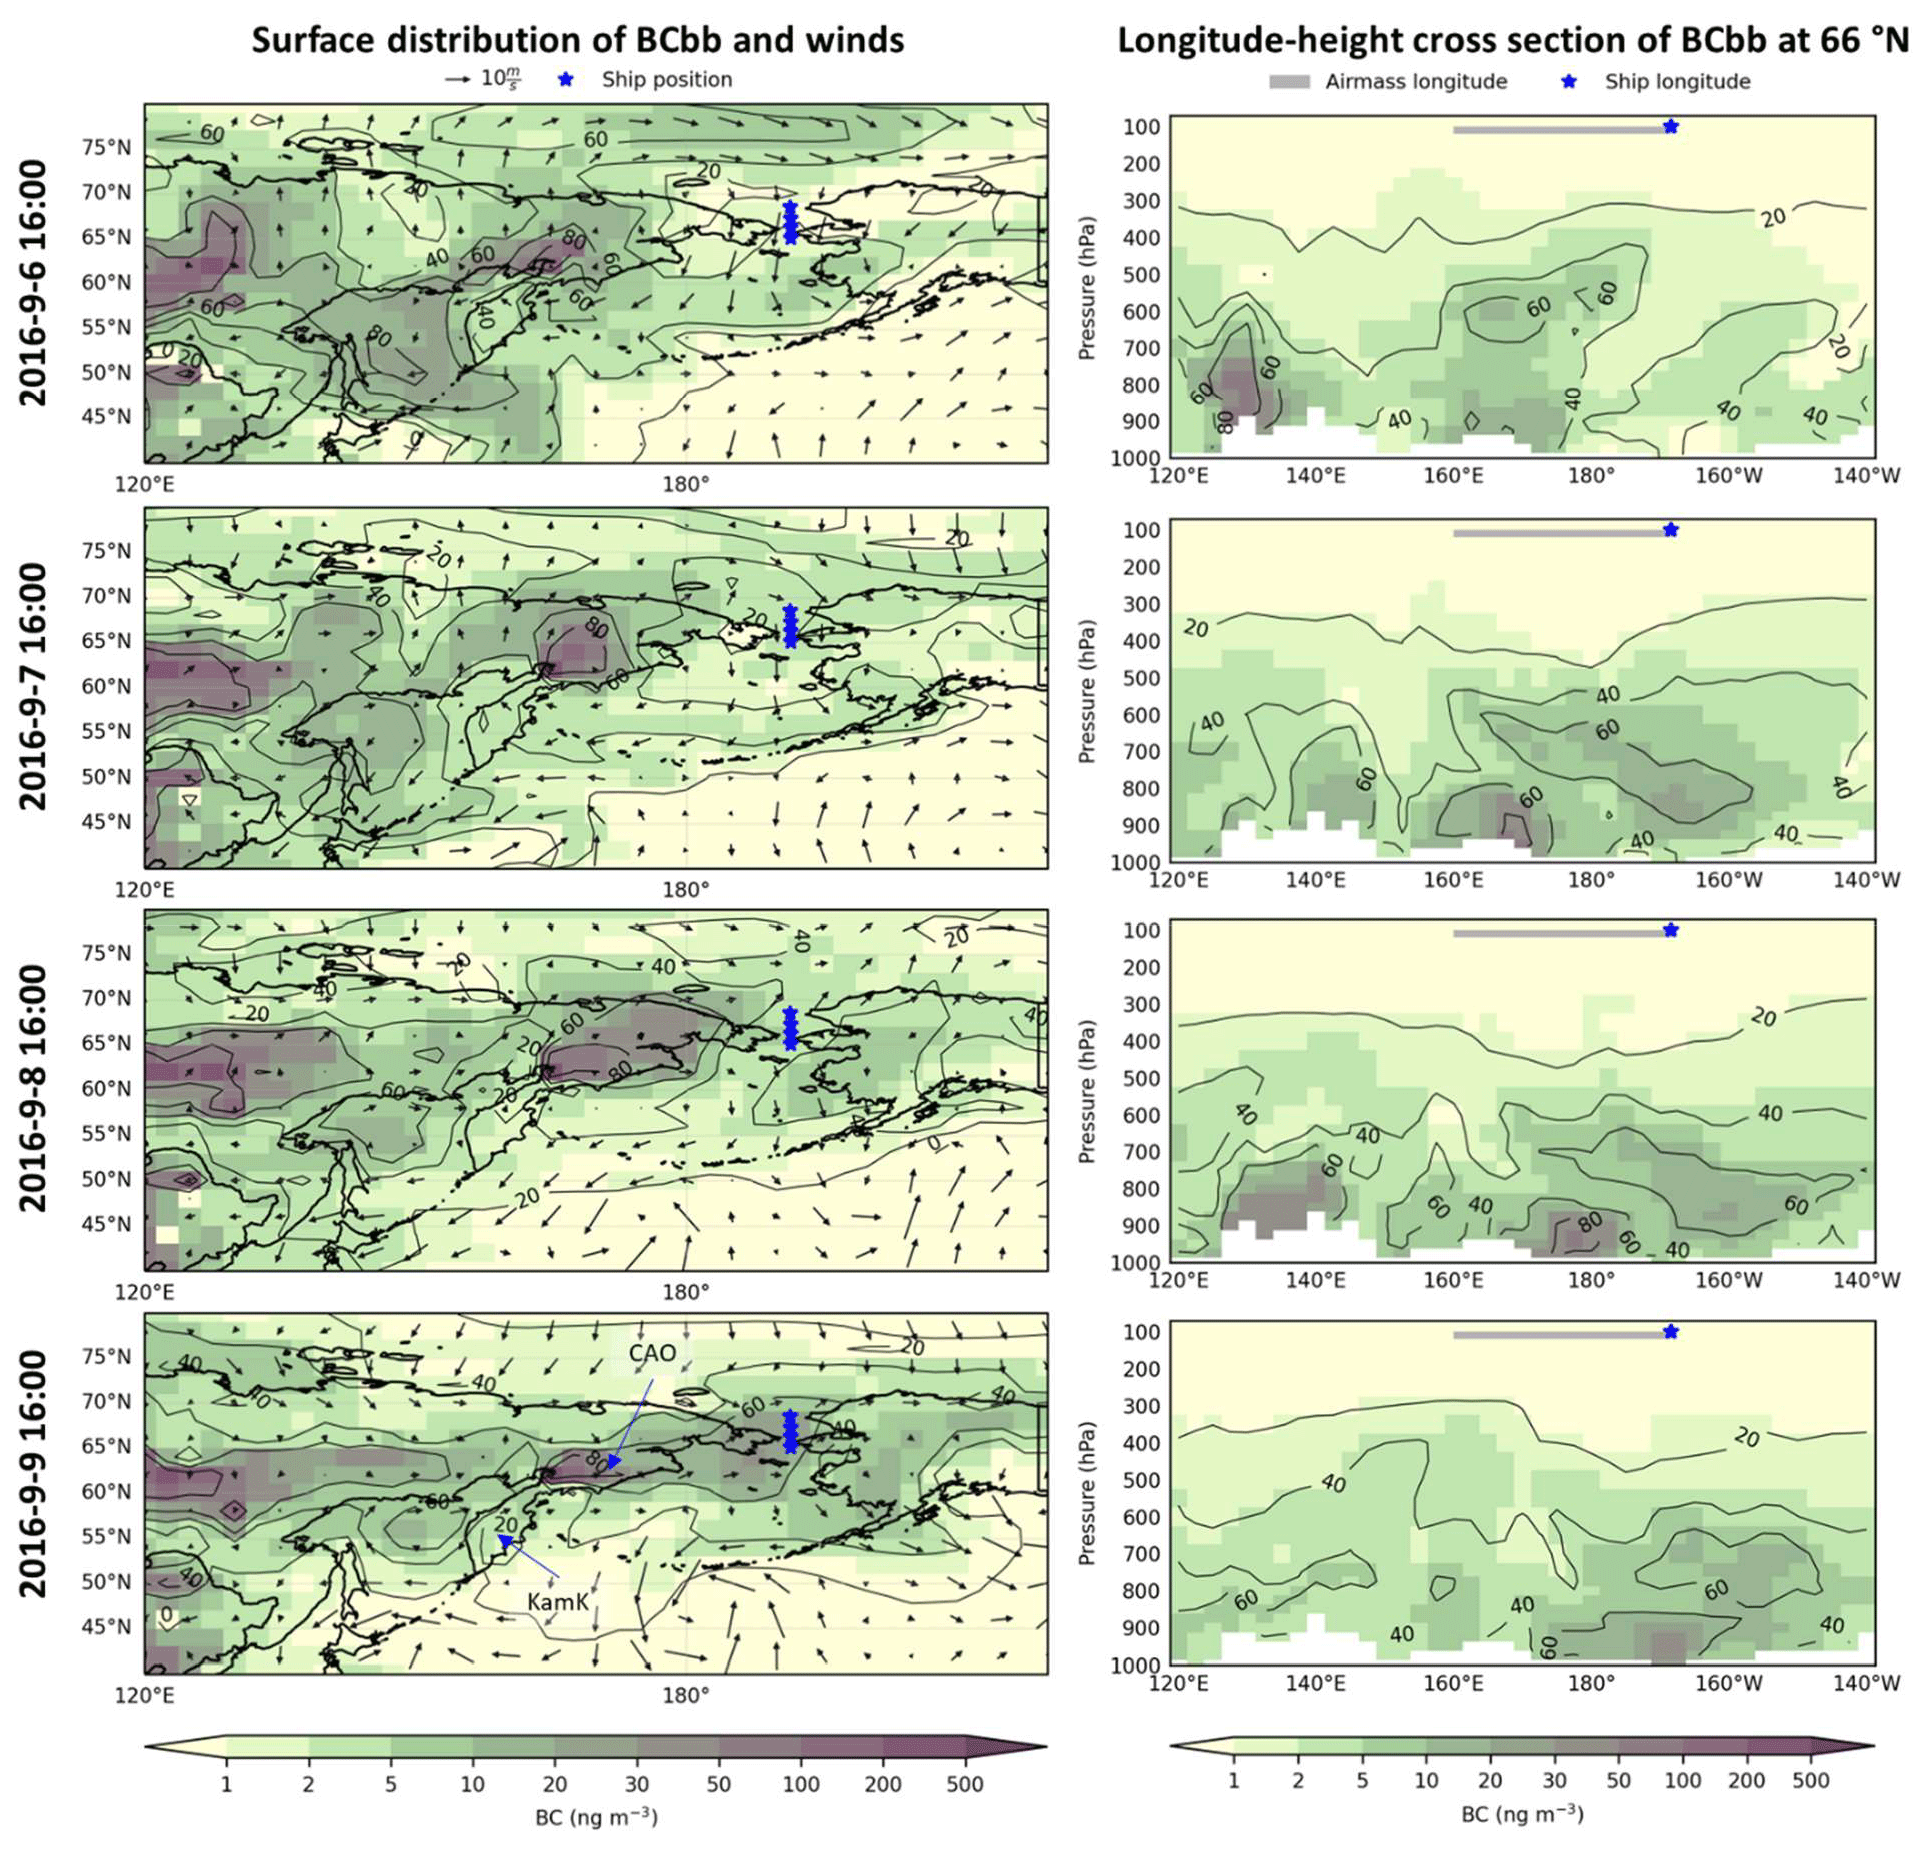
Figure 4Simulated biomass burning BC (BCbb; color image) surface distributions (left) and longitude–pressure cross sections at 66° N (right) before Episode 3. Shown in the left panels are surface winds and the ship positions. Shown in the right panels are the ship longitude positions and the possible transport region of BC-containing air masses related to Episode 3. The latter was inferred from the GEOS-Chem model (left) and back trajectories (Fig. S9). In both panels, the contour plot represents the ratio of simulated biomass burning BC to total BC (%). In the bottom-left panel, CAO is the Chukotka Autonomous Okrug, and KamK is Kamchatka Krai.
To our knowledge, this is the first study that has calculated the background concentration of BC in the Arctic marine boundary layer during summer periods. The strong correlation between the estimated mean background mBC values and their respective overall mean values might indicate that the Arctic Ocean atmosphere is readily influenced by long-range transported air pollutants whose dispersion may be inhibited by the polar dome. This adds difficulty to the estimation. Nevertheless, the data used for the estimation are mostly limited to within the western Arctic Ocean, and the number of data used for the estimation is small. Future studies based on a larger dataset size over broader areas in the Arctic Ocean are promising in terms of providing a better estimation of the Arctic Ocean background BC concentration.
4.3 Comparisons between observations and model simulations
The time series of GEOS-Chem-model-simulated total BC mass concentration (mBC,S) and that ascribed to biomass burning sources (mBC,SBB) are also presented in Fig. 3, which shows that GEOS-Chem overestimated some low mBC (e.g., during 28 August to 5 September 2017) and underestimated some high mBC (e.g., 18 August 2020). Scatterplots between mBC,S and mBC are presented in Fig. S7. Except during the 2019 cruise, the R values in other years were greater than 0.5. The R for the overall model versus observed mBC was 0.66. Therefore, the GEOS-Chem model can reproduce (0.66×0.66 =) 44 % of the spatial and temporal variations in the shipborne mBC. The normalized mean biases (NMBs) of the model simulated from observed mBC in 2017 and 2019 were high, i.e., 102.9 % and −37.4 %, respectively. They were lower in other years, with 16.6 %, −8.5 %, and −3.1 % in 2016, 2018, and 2020, respectively. The overall normalized mean bias was estimated to be 4.6 %. Statistical analysis of NMB showed no distinct spatiotemporal variation characteristics (Fig. S8). Furthermore, the ratio of mean absolute error to the mean of mBC (MAE mean) ranged from 0.5 to 1.4 for individual cruises, with an overall estimate of 0.8 for all cruises (Fig. S7). This suggests that the model can reproduce observed data with an average relative uncertainty of less than 1.4.
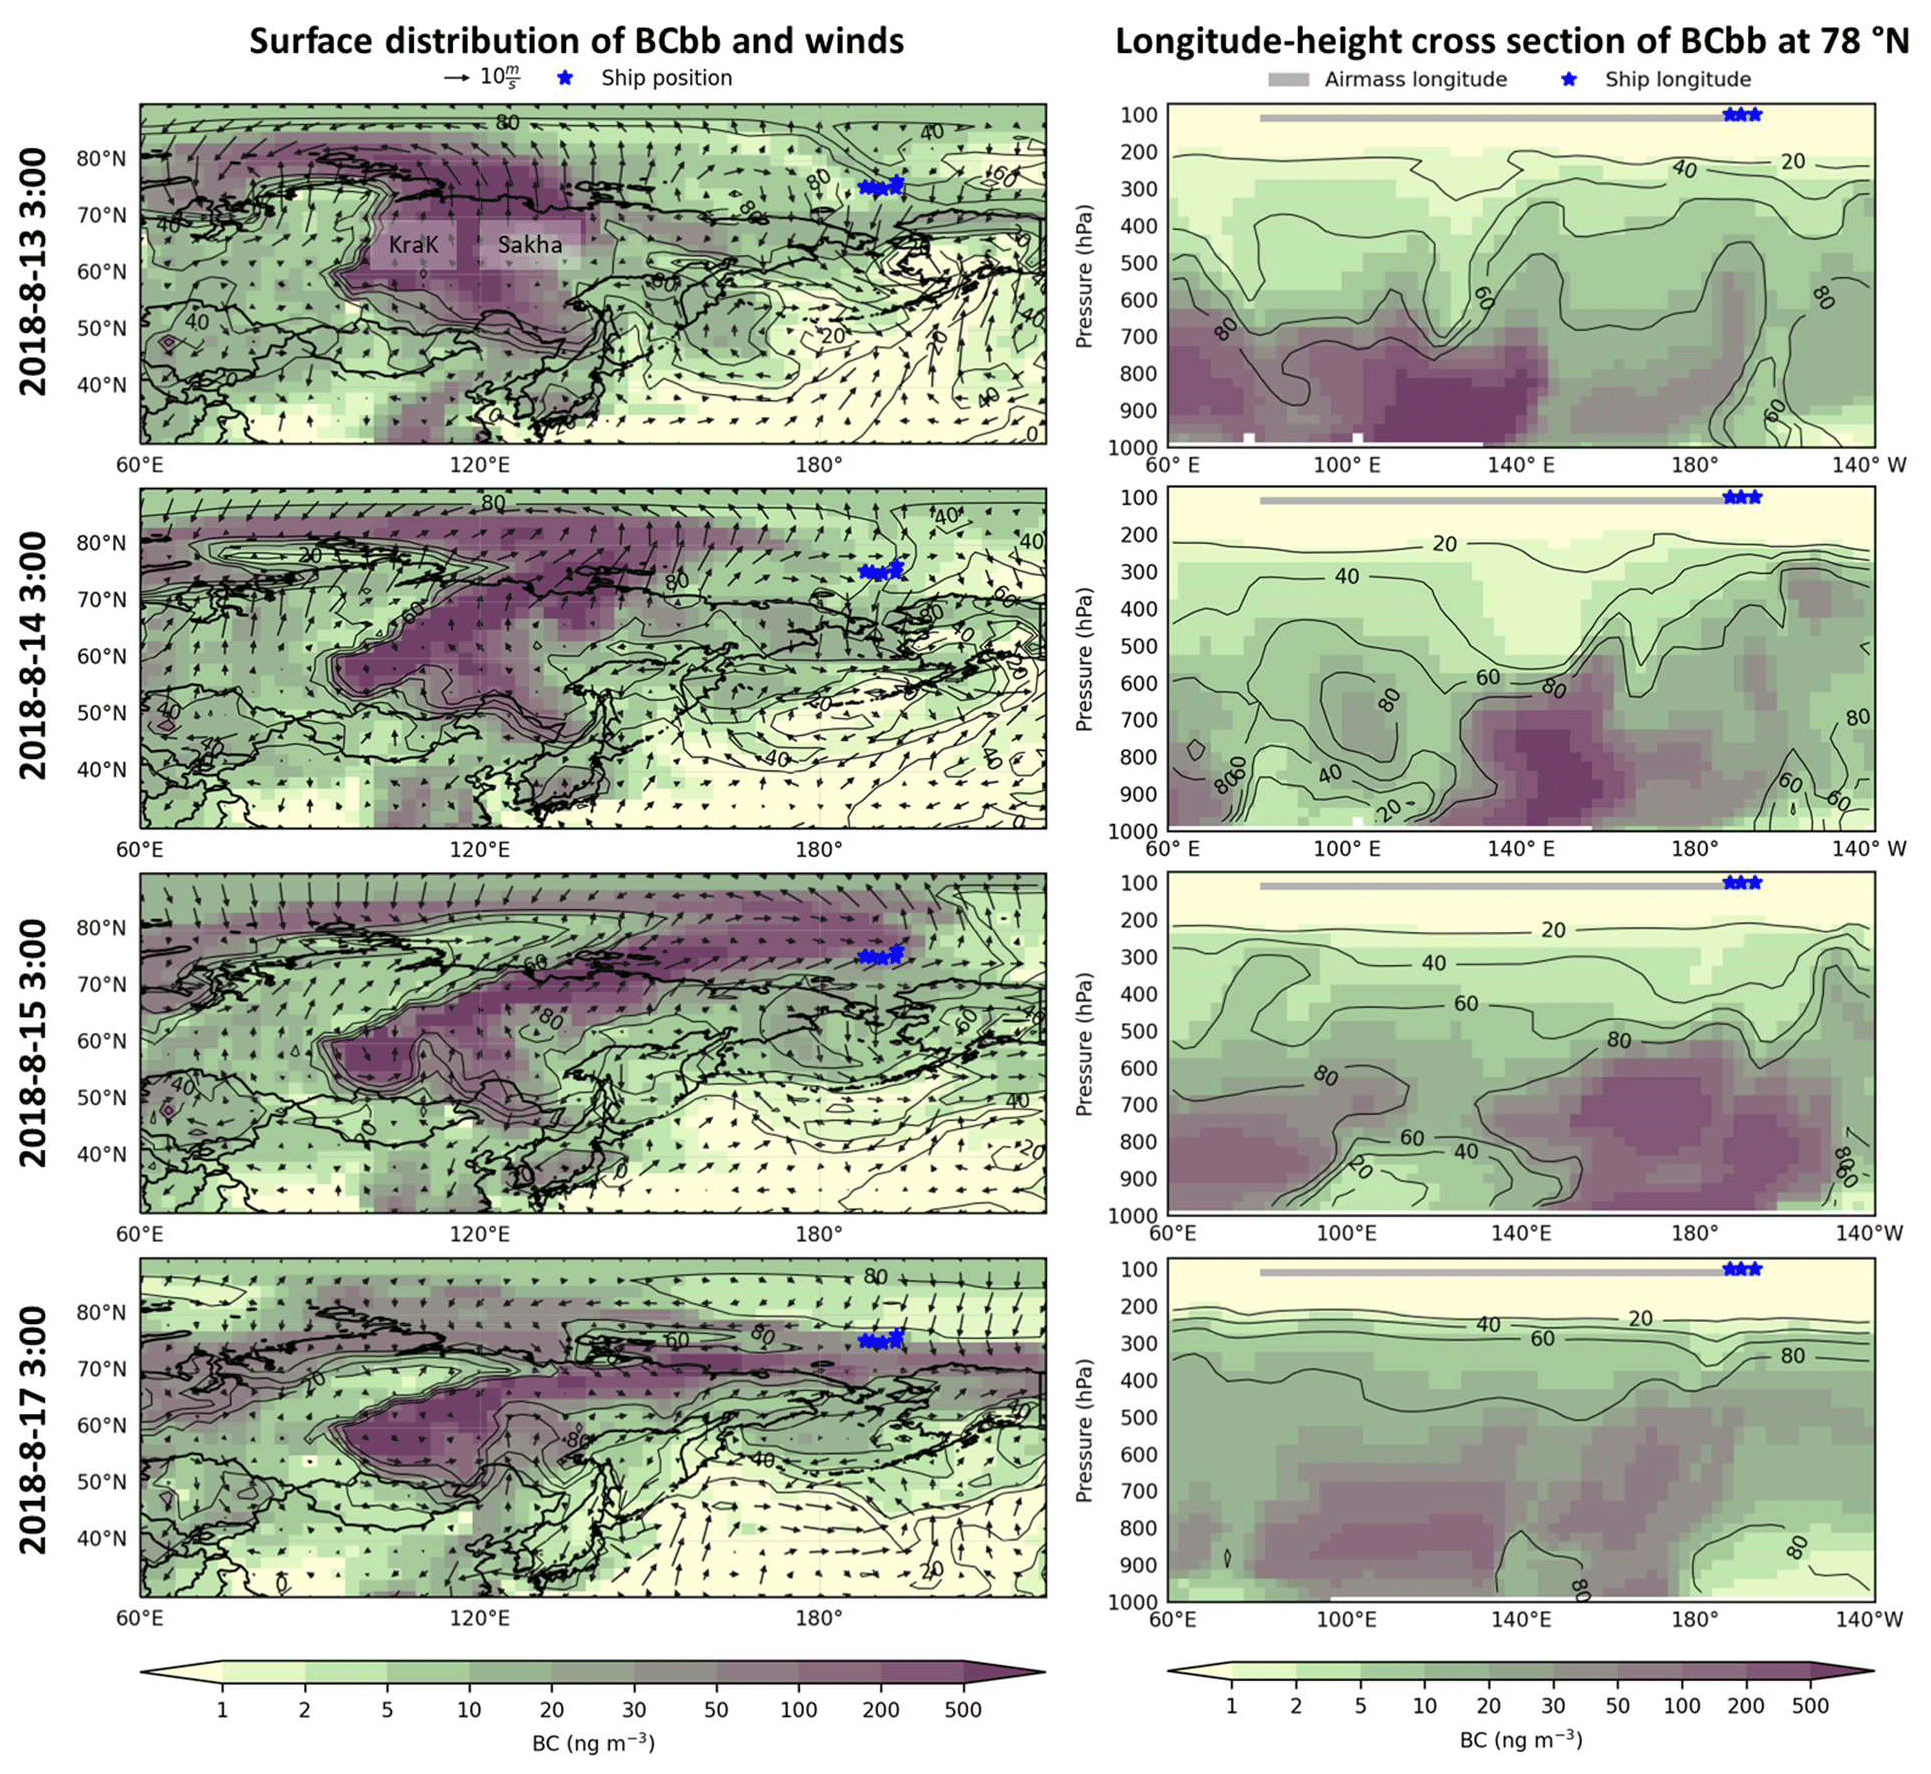
Figure 5Simulated biomass burning BC (BCbb; color image) surface distributions (left) and longitude–pressure cross sections at 78° N (right) before to right after Episode 8. Shown in the left panels are surface winds and the ship positions. Shown in the right panels are the ship longitude positions and the possible transport region of BC-containing air masses related to Episode 8. The latter was inferred from the GEOS-Chem model (left) and back trajectories (Fig. S11). In both panels, the contour plot represents the ratio of simulated biomass burning BC to total BC (%). In the upper-left panel, KraK is Krasnoyarsk Krai and Sakha is the Republic of Sakha.
GEOS-Chem failed to reproduce almost all the high BC spikes observed in the Arctic Ocean in 2019. As discussed in Sect. 4.1, the high spikes in 2019 were likely caused by intensive wildfires in the Arctic, especially eastern Siberia (Antokhina et al., 2023) and Alaska (Bhatt et al., 2021). Therefore, we can infer that the lower accounting of wildfires in the boreal regions by the GFED4s biomass burning inventory used in this study might be the main reason for the poor reproduction of observed BC during the 2019 cruise by GEOS-Chem (Pan et al., 2020), considering that the transport path of BC from the boreal regions to the Arctic Ocean is mainly through the lower to middle atmosphere as indicated by the analyses in Sect. 4.4 and previous studies (e.g., Ikeda et al., 2017; AMAP, 2021b). Thus, it is necessary to improve the estimation of biomass burning emissions in the boreal regions. However, the influence of possible uncertainties in the transport regime of the GEOS-Chem model (e.g., overestimation of wet deposition) in reproducing the peaks observed during the 2019 Arctic cruise cannot be ruled out. In addition, Fig. S7 shows a systematic overestimation of the model mBC when the observed mBC is lower than 1 ng m−3. Similar overestimation was also found in Whaley et al. (2022), which was possibly caused by the coarse resolution of the GEOS-Chem model, making it unable to accurately simulate such low BC mass concentrations.
4.4 Sources of high-BC episodes
Statistical analyses of the GEOS-Chem-simulated ratio of biomass burning BC to total BC (mBC,SBB mBC,S) are presented in Fig. 2b, which indicates that BCbb accounted for more of the observed BC mass concentration in higher than in lower-latitude regions. In the Arctic Ocean (i.e., north of 72° N), BCbb contributed on average 67 %–92 % of total BC observed along the cruise tracks. In the marginal Arctic Sea regions (i.e., between 52 and 72° N), mBC,SBB mBC,S was estimated to be 62 %–74 % except during the 2018 cruise, when it was estimated to be 16 % (Fig. 2b). These results indicate that most of the observed BC in the Arctic during summer and autumn was from biomass burning sources. This aligns with previous model studies indicating that during summer, the transport efficiency of low-latitude anthropogenic BC to the Arctic was low, and biomass burning BC contributed more than 63 % to the surface BC in the Arctic (Ikeda et al., 2017; Zhu et al., 2020).
Elevated BC mass concentration periods were observed on almost every Arctic cruise (Fig. 3). To characterize the sources of the high concentrations of BC in the Arctic Ocean and the marginal seas (north of 65° N), we identified periods when the 1 h mBC exceeded 10 ng m−3. From these periods, we further selected those lasting 18 h or longer, and the mean of valid 1 h mBC during the selected period was not less than 20 ng m−3. This process allowed us to identify and refine 10 high-BC episodes (Figs. 1, 3, S1, and S6; Table 3). Episode 1 (abbreviated as E1 and abbreviated similarly for other episodes) and E8 were observed in the Arctic Ocean, E2 was observed in the East Siberian Sea, E3 was observed on the way from the Chukchi Sea to the Bering Strait, E4 and E10 were observed in the Chukchi Sea, E5–E7 were observed in the Beaufort Sea near the Alaska coast, and E9 was observed on the way from the East Siberian Sea to the Chukchi Sea. Table 3 presents the time and space range details, as well as observed and model-simulated mean BC mass concentrations, during the 10 episodes. According to GEOS-Chem model simulation results, except for E9, which occurred in 2018, biomass burning contributed more than 69 % of the observed BC during all the other episodes (Table 3). Note that despite substantial normalized mean biases in model simulations compared with observed mBC for these episodes, ranging from −95 % to 178 %, we consider it reasonable to estimate the contribution of biomass burning to the total BC based on the model results. This is attributed to the pervasive dominance of biomass burning BC north of 65° N, where all episodes were identified (Fig. 3). The estimate is further supported by the uncertainty analysis, involving shifting the episode period back or forward by 18 h while maintaining its length, which revealed changes of no more than 10 % in the ratio of modeled biomass burning to total BC for most episodes. Additionally, the spatial and temporal variations in E3, E8, and E10 were well reproduced by the GEOS-Chem model, showing nearly simultaneous peaks in observed and model data during these episodes (Fig. 3). Therefore, in the following sections, the sources and transports of BC during E3, E8, and E10 are elaborated based on the GEOS-Chem model, with findings further corroborated by the HYSPLIT back trajectory model.
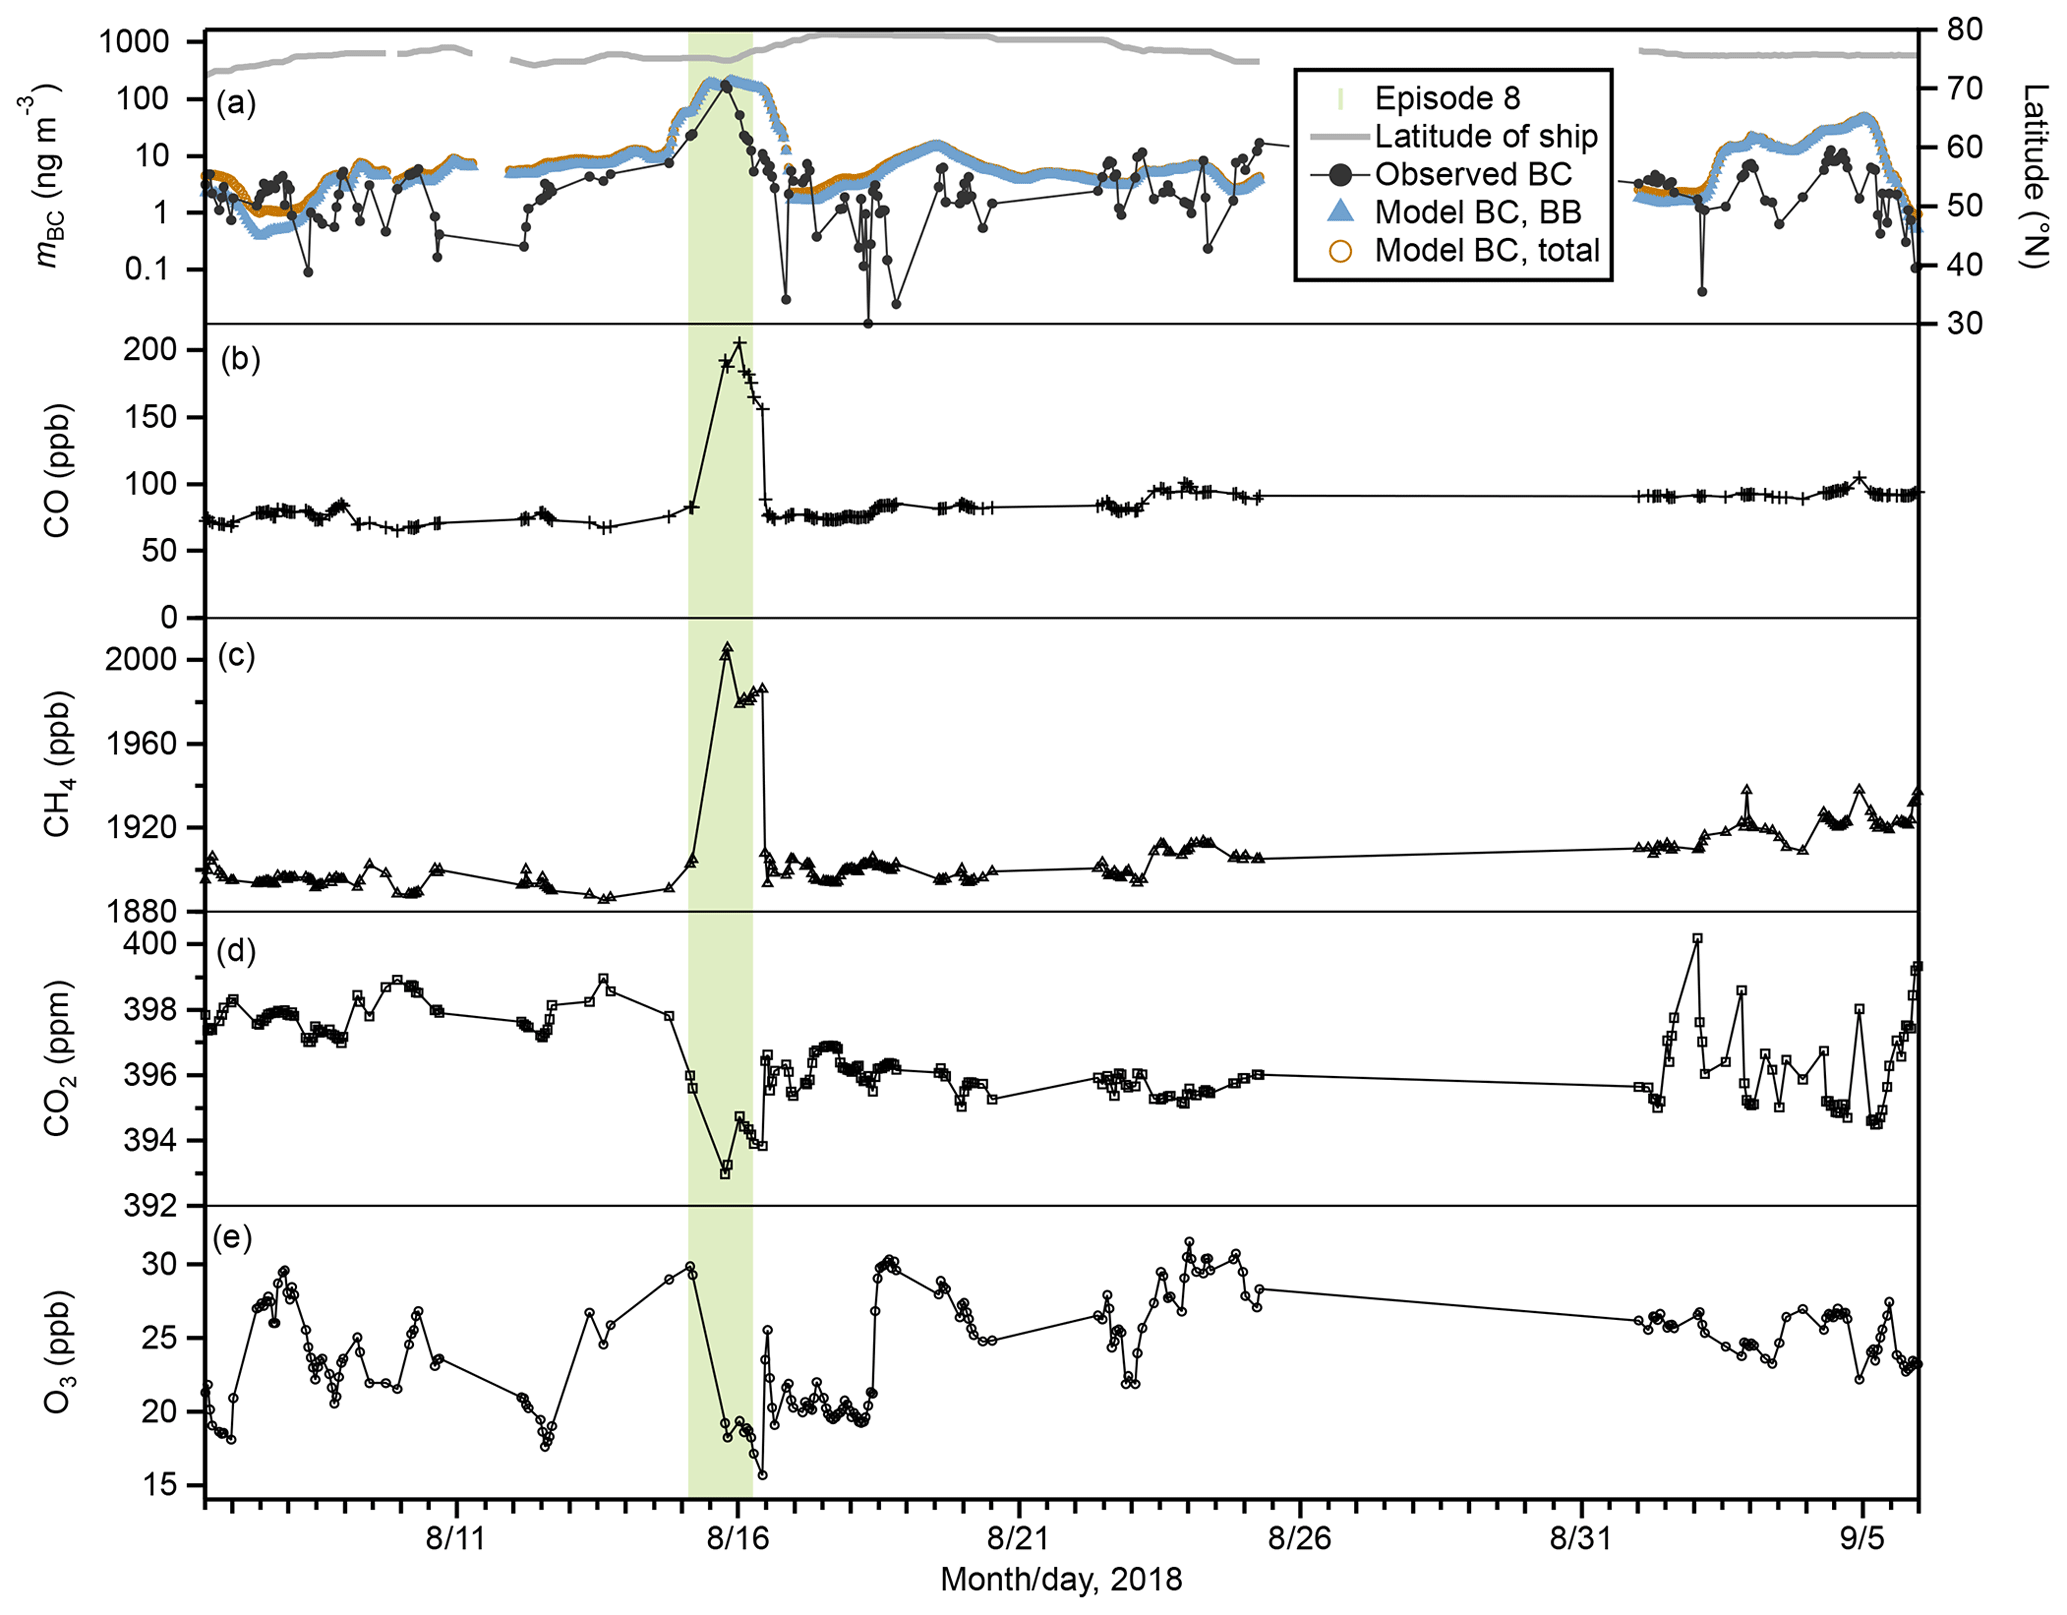
Figure 6Time series of (a) observed BC, model-simulated total BC and biomass burning BC, and latitude of ship positions, along with (b) CO, (c) CH4, (d) CO2, and (e) O3 during the 2018 shipborne observation. Bar shade indicates the Episode 8 period.
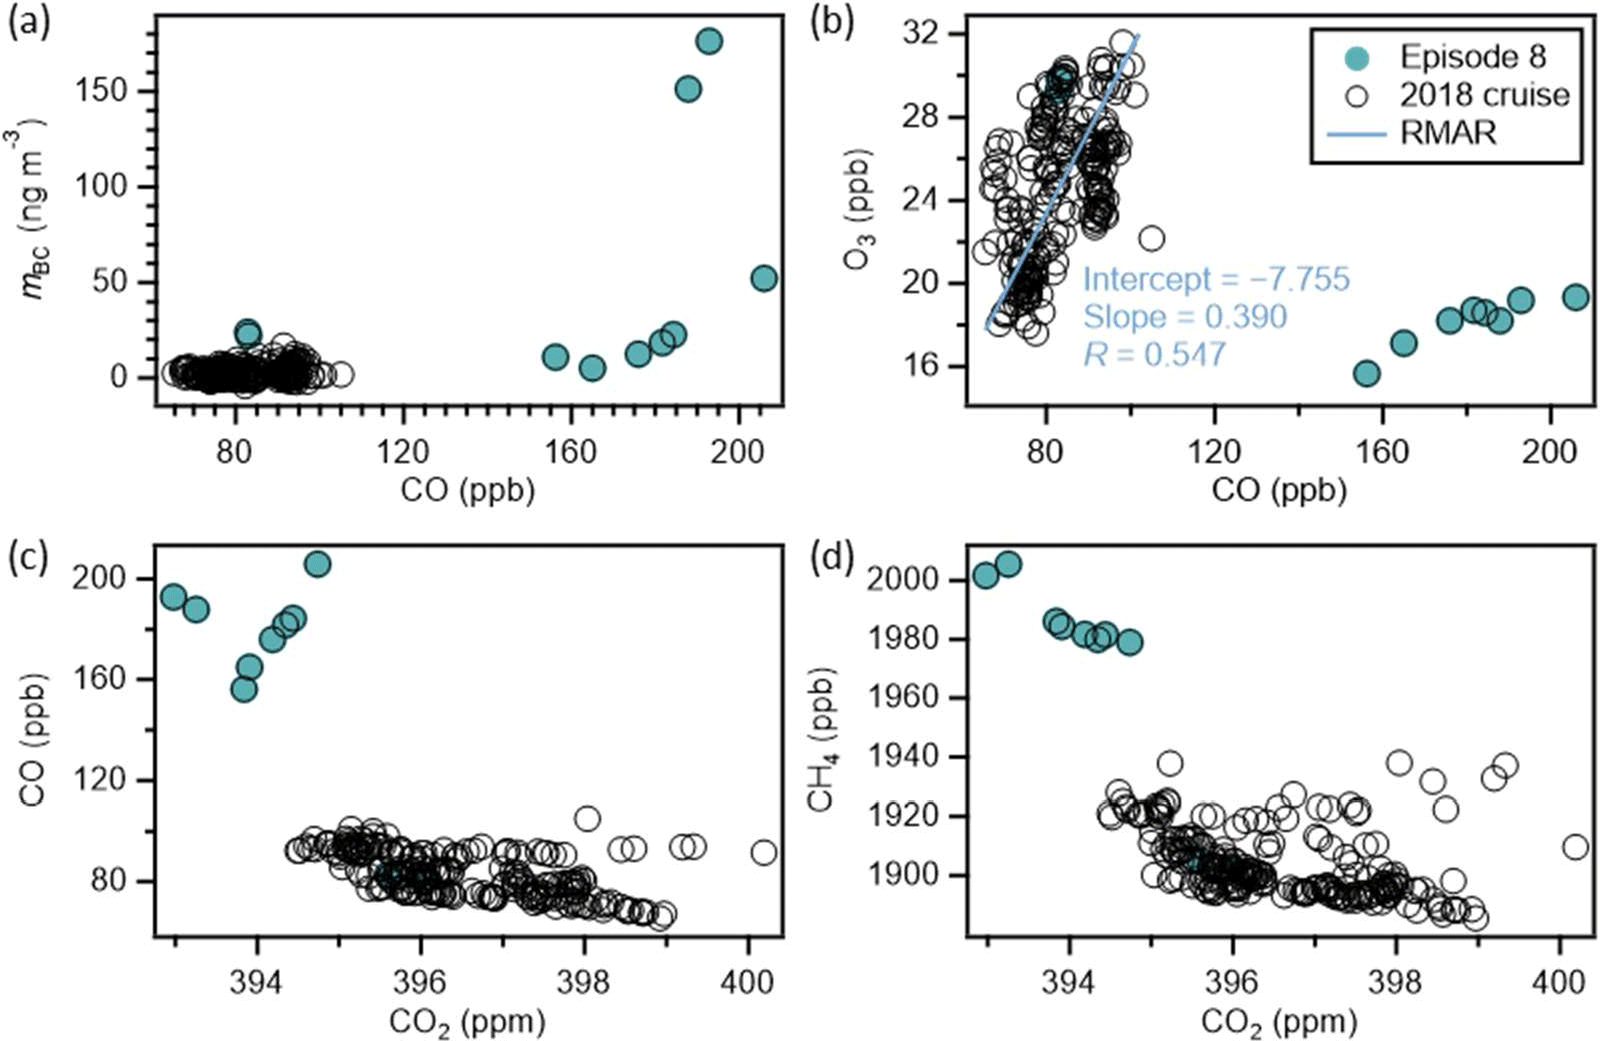
Figure 7Scatterplots of (a) mBC versus CO, (b) O3 versus CO, (c) CO versus CO2, and (d) CH4 versus CO2 during the cruise in the Arctic Ocean in 2018 and Episode 8. In (b), the line represents the reduced major axis regression (RMAR) for data having not been influenced by Episode 8 air masses; the intercept, slope, and correlation coefficient are also presented.
4.4.1 Episode 3
Episode 3 was measured during 9 September 2016 at 16:00 to 10 September 2016 at 10:00 UTC. The mean mBC is 44 ng m−3, and BC from biomass burning was estimated to contribute 69 % of the total BC (Table 3). Figure 4 presents the surface distribution of BCbb and the surface winds before this episode. It suggests that the biomass burning which occurred at the border of the Chukotka Autonomous Okrug (CAO) and Kamchatka Krai (KamK) was likely the main source of this episode. Southwest winds brought the biomass burning BC-containing air masses from the source region to the ship positions. Figure 4 indicates that biomass burning contributed 80 % of the BC mass concentration at this source region. GFED4s data and back trajectories (Fig. S9) also indicate that the biomass burning which occurred at the border of CAO and KamK was likely the main source of the observed high BC mass concentration during E3. The longitude–pressure cross sections of BCbb also presented in Fig. 4 suggest that the height of the transport path of BCbb was constrained to > 700 hPa (i.e., 3 km) and there was little contribution of subsidence BC from the upper atmosphere. This is also supported by the height distributions of back trajectories (Fig. S9), which indicate that the observed air masses were transported to the ship position within 2.5 km a.g.l. (above ground level). Compared with BCbb, the contribution of anthropogenic BC to the observed high BC mass concentrations in E3 was relatively small through either surface level or above-ground transports (Fig. S10).
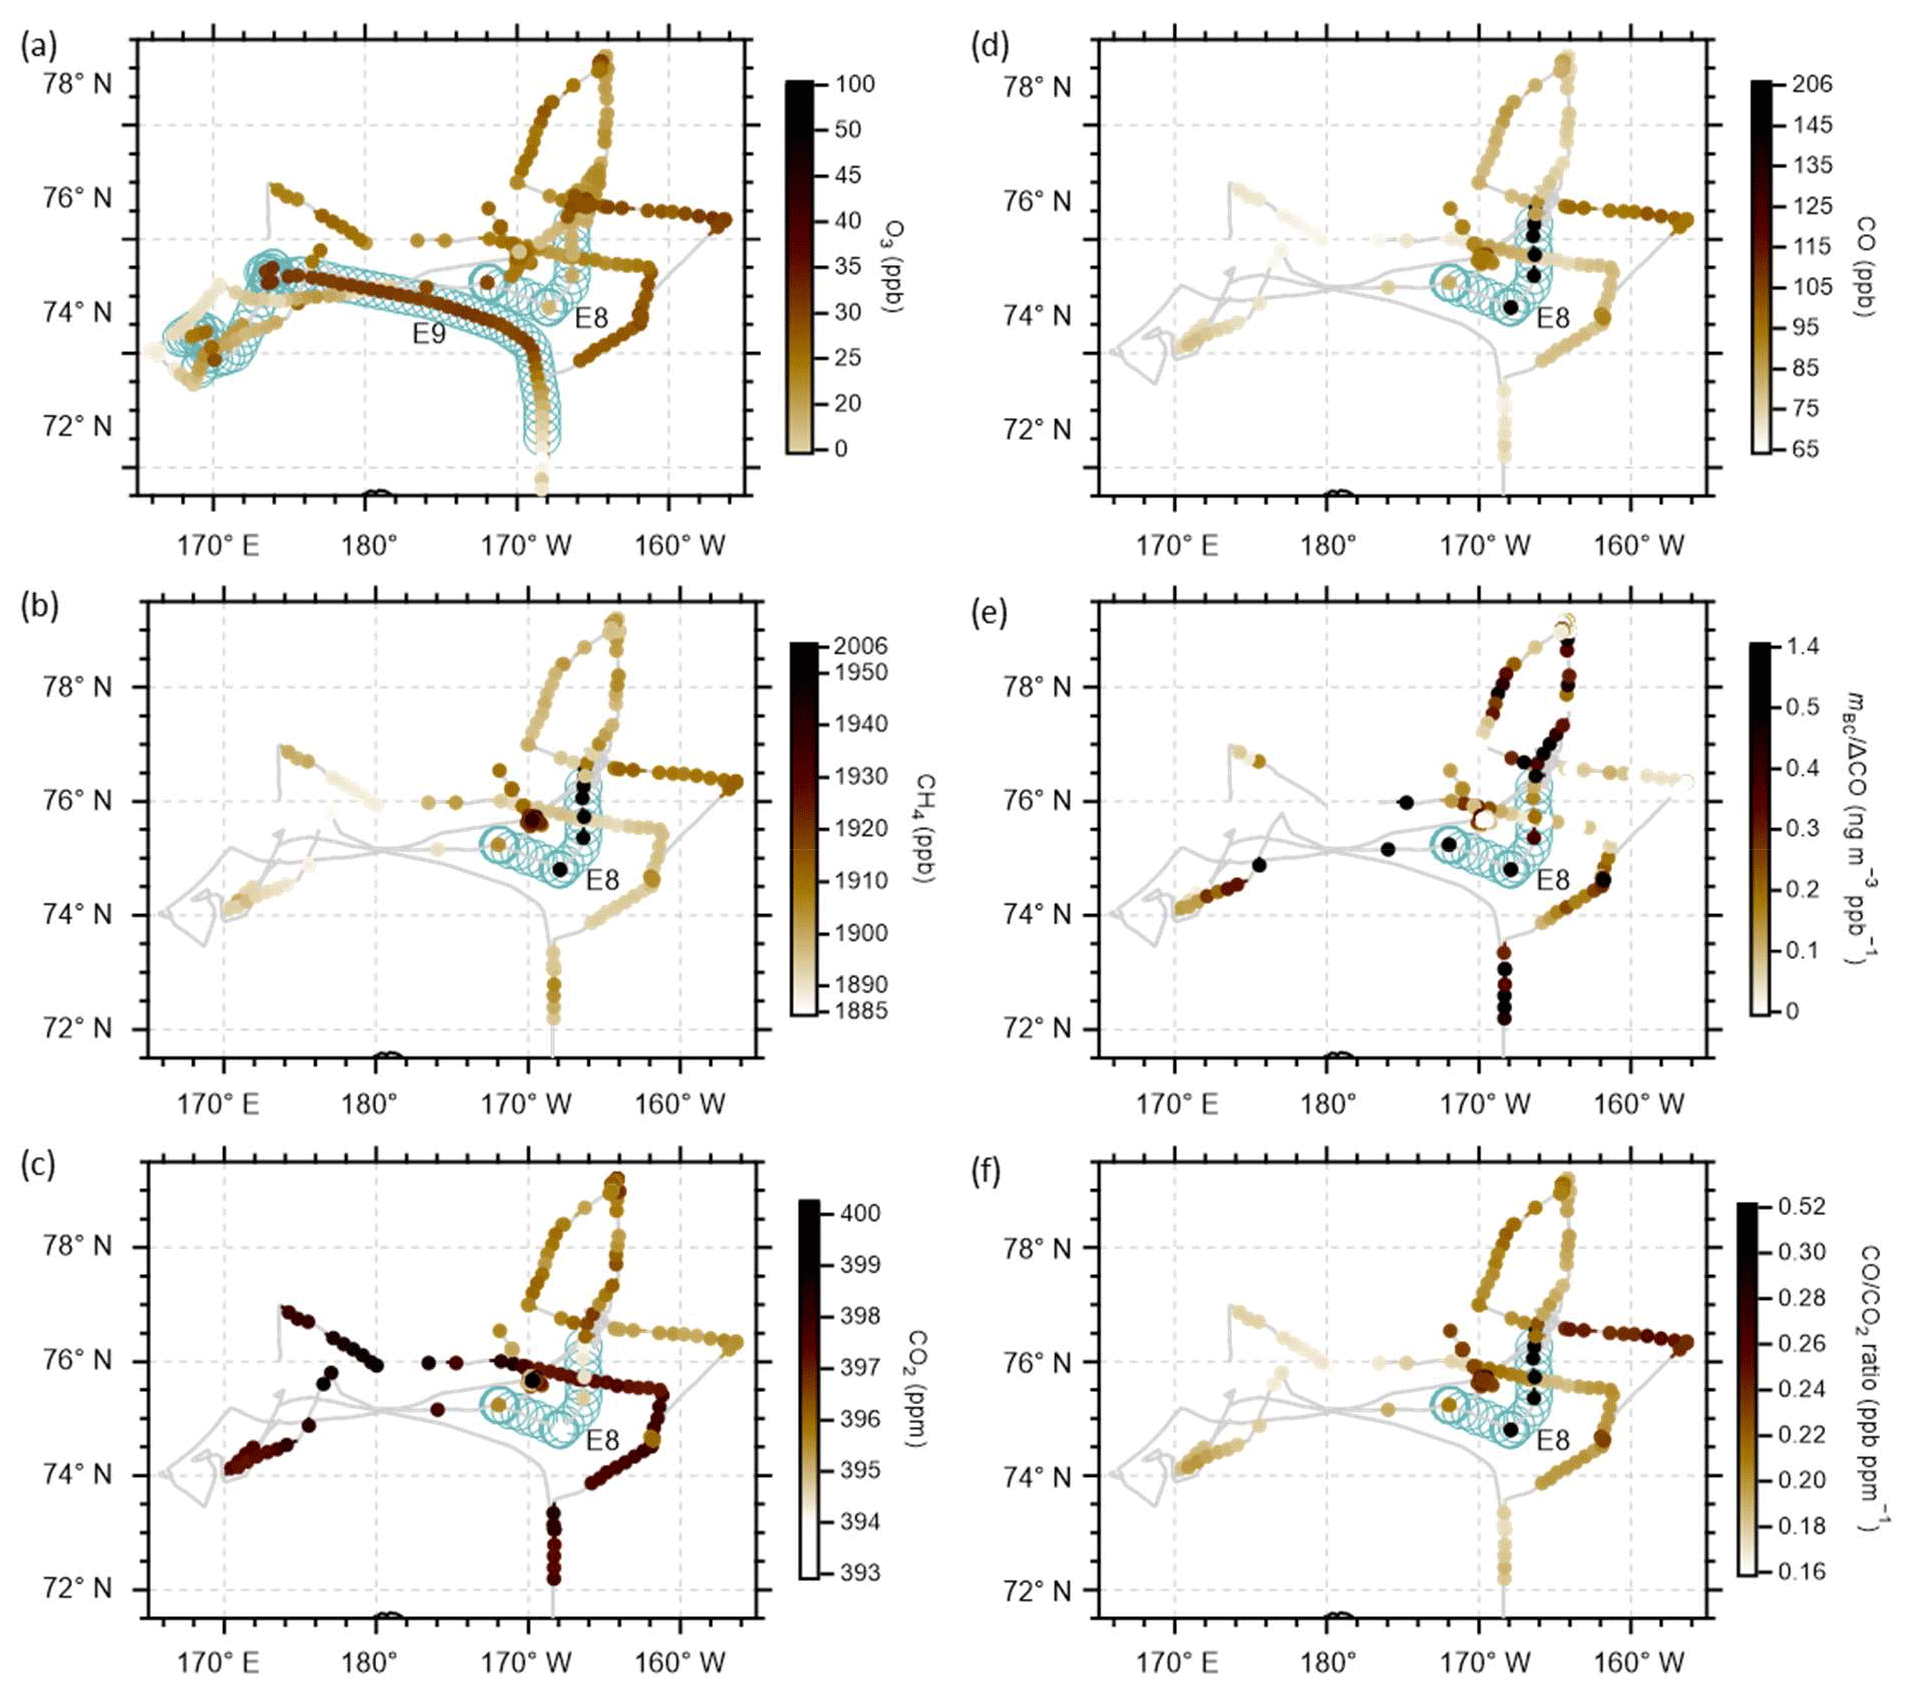
Figure 8Surface distributions of O3 (a), CH4 (b), CO2 (c), and CO (d) mixing ratios, as well as CO (e) and 2 (f) ratios, along the ship track during part of the 2018 cruise in the Arctic Ocean. In each panel, the gray line represents the cruise track; the filled color markers superimposed on the track indicate the respective observed (a, b, c, and d) or derived (e and f) parameters, which are at 1 h time resolution and screened to remove the influence of ship exhausts; and the open circles represent the ship positions during episodes 8 (a–f) and 9 (a). Note that valid CH4, CO, and CO2 data are only available for a limited time frame (see Fig. 6). For the derivation of ΔCO, the baseline of CO is defined as the minimum 1 h CO data, and the CO ratio was calculated only when ΔCO was higher than 4 ppb.
4.4.2 Episode 8
Episode 8 was measured during 15 August 2018 at 03:00 to 16 August 2018 at 06:00 UTC (Fig. 3). The mean mBC is 55 ng m−3, and BC from biomass burning was estimated to contribute 98 % of the total BC (Table 3). Note that although there are only nine valid 1 h mBC values during E8, the following analyses on gaseous species as well as GEOS-Chem and back trajectory model simulations indicate that E8 is part of a prominent transport event of Siberian biomass burning air masses to the Arctic Ocean. Figure 5 presents the surface distribution of biomass burning BC and winds before, during, and after Episode 8. Biomass burning air masses from Krasnoyarsk Krai (KraK) and the Republic of Sakha (Sakha) were transported northwards and northeastwards to the Siberian Arctic and then spread eastwards by the westerly from 13 to 14 August. Furthermore, northwest winds blew the biomass burning BC-containing air masses to the ship positions on 15 August. Figure 5 indicates that biomass burning contributed more than 80 % of BC mass concentration in the transported air masses. These transport paths are also supported by GFED4s data and back trajectory analyses (Fig. S11). Figure 5 also shows that the biomass burning BC-containing air masses were blown away from the ship later by northerly winds. Although the height distribution of back trajectories presented in Fig. S11 showed that the observed air masses during E8 were transported to the ship position mainly under 2 km a.g.l., longitude–pressure distributions of BCbb presented in Fig. 5 indicate that the transport of biomass burning BC-containing air masses from the source regions to above the ship position was mainly through the lower to middle atmosphere. Although the contribution of anthropogenic BC to the observed BC in Episode 8 was very small, surface level concentration distribution and longitude–pressure cross sections (Fig. S12) show that they followed transport paths to the ship positions that were similar to those of the biomass burning BC.
Figure 6 presents the time series of the atmospheric mixing ratios of CO, CH4, CO2, and O3, as well as observed and model-simulated BC mass concentrations during the 2018 shipborne observation when CO, CH4, and CO2 data were obtained. During Episode 8, the mixing ratios of CO and CH4 increased, whereas those of CO2 and O3 did not or even slightly decreased. Similar phenomena have been reported in previous studies in the lower atmosphere over Siberia (Paris et al., 2010). The increased CO and CH4 are consistent with the observation of biomass burning plumes possibly related to smoldering combustion conditions (Andreae et al., 1994). The slight decrease in CO2 is possibly due to uptake by intact high-latitude vegetation during the polar daylight period before transportation to the Arctic Ocean (Paris et al., 2010) as well as smoldering combustion conditions, producing much more CO than CO2. The former is consistent with the fact that in Siberia, planetary boundary layer and free-troposphere CO2 concentrations are at their minimum from July to August (Sasakawa et al., 2013). The non-increase or slight decrease in O3 was possibly caused by less active photochemistry in the fire plumes at the northern high latitude (Tanimoto et al., 2000) and/or surface deposition (Sect. S1). Over Siberia, the O3 formed in biomass burning plumes was probably lost largely due to deposition to the forest canopy before being transported out of the Siberia terrestrial region to the Arctic Ocean (Chin et al., 1994; Paris et al., 2010) such that the observed O3 concentration in the plumes was lower than that of the Arctic Ocean background. Scatterplots between mBC versus CO, O3 versus CO, CO versus CO2, and CH4 versus CO2 are presented in Fig. 7, where most of the data points during E8 are significantly different from the others. The reduced major axis regression between O3 and CO during the period of having not been influenced by Episode 8 air masses resulted in a slope of 0.39, which is similar to that derived from the MOSAiC observation in the central Arctic during the same season of 2020 (Fig. S13; Angot et al., 2022, and references therein). The spatial distributions of the atmospheric mixing ratios of O3, CO, CO2, and CH4, as well as the CO (i.e., the enhancement ratio of BC to CO; here, ΔCO is the increase in CO relative to baseline; see the caption of Fig. 8 for more details; note that in order to ensure that there were sufficient data to characterize the spatiotemporal changes in CO, the background of mBC was not subtracted) and ratios, are presented in Fig. 8. Distinctive features, such as increases in CO, CH4, CO, and 2 ratios, as well as decreases in CO2 and O3, during E8 can be clearly observed. In addition, the median CO of less than 1 ng m−3 ppb−1 is near to those values reported in Taketani et al. (2022), which might have been affected by wet removal of BC during transport processes or smoldering combustion conditions.
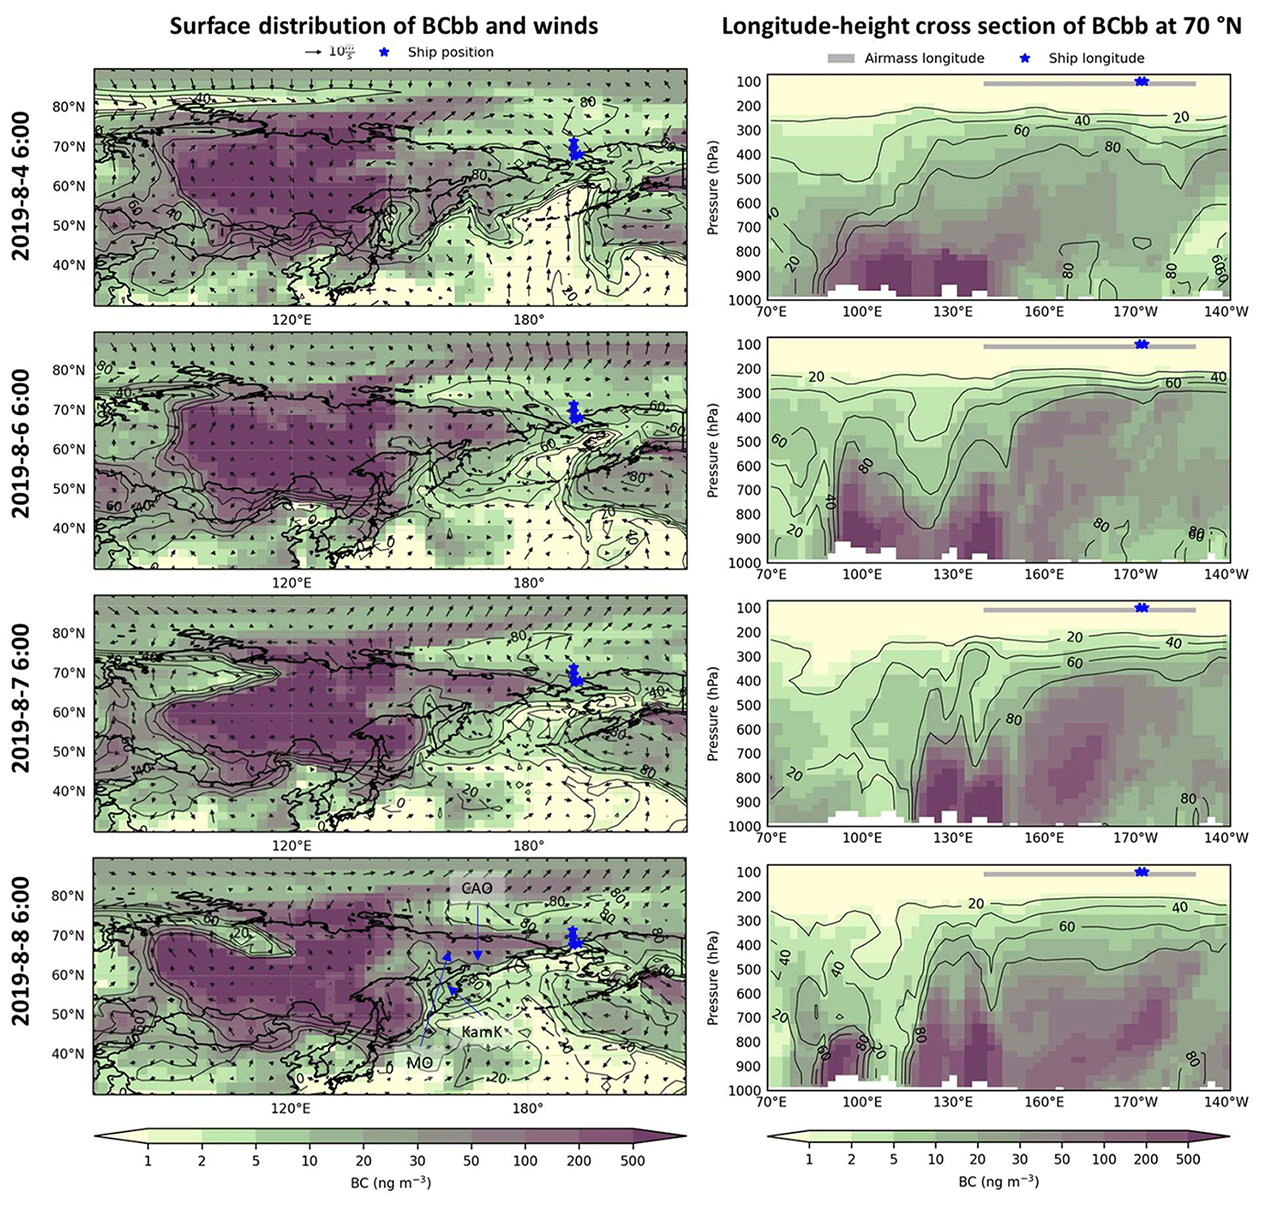
Figure 9Simulated biomass burning BC (BCbb; color image) surface distributions (left panel) and longitude–pressure cross sections at 70° N (right panel) before and during Episode 10. Shown in the left panels are surface winds and the ship positions. Shown in the right panels are the ship longitude positions and the possible surface transport region of BC-containing air masses related to Episode 10. The latter was inferred from GEOS-Chem model (left) and back trajectories (Fig. S14). In both panels, contour plots represent the ratio of simulated biomass burning BC to total BC (%). In the lower-left panel, MO is Magadan Oblast, CAO is Chukotka Autonomous Okrug, and KamK is Kamchatka Krai.
4.4.3 Episode 10
Episode 10 was measured during 7 August 2019 at 06:00 to 8 August 2019 at 20:00 UTC (Fig. 3). The mean mBC is 29 ng m−3, and BC from biomass burning was estimated to contribute 86 % of the total BC (Table 3). Figure 9 presents the surface distribution of biomass burning BC and surface winds before and during Episode 10. Although no obvious fire spot was observed at borders among Magadan Oblast, the Chukotka Autonomous Okrug, and Kamchatka Krai (abbreviated here as MCK; Figs. 9 and S10), GEOS-Chem simulations showed high concentrations of biomass burning BC at MCK borders on 6 August 2019 (Fig. 9), which was then transported to the ship position by weak northeastward winds. Longitude–pressure cross sections of BCbb presented in the right panels of Fig. 9 suggest that the high BCbb which occurred at MCK borders (150–170° E) was likely subsidence from upper atmosphere. Surface BCbb distributions (Fig. 9) and the GFED4s map (Fig. S14) show that intensive biomass burning occurred in Krasnoyarsk Krai (KraK), Irkutsk Oblast (IrO), and the Republic of Sakha (Sakha) areas (90–150° E) before and during Episode 10. This is consistent with Antokhina et al. (2023), who reported intensive fire activities during 3 July to 12 August 2019 in Siberia (95–120° E). The air masses containing high amounts of BCbb from these intensive fires were lifted to an altitude of approximately 4 km (i.e., ∼ 600 hPa) and were transported to the ship position mainly through the lower to middle atmospheres (Fig. 9, right). Figures S15 and S16 show the horizontal BCbb distribution and wind fields at about 800 and 600 hPa, respectively. Both figures indicate that subsidence of BCbb-containing air masses occurred at MCK borders, and the rest of the BCbb-containing air masses were transported to the Arctic above the ship positions through southwest winds that were much stronger than surface winds, which is consistent with the longitude–pressure cross section of BCbb (Fig. 9). In addition, the height distribution of back trajectories also showed that more than a third of air masses originated from an altitude higher than 2 km (Fig. S14). Contour plots in each figure (Figs. 9, S15, and S16) indicate that biomass burning BC contributed to more than 80 % of the BC transported to the ship position. Surface distributions and longitude–pressure distributions (Fig. S17) of anthropogenic BC show that it contributed little to the observed BC in Episode 10.
The mass concentration of black carbon aerosols was measured in the Arctic Ocean, encompassing the western Arctic Ocean and part of the East Siberian Sea, as well as the North Pacific Ocean. The measurements were conducted using COSMOS and an AE-22 Aethalometer on board the icebreaker R/V Araon during summer and autumn 2016–2020. Relatively low levels of mBC were observed at higher-latitude regions. In the western Arctic Ocean (> 72° N), the overall means (±1 standard deviation) of 1 h mBC during the cruises in 2016, 2017, 2018, 2019, and 2020 were 10 (± 11), 6.6 (± 6.7), 7.8 (± 15), 73 (± 210), and 14 (± 35) ng m−3, respectively. The estimated background mBC concentrations in respective years show a strong positive correlation with those mean values, indicating potential accumulation of atmospheric pollutants within the Arctic Ocean planetary boundary layer even in the summer and early autumn months. The overall mean of the background mBC across all five cruises was estimated to be 7.1 (±8.2) ng m−3. In the western Arctic Ocean and the Bering Sea (> 52° N), the year-to-year variation in mBC was not significant, except during the 2019 cruise, which observed much higher and more frequent elevated mBC compared with other years. This increase was likely attributed to more frequent biomass burning in the Arctic region in 2019. We identified 10 high-BC episodes north of 65° N based on the observational data. Significant but irregular interannual variability in mBC was observed in the North Pacific Ocean (south of 52° N).
Tagged-tracer simulations of BC using a global chemistry-transport model (GEOS-Chem) were applied for the interpretation of the sources and transport paths of the observed BC. The model's relative uncertainty, estimated based on the observed mBC, was less than 1.4. Additionally, the model was estimated to reproduce 44 % of the spatial and temporal variations in mBC. GEOS-Chem analyses indicate that biomass burning comprised the largest contribution to the observed BC along the ship tracks in the Arctic Ocean (67 %–92 %) and most high-BC episodes (41 %–98 %). GEOS-Chem also revealed that transport paths of biomass burning BC from the Siberian area to the Arctic could occur near the surface and/or through the lower to middle atmosphere. However, GEOS-Chem failed to accurately replicate the frequently observed high BC spikes in the Arctic during the 2019 cruise, which were attributed to the influx of biomass burning air masses. This suggests the need for improvements in biomass burning emission inventories, especially considering the ongoing increase in wildfires during the boreal summer in a warming climate. Nevertheless, it cannot be ruled out that uncertainties in the BC transport regimes used in GEOS-Chem also contributed to the simulation discrepancies.
This study provides crucial datasets on BC mass concentrations and the mixing ratios of O3, CH4, CO, and CO2 in the western Arctic Ocean regions during summer and autumn. Our results also highlight the significant impact of boreal fires on the observed Arctic BC mass during the summer and early autumn months, consistent with previous modeling and observational studies (e.g., Zhu et al., 2020; Popovicheva et al., 2022). These results are valuable for model validation, predicting Arctic climate change, and guiding air quality research in the Arctic Ocean. In addition, due to rapid changes in temperature, precipitation, snow cover, sea and land ice, permafrost, and extreme events occurring in the Arctic (AMAP, 2021a), the sources, transport pathways, and climate forcing effects of BC are thought to be changing in the Arctic. Therefore, further studies on the spatial–temporal distributions, background concentrations of BC in the Arctic marine boundary layer, and the impact of boreal fires as well as other natural and anthropogenic sources on Arctic Ocean atmospheric BC are required to clearly understand the feedback of atmospheric BC in the rapidly changing Arctic Ocean.
Table A1Statistics of the observed concentrations of gaseous species during shipborne measurements in 2017 and 2018.
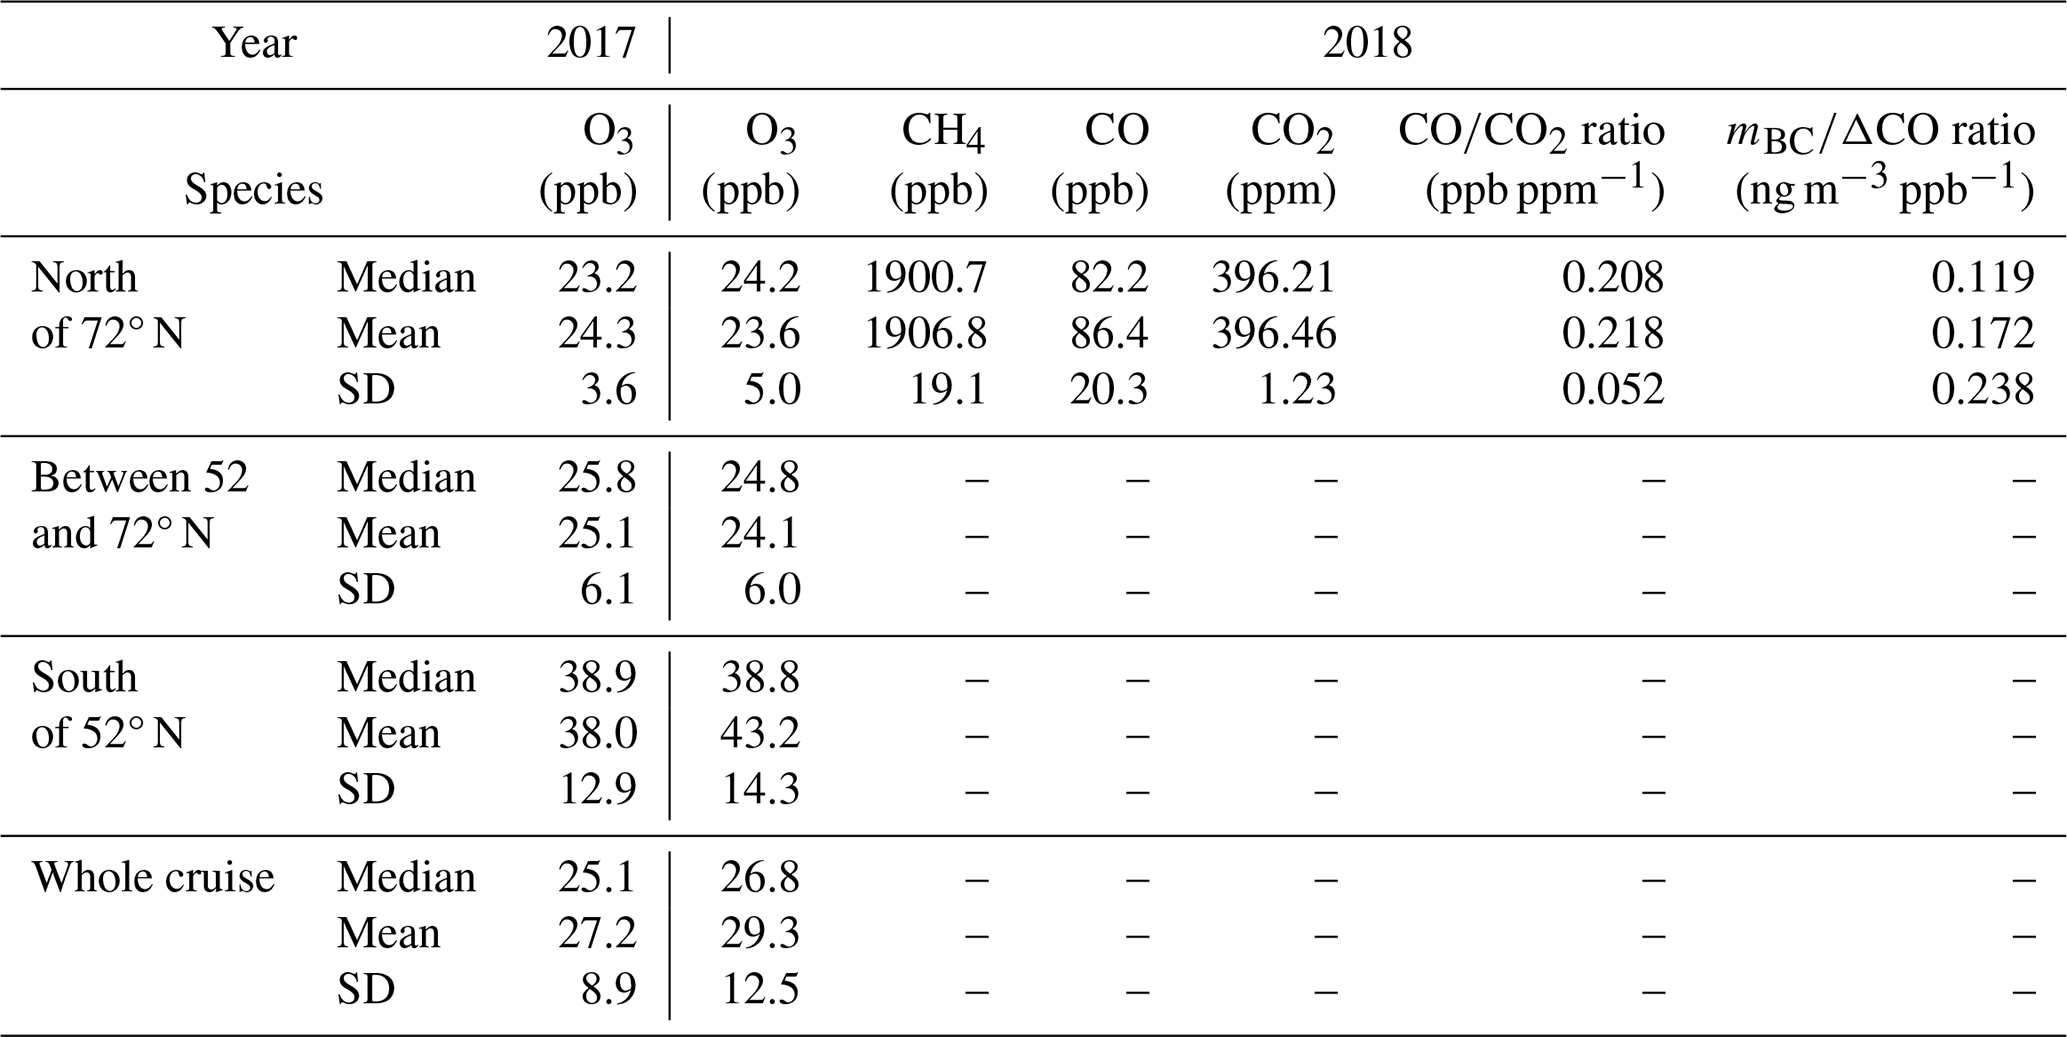
SD: standard deviation. A dash indicates no available data.
The dataset containing mBC, ship latitude and longitude, relative wind direction, relative wind speed, CH4, CO, and CO2 data used in this paper is available online at https://doi.org/10.17595/20240502.001 (Deng et al., 2024). The dataset containing BC mass concentrations and aerosol absorption coefficients measured at Utqiaġvik observatory is available online at https://doi.org/10.17592/001.2020112001 (Ohata et al., 2021b).
The supplement related to this article is available online at: https://doi.org/10.5194/acp-24-6339-2024-supplement.
HT, SK, and JJ designed the experiment and did the shipborne observations with contributions from SO, YJY, EJY, and SHK. KI did the model simulations. YD analyzed the observation and model data with contributions from HT and KI. YD wrote the paper with contributions from HT and KI. All authors contributed to the revisions of the paper.
The contact author has declared that none of the authors has any competing interests.
Publisher’s note: Copernicus Publications remains neutral with regard to jurisdictional claims made in the text, published maps, institutional affiliations, or any other geographical representation in this paper. While Copernicus Publications makes every effort to include appropriate place names, the final responsibility lies with the authors.
We thank Kimiko Suto for her support in gaseous species data analysis. We also thank Sho Ohata for his valuable suggestions on COSMOS data analysis. We acknowledge the NOAA Air Resources Laboratory (ARL) for providing the HYSPLIT transport and dispersion model.
This research has been supported by the Ministry of Oceans and Fisheries, Republic of Korea (grant no. 20210605); the National Research Foundation of Korea grant from the government of the Republic of Korea (grant no. NRF-2021M1A5A1065425); the Ministry of the Environment, Government of Japan (grant no. 2-2201: JPMEERF20222001); and the Japan Society for the Promotion of Science (grant nos. JP21K12216 and JP17KK0016).
This paper was edited by Birgit Wehner and reviewed by three anonymous referees.
AMAP: The Impact of Black Carbon on Arctic Climate, Oslo, Norway, 72 pp., ISBN 978-82-7971-069-1, 2011.
AMAP: AMAP Assessment 2015: Black carbon and ozone as Arctic climate forcers, Oslo, Norway, vii+116 pp., ISBN 978-82-7971-092-9, 2015.
AMAP: AMAP Arctic Climate Change Update 2021: Key Trends and Impacts, Tromsø, Norway, viii+148 pp., ISBN 978-82-7971-201-5, 2021a.
AMAP: AMAP Assessment 2021: Impacts of Short-lived Climate Forcers on Arctic Climate, Air Quality, and Human Health, Tromsø, Norway, x+375 pp., ISBN 978-82-7971-202-2, 2021b.
Andreae, M. O., Anderson, B. E., Blake, D. R., Bradshaw, J. D., Collins, J. E., Gregory, G. L., Sachse, G. W., and Shipham, M. C.: Influence of plumes from biomass burning on atmospheric chemistry over the equatorial and tropical South Atlantic during CITE 3, J. Geophys. Res.-Atmos., 99, 12793–12808, https://doi.org/10.1029/94JD00263, 1994.
Angot, H., Blomquist, B., Howard, D., Archer, S., Bariteau, L., Beck, I., Boyer, M., Crotwell, M., Helmig, D., Hueber, J., Jacobi, H.-W., Jokinen, T., Kulmala, M., Lan, X., Laurila, T., Madronich, M., Neff, D., Petäjä, T., Posman, K., Quéléver, L., Shupe, M. D., Vimont, I., and Schmale, J.: Year-round trace gas measurements in the central Arctic during the MOSAiC expedition, Sci. Data, 9, 723, https://doi.org/10.1038/s41597-022-01769-6, 2022.
Antokhina, O. Y., Antokhin, P. N., Belan, B. D., Gochakov, A. V., Martynova, Y. V., Pustovalov, K. N., Tarabukina, L. D., and Devyatova, E. V.: Effects of Rossby Waves Breaking and Atmospheric Blocking Formation on the Extreme Forest Fire and Floods in Eastern Siberia 2019, Fire, 6, 122, https://doi.org/10.3390/fire6030122, 2023.
Backman, J., Schmeisser, L., and Asmi, E.: Asian Emissions Explain Much of the Arctic Black Carbon Events, Geophys. Res. Lett., 48, e2020GL091913, https://doi.org/10.1029/2020GL091913, 2021.
Barrie, L. A.: Arctic air pollution: An overview of current knowledge, Atmos. Environ. (1967), 20, 643–663, https://doi.org/10.1016/0004-6981(86)90180-0, 1986.
Bey, I., Jacob, D. J., Yantosca, R. M., Logan, J. A., Field, B. D., Fiore, A. M., Li, Q., Liu, H. Y., Mickley, L. J., and Schultz, M. G.: Global modeling of tropospheric chemistry with assimilated meteorology: Model description and evaluation, J. Geophys. Res.-Atmos., 106, 23073–23095, https://doi.org/10.1029/2001JD000807, 2001.
Bhatt, U. S., Lader, R. T., Walsh, J. E., Bieniek, P. A., Thoman, R., Berman, M., Borries-Strigle, C., Bulock, K., Chriest, J., Hahn, M., Hendricks, A. S., Jandt, R., Little, J., McEvoy, D., Moore, C., Rupp, T. S., Schmidt, J., Stevens, E., Strader, H., Waigl, C., White, J., York, A., and Ziel, R.: Emerging Anthropogenic Influences on the Southcentral Alaska Temperature and Precipitation Extremes and Related Fires in 2019, Land, 10, 82, https://doi.org/10.3390/land10010082, 2021.
Boyer, M., Aliaga, D., Pernov, J. B., Angot, H., Quéléver, L. L. J., Dada, L., Heutte, B., Dall'Osto, M., Beddows, D. C. S., Brasseur, Z., Beck, I., Bucci, S., Duetsch, M., Stohl, A., Laurila, T., Asmi, E., Massling, A., Thomas, D. C., Nøjgaard, J. K., Chan, T., Sharma, S., Tunved, P., Krejci, R., Hansson, H. C., Bianchi, F., Lehtipalo, K., Wiedensohler, A., Weinhold, K., Kulmala, M., Petäjä, T., Sipilä, M., Schmale, J., and Jokinen, T.: A full year of aerosol size distribution data from the central Arctic under an extreme positive Arctic Oscillation: insights from the Multidisciplinary drifting Observatory for the Study of Arctic Climate (MOSAiC) expedition, Atmos. Chem. Phys., 23, 389–415, https://doi.org/10.5194/acp-23-389-2023, 2023.
Bozem, H., Hoor, P., Kunkel, D., Köllner, F., Schneider, J., Herber, A., Schulz, H., Leaitch, W. R., Aliabadi, A. A., Willis, M. D., Burkart, J., and Abbatt, J. P. D.: Characterization of transport regimes and the polar dome during Arctic spring and summer using in situ aircraft measurements, Atmos. Chem. Phys., 19, 15049–15071, https://doi.org/10.5194/acp-19-15049-2019, 2019.
Chen, X., Kang, S., Hu, Y., and Yang, J.: Temporal and spatial analysis of vegetation fire activity in the circum-Arctic during 2001–2020, Res. Cold Arid Reg., 15, 48–56, https://doi.org/10.1016/j.rcar.2023.03.002, 2023.
Chin, M., Jacob, D. J., Munger, J. W., Parrish, D. D., and Doddridge, B. G.: Relationship of ozone and carbon monoxide over North America, J. Geophys. Res.-Atmos., 99, 14565–14573, https://doi.org/10.1029/94JD00907, 1994.
Dall'Osto, M., Park, J., Kim, J. H., Kang, S. H., Park, K., Beddows, D. C. S., Harrison, R. M., and Yoon, Y. J.: Arctic ship-based evidence of new particle formation events in the Chukchi and East Siberian Seas, Atmos. Environ., 223, 117232, https://doi.org/10.1016/j.atmosenv.2019.117232, 2020.
Deng, Y., Kameyama, S., Tanimoto, H., and Jung, J.: Shipborne Observations of Surface Black Carbon Aerosol Mass Concentrations and Ozone/Methane/Carbon Monoxide/Carbon Dioxide Mixing Ratios in the Arctic Atmosphere, NIES [data set], https://doi.org/10.17595/20240502.001, 2024.
Ding, M. H., Tian, B., Zhang, T., Tang, J., Peng, H., Bian, L. G., and Sun, W. J.: Shipborne observations of atmospheric black carbon aerosol from Shanghai to the Arctic Ocean during the 7th Chinese Arctic Research Expedition, Atmos. Res., 210, 34–40, https://doi.org/10.1016/j.atmosres.2018.04.016, 2018.
Hayasaka, H.: Fire Weather Conditions in Boreal and Polar Regions in 2002–2021, Atmosphere, 13, 1117, https://doi.org/10.3390/atmos13071117, 2022.
Ikeda, K., Tanimoto, H., Sugita, T., Akiyoshi, H., Kanaya, Y., Zhu, C., and Taketani, F.: Tagged tracer simulations of black carbon in the Arctic: transport, source contributions, and budget, Atmos. Chem. Phys., 17, 10515–10533, https://doi.org/10.5194/acp-17-10515-2017, 2017.
Ikeda, K., Tanimoto, H., Kanaya, Y., and Taketani, F.: Evaluation of anthropogenic emissions of black carbon from East Asia in six inventories: constraints from model simulations and surface observations on Fukue Island, Japan, Environ. Sci.-Atmos., 2, 416–427, https://doi.org/10.1039/d1ea00051a, 2022.
IPCC: Climate Change 2021: The Physical Science Basis. Contribution of Working Group I to the Sixth Assessment Report of the Intergovernmental Panel on Climate Change, Cambridge, United Kingdom and New York, NY, USA, https://doi.org/10.1017/9781009157896, 2021.
Jurányi, Z., Zanatta, M., Lund, M. T., Samset, B. H., Skeie, R. B., Sharma, S., Wendisch, M., and Herber, A.: Atmospheric concentrations of black carbon are substantially higher in spring than summer in the Arctic, Commun Earth Environ, 4, 1–12, https://doi.org/10.1038/s43247-023-00749-x, 2023.
Kim, G., Cho, H. J., Seo, A., Kim, D., Gim, Y., Lee, B. Y., Yoon, Y. J., and Park, K.: Comparison of Hygroscopicity, Volatility, and Mixing State of Subnnicrometer Particles between Cruises over the Arctic Ocean and the Pacific Ocean, Environ. Sci. Technol., 49, 12024–12035, https://doi.org/10.1021/acs.est.5b01505, 2015.
Klimont, Z., Kupiainen, K., Heyes, C., Purohit, P., Cofala, J., Rafaj, P., Borken-Kleefeld, J., and Schöpp, W.: Global anthropogenic emissions of particulate matter including black carbon, Atmos. Chem. Phys., 17, 8681–8723, https://doi.org/10.5194/acp-17-8681-2017, 2017.
Kondo, Y., Sahu, L., Kuwata, M., Miyazaki, Y., Takegawa, N., Moteki, N., Imaru, J., Han, S., Nakayama, T., Oanh, N. T. K., Hu, M., Kim, Y. J., and Kita, K.: Stabilization of the Mass Absorption Cross Section of Black Carbon for Filter-Based Absorption Photometry by the use of a Heated Inlet, Aerosol Sci. Technol., 43, 741–756, https://doi.org/10.1080/02786820902889879, 2009.
Laing, J. R., Jaffe, D. A., and Sedlacek III, A. J.: Comparison of Filter-based Absorption Measurements of Biomass Burning Aerosol and Background Aerosol at the Mt. Bachelor Observatory, Aerosol Air Qual. Res., 20, 663–678, https://doi.org/10.4209/aaqr.2019.06.0298, 2020.
McCarty, J. L., Aalto, J., Paunu, V.-V., Arnold, S. R., Eckhardt, S., Klimont, Z., Fain, J. J., Evangeliou, N., Venäläinen, A., Tchebakova, N. M., Parfenova, E. I., Kupiainen, K., Soja, A. J., Huang, L., and Wilson, S.: Reviews and syntheses: Arctic fire regimes and emissions in the 21st century, Biogeosciences, 18, 5053–5083, https://doi.org/10.5194/bg-18-5053-2021, 2021.
McFarquhar, G. M., Ghan, S., Verlinde, J., Korolev, A., Strapp, J. W., Schmid, B., Tomlinson, J. M., Wolde, M., Brooks, S. D., Cziczo, D., Dubey, M. K., Fan, J. W., Flynn, C., Gultepe, I., Hubbe, J., Gilles, M. K., Laskin, A., Lawson, P., Leaitch, W. R., Liu, P., Liu, X. H., Lubin, D., Mazzoleni, C., Macdonald, A. M., Moffet, R. C., Morrison, H., Ovchinnikov, M., Shupe, M. D., Turner, D. D., Xie, S. C., Zelenyuk, A., Bae, K., Freer, M., and Glen, A.: INDIRECT AND SEMI-DIRECT AEROSOL CAMPAIGN The Impact of Arctic Aerosols on Clouds, B. Am. Meteorol. Soc., 92, 183–201, https://doi.org/10.1175/2010bams2935.1, 2011.
Moteki, N. and Kondo, Y.: Dependence of Laser-Induced Incandescence on Physical Properties of Black Carbon Aerosols: Measurements and Theoretical Interpretation, Aerosol Sci. Technol., 44, 663–675, https://doi.org/10.1080/02786826.2010.484450, 2010.
Nagovitsyna, E. S., Poddubny, V. A., Karasev, A. A., Kabanov, D. M., Sidorova, O. R., and Maslovsky, A. S.: Assessment of the Spatial Structure of Black Carbon Concentrations in the Near-Surface Arctic Atmosphere, Atmosphere, 14, 139, https://doi.org/10.3390/atmos14010139, 2023.
Ohata, S., Kondo, Y., Moteki, N., Mori, T., Yoshida, A., Sinha, P. R., and Koike, M.: Accuracy of black carbon measurements by a filter-based absorption photometer with a heated inlet, Aerosol Sci. Technol., 53, 1079–1091, https://doi.org/10.1080/02786826.2019.1627283, 2019.
Ohata, S., Koike, M., Yoshida, A., Moteki, N., Adachi, K., Oshima, N., Matsui, H., Eppers, O., Bozem, H., Zanatta, M., and Herber, A. B.: Arctic black carbon during PAMARCMiP 2018 and previous aircraft experiments in spring, Atmos. Chem. Phys., 21, 15861–15881, https://doi.org/10.5194/acp-21-15861-2021, 2021a.
Ohata, S., Mori, T., Kondo, Y., Sharma, S., Hyvarinen, A., Andrews, E., Tunved, P., Asmi, E., Backman, J., Servomaa, H., Veber, D., Eleftheriadis, K., Vratolis, S., Krejci, R., Zieger, P., Koike, M., Kanaya, Y., Yoshida, A., Moteki, N., Zhao, Y., Tobo, Y., Matsushita, J., and Oshima, N.: Black carbon mass concentrations and aerosol light absorption coefficients measured at Arctic sites (1.01), Arctic Data archive System [data set], https://doi.org/10.17592/001.2020112001, 2021b.
Oshima, N., Yukimoto, S., Deushi, M., Koshiro, T., Kawai, H., Tanaka, T. Y., and Yoshida, K.: Global and Arctic effective radiative forcing of anthropogenic gases and aerosols in MRI-ESM2.0, Prog. Earth Planet. Sci., 7, 38, https://doi.org/10.1186/s40645-020-00348-w, 2020.
Pan, X., Ichoku, C., Chin, M., Bian, H., Darmenov, A., Colarco, P., Ellison, L., Kucsera, T., da Silva, A., Wang, J., Oda, T., and Cui, G.: Six global biomass burning emission datasets: intercomparison and application in one global aerosol model, Atmos. Chem. Phys., 20, 969–994, https://doi.org/10.5194/acp-20-969-2020, 2020.
Pankratova, N. V., Belikov, I. B., Belousov, V. A., Kopeikin, V. M., Skorokhod, A. I., Shtabkin, Y. A., Malafeev, G. V., and Flint, M. V.: Concentration and Isotopic Composition of Methane, Associated Gases, and Black Carbon over Russian Arctic Seas (Shipborne Measurements), Oceanology, 60, 593–602, https://doi.org/10.1134/s0001437020050197, 2020.
Paris, J.-D., Stohl, A., Ciais, P., Nédélec, P., Belan, B. D., Arshinov, M. Yu., and Ramonet, M.: Source-receptor relationships for airborne measurements of CO2, CO and O3 above Siberia: a cluster-based approach, Atmos. Chem. Phys., 10, 1671–1687, https://doi.org/10.5194/acp-10-1671-2010, 2010.
Park, J., Dall'Osto, M., Park, K., Gim, Y., Kang, H. J., Jang, E., Park, K.-T., Park, M., Yum, S. S., Jung, J., Lee, B. Y., and Yoon, Y. J.: Shipborne observations reveal contrasting Arctic marine, Arctic terrestrial and Pacific marine aerosol properties, Atmos. Chem. Phys., 20, 5573–5590, https://doi.org/10.5194/acp-20-5573-2020, 2020.
Petzold, A., Ogren, J. A., Fiebig, M., Laj, P., Li, S.-M., Baltensperger, U., Holzer-Popp, T., Kinne, S., Pappalardo, G., Sugimoto, N., Wehrli, C., Wiedensohler, A., and Zhang, X.-Y.: Recommendations for reporting ”black carbon” measurements, Atmos. Chem. Phys., 13, 8365–8379, https://doi.org/10.5194/acp-13-8365-2013, 2013.
Pfannerstill, E. Y., Wang, N., Edtbauer, A., Bourtsoukidis, E., Crowley, J. N., Dienhart, D., Eger, P. G., Ernle, L., Fischer, H., Hottmann, B., Paris, J.-D., Stönner, C., Tadic, I., Walter, D., Lelieveld, J., and Williams, J.: Shipborne measurements of total OH reactivity around the Arabian Peninsula and its role in ozone chemistry, Atmos. Chem. Phys., 19, 11501–11523, https://doi.org/10.5194/acp-19-11501-2019, 2019.
Popovicheva, O. B., Evangeliou, N., Eleftheriadis, K., Kalogridis, A. C., Sitnikov, N., Eckhardt, S., and Stohl, A.: Black Carbon Sources Constrained by Observations in the Russian High Arctic, Environm. Sci. Technol., 51, 3871–3879, https://doi.org/10.1021/acs.est.6b05832, 2017.
Popovicheva, O. B., Evangeliou, N., Kobelev, V. O., Chichaeva, M. A., Eleftheriadis, K., Gregorič, A., and Kasimov, N. S.: Siberian Arctic black carbon: gas flaring and wildfire impact, Atmos. Chem. Phys., 22, 5983–6000, https://doi.org/10.5194/acp-22-5983-2022, 2022.
Sakerin, S. M., Bobrikov, A. A., Bukin, O. A., Golobokova, L. P., Pol'kin, Vas. V., Pol'kin, Vik. V., Shmirko, K. A., Kabanov, D. M., Khodzher, T. V., Onischuk, N. A., Pavlov, A. N., Potemkin, V. L., and Radionov, V. F.: On measurements of aerosol-gas composition of the atmosphere during two expeditions in 2013 along the Northern Sea Route, Atmos. Chem. Phys., 15, 12413–12443, https://doi.org/10.5194/acp-15-12413-2015, 2015.
Sakerin, S. M., Kabanov, D. M., Makarov, V. I., Pol'kin, V. V., Popova, S. A., Chankina, O. V., Pochufarov, A. O., Radionov, V. E., and Rize, D. D.: Spatial Distribution of Atmospheric Aerosol Physicochemical Characteristics in the Russian Sector of the Arctic Ocean, Atmosphere, 11, 1170, https://doi.org/10.3390/atmos11111170, 2020.
Sakerin, S. M., Kabanov, D. M., Kopeikin, V. M., Kruglinsky, I. A., Novigatsky, A. N., Pol'kin, V. V., Shevchenko, V. P., and Turchinovich, Y. S.: Spatial Distribution of Black Carbon Concentrations in the Atmosphere of the North Atlantic and the European Sector of the Arctic Ocean, Atmosphere, 12, 949, https://doi.org/10.3390/atmos12080949, 2021.
Sasakawa, M., Machida, T., Tsuda, N., Arshinov, M., Davydov, D., Fofonov, A., and Krasnov, O.: Aircraft and tower measurements of CO2 concentration in the planetary boundary layer and the lower free troposphere over southern taiga in West Siberia: Long-term records from 2002 to 2011, J. Geophys. Res.-Atmos., 118, 9489–9498, https://doi.org/10.1002/jgrd.50755, 2013.
Schmale, J., Sharma, S., Decesari, S., Pernov, J., Massling, A., Hansson, H.-C., von Salzen, K., Skov, H., Andrews, E., Quinn, P. K., Upchurch, L. M., Eleftheriadis, K., Traversi, R., Gilardoni, S., Mazzola, M., Laing, J., and Hopke, P.: Pan-Arctic seasonal cycles and long-term trends of aerosol properties from 10 observatories, Atmos. Chem. Phys., 22, 3067–3096, https://doi.org/10.5194/acp-22-3067-2022, 2022.
Schulz, H., Zanatta, M., Bozem, H., Leaitch, W. R., Herber, A. B., Burkart, J., Willis, M. D., Kunkel, D., Hoor, P. M., Abbatt, J. P. D., and Gerdes, R.: High Arctic aircraft measurements characterising black carbon vertical variability in spring and summer, Atmos. Chem. Phys., 19, 2361–2384, https://doi.org/10.5194/acp-19-2361-2019, 2019.
Sharma, S., Leaitch, W. R., Huang, L., Veber, D., Kolonjari, F., Zhang, W., Hanna, S. J., Bertram, A. K., and Ogren, J. A.: An evaluation of three methods for measuring black carbon in Alert, Canada, Atmos. Chem. Phys., 17, 15225–15243, https://doi.org/10.5194/acp-17-15225-2017, 2017.
Shevchenko, V. P., Kopeikin, V. M., Novigatsky, A. N., and Malafeev, G. V.: Black Carbon in the Atmospheric Boundary Layer Over the North Atlantic and the Russian Arctic Seas in June–September 2017, Oceanology, 59, 692–696, https://doi.org/10.1134/s0001437019050199, 2019.
Sierau, B., Chang, R. Y.-W., Leck, C., Paatero, J., and Lohmann, U.: Single-particle characterization of the high-Arctic summertime aerosol, Atmos. Chem. Phys., 14, 7409–7430, https://doi.org/10.5194/acp-14-7409-2014, 2014.
Sinha, P. R., Kondo, Y., Koike, M., Ogren, J. A., Jefferson, A., Barrett, T. E., Sheesley, R. J., Ohata, S., Moteki, N., Coe, H., Liu, D., Irwin, M., Tunved, P., Quinn, P. K., and Zhao, Y.: Evaluation of ground-based black carbon measurements by filter-based photometers at two Arctic sites, J. Geophys. Res.-Atmos., 122, 3544–3572, https://doi.org/10.1002/2016JD025843, 2017.
Stein, A. F., Draxler, R. R., Rolph, G. D., Stunder, B. J. B., Cohen, M. D., and Ngan, F.: NOAA's HYSPLIT Atmospheric Transport and Dispersion Modeling System, B. Am. Meteorol. Soc., 96, 2059–2077, https://doi.org/10.1175/BAMS-D-14-00110.1, 2015.
Stohl, A., Klimont, Z., Eckhardt, S., Kupiainen, K., Shevchenko, V. P., Kopeikin, V. M., and Novigatsky, A. N.: Black carbon in the Arctic: the underestimated role of gas flaring and residential combustion emissions, Atmos. Chem. Phys., 13, 8833–8855, https://doi.org/10.5194/acp-13-8833-2013, 2013.
Taketani, F., Miyakawa, T., Takashima, H., Komazaki, Y., Pan, X., Kanaya, Y., and Inoue, J.: Shipborne observations of atmospheric black carbon aerosol particles over the Arctic Ocean, Bering Sea, and North Pacific Ocean during September 2014, J. Geophys. Res.-Atmos., 121, 1914–1921, https://doi.org/10.1002/2015jd023648, 2016.
Taketani, F., Miyakawa, T., Takigawa, M., Yamaguchi, M., Komazaki, Y., Mordovskoi, P., Takashima, H., Zhu, C. M., Nishino, S., Tohjima, Y., and Kanaya, Y.: Characteristics of atmospheric black carbon and other aerosol particles over the Arctic Ocean in early autumn 2016: Influence from biomass burning as assessed with observed microphysical properties and model simulations, Sci. Total Environ., 848, 157671, https://doi.org/10.1016/j.scitotenv.2022.157671, 2022.
Tanimoto, H., Kajii, Y., Hirokawa, J., Akimoto, H., and Minko, N. P.: The atmospheric impact of boreal forest fires in far eastern Siberia on the seasonal variation of carbon monoxide: Observations at Rishiri, A northern remote island in Japan, Geophys. Res. Lett., 27, 4073–4076, https://doi.org/10.1029/2000GL011914, 2000.
Terpugova, S. A., Zenkova, P. N., Kabanov, D. M., Pol'kin, V. V., Golobokova, L. P., Panchenko, M. V., Sakerin, S. M., Lisitzin, A. P., Shevchenko, V. P., Politova, N. V., Kozlov, V. S., Khodzher, T. V., Shmargunov, V. P., and Chernov, D. G.: Results of the Study of Aerosol Characteristics in the Atmosphere of the Kara and Barents Seas in Summer and Autumn 2016, Atmos. Ocean. Opt., 31, 507–518, https://doi.org/10.1134/s1024856018050172, 2018.
van der Werf, G. R., Randerson, J. T., Giglio, L., van Leeuwen, T. T., Chen, Y., Rogers, B. M., Mu, M., van Marle, M. J. E., Morton, D. C., Collatz, G. J., Yokelson, R. J., and Kasibhatla, P. S.: Global fire emissions estimates during 1997–2016, Earth Syst. Sci. Data, 9, 697–720, https://doi.org/10.5194/essd-9-697-2017, 2017.
Voronova, O. S., Zima, A. L., Kladov, V. L., and Cherepanova, E. V.: Anomalous Wildfires in Siberia in Summer 2019, Izv. Atmos. Ocean. Phys., 56, 1042–1052, https://doi.org/10.1134/s000143382009025x, 2020.
Wang, Q., Schwarz, J. P., Cao, J., Gao, R., Fahey, D. W., Hu, T., Huang, R.-J., Han, Y., and Shen, Z.: Black carbon aerosol characterization in a remote area of Qinghai–Tibetan Plateau, western China, Sci. Total Environ., 479–480, 151–158, https://doi.org/10.1016/j.scitotenv.2014.01.098, 2014.
Whaley, C. H., Mahmood, R., von Salzen, K., Winter, B., Eckhardt, S., Arnold, S., Beagley, S., Becagli, S., Chien, R.-Y., Christensen, J., Damani, S. M., Dong, X., Eleftheriadis, K., Evangeliou, N., Faluvegi, G., Flanner, M., Fu, J. S., Gauss, M., Giardi, F., Gong, W., Hjorth, J. L., Huang, L., Im, U., Kanaya, Y., Krishnan, S., Klimont, Z., Kühn, T., Langner, J., Law, K. S., Marelle, L., Massling, A., Olivié, D., Onishi, T., Oshima, N., Peng, Y., Plummer, D. A., Popovicheva, O., Pozzoli, L., Raut, J.-C., Sand, M., Saunders, L. N., Schmale, J., Sharma, S., Skeie, R. B., Skov, H., Taketani, F., Thomas, M. A., Traversi, R., Tsigaridis, K., Tsyro, S., Turnock, S., Vitale, V., Walker, K. A., Wang, M., Watson-Parris, D., and Weiss-Gibbons, T.: Model evaluation of short-lived climate forcers for the Arctic Monitoring and Assessment Programme: a multi-species, multi-model study, Atmos. Chem. Phys., 22, 5775–5828, https://doi.org/10.5194/acp-22-5775-2022, 2022.
Xie, Z. Q., Blum, J. D., Utsunomiya, S., Ewing, R. C., Wang, X. M., and Sun, L. G.: Summertime carbonaceous aerosols collected in the marine boundary layer of the Arctic Ocean, J. Geophys. Res.-Atmos., 112, D02306, https://doi.org/10.1029/2006jd007247, 2007.
Zhu, C., Kanaya, Y., Takigawa, M., Ikeda, K., Tanimoto, H., Taketani, F., Miyakawa, T., Kobayashi, H., and Pisso, I.: FLEXPART v10.1 simulation of source contributions to Arctic black carbon, Atmos. Chem. Phys., 20, 1641–1656, https://doi.org/10.5194/acp-20-1641-2020, 2020.