the Creative Commons Attribution 4.0 License.
the Creative Commons Attribution 4.0 License.
 | 29 May 2024
Simultaneous organic aerosol source apportionment at two Antarctic sites reveals large-scale and ecoregion-specific components
David C. S. Beddows
Anna Jones
Thomas Lachlan-Cope
Matteo Rinaldi
Stefano Decesari
Francesco Manarini
Mara Russo
Karam Mansour
Roy M. Harrison
Andrea Mazzanti
Emilio Tagliavini
Antarctica and the Southern Ocean (SO) are the most pristine areas of the globe and represent ideal places to investigate aerosol–climate interactions in an unperturbed atmosphere. In this study, we present submicrometer aerosol (PM1) source apportionment for two sample sets collected in parallel at the British Antarctic Survey stations of Signy and Halley during the austral summer of 2018–2019. Water-soluble organic matter (WSOM) is a major aerosol component at both sites (37 % and 29 % of water-soluble PM1, on average, at Signy and Halley, respectively). Remarkable differences between pelagic (open-ocean) and sympagic (influenced by sea ice) air mass histories and related aerosol sources are found. The application of factor analysis techniques to series of spectra obtained by means of proton-nuclear magnetic resonance (H-NMR) spectroscopy on the samples allows the identification of five organic aerosol (OA) sources: two primary organic aerosol (POA) types, characterized by sugars, polyols, and degradation products of lipids and associated with open-ocean and sympagic/coastal waters, respectively; two secondary organic aerosol (SOA) types, one enriched in methanesulfonic acid (MSA) and dimethylamine (DMA) and associated with pelagic waters and the other characterized by trimethylamine (TMA) and linked to sympagic environments; and a fifth component of unclear origin, possibly associated with the atmospheric aging of primary emissions. Overall, our results strongly indicate that the emissions from sympagic and pelagic ecosystems affect the variability in the submicrometer aerosol composition in the study area, with atmospheric circulation establishing marked latitudinal gradients only for some of the aerosol components (e.g., the sympagic components) while distributing the others (e.g., pelagic and/or aged components) both in maritime and inner Antarctic regions.
- Article
(3112 KB) - Full-text XML
-
Supplement
(3869 KB) - BibTeX
- EndNote


Given their distance from major anthropogenic sources, the Southern Ocean (SO) and Antarctica are considered to be a proxy for preindustrial atmospheric conditions and processes (Cavalieri et al., 1999; Arrigo et al., 2010; Carslaw et al., 2013; Arrigo et al., 2015; Hamilton et al., 2015) that impact the climate of the entire Southern Hemisphere. During winter, a layer of sea ice is formed over the SO; it extends up to approximately 19×106 km2 in the winter season and decreases by about 80 % (4 × 10⁶ km2) in the summer (Cavalieri et al., 1999). Climate models have large uncertainties with respect to simulating clouds, aerosols, and air–sea exchange as well as these components' effects on Earth's albedo in this area of the globe (Carslaw et al., 2013). One of the main reasons for this uncertainty is that the aerosol source apportionment is poorly understood. The very diverse ecosystems, stretching from the SO and sub-Antarctic marine areas to the Antarctic coastal areas and ice shelves are schematically reduced to two large natural sources governing the aerosol populations: sea spray (mostly composed of sea salt; primary) and non-sea-salt sulfate (nSS-SO4; secondary). The former – with mass size distributions peaking in the supermicrometer range – is produced by oceanic waves breaking and bubble bursting. By contrast, the latter – secondary in type and submicrometer in size – is obtained by atmospheric oxidation of dimethylsulfide (DMS), a trace gas produced by marine phytoplankton. However, a recent intensification in Antarctic aerosol measurement field campaigns is revealing that aerosol chemistry in the southern high latitudes can be much more complex. For example, blowing snow over pack ice has been suggested to contribute sea-salt aerosol in similar amounts to breaking waves (Legrand et al., 2017a; Giordano et al., 2018; Frey et al., 2020).
With respect to secondary (gas-to-particle formation) aerosols, DMS-derived nSS-SO4 (Charlson et al., 1987; Vallina et al., 2007) is normally accompanied by organic sulfur species, the most well known and usually more abundant of which is methanesulfonic acid (MSA) (Rankin and Wolff, 2003; Legrand et al., 2017b; Fossum et al., 2018). The role of aerosol sulfur species in regulating cloud condensation nuclei (CCN) concentrations in the marine environment is being challenged by a much larger variety of poorly known ocean-emitted aerosol components (Quinn and Bates, 2011). Another potential key component for new particle formation in Antarctica is iodine, which is known to form new particles via iodic acid nucleation (Saiz-Lopez et al., 2007; Baccarini et al., 2021).
Therefore, the scientific question regarding the chemical nature and source identification of aerosols in the SO intercepts a broader debate about the relative importance of secondary aerosols produced from biogenic sulfur vs. primary sea-spray aerosols in regulating cloudiness in the marine environment.
Pioneering measurements of organic carbon (OC) in size-segregated aerosol (Virkkula et al., 2006) have shown that MSA represents only a few percent of the substantial amount of OC observed in the submicrometer fraction. Recent Antarctic measurements have also suggested that the importance of organic components may have been overlooked. Saliba et al. (2021) found that the large organic fraction of particles < 0.1 µm diameter may have important implications for CCN number concentrations and indirect radiative forcing over the SO. Moreover, recent measurements over the SO (43–70° S) and the Amundsen Sea (70–75° S) have shown that water-insoluble organic carbon (WIOC) accounts for 75 % and 73 % of aerosol total organic carbon in the two regions, respectively (Jung et al., 2020). In the Amundsen Sea, WIOC concentrations were correlated with the biomass of a phytoplankton species (Phaeocystis antarctica) that produces extracellular polysaccharide mucus that can be ejected by sea spray into the aerosol.
Intensified observations using advanced aerosol instrumentation aboard research ships have highlighted a certain dependence of the aerosol concentration and composition on the air mass origin and atmospheric circulation patterns across latitudes. Humphries et al. (2021) identified three main aerosol source areas in the SO – the northern sector (40–45° S), the midlatitude sector (45–65° S), and the southern sector (65–70° S) – with different mixtures of continental and anthropogenic, primary, and secondary aerosols depending on the studied region. During the same period of study, Sanchez et al. (2021) and Humphries et al. (2021) found a weak gradient in CCN at 0.3 % supersaturation with increasing CCN concentrations to the south between 44 and 62.1° S, which may have been caused by aerosol precursors from Antarctic coastal biological emissions.
At the same time, study of the variability in aerosol sources in sub-Antarctic and Antarctic coastal areas has added complexity to the representation of aerosol concentrations based on latitudinal changes. Indeed, emerging recent literature has shown that aerosol populations of variable chemical composition can be observed within polar Antarctic (> 60° S) air masses. By analyzing simultaneous aerosol size distribution measurements at three sites, Lachlan-Cope et al. (2020) showed that the dynamics of aerosol number concentrations and distributions is more complex than the simplified view of particles composed of a sulfate–sea-spray combination, and it is likely that an array of additional chemical components and processes drive the aerosol population. Likewise, our previous results indicated that not only the marine productivity but also the biogenic taxa and ecophysiological state of the microbiota affect the production of aerosol precursors in seawater (Dall'Osto et al., 2017, 2019). We previously showed that the microbiota of sea ice and the sea-ice-influenced ocean (sympagic environment) can be a stronger source of atmospheric primary and secondary organic nitrogen (ON), specifically low-molecular-weight alkylamines (Dall'Osto et al., 2017, 2019), relative to open-ocean areas not influenced by sea ice (pelagic ocean). Rinaldi et al. (2020) reported that non-methanesulfonic-acid water-soluble organic matter (non-MSA WSOM) represents 6 %–8 % and 11 %–22 % of the aerosol PM1 mass originating from open-ocean and sea-ice regions, respectively. This study showed that the Weddell Sea areas covered by open or consolidated packed sea ice (sympagic environment) are a strong source of ON in aerosol. Thus, ON compounds should be considered when assessing secondary aerosol formation processes in Antarctica, in addition to the known role played by sulfur aerosols (Brean et al., 2021). By means of chamber experiments simulating primary aerosol formation on site in the same area around the Antarctic Peninsula and Weddell Sea, Decesari et al. (2020) reported that the process of aerosolization enriches submicrometer primary marine particles with lipids and sugars while depleting them of amino acids. From these experiments, it emerged that the potential impact of the sea-ice (sympagic) planktonic ecosystem on aerosol composition had been overlooked in past studies and that multiple ecoregions (sympagic environments, pelagic waters, and coastal/terrestrial ecosystems) act as distinct aerosol sources around Antarctica (Decesari et al., 2020; Rinaldi et al., 2020). In particular, Decesari et al. (2020) found at least three main bioregion sources of water-soluble organic carbon (WSOC): (1) open SO pelagic environments dominated by primary sea-spray aerosol (SSA), mainly constituted of lipids and polyols; (2) sympagic areas in the Weddell Sea, with secondary sulfur and nitrogen organic compounds; and (3) terrestrial land vegetation coastal areas, traced by sucrose in the aerosol.
Here, we report atmospheric measurements simultaneously carried out at two Antarctic research stations (Signy and Halley) over a 3-month period (December 2018–March 2019). To our knowledge, this is the first study attempting aerosol characterization and source apportionment at the synoptic scale by means of parallel measurements at two distant Antarctic stations. We stress that organic water-soluble aerosol components contribute to the aerosol population and to its most hygroscopic fraction; hence, we claim that they have been overlooked with respect to their relevant climate importance. Our findings highlight the heterogeneity of the Antarctic ecosystems and how this heterogeneity impacts the organic aerosol sources, allowing us – for the first time – to report some unique insights into their spatiotemporal variability in this region of the world.
2.1 Measurement field campaigns
The measurements reported here were made in the framework of the PI-ICE (Polar Interactions: Impact on the Climate and Ecology) study in the period from December 2018 to March 2019 at the British Antarctic Survey (BAS) stations of Halley and Signy. BAS Halley VI station (75°36′0′′ S, 26°11′0′′ W) is located in coastal Antarctica, on the floating Brunt Ice Shelf about 20 km from the coast of the Weddell Sea, but hundreds of kilometers from the open ocean (at a variable distance during the year, depending on the extension of the pack ice and floating sea ice covering the Weddell Sea in the different seasons, but approximately 200 km during summer). Temperatures at Halley rarely rise above 0 °C, and temperatures of around −10 °C are common on sunny summer days. Winds are predominantly from the east. Strong winds sometimes pick up the surface snow, reducing visibility to a few meters (https://www.bas.ac.uk/polar-operations/sites-and-facilities/facility/halley/, last access: 12 January 2024). A variety of measurements were made from the Clean Air Sector Laboratory (CASLab), which is located about 1 km southeast of Halley station (Jones et al., 2008). In contrast, BAS Signy station at Signy Island (60°43′0′′ S, 45°38′0′′ W) is located in the South Orkney Islands (maritime Antarctic) and is characterized by a cold oceanic climate, a mean annual air temperature of 3.5 °C, and an annual precipitation ranging from 350 to 700 mm, which primarily falls as summer rain. Summer air temperatures are generally positive (record maximum of 19.8 °C), although sudden drops in temperature can occur throughout the summer (−7 °C has been recorded in January). Signy is also extremely windy, with prevailing westerly winds (https://www.bas.ac.uk/polar-operations/sites-and-facilities/facility/signy/, last access: 12 January 2024).
Two high-volume samplers (MCV, Barcelona, Spain, equipped with a Digitel PM1 sampling inlet) at Signy and Halley collected ambient aerosol particles with Dp < 1 µm on pre-washed (with ultrapure water) and pre-baked (at 800 °C for 1 h) quartz fiber filters, at a controlled flow of 500 L min−1. Due to the necessity of collecting a sufficient aerosol loading for detailed chemical analyses on the filters, the sampling time was of the order of about 50 h for each sample. A total of 8 and 14 PM1 samples were collected during the field study at Halley and Signy stations, respectively. The samples were stored at about −20 °C until extraction and chemical analyses.
Figure 1 shows a map of the study area. Temporal periods are reported in Table S1 and Fig. S1 in the Supplement, while Table S2 reports the meteorological data for the sampling periods at both sites.
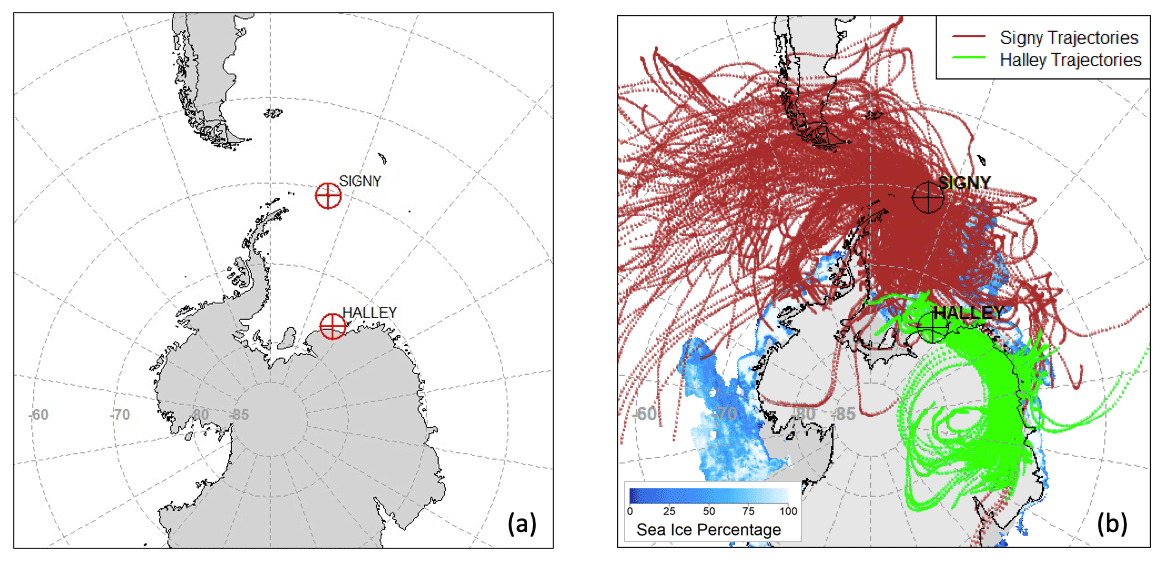
Figure 1Maps of the (a) study area, showing BAS Signy and Halley stations, and (b) air mass back trajectories for all of the sampling periods at both stations. Blue shades represent the sea-ice cover averaged over the studied period. Gray shades outside of the continental boundaries represent the average shelf-ice cover.
2.2 Air mass back-trajectory analysis and source region classification
The 5-day back-trajectories arriving at a height of 30 m every 6 h were calculated using HYSPLIT (Hybrid Single-Particle Lagrangian Integrated Trajectory v4; Draxler et al., 1998; Stein et al., 2015) and monthly global NOAA NCEP/NCAR pressure level reanalysis data archives. Using these data, trajectory-level plots were calculated using the openair package (Carslaw and Ropkins, 2012) by exploiting the concentration-weighted trajectory (CWT) method. The CWT approach uses the concentration measured upon a trajectory's arrival at a site and the residence time of that trajectory in each grid cell it passes through to create a mean concentration for each grid cell. When plotted as a map, this shows which cells are associated with higher concentrations of certain species at the measurement site.
2.3 Aerosol offline measurements
The aerosol samples from both of the sites were extracted with deionized ultrapure water (Milli-Q) in a mechanical shaker for 1 h, and the water extracts were filtered on PTFE membranes (pore size: 0.45 µm) in order to remove suspended materials. Extracts were analyzed by ion chromatography (IC) for the quantification of water-soluble inorganic ions (sodium, Na+; chloride, Cl−; nitrate, NO; sulfate, SO; ammonium, NH; potassium, K+; magnesium, Mg2+; and calcium, Ca2+), organic acids (acetate, ace; formate, for; methanesulfonate, MSA; and oxalate, oxa) (Sandrini et al., 2016), and low-molecular-weight alkyl amines (methyl-, ethyl-, dimethyl-, diethyl-, and trimethyl-amine; MA, EA, DMA, DEA, and TMA, respectively) (Facchini et al., 2008a). An IonPac CS16 3×250 mm Dionex separation column with gradient MSA elution and an IonPac AS11 2×250 mm Dionex separation column with gradient KOH elution were deployed for cations and anions, respectively. The sea-salt and non-sea-salt fractions of the main aerosol components measured by IC (SS-x and nSS-x, respectively) were derived based on the global average sea-salt composition found in Seinfeld and Pandis (2016) using Na+ as the sea-salt tracer. A complete list of the species quantified by IC and used in the subsequent discussion is given in Table S3. The data are also available from Zenodo (https://doi.org/10.5281/zenodo.10663787, Paglione, 2024).
The water-soluble organic carbon (WSOC) content was quantified using a total organic carbon (TOC) thermal combustion analyzer (Shimadzu TOC-5000A). Given MSA's high relative contribution to the total organic mass, it is separated by subtracting its carbon contribution (in µgC m−3) from the total WSOC, thereby obtaining the non-MSA WSOC. A carbon-to-mass conversion factor of 2 was used to estimate the non-MSA water-soluble organic matter (non-MSA WSOM) from the non-MSA WSOC measurements, following the values suggested for marine organic aerosols by Jung al. (2020). The total WSOM was then calculated as the sum of MSA and the non-MSA WSOM mass concentrations. Field blanks were collected at both sites, and all of the sample concentrations were corrected for the blanks, which resulted in negligible values.
Aliquots of the aerosol extracts were dried under vacuum and redissolved in deuterium oxide (D2O) for organic functional group characterization by proton-nuclear magnetic resonance (H-NMR) spectroscopy (hereinafter also referred to as NMR), as described in Decesari et al. (2000). The H-NMR spectra were acquired at 600 MHz in a 5 mm probe using a Varian Unity INOVA spectrometer, at the NMR facility of the Department of Industrial Chemistry (University of Bologna). Sodium 3-trimethylsilyl-(2,2,3,3-d4) propionate (TSP-d4) was used as an internal standard by adding 50 µL of a 0.05 % TSP-d4 (by weight) in D2O to the standard in the probe. To avoid the shifting of pH-sensitive signals, the extracts were buffered to pH ∼3 using a deuterated-formate/formic-acid (DCOO HCOOH) buffer prior to the analysis. The speciation of hydrogen atoms bound to carbon atoms can be provided by H-NMR spectroscopy in protic solvents. On the basis of the range of frequency shifts, the signals can be attributed to H–C containing specific functionalities (Decesari et al., 2000, 2007). The main functional groups identified include unfunctionalized alkyls (H–C), i.e., methyl (CH3), methylene (CH2), and methine (CH) groups of unsubstituted aliphatic chains (also later named “aliphatic chains”); aliphatic protons adjacent to unsaturated/substituted groups (benzyl and acyl groups: H–C–C =) and/or heteroatoms (amines, sulfonates: H–C–X, with X ≠ O), like alkene (allylic protons), carbonyl, or imino groups (hetero-allylic protons) or aromatic rings (benzylic protons) (also later named “polysubstituted aliphatic chains”); aliphatic hydroxyl/alkoxy groups (H–C–O), typical of a variety of possible compounds, like aliphatic alcohols, polyols, saccharides, ethers, and esters (i.e., also abbreviated later as “Sug–Alc–Eth–Est”); anomeric and vinylic groups (O–CH–O), from incompletely oxidized isoprene and terpene derivatives, from products of aromatic-rings opening (e.g., maleic acid), or from sugar/anhydro-sugar derivatives (glucose, sucrose, levoglucosan, glucuronic acid, etc.); and, finally, aromatic functionalities (Ar–H, also abbreviated later as “Arom”). Organic hydrogen concentrations directly measured by H-NMR were converted to organic carbon. Stoichiometric ratios were specifically assigned to functional groups using the same rationale described in previous works (Decesari et al., 2007; Tagliavini et al., 2006): briefly, the choice of specific molar ratios is based on the expected stoichiometry and structural features of the molecules that every region of the H-NMR spectra can actually represent in atmospheric aerosol samples on average. The ratios used in this study are showed in Table S4 in the Supplement. Although the sum of NMR functional group concentrations approached total WSOC in many samples, the uncharacterized fraction was significant (on average 30 %). Possible reasons for the “unresolved carbon” are (1) the presence of carbon atoms not attached to protons and, thus, not detectable by H-NMR, such as oxalates and compounds containing substituted quaternary carbon atoms or fully substituted aryls (Moretti et al., 2008); (2) the uncorrected estimations of stoichiometric ratios used for the conversion of directly measured organic hydrogens into organic carbon; and (3) evaporative losses during the evaporation of the extract prior to the preparation of the NMR tube.
Organic tracers were identified in the H-NMR spectra on the basis of their characteristic patterns of resonance and chemical shifts: for this scope, we used libraries of reference spectra from the literature (of standard single compounds and/or mixtures from laboratory/chamber experiments and/or from ambient field studies at near-source stations). We also validated our interpretations using extensive libraries of biogenic compounds and theoretical simulations of H-NMR spectra of atmospherically relevant molecules offered by specific elaboration tools/software such as Chenomx NMR Suite (Chenomx inc., evaluation version 9.0) and ACD/Labs (Advanced Chemistry Developments inc., version 12.01), some examples of which are reported in the Supplement (Figs. S2, S3).
Among the tracers identified, MSA and two low-molecular-weight alkyl amines (di- and tri-methyl amines; DMA and TMA, respectively) were quantified in mass concentrations. Speciation and quantification of these tracers by H-NMR were validated by comparison with the IC measurements of the same species; this comparison showed excellent agreement between the two techniques (Fig. S4). Other molecular tracers (such as lactic acid – Lac; betaine – Bet; choline – Cho; glycerol – Gly; glucose – Gls; sucrose – Suc; and hydroxymethanesulfonic acid – HMSA) were unequivocally identified but not quantified in this study, where they were mainly used for source identification. In the present study, we also sometimes refer to broadly defined chemical classes synonymously with the classes of compounds carrying specific functional groups or combinations of them, like “polyols” (i.e., compounds with NMR bands in the H–C–O region) or “saccharides” (similar to polyols but with the concomitant presence of NMR signals in the anomeric region O–CH–O). Intense NMR bands in the H–C (unfunctionalized alkyls) region with prominent peaks characteristic of aliphatic chains (terminal methyls at 0.9 ppm, methylenic chains at 1.2 ppm, and methines or methylenes in beta position to a C = O group or an oxygen atom at 1.5 ppm) were attributed to compounds from the degradation of lipids (sometimes defined concisely as “lipids”) including low-molecular-weight fatty acids (LMW-FA) and mixtures of other alkanoic acids. A comprehensive list and a description of the functional groups, molecular species, and categories of compounds identified in this study by H-NMR spectra analysis is given in Table S5.
2.4 Factor analysis of H-NMR spectra
The H-NMR spectra from the samples collected at both sites were analyzed by factor analysis techniques, following the method already described in previous publications (Decesari et al., 2011; Finessi et al., 2012; Paglione et al., 2014a, b), to apportion major components of WSOC and attribute them to specific sources. Factor analysis was applied directly to the collection of spectra, using the spectral signals at the different chemical shifts as the input variable (after several preprocessing steps; described in more detail in Sect. S2 in the Supplement). The factor analysis methods used in this study include two different nonnegative algorithms: positive matrix factorization (PMF; Paatero and Tapper, 1994), using the ME-2 solver (Paatero, 1999), and multivariate curve resolution (MCR), according to the classical alternating least-squares approach (Jaumot et al., 2005; Tauler, 1995). Factor analysis was applied to the Signy and Halley spectral datasets, which were merged together with two main purposes: (i) to increase the number of samples () in order to improve the statistics and (ii) to find and compare relative contributions of possible common aerosol components/sources between the two sites.
The solutions with up to eight factors were explored. A full examination of the inputs and outcomes of the NMR factor analysis is reported in the Supplement (Sect. S2, Figs. S5–S12), while we focus on the five-factor solution in Sect. 3.3, which is the most interpretable and shows a substantial agreement between the two algorithms. Interpretation of factors and their attribution to specific sources is based on an integrated approach including the following: the comparison between spectral profiles and a unique library of reference spectra (recorded during laboratory studies or in the field at near-source stations; Decesari et al., 2020), the correlation of factors' contributions with available chemical tracers (i.e., sea salt and other inorganic ions, MSA, and amines; Table S6), and the examination of back trajectories and of the concentration-weighted trajectory (CWT) maps of each factor indicating their potential source areas.
Moreover, in order to specifically check the separation between primary and secondary aerosol sources, we applied another run of factor analysis, this time adding 16 H-NMR spectra of sea-spray aerosol (SSA) generated in bubble-bursting tank experiments (primary by definition) to the ambient aerosol spectra from Signy and Halley. These bubble-bursting experiments were performed using local Antarctic seawater and melted sea ice collected in the regions of Antarctic Peninsula, South Shetland islands, and Weddell Sea during the PI-ICE project cruise, as described by Dall'Osto al. (2022a). The results of this additional factor analysis (summarized in Sect. S2 in the Supplement) helped to interpret factors identified by ambient samples and to attribute some of them to primary sources (POA) (Figs. S11, S12).
This section is divided in three main parts: in Sect. 3.1, we discuss the bulk aerosol composition at Signy and the drivers of its variability; in Sect. 3.2, we provide the same analysis for the data collected at Halley station and discuss the differences between the two stations for the period of sampling overlap (42 d); finally, in Sect. 3.3, we discuss the WSOC source apportionment results based on the H-NMR spectra factor analysis. Samples collected at Signy are labeled as “Sx”, whereas samples from Halley are labeled as “Hx”.
3.1 Main aerosol chemical components at Signy
The chemical composition of the 14 PM1 aerosol samples collected at Signy station is reported in Fig. 2. On average, the concentrations of the PM1 aerosol water-soluble fraction are low (1.59 ± 1.44 µg m−3, average ± standard deviation, n=14) but show a noticeable variability between samples (min = 0.29 µg m−3 for S10, max = 5.54 µg m−3 for S5). The major chemical class contributing to water-soluble PM1 is sea salt (representing 45 ± 19 % of the total of the whole sampling period on average), followed by WSOM (37 ± 19 %, of which 6 ± 5 % was represented by MSA), non-sea-salt sulfate (nSS-SO4, 12 ± 14 %), and remaining minor contributions of ammonium (3 ± 3 %), nitrate (1 ± 1 %), and other non-sea-salt ions (i.e., nSS-K, nSS-Mg, and nSS-Ca, amounting to 2 ± 3 % in total).
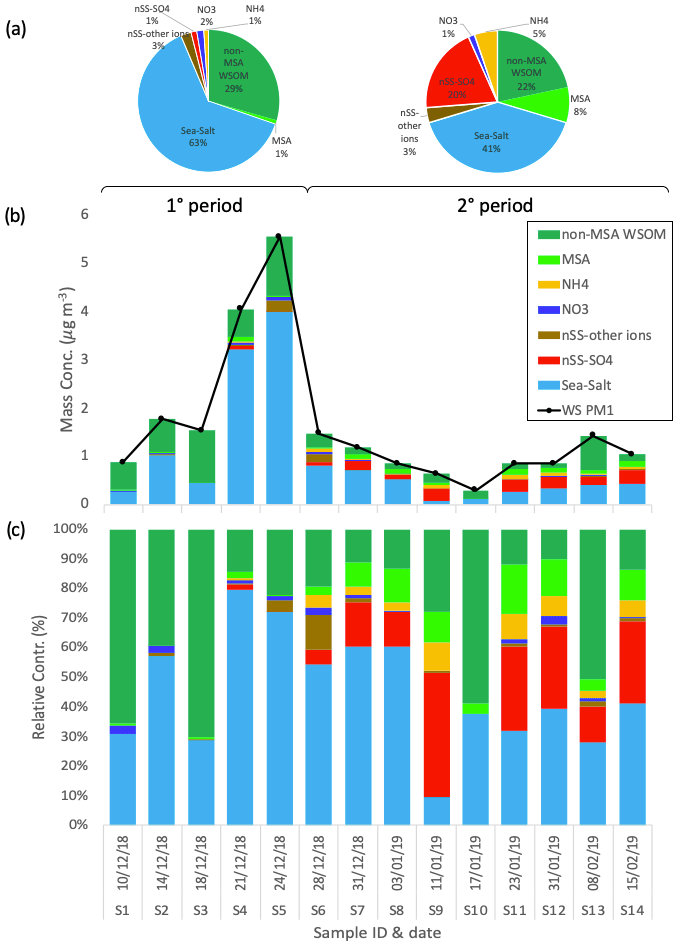
Figure 2Water-soluble PM1 loadings and chemical composition at Signy during the whole period. Pie charts in panel (a) report the average relative contributions for two different periods of the campaign: 1° period (samples S1–S5) and 2° period (samples S6–S14). Panels (b) and (c) show the respective mass concentrations and relative contribution of the different chemical species measured in each sample.
The sampling period can be divided into two different subperiods: the first time span (samples S1–S5, corresponding to 10–28 December 2018) is characterized by relatively high PM1 concentrations (2.75 ± 1.96 µg m−3), whereas the second subperiod (samples S6–S14, spanning 28 December 2018–2015 February 2019) shows lower concentrations on average (0.95 ± 0.37 µg m−3). Regarding composition, the first subperiod is characterized by a higher contribution of sea salt (54 ± 23 % to total water-soluble PM1) compared with the second subperiod, which exhibits a lower sea-salt content (40 ± 17 %) and an increased fraction of non-sea-salt sulfate (19 ± 13 %). The contribution of WSOM shows lower variability between the two subperiods (43 ± 25 % and 33 ± 16 % of water-soluble PM1 in the first and second time spans, respectively, of which MSA represents 1 ± 1 % and 8 ± 5 %, respectively). Nevertheless, the inter-sample variability in the WSOM concentrations is large (0.49 ± 0.35 µg m−3 on average; min = 0.18 µg m−3 for S10, max = 1.25 µg m−3 for S5). The main difference in WSOM at Signy between the two subperiods is found in the functional group composition, as characterized by H-NMR analyses (Fig. 3). Specifically, the first subperiod (S1–S5) is enriched in alkoxy groups (H–C–O; 43 ± 4 % relative to 23 ± 8 % of total WSOC) and unsubstituted aliphatic chains (H–C; 30 ± 5 % relative to 16 ± 5 %) compared with the second subperiod (S6–S14). These H-NMR features have been previously associated (by comparing the analysis of tank-generated sea-spray particles) with sugars, polyols (e.g., glucose, sucrose, and glycerol), and fatty acids from lipids degradation of primary biogenic origin (sea and sea-ice microbiota) (Facchini et al., 2008b; Decesari et al., 2011, 2020; Liu et al., 2018; Dall'osto et al., 2022a, b). By contrast, the second subperiod is enriched in MSA (24 ± 13 % relative to 3 ± 3 % in the first subperiod in terms of WSOC as reconstructed by H-NMR) and alkyl amines (15 ± 8 % relative to 2 ± 1 %), which are considered mostly secondary in nature (Dall'Osto et al., 2019).
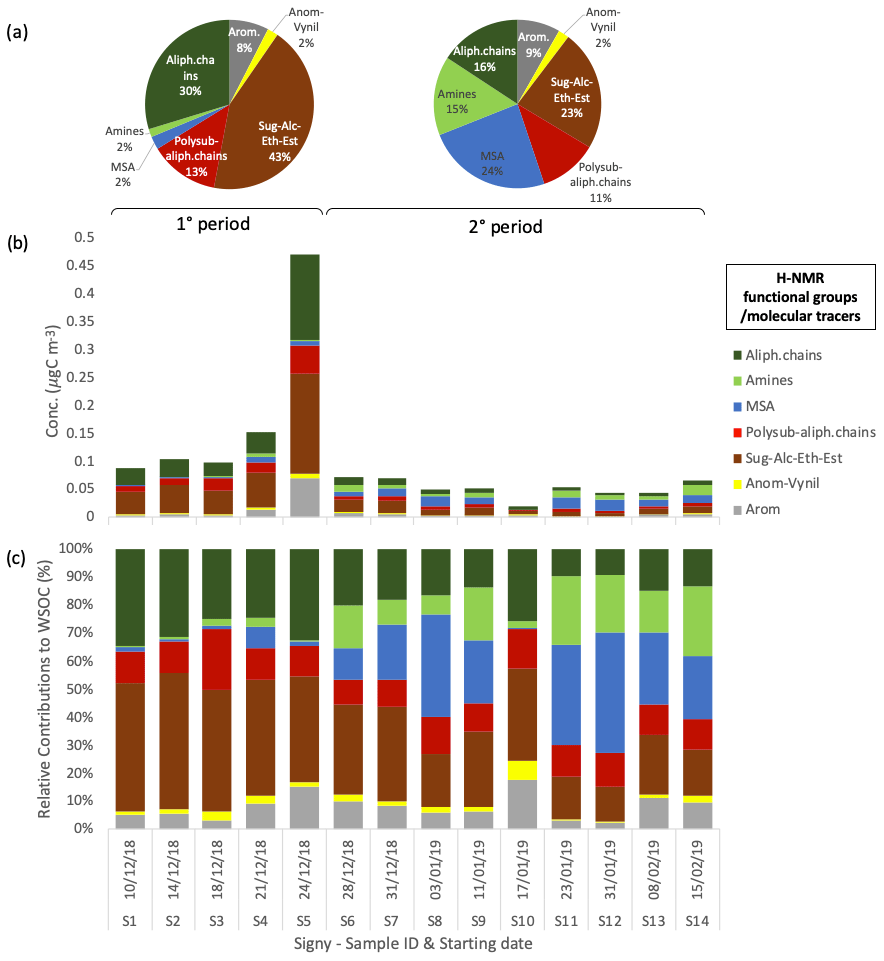
Figure 3Water-soluble OC concentrations and composition in terms of H-NMR functional groups at Signy. (a) Average relative contributions of two different periods of the campaign: 1° period (samples S1–S5) and 2° period (samples S6–S14). Panels (b) and (c) show the respective mass concentration and relative contribution of the different functional groups identified and quantified by H-NMR in each sample (expressed in µgC m−3).
The meteorological conditions are not statistically different between the two subperiods (Table S2). However, the analysis of the air mass origins (Fig. S13) reveals different back trajectories between the first five samples (S1–S5) and the last nine samples (S6–S14), suggesting that the observed changes in the chemical composition are linked to different air mass origins of the air masses reaching the sampling site, as further discussed in the next sections.
3.2 Main aerosol chemical components at Halley and comparison with Signy
The chemical composition of the eight PM1 aerosol samples collected at Halley station (reported in Fig. 4) shows remarkable differences with respect to Signy. Overall, water-soluble PM1 mass concentrations are substantially lower (0.79 ± 0.56 µg m−3, average ± standard deviation, n=8) and show less variability between samples (min = 0.25 µg m−3 for H4, max = 2.02 µg m−3 for H7). Most noticeably, a much lower contribution of sea salt to PM1 is measured in these samples, representing only 6 ± 7 % on average, in striking contrast to Signy. Only one sample (H5) shows a relatively high influence of sea salt (23 % of total PM1). In contrast to Signy, the PM1 chemical composition at Halley is constantly dominated by non-sea-salt sulfate and WSOM, representing 53 ± 17 % and 29 ± 14 % on average (of which 8 ± 6 % is represented by MSA), respectively. In the samples collected at the end of January, nSS-SO4 represents a major component of PM1 at both Halley and Signy, but its concentrations at the former site are greater, peaking above 1 µg m−3. In summary, based on the analysis of the submicrometer aerosol bulk composition, a first sharp difference between the two sites can be underlined, with Signy being much more impacted by primary aerosol (sea spray), whereas Halley is much more influenced by secondary aerosol (nSS-SO4).
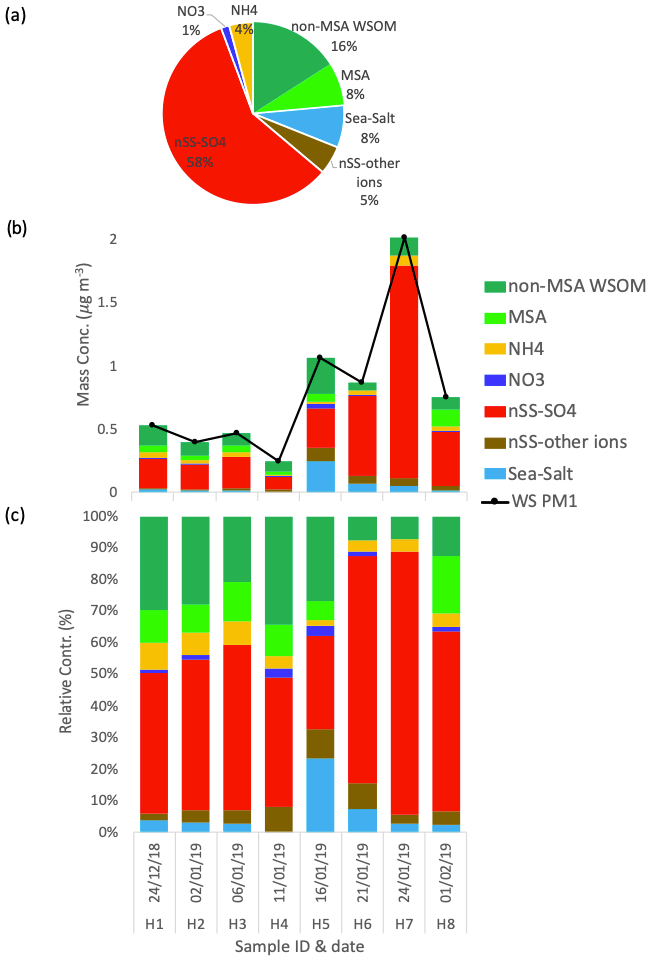
Figure 4Water-soluble PM1 loadings and the chemical composition at Halley. The pie chart in panel (a) represents the average relative contributions of the whole sampling period. Panels (b) and (c) represent the respective mass concentration and the relative contribution of the different chemical species measured in each sample.
The organic composition expressed in terms of H-NMR functional groups and molecular tracers shows a limited variability between samples at Halley, with a dominant contribution of alkoxy groups (H–C–O), MSA, and alkyls (H–C), representing 33 ± 7 %, 28 ± 14 %, and 18 ± 6 % on average, respectively (Fig. 5). The significant contribution from MSA is in line with the high nSS-SO4 share in the water-soluble PM1 mass, while the high contributions from the H–C–O and H–C groups indicate a contribution from primary aerosol that is not seen from the inorganic composition data alone.
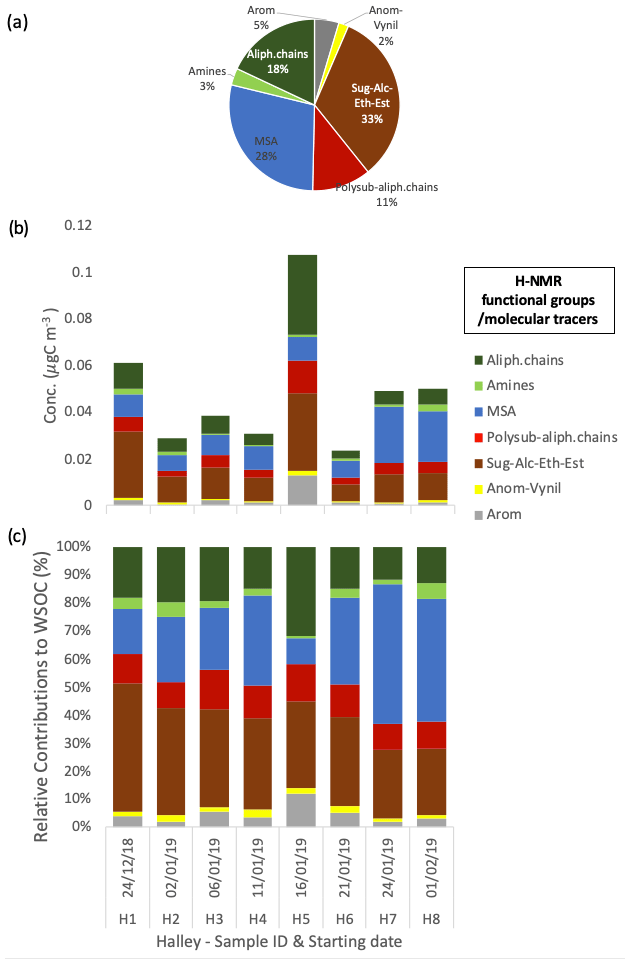
Figure 5Water-soluble OC concentrations and the composition in terms of H-NMR functional groups at Halley. The pie chart in panel (a) represents the average relative contribution. Panels (b) and (c) show the respective mass concentration and the relative contribution of the different functional groups identified and quantified by H-NMR in each sample (expressed in µgC m−3).
The contribution of MSA at Halley, representing 28 ± 14 % of the total WSOC on average, is significant with respect to the aerosol mass contribution throughout the whole sampling period, regardless of the fact that Halley is quite a distance from open-ocean regions. In contrast, alkyl amines represent only a minor portion of WSOC in Halley samples (3 ± 2 % on average), contrary to the parallel samples from Signy (14 ± 8 %). A direct comparison of the average water-soluble PM1 and WSOC concentrations and composition at Signy and Halley, based on the samples collected in parallel during the 42 d of the campaign, is reported in Fig. 6 (only the samples from the second subperiod at Signy are considered here, hence the exclusion of S5). Although the total concentration of water-soluble PM1 in the parallel samples is comparable between the two sites, the average values reported in Fig. 6a again highlight the much higher contribution of sea salt at Signy (0.40 ± 0.29 µg m−3, representing 42 ± 18 % of total water-soluble PM1 during the overlapping period on average) with respect to Halley, which was conversely dominated by nSS-SO4 (53 ± 17 % of total water-soluble PM1). In any case, WSOM represented the second major component of PM1, with similar proportions between the two sites but also with remarkable differences in the functional groups' distributions and in tracer concentrations (Fig. 6b). A lower contribution of alkoxy groups and higher concentrations of alkyl amines is observed at Signy compared with Halley. All of these differences strongly suggest different sources and origin areas for the aerosol collected at the two sites, which is also confirmed by the air mass analysis information shown in Fig. S14. Analysis of the back trajectories highlights a much stronger influence of marine air masses at Signy, in agreement with the substantially higher contribution of sea salt in PM1 and the reduced secondary organic nitrogen compounds (alkyl amines) at Halley. At the same time, however, the MSA concentrations are similar between the two sites, in spite of Halley station's distance from the sea, and the nSS-SO4 concentrations – which are known to be impacted by DMS sources in the ocean – are greater at Halley than at Signy. The MSA / nSS-SO4 ratios are 0.55 ± 0.23 at Signy and 0.24 ± 0.05 at Halley (on average for the overlapping period). The Halley values are in line with previous measurements at the same site by Legrand and Pasteur (1998). At Signy, the MSA / nSS-SO4 ratio is consistent with the latitudinal trend evidenced by Bates et al. (1992) for the Southern Hemisphere.
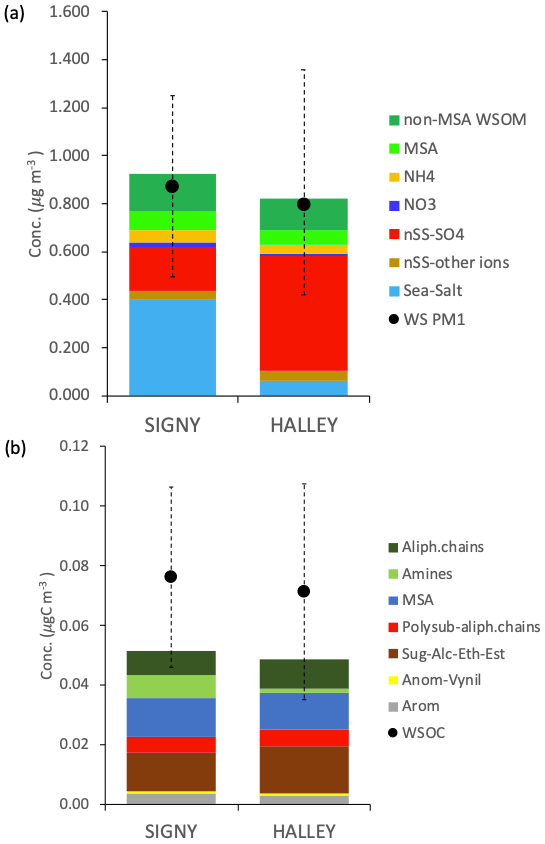
Figure 6Average concentrations at Signy and Halley for the overlapping period (S6–S12 and H1–H8): (a) average concentrations of water-soluble PM1 and its main components; (b) average concentrations of WSOC measured by TOC and H-NMR functional group concentrations.
Finally, the organic composition at Halley, which is rich in H–C–O and H–C groups, points to a primary organic contribution, which again conflicts with the prevalently continental back trajectories reaching Halley station. Some clues to resolve such discrepancies are provided by the organic factor analysis discussed in the next section.
3.3 Water-soluble organic aerosol (WSOA) source apportionment: primary and secondary OA types and their contributions
The large inter-sample variability in the H-NMR spectra characterizing the two sample sets from Signy and Halley makes factor analysis a potentially powerful tool for source identification and source apportionment, in spite of the small number of samples. A full examination of the outcomes of NMR factor analysis is reported in the Supplement (Sect. S.2, Figs. S5–S12). Here, we provide a description of the five-factor solution, which was identified as the most robust and informative one (Fig. 7) based on the best separation of interpretable spectral features and on the best agreement between the two algorithms applied with respect to both spectral profiles and contributions. The associated concentration-weighted trajectory (CWT) maps for each factor, indicating their potential source areas, are reported in Fig. 8. Our factor analysis was able to identify two primary organic aerosol (POA), two secondary organic aerosol (SOA), and one other factor prevalently found at Halley that was of unknown origin. Specifically, the WSOM factors are as follows:
-
Factor 1 – “marine POA pelagic (lipids, polyols, and saccharides)”. This factor characterized most of the samples at both Signy and Halley with comparable concentrations and relative contributions among the parallel samples at the two sites. Interestingly, this factor is characterized by an NMR spectral profile dominated by polyols (glycerol and possibly threitol) and saccharides (found in some samples as glucose and sucrose) as well as aliphatic compounds bearing alkyl chains, such as in low-molecular-weight fatty acids (LMW-FAs). All of these features are typical of primarily emitted submicrometer sea-spray particles generated by bubble-bursting experiments of biologically productive seawater, as already documented in previous studies conducted in similar SO areas (Decesari et al., 2020; Dall'Osto et al., 2022a) as well as in the North Atlantic Ocean (Facchini et al., 2008b). This POA component was present in almost all of the samples (especially at Signy) and was prevalently associated with air masses coming from open-ocean regions, including large sectors of the SO northwest of Signy and east of Halley (see the CWT maps in Fig. 8). The CWT maps for Factor 1 at Halley, although showing large overpasses over continental Antarctica, clearly show a maximum when being influenced by a northern origin in the SO. In summary, this POA seems to be a common component of the sea-spray OA associated with open-ocean areas across a wide range of longitudes and can be transported for thousands of kilometers.
-
Factor 2 – “marine POA (Lac)”. This factor represents a significant portion (up to 70 %) of WSOC in specific samples, especially at Signy (i.e., S3–S5). It shows a mixture of LMW-FAs and polyols, similar to Factor 1, but with an important contribution from lactic acid (Lac, peaks at 1.35 and 4.21 ppm in the H-NMR spectra). Lactic acid – a major product of sugar fermentation common to many microorganisms (Miyazaki et al., 2014) – has already been identified in seawater and sea-spray aerosol samples in the study region and is considered to be of primary biogenic origin (Decesari et al., 2020; Dall'Osto et al., 2022a). In particular, these features are characteristics of specific sea-spray aerosol samples coming from seawater bubble-bursting experiments conducted in coastal areas around Adelaide Island, Davis Coast, and Livingston Island (SW3, SW4, SW8, and especially SW11 and SW15; Figs. S8, S11, S12). This factor is found only in the first subperiod of Signy (S1–S5), and the associated CWT maps are similar but show somewhat higher concentrations closer to the site with respect to Factor 1. For this reason, we consider it to be a second marine POA factor influenced by aerosol sources in coastal/sympagic areas around the Antarctic Peninsula.
-
Factor 3 – “marine SOA pelagic (MSA + DMA)”. This factor is dominated by methanesulfonic acid and dimethyl amine (identified by the H-NMR singlets at 2.80 and 2.71 ppm, respectively). The predominance of these compounds indicates marine biogenic secondary formation for this factor. The contribution time series of Factor 3 shows a good correlation with the concentrations of MSA at both sites (R2=0.88, n=22, p<0.005) and with nSS-SO4 in particular at Halley (R2=0.58, n=8, p<0.1). The CWT maps associated with Factor 3 (Fig. 8) at Signy show the predominance of air masses coming from the open SO and spending most of their time on pelagic waters (Fig. S15). In contrast, at Halley, this component shows maxima in air masses originating in open-ocean areas to the northeast but traveling above the planetary boundary layer (PBL) (Fig. S16) and possibly reaching the station through free-tropospheric circulation after spending time over the Antarctic continent. In summary, this component can be considered to be a background/regional marine SOA source associated with emissions in pelagic waters of the SO.
-
Factor 4 – “marine SOA sympagic (TMA + MSA)”. This factor is characterized by high loadings of trimethyl amine, even higher than MSA. This component was very characteristic of Signy (but absent at Halley), especially of the second sampling subperiod (S6–S14). The corresponding CWT maps clearly assign Factor 4 to a source footprint stretching over the sympagic waters of the Weddell Sea. This observation agrees with our previous findings in the same area pointing to the sympagic Weddell Sea region as a source of biogenic organic nitrogen and, in particular, amines in ambient aerosols (Dall'Osto et al., 2017, 2019; Decesari et al., 2020; Brean et al., 2021).
-
Factor 5 – “POA–SOA mix”. A final factor was found to characterize the organic composition at Halley. It accounts for a substantial fraction of the H–C–O and H–C groups at the aforementioned station, corresponding to the sum of the contribution from the POA pelagic (Factor 1) but with distinct groups of H-NMR resonances. In particular, a complex pattern of H-NMR signals is found at the chemical shift between 4 and 4.5 ppm (in the range of the H–C–O groups) (Fig. S17). These signals have never been observed before in ambient aerosol samples and are largely missing in the Signy samples. They can be tentatively attributed to acidic sugars (e.g., uronic acids) or organic sulfate (sulfate esters), as better discussed in Supplement (Fig. S10 and corresponding text). Considering the high abundance of nSS-SO4 and the likely corresponding acidic nature of the aerosol at Halley, a hypothesis for the formation of these compounds could be the esterification of common polyols (such as glycerol) to organic sulfates. However, this hypothesis is just speculative at this stage and possibly needs confirmation from additional analysis and data. As already mentioned, alkoxy groups are usually considered primarily emitted (confirmed also by the presence of degraded/oxidized lipid signals at 0.9, 1.3, and 1.6 ppm in the alkyls region of the Factor 5 spectral profile), but the hypothesized substitution of hydroxyls with sulfonate groups can be considered of secondary nature (aging of primary alcohols/sugars). Moreover, the factor profile shows some other secondary features, such as MSA and DMA signals, which makes this factor difficult to identify. For this reason, we consider it to be a mixture of primary and secondary OA (“POA–SOA mix”), characterizing the Halley site. A clearer interpretation of the nature of this organic fraction could not currently be achieved. The CWT maps for Factor 5 do not elucidate any specific source areas. It is speculated that it could be a mixture of primary and secondary components, potentially partially coming from continental/terrestrial environments (Kyrö et al., 2013).
Figure 7 reports the average contributions of the five factors at the two sites. It is worth noting that the WSOA factor analysis confirmed the importance of primary sources (POA) in the first sampling subperiod at Signy, as already evidenced by the bulk chemical analyses: in fact, the sum of POA factors represents 89 % of the total WSOA on average for the first five samples (S1–S5). Much more relevant are the contributions of secondary components (SOA) in the second sampling subperiod at Signy (71 % of total WSOA on average for samples S6–S14) and at Halley (35 % of WSOA on average). However, the dominant component at Halley remained the so-called POA–SOA mix factor, accounting for the 44 % of WSOA at the site. Excluding Factor 5, the trend in the contribution of POA vs. SOA is clear: the SOA fraction of OA increases while the austral summer progresses, as a possible consequence of the increasing emissions of reactive vapors from the ocean as well as enhanced photochemistry. Nevertheless, one clear episode of a high POA concentration is observed in the middle of January at both stations, indicating that synoptic circulation can augment the transport of POA from the SO over the entire Weddell Sea region and into the Antarctic continent across a 2000 km wide area, even in the middle of the Austral summer.
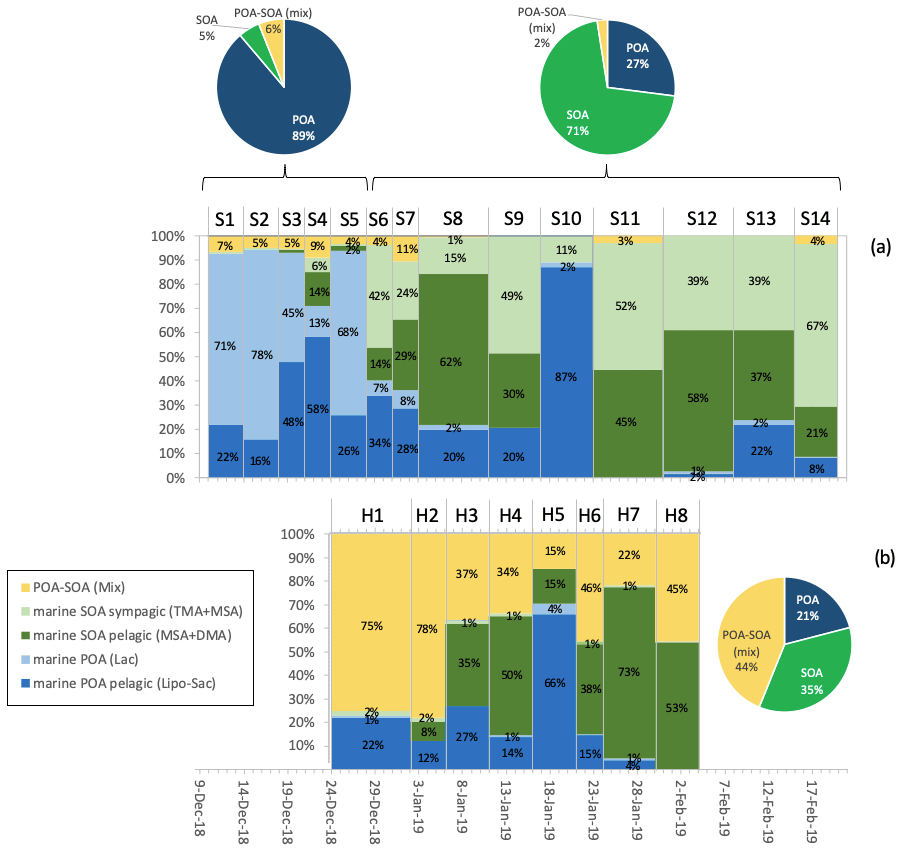
Figure 7Relative contributions of the WSOA factors identified by H-NMR factor analysis at Signy (a) and Halley (b). Histograms show the relative contributions (%) of each factor in each sample: blue shades refer to the POA components, green shades refer to SOA components, and yellow denotes the POA–SOA mix factor. Pie charts report the average values of the sum of factors classified as POA (dark blue), SOA (green), and POA–SOA mix (yellow) at the two sites and in different periods.
The variability in the aerosol populations in the polar southern latitudes is affected by strong latitudinal changes in both aerosol sources and atmospheric circulation. In the area of East Antarctica, Humphries et al. (2021) evidenced latitudinal gradients in atmospheric aerosol loading and composition which were associated with the position of the atmospheric polar front. Our results extend such observations to the West Antarctica region of Antarctic Peninsula and Weddell Sea while also adding new insights into the nature of aerosol sources and the drivers of aerosol chemistry.
The air mass back trajectories traveling to Signy and Halley (reported in Fig. S14) and the CWT maps (in Fig. 8) clearly show how the two sites are mostly influenced by different air mass origins and histories. In particular, Signy (60° S, in the maritime Antarctica) is impacted by two types of air masses: one (prominent in the first part of the campaign; samples S1–S5) associated with the westerlies and spending most of the time over the pelagic waters of the SO and the other (influencing the second period; samples S6–S14) recirculating over the Weddell Sea and spending more time over sympagic waters and sea-ice marginal zones (Figs. S13–S15). By contrast, Halley (75° S, over the ice shelf) is mainly affected by an anticyclonic flow (from the east or southeast) over the Antarctic continent (60 % of the air mass recirculated over the Antarctic continent), involving air masses that had traveled over consolidated pack ice with a minor influence from the pelagic environments in the SO (Figs. S14, S15). Whilst the Signy samples were representative of air masses that had previously traveled almost entirely within the PBL, different conditions were observed at Halley, where only 59 ± 24 % traveled within the PBL (Fig. S16a, b). As the specific ecoregions (sympagic and pelagic) supply aerosol populations with distinct physical and chemical characteristics (Dall'Osto et al., 2017, 2019; Decesari et al., 2020; Rinaldi et al., 2020; Brean et al., 2021), we show here that the latitudinal change between 60 and 75° S in the prevalent atmospheric circulation tends to maintain a segregation between the specific aerosol populations produced in the different environments. This explains why primary sea-salt particles are found in much greater numbers at Signy, whereas aged nSS-SO4 particles affect Halley to a greater extent. However, the results of the organic factor analysis highlight a more complicated picture. Summarizing our findings on the inorganic and organic characterization at the two stations, we can distinguish at least three atmospheric regimes:
-
During the subperiod at Signy (December), PM1 particles transported by the westerlies and coming from the pelagic waters of the open SO (organic Factor 1) with some possibly affected by marine ecosystems in the coastal Antarctica (organic Factor 2) increased the water-soluble PM1 concentrations above 1 µg m−3 (up to 5 µg m−3) and were mostly contributed by primary constituents (sea-salt and marine POA components).
-
During the second subperiod at Signy (January–February), the aerosol originated prevalently from sympagic areas of the Weddell Sea region and was characterized by lower concentrations (1 µg m−3 or lower) and by a higher contribution of secondary components (nSS-SO4 and SOA, especially enriched in biogenic organic nitrogen and, in particular, TMA).
-
At Halley (January), water-soluble PM1 occurred in very low concentrations (only occasionally reaching 1 µg m−3) and was dominated again by secondary components, especially nSS-SO4, MSA, and DMA, but also by OA classes specifically found at this site that were of unclear origin.
The relatively high concentrations of nSS-SO4 in the sinking anticyclonic air masses arriving at Halley point to the processes of atmospheric aging for this site. This may explain the lower MSA / nSS-SO4 ratio at Halley, assuming partial MSA oxidation to nSS-SO4 during transport. However, nSS-SO4 is associated with MSA and DMA, i.e., organic components overlapping with the “pelagic SOA” of Signy (and classified accordingly in Factor 3), meaning that the products of oceanic emissions find their way into the free troposphere and lead to aerosol formation in the Antarctic continental atmosphere. This study again highlights the importance of amines and organic nitrogen in SOA formation in southern polar areas, as already evidenced by our previous studies in the same area (Dall'Osto et al., 2017, 2019). Here, we identify two factors of organic nitrogen: one – rich in TMA – is associated with sources in the sympagic waters of the Weddell Sea (Factor 4), whereas the other (characterized by DMA and MSA) is associated with air masses from pelagic open SO waters (Factor 3). Factor 3, in particular, appears to be a background component of the Antarctic atmosphere in the middle of the austral summer (January) across latitudes (as it affects both Signy and Halley), and it is linked to long-range transport and to marine emissions over a wide source area (Fig. 8). Factor 4, instead, tracing SOA formation from emissions in the Weddell Sea, mainly affects maritime western Antarctica, although not Halley, in spite of the proximity of the site to the source regions. This can be explained by the fact that Halley does not receive direct flows from the Weddell Sea itself but rather from coastal Antarctic areas at eastern longitudes where sea ice is much less developed in summer (Figs. S14, S15).
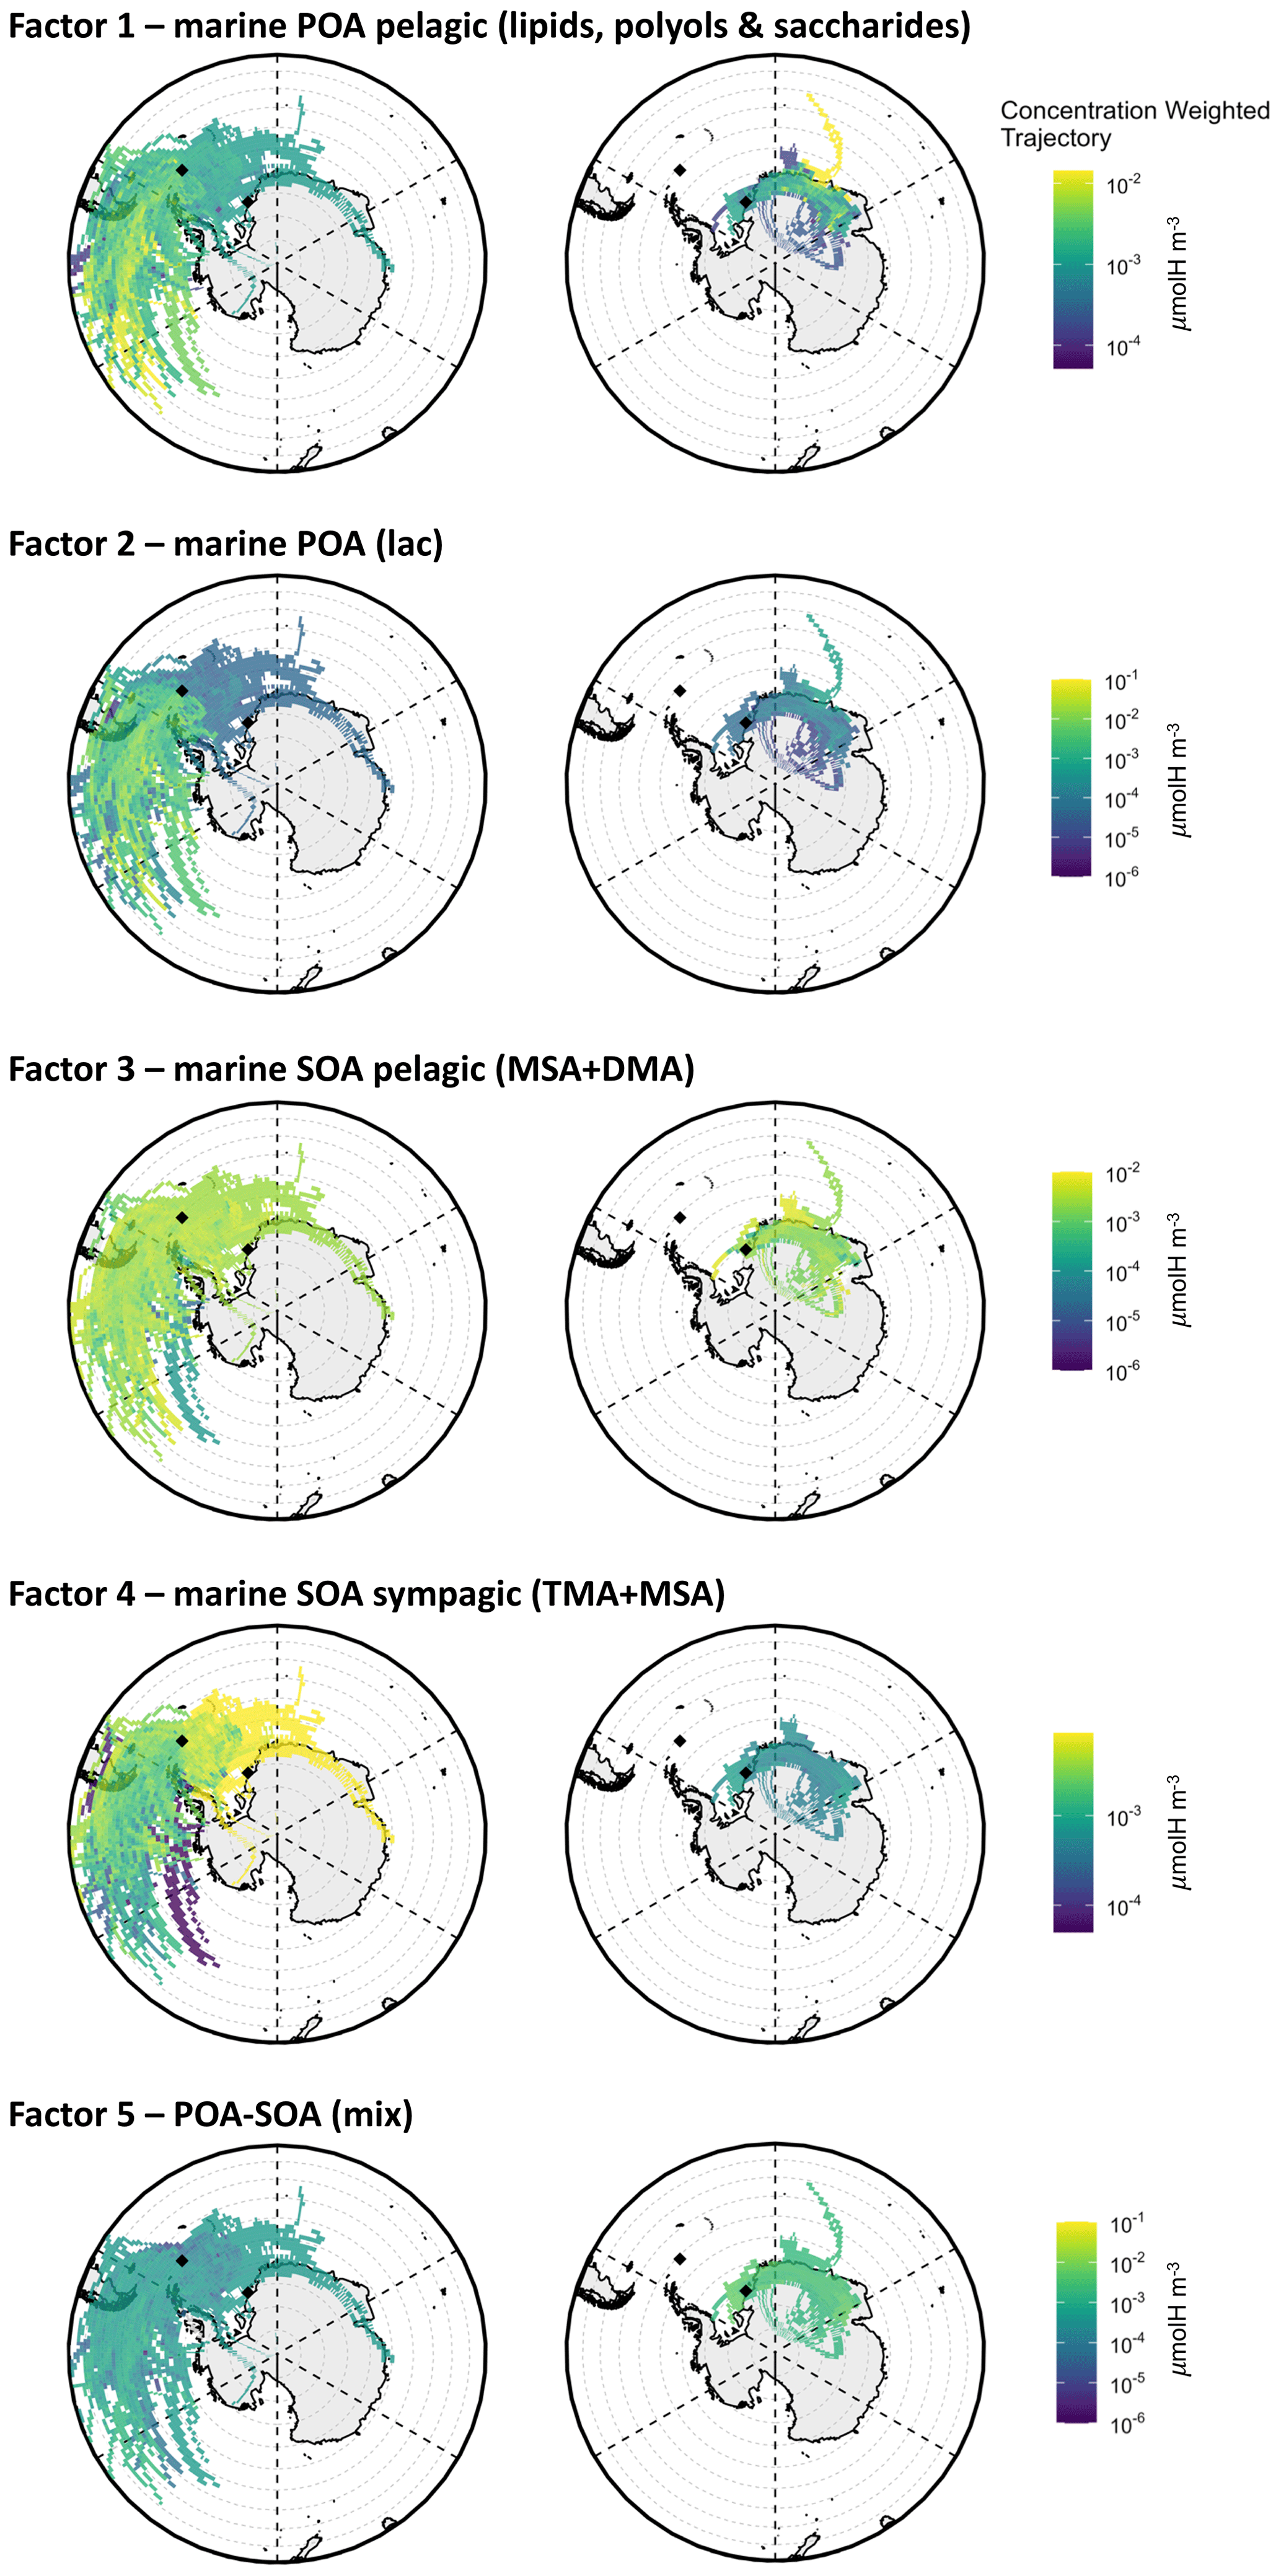
Figure 8CWT maps of the WSOA components identified by the factor analysis of NMR spectra at Signy (left) and Halley (right). The color scale shows which air masses along the back trajectories have, on average, higher concentrations (expressed in µmolH m−3) at the measurement site: lighter colors (toward yellow) and darker colors (toward blue) indicate respective higher and lower concentrations of the component associated with the air masses coming from a specific area.
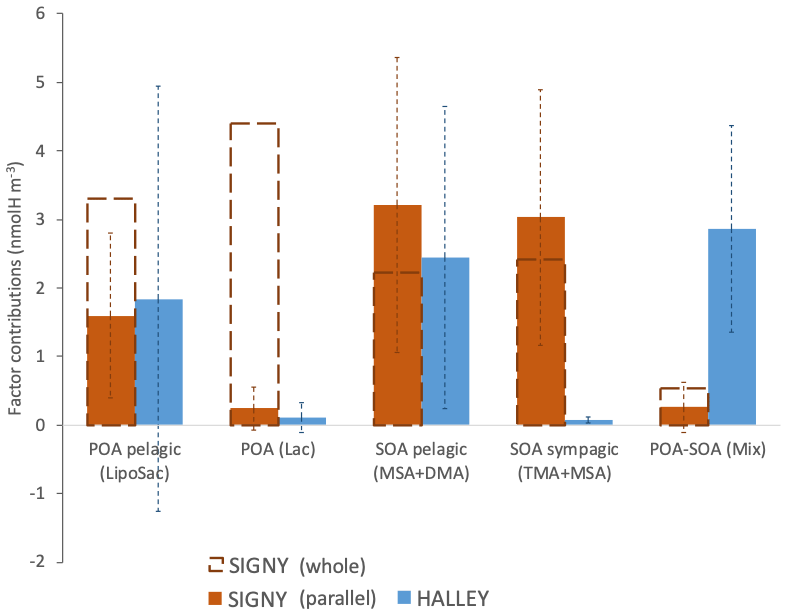
Figure 9Average contributions of WSOA components identified in the overlapping period at the two Antarctic stations.
The occurrence of specific organic factors at one site but not at the other (Factors 2 and 4 unique to Signy; Factor 5 unique to Halley) is in line with the idea that atmospheric circulation maintains chemical gradients in the Antarctic aerosol population. Nevertheless, we show that the secondary components associated with Factor 3 (MSA and DMA) can cross such gradients and be distributed at different latitudes. Figure 9 shows the average concentrations of the WSOA components identified by NMR factor analysis on average at Signy (both as an average of the whole sampling period and as an average of the parallel samples) and Halley stations. Factors 1 and 3 share a common temporal trend with respect to their contribution to WSOA at the two sites, suggesting that they represent background aerosol spread around a wide area of thousands of kilometers. Such common background components are of secondary and, more surprisingly, primary marine origin. The marine SOA pelagic (MSA + DMA) factor has very similar concentrations at Signy and Halley (3.21 ± 2.15 and 2.45 ± 2.21 nmolH m−3, respectively, on average for the parallel sampling period) (Fig. 9). Most noticeably, the same is true for the marine POA pelagic factor (1.60 ± 1.20 and 1.84 ± 3.11 nmolH m−3 at Signy and Halley, respectively). At Halley, the marine SOA pelagic factor is associated with air masses traveling above the PBL (Fig. S16b), and its concentration correlates with that of nSS-SO4, supporting the hypothesis of long-range transport associated with a free-tropospheric flow over the Antarctic dome. By contrast, the marine POA pelagic factor did not correlate with nSS-SO4 and is associated with strong winds and air masses coming directly from the northeast, especially during the aforementioned mid-January episode. Therefore, the marine POA pelagic factor is not associated with the free-tropospheric circulation and rather reached the station through transport in the PBL from the SO sectors located to the northeast of the site (Fig. 8). Contrary to Halley, the Signy site is sometimes dominated by other POA types which looked to have a more local origin and influence from the sympagic and/or coastal environments, such as the marine POA (Lac) and the marine SOA sympagic (TMA + MSA) factors.
When considering the primary aerosol components, their concentrations normalized by sea salt can provide further information on their origin/importance. It can be observed that the background marine POA pelagic enrichment in sea-spray particles is constant throughout the dataset at Signy (0.05 in the first subperiod vs. 0.04 in the second). This supports the hypothesis of a constant contribution of the background POA pelagic component in sea spray to which other primary components can be added from local biologically productive waters, as shown by samples S1–S5. In such samples, the background marine POA pelagic fraction indeed contributes less than 40 % to the total POA, mostly represented by the other primary component, marine POA (Lac) (Fig. 7). In these samples, the total POA / sea-salt ratio reached up to 0.14 (on average). Conversely, the background POA pelagic component was more enriched with respect to sea salt at Halley (average value of 0.19), where it is also the dominant POA component. This may depend on different sea-spray production conditions (e.g., reduced salinity close to the shelf or in polynyas) or to some aging process during transport to the station which preferentially removes the more soluble inorganic fraction of sea spray. These hypothetical mechanisms remain speculative at this stage and need further investigation; however, it is worth noting that marine POA may influence a much wider geographical area than the simple sea-salt concentrations would suggest.
The Antarctic ecosystems are characterized by a substantial spatial heterogeneity across marine (pelagic and sympagic) and terrestrial biomes, with productivity and biodiversity patchiness superimposed on strong environmental gradients (Convey et al., 2014). This study represents the first chemical characterization and source apportionment of organic aerosol conducted in parallel at the two British Antarctic stations of Signy and Halley, representing two different Antarctic environments separated by 2000 km and exposed to different, but partly overlapping, biogenic sources. In contrast to the paradigm of reducing the aerosol composition in background Antarctic regions to sea spray (mostly composed of sea salt; primary) and non-sea-salt sulfate (nSS-SO4; secondary), we find that water-soluble organic matter (WSOM) is the second most abundant submicrometer aerosol component in this area of the world, accounting for a substantial fraction of the total water-soluble PM1 mass, both at Signy (37 %, min–max of 16 %–71 %; after sea salt, 45 %, min–max of 9 %–80 %) and Halley (29 %, min–max of 7 %–44 %; after nSS-SO4, 53 %, min–max of 29 %–83 %). Our results starkly highlight how the heterogeneity of the Antarctic ecosystems also impact the organic aerosol sources, allowing us – for the first time – to report some unique insights into their spatiotemporal variability in that region of the world.
In particular, significant differences are found between pelagic (characterized by higher PM1 concentrations and more primary components) and sympagic (dominated by secondary components and in particular amines) periods at Signy and Halley. The sympagic area of the Weddell Sea appears to be a strong source of organic nitrogen compounds in the maritime Antarctica (Signy) and, in particular, of low-molecular-weight amines, confirming the results of previous studies in the same area (Dall'Osto et al., 2017, 2019; Decesari et al., 2020; Rinaldi et al., 2020; Brean et al., 2021). The amine speciation among samples from the different sites and over a longer period highlight that TMA is dominant over Weddell sympagic waters (specifically characterizing Signy during the second part of the measurement period), whereas DMA is spread on a larger scale, reaching Halley (regional background footprint, similar to MSA and non-sea-salt sulfate).
Enclosed between the Antarctic continent and the pack sea ice of the Weddell Sea, Halley station shows a distinct chemical composition, much depleted in sea salt and enriched in nSS-SO4 compared with Signy, likely due to long-range transport and aging in the free troposphere. The “chemical segregation” of Halley prevents inputs of certain OA types found at Signy, including SOA produced by emissions in the Weddell Sea, but allows specific aerosol organic compounds (possibly associated with organic sulfate) to develop at Halley and not at Signy.
Apart from such differences between the two environments, our study highlights the existence of background biogenic marine sources, which influence the aerosol composition on a larger scale (regional or even supra-regional): among these, in particular, there is a secondary marine component of pelagic origin, marine SOA pelagic (MSA + DMA) as well as a noteworthy marine primary source, marine POA pelagic (lipids, polyols and saccharides, which seems to travel for long distances across latitudes. In particular, the sinking free-tropospheric air masses arriving at Halley are shown to transport SOA originating from marine emissions of DMS and DMA in distant oceanic regions, and the prevalent atmospheric flow at Halley is occasionally interrupted by the direct transport of POA (from emissions in the SO) in the PBL.
In conclusion, our study highlights the striking complexity of the aerosol sources in a natural and pristine environment such as the Antarctic. Ongoing climate change is predicted to change the Antarctic environment (Rintoul et al., 2018); this, in turn, will feedback to biosphere and cryosphere exchanges with the atmosphere, changing the atmospheric concentrations of aerosols and cloud condensation nuclei (CCN) and resulting in a yet unknown further climate feedback. Future interdisciplinary studies using emerging chemical and statistical analytical techniques are required to tease out processes across spatial gradients of key environmental factors.
The data discussed in the paper are available from Zenodo (https://doi.org/10.5281/zenodo.10663786, Paglione, 2024).
The supplement related to this article is available online at: https://doi.org/10.5194/acp-24-6305-2024-supplement.
MD'O, AJ, and MatR designed the research; MD'O, AJ, and MatR organized the field campaigns; MD'O and AJ collected the aerosol samples; MP, FM, and MarR performed the chemical analyses; MP performed the factor analysis of the H-NMR spectra; SD, AM, and ET contributed to the H-NMR spectra interpretation and to the factor analysis discussion and correction; DCSB and KM elaborated the back trajectories and maps; MP, MD'O, MatR, and SD wrote the paper; and all authors (including RMH and TL-C) contributed the scientific discussion and paper revision.
The contact author has declared that none of the authors has any competing interests.
Publisher’s note: Copernicus Publications remains neutral with regard to jurisdictional claims made in the text, published maps, institutional affiliations, or any other geographical representation in this paper. While Copernicus Publications makes every effort to include appropriate place names, the final responsibility lies with the authors.
Moreover, the author wish to acknowledge the “Severo Ochoa Centre of Excellence” accreditation (grant no. CEX2019-000928-S).
This research has been supported by the European Commission, within the framework of the EU Horizon 2020 Research and Innovation program (project FORCeS, grant no. 821205), and the Ministerio de Economía y Competitividad (project PI-ICE, grant no. CTM2017–89117-R, and project POLAR-CHANGE, grant no. PID2019-110288RB-I00).
The article processing charges for this open-access publication were covered by the CSIC Open Access Publication Support Initiative through its Unit of Information Resources for Research (URICI).
This paper was edited by Rebecca Garland and reviewed by two anonymous referees.
Arrigo, K. R., van Dijken, G. L., and Strong, A. L.: Environmental controls of marine productivity hot spots around Antarctica, J. Geophys. Res.-Ocean., 120, 5545–5565, https://doi.org/10.1002/2015JC010888, 2015.
Baccarini, A., Dommen, J., Lehtipalo, K., Henning, S., Modini, R. L., Gysel-Beer, M., Baltensperger, U., and Schmale, J.: Low-volatility vapors and new particle formation over the Southern Ocean during the Antarctic Circumnavigation Expedition, J. Geophys. Res.-Atmos., 126, e2021JD035126, https://doi.org/10.1029/2021JD035126, 2021.
Bates, T. S., Calhoun, J. A., and Quinn, P. K.: Variations in the methanesulfonate to sulfate molar ratio in submicrometer marine aerosol particles over the South Pacific Ocean, J. Geophys. Res., 97, 9859–9865, https://doi.org/10.1029/92JD00411, 1992.
Brean, J., Dall'Osto, M., Simó, R., Shi, Z., Beddows, D. C. S., and Harrison, R. M.: Open Ocean and coastal new particle formation from sulfuric acid and amines around the Antarctic peninsula, Nat. Geosci., 14, 383–388, https://doi.org/10.1038/s41561-021-00751-y, 2021.
Cavalieri, D. J., Parkinson, C. L., Gloersen, P., Comiso, J. C., and Zwally, H. J.: Deriving long-term time series of sea ice cover from satellite passive-microwave multisensor data sets, J. Geophys. Res., 104, 15803–15814, https://doi.org/10.1029/1999JC900081, 1999.
Carslaw, D. C. and Ropkins, K.: openair – An R package for air quality data analysis, Environ. Model. Softw., 27/28, 52–61, https://doi.org/10.1016/j.envsoft.2011.09.008, 2012.
Carslaw, K. S., Lee, L. A., Reddington, C. L., Pringle, K. J., Rap, A., Forster, P. M., Mann, G. W., Spracklen, D. V., Woodhouse, M. T., Regayre, L. A., and Pierce, J. R.: Large contribution of natural aerosols to uncertainty in indirect forcing, Nature, 503, 67–71, https://doi.org/10.1038/nature12674, 2013.
Charlson, R., Lovelock, J., Andreae, M. O., and Warren, S. G.: Oceanic phytoplankton, atmospheric sulphur, cloud albedo and climate, Nature 326, 655–661, https://doi.org/10.1038/326655a0, 1987.
Convey, P., Chown, S. L., Clarke, A., Barnes, D. K. A., Cummings, V., Ducklow, H., Frati, F., Green, T. G. A., Gordon, S., Griffiths, H., Howard-Williams, C., Huiskes, A. H. L., Laybourn-Parry, J., Lyons, B., McMinn, A., Peck, L. S., Quesada, A., Schiaparelli, S., and Wall, D.: The spatial structure of Antarctic biodiversity, Ecol. Monogr., 84, 203–244, 2014.
Dall'Osto, M., Ovadnevaite, J., Paglione, M., Beddows, D. C. S., Ceburnis, D., Cree, C., Cortés, P., Zamanillo, M., Nunes, S. O., Pérez, G. L., Ortega-Retuerta, E., Emelianov, M., Vaqué, D., Marrasé, C., Estrada, M., Montserrat Sala, M., Vidal, M., Fitzsimons, M. F., Beale, R., Airs, R., Rinaldi, M., Decesari, S., Facchini, M. C., Harrison, R. M., O'Dowd, C., and Simó, R.: Antarctic sea ice region as a source of biogenic organic nitrogen in aerosols, Sci. Rep., 7 6047, https://doi.org/10.1038/s41598-017-06188-x, 2017.
Dall'Osto, M., Airs, R. L., Beale, R., Cree, C., Fitzsimons, M. F., Beddows, D., Harrison, R. M., Ceburnis, D., O'Dowd, C., Rinaldi, M., Paglione, M., Nenes, A., Decesari, S., and Simó, R.: Simultaneous detection of alkylamines in the surface ocean and atmosphere of the Antarctic sympagic environment, ACS Earth Space Chem., 3, 854–862, 2019.
Dall'Osto, M., Vaqué, D., Sotomayor-Garcia, A., Cabrera-Brufau, M., Estrada, M., Buchaca, T., Soler, M., Nunes, S., Zeppenfeld, S., van Pinxteren, M., Herrmann, H., Wex, H., Rinaldi, M., Paglione, M., Beddows, D. C. S., Harrison, R. M., and Berdalet, E.: Sea ice microbiota in the Antarctic Peninsula modulates cloud-relevant sea spray aerosol production, Front. Mar. Sci., 9, 827061, https://doi.org/10.3389/fmars.2022.827061, 2022a.
Dall'Osto, M., Sotomayor-Garcia, A., Cabrera-Brufau, M., Berdalet, E., Vaqué, D., Zeppenfeld, S., van Pinxteren, M., Herrmann, H., Wex, H., Rinaldi, M., Paglione, M., Beddows, D., Harrison, R., Avila, C., Martin-Martin, R. P., Park, J., and Barbosa, A.: Leaching material from Antarctic seaweeds and penguin guano affects cloud-relevant aerosol production, Sci. Total Environ., 831, 154772, https://doi.org/10.1016/j.scitotenv.2022.154772, 2022b.
Decesari, S., Facchini, M. C., Fuzzi, S., and Tagliavini, E.: Characterization of water-soluble organic compounds in atmospheric aerosol: a new approach, J. Geophys. Res., 105, 1481–1489, 2000.
Decesari, S., Mircea, M., Cavalli, F., Fuzzi, S., Moretti, F., Tagliavini, E., and Facchini, M. C.: Source attribution of water-soluble organic aerosol by Nuclear Magnetic Resonance spectroscopy, Environ. Sci. Technol, 41, 2479–2484, 2007.
Decesari, S., Finessi, E., Rinaldi, M., Paglione, M., Fuzzi, S., Stephanou, E. G., Tziaras, T., Spyros, A., Ceburnis, D., O'Dowd, C., Dall'Osto, M., Harrison, R. M., Allan, J., Coe, H., and Facchini, M. C.: Primary and secondary marine organic aerosols over the North Atlantic Ocean during the MAP experiment, J. Geophys. Res., 116, D22210, https://doi.org/10.1029/2011JD016204, 2011.
Decesari, S., Paglione, M., Rinaldi, M., Dall'Osto, M., Simó, R., Zanca, N., Volpi, F., Facchini, M. C., Hoffmann, T., Götz, S., Kampf, C. J., O'Dowd, C., Ceburnis, D., Ovadnevaite, J., and Tagliavini, E.: Shipborne measurements of Antarctic submicron organic aerosols: an NMR perspective linking multiple sources and bioregions, Atmos. Chem. Phys., 20, 4193–4207, https://doi.org/10.5194/acp-20-4193-2020, 2020.
Draxler, R. R. and Hess, G. D.: An Overview of the HYSPLIT_4Modeling System of Trajectories, Dispersion, and Deposition, Aust. Meteorol. Mag., 47, 295–308, 1998.
Stein, A. F., Draxler, R. R., Rolph, G. D., Stunder, B. J. B., Cohen, M. D., and Ngan, F.: NOAA's HYSPLIT Atmospheric Transport and Dispersion Modeling System, Bull. Am. Meteorol. Soc., 96, 2059–2077, https://doi.org/10.1175/BAMS-D-14-00110.1, 2015.
Facchini, M. C., Decesari, S., Rinaldi, M., Carbone, C., Finessi, E., Mircea, M., Fuzzi, S., Moretti, F., Tagliavini, E., Ceburnis, D., and O'Dowd, C. D.: Important Source of Marine Secondary Organic Aerosol from Biogenic Amines, Environ. Sci. Technol., 42, 9116–9121, 2008a.
Facchini, M. C., Rinaldi, M., Decesari, S., Carbone, C., Finessi, E., Mircea, M., Fuzzi, S., Ceburnis, D., Flanagan, R., Nilsson, E. D., de Leeuw, G., Martino, M., Woeltjen, J., and O'Dowd, C. D.: Primary submicron marine aerosol dominated by insoluble organic colloids and aggregates, Geophys. Res. Lett., 35, L17814, https://doi.org/10.1029/2008GL034210, 2008b.
Finessi, E., Decesari, S., Paglione, M., Giulianelli, L., Carbone, C., Gilardoni, S., Fuzzi, S., Saarikoski, S., Raatikainen, T., Hillamo, R., Allan, J., Mentel, Th. F., Tiitta, P., Laaksonen, A., Petäjä, T., Kulmala, M., Worsnop, D. R., and Facchini, M. C.: Determinationof the biogenic secondary organic aersol fraction in the boreal forest by NMR spectroscopy, Atmos. Chem. Phys., 12, 941–959, https://doi.org/10.5194/acp-12-941-2012, 2012.
Fossum, K. N., Ovadnevaite, J., Ceburnis, D., Dall'Osto, M., Marullo, S., Bellacicco, M., Simó, R., Liu, D., Flynn, M., Zuend, A., and O'Dowd, C.: Summertime Primary and Secondary Contributions to Southern Ocean Cloud Condensation Nuclei, Sci. Rep.-UK, 8, 13844, https://doi.org/10.1038/s41598-018-32047-4, 2018.
Frey, M. M., Norris, S. J., Brooks, I. M., Anderson, P. S., Nishimura, K., Yang, X., Jones, A. E., Nerentorp Mastromonaco, M. G., Jones, D. H., and Wolff, E. W.: First direct observation of sea salt aerosol production from blowing snow above sea ice, Atmos. Chem. Phys., 20, 2549–2578, https://doi.org/10.5194/acp-20-2549-2020, 2020.
Giordano, M. R., Kalnajs, L. E., Goetz, J. D., Avery, A. M., Katz, E., May, N. W., Leemon, A., Mattson, C., Pratt, K. A., and DeCarlo, P. F.: The importance of blowing snow to halogen-containing aerosol in coastal Antarctica: influence of source region versus wind speed, Atmos. Chem. Phys., 18, 16689–16711, https://doi.org/10.5194/acp-18-16689-2018, 2018.
Hamilton, D. S.: Natural aerosols and climate: Understanding the unpolluted atmosphere to better understand the impacts of pollution, Weather, 70, 264–268, https://doi.org/10.1002/wea.2540, 2015.
Humphries, R. S., Keywood, M. D., Gribben, S., McRobert, I. M., Ward, J. P., Selleck, P., Taylor, S., Harnwell, J., Flynn, C., Kulkarni, G. R., Mace, G. G., Protat, A., Alexander, S. P., and McFarquhar, G.: Southern Ocean latitudinal gradients of cloud condensation nuclei, Atmos. Chem. Phys., 21, 12757–12782, https://doi.org/10.5194/acp-21-12757-2021, 2021.
Jaumot, J., Gargallo, R. de Juan, A., and Romà Tauler, R.: A graphical user-friendly interface for mcr-als: a new tool for multivariate curve resolution in matlab. Chemometrics and Intelligent Laboratory Systems, 76, 101–110, https://doi.org/10.1016/j.chemolab.2004.12.007, 2005.
Jones, A. E., Wolff, E. W., Salmon, R. A., Bauguitte, S. J.-B., Roscoe, H. K., Anderson, P. S., Ames, D., Clemitshaw, K. C., Fleming, Z. L., Bloss, W. J., Heard, D. E., Lee, J. D., Read, K. A., Hamer, P., Shallcross, D. E., Jackson, A. V., Walker, S. L., Lewis, A. C., Mills, G. P., Plane, J. M. C., Saiz-Lopez, A., Sturges, W. T., and Worton, D. R.: Chemistry of the Antarctic Boundary Layer and the Interface with Snow: an overview of the CHABLIS campaign, Atmos. Chem. Phys., 8, 3789–3803, https://doi.org/10.5194/acp-8-3789-2008, 2008.
Jung, J., Hong, S.-B., Chen, M., Hur, J., Jiao, L., Lee, Y., Park, K., Hahm, D., Choi, J.-O., Yang, E. J., Park, J., Kim, T.-W., and Lee, S.: Characteristics of methanesulfonic acid, non-sea salt sulfate and organic carbon aerosols over the Amundsen Sea, Antarctica, Atmos. Chem. Phys., 20, 5405–5424, https://doi.org/10.5194/acp-20-5405-2020, 2020.
Kyrö, E.-M., Kerminen, V.-M., Virkkula, A., Dal Maso, M., Parshintsev, J., Ruíz-Jimenez, J., Forsström, L., Manninen, H. E., Riekkola, M.-L., Heinonen, P., and Kulmala, M.: Antarctic new particle formation from continental biogenic precursors, Atmos. Chem. Phys., 13, 3527–3546, https://doi.org/10.5194/acp-13-3527-2013, 2013.
Lachlan-Cope, T., Beddows, D. C. S., Brough, N., Jones, A. E., Harrison, R. M., Lupi, A., Yoon, Y. J., Virkkula, A., and Dall'Osto, M.: On the annual variability of Antarctic aerosol size distributions at Halley Research Station, Atmos. Chem. Phys., 20, 4461–4476, https://doi.org/10.5194/acp-20-4461-2020, 2020.
Legrand, M. and Pasteur, E. C.: Methane sulfonic acid to non-sea-salt surfate ratio in coastal Antarctic aerosol and surface snow, J. Geophys. Res., VOL. 103, 10991–11006, 1998.
Legrand, M., Preunkert, S., Wolff, E., Weller, R., Jourdain, B., and Wagenbach, D.: Year-round records of bulk and size-segregated aerosol composition in central Antarctica (Concordia site) – Part 1: Fractionation of sea salt particles, Atmos. Chem. Phys., 17, 14039–14054, https://doi.org/10.5194/acp-17-14039-2017, 2017a.
Legrand, M., Preunkert, S., Weller, R., Zipf, L., Elsässer, C., Merchel, S., Rugel, G., and Wagenbach, D.: Year-round record of bulk and size-segregated aerosol composition in central Antarctica (Concordia site) – Part 2: Biogenic sulfur (sulfate and methanesulfonate) aerosol, Atmos. Chem. Phys., 17, 14055–14073, https://doi.org/10.5194/acp-17-14055-2017, 2017b.
Liu, J., Dedrick, J., Russell, L. M., Senum, G. I., Uin, J., Kuang, C., Springston, S. R., Leaitch, W. R., Aiken, A. C., and Lubin, D.: High summertime aerosol organic functional group concentrationsfrom marine and seabird sources at Ross Island, Antarctica, during AWARE, Atmos. Chem. Phys., 18, 8571–8587, https://doi.org/10.5194/acp-18-8571-2018, 2018.
Miyazaki, Y., Sawano, M., and Kawamura, K.: Low-molecular-weight hydroxyacids in marine atmospheric aerosol: evidence of a marine microbial origin, Biogeosciences, 11, 4407–4414, https://doi.org/10.5194/bg-11-4407-2014, 2014.
Moretti, F., Tagliavini, E., Decesari, S., Facchini, M. C., Rinaldi, M., and Fuzzi, S.: NMR Determination of Total Carbonyls and Carboxyls: A tool for tracing the evolution of atmospheric oxidized organic aerosols, Environ. Sci. Technol., 42, 4844–4849, https://doi.org/10.1021/es703166v, 2008.
Paatero, P.: The Multilinear Engine: A Table-Driven, Least Squares Program for Solving Multilinear Problems, including the n-Way Parallel Factor Analysis Model, J. Comp. Graph. Stat., 8, 854–888, 1999.
Paatero, P. and Tapper, U.: Positive matrix factorization: A non-negative factor model with optimal utilization of error estimates of data values, Environmetrics, 5, 111–126, https://doi.org/10.1002/env.3170050203, 1994.
Paglione, M.: Simultaneous organic aerosol characterization and source apportionment at two Antarctic sites (Signy and Halley stations) during Antarctic summer 2018–19, Zenodo [data set], https://doi.org/10.5281/zenodo.10663787, 2024.
Paglione, M., Kiendler-Scharr, A., Mensah, A. A., Finessi, E., Giulianelli, L., Sandrini, S., Facchini, M. C., Fuzzi, S., Schlag, P., Piazzalunga, A., Tagliavini, E., Henzing, J. S., and Decesari, S.: Identification of humic-like substances (HULIS) in oxygenated organic aerosols using NMR and AMS factor analyses and liquid chromatographic techniques, Atmos. Chem. Phys., 14, 25–45, https://doi.org/10.5194/acp-14-25-2014, 2014a.
Paglione, M., Saarikoski, S., Carbone, S., Hillamo, R., Facchini, M. C., Finessi, E., Giulianelli, L., Carbone, C., Fuzzi, S., Moretti, F., Tagliavini, E., Swietlicki, E., Eriksson Stenström, K., Prévôt, A. S. H., Massoli, P., Canaragatna, M., Worsnop, D., and Decesari, S.: Primary and secondary biomass burning aerosols determined by proton nuclear magnetic resonance (1H-NMR) spectroscopy during the 2008 EUCAARI campaign in the Po Valley (Italy), Atmos. Chem. Phys., 14, 5089–5110, https://doi.org/10.5194/acp-14-5089-2014, 2014b.
Quinn, P. K. and Bates, T. S.: The case against climate regulation via oceanic phytoplankton sulphur emissions, Nature, 480, 51–56, https://doi.org/10.1038/nature10580, 2011.
Rankin, A. M. and Wolff, E. W.: A year-long record of size segregated aerosol composition at Halley, Antarctica, J. Geophys. Res., 108, 4775, https://doi.org/10.1029/2003JD003993, 2003.
Rinaldi, M., Paglione, M., Decesari, S., Harrison, R. M., Beddows, D. C., Ovadnevaite, J., Ceburnis, D., O'Dowd, C. D., Simó, R., and Dall'Osto, M.: Contribution of Water-Soluble Organic Matter from Multiple Marine Geographic Eco-Regions to Aerosols around Antarctica, Environ. Sci. Technol., 54, 7807–7817, https://doi.org/10.1021/acs.est.0c00695, 2020.
Rintoul, S. R., Chown, S. L., DeConto, R. M., England, M. H., Fricker, H. A., Masson-Delmotte, V., Naish, T. R., Siegert, M. J., and Xavier, J. C.: Choosing the future of Antarctica, Nature, 558, 233–241, 2018.
Saiz-Lopez, A., Mahajan, A. S., Salmon, R. A., Bauguitte, S. J.-B., Jones, A. E., Roscoe, H. K., and Plane, J. M. C.: Boundary layer halogens in coastal Antarctica, Science, 317, 348–351, https://doi.org/10.1126/science.1141408, 2007.
Saliba, G., Sanchez, K. J., Russell, L. M., Twohy, C. H., Roberts, G. C., Lewis, S., Dedrick, J., McCluskey, C. S., Moore, K., DeMott, P. J., and Toohey, D. W.: Organic composition of three different size ranges of aerosol particles over the Southern Ocean, Aerosol Sci. Technol., 55, 268–288, https://doi.org/10.1080/02786826.2020.1845296, 2021.
Sanchez, K. J., Roberts, G. C., Saliba, G., Russell, L. M., Twohy, C., Reeves, J. M., Humphries, R. S., Keywood, M. D., Ward, J. P., and McRobert, I. M.: Measurement report: Cloud processes and the transport of biological emissions affect southern ocean particle and cloud condensation nuclei concentrations, Atmos. Chem. Phys., 21, 3427–3446, https://doi.org/10.5194/acp-21-3427-2021, 2021.
Sandrini, S., van Pinxteren, D., Giulianelli, L., Herrmann, H., Poulain, L., Facchini, M. C., Gilardoni, S., Rinaldi, M., Paglione, M., Turpin, B. J., Pollini, F., Bucci, S., Zanca, N., and Decesari, S.: Size-resolved aerosol composition at an urban and a rural site in the Po Valley in summertime: implications for secondary aerosol formation, Atmos. Chem. Phys., 16, 10879–10897, https://doi.org/10.5194/acp-16-10879-2016, 2016.
Seinfeld, J. H. and Pandis, S. N.: Atmospheric chemistry and physics – from air pollution to climate change, Third edition, John Wiley & Sons, New York, ISBN: 978-1-118-94740-1, 2016.
Tagliavini, E., Moretti, F., Decesari, S., Facchini, M. C., Fuzzi, S., and Maenhaut, W.: Functional group analysis by H NMR/chemical derivatization for the characterization of organic aerosol from the SMOCC field campaign, Atmos. Chem. Phys., 6, 1003–1019, https://doi.org/10.5194/acp-6-1003-2006, 2006.
Tauler, R.: Multivariate Curve Resolution applied to second order data, Chem. Int. Laborat. Syst., 30, 133–146, 1995.
Vallina, S. M., Simó, R., Gassó, S., de Boyer-Montégut, C., del Rio, E., Jurado, E., and Dachs, J.: Analysis of a potential “solar radiation dose–dimethylsulfide–cloud condensation nuclei” link from globally mapped seasonal correlations, Global Biogeochem. Cy., 21, GB2004, https://doi.org/10.1029/2006GB002787, 2007.
Virkkula, A., Teinilä, K., Hillamo, R., Kerminen, V.-M., Saarikoski, S., Aurela, M., Viidanoja, J., Paatero, J., Koponen, I. K., and Kulmala, M.: Chemical composition of boundary layer aerosol over the Atlantic Ocean and at an Antarctic site, Atmos. Chem. Phys., 6, 3407–3421, https://doi.org/10.5194/acp-6-3407-2006, 2006.