the Creative Commons Attribution 4.0 License.
the Creative Commons Attribution 4.0 License.
 | 28 May 2024
Interannual variability of summertime formaldehyde (HCHO) vertical column density and its main drivers at northern high latitudes
Tianlang Zhao
Zolal Ayazpour
Gonzalo González Abad
Caroline R. Nowlan
Yiqi Zheng
The northern high latitudes (50–90° N, mostly including boreal-forest and tundra ecosystems) have been undergoing rapid climate and ecological changes over recent decades, leading to significant variations in volatile organic compounds (VOC) emissions from biogenic and biomass burning sources. Formaldehyde (HCHO) is an indicator of VOC emissions, but the interannual variability of HCHO and its main drivers over the region remains unclear. In this study, we use the GEOS-Chem chemical transport model and satellite retrievals from the Ozone Monitoring Instrument (OMI) and the Ozone Mapping and Profiler Suite (OMPS) to examine the interannual variability of HCHO vertical column density (VCD) during the summer seasons spanning from 2005 to 2019. Our results show that, in 2005–2019 summers, wildfires contributed 75 %–90 % of the interannual variability of HCHO VCD over Siberia, Alaska and northern Canada, while biogenic emissions and background methane oxidation account for ∼ 90 % of HCHO interannual variability over eastern Europe. We find that monthly solar-induced chlorophyll fluorescence (SIF) from the Orbiting Carbon Observatory-2 (OCO-2), an efficient proxy for plant photosynthesis, shows a good linear relationship (R= 0.6–0.7) with the modeled biogenic HCHO column (dVCDBio,GC) in eastern Europe, Siberia, Alaska and northern Canada, indicating the coupling between SIF and biogenic VOC emissions over the four domains on a monthly scale. In Alaska, Siberia and northern Canada, SIF and dVCDBio,GC both show relatively lower interannual variabilities (SIF: CV = 1 %–9 %, dVCDBio,GC: CV = 1 %–2 %; note that CV stands for coefficient of variation) in comparison to wildfire-induced HCHO (CV = 8 %–13 %), suggesting that the high interannual variabilities of OMI HCHO VCD (CV = 10 %–16 %) in these domains are likely driven by wildfires instead of biogenic emissions.
- Article
(3083 KB) - Full-text XML
-
Supplement
(1125 KB) - BibTeX
- EndNote


Volatile organic compounds (VOCs) are the main precursors of tropospheric ozone and secondary organic aerosols, strongly impacting air quality and climate (Atkinson, 2000; Kroll and Seinfeld, 2008; Mao et al., 2018; Zheng et al., 2020). Formaldehyde (HCHO) is mainly produced from atmospheric VOC oxidation with a short photochemical lifetime on the order of hours, serving as an indicator of non-methane VOC (NMVOC) emissions and photochemical processes (Fu et al., 2007; Millet et al., 2008). Understanding the interannual variability of HCHO is important for quantifying long-term trends of VOC emissions in response to climate changes and air quality control implementations.
Several studies suggest that biogenic VOC emissions are largely responsible for interannual variabilities of HCHO on a global scale (Palmer et al., 2001; De Smedt et al., 2008; González Abad et al., 2015; De Smedt et al., 2018). Stavrakou et al. (2009) consider biogenic VOC (BVOC) emissions to be the predominant source of global HCHO columns, in which isoprene alone contributes to 30 % of global HCHO. Isoprene emissions were also found to be the major driver of HCHO interannual variability (Bauwens et al., 2016; Stavrakou et al., 2018; Morfopoulos et al., 2022). During wildfire seasons, pyrogenic emission is the secondary important controlling factor of HCHO over the whole Amazon (Zhang et al., 2019) and contributes to 50 %–72 % of the HCHO total column in Alaskan summer fire seasons (Zhao et al., 2022). Over the Antarctic region, HCHO is produced mainly from methane oxidation with hydroxyl radicals (OHs), with possible unknown HCHO sources and long-range transport (Riedel et al., 1999). The interannual variability of HCHO over this region is still unclear.
Northern high latitudes have been experiencing rapid Arctic warming in recent decades, resulting in strong increases in BVOC emissions (Lappalainen et al., 2009; Vedel-Petersen et al., 2015; Kramshøj et al., 2016; Seco et al., 2022). Several studies suggest monoterpenes to be the most abundant BVOC species in boreal forests over middle and northern Europe and southeastern Siberia (Spirig et al., 2004; Timkovsky et al., 2010; Bäck et al., 2012; Rantala et al., 2015; Juráň et al., 2017; Zhou et al., 2017). This BVOC speciation appears to be different in the boreal forests in Alaska, northern Canada and eastern Siberia, where isoprene appears to be the most abundant BVOC species (Blake et al., 1992; Timkovsky et al., 2010; Zhao et al., 2022). BVOC measurements in tundra systems show a very strong positive temperature dependence for isoprene fluxes over Greenland (Vedel-Petersen et al., 2015; Kramshøj et al., 2016; Lindwall et al., 2016a), northern Sweden (Faubert et al., 2010; Tang et al., 2016) and the Alaska North Slope (Potosnak et al., 2013; Angot et al., 2020; Selimovic et al., 2022).
Wildfire is another important source of HCHO (Permar et al., 2021). A number of studies have shown positive trends and strong interannual variabilities of wildfires over Arctic regions in the past few decades (Kelly et al., 2013; Giglio et al., 2013; Descals et al., 2022). Several modeling studies suggest that wildfires can become the main source of HCHO over Alaska (Zhao et al., 2022), Siberia and Canada (Stavrakou et al., 2018). In fact, the contribution from wildfires could be even larger as models tend to underestimate the secondary production of HCHO from other VOC precursors (Alvarado et al., 2020; Zhao et al., 2022; Jin et al., 2023). To what extent wildfires contribute to HCHO interannual variability remains unclear.
Solar-induced fluorescence (SIF) could potentially provide additional constraints on the biogenic-related HCHO column over northern high latitudes due to their similar dependence on temperature and light availability (Foster et al., 2014; Zheng et al., 2015). SIF is the re-emission of light by plants as a result of absorbing solar radiation during photosynthesis and is widely used to estimate vegetation productivity and health (Porcar-Castell et al., 2014; Magney et al., 2019). Isotopic labeling studies show that 70 %–90 % of isoprene production is from chloroplasts, directly linked to photosynthesis (Delwiche and Sharkey, 1993; Karl et al., 2002; Affek and Yakir, 2003). As SIF is directly linked to flux-derived gross primary productivity (GPP) and because HCHO can be largely explained by isoprene emissions (Zheng et al., 2017), we expect to use SIF as a valuable tool to constrain biogenic emissions from boreal forests at northern high latitudes.
The new retrievals of HCHO from the Ozone Monitoring Instrument (OMI) and the Ozone Mapping and Profiler Suite (OMPS) provide a continuous long-term record on a global scale, with improved calibration, updates in spectral fitting and air mass factor calculations (González Abad et al., 2022; Nowlan et al., 2023). Here, we use the newly retrieved HCHO vertical column density (VCD) products from OMI and OMPS, combined with the GEOS-Chem chemical transport model, to examine summertime HCHO spatiotemporal variability over northern high latitudes from 2005 to 2019. The satellites and the model are introduced in Sect. 2. In Sect. 3, we evaluate the spatial variability of HCHO VCD using satellite retrievals, and we evaluate BVOC emissions with previous in situ measurements. In Sect. 4, we evaluate the interannual variability of HCHO VCD using satellite retrievals, and we present model sensitivity tests to demonstrate how background HCHO, wildfire and biogenic VOC emissions influence HCHO interannual variability across Alaska, Siberia, northern Canada and eastern Europe. In Sect. 5, we evaluate biogenic HCHO interannual variability using satellite SIF data. A summary and discussion are in Sect. 6.
2.1 Observational data sets
We use satellite observations of tropospheric HCHO columns from OMI and OMPS to evaluate summertime HCHO variability at northern high latitudes. OMI is a UV–Vis backscatter spectrometer on board the Aura satellite launched in July 2004, with global daily coverage at an overpass time of 13:30 LT. OMI provides a long-term record of HCHO VCD but was discontinued in 2023. OMPS is the continuation of OMI HCHO measurements over polar regions. OMPS is a spectrometer on board two satellites: NASA/NOAA SUOMI NPP (hereafter SNPP) and NOAA-20, which were launched in October 2011 and November 2017, respectively. Compared to OMI, OMPS-SNPP has a relatively lower nadir spatial resolution (OMI: 13 × 24 km2, OMPS-SNPP: 50 × 50 km2) (de Graaf et al., 2016; Levelt et al., 2006) but has an improved signal-to-noise ratio (González Abad et al., 2016). OMI and OMPS HCHO products share a similar concept and retrieval approach; thus, the joint evaluation by the two satellites can examine the consistency between OMI and OMPS and, more importantly, provide the capability to study HCHO interannual variability on a decadal timescale. Here, we use monthly mean HCHO VCD from the OMI HCHO VCD retrieval (OMHCHO version 4) product (González Abad et al., 2022) during the 2005–2019 summertime and the OMPS-SNPP Level-2 HCHO total column V1 product (Nowlan et al., 2023) during the 2012–2019 summertime, provided by the Smithsonian Astrophysical Observatory.
The OMI and OMPS HCHO retrievals use a three-step procedure to calculate the HCHO VCD (Nowlan et al., 2023). First, the slant column density (SCD) is determined through spectral fitting of a backscattered radiance spectrum collected in the wavelength region of 328.5 to 356.5 nm. This fit uses a daily reference spectrum (one for each cross-track position) determined from radiances collected over a relatively clean area of the Pacific between latitudes 30° S and 30° N. The area used for this reference calculation is referred to as the reference sector. Second, scene-by-scene radiative transfer calculations are performed to determine vertically resolved scattering weights, which can be used to determine the air mass factor (AMF) in combination with the trace gas profile (Palmer et al., 2001). This AMF describes the path of light and is used for converting the SCD to a VCD (VCD = SCD/AMF). Third, the background reference slant column (SCDR) in the radiance sector region is determined using a model to correct the retrieved SCD which is, in fact, the differential SCD determined from the ratio of the observed radiance and the reference radiance. A further bias correction (SCDB) is applied to reduce high-latitude biases, which mostly affect OMPS-SNPP (Nowlan et al., 2023).
To compare with modeled results, OMI and OMPS-SNPP HCHO retrievals are reprocessed following a three-step procedure. This is primarily done to replace the climatology used in the OMI and OMPS-SNPP products with our own GEOS-Chem simulations. First, we remove the data points fulfilling the following criteria: (1) main quality flag > 0, (2) cloud cover fraction ≥ 40 %, (3) solar zenith angle (SZA) ≥ 70°, and (4) ice or snow flag = 1. After filtering, we regrid the level-2 swath data in the local time window of 12:00–15:00 LT to 0.5° × 0.625° horizontal resolution. Second, we calculate the air mass factor (AMFGC) based on the local GEOS-Chem HCHO vertical profile and satellite scattering weight (Palmer et al., 2001). Third, we calculate the slant column density of HCHO in the reference sector (SCDR,SAT) using the modeled HCHO reference sector column and the satellite air mass factor over the same location (VCDR,GC and AMFR,SAT) (De Smedt et al., 2018; Zhu et al., 2016):
VCDR,GC is calculated by a global monthly climatology of hourly HCHO profiles at the time of overpass based on a 2018 GEOS-Chem high-performance (GCHP) run at 0.5° × 0.5° resolution (Bindle et al., 2021; Eastham et al., 2018). AMFR,SAT is the AMF from the satellite product, which is calculated using the VLIDORT radiative transfer model as described in Nowlan et al. (2023). We rearrange the satellite vertical column as follows:
Here ΔSCDSAT is the fitted HCHO slant column, and SCDB,SAT is the bias correction term for unexplained background patterns in the HCHO retrievals, which may be due to instrument or retrieval issues (Nowlan et al., 2023). The single-scene precision of the retrieval is 1 × 10¹⁶ molec. cm−2 (absolute) for OMI and 3.5 × 10¹⁵ molec. cm−2 for OMPS-SNPP from spectral fitting and 45 %–105 % (relative) from the AMF (González Abad et al., 2015; Nowlan et al., 2023). The spectral fitting error is primarily random in individual measurements, while the AMF error has both random and systematic components. The precision can be improved by spatial and temporal averaging (De Smedt et al., 2008; Zhu et al., 2016; Boeke et al., 2011). Our analyses in this work are based on monthly data; thus, the absolute uncertainty in the HCHO column is reduced to < 1 × 10¹⁵ molec. cm−2 (De Smedt et al., 2018).
We utilize high-resolution SIF estimates derived from OCO-2 and MODIS (https://doi.org/10.3334/ORNLDAAC/1863, Yu et al., 2021). These data sets provided globally contiguous daily SIF estimates at a spatial resolution of approximately 0.05° × 0.05° (around 5 km at the Equator) and a temporal resolution of 16 d for the period of September 2014 to July 2020. The data set was estimated using an artificial neural network (ANN) trained on the native OCO-2 SIF observations and MODIS BRDF-corrected seven-band surface reflectance along orbits of OCO-2. The ANN model was subsequently used to predict daily mean SIF (mW m−2 nm−1 sr−1) in the gap regions based on MODIS reflectance and land cover. In our study, the OCO-2 SIF estimates are monthly averaged and regridded to 0.1° × 0.1° spatial resolution for the comparison with OMI HCHO VCD and are regridded to 2° × 2.5° spatial resolution when comparing with GEOS-Chem results.
2.2 Global GEOS-Chem simulations
GEOS-Chem, a 3-D global chemical transport model, is used in this study to examine the spatiotemporal variability of HCHO and VOCs across northern high latitudes. The model is driven by the Modern-Era Retrospective analysis for Research and Applications version 2 (MERRA-2), provided by the Global Modeling and Assimilation Office (GMAO) at NASA's Goddard Space Flight Center (Rienecker et al., 2011). GEOS-Chem version 12.7.2 is deployed (https://doi.org/10.5281/zenodo.3701669, The International GEOS-Chem Community, 2020) with an update on cloud chemistry (https://github.com/geoschem/geos-chem/issues/906, last access: 10 August 2022). The simulations encompass 15 summers (1 May to 31 August) from 2005 to 2019 at a horizontal resolution of 2° × 2.5° and 72 vertical layers from the surface to 0.01 hPa. For all model runs, we use a standard restart file from the GEOS-Chem 1-year benchmark simulation, followed by an additional spinup period of several days to allow adequate representation of HCHO production and loss in the model.
Biomass burning emissions in our simulation are derived from the Global Fire Emission Database (GFED4.1s) inventory (van der Werf et al., 2017; Randerson et al., 2017). A year-specific GFED4.1s inventory is used for each year of the simulation to make sure the representation of the interannual variability in wildfire emissions is accurate. Emissions on a 3 h basis are obtained from MODIS satellite observations, which provide information on fire detection and burning area (Mu et al., 2011; van der Werf et al., 2017). The GFED4.1s inventory reports the HCHO emission factors of 1.86 and 2.09 g kg−1 dry matter for boreal-forest and temperate-forest fires (Akagi et al., 2011).
BVOC emissions in the study are calculated online (emission factor maps computed online) using the Model of Emissions of Gases and Aerosols from Nature (MEGAN, v2.1) (Guenther et al., 2006, 2012) as implemented by Hu et al. (2015). Terrestrial vegetation for BVOC emissions is based on the plant functional type (PFT) distribution derived from the Community Land Model (CLM4) (Lawrence et al., 2011; Oleson et al., 2013). Utilizing online MEGAN simplifies the investigation of the relationship between BVOC emission patterns and PFTs. CLM4 output (Fig. S1 in the Supplement) suggests two major PFTs over northern high latitudes: broadleaf deciduous boreal shrubs (mainly over northern and southern Alaska, northern Canada and northern Siberia) and needleleaf evergreen boreal trees (mainly over interior Alaska, northern Canada, south Siberia and the northern part of eastern Europe), both with high emission factors in isoprene and low emission factors in monoterpenes. The southern part of eastern Europe is dominated by croplands and broadleaf deciduous temperate trees. In this work, “monoterpenes” from model calculation are lumped monoterpenes, including α-pinene, β-pinene, sabinene and carene.
We conducted a model sensitivity test to assess the difference in BVOC emissions and HCHO dVCDBio,GC due to online versus offline MEGAN applications. The results of the tests show that the use of online MEGAN has a modest impact on monthly ISOPe and MONOe (25 %–53 % for ISOPe in Alaska, northern Canada and eastern Europe; 53 % for ISOPe in Siberia; 17 %–24 % for MONOe across the four domains) and provides a similar, isoprene-dominated BVOC emission regime over Alaska, central Siberia, northern Canada and eastern Europe in comparison to results from using offline MEGAN. The difference in dVCDBio,GC between using online and offline MEGAN is approximately 13 %–26 %, suggesting a minor impact on dVCDBio,GC and VCDGC variability over northern high latitudes when using online or offline MEGAN.
In this study, we use the detailed O3–NOx–HOx–VOC chemistry (“tropchem” mechanism) (Park et al., 2004; Mao et al., 2010, 2013), incorporating updates on isoprene chemistry (Fisher et al., 2016). The performance of this version of isoprene chemistry in GEOS-Chem has been extensively evaluated using recent field campaigns and satellite observations over the southeastern US (Fisher et al., 2016; Travis et al., 2016), including HCHO production from isoprene oxidation (Zhu et al., 2016, 2020; Kaiser et al., 2018). The ability of GEOS-Chem, with this chemistry, to reproduce the vertical profiles of HCHO observed during the Alaskan summer, as shown in the ATom-1 in situ campaign, has been demonstrated (Zhao et al., 2022). Under high-NOx conditions (1 ppbv), HCHO production is rapid, reaching 70 %–80 % of its maximum yield within a few hours, whereas, under low-NOx conditions (0.1 ppbv or lower), it takes several days to reach the maximum yield, and the cumulative yield is approximately 2–3 times lower than that under high-NOx conditions (Marais et al., 2012).
To examine the influence of different sources on HCHO columns at northern high latitudes, we conducted four GEOS-Chem simulations, as described in Table 1, to separate the modeled HCHO total column (VCDGC) into three parts, namely the background column (VCD0,GC), the biogenic-emission-induced column (dVCDBio,GC) and the wildfire-emission-induced column (dVCDFire,GC):
VCD0,GC is the VCDGC from the GEOS-Chem simulation in which both biogenic and wildfire emissions are turned off. VCD0,GC, dVCDFire,GC and dVCDBio,GC are derived using Eq. (4a) to (4c):
To assess the linearity assumption in Eq. (3), we conducted model sensitivity tests over a 1-month period to evaluate the disparity between VCDGC and VCD dVCD dVCD (derived from Eq. 4a, d and e). The difference between these two terms is less than 14 % at northern high latitudes, suggesting a minor importance of the nonlinear effect in this area.
Table 1Configuration of GEOS-Chem global simulations in this study.
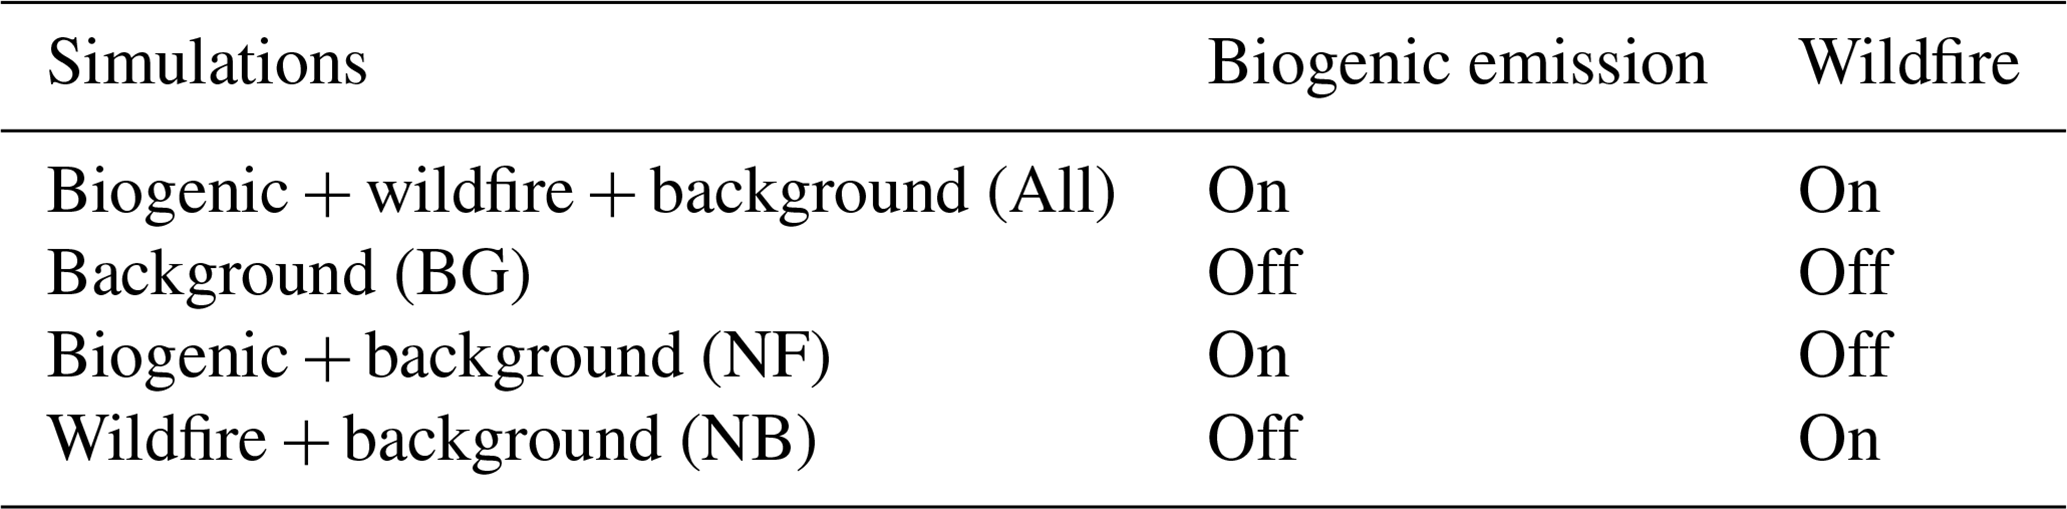
Figure 1a defines the four domains focused on in this work. The selection of the Alaska domain follows Zhao et al. (2022), the selections of the eastern Europe and Siberia domains follow Bauwens et al. (2016), and the selection of the northern Canada domain follows that of the North America domain in Bauwens et al. (2016) but excluding Alaska.
To emphasize the key drivers of HCHO interannual variability, we categorize the years spanning from 2005 to 2019 into two distinct groups, “high-HCHO years” and “low-HCHO years”, within each of the four specified domains. For each domain, the years that have an above-average May–August sum of regionally averaged monthly OMI VCDSAT,reprocessed are categorized as high-HCHO years; those years that have a value that is below average are categorized as low-HCHO years (shown in Table S1).
We use the coefficient of variation (CV) to quantify the interannual variability of summertime HCHO VCD. CV is defined as the ratio of the standard deviation to the mean (CV ), which is a measure of interannual variability (Giglio et al., 2013). Assuming VCD0,GC, dVCDBio,GC and dVCDFire,GC are three independent components of VCDGC, we have ; thus, the contribution of each component to the CV of VCDGC can be calculated by
Figure 1 shows the July mean HCHO VCD over northern high latitudes during 2012–2019 from reprocessed OMI and OMPS-SNPP retrievals, as well as GEOS-Chem model output. We show that OMI and OMPS-SNPP HCHO VCD have consistent spatial patterns and that their magnitudes agree within 15 % (Fig. 1a, b and d). OMPS-SNPP does show lower values in some regions, perhaps due to several cloud and surface reflectance assumptions made in OMPS-SNPP retrievals or biases that may persist at high latitudes and large solar zenith angles (Nowlan et al., 2023). While GEOS-Chem reproduced well the spatial pattern of HCHO VCD that OMI and OMPS-SNPP captured (Fig. 1c), we find that GEOS-Chem HCHO VCD is lower than that of OMI by 40 %, particularly over wildfire-impacted areas (Fig. 1e). The model–satellite discrepancies in wildfire areas can, in part, be due to model underestimates of VOC emissions and HCHO production from wildfire plumes (Jin et al., 2023) and can, in part, be due to the uncertainties in air mass factor calculation for satellite HCHO retrievals in the presence of wildfire smoke (Jung et al., 2019). The model–satellite discrepancies outside wildfire areas could be also due to model underestimates of oxygenated VOCs (OVOCs), biogenic VOC emissions and biases in satellite HCHO retrieval products. For example, Selimovic et al. (2022) found that GEOS-Chem underestimates OVOCs, including HCHO, by a factor of 3–12 at Toolik Field Station in northern Alaska. Stavrakou et al. (2015) show model underestimations of biogenic isoprene emissions and wildfire emissions over eastern Europe and Alaska. Recent studies suggest that TROPOMI HCHO retrievals may have a positive bias under low-HCHO conditions (Vigouroux et al., 2020). OMPS-SNPP HCHO shows a similar positive bias at clean sites but has a closer agreement with FTIR HCHO columns at polluted sites (Nowlan et al., 2023; Kwon et al., 2023).
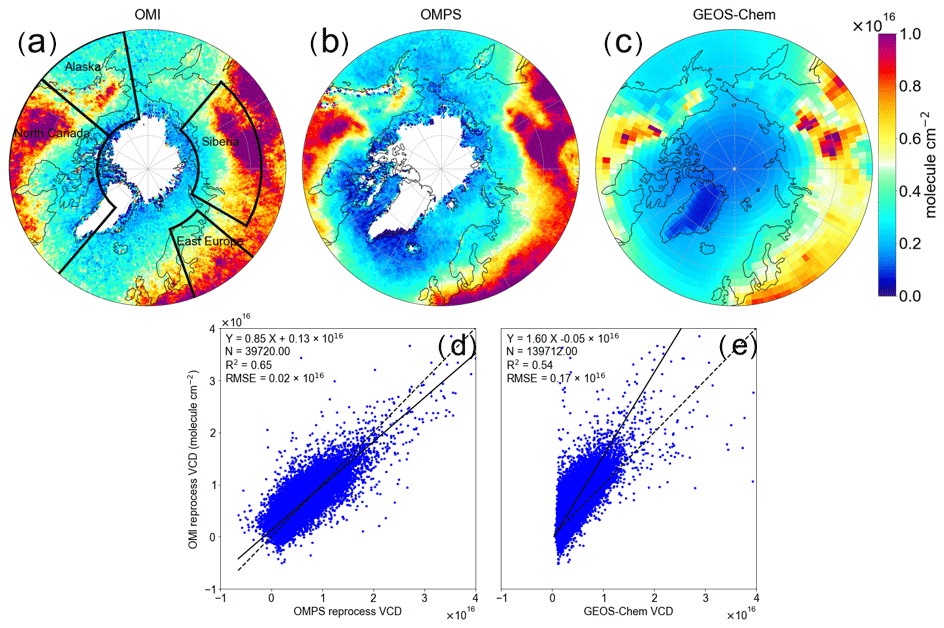
Figure 1HCHO VCD from OMI, OMPS-SNPP and GEOS-Chem, as well as their linear correlation. Panels (a), (b) and (c) show the spatial pattern of the July mean HCHO VCD from reprocessed OMI, reprocessed OMPS-SNPP and GEOS-Chem over northern high latitudes in the 2012–2019 summers. The black boxes in (a) show the four study domains: Alaska ([50,75]° N, [−170, −130]° E), Siberia ([57,75]° N, [60,140]° E), northern Canada ([50,75]° N, [−130, −40]° E) and eastern Europe ([50,71]° N, [20,50]° E). (d) Scatter plot of monthly HCHO VCD from reprocessed OMI versus reprocessed OMPS-SNPP over continental northern high latitudes in the 2012–2019 summers. OMI and OMPS-SNPP data are regridded to 2° × 2.5° horizontal resolution to match up with GEOS-Chem pixels. Panel (e) is similar to (d) but shows OMI versus GEOS-Chem.
We use model sensitivity tests to characterize the spatial variability of HCHO VCDGC,0, dVCDBio,GC and dVCDFire,GC over northern high latitudes. Figure 2 shows a similar spatial pattern of VCD0,GC and dVCDBio,GC, with a distinctive spatial pattern of dVCDFire,GC. The enhancement of VCD0,GC is mainly shown over eastern Europe, eastern Siberia and central Canada, around 2–4 × 10¹⁵ molec. cm−2; dVCDFire,GC exhibits increases mainly over Alaska, northern Canada and central Siberia, with values larger than 5 × 10¹⁵ molec. cm−2 at fire hotspots; dVCDBio,GC spatial pattern corresponds mainly to isoprene emissions over vegetated areas and is enhanced over eastern Europe (2.4 × 10¹⁵ molec. cm−2) and eastern Siberia (1.1 × 10¹⁵ molec. cm−2). The model suggests that eastern Europe is covered by needleleaf evergreen temperate trees and broadleaf deciduous boreal trees, while eastern Siberia is mainly covered by needleleaf evergreen boreal trees (Fig. S1). We note that ΔdVCDISOPe (isoprene emission flux, unit: 1016 molec. cm−2 per 1013 atmosC cm−2 s−1) over northern high latitudes is around 0.24, a factor of 10 lower than ΔVCDGC:ΔISOPe over the southeastern US (Millet et al., 2008). This indicates a much lower HCHO production efficiency from isoprene oxidation at northern high latitudes compared to middle latitudes, possibly resulting from the availability of NOx and the difference in temperature, photolysis and oxidant levels (Marais et al., 2012; Mao et al., 2013; Li et al., 2016; Wolfe et al., 2016).
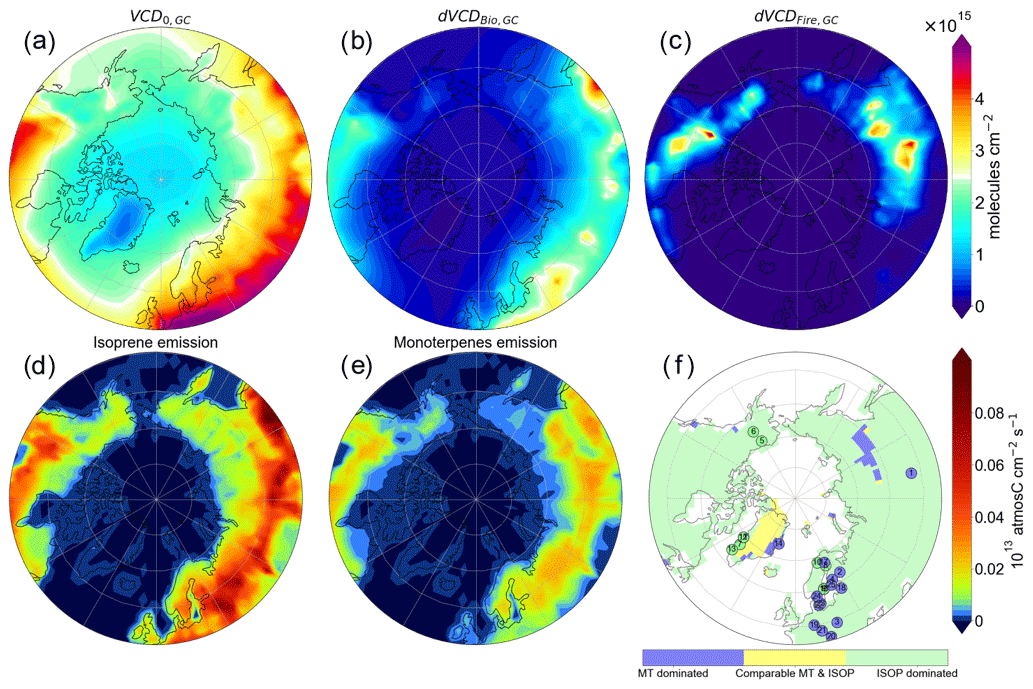
Figure 2Panels (a) to (e) show GEOS-Chem HCHO VCD0,GC, dVCDBio,GC, dVCDFire,GC and isoprene and monoterpene emission fluxes over northern high latitudes, averaged for July from 2005 to 2019. (f) BVOC emission regimes over northern high latitudes in GEOS-Chem simulation for 2005–2019 summers and from in situ measurements (references listed in Table 2). Isoprene-dominated regime in a pixel means isoprene emission is significantly higher than monoterpene emission (p<0.05 in t test) for May–August in 2005–2019.
Table 2In situ measurements of BVOC in Fig. 2f.
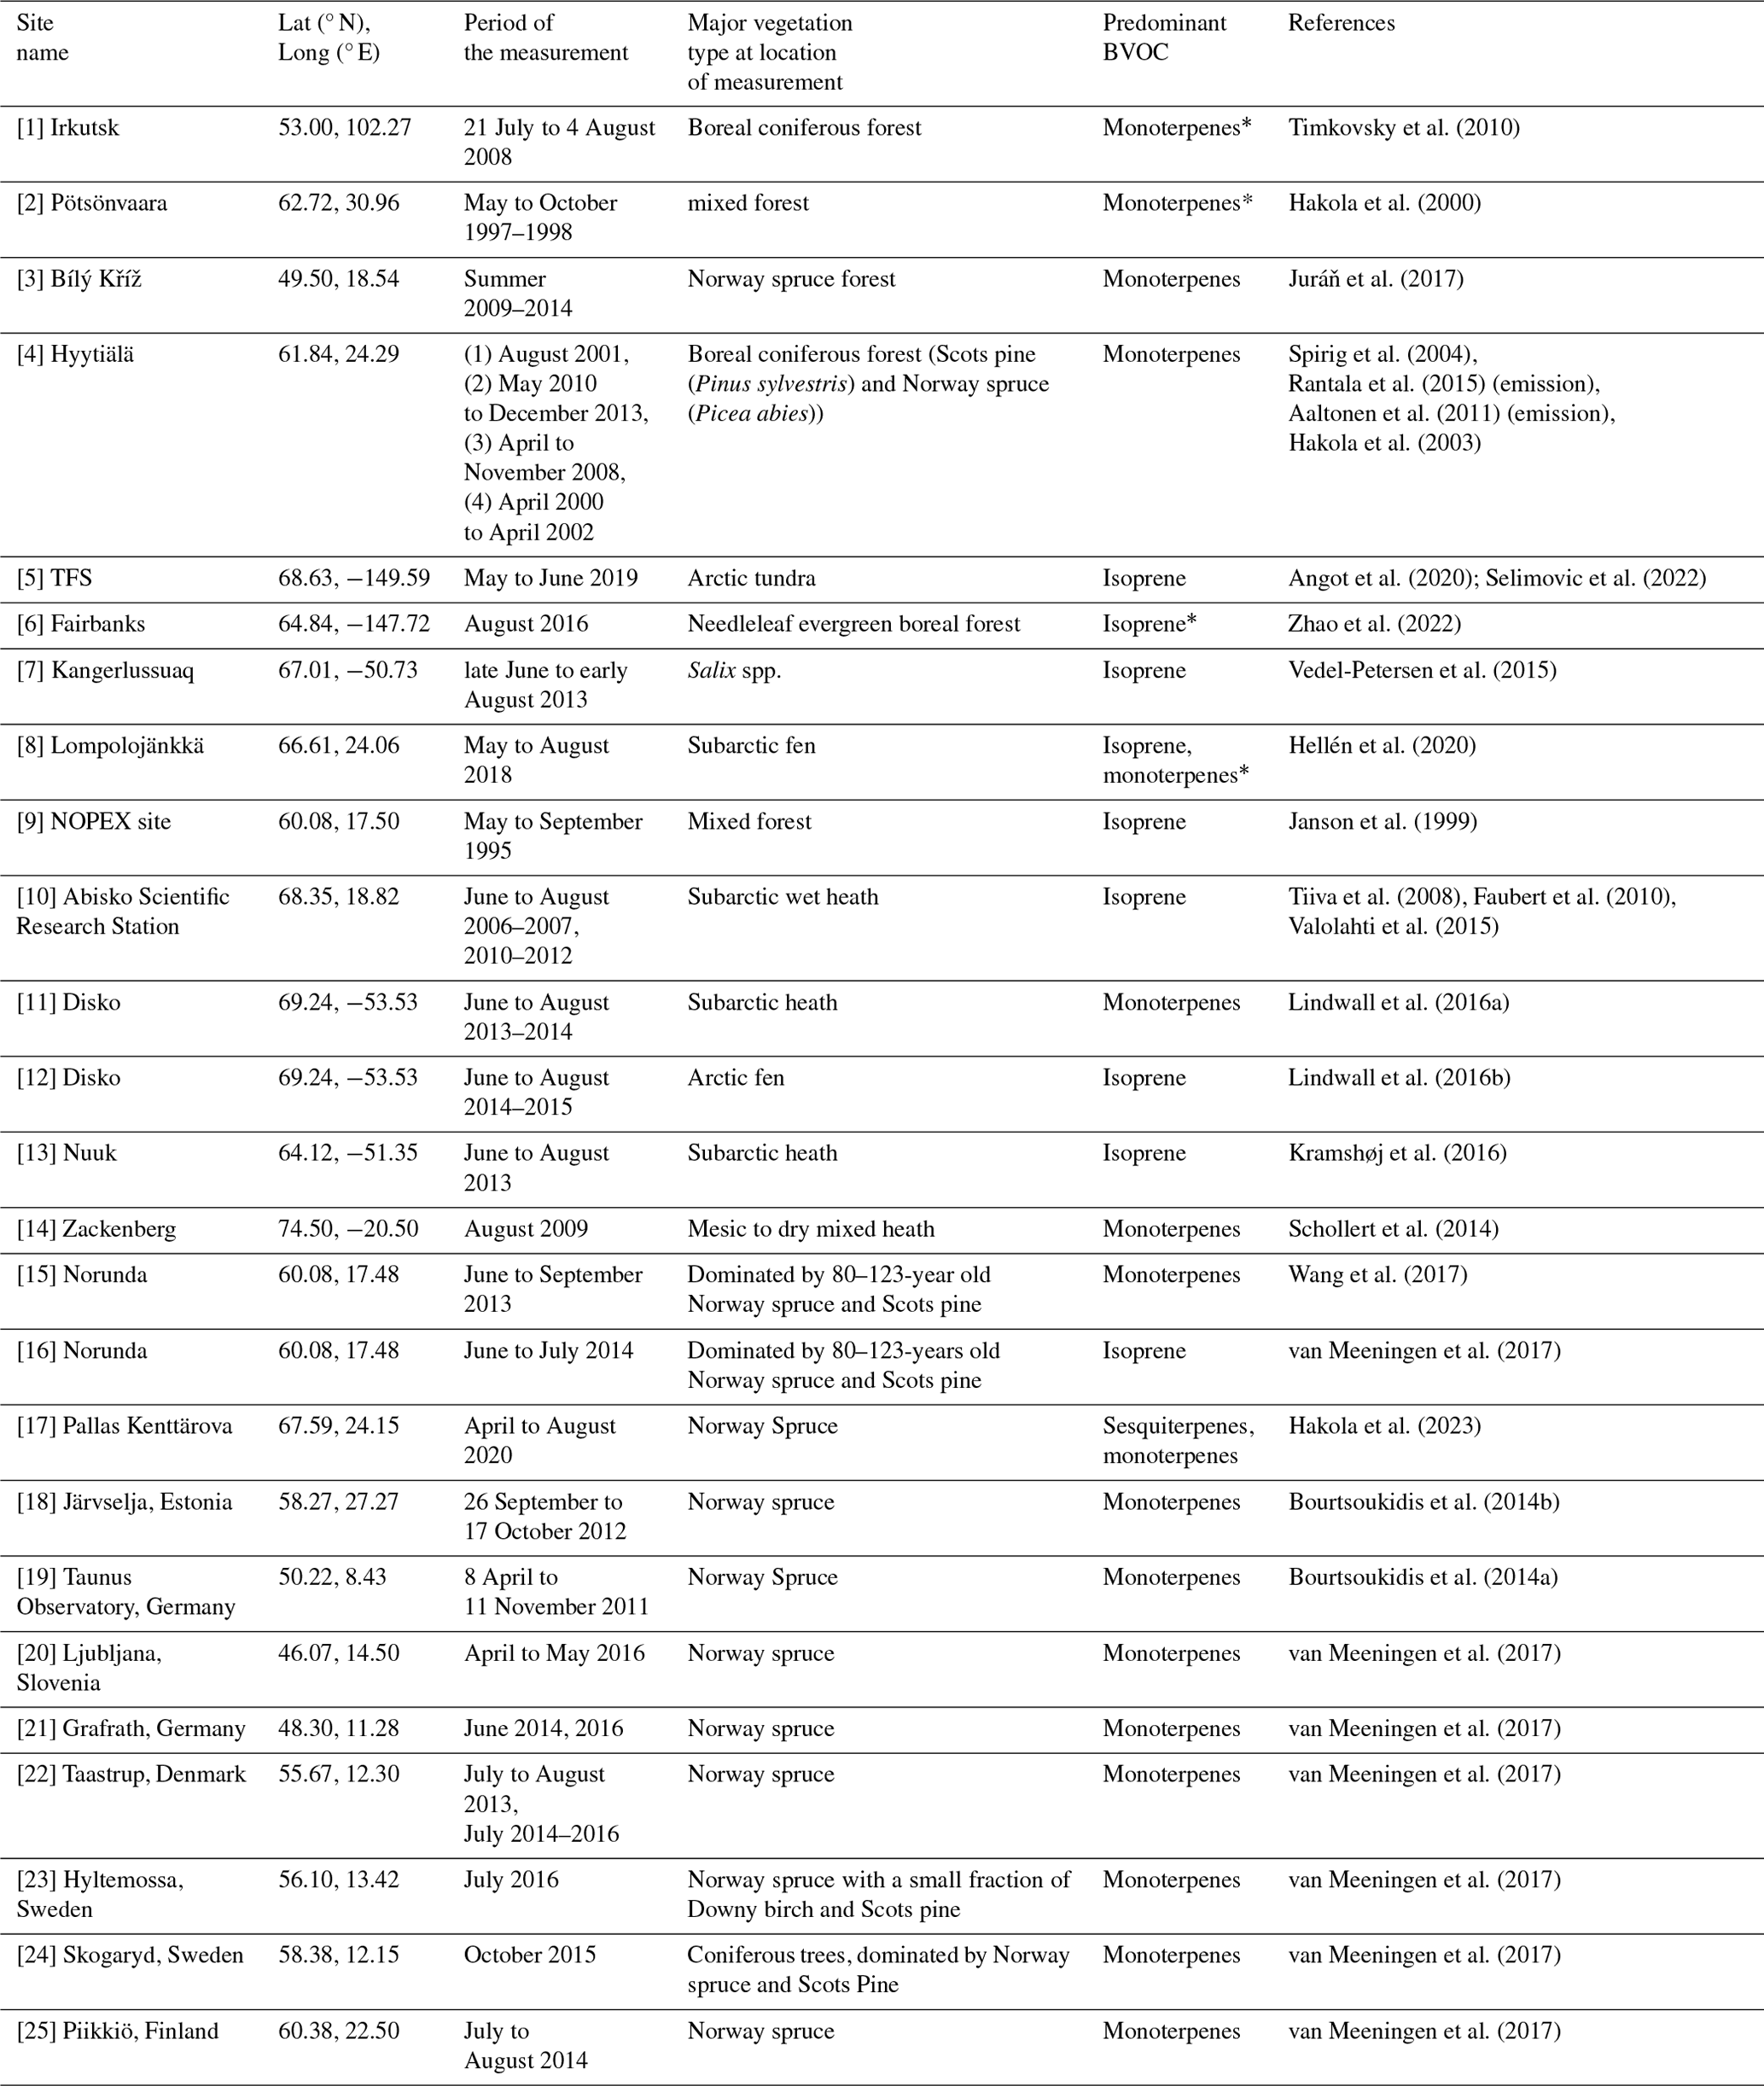
For the column “Predominant BVOC”, with * means most abundant BVOC in mixing ratio and without * means most emitted BVOC.
Our modeled ISOPe is ∼ 1–2 times higher than MONOe (monoterpene emission) in the Alaskan, European, northern Canadian and central Siberian boreal-forest zones, as shown in Fig. 4d and e. Our model shows comparable isoprene surface mixing ratios in relation to the in situ measurements along the Trans-Siberian Railway within Russian boreal forests (generally < 1 ppb in our model and around 0.31–0.48 ppb in the in situ campaign in Timkovskys et al. (2010) – both can reach ∼ 4 ppb in eastern Siberia). Our model also shows comparable monoterpene surface mixing ratios over the Alaska North Slope (0.009 ppbv in our model and ∼ 0.014 ppbv in Selimovic et al., 2022). In comparison to Stavrakou et al. (2018), our modeled ISOPe results over eastern Europe, Alaska and northern Canada agree within 20 %, but our modeled MONOe result is around 40 % lower, likely because we are using online MEGAN as well as different PFT maps and canopy models (Guenther et al., 2012).
A remarkable feature is the heterogeneity of BVOC emissions at northern high latitudes revealed by measurements. We show in Table 2 that, while isoprene dominates BVOC emission over the Arctic tundra and broadleaf forests, monoterpene becomes the dominant species over coniferous forests. This includes a large portion over the European boreal zone, such as at Hyytiälä in Finland (Rinne et al., 2000; Bäck et al., 2012; Rantala et al., 2015; Zhou et al., 2017; Ciarelli et al., 2024), Bílý Kříž in Czech Republic (Juráň et al., 2017) and Norunda research station in Sweden (Wang et al., 2017). However, this large-scale heterogeneity is not being reproduced by our model. We find from Fig. 2f that modeled BVOC emissions are dominated by isoprene in most parts of the northern high latitudes, except in eastern Siberia and eastern Greenland. As shown in Fig. S1, the isoprene dominance in the region is mainly due to the broadleaf deciduous boreal shrubs and needleleaf evergreen boreal trees that are assumed in the model and the fact that the region exhibits higher isoprene emission factors than monoterpenes; in contrast, eastern Siberia is covered predominantly by needleleaf deciduous boreal trees, leading to higher monoterpenes than isoprene emissions (Guenther et al., 2012).
Figure 3 shows that, in Alaska, northern Canada and Siberia, high-HCHO years are often associated with strong wildfire VOC emissions (R2= 0.78–0.89) and, to a lesser extent, are associated with biogenic VOC emissions (R2= 0.21–0.47). The interannual variability of wildfire VOC emission is further supported by CO emissions from both GFED4 and satellite-based estimation (Yurganov and Rakitin, 2022). The high correlation between OMI HCHO VCD and GFED wildfire VOC emissions in Alaska, Siberia and northern Canada indicates a strong wildfire impact on interannual variabilities of HCHO VCD in these domains. In eastern Europe, high-HCHO years are associated with large biogenic emissions (with wildfire VOC emissions: R2= 0.51; with biogenic emissions: R2= 0.72), indicating the important role of biogenic emissions in interannual variability of HCHO in eastern Europe.
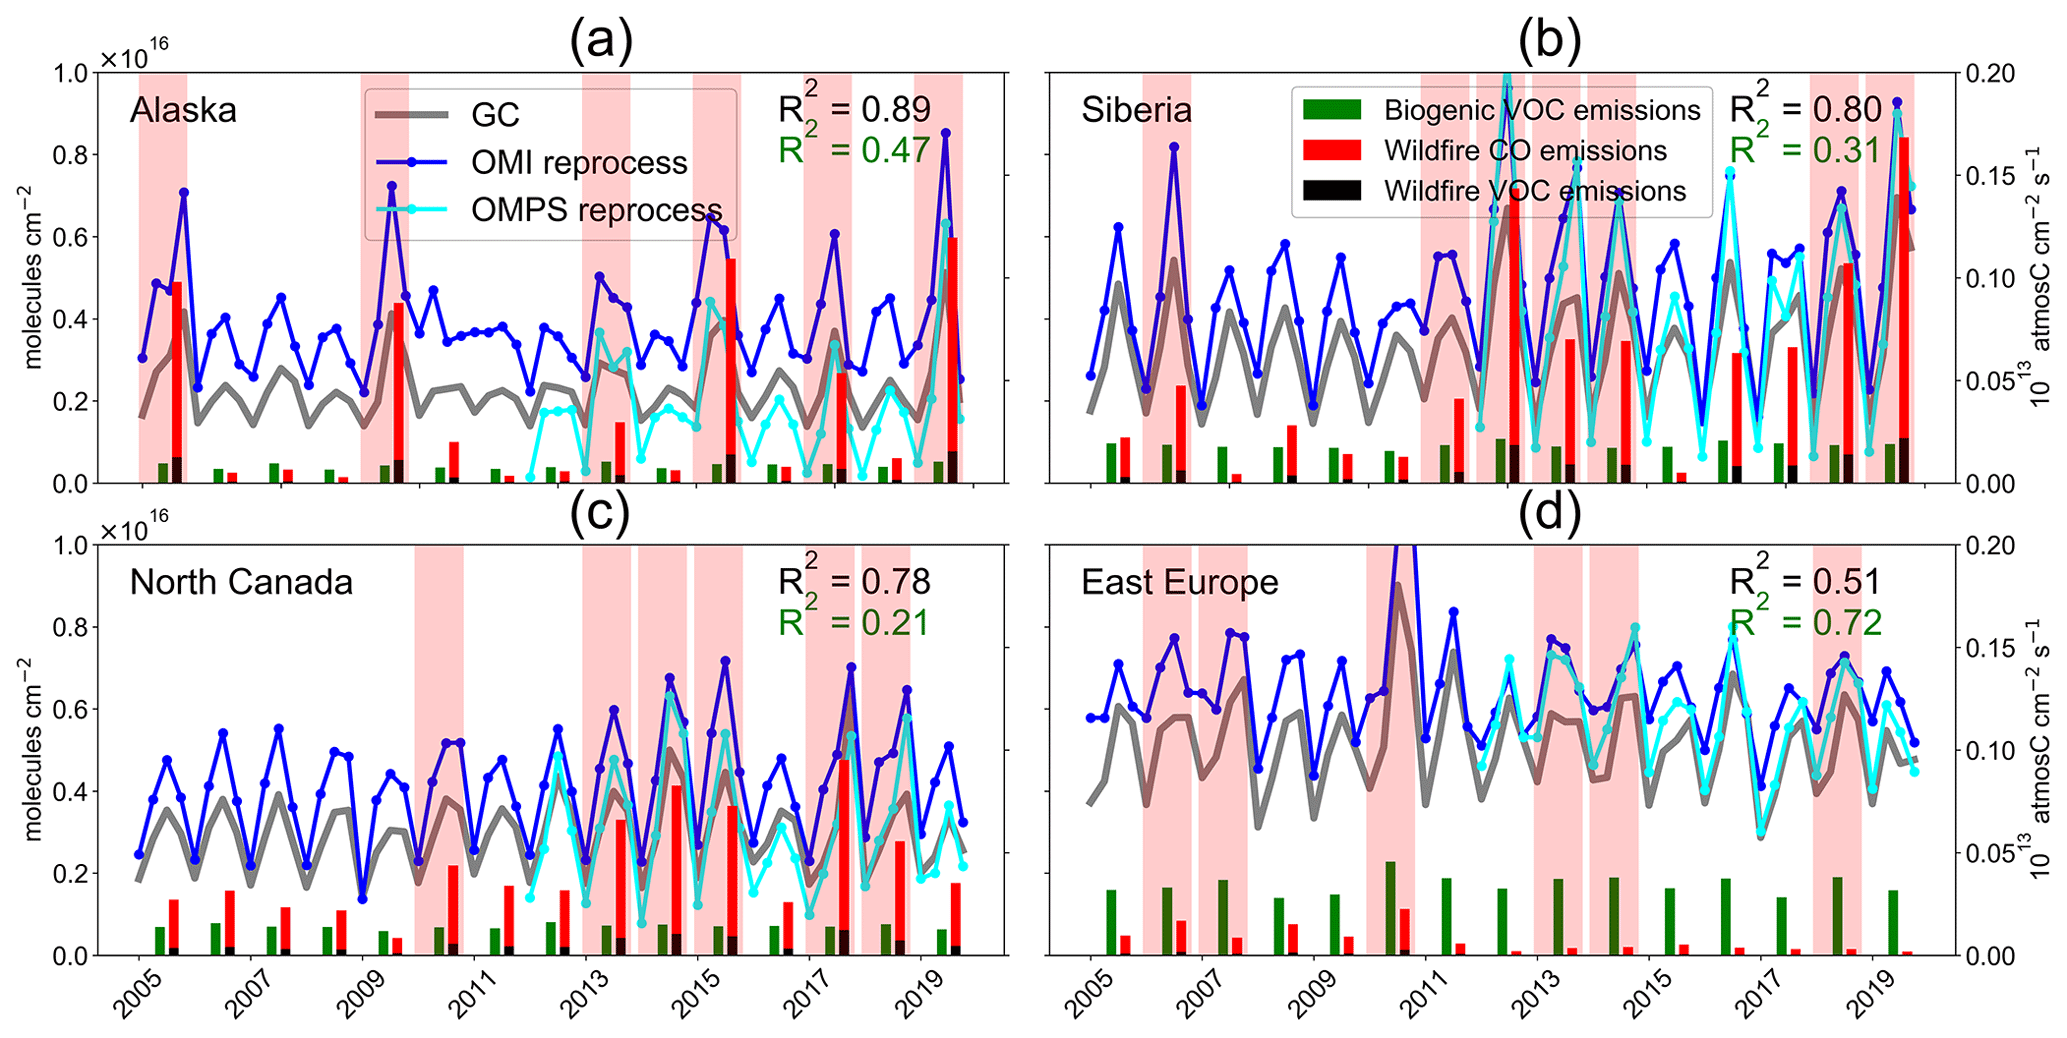
Figure 3Time series of HCHO VCD and biogenic and wildfire emissions over (a) Alaska, (b) Siberia, (c) northern Canada and (d) eastern Europe for 1 May–31 August in 2005–2019. The blue lines are monthly HCHO VCD from reprocessed OMI, cyan lines are from reprocessed OMPS-SNPP, and gray lines are from GEOS-Chem. Red and black bars are area-normalized wildfire CO and VOC emissions during the summer of each year; green bars are area-normalized biogenic VOC emissions. Wildfire emissions are calculated from the GFED4.1s inventory; biogenic VOC emissions are calculated by the MEGAN2.1 model. Pink shading indicates high-HCHO-VCD years (for a definition, see Sect. 2.2 and Table S1). The R2 between reprocessed OMI HCHO VCD and biogenic VOC emissions (green) and wildfire VOC emissions (black) is shown at top right of each panel.
Figure 4a to c show that wildfire is the main driver of HCHO VCDGC interannual variability over Siberia, northern Canada and Alaska. In the low-HCHO years of these three domains, the dVCDFire,GC contribution is ∼ 2 %–11 % of the HCHO total column, which is less than that of VCD0,GC and dVCDBio,GC; in high-HCHO years, the dVCDFire,GC contribution to the total column rises to ∼ 20 %–34 %. This is consistent with Fig. 3 in that HCHO VCD interannual variability has significantly higher correlations with wildfire emissions (R2= 0.78–0.89) than with biogenic emissions (R2= 0.21–0.47) over Siberia, northern Canada and Alaska. These findings highlight the role of wildfire in driving HCHO interannual variability in the three domains.
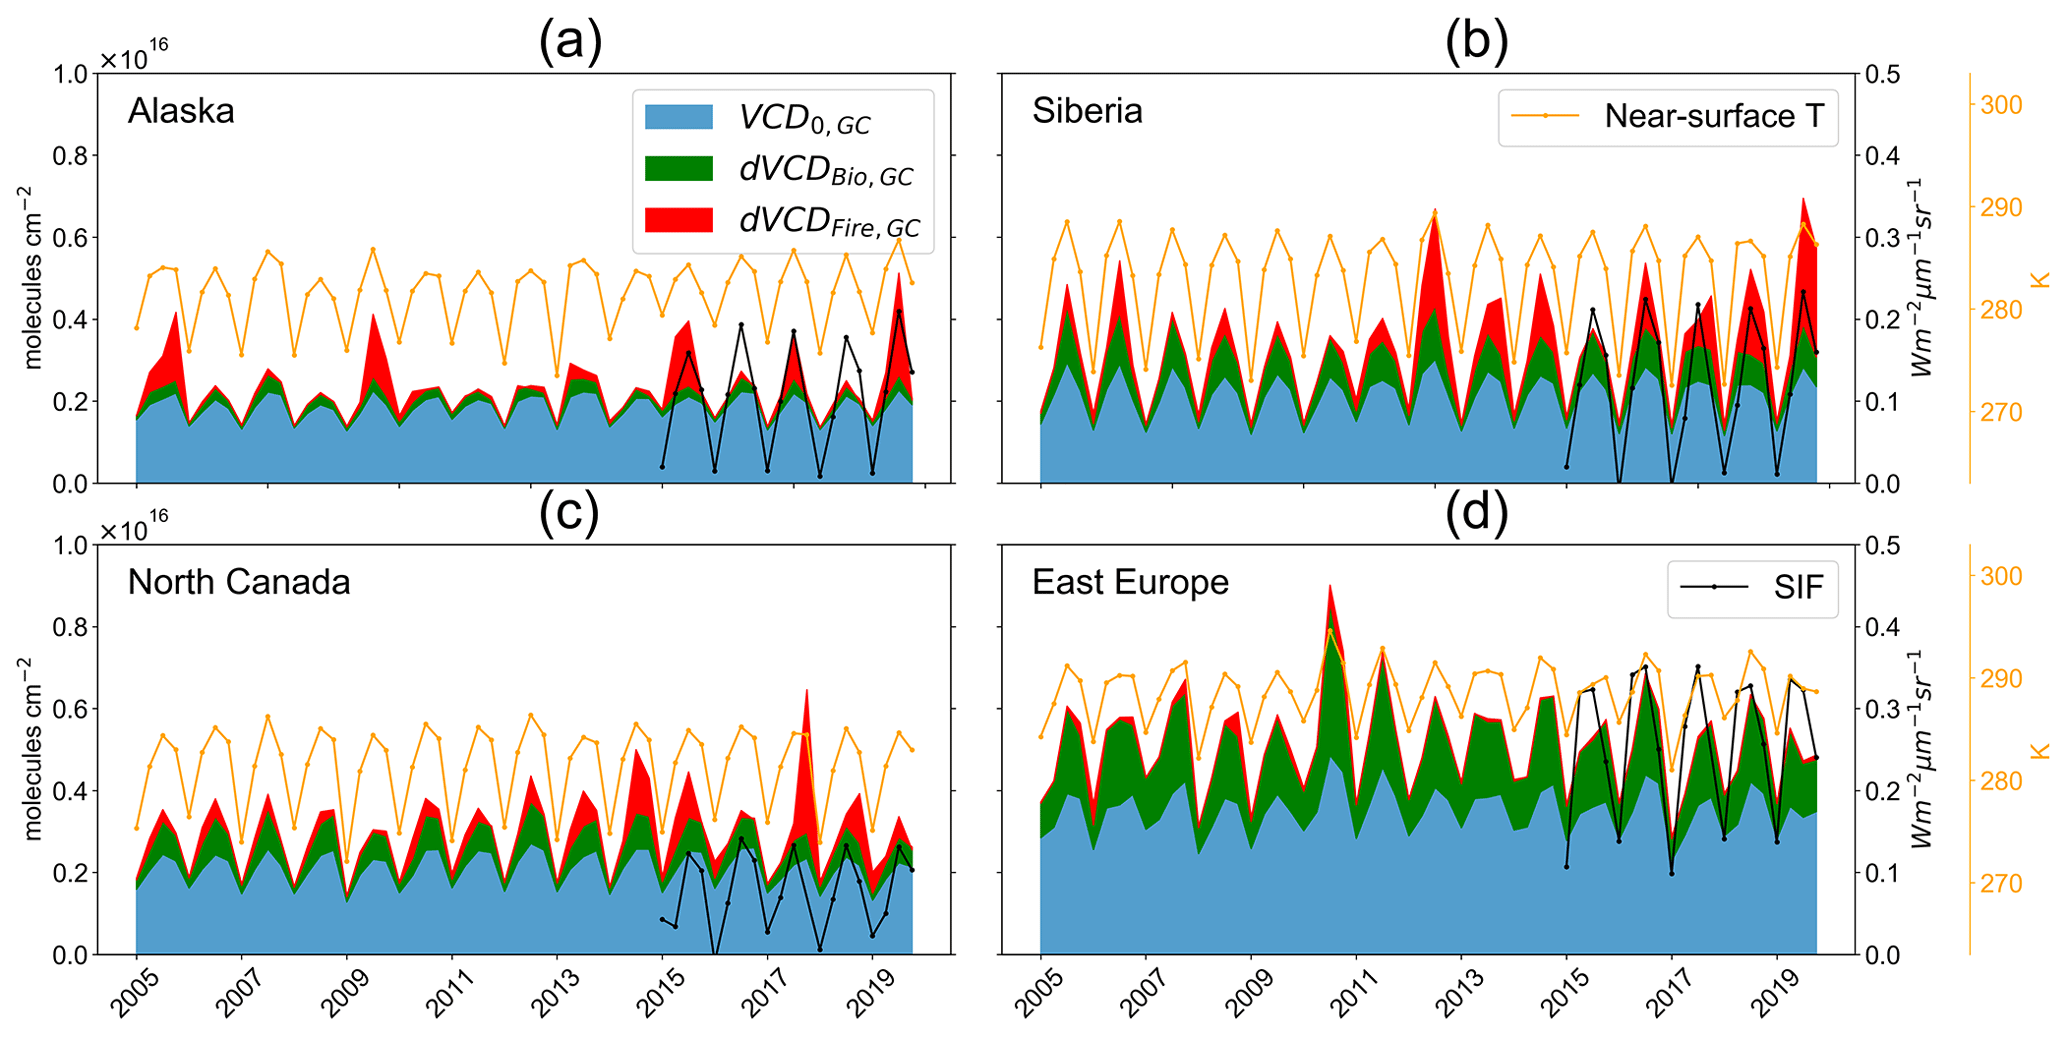
Figure 4Interannual variability of monthly HCHO VCD0,GC, dVCDBio,GC and dVCDFire,GC, as well as near-surface temperature, over (a) Alaska, (b) Siberia, (c) northern Canada and (d) eastern Europe in 2005–2019 summers. For each year, only the monthly values in May, June, July and August are shown. The indigo, green and red shades are background HCHO VCD0,GC, dVCDBio,GC and dVCDFire,GC based on GEOS-Chem sensitivity tests (Table 1). The orange curves are monthly surface temperature from the MERRA-2 data set. The black curves are OCO-2 monthly SIF.
In eastern Europe, biogenic emissions and background HCHO account for the majority of HCHO VCD interannual variability, largely due to the relatively higher surface temperature, stronger photolysis, higher oxidant levels and higher availability of NOx than in the other three domains. On a regional scale, BVOC emissions and methane oxidation with hydroxyl radicals (OHs) both depend on temperature (Guenther et al., 2012; Holmes et al., 2013). In Fig. 4d, the surface temperature in eastern Europe is higher than that in Alaska, northern Canada and Siberia by 5–7 K, leading to an increase in BVOC emissions and VCD0,GC through methane oxidation. HCHO VCD is further enhanced through the higher NOx level (0.4–1 ppbv) in eastern Europe than in the other three domains (0.1–0.5 ppbv) as the HCHO yield from isoprene photooxidation increases with NOx level. The high NOx level in eastern Europe results from its large urban areas and high anthropogenic emissions. The large contribution of BVOC to HCHO VCD is consistent with Fig. 5, which shows that the CV of dVCDBio,GC + VCD0,GC accounts for > 90 % of VCDGC's CV in eastern Europe. Similarly, Fig. 3d shows that biogenic emission has a higher correlation (R2= 0.72) with VCDGC than wildfire emission does (R2= 0.51). These results suggest that biogenic emissions and background are the main contributors to HCHO interannual variability in eastern Europe.
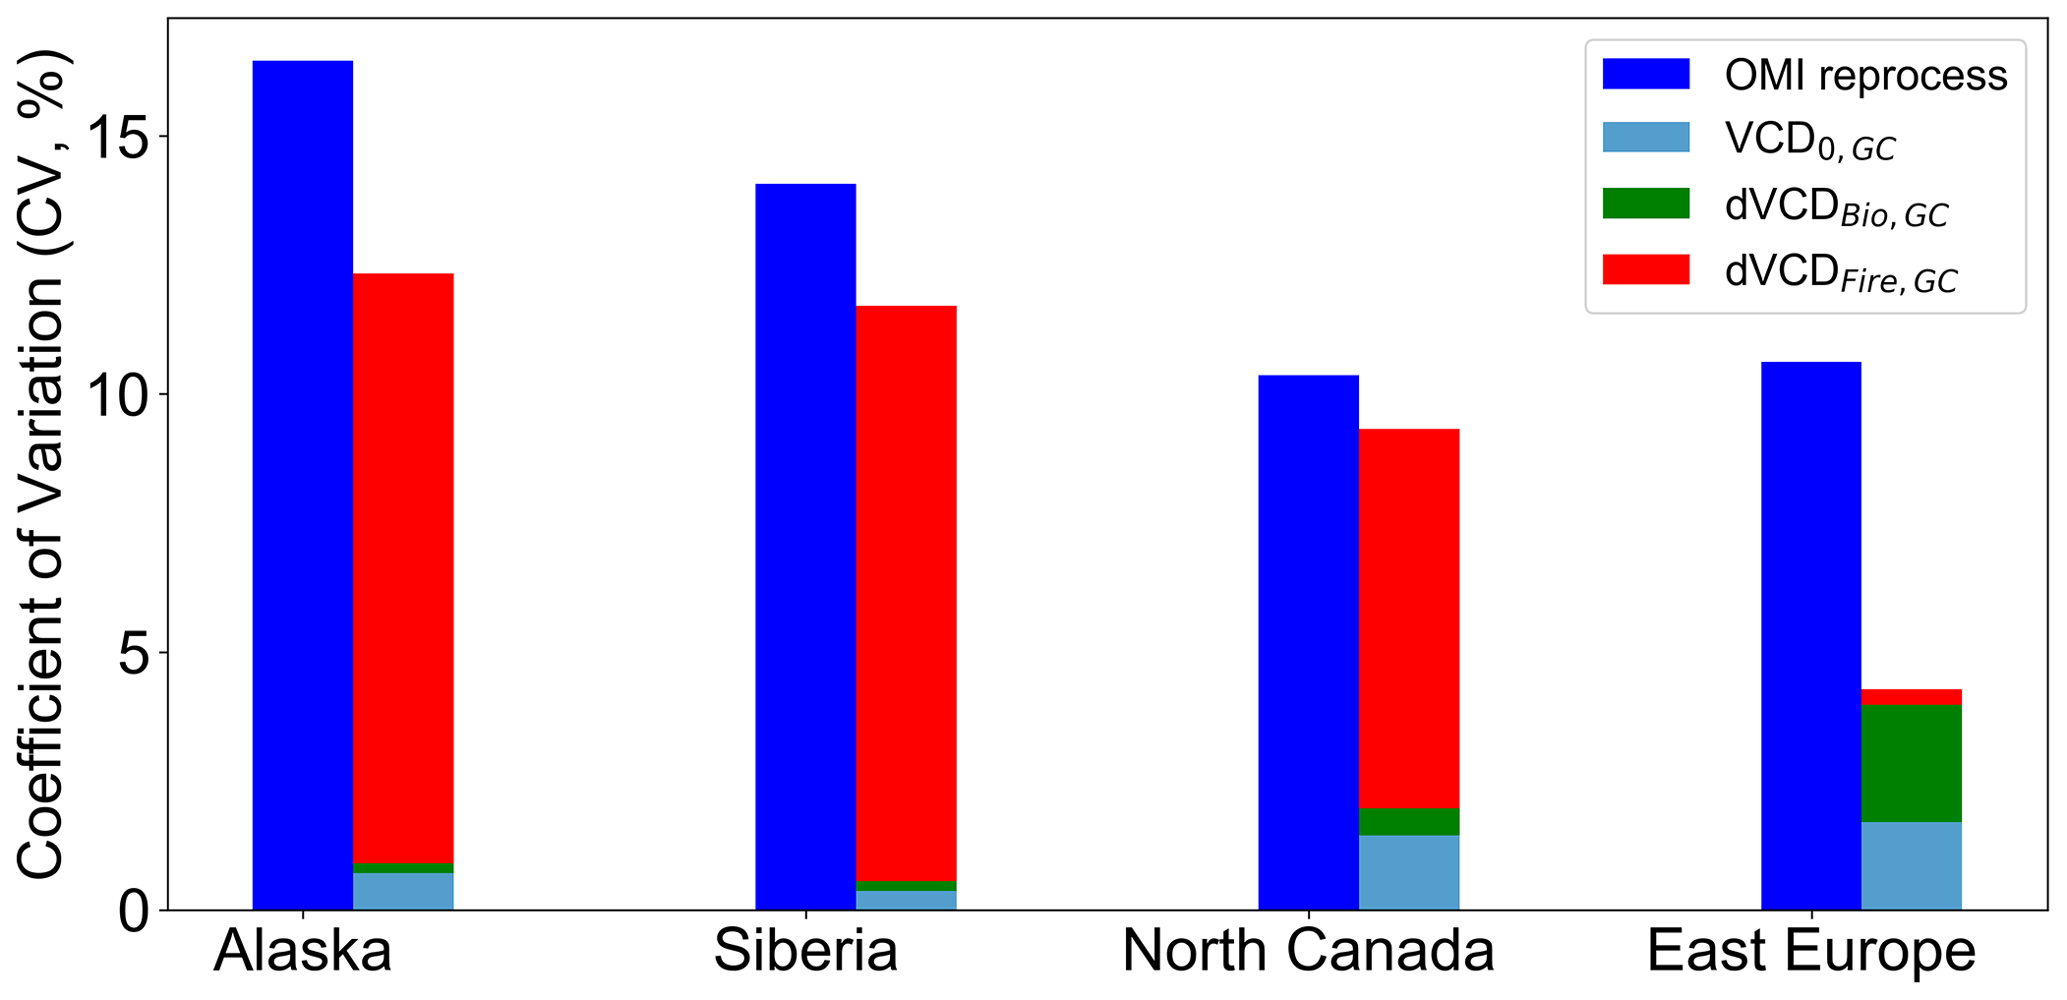
Figure 5Coefficient of variation (CV) of OMI HCHO VCD, modeled HCHO VCD0,GC, dVCDBio,GC and dVCDFire,GC in the summertime of 2005–2019.
We further examine the contribution from background, biogenic and pyrogenic emissions to the interannual variability of HCHO VCDGC over each region. We find from model results that biogenic emissions and background signals contribute to 90 % of the interannual variability of HCHO VCDGC in eastern Europe, while wildfire accounts for over 90 % of CV in Alaska, Siberia and northern Canada, which is consistent with previous work (Stavrakou et al., 2018; Zhao et al., 2022). We use the Mann–Kendall test, a non-parametric statistical test used to detect trends in time series data, to test the significance of the trend of monthly HCHO VCDGC time series over a specific domain (Gilbert, 1987). We found no significant trend of HCHO VCDGC over eastern Europe, northern Canada and Alaska from either satellites or the model. On the other hand, we find that the trend of HCHO VCDGC over Siberia is significant (p<0.05) and increasing (1.7 % per year). VCD0,GC and dVCDBio,GC show no significant trend, while the trend of dVCDFire,GC is significant and increasing in Siberia (12 % per year), suggesting that wildfires are responsible for the VCDGC trends in Siberia. In contrast to Bauwens et al. (2016), we find that the HCHO VCDGC trend over Siberia is largely driven by the increasing wildfires in recent years and, to a lesser extent, by biogenic VOC emissions, highlighting the important role of wildfires in HCHO VCD interannual variability.
In Fig. 6a to d, we find a good linear relationship (R= 0.6–0.7) between OCO-2 monthly SIF and dVCDBio,GC in Alaska, Siberia, northern Canada and eastern Europe. Foster et al. (2014) show a highly linear correlation between seasonal variations of the satellite HCHO column (fire free) and GPP at northern high latitudes. This is consistent with our findings over most continental areas at northern high latitudes (Fig. S2) since SIF is a widely used proxy of GPP (Frankenberg et al., 2011). In Fig. 6g to j, SIF and ISOPe show a linear relationship when SIF is within 0–0.25 W m−2 µm−1 sr−1 but tend to decouple when SIF > 0.25 W m−2µm−1 sr−1, possibly due to the different temperature optimums of isoprene emission and photosynthesis (Harrison et al., 2013; Zheng et al., 2015).
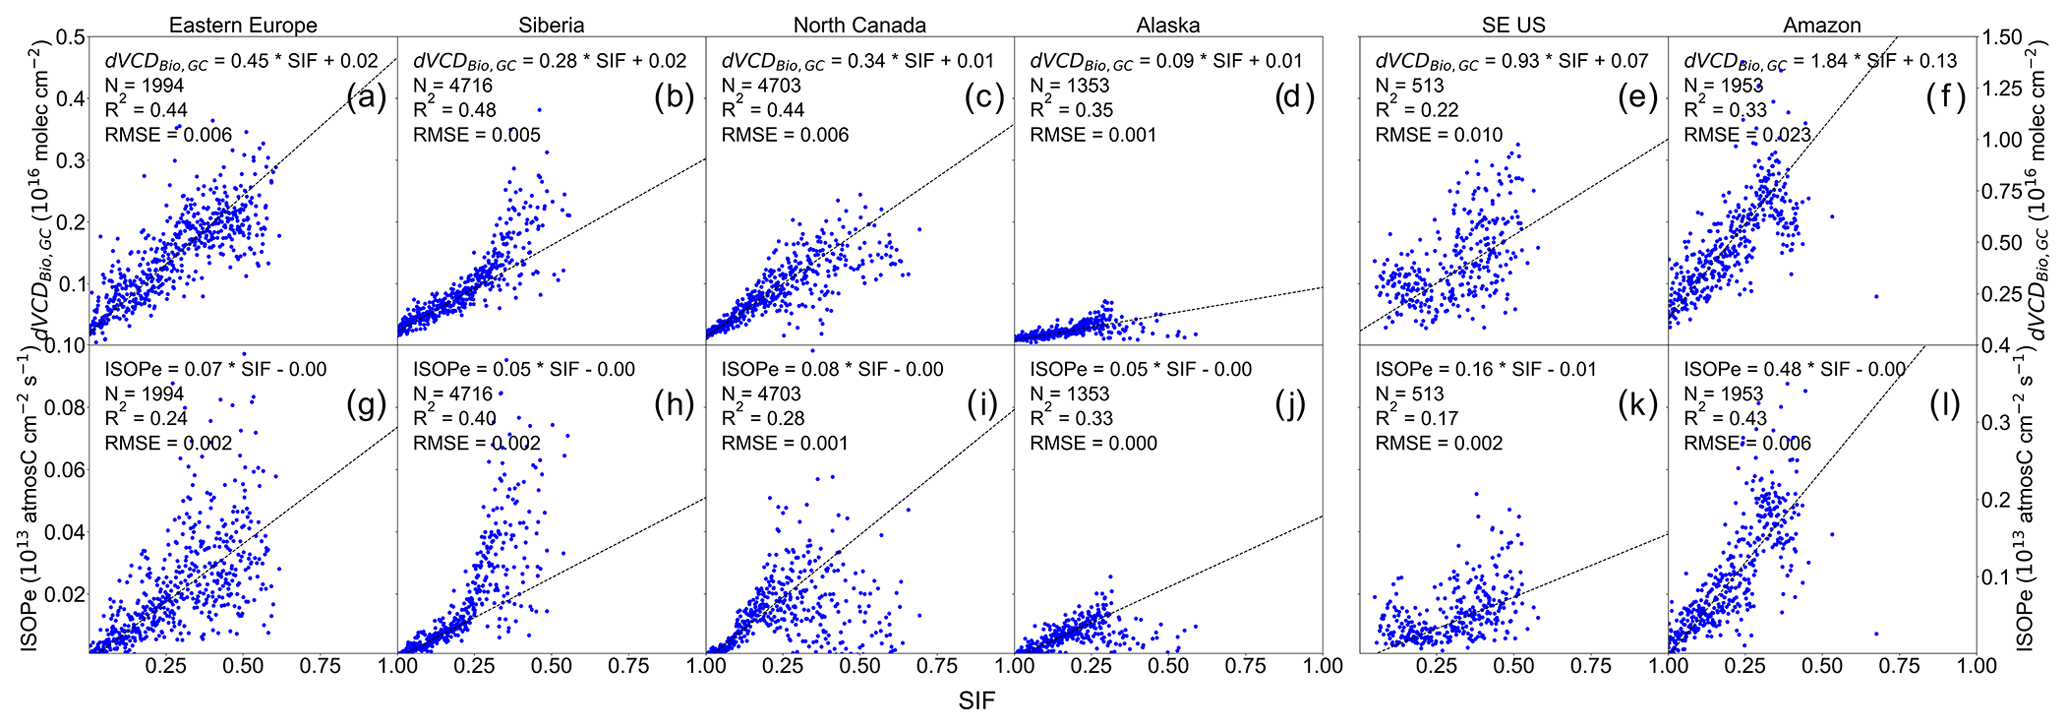
Figure 6Scatter plot of monthly OCO-2 SIF versus GEOS-Chem HCHO dVCDBio,GC and isoprene emission fluxes in the four study domains plus the southeastern US ([26, 36]° N, [−100,−75]° E) and the Amazon ([−20,−5]° N, [−75,−40]° E) from May to August in 2015–2019. OCO-2 SIF is regridded to 2° × 2.5° spatial resolution. Only continental pixels of SIF-dVCDBio,GC and SIF-ISOPe matchups are used to plot. Before plotting, data matchups are binned by SIF using a bin size of 0.001 W m−2 µm−1 sr−1. Linear regression is shown as the black dash in each panel, calculated for SIF within 0–0.25 W m−2 µm−1 sr−1. The number of binned data pairs (N), R squared (R2) values and root mean square error (RMSE) values are calculated based on binned data across all ranges.
Despite the difference in the distribution of vegetation types, the dVCDBio,GC–SIF slope is homogeneous over Siberia, northern Canada and eastern Europe (slope = 0.28–0.45, unit: 1016 molec. cm−2 per W m−2µm−1 sr−1), suggesting SIF as a tool to understand biogenic HCHO variability in these regions. The dVCDBio,GC–SIF slope in Alaska is 3–5 times lower than in the other three domains, which warrants further investigation. In contrast to high latitudes, we find that both the ISOPe : SIF slope and the dVCD SIF slope are a factor of 2–10 times higher in the southeastern US and the Amazon (Fig. 6e–f, k–l) than at northern high latitudes, indicating that the dVCDBio,GC–SIF slope over northern high latitudes and lower latitudes could be very different.
SIF offers an independent evaluation of the interannual variability of HCHO dVCDBio,GC. As SIF shows a linear relationship with dVCDBio,GC at northern high latitudes (Fig. 6a to d), it is reasonable to infer from Fig. 4 that the low interannual variability shown in SIF (CV = 1 %–9 %) is expected for dVCDBio,GC (CV = 1 %–2 %) in Alaska, Siberia and northern Canada. In contrast, we find that dVCDFire,GC has a much weaker correlation with SIF (Fig. S2c) and shows a higher interannual variability (CV = 8 %–13 %). As wildfire emission is highly correlated (R2= 78 %–89 %) with OMI HCHO VCD over northern Canada, Siberia, and Alaska (Fig. 3), the high interannual variabilities of OMI HCHO VCD (CV = 10 %–16 %) in these domains are likely driven by wildfires instead of biogenic emissions.
We use reprocessed new retrievals of HCHO from OMI and OMPS-SNPP to evaluate the interannual variability of HCHO VCD from GEOS-Chem over northern high latitudes in 2005–2019 summers. The reprocessed OMI and OMPS-SNPP HCHO VCDs show a high consistency in the spatial pattern and interannual variability. GEOS-Chem reproduced the interannual variability of HCHO VCD, but the magnitude is biased low in comparison to satellite retrievals.
Our modeled HCHO VCD can be biased low due to large underestimations of HCHO production and emission factors in wildfire smoke. Previous in situ campaigns show underestimated emission factors of VOCs in the GFED4.1s emission inventory for temperate forests in the western US (Liu et al., 2017; Permar et al., 2021), while the bias in VOC emission factors in boreal-forest wildfires remains unclear. HCHO underestimation can also be due to the missing HCHO secondary production in wildfire-impacted conditions (Liao et al., 2021; Jin et al., 2023). GEOS-Chem is found to underestimate oxygenated VOCs by a factor of 3 to 12 in some Arctic regions, which could contribute to the bias in modeled HCHO at northern high latitudes (Selimovic et al., 2022). More measurements in the Arctic region are needed to reconcile the model–observation discrepancies.
Wildfire accounts for the majority of the HCHO interannual variability in Alaska, northern Canada and Siberia. Compared to biogenic emissions and background HCHO, wildfire emission shows a better correlation with HCHO VCD despite the fact that biogenic and background HCHO can dominate HCHO VCD in the low-HCHO years of these three regions. We also find an increasing trend (p<0.05) in wildfire emission and HCHO VCD over northern Canada and Siberia. With rapid Arctic warming, wildfire frequency and intensity have risen rapidly in recent decades and will continue to do so in the near future (Descals et al., 2022). We expect that wildfire will continue to dominate HCHO interannual variability in the three regions.
Eastern Europe is the only one of the four studied regions where HCHO interannual variability is dominated by biogenic emission and background HCHO. This is due to a combination of lower wildfire activities, higher surface temperatures and anthropogenic NOx emissions in this region. No significant trends in terms of biogenic emission, biogenic-related HCHO and background HCHO are found in the four regions during the summertime of 2005–2019. However, model estimates of HCHO from biogenic emissions are largely uncertain as the model-calculated VOC speciation is at odds with field measurements (Fig. 2f and Table 2). Previous work shows good performance by the model in capturing the long-term variability of biogenic emissions in response to climate variables (Stavrakou et al., 2018), but the model underestimates biogenic and fire emissions over northern high latitudes, especially over eastern Europe and Alaska (Stavrakou et al., 2015). Future research is warranted to examine the HCHO signal from biogenic emissions in this region.
The OCO-2 satellite SIF provides an additional constraint on the interannual variability of biogenic emissions and is independent of wildfire emissions. As a proxy of vegetation photosynthesis and GPP, SIF is expected to have a good correlation with isoprene emission and HCHO VCD in the northern boreal regions, though this correlation can be worse at middle latitudes and tropical regions (Foster et al., 2014). We show a tight and homogeneous linear relationship (R= 0.6–0.7) between SIF and dVCDBio,GC at northern high latitudes, suggesting that SIF may serve as a tool to understand biogenic HCHO variability in this region.
The OMPS-SNPP HCHO L2 V1 product is available at https://disc.gsfc.nasa.gov/datasets/OMPS_NPP_NMHCHO_L2_1/summary (González Abad, 2022). The OMI HCHO L2 product is available at https://waps.cfa.harvard.edu/sao_atmos/data/omi_hcho/OMI-HCHO-L2/ (González Abad et al., 2022). The OCO-2 SIF is available at https://doi.org/10.3334/ORNLDAAC/1863 (Yu et al., 2021). Data used in this work are available at https://doi.org/10.6084/m9.figshare.23599566.v1 (Zhao, 2023a). Data processing and plotting codes are available at https://doi.org/10.5281/zenodo.8094844 (Zhao, 2023b). The GEOS-Chem model is publicly available at https://doi.org/10.5281/zenodo.3701669 (The International GEOS-Chem Community, 2020).
The supplement related to this article is available online at: https://doi.org/10.5194/acp-24-6105-2024-supplement.
TZ and JM designed the research, performed the simulations and conducted the analysis. ZA, GGA and CRN provided the OMI and OMPS data. YZ helped process and analyze the data. TZ and JM wrote the paper, with all the co-authors providing input.
The contact author has declared that none of the authors has any competing interests.
Publisher's note: Copernicus Publications remains neutral with regard to jurisdictional claims made in the text, published maps, institutional affiliations, or any other geographical representation in this paper. While Copernicus Publications makes every effort to include appropriate place names, the final responsibility lies with the authors.
Tianlang Zhao and Jingqiu Mao acknowledge funding from NASA (grant nos. 80NSSC19M0154 and 80NSSC21K0428). Zolal Ayazpour, Gonzalo González Abad and Caroline R. Nowlan acknowledge funding from NOAA (grant no. NA18OAR4310108) and NASA (grant nos. 80NSSC18M0091, 80NSSC18K0691 and 80NSSC21K0177). We thank William Simpson (University of Alaska Fairbanks) for the helpful discussions.
This research has been supported by the National Aeronautics and Space Administration (grant nos. 80NSSC19M0154, 80NSSC21K0428, 80NSSC18M0091, 80NSSC18K0691 and 80NSSC21K0177) and the National Oceanic and Atmospheric Administration (grant no. NA18OAR4310108).
This paper was edited by Eduardo Landulfo and reviewed by three anonymous referees.
Aaltonen, H., Pumpanen, J., Pihlatie, M., Hakola, H., Hellén, H., Kulmala, L., Vesala, T., and Bäck, J.: Boreal pine forest floor biogenic volatile organic compound emissions peak in early summer and autumn, Agr. Forest Meteorol., 151, 682–691, https://doi.org/10.1016/j.agrformet.2010.12.010, 2011.
Affek, H. P. and Yakir, D.: Natural Abundance Carbon Isotope Composition of Isoprene Reflects Incomplete Coupling between Isoprene Synthesis and Photosynthetic Carbon Flow, Plant Physiol., 131, 1727–1736, https://doi.org/10.1104/pp.102.012294, 2003.
Akagi, S. K., Yokelson, R. J., Wiedinmyer, C., Alvarado, M. J., Reid, J. S., Karl, T., Crounse, J. D., and Wennberg, P. O.: Emission factors for open and domestic biomass burning for use in atmospheric models, Atmos. Chem. Phys., 11, 4039–4072, https://doi.org/10.5194/acp-11-4039-2011, 2011.
Alvarado, L. M. A., Richter, A., Vrekoussis, M., Hilboll, A., Kalisz Hedegaard, A. B., Schneising, O., and Burrows, J. P.: Unexpected long-range transport of glyoxal and formaldehyde observed from the Copernicus Sentinel-5 Precursor satellite during the 2018 Canadian wildfires, Atmos. Chem. Phys., 20, 2057–2072, https://doi.org/10.5194/acp-20-2057-2020, 2020
Angot, H., McErlean, K., Hu, L., Millet, D. B., Hueber, J., Cui, K., Moss, J., Wielgasz, C., Milligan, T., Ketcherside, D., Bret-Harte, M. S., and Helmig, D.: Biogenic volatile organic compound ambient mixing ratios and emission rates in the Alaskan Arctic tundra, Biogeosciences, 17, 6219–6236, https://doi.org/10.5194/bg-17-6219-2020, 2020.
Atkinson, R.: Atmospheric chemistry of VOCs and NOx, Atmos. Environ., 34, 2063–2101, https://doi.org/10.1016/S1352-2310(99)00460-4, 2000.
Bäck, J., Aalto, J., Henriksson, M., Hakola, H., He, Q., and Boy, M.: Chemodiversity of a Scots pine stand and implications for terpene air concentrations, Biogeosciences, 9, 689–702, https://doi.org/10.5194/bg-9-689-2012, 2012.
Bauwens, M., Stavrakou, T., Müller, J.-F., De Smedt, I., Van Roozendael, M., van der Werf, G. R., Wiedinmyer, C., Kaiser, J. W., Sindelarova, K., and Guenther, A.: Nine years of global hydrocarbon emissions based on source inversion of OMI formaldehyde observations, Atmos. Chem. Phys., 16, 10133–10158, https://doi.org/10.5194/acp-16-10133-2016, 2016.
Bindle, L., Martin, R. V., Cooper, M. J., Lundgren, E. W., Eastham, S. D., Auer, B. M., Clune, T. L., Weng, H., Lin, J., Murray, L. T., Meng, J., Keller, C. A., Putman, W. M., Pawson, S., and Jacob, D. J.: Grid-stretching capability for the GEOS-Chem 13.0.0 atmospheric chemistry model, Geosci. Model Dev., 14, 5977–5997, https://doi.org/10.5194/gmd-14-5977-2021, 2021.
Blake, D. R., Hurst, D. F., Smith, T. W., Whipple, W. J., Chen, T.-Y., Blake, N. J., and Rowland, F. S.: Summertime measurements of selected nonmethane hydrocarbons in the Arctic and Subarctic during the 1988 Arctic Boundary Layer Expedition (ABLE 3A), J. Geophys. Res., 97, 16559, https://doi.org/10.1029/92JD00892, 1992.
Boeke, N. L., Marshall, J. D., Alvarez, S., Chance, K. V., Fried, A., Kurosu, T. P., Rappenglück, B., Richter, D., Walega, J., Weibring, P., and Millet, D. B.: Formaldehyde columns from the Ozone Monitoring Instrument: Urban versus background levels and evaluation using aircraft data and a global model, J. Geophys. Res., 116, D05303, https://doi.org/10.1029/2010JD014870, 2011.
Bourtsoukidis, E., Williams, J., Kesselmeier, J., Jacobi, S., and Bonn, B.: From emissions to ambient mixing ratios: online seasonal field measurements of volatile organic compounds over a Norway spruce-dominated forest in central Germany, Atmos. Chem. Phys., 14, 6495–6510, https://doi.org/10.5194/acp-14-6495-2014, 2014a.
Bourtsoukidis, E., Bonn, B., and Noe, S. M.: On-line field measurements of BVOC emissions from Norway spruce (Picea abies) at the hemiboreal SMEAR-Estonia site under autumn conditions, Boreal Environ. Res., 19, 153–167, 2014b.
Ciarelli, G., Tahvonen, S., Cholakian, A., Bettineschi, M., Vitali, B., Petäjä, T., and Bianchi, F.: On the formation of biogenic secondary organic aerosol in chemical transport models: an evaluation of the WRF-CHIMERE (v2020r2) model with a focus over the Finnish boreal forest, Geosci. Model Dev., 17, 545–565, https://doi.org/10.5194/gmd-17-545-2024, 2024.
de Graaf, M., Sihler, H., Tilstra, L. G., and Stammes, P.: How big is an OMI pixel?, Atmos. Meas. Tech., 9, 3607–3618, https://doi.org/10.5194/amt-9-3607-2016, 2016.
Delwiche, C. F. and Sharkey, T. D.: Rapid appearance of 13C in biogenic isoprene when 13CO2 is fed to intact leaves, Plant Cell Environ., 16, 587–591, https://doi.org/10.1111/j.1365-3040.1993.tb00907.x, 1993.
Descals, A., Gaveau, D. L. A., Verger, A., Sheil, D., Naito, D., and Peñuelas, J.: Unprecedented fire activity above the Arctic Circle linked to rising temperatures, Science, 378, 532–537, https://doi.org/10.1126/science.abn9768, 2022.
De Smedt, I., Müller, J.-F., Stavrakou, T., van der A, R., Eskes, H., and Van Roozendael, M.: Twelve years of global observations of formaldehyde in the troposphere using GOME and SCIAMACHY sensors, Atmos. Chem. Phys., 8, 4947–4963, https://doi.org/10.5194/acp-8-4947-2008, 2008.
De Smedt, I., Theys, N., Yu, H., Danckaert, T., Lerot, C., Compernolle, S., Van Roozendael, M., Richter, A., Hilboll, A., Peters, E., Pedergnana, M., Loyola, D., Beirle, S., Wagner, T., Eskes, H., van Geffen, J., Boersma, K. F., and Veefkind, P.: Algorithm theoretical baseline for formaldehyde retrievals from S5P TROPOMI and from the QA4ECV project, Atmos. Meas. Tech., 11, 2395–2426, https://doi.org/10.5194/amt-11-2395-2018, 2018.
Eastham, S. D., Long, M. S., Keller, C. A., Lundgren, E., Yantosca, R. M., Zhuang, J., Li, C., Lee, C. J., Yannetti, M., Auer, B. M., Clune, T. L., Kouatchou, J., Putman, W. M., Thompson, M. A., Trayanov, A. L., Molod, A. M., Martin, R. V., and Jacob, D. J.: GEOS-Chem High Performance (GCHP v11-02c): a next-generation implementation of the GEOS-Chem chemical transport model for massively parallel applications, Geosci. Model Dev., 11, 2941–2953, https://doi.org/10.5194/gmd-11-2941-2018, 2018.
Faubert, P., Tiiva, P., Rinnan, Å., Michelsen, A., Holopainen, J. K., and Rinnan, R.: Doubled volatile organic compound emissions from subarctic tundra under simulated climate warming, New Phytol., 187, 199–208, https://doi.org/10.1111/j.1469-8137.2010.03270.x, 2010.
Fisher, J. A., Jacob, D. J., Travis, K. R., Kim, P. S., Marais, E. A., Chan Miller, C., Yu, K., Zhu, L., Yantosca, R. M., Sulprizio, M. P., Mao, J., Wennberg, P. O., Crounse, J. D., Teng, A. P., Nguyen, T. B., St. Clair, J. M., Cohen, R. C., Romer, P., Nault, B. A., Wooldridge, P. J., Jimenez, J. L., Campuzano-Jost, P., Day, D. A., Hu, W., Shepson, P. B., Xiong, F., Blake, D. R., Goldstein, A. H., Misztal, P. K., Hanisco, T. F., Wolfe, G. M., Ryerson, T. B., Wisthaler, A., and Mikoviny, T.: Organic nitrate chemistry and its implications for nitrogen budgets in an isoprene- and monoterpene-rich atmosphere: constraints from aircraft (SEAC4RS) and ground-based (SOAS) observations in the Southeast US, Atmos. Chem. Phys., 16, 5969–5991, https://doi.org/10.5194/acp-16-5969-2016, 2016.
Foster, P. N., Prentice, I. C., Morfopoulos, C., Siddall, M., and van Weele, M.: Isoprene emissions track the seasonal cycle of canopy temperature, not primary production: evidence from remote sensing, Biogeosciences, 11, 3437–3451, https://doi.org/10.5194/bg-11-3437-2014, 2014.
Frankenberg, C., Fisher, J. B., Worden, J., Badgley, G., Saatchi, S. S., Lee, J.-E., Toon, G. C., Butz, A., Jung, M., Kuze, A., and Yokota, T.: New global observations of the terrestrial carbon cycle from GOSAT: Patterns of plant fluorescence with gross primary productivity, Geophys. Res. Lett., 38, L17706, https://doi.org/10.1029/2011GL048738, 2011.
Fu, T.-M., Jacob, D. J., Palmer, P. I., Chance, K., Wang, Y. X., Barletta, B., Blake, D. R., Stanton, J. C., and Pilling, M. J.: Space-based formaldehyde measurements as constraints on volatile organic compound emissions in east and south Asia and implications for ozone, J. Geophys. Res.-Atmos., 112, D06312, https://doi.org/10.1029/2006JD007853, 2007.
Giglio, L., Randerson, J. T., and van der Werf, G. R.: Analysis of daily, monthly, and annual burned area using the fourth-generation global fire emissions database (GFED4), J. Geophys. Res.-Biogeo., 118, 317–328, https://doi.org/10.1002/jgrg.20042, 2013.
Gilbert, R. O.: Statistical Methods for Environmental Pollution Monitoring, John Wiley & Sons, 354 pp., ISBN 9780471288787, 1987.
González Abad, G.: OMPS-NPP L2 NM Formaldehyde (HCHO) Total Column swath orbital V1 (OMPS_NPP_NMHCHO_L2), GES DISC [data set], https://disc.gsfc.nasa.gov/datasets/OMPS_NPP_NMHCHO_L2_1/summary (last access: 5 February 2024), 2022.
González Abad, G., Liu, X., Chance, K., Wang, H., Kurosu, T. P., and Suleiman, R.: Updated Smithsonian Astrophysical Observatory Ozone Monitoring Instrument (SAO OMI) formaldehyde retrieval, Atmos. Meas. Tech., 8, 19–32, https://doi.org/10.5194/amt-8-19-2015, 2015.
González Abad, G., Vasilkov, A., Seftor, C., Liu, X., and Chance, K.: Smithsonian Astrophysical Observatory Ozone Mapping and Profiler Suite (SAO OMPS) formaldehyde retrieval, Atmos. Meas. Tech., 9, 2797–2812, https://doi.org/10.5194/amt-9-2797-2016, 2016.
González Abad, G., Ayazpour, Z., Kwon, H.-A., Nowlan, C. R., Miller, C. E., Chong, H., Sun, K., Vigouroux, C., Liu, X., and Chance, K.: OMI Collection 4 Formaldehyde Retrievals: Towards a Multi-Sensor, Multi-Satellite and Multi-Decadal Dataset, in: AGU Fall Meeting Abstracts, Vol. 2022, A32F-1476, https://ui.adsabs.harvard.edu/abs/2022AGUFM.A32F1476G/abstract (last access: 5 February 2024), 2022 (data available at: https://waps.cfa.harvard.edu/sao_atmos/data/omi_hcho/OMI-HCHO-L2/).
Guenther, A., Karl, T., Harley, P., Wiedinmyer, C., Palmer, P. I., and Geron, C.: Estimates of global terrestrial isoprene emissions using MEGAN (Model of Emissions of Gases and Aerosols from Nature), Atmos. Chem. Phys., 6, 3181–3210, https://doi.org/10.5194/acp-6-3181-2006, 2006.
Guenther, A. B., Jiang, X., Heald, C. L., Sakulyanontvittaya, T., Duhl, T., Emmons, L. K., and Wang, X.: The Model of Emissions of Gases and Aerosols from Nature version 2.1 (MEGAN2.1): an extended and updated framework for modeling biogenic emissions, Geosci. Model Dev., 5, 1471–1492, https://doi.org/10.5194/gmd-5-1471-2012, 2012.
Hakola, H., Tarvainen, V., Laurila, T., Hiltunen, V., Hellén, H., and Keronen, P.: Seasonal variation of VOC concentrations above a boreal coniferous forest, Atmos. Environ., 37, 1623–1634, https://doi.org/10.1016/S1352-2310(03)00014-1, 2003.
Hakola, H., Taipale, D., Praplan, A., Schallhart, S., Thomas, S., Tykkä, T., Helin, A., Bäck, J., and Hellén, H.: Emissions of volatile organic compounds from Norway spruce and potential atmospheric impacts, Frontiers in Forests and Global Change, 6, 1116414, https://doi.org/10.3389/ffgc.2023.1116414, 2023.
Harrison, S. P., Morfopoulos, C., Dani, K. G. S., Prentice, I. C., Arneth, A., Atwell, B. J., Barkley, M. P., Leishman, M. R., Loreto, F., Medlyn, B. E., Niinemets, Ü., Possell, M., Peñuelas, J., and Wright, I. J.: Volatile isoprenoid emissions from plastid to planet, New Phytol., 197, 49–57, https://doi.org/10.1111/nph.12021, 2013.
Hellén, H., Schallhart, S., Praplan, A. P., Tykkä, T., Aurela, M., Lohila, A., and Hakola, H.: Sesquiterpenes dominate monoterpenes in northern wetland emissions, Atmos. Chem. Phys., 20, 7021–7034, https://doi.org/10.5194/acp-20-7021-2020, 2020.
Holmes, C. D., Prather, M. J., Søvde, O. A., and Myhre, G.: Future methane, hydroxyl, and their uncertainties: key climate and emission parameters for future predictions, Atmos. Chem. Phys., 13, 285–302, https://doi.org/10.5194/acp-13-285-2013, 2013.
Hu, L., Millet, D. B., Baasandorj, M., Griffis, T. J., Turner, P., Helmig, D., Curtis, A. J., and Hueber, J.: Isoprene emissions and impacts over an ecological transition region in the U.S. Upper Midwest inferred from tall tower measurements, J. Geophys. Res.-Atmos., 120, 3553–3571, https://doi.org/10.1002/2014JD022732, 2015.
Janson, R., De Serves, C., and Romero, R.: Emission of isoprene and carbonyl compounds from a boreal forest and wetland in Sweden, Agr. Forest Meteorol., 98–99, 671–681, https://doi.org/10.1016/S0168-1923(99)00134-3, 1999.
Jin, L., Permar, W., Selimovic, V., Ketcherside, D., Yokelson, R. J., Hornbrook, R. S., Apel, E. C., Ku, I.-T., Collett Jr., J. L., Sullivan, A. P., Jaffe, D. A., Pierce, J. R., Fried, A., Coggon, M. M., Gkatzelis, G. I., Warneke, C., Fischer, E. V., and Hu, L.: Constraining emissions of volatile organic compounds from western US wildfires with WE-CAN and FIREX-AQ airborne observations, Atmos. Chem. Phys., 23, 5969–5991, https://doi.org/10.5194/acp-23-5969-2023, 2023.
Jung, Y., González Abad, G., Nowlan, C. R., Chance, K., Liu, X., Torres, O., and Ahn, C.: Explicit Aerosol Correction of OMI Formaldehyde Retrievals, Earth Space Sci., 6, 2087–2105, https://doi.org/10.1029/2019EA000702, 2019.
Juráň, S., Pallozzi, E., Guidolotti, G., Fares, S., Šigut, L., Calfapietra, C., Alivernini, A., Savi, F., Večeřová, K., Křůmal, K., Večeřa, Z., and Urban, O.: Fluxes of biogenic volatile organic compounds above temperate Norway spruce forest of the Czech Republic, Agr. Forest Meteorol., 232, 500–513, https://doi.org/10.1016/j.agrformet.2016.10.005, 2017.
Kaiser, J., Jacob, D. J., Zhu, L., Travis, K. R., Fisher, J. A., González Abad, G., Zhang, L., Zhang, X., Fried, A., Crounse, J. D., St. Clair, J. M., and Wisthaler, A.: High-resolution inversion of OMI formaldehyde columns to quantify isoprene emission on ecosystem-relevant scales: application to the southeast US, Atmos. Chem. Phys., 18, 5483–5497, https://doi.org/10.5194/acp-18-5483-2018, 2018.
Karl, T., Fall, R., Rosenstiel, T., Prazeller, P., Larsen, B., Seufert, G., and Lindinger, W.: On-line analysis of the 13CO2 labeling of leaf isoprene suggests multiple subcellular origins of isoprene precursors, Planta, 215, 894–905, https://doi.org/10.1007/s00425-002-0825-2, 2002.
Kelly, R., Chipman, M. L., Higuera, P. E., Stefanova, I., Brubaker, L. B., and Hu, F. S.: Recent burning of boreal forests exceeds fire regime limits of the past 10,000 years, P. Natl. Acad. Sci. USA, 110, 13055–13060, https://doi.org/10.1073/pnas.1305069110, 2013.
Kramshøj, M., Vedel-Petersen, I., Schollert, M., Rinnan, Å., Nymand, J., Ro-Poulsen, H., and Rinnan, R.: Large increases in Arctic biogenic volatile emissions are a direct effect of warming, Nat. Geosci., 9, 349–352, https://doi.org/10.1038/ngeo2692, 2016.
Kroll, J. H. and Seinfeld, J. H.: Chemistry of secondary organic aerosol: Formation and evolution of low-volatility organics in the atmosphere, Atmos. Environ., 42, 3593–3624, https://doi.org/10.1016/j.atmosenv.2008.01.003, 2008.
Kwon, H.-A., Abad, G. G., Nowlan, C. R., Chong, H., Souri, A. H., Vigouroux, C., Röhling, A., Kivi, R., Makarova, M., Notholt, J., Palm, M., Winkler, H., Té, Y., Sussmann, R., Rettinger, M., Mahieu, E., Strong, K., Lutsch, E., Yamanouchi, S., Nagahama, T., Hannigan, J. W., Zhou, M., Murata, I., Grutter, M., Stremme, W., De Mazière, M., Jones, N., Smale, D., and Morino, I.: Validation of OMPS Suomi NPP and OMPS NOAA-20 Formaldehyde Total Columns With NDACC FTIR Observations, Earth Space Sci., 10, e2022EA002778, https://doi.org/10.1029/2022EA002778, 2023.
Lappalainen, H. K., Sevanto, S., Bäck, J., Ruuskanen, T. M., Kolari, P., Taipale, R., Rinne, J., Kulmala, M., and Hari, P.: Day-time concentrations of biogenic volatile organic compounds in a boreal forest canopy and their relation to environmental and biological factors, Atmos. Chem. Phys., 9, 5447–5459, https://doi.org/10.5194/acp-9-5447-2009, 2009.
Lawrence, D. M., Oleson, K. W., Flanner, M. G., Thornton, P. E., Swenson, S. C., Lawrence, P. J., Zeng, X., Yang, Z.-L., Levis, S., Sakaguchi, K., Bonan, G. B., and Slater, A. G.: Parameterization improvements and functional and structural advances in Version 4 of the Community Land Model, J. Adv. Model. Earth Sy., 3, M03001, https://doi.org/10.1029/2011MS000045, 2011.
Levelt, P. F., van den Oord, G. H. J., Dobber, M. R., Malkki, A., Huib Visser, Johan de Vries, Stammes, P., Lundell, J. O. V., and Saari, H.: The ozone monitoring instrument, IEEE T. Geosci. Remote, 44, 1093–1101, https://doi.org/10.1109/TGRS.2006.872333, 2006.
Li, J., Mao, J., Min, K.-E., Washenfelder, R. A., Brown, S. S., Kaiser, J., Keutsch, F. N., Volkamer, R., Wolfe, G. M., Hanisco, T. F., Pollack, I. B., Ryerson, T. B., Graus, M., Gilman, J. B., Lerner, B. M., Warneke, C., de Gouw, J. A., Middlebrook, A. M., Liao, J., Welti, A., Henderson, B. H., McNeill, V. F., Hall, S. R., Ullmann, K., Donner, L. J., Paulot, F., and Horowitz, L. W.: Observational constraints on glyoxal production from isoprene oxidation and its contribution to organic aerosol over the Southeast United States, J. Geophys. Res.-Atmos., 121, 9849–9861, https://doi.org/10.1002/2016JD025331, 2016.
Liao, J., Wolfe, G. M., Hannun, R. A., St. Clair, J. M., Hanisco, T. F., Gilman, J. B., Lamplugh, A., Selimovic, V., Diskin, G. S., Nowak, J. B., Halliday, H. S., DiGangi, J. P., Hall, S. R., Ullmann, K., Holmes, C. D., Fite, C. H., Agastra, A., Ryerson, T. B., Peischl, J., Bourgeois, I., Warneke, C., Coggon, M. M., Gkatzelis, G. I., Sekimoto, K., Fried, A., Richter, D., Weibring, P., Apel, E. C., Hornbrook, R. S., Brown, S. S., Womack, C. C., Robinson, M. A., Washenfelder, R. A., Veres, P. R., and Neuman, J. A.: Formaldehyde evolution in US wildfire plumes during the Fire Influence on Regional to Global Environments and Air Quality experiment (FIREX-AQ), Atmos. Chem. Phys., 21, 18319–18331, https://doi.org/10.5194/acp-21-18319-2021, 2021.
Lindwall, F., Schollert, M., Michelsen, A., Blok, D., and Rinnan, R.: Fourfold higher tundra volatile emissions due to arctic summer warming, J. Geophys. Res.-Biogeo., 121, 895–902, https://doi.org/10.1002/2015JG003295, 2016a.
Lindwall, F., Svendsen, S. S., Nielsen, C. S., Michelsen, A., and Rinnan, R.: Warming increases isoprene emissions from an arctic fen, Sci. Total Environ., 553, 297–304, https://doi.org/10.1016/j.scitotenv.2016.02.111, 2016b.
Liu, X., Huey, L. G., Yokelson, R. J., Selimovic, V., Simpson, I. J., Müller, M., Jimenez, J. L., Campuzano-Jost, P., Beyersdorf, A. J., Blake, D. R., Butterfield, Z., Choi, Y., Crounse, J. D., Day, D. A., Diskin, G. S., Dubey, M. K., Fortner, E., Hanisco, T. F., Hu, W., King, L. E., Kleinman, L., Meinardi, S., Mikoviny, T., Onasch, T. B., Palm, B. B., Peischl, J., Pollack, I. B., Ryerson, T. B., Sachse, G. W., Sedlacek, A. J., Shilling, J. E., Springston, S., Clair, J. M. S., Tanner, D. J., Teng, A. P., Wennberg, P. O., Wisthaler, A., and Wolfe, G. M.: Airborne measurements of western U.S. wildfire emissions: Comparison with prescribed burning and air quality implications, J. Geophys. Res.-Atmos., 122, 6108–6129, https://doi.org/10.1002/2016JD026315, 2017.
Magney, T. S., Bowling, D. R., Logan, B. A., Grossmann, K., Stutz, J., Blanken, P. D., Burns, S. P., Cheng, R., Garcia, M. A., Köhler, P., Lopez, S., Parazoo, N. C., Raczka, B., Schimel, D., and Frankenberg, C.: Mechanistic evidence for tracking the seasonality of photosynthesis with solar-induced fluorescence, P. Natl. Acad. Sci. USA, 116, 11640–11645, https://doi.org/10.1073/pnas.1900278116, 2019.
Mao, J., Jacob, D. J., Evans, M. J., Olson, J. R., Ren, X., Brune, W. H., Clair, J. M. St., Crounse, J. D., Spencer, K. M., Beaver, M. R., Wennberg, P. O., Cubison, M. J., Jimenez, J. L., Fried, A., Weibring, P., Walega, J. G., Hall, S. R., Weinheimer, A. J., Cohen, R. C., Chen, G., Crawford, J. H., McNaughton, C., Clarke, A. D., Jaeglé, L., Fisher, J. A., Yantosca, R. M., Le Sager, P., and Carouge, C.: Chemistry of hydrogen oxide radicals (HOx) in the Arctic troposphere in spring, Atmos. Chem. Phys., 10, 5823–5838, https://doi.org/10.5194/acp-10-5823-2010, 2010.
Mao, J., Paulot, F., Jacob, D. J., Cohen, R. C., Crounse, J. D., Wennberg, P. O., Keller, C. A., Hudman, R. C., Barkley, M. P., and Horowitz, L. W.: Ozone and organic nitrates over the eastern United States: Sensitivity to isoprene chemistry, J. Geophys. Res.-Atmos., 118, 11256–11268, https://doi.org/10.1002/jgrd.50817, 2013.
Mao, J., Carlton, A., Cohen, R. C., Brune, W. H., Brown, S. S., Wolfe, G. M., Jimenez, J. L., Pye, H. O. T., Lee Ng, N., Xu, L., McNeill, V. F., Tsigaridis, K., McDonald, B. C., Warneke, C., Guenther, A., Alvarado, M. J., de Gouw, J., Mickley, L. J., Leibensperger, E. M., Mathur, R., Nolte, C. G., Portmann, R. W., Unger, N., Tosca, M., and Horowitz, L. W.: Southeast Atmosphere Studies: learning from model-observation syntheses, Atmos. Chem. Phys., 18, 2615–2651, https://doi.org/10.5194/acp-18-2615-2018, 2018.
Marais, E. A., Jacob, D. J., Kurosu, T. P., Chance, K., Murphy, J. G., Reeves, C., Mills, G., Casadio, S., Millet, D. B., Barkley, M. P., Paulot, F., and Mao, J.: Isoprene emissions in Africa inferred from OMI observations of formaldehyde columns, Atmos. Chem. Phys., 12, 6219–6235, https://doi.org/10.5194/acp-12-6219-2012, 2012.
Millet, D. B., Jacob, D. J., Boersma, K. F., Fu, T.-M., Kurosu, T. P., Chance, K., Heald, C. L., and Guenther, A.: Spatial distribution of isoprene emissions from North America derived from formaldehyde column measurements by the OMI satellite sensor, J. Geophys. Res., 113, D02307, https://doi.org/10.1029/2007JD008950, 2008.
Morfopoulos, C., Müller, J.-F., Stavrakou, T., Bauwens, M., De Smedt, I., Friedlingstein, P., Prentice, I. C., and Regnier, P.: Vegetation responses to climate extremes recorded by remotely sensed atmospheric formaldehyde, Glob. Change Biol., 28, 1809–1822, https://doi.org/10.1111/gcb.15880, 2022.
Mu, M., Randerson, J. T., van der Werf, G. R., Giglio, L., Kasibhatla, P., Morton, D., Collatz, G. J., DeFries, R. S., Hyer, E. J., Prins, E. M., Griffith, D. W. T., Wunch, D., Toon, G. C., Sherlock, V., and Wennberg, P. O.: Daily and 3-hourly variability in global fire emissions and consequences for atmospheric model predictions of carbon monoxide, J. Geophys. Res.-Atmos., 116, D24303, https://doi.org/10.1029/2011JD016245, 2011.
Nowlan, C. R., González Abad, G., Kwon, H.-A., Ayazpour, Z., Chan Miller, C., Chance, K., Chong, H., Liu, X., O'Sullivan, E., Wang, H., Zhu, L., De Smedt, I., Jaross, G., Seftor, C., and Sun, K.: Global Formaldehyde Products From the Ozone Mapping and Profiler Suite (OMPS) Nadir Mappers on Suomi NPP and NOAA-20, Earth Space Sci., 10, e2022EA002643, https://doi.org/10.1029/2022EA002643, 2023.
Oleson, K., Lawrence, M., Bonan, B., Drewniak, B., Huang, M., Koven, D., Levis, S., Li, F., Riley, J., Subin, M., Swenson, S., Thornton, E., Bozbiyik, A., Fisher, R., Heald, L., Kluzek, E., Lamarque, J.-F., Lawrence, J., Leung, R., Lipscomb, W., Muszala, P., Ricciuto, M., Sacks, J., Sun, Y., Tang, J., and Yang, Z.-L.: Technical description of version 4.5 of the Community Land Model (CLM), No. NCAR/TN-503+STR, https://doi.org/10.5065/D6RR1W7M, 2013.
Palmer, P. I., Jacob, D. J., Chance, K., Martin, R. V., Spurr, R. J. D., Kurosu, T. P., Bey, I., Yantosca, R., Fiore, A., and Li, Q.: Air mass factor formulation for spectroscopic measurements from satellites: Application to formaldehyde retrievals from the Global Ozone Monitoring Experiment, J. Geophys. Res., 106, 14539–14550, https://doi.org/10.1029/2000JD900772, 2001.
Park, R. J., Jacob, D. J., Field, B. D., Yantosca, R. M., and Chin, M.: Natural and transboundary pollution influences on sulfate-nitrate-ammonium aerosols in the United States: Implications for policy, J. Geophys. Res.-Atmos., 109, D15204, https://doi.org/10.1029/2003JD004473, 2004.
Permar, W., Wang, Q., Selimovic, V., Wielgasz, C., Yokelson, R. J., Hornbrook, R. S., Hills, A. J., Apel, E. C., Ku, I., Zhou, Y., Sive, B. C., Sullivan, A. P., Collett, J. L., Campos, T. L., Palm, B. B., Peng, Q., Thornton, J. A., Garofalo, L. A., Farmer, D. K., Kreidenweis, S. M., Levin, E. J. T., DeMott, P. J., Flocke, F., Fischer, E. V., and Hu, L.: Emissions of Trace Organic Gases From Western U.S. Wildfires Based on WE-CAN Aircraft Measurements, J. Geophys. Res.-Atmos., 126, e2020JD033838, https://doi.org/10.1029/2020JD033838, 2021.
Porcar-Castell, A., Tyystjärvi, E., Atherton, J., van der Tol, C., Flexas, J., Pfündel, E. E., Moreno, J., Frankenberg, C., and Berry, J. A.: Linking chlorophyll a fluorescence to photosynthesis for remote sensing applications: mechanisms and challenges, J. Exp. Bot., 65, 4065–4095, https://doi.org/10.1093/jxb/eru191, 2014.
Potosnak, M. J., Baker, B. M., LeStourgeon, L., Disher, S. M., Griffin, K. L., Bret-Harte, M. S., and Starr, G.: Isoprene emissions from a tundra ecosystem, Biogeosciences, 10, 871–889, https://doi.org/10.5194/bg-10-871-2013, 2013.
Randerson, J. T., van der Werf, G. R., Giglio, L., Collatz, G. J., and Kasibhatla, P. S.: Global Fire Emissions Database, Version 4.1 (GFEDv4), ORNL DAAC [data set], https://doi.org/10.3334/ORNLDAAC/1293, 2017.
Rantala, P., Aalto, J., Taipale, R., Ruuskanen, T. M., and Rinne, J.: Annual cycle of volatile organic compound exchange between a boreal pine forest and the atmosphere, Biogeosciences, 12, 5753–5770, https://doi.org/10.5194/bg-12-5753-2015, 2015.
Riedel, K., Weller, R., and Schrems, O.: Variability of formaldehyde in the Antarctic troposphere, Phys. Chem. Chem. Phys., 1, 5523–5527, https://doi.org/10.1039/a905368i, 1999.
Rienecker, M. M., Suarez, M. J., Gelaro, R., Todling, R., Bacmeister, J., Liu, E., Bosilovich, M. G., Schubert, S. D., Takacs, L., Kim, G.-K., Bloom, S., Chen, J., Collins, D., Conaty, A., da Silva, A., Gu, W., Joiner, J., Koster, R. D., Lucchesi, R., Molod, A., Owens, T., Pawson, S., Pegion, P., Redder, C. R., Reichle, R., Robertson, F. R., Ruddick, A. G., Sienkiewicz, M., and Woollen, J.: MERRA: NASA's Modern-Era Retrospective Analysis for Research and Applications, J. Climate, 24, 3624–3648, https://doi.org/10.1175/JCLI-D-11-00015.1, 2011.
Rinne, J., Hakola, H., Laurila, T., and Rannik, Ü.: Canopy scale monoterpene emissions of Pinus sylvestris dominated forests, Atmos. Environ., 34, 1099–1107, https://doi.org/10.1016/S1352-2310(99)00335-0, 2000.
Schollert, M., Burchard, S., Faubert, P., Michelsen, A., and Rinnan, R.: Biogenic volatile organic compound emissions in four vegetation types in high arctic Greenland, Polar Biol., 37, 237–249, https://doi.org/10.1007/s00300-013-1427-0, 2014.
Seco, R., Holst, T., Davie-Martin, C. L., Simin, T., Guenther, A., Pirk, N., Rinne, J., and Rinnan, R.: Strong isoprene emission response to temperature in tundra vegetation, P. Natl. Acad. Sci. USA, 119, e2118014119, https://doi.org/10.1073/pnas.2118014119, 2022.
Selimovic, V., Ketcherside, D., Chaliyakunnel, S., Wielgasz, C., Permar, W., Angot, H., Millet, D. B., Fried, A., Helmig, D., and Hu, L.: Atmospheric biogenic volatile organic compounds in the Alaskan Arctic tundra: constraints from measurements at Toolik Field Station, Atmos. Chem. Phys., 22, 14037–14058, https://doi.org/10.5194/acp-22-14037-2022, 2022.
Spirig, C., Guenther, A., Greenberg, J. P., Calanca, P., and Tarvainen, V.: Tethered balloon measurements of biogenic volatile organic compounds at a Boreal forest site, Atmos. Chem. Phys., 4, 215–229, https://doi.org/10.5194/acp-4-215-2004, 2004.
Stavrakou, T., Müller, J.-F., De Smedt, I., Van Roozendael, M., van der Werf, G. R., Giglio, L., and Guenther, A.: Evaluating the performance of pyrogenic and biogenic emission inventories against one decade of space-based formaldehyde columns, Atmos. Chem. Phys., 9, 1037–1060, https://doi.org/10.5194/acp-9-1037-2009, 2009.
Stavrakou, T., Müller, J.-F., Bauwens, M., De Smedt, I., Van Roozendael, M., De Mazière, M., Vigouroux, C., Hendrick, F., George, M., Clerbaux, C., Coheur, P.-F., and Guenther, A.: How consistent are top-down hydrocarbon emissions based on formaldehyde observations from GOME-2 and OMI?, Atmos. Chem. Phys., 15, 11861–11884, https://doi.org/10.5194/acp-15-11861-2015, 2015.
Stavrakou, T., Müller, J.-F., Bauwens, M., Smedt, I. D., Roozendael, M. V., and Guenther, A.: Impact of Short-Term Climate Variability on Volatile Organic Compounds Emissions Assessed Using OMI Satellite Formaldehyde Observations, Geophys. Res. Lett., 45, 8681–8689, https://doi.org/10.1029/2018GL078676, 2018.
Tang, J., Schurgers, G., Valolahti, H., Faubert, P., Tiiva, P., Michelsen, A., and Rinnan, R.: Challenges in modelling isoprene and monoterpene emission dynamics of Arctic plants: a case study from a subarctic tundra heath, Biogeosciences, 13, 6651–6667, https://doi.org/10.5194/bg-13-6651-2016, 2016.
Tiiva, P., Faubert, P., Michelsen, A., Holopainen, T., Holopainen, J. K., and Rinnan, R.: Climatic warming increases isoprene emission from a subarctic heath, New Phytol., 180, 853–863, https://doi.org/10.1111/j.1469-8137.2008.02587.x, 2008.
Timkovsky, I. I., Elanskii, N. F., Skorokhod, A. I., and Shumskii, R. A.: Studying of biogenic volatile organic compounds in the atmosphere over Russia, Izv. Atmos. Ocean. Phys., 46, 319–327, https://doi.org/10.1134/S0001433810030059, 2010.
The International GEOS-Chem Community: geoschem/geos-chem: GEOS-Chem 12.7.2, Zenodo [code], https://doi.org/10.5281/zenodo.3701669, 2020.
Travis, K. R., Jacob, D. J., Fisher, J. A., Kim, P. S., Marais, E. A., Zhu, L., Yu, K., Miller, C. C., Yantosca, R. M., Sulprizio, M. P., Thompson, A. M., Wennberg, P. O., Crounse, J. D., St. Clair, J. M., Cohen, R. C., Laughner, J. L., Dibb, J. E., Hall, S. R., Ullmann, K., Wolfe, G. M., Pollack, I. B., Peischl, J., Neuman, J. A., and Zhou, X.: Why do models overestimate surface ozone in the Southeast United States?, Atmos. Chem. Phys., 16, 13561–13577, https://doi.org/10.5194/acp-16-13561-2016, 2016.
Valolahti, H., Kivimäenpää, M., Faubert, P., Michelsen, A., and Rinnan, R.: Climate change-induced vegetation change as a driver of increased subarctic biogenic volatile organic compound emissions, Glob. Change Biol., 21, 3478–3488, https://doi.org/10.1111/gcb.12953, 2015.
Vedel-Petersen, I., Schollert, M., Nymand, J., and Rinnan, R.: Volatile organic compound emission profiles of four common arctic plants, Atmos. Environ., 120, 117–126, https://doi.org/10.1016/j.atmosenv.2015.08.082, 2015.
Vigouroux, C., Langerock, B., Bauer Aquino, C. A., Blumenstock, T., Cheng, Z., De Mazière, M., De Smedt, I., Grutter, M., Hannigan, J. W., Jones, N., Kivi, R., Loyola, D., Lutsch, E., Mahieu, E., Makarova, M., Metzger, J.-M., Morino, I., Murata, I., Nagahama, T., Notholt, J., Ortega, I., Palm, M., Pinardi, G., Röhling, A., Smale, D., Stremme, W., Strong, K., Sussmann, R., Té, Y., van Roozendael, M., Wang, P., and Winkler, H.: TROPOMI–Sentinel-5 Precursor formaldehyde validation using an extensive network of ground-based Fourier-transform infrared stations, Atmos. Meas. Tech., 13, 3751–3767, https://doi.org/10.5194/amt-13-3751-2020, 2020.
Wang, M., Schurgers, G., Arneth, A., Ekberg, A., and Holst, T.: Seasonal variation in biogenic volatile organic compound (BVOC) emissions from Norway spruce in a Swedish boreal forest, Boreal Environ. Res., 22, 353–367, 2017.
van der Werf, G. R., Randerson, J. T., Giglio, L., van Leeuwen, T. T., Chen, Y., Rogers, B. M., Mu, M., van Marle, M. J. E., Morton, D. C., Collatz, G. J., Yokelson, R. J., and Kasibhatla, P. S.: Global fire emissions estimates during 1997–2016, Earth Syst. Sci. Data, 9, 697–720, https://doi.org/10.5194/essd-9-697-2017, 2017.
van Meeningen, Y., Wang, M., Karlsson, T., Seifert, A., Schurgers, G., Rinnan, R., and Holst, T.: Isoprenoid emission variation of Norway spruce across a European latitudinal transect, Atmos. Environ., 170, 45–57, https://doi.org/10.1016/j.atmosenv.2017.09.045, 2017.
Wolfe, G. M., Kaiser, J., Hanisco, T. F., Keutsch, F. N., de Gouw, J. A., Gilman, J. B., Graus, M., Hatch, C. D., Holloway, J., Horowitz, L. W., Lee, B. H., Lerner, B. M., Lopez-Hilifiker, F., Mao, J., Marvin, M. R., Peischl, J., Pollack, I. B., Roberts, J. M., Ryerson, T. B., Thornton, J. A., Veres, P. R., and Warneke, C.: Formaldehyde production from isoprene oxidation across NOx regimes, Atmos. Chem. Phys., 16, 2597–2610, https://doi.org/10.5194/acp-16-2597-2016, 2016.
Yu, L., Wen, J., Chang, C. Y., Frankenberg, C., and Sun, Y.: High Resolution Global Contiguous SIF Estimates from OCO-2 SIF and MODIS, Version 2, ORNL DAAC [data set], https://doi.org/10.3334/ORNLDAAC/1863, 2021.
Yurganov, L. and Rakitin, V.: Two Decades of Satellite Observations of Carbon Monoxide Confirm the Increase in Northern Hemispheric Wildfires, Atmosphere, 13, 1479, https://doi.org/10.3390/atmos13091479, 2022.
Zhang, Y., Li, R., Min, Q., Bo, H., Fu, Y., Wang, Y., and Gao, Z.: The Controlling Factors of Atmospheric Formaldehyde (HCHO) in Amazon as Seen From Satellite, Earth Space Sci., 6, 959–971, https://doi.org/10.1029/2019EA000627, 2019.
Zhao, T.: Data used in the work “Zhao and Mao 2023: Interannual variability of summertime formaldehyde (HCHO) vertical column density and its main drivers in northern high latitudes”, Figshare [data set], https://doi.org/10.6084/m9.figshare.23599566.v1, 2023a.
Zhao, T.: Holton1/Codes-for-HCHO-interannual-variability-in-northern-high-latitudes: Interannual variability of summertime formaldehyde (HCHO) vertical column density and its main drivers in northern high latitudes, Zenodo [code], https://doi.org/10.5281/zenodo.8094844, 2023b.
Zhao, T., Mao, J., Simpson, W. R., De Smedt, I., Zhu, L., Hanisco, T. F., Wolfe, G. M., St. Clair, J. M., González Abad, G., Nowlan, C. R., Barletta, B., Meinardi, S., Blake, D. R., Apel, E. C., and Hornbrook, R. S.: Source and variability of formaldehyde (HCHO) at northern high latitudes: an integrated satellite, aircraft, and model study, Atmos. Chem. Phys., 22, 7163–7178, https://doi.org/10.5194/acp-22-7163-2022, 2022.
Zheng, Y., Unger, N., Barkley, M. P., and Yue, X.: Relationships between photosynthesis and formaldehyde as a probe of isoprene emission, Atmos. Chem. Phys., 15, 8559–8576, https://doi.org/10.5194/acp-15-8559-2015, 2015.
Zheng, Y., Unger, N., Tadić, J. M., Seco, R., Guenther, A. B., Barkley, M. P., Potosnak, M. J., Murray, L. T., Michalak, A. M., Qiu, X., Kim, S., Karl, T., Gu, L., and Pallardy, S. G.: Drought impacts on photosynthesis, isoprene emission and atmospheric formaldehyde in a mid-latitude forest, Atmos. Environ., 167, 190–201, https://doi.org/10.1016/j.atmosenv.2017.08.017, 2017.
Zheng, Y., Thornton, J. A., Ng, N. L., Cao, H., Henze, D. K., McDuffie, E. E., Hu, W., Jimenez, J. L., Marais, E. A., Edgerton, E., and Mao, J.: Long-term observational constraints of organic aerosol dependence on inorganic species in the southeast US, Atmos. Chem. Phys., 20, 13091–13107, https://doi.org/10.5194/acp-20-13091-2020, 2020.
Zhou, P., Ganzeveld, L., Taipale, D., Rannik, Ü., Rantala, P., Rissanen, M. P., Chen, D., and Boy, M.: Boreal forest BVOC exchange: emissions versus in-canopy sinks, Atmos. Chem. Phys., 17, 14309–14332, https://doi.org/10.5194/acp-17-14309-2017, 2017.
Zhu, L., Jacob, D. J., Kim, P. S., Fisher, J. A., Yu, K., Travis, K. R., Mickley, L. J., Yantosca, R. M., Sulprizio, M. P., De Smedt, I., González Abad, G., Chance, K., Li, C., Ferrare, R., Fried, A., Hair, J. W., Hanisco, T. F., Richter, D., Jo Scarino, A., Walega, J., Weibring, P., and Wolfe, G. M.: Observing atmospheric formaldehyde (HCHO) from space: validation and intercomparison of six retrievals from four satellites (OMI, GOME2A, GOME2B, OMPS) with SEAC4RS aircraft observations over the southeast US, Atmos. Chem. Phys., 16, 13477–13490, https://doi.org/10.5194/acp-16-13477-2016, 2016.
Zhu, L., González Abad, G., Nowlan, C. R., Chan Miller, C., Chance, K., Apel, E. C., DiGangi, J. P., Fried, A., Hanisco, T. F., Hornbrook, R. S., Hu, L., Kaiser, J., Keutsch, F. N., Permar, W., St. Clair, J. M., and Wolfe, G. M.: Validation of satellite formaldehyde (HCHO) retrievals using observations from 12 aircraft campaigns, Atmos. Chem. Phys., 20, 12329–12345, https://doi.org/10.5194/acp-20-12329-2020, 2020.
- Abstract
- Introduction
- Observations and model
- Evaluation of the spatial distribution of HCHO VCD and BVOC emissions
- Examination of the interannual variabilities of HCHO VCD
- SIF evaluation of dVCDBio,GC interannual variability
- Conclusions and discussions
- Code and data availability
- Author contributions
- Competing interests
- Disclaimer
- Acknowledgements
- Financial support
- Review statement
- References
- Supplement