the Creative Commons Attribution 4.0 License.
the Creative Commons Attribution 4.0 License.
Shallow- and deep-convection characteristics in the greater Houston, Texas, area using cell tracking methodology
Kristofer S. Tuftedal
Bernat Puigdomènech Treserras
Mariko Oue
Pavlos Kollias
The convective lifecycle, from initiation to maturity and dissipation, is driven by a combination of kinematic, thermodynamic, microphysical, and radiative processes that are strongly coupled and variable in time and space. Weather radars have been traditionally used to provide various convective-cloud characteristics. Here, we analyzed climatological convective-cell radar characteristics to obtain and assess the diurnal cycles of three convective-cell types – shallow, modest deep, and vigorous deep convective cells – that formed in the greater Houston area, using the National Weather Service radar from Houston, Texas, and a multi-cell identification and tracking algorithm. The examined dataset spans 4 years (2018–2021) and covers the warm-season months (June to September) in those years. The analysis showed clear diurnal cycles in cell initiation (CI) consistent with the sea breeze circulation and showed diurnal and normalized lifetime relationships in cell evolution parameters (e.g., maximum reflectivity, echo-top height, Geostationary Operational Environmental Satellite-16 (GOES-16) channel 13 brightness temperature, and the height of maximum reflectivity). The cell evolution is well represented by relationships between (1) the height and value of the maximum radar reflectivity, (2) the minimum GOES-16 channel 13 brightness temperature and the maximum vertically integrated liquid, (3) the maximum reflectivity and columnar-average reflectivity, and (4) the echo-top ascent rate and cell lifetime. The relationships presented herein help to identify the cell lifecycle stages such as early shallow convection, vigorous vertical development, anvil development, and convective core dissipation. GOES-16 Aerosol Optical Depth values are also used as a proxy for cell initiation aerosol concentrations to investigate any potential relationships between initiation location and aerosol concentration. Overall, no significant relationships between initiation location and aerosol concentration were found for the three cell types investigated, but there are some minor differences in the pre-CI aerosol optical depth for vigorous deep convective cells.
- Article
(9637 KB) - Full-text XML
- BibTeX
- EndNote
Convection is one of the most important contributors to the Earth's climate system through its transport of heat, moisture, and momentum. These processes strongly depend on cloud evolution. While an ordinal convective-cloud model is proposed, the cloud evolution may vary depending on the environment, diurnal cycle, etc. (e.g., Bony et al., 2015; Fridlind et al., 2017; Ladino et al., 2017; Colin and Sherwood, 2021). These variabilities may cause large uncertainties in convective parameterizations in numerical climate and cloud models. Modeling studies have attempted to answer some of these outstanding questions (Lee et al., 2008; Zhu et al., 2012; Varble et al., 2014; Igel et al., 2015; Peters et al., 2019), but the general lack of high-quality observational data to compare with these modeling studies makes it difficult to assess the validity of the results presented therein. Previous modeling studies have tended to focus only on comparisons with observed reflectivity, which can be rather convoluted to use for microphysical analyses. However, recent work in simulating polarimetric variables using forward operators (Ryzhkov et al., 2011; Wolfensberger and Berne, 2018; Kumjian et al., 2019) may provide better insight into the changes in storm microphysics through comparisons with observed polarimetry.
The ongoing debate in the literature about warm- and cold-phase convective invigoration (i.e., whether aerosol particles invigorate convection through latent heating caused by condensation or freezing, respectively; Sheffield et al., 2015; Fan et al., 2018; Abbott and Cronin, 2021; Igel and van den Heever, 2021; Grabowski and Morrison, 2021) is one such example of the need for high-quality observational datasets to compare with modeling studies. While model-based studies may provide some context to the physical processes that occur within convection, their model intercomparisons also show inconsistency among the models and microphysical parameterizations. The collection of a robust observational dataset that can be used as an observational benchmark for modeling studies is challenging. Such a dataset requires a sufficiently large sample size of convective-cloud properties over a wide range of meteorological and aerosol conditions and convective-cell-centric methodologies rather than domain-averaging approaches that fail to capture the lifecycle of convective clouds.
To address some of the observational shortcomings and needs, a diverse, coordinated (interagency) effort took place in the greater Houston, Texas, metropolitan area and surrounding region from the summer of 2021 through the summer of 2022 to collect a comprehensive dataset of isolated convective cells (Jensen et al., 2022). These efforts include the Tracking Aerosol Convection Interactions Experiment (TRACER) supported by the United States Department of Energy (DOE) Atmospheric Radiation Measurement (ARM) facility and the National Science Foundation (NSF) Experiment of Sea Breeze Convection, Aerosols, Precipitation and Environment (ESCAPE) campaign. The study region was selected because it is warm and humid in the summer, commonly experiences onshore flow and sea-breeze-forced convection, and has variable aerosol concentrations along the Gulf Coast. Recent studies on convective cells that form in coastal regions have illustrated that these cells are less influenced by the synoptic-scale meteorological conditions than cells that exist in only maritime or continental environments (e.g., Bergemann and Jakob, 2016; Birch et al., 2016). The land–sea breeze circulation that develops in these regions has been shown to have a greater effect on local convection by acting as a forcing mechanism for convective initiation (CI) through an increase in surface convergence (Haurwitz, 1947; Rotunno, 1983). The study of convective cells that form under CI forced by land–sea breeze circulation can be used to more directly attribute convective characteristics to ongoing convective processes rather than the synoptic-scale meteorological conditions present. This lack of dependence on the larger-scale meteorology allows for more generalizable conclusions to be drawn for any convective characteristics presented herein.
Previous studies of long-term remote-sensing data collected in Houston suggest that variability in the convective-cloud microstructure, hydrometeor properties, and electrification is correlated to variability in aerosol conditions over and downwind of Houston (Hu et al., 2019a, b). In these studies, NEXRAD radar observations were used to track convective cells during different cloud condensation nuclei (CCN) conditions (satellite-retrieved; Rosenfeld et al., 2016) and to investigate how variability in cloud, precipitation, and lightning characteristics related to CCN conditions, though it neglected proper control of the meteorology. Also, a recent pilot study has identified the need to collect observations of convective clouds at temporal and spatial resolutions that are higher than are possible using the existing operational observations (Fridlind et al., 2019). Those studies show large variabilities of convective-cloud properties associated with cloud lifecycles. In addition, cloud lifecycles also vary from one individual cloud to another. These substantial variabilities make it prudent to analyze very large datasets of convective clouds to obtain more representative bulk statistics of these phenomena. This lack of generalizable data also hinders our ability to evaluate cloud model simulations.
Here, we add and expand on those previous studies by using a similar methodology but focusing on characteristics of both shallow and deep convection and utilizing an extensive convective-cell-centric methodology for the different types of isolated convection observed around the Houston metropolitan and surrounding areas. The climatologies of the observed characteristics of shallow and deep convection are derived from the National Weather Service (NWS) KHGX Weather Surveillance Radar–1988 Doppler (WSR-88D; Crum and Alberty, 1993; Radar Operations Center, 2022) and the Geostationary Operational Environmental Satellite-16 (GOES-16). Strict thresholding of the radar- and satellite-derived characteristics of tracked convective cells allows for the analysis of the behaviors of each case type (i.e., shallow, modest deep, and vigorous deep convection) distinct from one another. Sensitivity testing is also performed to determine how much the results presented herein vary with small variations in threshold selection. Section 2 outlines the data, threshold variables, and analysis methods used, Sect. 3 presents the analyses of these convective types, and Sect. 4 discusses the observations and results.
2.1 Domain and data
Our study domain was centered on the KHGX WSR-88D near Houston, Texas, and extended ± 125 km to the north, east, south, and west, creating a 250 km by 250 km domain. This region was selected because the coastline with the Gulf of Mexico generates regular land–sea breeze circulations which provide a forcing mechanism for CI. This domain also provides regions with relatively “pristine” and “polluted” aerosol regimes. For example, the area to the northeast of Houston is generally downstream of pollution sources, such as the Houston metropolitan area itself and oil refineries near Houston, allowing for the advection of this polluted air over this sub-region. The area to the southwest of Houston is generally upstream and made up of mostly rural land even further upstream, allowing the air there to be far less polluted. However, the general flow pattern described previously does not hold true for all cases and is not accounted for in these analyses (i.e., events where there is easterly flow at the surface). As such, flow patterns that deviate substantially from the general flow will introduce considerable error into any aerosol concentration relationships presented herein.
Data from KHGX and GOES-16 were collected for the period of June through September for the years 2018–2021, when convective initiation occurred during local daytime (09:00–21:00 CDT (central daylight time)). Initiation during local daytime was chosen to increase the likelihood that sea breeze propagation was a primary forcing mechanism for CI and to enable the analysis of GOES aerosol optical depth (AOD) data.
During the study period, the volume coverage patterns (VCPs) available to KHGX changed with the implementation of VCPs 215 (15 elevation angles from 0.5 and 19.5°) and 112 (14 elevation angles from 0.5 and 19.5°) and the removal of VCPs 11, 211, 21, and 221 (Radar Operations Center 2015; Zittel, 2019). Aside from these differing VCPs, different dynamic scanning techniques can adjust how the radar scans without changing the VCP (Chrisman, 2009, 2013, 2014, 2016). These differing VCPs and dynamic scanning techniques have an effect on the time required to complete a single VCP. Despite these variations in rescan time, the time required to complete any of these VCPs is on the order of approximately 5 min. These different VCPs also collect slightly different sets of elevation data, which can substantially affect the uncertainty in any analysis of height or vertically integrated liquid (VIL; Greene and Clark, 1972; Amburn and Wolf, 1997) presented herein.
The horizontal radar reflectivity factor (ZH) from KHGX was collected during normal weather surveillance operations and regridded to a 250 km by 250 km domain with 500 m by 500 m horizontal spacing for each case day considered, which was then used to estimate the VIL, radar-derived echo-top height (ETH), and radar-derived profile depth (Hcell). GOES-16 channel 13 cloud-top brightness temperature data (GOESBT) were regridded to the same grid as before and analyzed such that each 5 min image was linked to the KHGX scan time nearest to each GOESBT product time. Since KHGX and GOES-16 do not scan at the exact same time, some error may be introduced by the difference between product times. However, since both KHGX and GOES-16 scan at approximately 5 min intervals, the maximum difference between product times is approximately 2.5 min. The calculation of GOES-16 AOD data requires cloud-free pixels. In many cases, the location of cell initiation already contains some form of cloud cover (be it low-, middle-, or upper-level clouds) at the time of initiation, which inhibits AOD generation. When AOD values are generated, they are classified as low-, medium-, or high-quality returns. To ensure a large enough sample size, AOD data denoted as medium or high quality were temporally averaged for the 30 min preceding cell initiation at the location of cell initiation. We calculated VIL from the gridded ZH (with ZH capped at 56 dBZ, as done in Greene and Clark, 1972) data from KHGX using Eq. (1):
where imax is the total number of sweeps for a given VCP, Z is the radar reflectivity of a given sweep (i) in units of mm6 m−3, and dh is the vertical spacing between sweeps. VIL assumes a Marshall–Palmer drop-size distribution, which introduces uncertainty, since this relationship may not be completely valid for convective events in coastal regions. Other sources of uncertainty in VIL include beam spreading with increasing distance from the radar and data sparsity at high elevations within 30 km of KHGX. The uncertainty because of beam spreading with distance has been shown to be relatively small, but VIL within 30 km of the radar tends to be underestimated for 5 min WSR-88D VCPs (Oue et al., 2022).
2.2 Cell tracking
KHGX VIL and GOES-16 observations were used as input to a modified version of the multi-cell identification and tracking (MCIT) algorithm (Rosenfeld, 1987; Gagin et al., 1985; Hu et al., 2019a) to track all features with a VIL of ≥ −20 dB during that period. The specifics of the MCIT algorithm can be found in Sects. 2.3 to 2.4.2 in Hu et al. (2019a), and the modifications made to the algorithm are provided in detail in Lamer et al. (2023). The MCIT algorithm ingests time series of volume scans and tracks local maxima of VIL by identifying the two cells in consecutive radar scans that have a common maximum VIL (i.e., the areas of VIL have some overlap from one time to the next). To check for an overlap from one time step to the next, pySTEPS (Pulkkinen et al., 2019a, b) is used to compute velocity fields to find the shift in images. The current image is then checked against the advected cell from the computed velocity field for an overlap between the actual cell and the computed cell location. This tracking continues until the cell dies, splits, or merges. In addition to the KHGX data, we used the GOES-16 channel 13 cloud-top brightness temperature (GOESBT) to identify cold-topped and warm-topped cells. The initial analysis from the modified MCIT algorithm identified 1 664 215 features with a VIL value ≥ −20 dB during the analysis period.
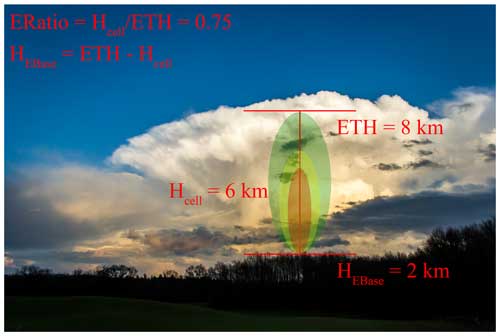
Figure 1A visual illustration of ERatio, Hcell, and HEBase. This image is meant to provide a visual context for these three variables. The red-, yellow-, and green-shaded areas represent arbitrary high-, medium-, and low-reflectivity contours, respectively. ERatio and HEBase are calculated using the maximum ETH and Hcell, which are radar-derived quantities and will always be less than the actual height of the storm top and the physical depth of a given cell, respectively.
2.3 Cell classification
To better characterize the evolution of each cell, we employed the following cloud properties.
-
ETH: the height at the middle of the highest gate with a detectable signal (ZH > −10 dBZ) from KHGX
-
Hcell: the depth between the top of the highest gate of the radar detectible signal for a cell and the bottom of the lowest gate of the radar-detectable signal (not corrected for increasing altitude with increasing range from the radar)
-
ERatio (Fig. 1): the ratio of the ETH to Hcell
-
the tracked cell area based on VIL (Area).
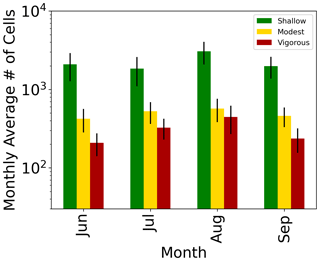
Figure 2Bar graphs showing the monthly average cell count for shallow (green), modest deep (yellow), and vigorous deep (red) convection. The vertical black lines at the top of each bar denote ± 1 standard deviation.
Table 1A table of the thresholds used to isolate shallow, modest deep, and vigorous deep convection from all tracked features from the modified version of the MCIT algorithm.
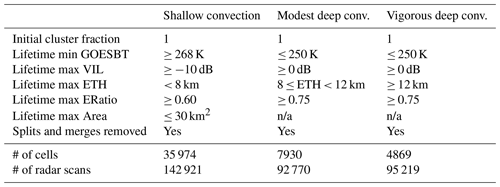
n/a: not applicable.
Using these properties, GOESBT, and VIL, we classified tracked features into three categories: (1) shallow, (2) modest deep, and (3) vigorous deep convective cells. Thresholds for the classification are listed in Table 1. These thresholds were empirically derived to avoid the false classification of cloud systems such as high cirrus clouds, mesoscale convective systems (MCSs), or large regions of stratiform precipitation. We also made the initial cluster fraction of the cell, which is the ratio of the area of a given cell to the area of the cluster (parent) of the cell at the beginning of the cell lifetime, equal to 1 (a value of 1 means that the cell is discrete). The split and merged cells are removed in this study using the process outlined in Lamer et al., (2023). The area threshold is only used to classify the shallow cells to ensure that these shallow features are not large regions of stratiform precipitation. This extensive thresholding removes noisy features, which are likely due to non-meteorological echoes (ground clutter, insects, etc.). Cells that have their “birth” or “death” at a domain edge are removed to avoid analyzing cases which are ongoing before or after entering or leaving the study domain. Cells which pass within 15 km of KHGX are also removed to mitigate the lack of data in the “cone of silence”.
The shallow and deep convective cells selected based on these thresholds were then analyzed separately and compared with one another. Sensitivity studies were also performed on each case type by varying all thresholds (except initial cluster fraction and split or merge status) by ± 5 % individually and simultaneously to observe any changes in the distributions of certain variables for each case type (see the Appendix).
2.4 Climatological analyses and statistical analysis
Cell properties introduced in Sects. 2.1 and 2.2 for all cells classified into the three categories during the 4-year observation period were examined to allow for bulk analyses of cell type characteristics. Analyses used herein include observations during specific times during the cells' lifetimes (such as the time of initiation), aggregates of all scans from the entire lifetimes of all cells of a given type, changes in variables over cell normalized lifetimes, diurnal changes in these variables, and spatial differences in initiation location. These analysis types enabled us to investigate how these cells changed as they grew, matured, and decayed, and they allowed for the direct comparison of how these case types differ from each other. To parse out any potential aerosol effects on shallow and deep CI and intensity, GOES-16 AOD data were analyzed. The nonparametric Mann–Whitney U test was used to investigate statistical differences between regional cell-initiation AOD distributions (Mann and Whitney, 1947).
3.1 Overall cell characteristics
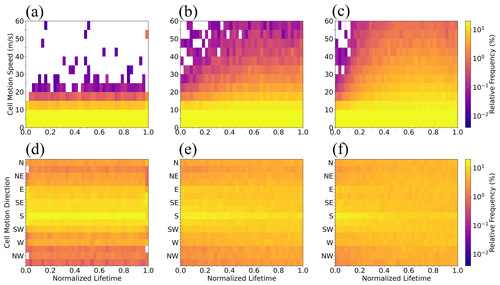
The monthly average number of cells varies little from month to month for June, July, August, and September, is highest in August, and shows no significant difference between months. The storm motion could be important to understanding storm evolution. To evaluate the primary speed and direction of cell motion, Fig. 3 shows frequency distributions of the propagation speed and direction as a function of normalized lifetime for the three cell types investigated. The frequencies shown are normalized by the total number of samples in each normalized lifetime bin (every 0.025). All cell types tend to have storm motions ranging primarily between southerly and easterly. Shallow convective cells, overall, move the slowest out of the three cell types and have less variability in speed than modest and vigorous deep convective cells. Over the lifetimes of these cells, shallow convective-cell speed varies little and is much slower when compared to deep convection. Overall, for the three categories, the convective cells mainly tend to have storm motions spanning from southwesterly to easterly. Larger variability in storm motion is found in the later period of the cell lifetime for modest and vigorous deep cells, with the greatest variability seen in the vigorous deep cells. This finding suggests that some of the vigorous deep convective cells may be supercellular in nature because of the large deviations from the early storm motions near the time of initiation, but this cannot be confirmed without further analyses of the detailed conditions for supercells, which is outside of the scope of this research. The direction of motion of sea-breeze-induced convective cells can depend on the low-level (i.e., 925 hPa) wind direction relative to the coastline (Die Wang, personal communication, 2023). The direction of cell motion (particularly early in the lifetimes of these cells) indicates the possibility that the sea breeze along the Gulf Coast plays a part in storm initiation and propagation, as these directions would be consistent with the inland propagation of the sea breeze, which propagates from southeast to northwest from the coastline.
3.2 Location and diurnal frequency of initiation
Figure 4 shows the diurnal frequency of initiation times as a function of local time. All cell types have their peak in initiation in the late morning or early afternoon hours, with initiation sharply decreasing as the day progresses. Overall, all types of convection in this region preferentially initiate in the late morning or early afternoon. However, there is a slight difference in peak time. Shallow convection and vigorous deep convection show earlier peaks in initiation time – between 10:00 and 14:00 CDT – when compared to the peak for modest deep convection, which is shifted slightly later (between 12:00 and 15:00 CDT; Fig. 4).
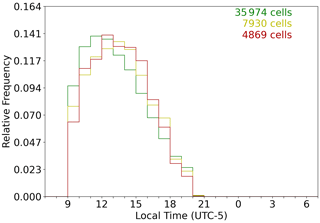
Figure 4The frequency of initiation as a function of local time of day for shallow convection (green), modest deep convection (yellow), and vigorous deep convection (red).
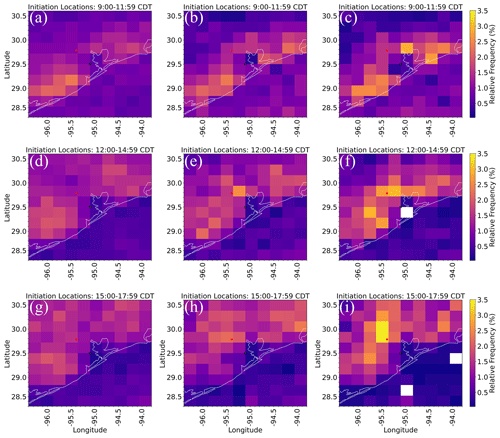
Figure 5Maps showing the spatial distribution of initiation locations normalized by the number of cells that initiated during the 3 h period 09:00 to 11:59 (a–c), 12:00 to 14:59 (d–f), and 15:00 to 17:59 (g–i) (all times are local time) for shallow (a, d, and g), modest deep (b, e, and h), and vigorous deep (c, f, and i) convection. The black (red) star in each plot denotes the location of KHGX (downtown Houston).
Figure 5 shows the initiation locations for shallow (Fig. 5a, d, and e), modest deep (Fig. 5b, e, and h), and vigorous deep (Fig. 5c, f, and i) convection. The three types all show a preference to initiate over land along the coastline to the southwest and northeast of Houston (within 100 km from the coast), with a local minimum in initiation over Galveston Bay (the large bay to the east of Houston), suggesting that a land–sea contrast – hence, a sea breeze – is a key factor in initiating convection in this area. The inland propagation of the sea breeze can also be observed based on the cells' overall speed and direction of travel early in their lifetimes (Fig. 3). One feature of note is the obvious preference for shallow CI to the southwest of Houston (Fig. 5a, d, and e). Another notable feature is that both moderate and vigorous deep convective-cell types show a local maximum over the Houston metropolitan area, which is especially apparent in vigorous deep convective cases. This initiation maximum could be caused by the enhancement from aerosol loading and/or urban heating but will need further examination in the future. There is an obvious inland shift in initiation location, most obviously for vigorous deep convection, from the 09:00–11:59 to 12:00–14:59 CDT period, further supporting the influence of the sea breeze on CI for all case types. The diurnal spatial shift in initiation location shows that the sea breeze is a key factor for CI along the coast. Figures 4 and 5 highlight that the early afternoon hours are the most preferable time for CI for all cell types. This is consistent with previous studies (e.g., Park et al., 2020).
The domain maximum in shallow CI to the southwest of Houston is also apparent in all periods except 18:00–20:59 CDT (not shown), but modest and vigorous deep convective types do not visually show the same southwest initiation preference. Rather, the two deep convective types (especially vigorous deep convection) show maxima in initiation over the Houston metropolitan area in the mid-to-late afternoon. We further speculate that this may be the result of urban heating allowing parcels to reach their convective temperatures during this time, even on days where the convective available potential energy (CAPE) is high but the convective inhibition (CIN) elsewhere in the domain is too strong to allow for other convection to initiate. However, as stated previously, further research is necessary to elucidate which mechanism(s) is (are) responsible for this local initiation maximum in deep convection.
3.3 Diurnal changes in cell characteristics
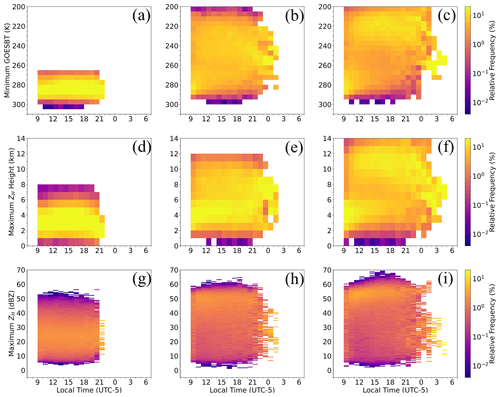
To assess the diurnal cycle of convective cells, we analyzed cell characteristics on an hour-by-hour basis for each scan for the cell duration over the course of the day. Figure 6 shows the diurnal trends in the distributions of GOESBT, the height of the cell maximum radar reflectivity (HdBZmax), and the cell maximum radar reflectivity (dBZmax) for all scans of all convective cases. For shallow cells, the GOESBT tends to be constant at around 285 K over time, and the majority of the cells have HdBZmax. In contrast, the two deep convection types exhibit similar maximum frequencies of GOESBT before noon, a substantial shift of the maximum frequency to ∼ 240 K for modest deep cells and ∼ 220 K for the vigorous deep cells around noon, and then a tapering off into the later evening and overnight hours. The frequency peak of HdBZmax for the modest and vigorous convective types is found below 6 km before noon, similar to that for shallow cells. It then shifts to 6–10 km until ∼ 18:00 CDT for modest deep cells and to 9–13 km until 23:00 CDT for vigorous deep cells. ETH also shows the same change in characteristics as GOESBT and HdBZmax (not shown), further supporting late morning or early afternoon initiation. There is little dependency of the maximum reflectivity on time.
3.4 Analysis of bulk cell type and normalized cell lifetime characteristics
Even though the peak in CI has been shown to occur in the late morning or early afternoon, and the peak in intensity occurs in the early to mid-afternoon, there may be diurnal variability and differences in cell lifetime duration that are unaccounted for. To observe how these cells behave over the courses of their respective lifetimes rather than the course of a given day, we analyzed these cells by aggregating scans during specific periods of their lifetimes, aggregating all scans of all cells of each type, and normalizing each by its respective lifetime. These analyses allow for direct comparisons of case types, regardless of what times the cells initiated or how long they lasted.
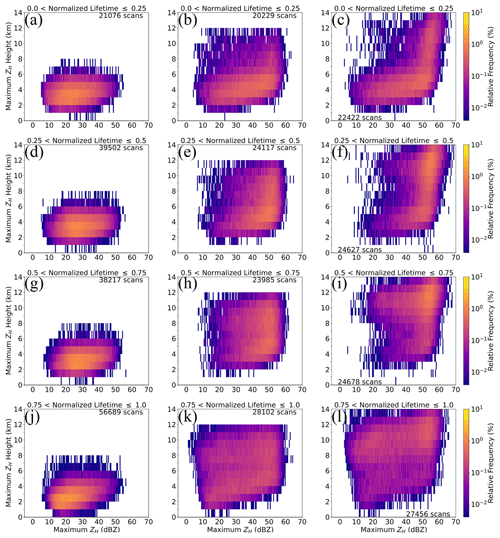
Figure 7The distributions (normalized by the number of scans considered for each cell lifetime segment) of dBZmax versus HdBZmax for the first 25 % (a–c), the second 25 % (d–f), the third 25 % (g–i), and the final 25 % of the cell lifetime (j–l) for shallow (a, d, g, and j), modest deep (b, e, h, and k), and vigorous deep (c, f, i, and l) convection.
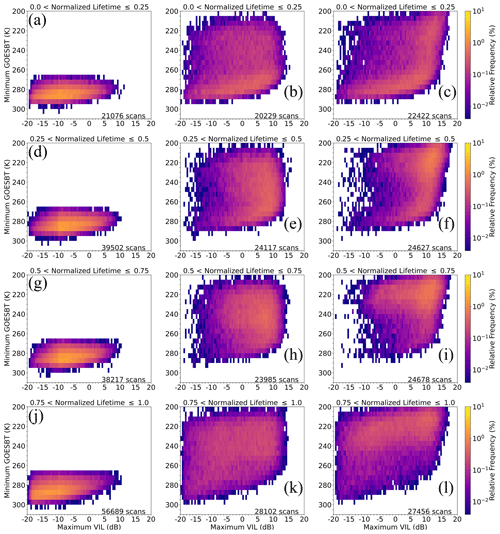
The growth and decay of these cells can be seen by analyzing the changes in the distributions of dBZmax, HdBZmax, maximum VIL, GOESBT, and the average of the maximum radar reflectivity for all columns within a given cell (dBZavg). Shallow convective cells show low dBZmax overall at low HdBZmax over the course of the entire cell lifetime (Fig. 7). Cell growth and decay is apparent, as HdBZmax and dBZmax shift to higher values overall during the first half of the cell lifetime and then decrease back to a distribution that looks most similar to cell initiation at the end of the cell lifetime. Modest and vigorous deep convection show clear signals of the birth (Fig. 7b and c), mature (Fig. 7e, f, h, and i), and dissipation (Fig. 7k and l) phases. Early in their lifetimes, these cell types are dominated by low dBZmax values at low HdBZmax, both of which increase considerably as the cells move into their mature phases. This trend is especially apparent in vigorous deep convection, where, early in the cell lifetime, there is a clear signal from initiation and some cells that have begun to grow (based on the secondary maximum at high dBZmax at high HdBZmax values). As these cells continue to mature, we see that HdBZmax remains high but that dBZmax begins to decrease. This is indicative of cells where the convective core has dissipated, leaving “orphan anvils” (Hitschfeld, 1960). However, HdBZmax appears to be slightly skewed by bright banding, as both modest and vigorous deep convection show rather unnatural-looking discontinuities in their distributions around 6 km above radar level. These discontinuity features are especially apparent in Fig. 8b and e.
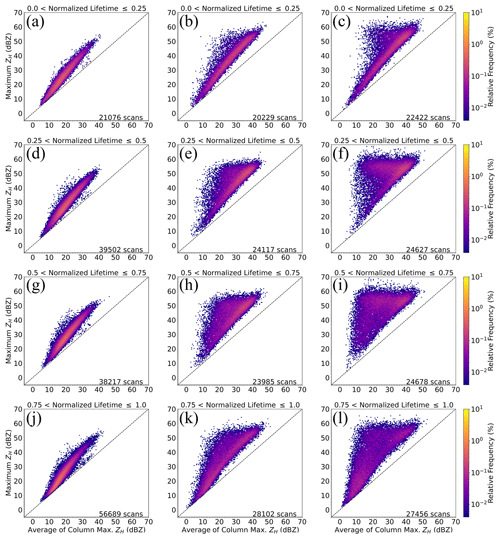
Figure 9As in Fig. 7, but for dBZavg versus dBZmax. The dashed line is the one-to-one line, where the values of dBZavg and dBZmax are equal.
Figure 8 supports the idea that the feature seen in Fig. 7 around 6 km above radar level is caused by the bright band, since there are no similar discontinuities in these distributions where GOESBT is warmer. However, this is one interpretation, and the discontinuities shown in Fig. 7 may instead be indicative of some ongoing storm physics. As with Fig. 7, Fig. 8 clearly shows the initiation, growth, and decay of these cell types. Shallow convective cells remain at a relatively warm GOESBT and a low maximum VIL throughout their lives, whereas modest and vigorous deep convection show clear growth from warm-GOESBT, low-maximum-VIL cells to cold-GOESBT, high-maximum-VIL cells. The rapid changes shown in Figs. 7 and 8 during the early stages of vigorous deep convection show the quick vertical evolution of these cells. Also shown (as in Fig. 7) is the dissipation phase, where GOESBT remains cold but VIL drops off considerably. This further supports the idea that this is the period when the convective cores have dissipated, leaving orphan anvils behind.
As stated previously, dBZavg is the average of the column ZH maxima within a given cell, and dBZmax is the cell maximum ZH for a given time. To investigate potential anvil generation, the distributions of dBZavg versus dBZmax are analyzed (Fig. 9). During the anvil generation phase, we would expect cells to be at their most intense states, meaning they would have a high value of dBZmax. We would also expect an increasingly large region of low ZH to form high aloft in the storm. This region of low ZH will skew dBZavg lower, while dBZmax will remain unaffected until the storm begins to dissipate. When comparing shallow and deep convection with this information in mind, the presence – apparent in deep convection – of low dBZavg and high dBZmax could be interpreted as anvil generation. As with previous figures in this section, these anvil signatures are especially apparent in vigorous deep convective cells. Early in their lifetimes, deep convective cells have not had enough time to grow to a state where anvil generation is possible (with the exception of the most intense cells). The vast majority of cells exist very near the one-to-one line of dBZavg versus dBZmax, with only a small subset of cells showing the high dBZmax and lower dBZavg values indicative of cells that are growing and beginning to produce anvils (Fig. 9c). As cells move into the mature life stage, the low-dBZavg, high-dBZmax region, where strong-anvil-generating cells are present, becomes the dominant regime for these cells (Fig. 9f and i). As cells decay, the distribution maximum shifts back down to near the one-to-one line (Fig. 9l), which would be suggestive of orphan anvils, given the analyses provided in the previous paragraphs. One feature of note in the vigorous deep convective cells during the dissipation phase is the secondary maximum at high dBZavg and high dBZmax. This feature represents the transition from the mature stage with a large dBZmax at a deeper depth within the clouds to the later stage (normalized lifetime: 0.75–1.0) with a lower dBZmax.
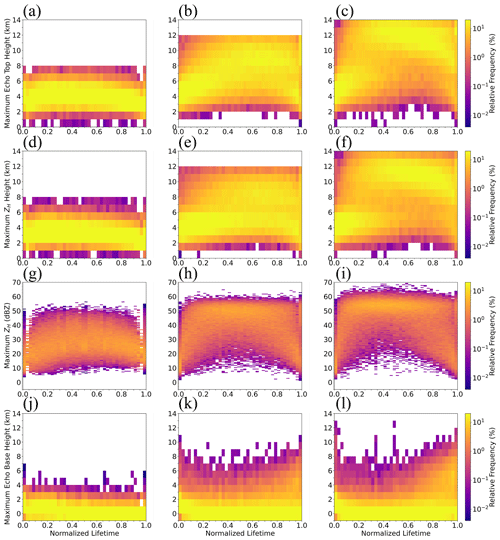
Figure 10The bin-normalized distributions for the evolutions of ETH (a–c), HdBZmax (d–f), dBZmax (g–i), and HEBase (j–l) over the normalized lifetime for shallow (a, d, g, and j), modest deep (b, e, h, and k), and vigorous deep (c, f, i, and l) convection.
Shallow convective cells reach their maximum ETH during approximately the first 10 % of their lives and appear to maintain this height until around 75 %, and then they gradually decrease in height until dissipation (Fig. 10a). Modest convective cells take substantially longer (∼ 35 %–55 % of the way through their lives) to reach their maximum ETH and then sharply decrease in height during the last 15 % (Fig. 10b). Vigorous convective cells, on the contrary, reach their maximum ETH quite quickly (within the first 15 % to 35 % of their lives), maintain a tall echo top, and finally gradually decrease in height to dissipation (Fig. 10c). The gradual decrease in ETH leading to dissipation is further indicative of convective anvils. In this case, we believe that this signal further supports the notion that we are observing convective-core dissipation, with orphan anvils left behind. Both HdBZmax and dBZmax show similar trends to ETH for all case types. Shallow convective cells reach their dBZmax and HdBZmax early in their normalized lifetimes (within the first 20 %–30 %), maintain those values, and then gradually decay to dissipation (Fig. 10d and g). Modest convection shows a gradual increase in HdBZmax that looks nearly identical to its maximum ETH. It appears that these cells reach their HdBZmax anywhere from 35 % to 65 % of the way through their lifetimes. However, dBZmax is reached much earlier (within the first 20 % of their lifetimes) than HdBZmax is (Fig. 10e and h). Vigorous deep convection reaches its HdBZmax much sooner in its normalized lifetime (between 10 % and 25 % of the normalized life), like ETH (Fig. 10f). As with modest deep convection, vigorous deep convection also reaches its dBZmax early in its life (within the first 20 % of its normalized life) and maintains this value until about halfway through its life, when dissipation begins (Fig. 10i). One feature that is seen in dBZmax and HdBZmax for both modest and vigorous deep convection is an apparent bimodality later in the cell lifetime (≳ 0.4), as it appears that some cells maintain high values of dBZmax and VIL (not shown) at higher altitudes (∼ 9 km) all the way up to dissipation (Fig. 10f and i). This is particularly apparent in the modest deep cells. This bimodality suggests that some of the modest deep cells with lower ETHs were dominated by warm-phase precipitation processes (similar to the shallow cells), as HdBZmax was found to be below 6 km throughout their lifetimes. This reasoning would explain why dBZmax and VIL remain so high all the way up to the end of the cell life, as these cells are deemed to have “dissipated” when they leave the domain, even though they may still persist for some time.
Cell echo base height (HEBase) was determined as the maximum ETH minus the radar-derived echo profile depth to estimate the precipitation bases of these cells. For shallow convection, HEBase remains relatively flat for the duration of the cell, whereas it shows an increase in height during dissipation for modest and vigorous deep convective cells (Fig. 10j, k, and l). This signature is especially apparent in the vigorous deep convective cells. This increase in HEBase, in tandem with the minimal decrease in maximum ETH during the dissipation of both types of deep convection (especially vigorous deep convection), reinforces the idea that we are observing the generation of orphan anvils. The bimodality observed here may also partially be caused by some cells leaving the domain during their mature phases (prior to dissipation), despite the mitigation techniques we applied, but this is less certain than the reasoning given for dBZmax.
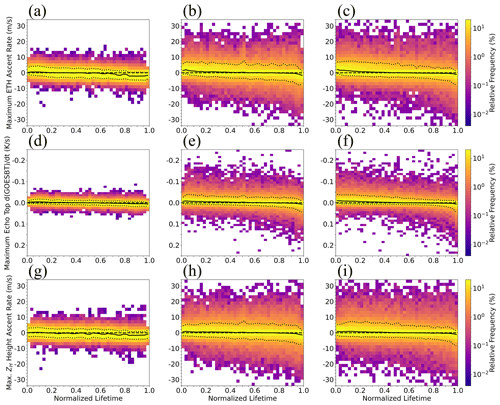
Figure 11The bin-normalized ETH-based (a–c), GOESBT-based (d–f), and HdBZmax-based (g–i) ascent rates for shallow (a, d, and g), modest deep (b, e, and h), and vigorous deep (c, f, and i) convection. The dashed lines denote the zero line, the solid lines denote the median values per bin for all normalized-lifetime bins, and the dotted lines above and below the median lines denote the 90th- and 10th-percentile values per bin for all normalized-lifetime bins.
In an attempt to quantify the vertical motion within vigorous deep convective cells, we approximated this quantity in three different ways. We used the maximum ETH, the HdBZmax during each scan, and the GOESBT at the time closest to the radar scan time along with the time between samples to calculate maximum ETH and HdBZmax “ascent rates” as well as GOESBT “cloud-top lapse rates.” As shown in Fig. 11, there are maximum ETH and HdBZmax ascent signatures early and descent signatures late in the lives of these cells for all case types. GOESBT shows cooling during the same period when maximum ETH and HdBZmax ascend and warming during the same period when they descend. The near-identical timings and structures of these derived ascent rates suggest that these values may be good proxies for updraft intensity during the early parts of these cells' lives. However, the later portions of these cells' lives are dominated by the tops or high upper portions of these features (as shown in Fig. 11) and most likely do not represent downdraft intensity during dissipation. We suspect that, in vigorous deep convective cases, we may be seeing orphan anvils falling out as virga since the descent signature occurs quite late in these cells' normalized lifetimes, after their HEBase increases considerably. The maximum ETH and HdBZmax descent rates and the GOESBT warming rates match well late in these cells' lives, which further supports the idea that we may be observing anvil fall-out. Further analysis is necessary to validate these results. There is a hint of this signature as well for modest deep convective cells, but it is not as obvious. To further assess the quality of these approximations, analyses outside the scope of this study will be needed. One caveat to consider with these ascent rate results is the increasing uncertainty in ETH and HdBZmax with increasing range from KHGX. Since we have large sample sizes for all case types, this uncertainty may account for the large spread that is always seen. The large uncertainty for cells in the farthest portions of our domain muddle these results considerably. However, since the same signal is seen when looking at the GOESBT cloud-top lapse rates, the above analyses have more credence.
3.5 Aerosol effect analysis
One potential ingredient that may influence CI, and which has been a key point of debate in recent literature, is aerosol loading. Aerosol particles in this region range from natural particles, such as sea spray, to industrial pollutants from oil refineries and urban sources. However, there is no dataset that tracks individual aerosol species on the spatiotemporal scale needed for a direct comparison with MCIT output. As such, we used temporal averages of GOES-16 AOD at the locations of cell initiation for the 30 min prior to MCIT-detected initiation. We analyzed these data for regions to the southwest and northeast of Houston. The analyses of AOD for shallow and modest deep (Fig. 12a and b) cells at the locations of their initiation show essentially identical distributions from southwest to northeast, the primary difference being that both shallow and modest deep cells exhibit a longer tail toward higher AOD values to the southwest. The median (mean) AOD for shallow convective-cell initiation locations was 0.338 (0.400) to the southwest and 0.335 (0.366) to the northeast, and that for modest deep convection was 0.366 (0.453) to the southwest and 0.346 (0.384) to the northeast. Considering the substantial difference in initiation location for shallow convection and the nearly identical initiation AOD distributions, this result can be interpreted as indicating that the bulk AOD does not play an important role in controlling cell initiation. However, this does not mean that aerosol particles play no role as a control on cell initiation. Rather, it may be that specific species of aerosol particles are more or less important to these processes. Vigorous deep convective cells, however, do show differing distributions from southwest to northeast (Fig. 19c). As with shallow and modest deep convection, vigorous deep convection also exhibits a longer tail extending to higher values of AOD to the southwest. The initiation locations for vigorous deep convective cells tend to have marginally higher AOD values to the southwest. The median (mean) of the AOD distributions for vigorous deep convective-cell initiation locations was 0.428 (0.513) to the southwest and 0.373 (0.396) to the northeast. However, these differences in distributions are not statistically significant. From the previous area-normalized cell initiation, we speculate that the marginally higher values of AOD and rates of cell initiation to the southwest in vigorous deep convection suggest that aerosol loading may indeed factor into vigorous deep CI, but that more marginal convective cells are either more dependent on specific species of aerosol particles rather than overall aerosol loading or they are not as affected by aerosol loading overall.
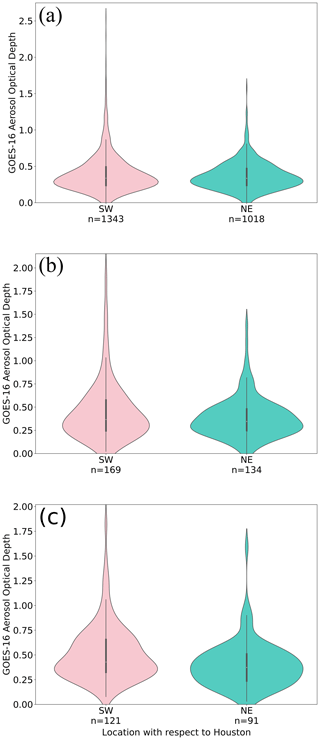
Figure 12Violin plots depicting the distributions of the average of the 30 min AOD values for the period prior to cell initiation to the southwest (red) and northeast (blue) of Houston for (a) shallow, (b) modest deep, and (c) vigorous deep convective cells. The number (n) under each violin plot corresponds to the number of cells considered for each distribution.
The climatological characteristics of convective-cell evolution and their diurnal cycles were analyzed using the NWS KHGX WSR-88D from Houston, Texas, for the warm-season months (June to September) from 2018 and 2021 and a modified version of the MCIT algorithm. In total, this study analyzed 48 773 convective cells (35 974 shallow cells for 142 921 volume scans, 7930 modest deep cells for 92 770 volume scans, and 4869 vigorous deep cells for 95 219 volume scans). Analysis of these case types together allowed for the direct comparison of cell characteristics and the environments in which they form. The key findings from this study are:
-
For all cell types, CI occurs most frequently in the late morning or early afternoon over land, consistent with the inland incursion of the sea breeze front.
-
There is a spatial variability in CI for shallow, modest deep, and vigorous deep convective cells, suggesting some effects of aerosol loading and/or urban heating. This is particularly clear for shallow cells. Higher AOD values tend to be present to the southwest of Houston, which is most easily observed when looking at the vigorous deep CI AOD distributions. While these results are not statistically significant, they suggest that aerosol loading may have some effect on deep CI. The initiation biases do not appear to be related to overall aerosol loading based on the pre-CI AOD analysis, with the exception of vigorous deep cells. Further analysis using high-resolution spatiotemporal aerosol and urban heat data will be needed.
-
The modest and vigorous deep convective cells particularly deepen in the afternoon into the evening (12:00–21:00 CDT), as the frequency peak of their heights of maximum reflectivity increases to 11 km and that of the brightness temperature decreases to 220 K. The shallow cells do not have clear diurnal variability in those parameters.
-
The cell evolution is well represented by relationships between the following cell properties:
-
The height and value of the maximum radar reflectivity. The developing stage (cell lifetime normalized by cell duration < 0.75) is well represented by an exponential curve, as the HdBZmax gradually increases from around 2 to 4 km with a maximum reflectivity of ∼ 50 dBZ and then dramatically increases to a height of 12 km for dBZmax values of 50–60 dBZ. These coincident increases in dBZmax and HdBZmax occur in the early stage of the cell lifetime (normalized lifetime < 0.5). The dissipation stage is represented by a wide distribution of the maximum reflectivity at a high altitude (∼ 10 km), suggesting anvil development and convective-core dissipation.
-
The brightness temperature (and, hence, the echo-top height) and the maximum VIL. The developing stage (normalized lifetime < 0.75) is well represented by an exponential curve, as the brightness temperature gradually decreases from 290 to 260 K from the maximum VIL until 10 dB and then dramatically decreases to 210 K for VIL > 10 dB.
-
The maximum reflectivity and columnar-average reflectivity. As the cells begin to develop for all case types, these variables remain near the one-to-one line. However, as deep convective cells (especially vigorous deep convective cells) reach the middle phases of their lifecycles (0.25 < normalized lifetime ≤ 0.75), an obvious extension with high dBZmax and low dBZavg becomes apparent. The extension of the distribution during this period further supports the development of anvils. In the remaining 25 % of vigorous deep convective-cell lifetimes, the distribution shifts to low values for both dBZmaxanddBZavg, suggesting convective-core dissipation that leaves only orphan anvils behind.
-
-
The ETH ascent rate is slightly more positive (5 m s−1) in the early stage (normalized lifetime < 0.4) and negative for the later stage (normalized lifetime > 0.8) for deep convective cells. Early in these cells' lives, the cell tops grow vertically as they intensify, and the rates at which they ascend should be close to the actual updraft intensity. Late in the cells' lives, HdBZmax remains high aloft, as it appears that HdBZmax remains in the anvil portion of the storm after it reaches maturity. These descent rates are likely to be representative of orphan anvils falling out as virga.
Based on the findings in this study, the analysis techniques presented can identify individual features within convective cells. Further parsing of these data may allow for the tracking of individual features within cells, such as the tracking of cores and anvils separately, thus enabling the analysis of their behaviors over their lives. Polarimetric variables can also be added, as in Hu et al. (2019a, b), for the automated tracking of features such as differential reflectivity columns and arcs. The convective cells considered in this study only constitute about 3 % of the features tracked during the climatology period and were selected based on the empirically derived thresholds in Table 1. Some of the features we excluded by using these thresholds are non-meteorological in nature, but others include high clouds and large precipitation shields. Different empirically derived thresholds can be developed to isolate these and other features from the full dataset and used to create large climatologies of these features of interest. The analysis techniques presented in this study can also be applied to cloud-resolving model simulations using radar simulator and cell tracking techniques (e.g., Oue et al., 2022). Analyses of this type will aid in better evaluating simulation results to understand isolated convective-cell formation and evolution mechanisms, including the effects of environmental factors such as aerosols. Some such formation mechanisms have been discussed here, such as aerosol loading and urban heating, but have not been explored in depth, but they may be of considerable importance in determining what processes are most important to convective growth, maintenance, and decay.
To assess the sensitivity of the results in this study, the thresholds were varied individually and simultaneously by ± 5 % from the values presented in Table 1. The number of cells selected in each sensitivity test was recorded, and plots were qualitatively analyzed to investigate substantial visual differences as these variables were adjusted. Table A1 shows the number of cells selected for each variable adjusted. Figure A1 shows the visual differences in the distributions based on the changes in the most sensitive thresholds.
The number of shallow convective cases varied more for lifetime minimum GOESBT than any other variable. The number of cases increased by 16.80 % for a 5 % reduction in the GOESBT threshold (from 268.0 to 254.6 K) and decreased by 48.99 % for a 5 % increase in the same threshold (from 268.0 to 281.4 K). The visual differences in the distributions of cases are shown in Fig. A1a–c. As shown, the visual differences in the distributions are caused by the addition or removal of colder-topped shallow convection (Fig. A1c). The overall shape of the distribution does not change otherwise. Increasing GOESBT only removes the more “intense” shallow convective cells that have colder GOESBT values during their lifetimes.
Like the shallow convective cases, the number of modest deep convection cases varied most with changes in lifetime minimum GOESBT. There was a 27.25 % reduction in cases with a 5 % decrease in GOESBT (250.0 to 237.5 K). This removes the slightly warmer GOESBT cloud tops, leaving an upper bound of more intense modest deep convective cases (Fig. A1e). There was also a 24.40 % increase in cases with a 5 % increase in lifetime minimum GOESBT (250.0 to 262.5 K). This clearly shows the addition of warmer, lower-intensity convective cells (Fig. A1f). The modest convective cells also varied by more than 10 % for the upper bound of the lifetime maximum ETH, but there were no visible changes in the distributions of this variable, only a reduction/increase in the number of cases (Fig. A1g, h, and i).
Vigorous convection varied most with lifetime maximum ETH. The number of cases increased by 28.94 % for a 5 % decrease in maximum ETH (12 to 11.4 km) and decreased by 26.95 % for a 5 % increase in maximum ETH (12 to 12.6 km). The variability in maximum ETH is shown in Fig. A1j–l and appears to behave similarly to how the sensitivity in maximum ETH affects modest deep convection. Adjusting this threshold only appears to reduce or increase the number of cases and does not change the shape of the distribution.
Table A1A table showing the sensitivity of cell selection based on ± 5 % adjustments of a given variable. The number n represents the number of cells selected after the threshold adjustments were applied. Percent changes of between ± 10 % and ± 20 % and percent changes of > ± 20 % are denoted by italicized and bolded values, respectively.
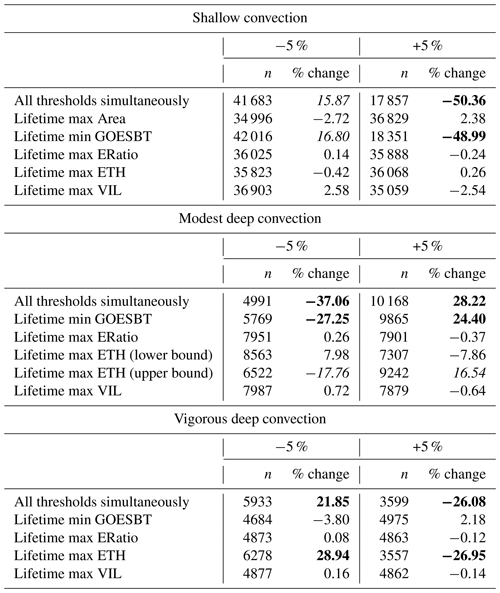
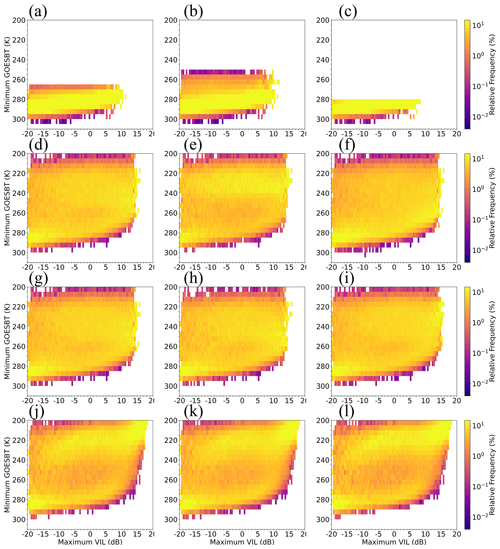
Figure A1The lifetime distributions of GOESBT versus maximum VIL, which are shown to illustrate the threshold sensitivities of the most sensitive variables shown in Table A1. The baseline (no change) distributions are shown in (a, d, g, and j), a 5 % decrease is shown in (b, e, h, and k), and a 5 % increase is shown in (c, f, i, and l) for shallow convection GOESBT sensitivity (a–c), modest deep convection GOESBT sensitivity (d–f), modest deep convection upper-bound ERatio sensitivity (g–i), and vigorous deep convection ETH sensitivity (j–l).
The MCIT tracking algorithm and analysis codes are available upon request.
The datasets generated for this study are available upon request. All other datasets used (WSR-88D KHGX and GOES-16) in this study are freely available through the National Centers for Environmental Information.
KST performed the threshold selection processes, all analyses presented herein, and the bulk of the manuscript preparation. BPT wrote the script for the MCIT algorithm and generated the dataset analyzed in this paper. MO provided assistance in the interpretation of results and assistance in preparing this manuscript. PK provided assistance in the interpretation of results, suggestions for analysis techniques, and assistance as a PhD advisor to KST.
The contact author has declared that none of the authors has any competing interests.
Publisher's note: Copernicus Publications remains neutral with regard to jurisdictional claims made in the text, published maps, institutional affiliations, or any other geographical representation in this paper. While Copernicus Publications makes every effort to include appropriate place names, the final responsibility lies with the authors.
The authors would like to thank the four anonymous reviewers and the editor, Zhanqing Li, whose comments helped improve the content and clarity of this paper.
This research has been supported by NSF (grant no. AGS-2019968, Pavlos Kollias and Mariko Oue) and the U.S. Department of Energy (grant no. DE-SC0021160, Mariko Oue).
This paper was edited by Zhanqing Li and reviewed by four anonymous referees.
Abbott, T. H. and Cronin, T. W.: Aerosol invigoration of atmospheric convection through increases in humidity, Science, 371, 83–85, https://doi.org/10.1126/science.abc5181, 2021.
Amburn, S. A. and Wolf, P. L.: VIL Density as a hail indicator, Weather Forecast., 12, 473–478, https://doi.org/10.1175/1520-0434(1997)012<0473:VDAAHI>2.0.CO;2, 1997.
Bergemann, M. and Jakob, C.: How important is tropospheric humidity for coastal rainfall in the tropics?, Geophys. Res. Lett., 43, 5860–5868, https://doi.org/10.1002/2016GL069255, 2016.
Birch, C. E., Webster, S., Peatman, S. C., Parker, D. J., Matthews, A. J., Li, Y., and Hassim, M. E. E.: Scale interactions between the MJO and the western maritime continent, J. Climate, 29, 2471–2492, https://doi.org/10.1175/JCLI-D-15-0557.1, 2016.
Bony, S., Stevens, B., Frierson, D. M. W., Jakob, C., Kageyama, M., Pincus, R., Shepherd, T. G., Sherwood, S. C., Siebesma, A. P., Sobel, A. H., Watanabe, M., and Webb, M. J.: Clouds, circulation, and climate sensitivity, Nat. Geosci., 8, 261–268, https://doi.org/10.1038/ngeo2398, 2015.
Chrisman, J. N.: Automated Volume Scan Evaluation and Termination (AVSET)—A simple technique to achieve faster volume scan updates, 34th Conf. on Radar Meteorology, Williamsburg, VA, Amer. Meteor. Soc., P4.4, https://ams.confex.com/ams/34Radar/techprogram/paper_155324.htm (last access: 15 April 2023), 2009.
Chrisman, J. N.: Dynamic scanning, NEXRAD Now, 22, 1–3, https://www.roc.noaa.gov/WSR88D/PublicDocs/NNOW/NNow22c.pdf (last access: 15 April 2023), 2013.
Chrisman, J. N.: Multiple elevation scan option for SAILS (MESO-SAILS)—The next step in dynamic scanning for the WSR-88D, Radar Operations Center, 27 pp., https://www.roc.noaa.gov/wsr88d/PublicDocs/NewTechnology/MESO-SAILS_Description_Briefing_Jan_2014.pdf (last access: 15 April 2023), 2014.
Chrisman, J. N.: Mid-volume rescan of low-level elevations (MRLE): A new approach to enhance sampling of quasi-linear convective systems (QLCSs), New Radar Technologies Web Page, NOAA/NWS/Radar Operations Center, 21 pp., https://www.roc.noaa.gov/WSR88D/PublicDocs/NewTechnology/DQ_QLCS_MRLE_June_2016.pdf (last access: 15 April 2023), 2016.
Colin, M. and Sherwood, S. C.: Atmospheric convection as an unstable predator-pray process with memory, J. Atmos. Sci., 78, 3781–3797, https://doi.org/10.1175/JAS-D-20-0337.1, 2021.
Crum, T. D. and Alberty, R. L.: The WSR-88D and the WSR-88D operational support facility, B. Am. Meteorol. Soc., 74, 1669–1688, https://doi.org/10.1175/1520-0477(1993)074<1669:TWATWO>2.0.CO;2, 1993.
Fan, J., Rosenfeld, D., Zhang, Y., Giangrande, S. E., Li, Z., Machado, L. A. T., Martin, S. T., Yang, Y., Wang, J., Artaxo, P., Barbosa, H. M. J., Braga, R. C., Comstock, J. M., Feng, Z., Gao, W., Gomes, H. B., Mei, F., Pöhlker, C., Pöschl, U., and De Souza, R. A. F.: Substantial convection and precipitation enhancements by ultrafine aerosol particles, Science, 359, 411–418, https://doi.org/10.1126/science.aan8461, 2018.
Fridlind, A. M., Li, X., Wu, D., van Lier-Walqui, M., Ackerman, A. S., Tao, W.-K., McFarquhar, G. M., Wu, W., Dong, X., Wang, J., Ryzhkov, A., Zhang, P., Poellot, M. R., Neumann, A., and Tomlinson, J. M.: Derivation of aerosol profiles for MC3E convection studies and use in simulations of the 20 May squall line case, Atmos. Chem. Phys., 17, 5947–5972, https://doi.org/10.5194/acp-17-5947-2017, 2017.
Fridlind, A. M., van Lier-Walqui, M., Collis, S., Giangrande, S. E., Jackson, R. C., Li, X., Matsui, T., Orville, R., Picel, M. H., Rosenfeld, D., Ryzhkov, A., Weitz, R., and Zhang, P.: Use of polarimetric radar measurements to constrain simulated convective cell evolution: a pilot study with Lagrangian tracking, Atmos. Meas. Tech., 12, 2979–3000, https://doi.org/10.5194/amt-12-2979-2019, 2019.
Gagin, A., Rosenfeld, D., and Lopez, R. E.: The relationship between height and precipitation characteristics of summertime convective cells in south Florida, J. Atmos. Sci., 42, 84–94, 1985.
Grabowski, W. W. and Morrison, H.: Supersaturation, buoyancy, and deep convection dynamics, Atmos. Chem. Phys., 21, 13997–14018, https://doi.org/10.5194/acp-21-13997-2021, 2021.
Greene, D. R. and Clark, R. A.: Vertically Integrated Liquid Water – A new analysis tool, Mon. Weather Rev., 100, 548–552, https://doi.org/10.1175/1520-0493(1972)100<0548:VILWNA>2.3.CO;2, 1972.
Haurwitz, B.: Comments on the sea-breeze circulation, J. Atmos. Sci., 4, 1–8, https://doi.org/10.1175/1520-0469(1947)004<0001:COTSBC>2.0.CO;2, 1947.
Hitschfeld, W.: The motion and erosion of convective storms in severe vertical wind shear, J. Atmos. Sci., 17, 270–282, https://doi.org/10.1175/1520-0469(1960)017<0270:TMAEOC>2.0.CO;2, 1960.
Hu, J., Rosenfeld, D., Zrnic, D., Williams, E., Zhang, P., Snyder, J. C., Ryzhkov, A., Hashimshoni, E., Zhang, R., and Weitz, R.: Tracking and characterization of convective cells through their maturation into stratiform storm elements using polarimetric radar and lightning detection, J. Atmos. Res., 226, 192–207, https://doi.org/10.1016/j.atmosres.2019.04.015, 2019a.
Hu, J., Rosenfeld, D., Ryzhkov, A., Zrnic, D., Williams, E., Zhang, P., Snyder, J. C., Zhang, R., and Weitz, R.: Polarimetric radar convective cell tracking reveals large sensitivity to cloud precipitation and electrification properties of CCN, J. Geophys. Res.-Atmos., 124, 12194–12205, https://doi.org/10.1029/2019jd030857, 2019b.
Igel, A. L. and van den Heever, S. C.: Invigoration or enervation of convective clouds by aerosols?, Geophys. Res. Lett., 48, e2021GL093804, https://doi.org/10.1029/2021GL093804, 2021.
Igel, A. L., Igel, M. R., and van den Heever, S. C.: Make it a double? Sobering results from simulations using single-moment microphysics schemes, J. Atmos. Sci., 72, 910–925, https://doi.org/10.1175/JAS-D-14-0107.1, 2015.
Jensen, M. P., Flynn, J. H., Judd, L. M., Kollias, P., Kuang, C., Mcfarquhar, G., Nadkarni, R., Powers, H., and Sullivan, J.: A succession of cloud, precipitation, aerosol, and air quality field experiments in the coastal urban environment, B. Am. Meteorol. Soc., 103, 103–105, https://doi.org/10.1175/BAMS-D-21-0104.1, 2022.
Kumjian, M. R., Martinkus, C. P., Prat, O. P., Collis, S., van Lier-Walqui, M., and Morrison, H. C.: A moment-based polarimetric radar forward operator for rain microphysics, J. Appl. Meteorol. Clim., 58, 113–130, https://doi.org/10.1175/JAMC-D-18-0121.1, 2019.
Ladino, L. A., Korolev, A., Heckman, I., Wolde, M., Fridlind, A. M., and Ackerman, A. S.: On the role of ice-nucleating aerosol in the formation of ice particles in tropical mesoscale convective systems, Geophys. Res. Lett., 44, 1574–1582, https://doi.org/10.1002/2016GL072455, 2017.
Lamer, K., Kollias, P., Luke, E. P., Treserras, B. P., Oue, M., Dolan, B.: Multisensor agile adaptive sampling (MAAS): a methodology to collect radar observations of convective cell life cycle, J. Atmos. Ocean. Tech., 40, 1509–1522, https://doi.org/10.1175/JTECH-D-23-0043.1, 2023.
Lee, M., Schubert, S. D., Suarez, M. J., Schemm, J. E., Pan, H., Han, J., and Yoo, S.: Role of convection triggers in the simulations of the diurnal cycle of precipitation over the United States Great Plains in a general circulation model, J. Geophys. Res.-Atmos., 113, D02111, https://doi.org/10.1029/2007JD008984, 2008.
Mann, H. B. and Whitney, D. R.: On a test of whether one of two random variables is stochastically larger than the other, Ann. Math. Stat., 18, 50–60, https://doi.org/10.1214/aoms/1177730491, 1947.
Oue, M., Saleeby, S. M., Marinescu, P. J., Kollias, P., and van den Heever, S. C.: Optimizing radar scan strategies for tracking isolated deep convection using observing system simulation experiments, Atmos. Meas. Tech., 15, 4931–4950, https://doi.org/10.5194/amt-15-4931-2022, 2022.
Park, J. M., van den Heever, S. C., Igel, A. L., Grant, L. D., Johnson, J. S., Saleeby, S. M., Miller, S. D., and Reid, J. S.: Environmental controls on tropical sea breeze convection and resulting aerosol redistribution, J. Geophys. Res.-Atmos., 125, e2019JD031699, https://doi.org/10.1029/2019JD031699, 2020.
Peters, K., Hohenegger, C., and Klocke, D.: Different representation of mesoscale convective systems in convection-permitting and convection-parameterizing NWP models and its implications for large-scale forecast evolution, Atmosphere, 10, 503, https://doi.org/10.3390/atmos10090503, 2019.
Pulkkinen, S., Nerini, D., Pérez Hortal, A. A., Velasco-Forero, C., Seed, A., Germann, U., and Foresti, L.: Pysteps: an open-source Python library for probabilistic precipitation nowcasting (v1.0), Geosci. Model Dev., 12, 4185–4219, https://doi.org/10.5194/gmd-12-4185-2019, 2019a.
Pulkkinen, S., Nerini, D., Perez Hortal, A., Velasco-Forero, C., Germann, U., Seed, A., and Foresti, L.: Pysteps – a community-driven open-source library for precipitation nowcasting, Poster presented at the 3rd European Nowcasting Conference, Madrid, ES, 24–26 April 2019, https://doi.org/10.13140/RG.2.2.31368.67840, 2019b.
Radar Operations Center: WSR-88D Volume Coverage Pattern (VCP) improvement initiatives, New Radar Technologies Web Page, NOAA/NWS/Radar Operations Center, 8 pp., https://www.roc.noaa.gov/WSR88D/PublicDocs/NewTechnology/New_VCP_Paradigm_Public_Oct_2015.pdf (last access: 15 April 2023), 2015.
Radar Operations Center: NEXRAD technical information, NEXRAD Technical Information Web Page, NOAA/NWS/Radar Operations Center, https://www.roc.noaa.gov/WSR88D/Engineering/NEXRADTechInfo.aspx (last access: 15 April 2023), 2022.
Rosenfeld, D.: Objective method for analysis and tracking of convective cells as seen by radar, J. Atmos. Ocean. Tech., 4, 422–434, 1987.
Rosenfeld, D., Zheng, Y., Hashimshoni, E., Pöhlker, M. L., Jefferson, A., Pöhlker, C., Yu, X., Zhu, Y., Liu, G., Yue, Z., Fischman, B., Li, Z., Giguzin, D., Goren, T., Artaxo, P., Barbosa, H. M. J., Pöschl, U., and Andreae, M. O.: Satellite retrieval of cloud condensation nuclei concentrations by using clouds as CCN chambers, P. Natl. Acad. Sci. USA, 113, 5828–5834, https://doi.org/10.1073/pnas.1514044113, 2016.
Rotunno, R.: On the linear theory of the land and sea breeze, J. Atmos. Sci., 40, 1999–2009, https://doi.org/10.1175/1520-0469(1983)040<1999:OTLTOT>2.0.CO;2, 1983.
Ryzhkov, A., Pinsky, M., Pokrovsky, A., and Khain, A.: Polarimetric Radar Observation Operator for a Cloud Model with Spectral Microphysics, J. Appl. Meteorol. Clim., 50, 873–894, https://doi.org/10.1175/2010JAMC2363.1, 2011.
Sheffield, A. M., Saleeby, S. M., and van den Heever, S. C.: Aerosol-induced mechanisms for cumulus congestus growth, J. Geophys. Res.-Atmos., 120, 8941–8952, https://doi.org/10.1002/2015JD023743, 2015.
Varble, A., Zipser, E. J., Fridlind, A. M., Zhu, P., Ackerman, A. S., Chaboureau, J., Collis, S., Fan, J., Hill, A., and Shipway, B.: Evaluation of cloud-resolving and limited area model intercomparison simulations using TWP-ICE observations: 1. Deep convective updraft properties, J. Geophys. Res.-Atmos., 119, 13891–13918, https://doi.org/10.1002/2013JD021371, 2014.
Wolfensberger, D. and Berne, A.: From model to radar variables: a new forward polarimetric radar operator for COSMO, Atmos. Meas. Tech., 11, 3883–3916, https://doi.org/10.5194/amt-11-3883-2018, 2018.
Zhu, P., Dudhia, J., Field, P. R., Wapler, K., Fridlind, A., Varble, A., Zipser, E., Petch, J., Chen, M., and Zhu, Z.: A limited area model (LAM) intercomparison study of a TWP-ICE active monsoon mesoscale convective event, J. Geophys. Res.-Atmos., 117, D11208, https://doi.org/10.1029/2011JD016447, 2012.
Zittel, W. D.: Theory and concept of operations for multi-PRF dealiasing algorithm's VCP 112, New Radar Technologies Web Page, NOAA/NWS/Radar Operations Center, 13 pp., https://www.roc.noaa.gov/WSR88D/PublicDocs/NewTechnology/Theory_ConOps_VCP112.pdf (last access: 15 April 2023), 2019.


